Embed Size (px)
Citation preview

BANGLADESHLOOKING BEYOND GARMENTS
EMPLOYMENT DIAGNOSTIC STUDY


BANGLADESHLOOKING BEYOND GARMENTS
EMPLOYMENT DIAGNOSTIC STUDY
Co-publication of the Asian Development Bank and the International Labour Organization, Regional Office for Labour and the Pacific.

Creative Commons Attribution 3.0 IGO license (CC BY 3.0 IGO)
© 2016 Asian Development Bank and International Labour Organization
Some rights reserved. Published in 2016. Printed in the Philippines.
ISBN 978-92-9257-561-8 (Print), 978-92-9257-562-5 (e-ISBN) Publication Stock No. RPT168372-2
Cataloging-In-Publication Data
Asian Development Bank and International Labour Organization.. Bangladesh: Looking beyond garments.Mandaluyong City, Philippines: Asian Development Bank and International Labour Organization, 2016.
1. Economic development. 2. Employment diagnostics. 3. Bangladesh. I. Asian Development Bank and International Labour Organization.
The views expressed in this publication are those of the authors and do not necessarily reflect the views and policies of the Asian Development Bank or its Board of Governors or the Secretariat of the United Nations or the International Labour Organization or the governments they represent.
ADB and ILO does not guarantee the accuracy of the data included in this publication and accepts no responsibility for any consequence of their use. The mention of specific companies or products of manufacturers does not imply that they are endorsed or recommended by ADB and ILO in preference to others of a similar nature that are not mentioned.
By making any designation of or reference to a particular territory or geographic area, or by using the term “country” in this document, ADB and ILO does not intend to make any judgments as to the legal or other status of any territory or area.
This work is available under the Creative Commons Attribution 3.0 IGO license (CC BY 3.0 IGO) https://creativecommons.org/licenses/by/3.0/igo/. By using the content of this publication, you agree to be bound by the terms of this license.
This CC license does not apply to non-ADB and non-ILO copyright materials in this publication. If the material is attributed to another source, please contact the copyright owner or publisher of that source for permission to reproduce it. ADB and ILO cannot be held liable for any claims that arise as a result of your use of the material.
Attribution—You should always acknowledge ADB and ILO as the source using the following format:Author. Year of publication. Title of the material. © Asian Development Bank and International Labour Organization. [license].
Translations—Any translations you create should carry the following disclaimer:Originally published by ADB and ILO in English under the title [title in italics]. © ADB. [URL or DOI] [license]. The quality of the
translation and its coherence with the original text is the sole responsibility of the translator. The English original of this work is the only official version.
Adaptations—Any adaptations you create should carry the following disclaimer:This is an adaptation of an original work titled [title in italics]. © ADB. [URL or DOI][license]. The views expressed here are those
of the authors and do not necessarily reflect the views and policies of ADB or its Board of Governors or the Secretariat of the United Nations or the International Labour Organization or the governments they represent. ADB and ILO does not endorse this work or guarantee the accuracy of the data included in this publication and accepts no responsibility for any consequence of their use.
Please contact [email protected] if you have questions or comments with respect to content, or if you wish to obtain copyright permission for your intended use that does not fall within these terms, or for permission to use the ADB logo. For permission to use the ILO logo, please contact [email protected].
Notes: In this publication, “$” refers to US dollars. ADB recognizes “Korea” as the Republic of Korea. Corrigenda to ADB publications may be found at http://www.adb.org/publications/corrigenda
Asian Development Bank 6 ADB Avenue, Mandaluyong City, 1550 Metro Manila, PhilippinesTel +632 632 4444; Fax +632 636 2444www.adb.org; openaccess.adb.org
International Labour Organization4 route des Morillons, 1211 Geneva 22, SwitzerlandTel +41 (0)22 799 6111; Fax +41 (0) 22 798 8685www.ilo.org

iii
Foreword
Bangladesh has enjoyed robust growth since the early 2000s—consistently greater than 6%—exceeding trends in other similar developing countries. Yet, the impact on employment has been less positive. Instead, the economy is still beset by underemployment, widespread informal employment, low productivity and earnings, and poor working conditions. Taken together these factors, limit the impact that strong growth has had on poverty reduction. Indeed, the proportion of workers employed in the informal sector—where high underemployment, low earnings, and poor working conditions are common—actually rose to 87.1% in 2013, from 78.4% in 2005–2006, where they experience high underemployment, low earnings, and poor working conditions. Meanwhile, gender disparities persist and compound the situation.
While increasing employment opportunities alone benefits the poor, the nature and the challenges of the present employment situation need to be carefully examined. In addition, it is essential to shift workers to more highly productive sectors through structural economic transformation.
To address the challenges, this study argues for still stronger growth with more rapid industrialization. It stresses the need for substantial diversification of production and employment within the manufacturing and agriculture sectors. It examines the ongoing need for significant numbers of Bangladeshi workers to continue finding employment overseas. It also underscores the importance of upgrading education and skills so that people can be productively employed at home. Key challenges include raising the quality of all levels of education, increasing enrollment in technical and vocational education and training, and addressing the issue of skills mismatch.
A team from the Economic Research and Regional Cooperation Department of the Asian Development Bank (ADB) of the Asian Development Bank (ADB) under the supervision of Cyn-Young Park, and later Edimon Ginting, director, Economic Analysis and Operational Support Division conducted the study, in collaboration with the International Labour Organization (ILO), under the supervision of Panudda Boonpala, director, ILO Decent Work Team and ILO Country Office, New Delhi. The team consisted of Sakiko Tanaka, Valerie Mercer-Blackman, and Lilibeth Poot from ADB; Sher Verick and Catherine Saget from the ILO; and experts including Rizwanul Islam (Lead Consultant), Ronald Miller, Sewin Chan, and Selim Raihan.
Sunhwa Lee, Tania Rajadel, Rudi Van Dael from ADB; Manas Bhattacharya, Gabriel Bordado, Paul Comyn, T.I.M. Nurunnabi Khan, Rossana Merola, and Seeta Sharma from the ILO, Laurent Bossavie, Yoonyoung Cho, Simon Davies, Thomas Farole, and Manjula Luthria from the World Bank provided useful inputs and valuable comments in the report’s finalization. Research assistance was provided by Megan Thomas, with additional support provided by Regina Baroma and Maricor Muzones. The report was edited by Eric Van Zant and proofreading was done by Tuesday Soriano. Michael Cortes did the layout, cover design, and typesetting. Ricasol Cruz-Calaluan, Gee-Ann Burac, and Maria Carmela Teves provided administrative support.

iv
We would also like to acknowledge the excellent support provided by the ADB Bangladesh Resident Mission led by Kazuhiko Higuchi, country director, in facilitating dialogue and collaboration with the government. Md. Golam Mortaza and Barun Dey of the resident mission provided tremendous support in the conduct of the study. We would especially like to acknowledge the collaboration with the ILO Country Office for Bangladesh led by Srinivas Reddy, director, ILO Country Office, Dhaka.
As part of its preparation, the study team conducted a number of ADB–ILO missions (from November 2014 to May 2016) and undertook a series of consultations with key stakeholders, including government, employers’ and workers’ organizations, leading academicians, and development partners on the study framework, approach, and findings. Through the consultations a number of key employment challenges were identified and later became the thematic areas the study covered, including (i) diversification of the economy, (ii) skills development, (iii) women at work, and, after later consultation, (iv) overseas employment. Feedback from the different sectors greatly benefited the report, and enhanced its relevance and applicability to the development needs of the country.
The study team would also like to thank the Government of Bangladesh for its invaluable support, without which this study would not have been possible. In particular, we are grateful for the excellent collaboration and insights from the Ministry of Finance Economic Relations Division, Ministry of Labour and Employment, Ministry of Expatriates’ Welfare and Overseas Employment, Ministry of Education, Bangladesh Bureau of Statistics, National Skills Development Council, and employers’ and workers’ organizations.
Shang-Jin WeiChief Economist and Director GeneralEconomic Research and Regional Cooperation DepartmentAsian Development Bank
Tomoko NishimotoAssistant Director-General and Regional Director for Asia and the PacificInternational Labour Organization
Foreword

v
Foreword iiiBoxes, Figures, and Tables viiAbbreviations x
1. Introduction and Highlights 1
2. Employment and the Labor Market: Trends and Challenges 6 2.1 Introduction 6 2.2 Demographic and Labor Force Situation 7 2.3 Overview of the Employment Situation 10 2.4 Youth Unemployment and Unemployment of the Educated 15 2.5 Child Labor 17 2.6 Trends in Real Wages 18 2.7 Changes in Labor Policies and Employment 21 2.8 The Magnitude of the Employment Challenge: A Quantitative Estimate 22 2.9 Conclusion 26
3. Economic Diversification, Structural Change, and Employment in Bangladesh 29 3.1 Introduction 29 3.2 Review of Literature 29 3.3 Nature of Structural Transformation in Bangladesh 30 3.4 Policy Environment 35 3.5 Potential Sectors for Diversification 37 3.6 Employment Multipliers 45 3.7 Supply-Side Constraints for Diversification 48 3.8 Conclusion 49
4. Overseas Employment of Bangladeshi Workers: Trends, Prospects, and Challenges 51 4.1 Introduction 51 4.2 Review of Literature 52 4.3 Overseas Employment: Trends, Determinants, and Impact 56 4.4 Prospects for Overseas Employment of Workers from Bangladesh 63 4.5 Matching the Skills of Bangladeshi Workers with Those Needed in Receiving Countries 65 4.6 Rights and Welfare of Migrant Workers 69 4.7 Conclusion 76
Contents

vi
5. Skills Development 79 5.1 Introduction 79 5.2 Education and the People of Bangladesh 79 5.3 Structure of Education and Training Systems 81 5.4 Access to Skills Training and Higher Education 86 5.5 Skills Mismatch 91 5.6 Returns to Education 93 5.7 Quality of Education and Skills Training 97 5.8 Conclusion 98
6. Women at Work 99 6.1 Introduction 99 6.2 Women and Work in Bangladesh 100 6.3 Labor Force Participation 104 6.4 Barriers to Full Participation in the Working World 110 6.5 Avenues for Expansion of Labor Force Participation 115 6.6 Status of Women in the Workplace 119 6.7 Conclusion 124
7. Policy Recommendations to Improve Productive Employment Outcomes and Creating Quality Employment 126 7.1 Introduction 126 7.2 Promoting Economic Diversification and Creating Better Jobs 127 7.3 Finding More and Better Jobs Abroad and Promoting the Rights and Welfare of Migrant Workers 128 7.4 Improving Opportunities for Skills Development and Higher Education 129 7.5 Enhancing Outcomes for Women in the Labor Market 131 7.6 The Way Forward 133
Appendixes 135 1 Macroeconomic Performance 135 2 Definitions and Methodologies Used in Labor Force Surveys in Bangladesh 136 3 Basic Data on Labor Force and Employment in South Asian Countries 138 4 Labor Force Growth and Employment Elasticity Used in the Employment Projections 139 5 Methodology for Deriving Employment Multipliers 140
References 141
Contents

vii
Boxes 2.1 Estimation of Jobs Required per Year 244.1 Safeguarding Migrant Worker Rights: Good Practices 714.2 Setting Standards for Domestic Worker Employment Contracts: Philippines 72
Figures 2.1 Overall and Youth Unemployment Rate, 1999–2013 152.2 Unemployment Rate by Level of Education, 2010 and 2013 162.3 Unemployment Rate by Gender and Level of Education, 2013 162.4 Index of Real Wages, 1993–1994 to 2008–2009 203.1 Share of Different Subsectors in Manufacturing GDP, 2006–2014 313.2 Broad Sectoral Shares of Employment, 1999–2013 323.3 Herfindahl–Hirschman Concentration Index of Value Added, 1989–2012 343.4 Change in Export Composition, 1995–2013 353.5 Average Monthly Income from Employment (Wage/Salary), 2013 383.6 Distribution of Employment in Key Sectors by Age Group, 2013 393.7 Tourism’s Direct and Total Contribution to Employment and GDP, 2000–2006 454.1 Total Workers Going Abroad, 1990–2014 564.2 Percentage Distribution of Overseas Employment by Destination, 1990–2014 574.3 Flow of Female Workers for Overseas Employment, 2000–2014 574.4 Total Number and Number of Female Workers Going Abroad, 2000–2014 574.5a Destination of Migrant Workers, 1976–2014 584.5b Destination of Female Migrant Workers, 1999–2014 584.6 Flow of Remittances and Foreign Exchange Reserves, 2005–2015 604.7 Current Account Indicators, 2006-2015 654.8 Share of Various Skill Categories in Total Migrant Workers, 1990–2014 654.9 Gender Difference in the Skill Composition of Migrant Workers, 2005–2014 734.10 Various Stages of International Migration for Employment 765.1 Demographic Pyramid, 2011 805.2 Estimated Income Relative to Having No Education, 2013 94A1.1 Annual Growth of GDP and Manufacturing, 1990–2013 136
Boxes, Figures, and Tables

viii
Tables 2.1 Growth of Population, 2000 to 2013 72.2 Working-Age Population, 2000–2013 72.3 Annual Labor Force Growth 82.4 Male and Female Labor Force Participation Rates, 1991–2010 82.5 Age-Specific Labor Force Participation Rates by Sex, 1995–2010 92.6 Labor Force by Level of Education, 1999–2000 and 2010 92.7 Sector Composition of Employment by Gender, 1999–2013 102.8 Growth of Employed Persons by Industry and Gender, 1999–2013 102.9 Elasticity of Employment with Respect to Output, 1995–2013 112.10 Underemployment in Bangladesh, 1999–2013 132.11 Underemployment in Bangladesh by Location and Gender, 1999–2013 132.12 Excessive Work Hours by the Employed Population, 2010 and 2013 142.13 Changes in the Structure of Employment by Status in Employment, 1999–2013 142.14 Employment in the Informal Sector, 2002–2013 152.15 Youth Unemployment Rate, 1999–2013 152.16 Youth Unemployment Rate by Gender and Location, 2013 162.17 Labor Force Participation Rates of Children, 1990–1991 to 2011 172.18 Percentage Distribution of Day Laborers by Weekly Income, 2010 192.19 Percentage Distribution of Salaried Workers by Monthly Income, 2010 192.20 Average Monthly per Capita Income of Households according to Educational Attainment of the Household Head, 2005 and 2010 192.21 Indexes of Real Wages, 2006–2007 to 2011–2012 212.22 Export of Ready-Made Garments, 2010 to First Quarter 2015 222.23 Employment Projections under Alternative GDP Growth Assumptions 252.24 Employment Projection with Employment Elasticity of 0.55 263.1 Subsectoral Shares of GDP at Constant Prices, 2006, 2010, and 2014 313.2 Subsectoral Annual Average Growth and Shares of Employment, 1999–2013 323.3 Share of Skills and Informality of the Labor Force, 2013 333.4 Profile of Bangladesh Employed Persons in Selected Sectors 443.5 Direct and Indirect Employment Multipliers from Input–Output Analysis, 2000 and 2015 464.1 Top-10 Occupations of Male and Female Migrant Workers, 2005–2015 58 4.2 Percentage Distribution of Migrant Workers by Age and Education, 2013 60 4.3 Overseas Employment of Bangladeshi Workers to Major Destination Countries, 2000–2014 614.4 Distribution of Migrant Workers from Bangladesh, Nepal, and Pakistan in the Gulf Cooperation Council Countries by Skill Category 664.5 Workers Who Found Employment during 2005–2012 and Likely Future Skill Demands, Selected Countries 685.1 Education of the Labor Force, Aged 15 and Over 815.2 Training Received in Previous 12 Months 875.3 Length of Training Received in Previous 12 Months 875.4 Source of Training Received in Previous 12 Months 875.5 Main Area of Training Received in Previous 12 Months 885.6 Labor Force Wanting Training of Any Type 895.7 Main Area of Training Desired 895.8 Tertiary Education in the Labor Force, by Division 905.9 People with Tertiary Education by Sex and Age 915.10 Employment Income and Returns to Education, 2013 935.11 Unemployment Rates by Broad Educational Category 955.12 Youth (Aged 15–29) Unemployment Rates by Broad Educational Category 965.13 Monthly Earnings as a Percentage of Earnings of Those with Primary School Education, Key Industries 97
Boxes, Figures, and Tables

ix
6.1 Labor Force Participation Rates, 2003–2013 1046.2 Female Labor Force Participation by Age Cohort, 2010 and 2013 1056.3 Employment of Women by Industry for Key Industries, 2010 and 2013 1066.4 Women with Different Education Levels in Selected Industries, 2013 1076.5 Female Labor Force Participation by Division, 2010 and 2013 1076.6 Land Holdings and Female Labor Force Participation 1086.7 Education and Female Labor Force Participation 1096.8 Employment in Selected 2-Digit BSIC Manufacturing Industries, 2012 1156.9 Weekly Hours Worked, by Selected Industry, 2010 and 2013 1206.10 Status in Employment 1216.11 Wages by Sex and Location, 2005–2006 121A1.1 Annual Growth of GDP and Major Sectors, 2005–2015 135A1.2 Rate of Inflation and Budgetary Balance, 2005–2014 135A3.1 Labor Force Participation Rate 138A3.2 Unemployment Rate 138A3.3 Employment Status 138A3.4 Underemployment by Time Criterion 138A3.5 Employed Persons in the Formal and Informal Sector 138
Boxes, Figures, and Tables

x
ADB Asian Development BankBANBEIS Bangladesh Bureau of Educational Information and StatisticsBMET Bureau of Manpower, Employment and TrainingBPO business process outsourcingEGPP Employment Generation Program for the PoorestFDI foreign direct investmentFLFP female labor force participationG2G government-to-governmentGDP gross domestic productHDI Human Development IndexHIES household income and expenditure surveyICT information and communication technologyILO International Labour OrganizationIOM International Organization for MigrationISC industry skills councilIT information technologyITeS IT-enabled servicesLFS labor force surveyNGO nongovernment organizationNSDC National Skills Development CouncilPRC People’s Republic of ChinaRMG ready-made garmentSSC Secondary School CertificateTVET technical and vocational education and training
Abbreviations

1
Introduction and Highlights
Chapter 1 Introduction and Highlights
1.1 Introduction
low productivity to higher-productivity sectors, an important part of economic development. As productive employment plays a substantial role in transmitting the benefits of economic growth to the poor (reducing poverty and improving the distribution of income), the study examines the nature, trends, and magnitude of the employment challenges.
The new Sustainable Development Goals officially adopted in 2015, emphasize that “transformative agenda” of the Sustainable Development Goals needs to be interpreted in terms of structural transformation of the economy and employment. Goal 8 is set for inclusive and sustainable economic growth with employment and decent work for all.
This Employment Diagnostic Study highlights key labor market trends and challenges in Bangladesh, analyzes in depth the major issues relating to employment, and makes recommendations for government and stakeholder consideration. In Chapter 2, the study broadly reviews and analyzes labor market trends and challenges. Chapter 3 deals with economic diversification and employment. Chapter 4 is devoted to overseas employment and
INTRODUCTION
Economic growth in Bangladesh accelerated in the 1990s and has remained above 6% in most years since the early 2000s. Not many developing countries have been able to keep up such a robust pace for so long. Moreover, macroeconomic stability as measured by inflation and budget balance has improved (see ADB 2016).
Driven by the growth of the ready-made garments (RMG) industry, the share of employment in Bangladesh’s manufacturing sector increased from 11% in 2005–2006 to 16% in 2013. The rate of open unemployment in Bangladesh, which has remained around 4.5%, does not accurately capture the labor market challenges. The majority of workers are employed in the informal sector (87.1% in 2013, up from 78.4% in 2005–2006) where they suffer from high underemployment, low earnings, and poor working conditions. And gender disparities persist despite a rise in women’s labor force participation.
Generating more productive employment needs support from structural economic transformation. More than just numbers, the employment challenge needs to see a transfer of workers from sectors with

2
Bangladesh: Looking beyond Garments
Chapter 5 to skills development. Gender issues and women’s employment are analyzed in Chapter 6, and Chapter 7 presents key recommendations.
HIGHLIGHTS
In the following paragraphs, we highlight some of the main findings that are discussed in more detail in the rest of the report.
Higher growth and economic diversification are needed to cope with labor market challenges.
While manufacturing will continue to be the engine of growth and a major source of productive employment, the manufacturing base will need to diversify, and the sector will have to grow about 12%–15% over the next 15 years. Annual GDP growth would need to rise to 8% to fully absorb the available labor surplus. More labor-intensive sectors, including garments will have to continue to grow. Agriculture should also diversify to create more productive employment. The policy regime has to be neutral for non-garment industries with the same growth potential. The construction sector also has great potential for employment, although in recent years the sector has shown some degree of instability.
Using data from the 2013 Labour Force Survey, this study finds that the unemployment rates for workers at all education levels except for those who never attended school have declined since 2010. The analysis shows the gap in earnings between education levels narrowing, with the exception of secondary education, where graduates continue to earn increasingly more than people with only primary education. This general trend is positive in that the observed improvements in education do not seem to contribute to income inequality. In addition, greater access to education for women leads to their finding better jobs, while their rising employment in the garment sector has been associated with reductions in poverty.
For the quality of employment to improve, this report recommends that real wages need to rise in tandem with increasing labor productivity. Other elements of the work environment also have to improve, notably safety. If the experience of the garment industry is any indicator, minimum wages and improvements in workplace safety do not seem to reduce employment opportunities.
Supply-side factors may constrain the transition into more productive jobs.
While Bangladesh has successfully created manufacturing jobs particularly in textiles and garments, it has been unable to create a large pool of jobs in industries outside ready-made garments. Jobs in the service sector are, for the most part, informal (particularly wholesale and retail trade). Nonetheless, the analysis in Chapter 3 of this report shows that some areas of manufacturing as well as some promising service sectors—such as information technology, software, machinery repair, and tourism—have potential to grow further if the right incentives are set. Jobs in agriculture for the most part continue to be informal and not very productive, yet Bangladesh has the opportunity to invest more in agricultural value chains, which would help to bring farmers to market and raise their incomes.
Several supply-side factors have contributed to constraining economic diversification, some of which relate to employment: (i) a shortage of skilled workers, (ii) technological bottlenecks, and (iii) lack of entrepreneurship and management skills. Although labor in Bangladesh is abundant, a shortage in skilled workers is perceived to be a major constraint on manufacturing production. The shortage is particularly acute for medium-scale, export-oriented enterprises. Manufacturing goods now overwhelmingly dominate Bangladesh’s export basket, but a significant proportion of it comprises a very low domestic value addition because of limited backward linkages. Upgrading technology, adopting superior technology, and effective learning in the workplace are important to improve productivity as

3
Introduction and Highlights
well as competitiveness. However, the manufacturing sector is critically dependent on imported technology, while the capacity to operate and maintain machinery often does not exist. Moreover, although a good entrepreneur recognizes the need for training staff and acts accordingly, because of various reasons discussed in Chapter 5, opportunities for training workers and managers—even in large firms—are limited in Bangladesh.
Though the government’s latest 5-year plan identifies a number of priority sectors, several factors have held back their development in the last 1–2 decades. Some factors are sector-specific, while others are more general, affecting the overall economy. Chapter 3 discusses the problems of some of these sectors. Further research is needed to understand each of these sectors comprehensively, but lack of data is an issue. More general problems affecting all sectors are poor physical infrastructure, weak institutions, and the invisible costs of doing business.
Jobs abroad help provide more employment opportunities but migrant rights need to be enhanced.
Bangladesh has done well in maintaining a steady outflow of migrant workers. But this study finds potential for raising this number and changing the skills and occupational composition of workers. For Bangladesh workers to find more jobs abroad, it would be necessary to tap both existing destinations (such as Bahrain, Oman Qatar, and Singapore) and new ones (such as Jordan, Lebanon, and the Republic of Korea). Different destinations and their prospects can be studied by employing various means such as analysis of the economies and their business prospects and intensifying bilateral contacts.
The high cost of international migration from Bangladesh is a major issue. This cost not only includes the costs of air tickets, visas, and so on, but also fees paid to recruiting agencies and to intermediaries. Apart from financial cost, common problems include fraudulent practices, substitution of contracts in destination countries (for ones with much worse terms
and conditions than promised), and unacceptable conditions of work and living. Importantly, a very high proportion of this cost (around 88%) is accounted for by so-called facilitators. Any effort at reducing the cost of migration and addressing the issue of exploitation would have to focus primarily on this issue.
This study offers a number of recommendations covering several stages of the migration cycle. At the grassroots level, district employment and manpower offices could work together with nongovernment organizations and community-based organizations to provide alternative sources of information and raise awareness about various issues relating to overseas employment. At a higher level, the Bureau of Manpower, Employment and Training could work together with recruitment agencies to develop a system of recruitment that would minimize and eventually eliminate the role of subagents. The role and functioning of the Labour Wings in countries of destination need to be made stronger and more effective in dealing with the implementation of contracts. Last, given the spread of relevant actors over different countries and the number of government agencies involved, a strong mechanism for coordination is critical for increasing efficiency in the governance of migration.
Relevant skills and quality education are urgently required as the economy modernizes.
While Bangladesh has made notable progress in raising enrollment in primary education, significant challenges remain in education and skills development. Better education and quality in the workforce is crucial, with large numbers of young people entering the job market just as the country is looking to diversify and modernize its economy.
The evidence presented in Chapter 5 clearly indicates that the skills of the workforce are not meeting the demands of emerging or, indeed, established industries. Many employers state that the difficulty of finding appropriately skilled workers is a substantial constraint to growth. At the same time, private economic returns to education remain fairly modest,

4
Bangladesh: Looking beyond Garments
though this may be in part due to the huge expansion in the number of workers with at least basic education. As the economy grows and modernizes, it is likely that the lifetime rewards to education will be significant.
While provision of basic general education has expanded greatly, some areas of the country and population remain underserved, especially among the poorest. Efforts to bring all children into the educational system should continue. Perhaps because of the rapid expansion of the general education system and because of a tradition of rote learning, average educational quality remains low and many students are not reaching achievement targets. Better enforcement of standards for teaching and a policy to discourage side employment of teachers, along with attempts to improve the status of teachers, will help. Modernization of curriculums to make them more flexible and relevant and less memorization focused will be helpful, along with potential de-emphasis of high-stakes testing. Finally, private tertiary institutions have proliferated extremely quickly and it is not clear that adequate quality standards are in place. High unemployment rates among young graduates suggest that the skills being obtained are not those required by the marketplace. A more careful program of oversight of such institutions may help to improve educational quality.
Technical and vocational education and training (TVET) is a key area of concern. Many of the rapidly developing countries and recently developed countries of Asia made TVET a central focus of their education systems as a way of preparing for rapid industrialization. In Bangladesh, formal TVET education makes up only a tiny portion of secondary education, and evidence suggests that some TVET resources are underutilized because of low demand from students. A unified and simplified system of TVET management and provision, promotional efforts to students and their families, and, perhaps most importantly, a continuous system of communication, coordination, and cooperation with employers and their representatives could help make TVET an important element of development.
Improving employment policies and women-focused programs will further enhance outcomes for women in workforce.
This study finds that the expansion of microcredit created opportunities for self-employment, and the huge growth of the ready-made garment industry provided the first mass formal employment for women. Growth in the sector is expected to continue to provide jobs. The number of women in regular paid employment has also increased tremendously in recent years, although it remains a small proportion of women overall. Nonetheless, female labor force participation (FLFP) remains very low by international standards and while women’s education to higher secondary level and above is now widespread, highly educated women face frighteningly high unemployment rates, much higher than those for comparably educated men.
As discussed in Chapter 6, providing full legal economic rights to women and fully enforcing those rights is a critical step—it provides a strong signal of the direction of the country and may help to make discrimination against women less socially acceptable. Protection of women’s employment rights with respect to changes in family status, such as a provision of maternity and parental leave, is important. The Government of Bangladesh has attempted to take a lead position in the employment of women from the beginning. However, the reservation of positions for women has been maintained at the same low level, even as the number of women in the workforce and, in particular, the number of well-educated women has increased tremendously. Increasing employment of women in government should be nearly costless; indeed, there may be an increase in efficiency gained through the reduction of discrimination.
Experience in other countries with guaranteed work programs has found important effects of FLFP. The Employment Generation Program for the Poorest (EGPP) is a powerful tool both to improve the welfare of the poorest and to integrate women more fully into the working world. The EGPP should, for this reason,

5
Introduction and Highlights
be maintained, or expanded, if possible, with additional focus on the needs of women. Improved transportation and infrastructure will benefit all Bangladeshis, and will help in economic transformation, but they may be especially valuable for working women.

6
Bangladesh: Looking beyond Garments
Chapter 2Employment and the Labor Market: Trends and Challenges
A basic question in employment is the magnitude of the challenge given labor supply and the speed of employment growth in the medium term. This can be examined using labor force projections and projections of employment (total as well as sectoral) likely to be generated in a given period. The latter exercise uses the observed elasticity of employment with respect to output growth and the projected rate of economic growth.
Notably, a full-fledged diagnostic analysis of employment has to include in-depth analysis of the issue of structural transformation, mentioned above, as well as the qualitative dimension of labor supply, focusing on education and training. Secondly, overseas jobs have emerged as a major source of employment for the growing Bangladeshi labor force and a major source of foreign exchange earnings. Detailed analysis is also needed of the gender dimension given significant variation in employment characteristics between men and women. Subsequent chapters devote particular attention to the four topics: structural transformation, overseas employment, education and skill development, and gender.
Section 2 provides a basic picture of the demographic and labor force situation in the country. Section 3
2.1. Introduction
In recent years, a number of studies have dealt with various aspects of employment and the labor market in Bangladesh. While some are descriptive and broad reviews (such as ILO 2013a, IILS 2013, CPD 2011), others deal with specific groups, such as women (Rahman and Islam 2013 for example) and youth (such as Toufique 2014). In their data, 2010 is the latest year in these studies. But issues such as the quantitative dimension of the medium- and longer-term employment challenge, structural transformation, real wages, and the quality of employment, have not received due attention in recent research.
This chapter aims for a broad and deep understanding of the employment and labor market challenges in Bangladesh. It is distinct from the studies above in several ways, including (i) a more up-to-date picture by using data from the Labour Force Survey 2013, (ii) a good analysis of the basic demographic and labor force data to provide a picture of the supply side, and (iii) projections of employment for the medium term that provide a quantitative indicator of the employment challenge. The chapter also looks at qualitative aspects of employment.

7
Employment and the Labor Market
reviews the employment situation.1 Section 4 deals with employment of youth and the educated. Section 5 presents data on the use of child labor. Trends in real wages—overall as well as for major sectors—are examined in section 6, which also addresses whether differences in wages and earnings by levels of education are adding to income inequality. Section 7 focuses on labor policy relating to minimum wages and workplace safety and their impact on employment. In section 8, projections of employment are carried out for 2016–2020. Section 9 summarizes major findings and concludes.
2.2. Demographic and Labor Force Situation2.2.1. Demographic characteristics
During the 2000s, population growth in Bangladesh was around 1.5% a year, as confirmed by the growth of population recorded by the labor force surveys of 1999–2000 and 2010 (Table 2.1, last row). Surprising and difficult to explain is the big difference in the growth of the male and female population in the successive surveys. Also notable is high urban population growth, pointing to rapid urbanization.
The third notable demographic feature is the increase in the share of working-age population from 2000 to 2013 (Table 2.2), which applies to both men and women and rural and urban areas. This implies the oft-mentioned possibility of reaping the so-called “demographic dividend”—if of course the people of working age can be converted to human capital and utilized productively.
2.2.2. Labor force2
Data in Table 2.3 on labor force growth during 2002–03 to 2013 allow a few observations about the growth of labor force and variation in growth during the intersurvey periods. First, labor force growth increased sharply during the period between 2005–2006 and 2010 compared with the earlier intersurvey period of 2002–2003 to 2005–2006. From 2.25% a year, it increased to 3.45%. Second, labor force growth slowed to 2.3% a year during 2010–2013. Third, after a sharp rise in the growth of the female labor force during 2005–2010, there was a reversal during 2010–2013.3 Fourth, acceleration in the growth of urban labor force continued during 2010–2013, but growth of the rural labor force declined very sharply during the latter period.
It is not easy to explain the various patterns in the growth of labor force mentioned above. For example,
Item Total Male Female Urban Rural
2000 127.50 66.60 60.90 27.30 100.202006 137.30 70.00 67.30 32.30 105.00Annual growth (%),
2000–20061.24 0.83 1.68 2.84 0.78
2010 148.70 74.20 73.60 34.00 114.70Annual growth (%),
2006–20102.01 1.47 2.26 1.29 2.23
2013 154.20 76.60 77.50 43.20 110.90Annual growth (%),
2010–20131.22 1.07 1.74 8.31 (1.12)
Annual growth (%), 2000–2013
1.47 1.08 1.87 3.59 0.78
Item 2000 2006 2010 2013
Total population (million) 127.5 137.3 148.7 154.2Working-age population (million)
74.2 84.6 95.6 106.3
Working-age population, 15 and above (% of total)Total 58.2 61.6 64.3 68.9Male 57.5 61.4 64.5 68.0Female 58.9 61.8 64.8 69.9Urban 60.8 65.3 68.2 70.1Rural 57.6 60.5 63.1 68.5
____________________1 The issue of overseas employment is dealt with in Chapter 4.2 Key definitions and methods used in the Bangladesh labor force surveys are described in Appendix 2. 3 See Chapter 6 for a detailed analysis of this issue.
Table 2.1: Growth of Population, 2000 to 2013 (million)
Table 2.2: Working-Age Population, 2000–2013
( ) = negative.Source: Calculated from Labor Force Survey data.
Source: Bangladesh Bureau of Statistics. Various years. Labour Force Survey. Dhaka.

8
Bangladesh: Looking beyond Garments
the increase in the growth of the labor force during 2005–2010 is not surprising and could be explained by several factors. First, those who entered the labor force during the 2005–2010 period were already born in the early 1990s. Given the continued high growth of population at that time, the high labor force growth is not surprising. What is surprising is the increase in the rate of growth, because the factor of population growth was present in the earlier intersurvey period. What may have caused the difference during 2006–2010 is a more flexible interpretation of the term economic activity that resulted in inclusion of a larger proportion of population in the labor force in the 2010 survey compared with the earlier one. This raises the second possible factor in explaining the rise in labor force growth, that is, the very high growth of the female labor force, which was already much higher than the growth of the male labor force in the earlier intersurvey period. During 2005–2010, the female labor force grew 9.2% annually, compared with 5.5% during 2002–2005.4 It is possible that the above two factors could not counteract a negative factor acting on labor force growth, that is, growth in enrollment in education.
If the factors mentioned above were active during 2005–2010, one would have to argue that they reversed direction during the subsequent period (2010–2013). Indeed, the female participation rate declined during the latter period (although it remains to be examined and explained what may have caused this reversal). Whether this single factor outweighed the demographic factor of population growth is another question.
Looking at urban-rural differences, notably, much higher urban labor force growth continued. This is not surprising as rural-urban migration in a country like Bangladesh is a continuing phenomenon.
An important aspect of the labor force in Bangladesh is the notably higher participation of men, compared with women. One notable and positive development in this regard is the substantial rise in the female labor force participation (FLFP) rate over time, although the level remains substantially below those in a number of East and Southeast Asian countries. Table 2.4 presents relevant data. Notably, however, the FLFP rate declined during 2010–2013, after increasing continuously for 2 decades. This is an important issue and deserves careful, in-depth analysis.
Looking at changes in age-specific participation rates (Table 2.5), participation declined in ages 15–19 among men and increased a little in ages 20–40. This is positive in that the working-age population is probably spending more years in education,5 and the participation rate has increased in the prime age group. For women, however, the participation rate increased for ages 15–19 as well. Another difference between male and female participation is the sharp fall in the latter from the age of 50. This also deserves in-depth investigation.
2002–2003 to 2005–2006
2005–2006 to 2010
2010 to 2013
Total labor force 2.25 3.45 2.30Male 1.19 1.44 2.47Female 5.52 9.19 1.90Urban 1.17 3.23 8.74Rural 2.60 3.51 0.08
Year
Labor Force Participation Rate, Population Age 15 and Above
Female Male All
1990–1991 14.0 86.2 51.21995–1996 15.8 87.0 52.01999–2000 23.9 84.0 54.92002–2003 26.1 87.4 57.32006 29.2 86.8 58.52010 36.0 82.5 59.32013 33.5 81.6 57.1
____________________4 See Rahman and Islam (2013) for a detailed analysis of changes in FLFP in Bangladesh up to 2010, which analyzes the contributing factors. 5 The rate of school attendance for ages 15–19 increased from 28.40% in 1991 to 42.93% in 2011, and from 9.90% to 11.07% for ages 20–24 (Bangladesh Bureau of
Statistics 2011).
Table 2.3: Annual Labor Force Growth (% a year)
Table 2.4: Male and Female Labor Force Participation Rates, 1991–2010 (%)
Note: Labor force is defined as the economically active population age 15 and over.Source: Calculated from Bangladesh Bureau of Statistics. Various years. Labour Force Survey. Dhaka.
Source: Bangladesh Bureau of Statistics. Various years. Labour Force Survey. Dhaka.

9
Employment and the Labor Market
The level of education of the labor force is important in the contribution it can make to economic growth. Notable progress has been made, with the share of labor force with no education and only primary education declining, and this decline continued during 2010–2013.6 Also good news is the narrowing of the gender difference in this area. While in 2000, a much higher proportion of the female labor force had either no education or only primary level education, the male-female difference in that regard was all but wiped out by 2010 (Table 2.6). But the good news ends there.
Several shortfalls in the education level of the labor force are notable. First, the share with tertiary education is still rather low. Likewise, a very small proportion of the labor force (only one in a thousand) had technical or vocational qualification in 2010. This is not surprising given the low rate of enrollment in technical and vocational education as a percentage of secondary enrollment—only 2.43% compared with 6.31% in Malaysia and 18.41% in the People’s Republic of China. Furthermore, the gender differential in the labor force with tertiary education remains high (despite some narrowing).
Age
1995–1996 2000 2006 2010
Male Female Male Female Male Female Male Female
15–19 61.30 18.00 55.85 23.35 62.88 13.76 48.44 29.4020–24 78.80 15.80 74.01 26.30 80.41 29.00 75.93 40.9825–29 93.50 16.00 91.30 27.08 95.28 33.67 92.10 44.7130–34 98.30 15.80 95.65 26.51 98.68 34.88 97.29 46.6235–39 98.40 18.20 98.23 25.66 98.81 34.82 98.34 47.6740–44 99.00 17.00 97.78 26.57 97.72 35.15 98.05 46.2445–49 98.80 14.30 97.63 23.42 97.75 32.63 97.37 47.5850–54 98.00 14.30 95.76 18.28 95.35 31.12 94.11 10.2555–59 96.10 14.40 93.50 18.85 92.36 27.72 88.52 11.1860–64 88.60 11.40 81.39 11.11 82.70 22.62 77.20 6.6365+ 70.20 8.40 56.56 8.99 59.25 14.83 57.93 8.32
Level of Education
1999–2000 2010
Total Male Female Total Male Female
No education 48.1 41.5 59.1 40.1 39.9 40.6Class I–V 25.0 25.7 23.8 22.8 22.9 22.7Class VI–VIII 11.4 13.4 8.2 14.3 13.8 15.3Class IX–X 5.2 6.1 3.8 9.0 8.3 10.5Secondary school certificate or
equivalent7.1 8.9 4.0 6.2 6.5 5.6
Higher secondary certificate or equivalent
3.7 4.0 3.0
Bachelor or equivalent 3.2 4.5 1.1 2.1 2.5 1.2Master or equivalent 1.4 1.7 0.8Medical 0.2 0.2 0.1Technical/vocational 0.1 0.2 0.1
Table 2.5: Age-Specific Labor Force Participation Rates by Sex, 1995–2010 (%)
Table 2.6: Labor Force by Level of Education, 1999–2000 and 2010 (%)
Source: Bangladesh Bureau of Statistics. Various years. Labour Force Survey. Dhaka.
Source: Bangladesh Bureau of Statistics. Various years. Labour Force Survey. Dhaka.
____________________6 See Chapter 5 for data on education of the labor force for 2013.

10
Bangladesh: Looking beyond Garments
2.3. Overview of the Employment Situation2.3.1. Employment structure and growth
In a discussion on employment in a developing economy like that of Bangladesh, it is usual to start by looking at the composition of employment by sector of the economy. One expects a decline in the proportion of employment in agriculture and an increase in the shares of industry and services. Several interesting features of the sector composition of employment emerge from Table 2.7, which presents the relevant data for Bangladesh. First, the share of agriculture declined during 1995–96 and 2013, but the magnitude of this decline is rather small. This is despite a substantial decline in the share of the sector’s output in total gross domestic product (GDP). As for the proportion engaged in manufacturing, the increase was small up to 2010, but sharp during 2010–2013. The share of construction increased noticeably during 1999–2000 to 2010, from less than 3% to nearly 5%. But the share of the sector declined after 2010 to less than 4% in 2013.
The gender differences in employment in different sectors and how they are changing is quite evident. On the one hand, the share of women in agriculture has
been substantially higher than that of men and remains so. But, noticeably, during 2010–2013, the share of women in manufacturing doubled and became much higher than that of men. One notable element in the gender difference in sector composition is the much lower share of women in services. This is mainly due to the low rate of women’s participation in subsectors like transport and wholesale and retail trade.
A look at the growth rate of employment (Table 2.8) brings out the following points. The first good news is the gradual increase in the rate of growth of employment in manufacturing. While the rate of growth between 2005–06 and 2010 exceeded 6%, the rate almost doubled during 2010–2013. If growth of this order can be maintained for another decade or so, the economy would go a long way toward absorbing surplus labor. A second notable point is the increase in the growth of employment in the construction sector during 2005–2010. This is also normal for an economy like that of Bangladesh. However, the sharp increase in the growth of employment during 2005–2010 raises the question of whether it reflects a bubble in the real estate sector. The contraction of employment in the sector during 2010–2013 heightens this concern.
The gender difference in the growth of employment (as a whole as well as by sector) is also noticeable.
Table 2.7: Sector Composition of Employment by Gender, 1999–2013 (% of total)
Table 2.8: Growth of Employed Persons by Industry and Gender, 1999–2013 (% per year)
Source: Calculated from Bangladesh Bureau of Statistics. Various years. Labour Force Survey. Dhaka.
( ) = negative. Source: Calculated from Bangladesh Bureau of Statistics. Various years. Labour Force Survey. Dhaka.
Sector
1999–2000 2005–2006 2010 2013
Total Male Female T M F T M F T M F
Agriculture 50.76 51.91 46.24 45.76 39.27 66.54 47.57 40.18 64.84 45.10 41.41 53.64Manufacturing 9.55 7.50 17.63 11.03 10.88 11.51 12.45 12.73 11.77 16.36 13.78 22.52Construction 2.81 3.21 1.22 3.22 3.94 0.92 4.84 6.31 1.40 3.69 4.76 1.00Services 36.10 36.71 33.71 37.41 43.05 19.36 35.36 41.13 21.87 34.11 40.05 22.85
Sector
1999–2000 to 2005–2006 2005–2006 to 2010 2010 to 2013
Total Male Female Total Male Female Total Male Female
Agriculture 1.53 (2.14) 12.77 4.29 1.79 8.41 0.60 4.12 (5.00)Manufacturing 5.82 9.09 (1.15) 6.34 5.15 9.62 12.34 5.83 25.64Construction 5.66 6.05 1.34 13.52 13.01 19.51 (6.28) (6.17) (9.55)Services 3.91 5.27 (3.24) 1.93 0.08 12.88 1.21 2.18 2.68Total 3.30 2.51 6.13 3.32 1.22 9.06 2.39 3.08 1.21

11
Employment and the Labor Market
Growth of women’s employment during 2010–2013 has been much lower than men’s, sharply reversing the experience during 2000–2010. This is consistent with a decline in the labor force participation rate of women in the recent period. A decline in the growth of employment for women may have discouraged them from participating in the labor force.
2.3.2. Economic growth and employment
While growth of employment, especially relative to the growth of the labor force, is important, in examining how employment-intensive output growth has been, it is necessary to look at employment growth in relation to output growth. The elasticity of employment growth with respect to output growth is a summary measure of the latter, and can be estimated from available data. Table 2.9 presents estimates of employment elasticity for the subperiods referred to in Table 2.8.7 Several interesting points emerge.
First, for the economy as a whole, its ability to generate employment seems to have declined over time. The same remark applies to the job-creating ability of the agriculture sector.
Second, output growth in the manufacturing sector has gradually become more employment intensive over the period Table 2.9 covers. This is not surprising given that the highly labor-intensive RMG sector has primarily driven growth in the manufacturing sector since the 1990s. High growth of this sector and the heavy weight of the sector in total manufacturing must have contributed to making output growth in the sector as a whole increasingly employment intensive.8
Third, the construction sector has also become increasingly more employment intensive, and the sharp fluctuation in the elasticity of employment in this sector comes as a surprise. On the one hand, the figure for 2006–2010 appears to be much higher than what is expected for this sector and what was observed in earlier periods in Bangladesh. Likewise, the decline in employment in this sector reported for 2010–2013 is also a surprise, especially given the positive growth of output in the sector. The negative growth of employment associated with the positive growth of output has resulted in a negative employment elasticity for the sector—implying that during the latest period, output growth has been associated with a decline in employment.
____________________7 It may be noted that elasticity of employment with respect to output may be estimated using different methods. One is the method of regression of employment
with output as the independent variable. The other is to use data for two points in time and estimate employment elasticity as the ratio between employment growth and output growth. Given the absence of time-series data on employment, the latter method is used here. While interpreting such point estimates of employment elasticity, the possibility of the estimates being influenced heavily by situations of the selected years should be noted. A second point to be noted with regard to the elasticity estimates presented in Table 2.9 is that data on employment and output have been obtained from two different sources. While output growth is estimated from national accounts data (available from the Ministry of Finance), employment growth is estimated from Bangladesh Bureau of Statistics labor force surveys, which are household-based and conducted periodically. It would be unrealistic to expect a high degree of reliability for estimates of employment elasticity based on such diverse data sources.
8 It may be noted in this respect that several countries of East and Southeast Asia that were successful in simultaneously attaining high rates of economic growth and labor absorption demonstrated high employment elasticity during the early stages of their development. Examples include the Republic of Korea, Indonesia, Malaysia, and Thailand. Employment elasticity figures in the manufacturing sector of Bangladesh during the 1990s and 2000s are quite similar to those of Indonesia and Malaysia during the same period. What is different (and not so desirable from the point of raising productivity) is the rise in the figure beyond 1 during 2010–2013. For a comparative analysis of several Asian countries, including Bangladesh, see Islam (2014a).
Table 2.9: Elasticity of Employment with Respect to Output, 1995–2013
( ) = negative, GDP = gross domestic product. Sources: Output growth figures are calculated from data in the Ministry of Finance, Government of Bangladesh: Bangladesh Economic Review, various years; employment elasticity has been calculated from output growth figures in this table and employment growth figures presented in Table 2.8.
Sector
1995–1996 to 1999–2000 1999–2000 to 2005–2006 2005–2006 to 2010 2010–2013
Output Growth
(% per year)Employment
Elasticity
Output Growth
(% per year)Employment
elasticity
Output Growth
(% per year)Employment
Elasticity
OutputGrowth
(% per year)Employment
Elasticity
GDP 5.36 0.5392 5.63 0.5861 6.11 0.5499 6.20 0.3887Agriculture 5.32 0.7293 2.90 0.8207 4.28 0.7103 3.28 0.1951Manufacturing 5.37 0.2607 7.48 0.7807 7.52 0.8697 9.67 1.2761Construction 8.89 0.2711 8.37 0.6344 6.10 2.4164 8.18 (0.7677)Services 5.09 0.2141 5.75 0.6887 6.51 0.2734 5.90 0.2051

12
Bangladesh: Looking beyond Garments
have at best limited coverage and effectiveness, few people can afford to remain without work. Moreover, absent organized methods of job search, the notion of “looking for work” is rather ambiguous. So, it is not unusual to find low unemployment rates. This is also true in Bangladesh.
Open unemployment in Bangladesh has remained between 4% and 5% of the labor force since the 1990s. In fact, the figure remained unchanged at 4.3% through surveys in 1999–2000, 2003–03 and 2005–06, then inched up to 4.5% in 2010, and went back down to 4.3% in 2013. It seems therefore that not only is the rate of unemployment low, it has remained surprisingly stable for a long period. Hence, any serious discussion of employment and the labor market must go beyond open unemployment.
Given surplus labor in developing countries, underemployment is considered a useful alternative indicator of labor market conditions. However, it is also not without complexity, and hence measures also vary. Two alternatives often suggested are visible and invisible underemployment. Visible underemployment refers to the underutilization of an individual’s available labor time and the individual’s willingness to work longer. This is also referred to as the time measure of underemployment.10 Invisible underemployment is an analytical concept referring to the productivity and income-generating capacity of work one is engaged in. There is no universally accepted measure of such underemployment. It can be measured in terms of productivity associated with employment or the income generated. Up to 2010, the labor force surveys provided a measure of visible underemployment in terms of time and categorized those working less than 35 hours a week as underemployed. Relevant data are presented in Tables 2.10 and 2.11.
The measure of underemployment used for the Labour Force Survey 2013 is different from those for the
Fourth, the employment intensity of growth in the service sector appears to have declined sharply during the second half of the 2000s. This also cannot be explained easily, unless of course one can demonstrate that the components of the sector that have grown at a higher rate and have increased their weight in the sector are more capital intensive in nature. While this is not impossible, whether that has actually happened in Bangladesh or whether the sharp decline in employment elasticity of the sector represents another data issue remains an open question.
It needs to be noted that employment elasticity also provides an indicator of the direction of movement of labor productivity. An increase in the former implies a deterioration in the latter. An elasticity of more than one is particularly worrisome in that respect. Since this is found to be the case for manufacturing during 2010–2013, it would appear that employment growth in manufacturing during that period was attained at the expense of a decline in labor productivity.9 The construction sector during that period lies at another extreme: output growth was achieved with a reduction in employment.
2.3.3. Unemployment, underemployment, and excessive hours of work
Unemployment is regarded as an important indicator of a country’s labor market conditions. But in a developing country like Bangladesh, open unemployment usually does not, for various reasons, provide a real picture of the situation. First, given the standard definition and measurement of unemployment, it is not unusual to see very low rates of open unemployment in developing countries. Only those members of the labor force who have not worked even an hour during the reference week and have been actively looking for work are categorized as unemployed. In developing countries where poverty is widespread, unemployment benefits often do not exist, and social safety nets ____________________9 Theoretically, output growth consists of growth in employment and in labor productivity. Both can increase simultaneously, as is the experience of East and
Southeast Asian countries. This is demonstrated by a decomposition exercise (Islam 2010) for selected Asian countries. That exercise shows that for Bangladesh the contribution of productivity growth to GDP growth increased up to 2006, but what happened later still needs analysis.
10 The ILO is working on another measure of labor underutilization that, in addition to time underutilization, considers “potential labor force”, a concept defined to include three mutually exclusive groups (ILO 2013c): (i) unavailable job seekers—persons without employment who are seeking employment but not available, (ii) available potential job seekers—persons without employment and not seeking employment but are available, and (iii) willing potential job seekers—persons without employment who are neither seeking employment nor available for employment but want employment. In addition, “discouraged jobseekers” may be unemployed and willing to work and yet are not actively seeking jobs because of the perception of the lack of jobs.

13
Employment and the Labor Market
earlier years (described above) in two respects: (i) the threshold for weekly number of working hours is 40 hours instead of 35 in the earlier surveys, and (ii) two additional criteria—willingness and availability to work additional hours—are applied to determine whether one is underemployed.
Before coming to the data in Tables 2.10 and 2.11, a note of warning about using them to draw straightforward conclusions. For example, a comparison of the figures for 1999–2000 and 2002–03 indicates more than a doubling of the rate of underemployment. It is very difficult to explain such a sharp increase, especially
since the economy was not doing so badly during those years. Likewise, the sharp decline in the years after 2002–2003 defies logical explanation.11
Breaking down the overall figures by gender and location could perhaps reveal a reason for the observed volatility of the figures on underemployment. Table 2.11 indicates much more volatility in the rate of underemployment for women than men. Female underemployment increased sharply between 1999–2000 and 2005–06 and fell sharply thereafter, yet male underemployment showed a secular increase over the entire period of these three surveys.
It is tempting to conclude from these figures that after a sharp increase in female underemployment, it declined after 2005, and that should be regarded as a positive sign. In this context, it may be useful to look at the difference in trend in female underemployment between rural and urban areas. In this, the volatility is much higher for rural than urban women, raising the suspicion that the observed figures may reflect differences in inclusion in and exclusion from the labor force. For example, in 2005–06, many more rural women who work for short periods (particularly as unpaid workers) may have been included as members of the labor force, and that may have pushed the female underemployment rate to a very high level. In 2010, the opposite may have happened. Thus, how information about female employment is recorded in the questionnaires can have serious implications for the results.
Because of the application of different criteria, the official underemployment figures in 2013 are not comparable to earlier years. Tables 2.10 and 2.11 also present separate calculations made by using the same criteria as for the earlier years, revealing a few interesting points. First, separate declining trends for overall underemployment and for rural and urban areas continued in 2013. For women, the decline was continuous from 2005–06. For men, underemployment rose in 2010 and fell in 2013.
Alongside underemployment, long working hours are also a reality for many in the labor market in
____________________11 One possible reason for the observed blip in the figure for 2002–03 is that the survey for that year was carried out during a short period, which coincided with the
lean season of agriculture. That may have contributed to the high rate of underemployment in that year.
1999–2000
2005–2006 2010 2013a 2013b
National 16.6 24.5 20.3 17.8 4.0Male 7.4 10.9 14.4 13.1 3.8Female 52.8 68.3 34.1 29.5 4.4
Rural 17.8 27.8 22.7 20.5 4.4Male 8.1 12.4 16.7 n.c 4.2Female 57.7 77.0 36.6 n.c. 4.7
Urban 12.2 13.9 12.4 10.8 3.0Male 4.7 5.9 6.9 n.c. 2.7Female 38.2 39.8 25.6 n.c. 3.7
1999–2000
2002–2003
2005–2006 2010 2013a 2013b
National 16.6 34.2 24.5 20.3 17.8 4.0Rural 17.8 36.4 27.8 22.7 20.5 4.4Urban 12.2 26.7 13.9 12.4 10.8 3.0
Table 2.10: Underemployment in Bangladesh, 1999–2013 (% of labor force)
Table 2.11: Underemployment in Bangladesh by Location and Gender, 1999–2013 (% of labor force)
a Calculated from raw data by using the 35-hour-per-week cut-off point, and hence comparable with the figures for the earlier years.
b These are figures for underemployment reported in the official report of the Labour Force Survey 2013. The definition of underemployment used in that survey is different from the one used for the earlier surveys, and hence the figures for that year are not comparable to the earlier ones.
Source: Calculated from Bangladesh Bureau of Statistics, Labour Force Survey data.
n. c. = not calculated.a Calculated from raw data using the 35-hour-per-week cut-off point and
hence comparable to figures for the earlier years. b Figures for underemployment reported in the official report of the
Labour Force Survey 2013. That survey used a different definition of underemployment than earlier surveys, meaning the figures for that year and earlier years are not comparable.
Source: Calculated using data from Bangladesh Bureau of Statistics. Various years. Labour Force Survey. Dhaka.

14
Bangladesh: Looking beyond Garments
Bangladesh (Table 2.12). Several points emerge from the data. First, if 50 hours per week is regarded as a cut-off point for excessive work hours, the average worker in Bangladesh does not appear to suffer this problem. Yet many workers, irrespective of location and gender, do work excessive hours, more so urban men, with rural men not far behind. Second, the situation improved during 2010–2013, but only for men—for women in rural and urban areas, the proportion who worked excessive hours increased during this period. It therefore seems that the burden of making up the income of a household is now shared more equally by men and women.
2.3.4. Vulnerable employment
As mentioned, open unemployment in Bangladesh is low because people cannot simply afford to remain unemployed, so they try to eke out a living from some work. As a result, a large proportion of the employed are engaged in work that can be called “vulnerable.” There is no universally accepted definition of vulnerability in this context, but the sense conveyed here is the vulnerability of workers engaged in such employment from perspectives such as job stability and income earned from it. In 2003, the International Conference of Labour
Statisticians adopted a resolution, which defined vulnerable employment as own-account workers, and contributing family members.12 A few aspects relating to the trend in vulnerable employment emerge from Table 2.13.
First, between 2005–06 and 2010, no significant change appears to have taken place in the proportion of self-employed and own-account workers and those in unpaid family work. In other words, the degree of vulnerable employment did not improve during that period. However, some changes are noticeable for 2010–2013. While the proportion of self-employed remained virtually unchanged, that of unpaid family helper declined considerably.
Second, if one looks at a longer period, that is, between 1999–2000 and 2013, the proportion of self-employment and own-account work has declined substantially. But there was an increase in the share of unpaid family work until 2010, indicating that many of the own-account workers may possibly have simply reverted to becoming unpaid family helper. Only during 2010–2013, the share of this category declined, although remained at the level of 2002–03.
Table 2.12: Excessive Work Hours by the Employed Population, 2010 and 2013
Table 2.13: Changes in the Structure of Employment by Status in Employment,
1999–2013 (% of total employment)
Note: Excessive Work Hours are defined as work of more than 50 hours per week.Source: Calculated using data from Bangladesh Bureau of Statistics. Various years. Labour Force Survey. Dhaka.
Source: Calculated using data from Bangladesh Bureau of Statistics. Various years. Labour Force Survey. Dhaka.
Categories
Average Hours Worked per Week
Employed with Excessive Work
Hours (%)
2010 2013 2010 2013
All employed 46 46 51.1 46.6Male 51 47 64.8 51.0Female 35 43 19.2 36.3
All rural 45 45 50.8 44.4Rural male 50 46 65.4 49.3Rural female 34 42 17.0 32.8
All urban 49 48 62.0 52.5Urban male 53 49 62.6 55.2Urban female 38 46 26.7 46.7
Status1999–2000
2002–2003
2005–2006 2010 2013
Self-Employed/Own-Account Workers
35.1 44.8 41.9 40.8 40.7
Male 49.4 50.6 50.0 47.5 52.2 Female 10.8 24.5 15.9 25.1 12.3
Employee 12.6 13.7 13.9 14.6 23.2 Male 15.1 13.8 14.5 17.0 22.2 Female 8.2 13.4 11.7 8.9 25.5
Unpaid Family Helper 33.8 18.4 21.7 21.8 18.2 Male 10.2 9.9 9.7 7.1 5.1 Female 73.2 48.0 60.1 56.3 50.1
Day Laborers 18.3 20.0 18.2 19.7 15.5 Male 25.0 22.9 21.9 25.8 18.9 Female 7.8 9.6 6.5 5.3 7.2
____________________12 This is also used as one of the indicators of Millennium Development Goal (MDG) 1B relating to employment and labor market. However, this report considers
this an imperfect indicator of vulnerable employment, because all own-account workers need not be vulnerable and others, especially those in casual wage employment, may be vulnerable. On this, and a critique of the Millennium Development Goal indicators of vulnerable employment, see Islam (2014a).

15
Employment and the Labor Market
In fact, the degree of vulnerable employment on the whole appears to have increased over the long-term period. Moreover, if the proportion of paid employees is regarded as a proxy for regular employment, the situation appears to have worsened during the decade ending in 2010 and then improved in the 3 subsequent years. In other words, with regard to the Millennium Development Goal 1B target of reducing the proportion of own-account workers and contributing family workers in total employment, Bangladesh has a long way to go, and progress during the 2000s has not been in the right direction. Signs of improvement were only evident during 2010–2013.
Another indicator of vulnerable employment is the proportion of informal workers.13 When labor force growth is high and growth in formal sector jobs is insufficient to absorb new workers to the labor force, the informal sector is a last resort. Although part of the informal sector may show dynamic growth of economic activities, it largely acts as a sponge for absorbing surplus labor. In Bangladesh, employment in the informal sector increased substantially from 78.48% in 2005–2006 to 87.43% in 2010.14 In fact, the number employed in the informal sector grew at a higher rate (6.19% a year) between 2005–2006 and 2010 compared with the earlier intersurvey period of 2002–2003 to 2005–2006 when annual growth was 1.96%. Clearly, there has been a tendency toward informalization of employment in the country. During 2010–2013, no reversal was seen of this worrisome trend. Although the share of women engaged in the informal sector declined slightly (remaining at a very high level), that of men actually increased (Table 2.14).
2.4. Youth Unemployment and Unemployment of the EducatedYouth unemployment is typically higher than overall and adult unemployment and, in this, Bangladesh is no exception. The difference seems to be less sharp in Bangladesh, however (Figure 2.1, Table 2.15). While youth (age 15–29) unemployment is generally found to be two to three times the overall unemployment, it was less than twice the overall unemployment rate in Bangladesh in 2010. A slight improvement is apparent: youth unemployment rate for the whole country declined from 8.1% in 2005–06 to 7.5% in 2010. But the situation deteriorated in 2013, when youth unemployment, for all and separately for men and women, increased from 2010, more sharply for
Year
Employment in the Informal Sector (million)
Share of Informal Sector Employment in Total
Employment (%)
Total Male Female Total Male Female
2002–03 35.10 27.20 7.90 79.23 78.95 79.792005–06 37.20 27.50 9.70 78.48 76.18 85.692010 47.30 32.40 14.90 87.43 85.50 92.302013 50.10 35.60 15.20 87.40 86.30 90.30
____________________13 Employment of workers whose incomes fall below the poverty line may also be regarded as vulnerable. They may be in the formal sector and in paid employment. 14 The informal sector is defined by number of workers employed—those employing less than four workers are classified as informal. The figures represent both
urban and rural areas.
Table 2.14: Employment in the Informal Sector, 2002–2013
Source: Bangladesh Bureau of Statistics, Labour Force Survey, various years.
Figure 2.1: Overall and Youth Unemployment Rate, 1999–2013 (%)
Source: Constructed using data from Bangladesh Bureau of Statistics. Various years. Labour Force Survey. Dhaka.
Overall
0
16
12
10
8
6
4
2
14
1999–2000 2005–2006 2010 2013
Youth total Youth male Youth female
Table 2.15: Youth Unemployment Rate, 1999–2013 (%)
Source:Bangladesh Bureau of Statistics. Various years. Labour Force Survey. Dhaka.
Year
Overall Unemployment Rate
Youth (15–29) Unemployment Rate
Male Female Total Male Female Total
1999–2000 3.4 7.8 4.3 9.5 15.0 11.12005–2006 3.4 7.0 4.3 7.2 10.7 8.12010 4.1 5.8 4.5 6.8 8.5 7.52013 3.0 7.2 4.3 7.0 9.8 8.1

16
Bangladesh: Looking beyond Garments
women. Combined with the decline in FLFP, this indicates a worsening of opportunities for women in the Bangladesh labor market.
Youth unemployment is also higher in urban areas (Table 2.16), substantially so for women. It seems that young women in urban areas face greater difficulty finding jobs than their rural counterparts. It is also possible that a larger number of urban young women compete for a smaller number of jobs.
Education is usually regarded as useful for enhancing the quality of the labor force and improving their chances of entry into the workforce. While the transition from school to work is found to be difficult regardless of development, in developed countries, unemployment rates vary inversely with education level. In developing countries, the opposite is found, including in Bangladesh, where unemployment is higher for people with higher education, although the trend is going downward in 2013 relative to 2010 (Figure 2.2). Indeed, looking specifically at education level, one can see that people with higher secondary education suffer the highest unemployment. And, once again, the situation is worse for women with this level of education (Figure 2.3). Those with tertiary education fare better, but still suffer higher unemployment rates than those with primary or no education.
A study of school-to-work transition, provides further insights into the issue of youth employment and unemployment (Toufique 2014). First, in addition to open unemployment, underutilization of labor is very high among youth.15 Nearly 38% of youth were neither in the labor force nor in education or training in the year of study, another 20% were in irregular employment, and 4.6% were unemployed, or 62.6% in total. Second, ____________________15 The term includes those neither in the labor force nor in education, as well as people whose work does not allow them to make the most of their economic
potential.
Table 2.16: Youth Unemployment Rate by Gender and Location, 2013
Source: Bangladesh Bureau of Statistics. 2015. Labour Force Survey 2013. Dhaka.
Figure 2.2: Unemployment Rate by Level of Education, 2010 and 2013 (%)
Figure 2.3: Unemplyment Rate by Gender and Level of Education, 2013 (%)
Source: Constructed using data from Bangladesh Bureau of Statistics. Various years. Labour Force Survey. Dhaka.
TVET = technical and vocational education and training.Source: Constructed with data from Bangladesh Bureau of Statistics. 2015. Labour Force Survey 2013. Dhaka.
Rural Urban
Male 6.42 8.59Female 8.39 13.01Total 7.19 10.44
0
14
12
10
8
6
4
2
16
2010 2013
Neverattended
school
Primary Secondary Highersecondary
Tertiary
0
18
16
8
12
14
10
4
6
2
20
Male Female
No
educ
atio
n
Cla
ss I–
IV
Prim
ary
scho
olce
rtifi
cate
Juni
or sc
hool
cert
ifica
te
Hig
her s
choo
lce
rtifi
cate
Seco
ndar
y sc
hool
cert
ifica
te
Cla
ss V
I–VI
I
Clas
s IX
–X
TVET
Bach
elor
’s/M
aste
r’s/
PhD

17
Employment and the Labor Market
the School-to-Work Transition survey corroborates the much higher rate of unemployment of young women compared with men. Third, although unemployment is higher among the better educated, investment in education does bring positive returns to youth in the form of higher wages and salaries and access to better jobs.
2.5. Child Labor
Participation of children in economic activities, especially family-run ones such as agriculture and other informal sector activities, is age-old in developing countries like Bangladesh. But the phenomenon came to the limelight when the country’s major export-oriented industry (ready-made garments [RMG]) started employing children.16 However, a variety of factors, such as a decline in acute poverty, higher enrollment in primary education, and a strong campaign against the practice has led to a gradual decline in the phenomenon.
In 1995, the Bangladesh Garment Manufacturers’ and Exporters’ Association, the International Labour Organization (ILO), and United Nations Children’s Fund (UNICEF) signed a memorandum of understanding paving the way for eliminating child labor from the garment industry. That initiative allowed children displaced and fired from the industry to receive education and vocational and skills training. It also provided families with income to make up for their child’s lack of work. The initiative helped put an end to employment of children in the industry.
The 2006 Labour Act of the Government of Bangladesh formally prohibited the employment of children below the age of 14. In 2010, the government adopted the National Child Labour Elimination Policy and the National Plan of Action.17 Other legal measures designed to prevent child labor include the Factories Act of 1965, which disallows children below age 14 to be present in factories.
Nonetheless, it is not easy to eliminate employment of children completely, as an overwhelming majority of working children are engaged in agriculture, home-based rural activities, and the vast informal sector where
it is difficult to implement labor laws. Concerted effort by a variety of actors, however, has led to an elimination of child labor from the RMG industry and a decline in the number working elsewhere (Table 2.17), which illustrates several points. First, since 1995, the number and percentage of children in the labor force has declined. And the decline is more notable in the case of girls, probably because of the increase in their enrollment in school. In recent years, the rate of decline appears to have increased for boys as well.
Which sectors employ children more? Data from the Labour Force Survey 2005–06 (see ILO, UNICEF, and World Bank 2011) show that a higher proportion of children are employed in agriculture. However, there are important differences in this respect depending on age, gender, and location. First, children engaged in agriculture are more than half among 7–10 year olds and lower for ages 10–14. Second, for the older age group, the proportion in services increases with age. Third, a higher proportion of male children are employed in agriculture, followed by services and manufacturing. For female children, the main employing sector is services, followed by agriculture and manufacturing.
Year and Data Source
Number of Economically Active
Children (‘000)Children’s Labor Force Participation Rate (%)
Total Male Female Total Male Female
1990–1991 (Labour Force Survey)
5,923 3,844 2,079 19.3 22.9 15.0
1995–1996 (Labour Force Survey)
6,455 3,856 2,599 18.7 21.6 15.7
2002–2003 (National Child Labour Survey)
4,692 3,372 1,319 13.4 18.5 7.8
2005–2006 (Labour Force Survey)
3,718 2,829 889 10.1 15.0 5.0
2011 (sample population census)
1,070 777 293 6.7 9.4 3.8
____________________16 That is, below age 15.17 The plan committed to eliminate the worst forms of child labor by 2015.
Table 2.17: Labor Force Participation Rates of Children, 1990–1991 to 2011 (ages 5–14)
Source: Rahman, R. I. Forthcoming. Bangladesh: Growth, Employment and Social Change. Dhaka: University Press Limited.

18
Bangladesh: Looking beyond Garments
2.6. Trends in Real Wages
In a developing country like Bangladesh, wage rates are important for a variety of reasons. While wages are an important indicator of the quality of employment, they are critical for the poor, who are more likely to depend on daily employment for their living. Furthermore, differences in wages between workers with different levels of education and skills can be an important factor influencing income distribution.
At the very early stages of economic growth, wage laborers are likely to be engaged mostly in agriculture, in rudimentary industries, construction, transport, and other informal sector activities. Such employment requires little education or skill. On the other hand, a small modern sector creates demand for more educated and skilled workers. From the supply side, given the availability of a large number of people with little or no education and skills, wages are likely to be low at early stages of economic growth. With low literacy and enrollment in education, a small educated labor force is likely to fetch higher wages and salaries in the small modern sector.
The situation changes, however, as an economy moves to advanced economic growth when demand for workers with some education and skills increases, very likely pushing up the wages of workers with those attributes. On the other hand, with a gradual increase in tertiary enrollment, the supply of graduates is likely to increase, reducing pressure on their remuneration. As a result, the difference in wages between various levels of education is likely to narrow.
In Bangladesh, wages as a whole are still rather low, pointing to low worker productivity on the one hand and low incomes on the other, and keeping large numbers in the category of working poor. According to Government of Bangladesh (2014), nearly 42% of the employed labor force in 2010 were below the international poverty line of $1 (at purchasing power parity) per day. Data on the incomes of different categories of workers further reveals the poverty.
Tables 2.18 and 2.19 show the distribution of the categories “day laborers” and “salaried workers” by income.
Table 2.18 shows that nearly half of those who worked as day laborers earned less than Tk1,000 per week. Using the national poverty line and the average size of households in that year and assuming an average of 1.5 earners per household, it can be reasonably concluded that those belonging to this class of wage income were poor.18 In other words, about half of the “day labourers” were poor in 2010,19 with not much gender difference in this respect.
Table 2.19 presents similar data for “salaried workers”. Using the same procedure mentioned above, one can conclude that those earning less than Tk5,000 per month belonged to the category of poor. That, in turn, would imply that in 2010 nearly 30% of salaried workers were poor, with female salaried workes (at over 40%) faring much worse than men (26%) in this category. The estimates of working poor are rough, yet indicate the high incidence of poverty among the wage and salary earners in Bangladesh.
The discussion now turns to the question whether differences in the earnings of individuals with different levels of education can contribute to a deterioration in the distribution of income. One study (Sen and Rahman 2015, using primary data from the Labour Force Survey) shows that the level of wage income increases with each successive level of education for all survey years. This is not surprising. What is interesting is that the earnings gap between individuals with various levels of education has remained stable or decreased gradually during 2000–2010. This implies that differences in the earnings of people with different levels of education is not a disequalizing factor. Data from the Household Income and Expenditure Surveys (HIES) tend to point in the same direction. Although that survey does not provide income figures for individual members of households, data are available for households by level of education of household heads (Table 2.20).
____________________18 Incomes of self-employed workers are also important, especially from the point of view of the poverty-reducing impact of employment. But published data from
the Labour Force Survey do not provide the necessary tabulations of incomes from self-employment. 19 In the Household Income & Expenditure Survey 2010, poverty lines in per capita expenditure are reported for different regions and divisions, ranging from Tk1,311 to
Tk2,038 per month. The modal figure is around Tk1,600 and average household size is 4.5 members. Thus, the poverty line for a household works out to Tk7,200 per month. For converting the incomes of day laborers and salaried workers into household income, we assume that households have an average of 1.5 working members.

19
Employment and the Labor Market
Table 2.18: Percentage Distribution of Day Laborers by Weekly Income, 2010
Table 2.19: Percentage Distribution of Salaried Workers by Monthly Income, 2010
Table 2.20: Average Monthly per Capita Income of Households according to Educational Attainment of the Household Head, 2005 and 2010 (Tk)
Source: Bangladesh Bureau of Statistics. 2012. Labour Force Survey 2010. Dhaka.
Source: Bangladesh Bureau of Statistics. 2012. Labour Force Survey 2010. Dhaka.
Note: Data are in current prices and, hence, it would not be appropriate to compare the figures for the 2 years. It is the ratios between earnings of households with different levels of education that are being compared. Source: Bangladesh Bureau of Statistics (BBS). 2011. Household Income & Expenditure Survey 2010. Dhaka (Table 140); and BBS. 2010. Household Income and Expenditure Survey 2005. Dhaka.
Weekly Income (Taka)
All Areas Urban Rural
Total Male Female Total Male Female Total Male Female
500 or less 10.6 9.6 21.4 7.5 6.7 16.3 11.1 10.4 23.0501–1000 38.5 39.5 27.9 33.5 33.5 22.0 40.1 41.0 29.71,001–1,500 29.8 31.5 9.6 33.8 33.8 10.5 29.2 30.9 9.41,501–2,000 17.3 16.0 32.9 20.1 20.1 41.4 16.1 14.9 30.2More than 2,000 3.8 3.4 8.2 5.9 5.9 9.8 3.1 2.8 7.7
Income (Taka)
All Areas Urban Rural
Total Male Female Total Male Female Total Male Female
Less than 2,000 2.2 1.6 4.6 1.8 1.2 3.4 2.5 1.9 6.62,000–2,999 8.0 6.3 15.6 9.1 6.0 19.4 7.0 6.6 9.63,000–4,999 18.8 18.2 20.9 19.8 18.8 23.3 17.7 17.7 17.45,000–6,999 15.1 16.1 10.1 14.1 15.7 8.9 15.9 16.6 11.87,000–9,999 23.4 23.1 25.0 21.6 21.8 21.3 25.1 24.2 30.710,000–12,499 21.0 21.9 17.0 17.4 18.0 15.6 24.3 25.1 19.312,500–19,999 6.1 6.8 3.5 7.6 8.7 4.1 4.8 5.1 2.920,000 and over 5.4 6.1 3.3 6.1 9.8 4.1 2.1 2.8 1.7
Level of Education
National Urban Rural
2005 2010 2005 2010 2005 2010
No class passed 1,002 1,967 1,239 2,462 981 1,858Class I–V 1,441 2,505 1,775 3,294 1,326 2,227Class VI–IX 1,813 2,892 2,168 3,359 1,660 2,684Secondary school certificate,
Higher secondary certificate, and equivalent
2,418 4,511 2,433 5,579 2,407 3,646
Graduate 3,611 5,642 4,072 6,534 2,767 4,080Postgraduate 4,851 6,247 5,772 7,101 2,210 4,140RatiosPrimary and no class passed 1.44 1.27 1.43 1.34 1.35 1.20High school certificate/
primary1.68 1.80 1.37 1.69 1.81 1.64
Graduate/Higher secondary certificate
1.49 1.25 1.67 1.17 1.15 1.12
Postgraduate and graduate 1.34 1.11 1.42 1.09 0.80 1.01Postgraduate and higher
secondary certificate2.01 1.38 2.37 1.27 0.92 1.14

20
Bangladesh: Looking beyond Garments
Ratios calculated from HIES data (Table 2.20) show that, with some exceptions, the gaps between the monthly earnings of households with different levels of education narrowed during 2005–2010. The notable exception is the ratio between higher secondary and primary levels, which may indicate the changing requirement of education as the economy is growing and is about to move to a higher stage of growth. As an economy shifts gear from a very low to a slightly higher level of development, its production structure changes, which in turn results in changes in factor inputs, including in labor. At this stage, only a primary education may not offer the same advantages of those with no schooling. On the other hand, the requirement of labor with a higher level of education (such as secondary and higher secondary) may have started to rise such that a worker’s comparative strength in the labor market has grown.20
In Bangladesh, this is quite prominent at the national level and in data for urban areas, although the figures for rural areas do not show this trend. Yet, the gap in earnings between graduate and secondary levels of education has narrowed—possibly indicating that the premium that graduates were earning is declining. This could be due both to an increase in the supply of labor with that level of education and higher education levels required for similar jobs. What is quite clear from
the data referred to here, however, is that differences in earnings between various levels of education do not seem to be contributing to a worsening of income distribution in the country.
Looking at trends in real wages in recent years, especially since 2007–2008 (Figure 2.4), one can see a rise in some sectors (such as in agriculture and rural areas in general). This has given rise to discussion on tightening of the rural labor market in Bangladesh and a possible shortage of labor. But before one comes to this conclusion, it is important to take a careful look at all relevant data on real wages. Unfortunately, official sources provide data on real wages only up to 2008–2009. Figure 2.4 presents the picture for 1993–1994 to 2008–2009.21
Figure 2.4 indicates a rising trend in real wages—overall as well as in agriculture and manufacturing—since 2000–2001. This seems to be a positive development from the point of view of improving the living conditions of workers as well as of reaching the Lewis turning point. But before drawing such a conclusion, one should look carefully at the trend revealed by Figure 2.4. First, although real wages began to trend upward, there was a flattening after 2003–2004 for a few years, and the rise started again in 2007–2008. The latter year witnessed sharp increases in the prices
____________________20 Notably, the rate of return to investment was found to be higher for higher levels of education compared with rates for primary and secondary levels (Asadullah
2005). 21 The indexes are based on the real wages of unskilled workers in various sectors, both formal and informal.
Figure 2.4: Index of Real Wages, 1993–1994 to 2008–2009 (1969–1970 = 100)
Source: Government of Bangladesh, Ministry of Finance. 2010. Bangladesh Economic Review 2010 (in Bengali).
ConstructionOverall Manufacturing
0
300
200
150
100
50
250
Agriculture
1993
–199
4
1994
–199
5
1995
–199
6
1996
–199
7
1997
–199
8
1998
–199
9
1999
–200
0
2000
–200
1
2001
–200
2
2002
–200
3
2003
–200
4
2004
–200
5
2005
–200
6
2006
–200
7
2007
–200
8
2008
–200
9

21
Employment and the Labor Market
of food grains in the global market, the impact of which was felt in the local market as well. However, instead of depressing real wages (which may have been natural), they have risen since then, which may lead one to conclude that the Bangladesh labor market has tightened and the rise in real wages is a reflection of that. But if that were the case, why did real wages remain flat during 2003–04 to 2006–07, when economic growth was high? So, rather than hastening to conclude that the rise in real wages since 2008 reflects a real tightening of the labor market, it is important to examine whether the trend has been sustained over considerable time.
As the official real wage series is available only up to 2008–09, we estimate real wages using official data on nominal wages and consumer price index for 2006–07 to 2011–12 (Table 2.21).
The table indicates that the rise in real wages continued after 2008–09 only in agriculture. For industry, the indexes for both 2009–10 and 2010–11 were lower than for 2008–09. Although there was a rise again in 2011–12, the index for that year was below that of 2008–09. It therefore seems that there are no clear signs of a sustained increase in real wages in the industry sector, implying that it is still possible to continue hiring workers without raising real wages. Hence, it would be premature to conclude on the basis of real wage data alone that Bangladesh has reached or is about to reach the Lewis turning point.22
Data on trends in real wages give rise to a number of important questions. First, to what extent does the trend reflect movements in labor productivity? If movements in real wages do reflect those in labor productivity, and since real wages have risen more in agriculture and construction (at least in recent years), is it possible that productivity in these two sectors has increased faster than in manufacturing? It may be recalled (from section 2.3) that during 2010–2013 manufacturing demonstrated an employment elasticity greater than one implying a decline in labor productivity during that period. This question needs more in-depth research.
Another factor that may have influenced movements in real wages in various sectors is rural–urban migration. This is a common phenomenon in many developing countries, including Bangladesh. The substantial difference in population growth between rural and urban areas (noted in section 2.2, Table 2.1) illustrates this migration. Labor force growth in rural areas has also been much lower. And these factors, coupled with the spread of education among the younger generation, may have undermined the supply of labor for agriculture. However, the high rate of rural–urban migration may have boosted the supply of labor for manufacturing, helping to keep the lid on real wages in the sector.23
2.7. Changes in Labor Policies and EmploymentIn the wake of a number of major industrial accidents in recent years, especially in the RMG industry, a number of improvements have been made in labor policies generally, and particularly in RMG. The main element of improvement in the overall labor policy is an amendment enacted in 2013 to the Bangladesh Labour Act of 2006, which brings about certain improvements in freedom of association, collective bargaining, and safety in the workplace. More specifically, registration of trade unions has been made easier and the ban on strikes in export
Year Overall Industry Construction Agriculture
2006–2007 100.68 100.90 101.39 100.532007–2008 102.57 103.02 104.54 102.072008–2009 114.79 114.33 120.34 115.862009–2010 115.40 112.97 119.29 121.652010–2011 110.96 106.26 116.08 123.172011–2012 114.49 113.20 141.43 128.73
____________________22 In addition, the difference between industrial and agricultural wage has not increased over time. On this, see Rahman (2012, Table 7.9.3, 161).23 A recent phenomenon is reverse migration from urban to rural areas. A Bangladesh Bureau of Statistics survey in 2013 shows that between 2009 and 2013 the rate
of rural to urban migration increased (Byron 2015).
Table 2.21: Indexes of Real Wages, 2006–2007 to 2011–2012 (2005–2006 = 100)
Source: Prepared with data on nominal wages and consumer price indexes (CPI). For overall and industry and construction, urban CPI is used; for agriculture, rural CPI is used. Data are from Government of Bangladesh, Ministry of Finance. 2014. Bangladesh Economic Review 2014 (in Bengali).

22
Bangladesh: Looking beyond Garments
processing zones withdrawn. In the RMG industry, a major initiative in workplace safety combines public and private initiative to inspect export-oriented factories, identify factories at risk, and take corrective measures.24 Furthermore, minimum wages were raised in 2013.
Although a full treatment of the implications of such changes in labor policies for employment is not possible within the scope of this diagnostic study, and it may be too early to undertake such an exercise, a few observations may nevertheless be made. First, in freedom of association, a good beginning has been made in expediting registration of trade unions in the RMG industry. Until March 2015, however, only 437 unions had been registered, and only about 5% of the industry’s workers were unionized.25
In workplace safety, over 2,500 factories out of 3,500 export-oriented factories have been inspected and a small number have been identified as needing corrective action. A large number of factories not formally regarded as export-oriented (but possibly linked to the export market through subcontracting) remains outside the purview of the inspection program mentioned above.
It is difficult to say how many workers might be affected by the inspection process and the resulting closure of factories, but estimates put the number at about a not-insignificant 150,000, especially given no apropriate measures to tackle severance and termination.
It is also difficult to assess the impact of a rise in minimum wages on the competitiveness of the RMG industry and its export performance. On previous occasions, however, such as after the increase in minimum wages in 2010, the export performance of the industry was not hurt. After a small increase in exports in 2011, export growth bounced back strongly in 2012 (with a 43% increase). Likewise, exports grew strongly, at nearly 14%, in 2013–14 (Table 2.22), remaining strong in the first quarter of 2015. Because
RMG is labor intensive, an increase in exports would imply a commensurate increase in employment.26
2.8. The Magnitude of the Employment Challenge: A Quantitative EstimateIn an economy like Bangladesh’s, where unemployment is low and people somehow manage to eke out a living, jobs required may not provide a true indicator of the real challenge in the area of employment. In addition to numbers, it would be important to look at the type of employment (by sector, skill requirement, and so on) needed. This study attempts to present numbers to indicate the basic quantitative aspects of the employment challenge. But the numbers presented also take into account the possibility of making a dent in unemployment and underemployment. As such, the qualitative aspect of employment is also addressed to some extent.
2.8.1. Methodology applied
A few basic aspects of the projection of this diagnostic warrant mention. First, the terminal year is taken as 2020, the same as the Seventh Five Year Plan of the
YearValue of Exports
($ million)Percentage Increase over Previous Year
2010 12,497 1.212011 17,915 43.352012 19,090 6.562013 21,516 12.712014 24,492 13.83Jul–Sep 2013 6,204Jul–Sep 2014 6,233 0.47Jan–Mar 2014 6,120Jan–Mar 2015 6,602 7.88
____________________24 Labowitz and Baumann-Pauly (2014) and European Commission (2015). In the aftermath of the Rana Plaza disaster in 2013, a common approach to determining
the safety of factory buildings was arrived at jointly by the National Tripartite Committee, the Accord on Fire and Building Safety (a group of global brands and retailers, based mostly in Europe but including a few from Asia), and the Alliance for Bangladesh Worker Safety (which represents a group of North American companies representing 90% of RMG exports from Bangladesh to the United States).
25 Overall, union density (percent of total paid employees in unions) in Bangladesh was low at 7% in 2010, and has declined over time (ILO 2013a).26 Notably, however, official sources give the number employed in the industry at 4 million for 3 consecutive years—2011–2012, 2012–2013, and 2013–2014. See
Bangladesh Bank (2015).
Table 2.22: Export of Ready-Made Garments, 2010 to First Quarter 2015
Source: Bangladesh Bank. 2015. Quarterly Review on RMG: January–March 2015.

23
Employment and the Labor Market
Government of Bangladesh. Second, to illustrate the supply side, the labor force is projected using labor force growth during the intersurvey period of 2002–2003 to 2013. Third, an aggregate projection model is used, which involves the use of elasticity of employment with respect to output and projected GDP growth. The observed (estimated) elasticity for 2005–2013 is used. Three alternative scenarios are used for projected GDP growth. In the first, 6.5% GDP growth a year is used, which this study considers realistic given growth in recent years. The second scenario, 7%, is considered optimistic. The third scenario, 7.4%, is the average growth projected for the Seventh Plan period and which this study considers “very optimistic.”
The model used for projections is as follows:Et = E0 (1 + re)t (1) where
Et represents total employment in the terminal year of the projection period,
E0 represents total employment in the base year, and
re represents the annual rate of growth of employment during the projection period.
re = ηrg (2) where
η represents elasticity of employment with respect to output, and
rg represents growth of output
η = re ÷ rg (3)
2.8.2. Results of projections
Labor force
Applying the growth rate of 2.96% a year (the observed growth of the labor force during 2005–06 to 2013),27 gives a projected labor force of 74.45 million for 2020. This gives an additional labor force of 13.75 million during 2013–20, or about 1.95 million a year.
To the new labor force, one has to add the backlog of unemployment (2.6 million in 2013) and indicate for whom employment needs to be found. Allowing for some unemployment to remain, one could assume that the target should be to absorb about half of those by 2020. That would mean an additional 260,000 has to be added to the yearly target for employment.
Because international migration of workers is an important source of employment for the Bangladeshi labor force, it is appropriate to take that into account in estimating the number of jobs required in the domestic labor market. Given recent and long-term trends in the outflow of workers, it may be realistic to assume that about 400,000 people would find employment abroad every year.
Taking into account the addition to the labor force, the need to absorb some of the unemployed, and the possibility of international migration for employment, 1.81 million per year is the appropriate minimum quantitative target for employment during the next few years.
But to make a real dent in underemployment and the number of working poor, additional employment substantially higher than that number is needed so that the available surplus labor can gradually move to new jobs with higher productivity. As Table 2.23 shows, that process would start happening when economic growth exceeds 6.5%. But even with GDP growth of 7.0%–7.4%, employment created is not much higher than the 1.81 million estimated minimum. So, what level of economic growth would be required to allow the economy to absorb surplus labor within a reasonable time frame (say 10 to 15 years)?
To answer, one first needs an estimate of surplus labor and then make projections of employment needed to absorb it. Absent a national estimate of surplus labor based on rigorous methodology, an attempt is made here to provide an illustrative estimate of surplus labor and the GDP growth required to absorb that within a 15-year period.
____________________27 Appendix 4 presents a note on the choice of figures of labor force growth and employment elasticity for use in the projections.

24
Bangladesh: Looking beyond Garments
One approach (albeit rather crude) would be to apply the current rate of underemployment in agriculture (28.6%) to the employed labor force in that sector (26.2 million) and arrive at an estimate of surplus labor in that sector. This gives a figure of 7.49 million. Assuming the rate of underemployment to be 10% for the rest of the rural labor force (15.50 million) as well as for the urban labor force (16.20 million), one gets 1.55 million and 1.62 million respectively. So, the total surplus labor would work out to be 10.66 million.28 If this surplus labor is to be absorbed in 15 years, the number of additional jobs required per year works out to be a little over 700,000. Hence, for a period of 5 years, the number of additional jobs required would be (i) 9.05 million to absorb the new additions to the labor force (at the rate of 1.81 million per year as explained earlier), and (ii) 3.5 million as contribution to absorbing the existing surplus labor. Thus, a total of 12.55 million jobs would be required over 5 years, which implies 2.50 million annually (Box 2.1).
Employment
The annual employment growth rate is projected using an employment elasticity of 0.45, the same figure the Planning Commission uses for its projections in the Seventh Five Year Plan (2016–2020), and alternative rates of GDP growth of 6.5%, 7.0%, and 7.4% a year. The results are presented in Table 2.23.
It appears from the projections in the table that if 1.81 million jobs per year is taken as the minimum target (as noted, to absorb new entrants into the labor force), GDP growth of 6.5% a year would be adequate. However, with economic growth remaining at that level, the labor market will remain at its present state, with a large proportion of workers underemployed and poor even though working. Absorption of surplus labor can start only when economic growth exceeds 6.5%. But even growth of 7.4% (the average annual growth projected by the Planning Commission for the Seventh
____________________28 Another way of estimating surplus labor could use the idea of working poor. Given that the open unemployment rate is only 4% of the labor force and the
incidence of poverty is about 31% of the population, it is clear that a large proportion of those employed are nonetheless poor. Clearly, their incomes need to increase either through improvement in productivity and returns within their existing work or move to new work with higher productivity and returns. Applying the same percentage of poverty to the employed labor force (54.1 million) gives an estimate of 16.8 million working poor, clearly much higher than the estimate obtained using the underemployment rate. It may not be realistic to use this for estimating surplus labor in the economy.
Box 2.1: Estimation of Jobs Required per Year
1. Projected labor force in 2020 (using labor force growth of 2.96% a year, the growth rate during 2006–2013): 74.45 million.
2. Addition to labor force during 2013–2020: (74.45 − 60.7) = 13.75 million (or 1.95 million per year).3. Backlog of unemployed in 2013: 2.6 million.4. If half of the backlog of unemployed is to be employed by 2020, then the additional job requirement per year would
be 260,000.5. Likely number to get employment abroad per year: 400,000.6. New jobs required per year without accounting for surplus labor: 1.95 + 0.26 − 0.40 = 1.81 (million).7. Surplus labor (2013):
(i) Agriculture total labor force: 26.2 million.(ii) Time-related underemployment in the sector (28.6% in 2013): 7.49 million.(iii) Rural non-agricultural labor force: 15.5 million.(iv) Surplus labor in the non-agriculture sector (10%): 1.55 million.(v) Surplus labor in urban areas (10% of urban employment): 1.62 million.(vi) Total surplus labor (total of ii, iv, and v): 10.66 million.(vii) If the surplus labor is to be absorbed in 15 years, annual additional employment required would be 710,000.
8. Total number of jobs required annually during 2015–2020 (accounting for surplus labor: 1.81 + 0.71 = 2.51 (million).
Source: Summarized from description in the text.

25
Employment and the Labor Market
Plan period of 2015–2020) will be inadequate to absorb all surplus labor in about 15 years. Higher GDP growth will be required.29 An alternative approach may be to change the development strategy and go for a more employment-intensive pattern of growth, as explained below (section 2.8.3).
To sum up the results of the labor force and employment projections, economic growth of 6.5% is the minimum requirement merely to absorb all the new additions to the labor force in the medium term and to make some dent in the current rate of unemployment. Faster economic growth is needed to absorb current surplus labor in the economy. To exhaust surplus labor within a reasonable period of time (say 15 years), GDP growth of over 8% is needed.
2.8.3. Alternative scenarios with higher employment intensity of growth
It must be apparent that in making the projections, no variation has been made in the elasticity of employment, although different assumptions have been made for GDP growth. Is it not possible to think of higher employment growth through higher employment intensity of growth? Actually, the elasticity
of employment observed for the major sectors (except services) during 2005–2010 appears to be quite high. Any further increase in employment intensity for those sectors may not be desirable, at least from the point of view of productivity. However, the overall elasticity of employment with respect to GDP growth could be higher if the more employment-intensive sectors grew at higher rates than at present. For example, employment elasticity in the manufacturing sector is seen as higher than that in agriculture or in services. Hence, if manufacturing grows faster than those sectors, it is not impossible to think of a situation where the overall employment elasticity could be higher than observed in recent years. For example, even 6.5% to 7% GDP growth could be consistent with say, 12%–13% growth of manufacturing. Although the sector in Bangladesh has not attained such high growth, it is not impossible.30 With growth in that range and no decline in the employment intensity of growth in the sector, employment in the sector could increase 9%–10% a year. Overall employment elasticity with respect to GDP could also be higher than observed.31 To illustrate the likely scenario with such growth in the manufacturing sector, an alternative set of projections has been made using an overall employment elasticity of 0.55 (Table 2.24).
Notably in Table 2.24, even with GDP growth of 6.5%, much higher growth of employment is possible if the weight of manufacturing in that growth increases. In fact, if manufacturing grows 12%–13% per year and if labor-intensive industries like garments, shoes, furniture, electronics, or leather products feature in that growth, it is possible for employment in manufacturing to grow at 9%–10% a year. That would imply additional employment in the sector of about 600,000 per year (instead of less than 400,000 at present). Such growth in the manufacturing sector will have linkage effects with other sectors, especially the transport and service
____________________29 Using an employment elasticity of 0.45 and the projection model presented earlier, the required GDP growth for creating 13 million jobs works out to be about
8.4% a year. In an earlier exercise (Islam 2014b), this report estimated the required GDP growth for attaining the same objective mentioned here (that of absorbing all the surplus labor in about 15 years) by using a higher employment elasticity of 0.55 (the figure for 2005–2010); and the figure was 8% a year. Clearly, if the job-creating capacity of the economy declines (which would be reflected in lower employment elasticity), higher output growth would be required to absorb the same amount of labor.
30 For example, in the Republic of Korea and Malaysia, manufacturing output grew at such (or even higher) rates for a long time. Figure A1.1 in Appendix 1 shows the growth of manufacturing output and of GDP in Bangladesh during 1990–91 to 2012–13. It is clear from that figure that growth of manufacturing output has been quite volatile. It did exceed double digits in 2006–07, but then declined sharply. Even after recovery in 2010–11, growth has plateaued at below 10% a year. From the point of overall growth of the economy as well as of employment, sustained high growth of manufacturing output is essential.
31 It needs to be clearly understood that what is being suggested here is not for Bangladesh to pursue a strategy of development with low-productivity activities. The labor-intensive manufacturing referred to here can grow without compromising on labor productivity. And once the country’s economy has absorbed all surplus labor available and the labor market becomes tighter, it can gradually move to stages of industrialization involving different sector composition. It may also be noted that this is the kind of path followed by countries such as the Republic of Korea and Malaysia that have been successful in attaining high rates of economic growth and high employment growth.
Table 2.23: Employment Projections under Alternative GDP Growth Assumptions
(with employment elasticity of 0.45)
GDP = gross domestic product. Source: Asian Development Bank calculations.
GDP growth per year (%) 6.5 7.0 7.4
Total employment in 2020 (million)
71.09 72.19 73.07
Additional employment (2013–20) (million)
12.99 14.09 14.97
Additional employment per year(million)
1.86 2.01 2.14

26
Bangladesh: Looking beyond Garments
sectors. Hence, the employment outcome could be substantially better than the one presented in section 2.8.2 if a different pattern of growth (with substantially higher growth in the manufacturing sector) could be achieved.
2.9. Conclusion
The chapter highlighted the following key aspects of positive and negative developments in the labor market:
Positive developments in the labor market
• The proportion of the working-age population in the total population has increased as a whole and for men and women as well as for rural and urban areas.
• The growth of labor force during 2010–2013 declined compared with the earlier intersurvey period of 2005–06 to 2010.
• The proportion of the labor force with no education has declined, indicating improvement in the level of education of the labor force.
• The rate of open unemployment has declined slightly. The time measure of underemployment shows a decline in both rural and urban areas.
• Manufacturing employment has registered a double-digit growth. As a result, the share of this sector in total employment increased significantly during 2010–2013.
Table 2.24: Employment Projection with Employment Elasticity of 0.55
GDP = gross domestic product.Source: Asian Development Bank calculations.
GDP growth per year (%) 6.5 7.0 7.4
Total employment in 2020 (million)
74.30 75.69 76.82
Additional employment (2013–2020) (million)
16.20 17.59 18.72
Additional employment per year (million)
2.31 2.51 2.67
• Both the number engaged in and the share of the informal sector has declined.
• The share of unpaid family workers and of agricultural laborers has declined, while the share of employees has increased.
• Differences in wages and earnings by level of education do not appear to be acting as a source of rising inequality in the distribution of income.
• Real wages in agriculture have risen consistently since 2008.
Negative developments in the labor market
• The FLFP rate declined during 2010–2013.
• The proportion of the labor force with tertiary level and with technical education remains very low for both men and women.
• By any measure, underemployment remains very high, especially in agriculture. Male underemployment has noticeably declined.
• Excessive work (that is, long hours of work) is a common phenomenon for both men and women. The proportion of women working more than 50 hours per week has increased.
• During 2010–2013, the overall growth of employment was lower for women.
• Double-digit growth in manufacturing employment has not been the result of similar growth in output of the sector. As a result, labor productivity has declined.
• Employment in the construction sector contracted, despite healthy growth of output in the sector. This demonstrates that output growth is not a sufficient condition for growth in employment.
• The rate of youth unemployment increased during 2010–2013 for both men and women. This marks a reversal of the decline in youth unemployment during 2005–06 to 2010.

27
Employment and the Labor Market
• The rate of employment growth with respect to output growth declined during 2010–2013, demonstrating a decline in the job-creating capacity of growth as a whole. And that happened despite high growth of employment in manufacturing. A major factor in the decline in overall employment elasticity may be the contraction in employment in construction and a small increase in employment in agiculture. Elasticity of employment in the service sector has also been low.
• The relationship between education and the rate of open unemployment remains perverse—those with higher levels of education demonstrating higher unemployment. However, those with higher levels of education are able to find better jobs and to earn more.
• Real wages in sectors other than agriculture do not show a consistent increase.
• Despite some decline, the proportion of those employed and yet suffering from poverty remains quite high (nearly half in the case of day laborers).
• Labor policies relating to minimum wages and workplace safety in the RMG industry do not seem to have had neither positive nor adverse effect on the number employed as it was stagnated at 4 million for three consecutive years from 2011.
Remarks about the labor market situation
It is difficult to draw a firm conclusion about the state of the labor market on the basis of the data in this study. The rise in the real wages of agricultural labor may tempt the conclusion that the labor market, especially in rural areas, is tightening. But it would be a little premature to arrive at this conclusion for several reasons. First, seasonal variation in the demand for labor in rural areas is a known feature of economies dependent on monsoon agriculture. It is true that the spread of irrigation and new varieties of rice have led to substantial changes in the pattern and magnitude of such seasonal variation. Growth of nonfarm activities in rural areas and improvements in connectivity with urban or semi-urban areas are other factors that have
opened up new opportunities of employment for the rural labor force. On the supply side, the increase in enrollment in education may have contributed to some reduction in the supply of labor. Furthermore, younger members of the labor force with some education may no longer be willing to accept wage work in crop production as a means of livelihood. The operation of the abovementioned factors may have contributed to a tightening of the rural labor market and a rise in wages in agriculture.
The above, however, should not be taken to mean that the Bangladeshi labor market is tightening and surplus labor is no longer available. That real wages in manufacturing have not yet increased on a sustained basis shows that the modern sector is still able to hire workers without having to raise real wages substantially. That, combined with other features like the high incidence of informal employment, substantial degree of time-related underemployment, and low rate of labor force participation of women, shows the continued availability of surplus labor for the expansion of the modern sectors of the economy.
In addition, a high proportion of the employed labor force in Bangladesh remains in vulnerable employment. This category includes a host of people engaged in very low productivity employment—either in own-account work or in wage employment in both formal and informal activities. Apart from low incomes, they often face the risk of losing their livelihoods when hit by crisis after natural calamities, economic fluctuations, and personal factors (such as illness). In the absence of appropriate measures of social protection, such workers (and their families) face the risk of falling back into poverty or of becoming poorer.
Remarks based on employment projections
Projections of employment made in this study, simple as they may be, should point to the challenge policy makers still face. Several points emerge from these projections:
• With GDP growth of around 6.5% and growth elasticity of output at a level observed in recent years, it would be possible to just maintain the current state of the labor market. Not

28
Bangladesh: Looking beyond Garments
much improvement in the situation regarding unemployment and underemployment may be expected with such a rate of growth.
• Absorption of surplus labor would become possible only when GDP growth exceeds 6.5% a year. But to fully absorb the surplus labor in the economy within about 15 years, an annual GDP growth of 8% would be required, unless development strategy changes substantially and the pattern of growth becomes more employment intensive.
• With a change in development strategy in which labor-intensive manufacturing becomes a stronger engine of growth, overall employment elasticity could be higher. In that case, the same employment goal mentioned above may be possible with lower (than 8%) GDP growth.
Key employment challenges at a glance
• Capitalizing on the increase in the working-age population by raising the qualitative level of the labor force in both general and technical education with direct relevance to the needs of the labor market.
• Reversing the decline in the FLFP rate.
• Raising GDP growth progressively to 8% a year, which is required to absorb all surplus labor within 15 years or so.
• Attaining job-rich growth in which a high rate of employment growth is achieved alongside a high rate of output growth. This is a challenge because of the recent experiences of manufacturing and construction. In the former, employment growth exceeded output growth, whereas in construction, employment growth was negative despite positive output growth.
• These require genuine structural transformation of the economy through much more diversified growth in general and of manufacturing in particular.
• A major challenge is to raise productivity and incomes from labor—of both the wage employed and the self-employed. Separate strategies are needed for the two groups.
• The decline in women’s employment growth needs to be reversed. Particularly important is a diversification to include service sector jobs and jobs abroad.
• Bringing down the unemployment rate among the educated and youth. Higher returns associated with investment in higher education show that investment in education is useful. But the functioning of the labor market for the educated job seekers needs to improve.

29
Economic Diversification, Structural Change, and Employment in Bangladesh
Chapter 3Economic Diversification,
Structural Change, and Employment in Bangladesh
is heavy reliance on low-productivity activities in the agriculture and service sectors. The prospects for economic diversification clearly remain a challenge.
Against this backdrop, this chapter highlights trends in the transformation of the Bangladesh economy, identifies challenges to diversification and transformation of employment, and makes policy recommendations to promote a sustainable growth for more and better jobs. It examines the trends in structural transformation—the shift of workers out of agriculture into higher-productivity manufacturing and, possibly, into some services. Through this, the chapter sheds light on why diversification of production and employment has been insufficient.
3.2 Review of Literature
The structural change of an economy refers to a shift of resources from less to more productive sectors, an increase in the diversification and sophistication of production and exports, and discovery of new products (Felipe 2009). Tuck-Primdahl (2011) argues that structural transformation is a key determinant of productivity growth, explaining two-thirds of the difference between superior East Asian growth and more muted Latin American growth in the past 2 decades.
3.1. Introduction
The Bangladesh economy has undergone significant structural change over the last 4 decades. The share of agriculture in gross domestic product (GDP) has declined from over 60% to less than 20%, while the relative significance of industry (including manufacturing), currently estimated to be 28% of GDP, and service sectors have increased substantially. In the past 2 decades or so, the economy has sustained reasonably strong growth. Yet the policy agenda since at least the release of the Sixth Five-Year Plan in 2010 has accepted the need for economic diversification to sustain long-term economic growth and job creation.
However, the manufacturing base has yet to diversify significantly. Agriculture’s share in overall employment has been much slower to decline than that sector’s share in GDP. In the 1990s and 2000s, manufacturing increasingly focused on the ready-made garment (RMG) sector, and the share of employment in the manufacturing sector actually rose from 9.5% according to the 1999–2000 Labour Force Survey (LFS), to 16.4% in the 2013 LFS, driven by this expansion. Yet, this suggests that in the overall manufacturing sector, larger-scale employment creation remains a challenge. At the same time, almost 90% of employment in Bangladesh is informal (defined as a job without a full contract or benefits). And there
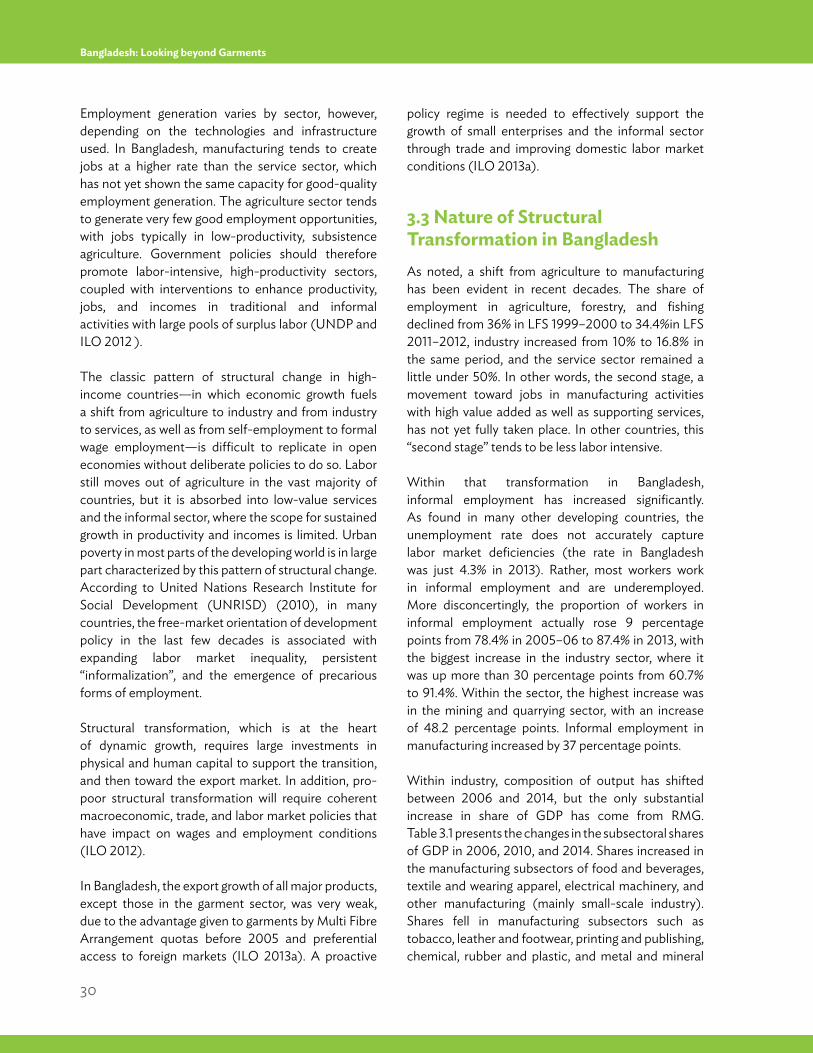
30
Bangladesh: Looking beyond Garments
Employment generation varies by sector, however, depending on the technologies and infrastructure used. In Bangladesh, manufacturing tends to create jobs at a higher rate than the service sector, which has not yet shown the same capacity for good-quality employment generation. The agriculture sector tends to generate very few good employment opportunities, with jobs typically in low-productivity, subsistence agriculture. Government policies should therefore promote labor-intensive, high-productivity sectors, coupled with interventions to enhance productivity, jobs, and incomes in traditional and informal activities with large pools of surplus labor (UNDP and ILO 2012 ).
The classic pattern of structural change in high-income countries—in which economic growth fuels a shift from agriculture to industry and from industry to services, as well as from self-employment to formal wage employment—is difficult to replicate in open economies without deliberate policies to do so. Labor still moves out of agriculture in the vast majority of countries, but it is absorbed into low-value services and the informal sector, where the scope for sustained growth in productivity and incomes is limited. Urban poverty in most parts of the developing world is in large part characterized by this pattern of structural change. According to United Nations Research Institute for Social Development (UNRISD) (2010), in many countries, the free-market orientation of development policy in the last few decades is associated with expanding labor market inequality, persistent “informalization”, and the emergence of precarious forms of employment.
Structural transformation, which is at the heart of dynamic growth, requires large investments in physical and human capital to support the transition, and then toward the export market. In addition, pro-poor structural transformation will require coherent macroeconomic, trade, and labor market policies that have impact on wages and employment conditions (ILO 2012).
In Bangladesh, the export growth of all major products, except those in the garment sector, was very weak, due to the advantage given to garments by Multi Fibre Arrangement quotas before 2005 and preferential access to foreign markets (ILO 2013a). A proactive
policy regime is needed to effectively support the growth of small enterprises and the informal sector through trade and improving domestic labor market conditions (ILO 2013a).
3.3 Nature of Structural Transformation in Bangladesh As noted, a shift from agriculture to manufacturing has been evident in recent decades. The share of employment in agriculture, forestry, and fishing declined from 36% in LFS 1999–2000 to 34.4%in LFS 2011–2012, industry increased from 10% to 16.8% in the same period, and the service sector remained a little under 50%. In other words, the second stage, a movement toward jobs in manufacturing activities with high value added as well as supporting services, has not yet fully taken place. In other countries, this “second stage” tends to be less labor intensive.
Within that transformation in Bangladesh, informal employment has increased significantly. As found in many other developing countries, the unemployment rate does not accurately capture labor market deficiencies (the rate in Bangladesh was just 4.3% in 2013). Rather, most workers work in informal employment and are underemployed. More disconcertingly, the proportion of workers in informal employment actually rose 9 percentage points from 78.4% in 2005–06 to 87.4% in 2013, with the biggest increase in the industry sector, where it was up more than 30 percentage points from 60.7% to 91.4%. Within the sector, the highest increase was in the mining and quarrying sector, with an increase of 48.2 percentage points. Informal employment in manufacturing increased by 37 percentage points.
Within industry, composition of output has shifted between 2006 and 2014, but the only substantial increase in share of GDP has come from RMG. Table 3.1 presents the changes in the subsectoral shares of GDP in 2006, 2010, and 2014. Shares increased in the manufacturing subsectors of food and beverages, textile and wearing apparel, electrical machinery, and other manufacturing (mainly small-scale industry). Shares fell in manufacturing subsectors such as tobacco, leather and footwear, printing and publishing, chemical, rubber and plastic, and metal and mineral

31
Economic Diversification, Structural Change, and Employment in Bangladesh
products. They held steady in wood and wood products, and metal and mineral products remained stable.
Within manufacturing, the rise in the share of employment in textile and the wearing apparel subsector has been remarkable, particularly during 2009 and 2014. While chemical, rubber, and plastics; electrical machinery; and other manufacturing increased, they did so from very low levels, while shares fell in all other subsectors (Figure 3.1).
Quite the reverse picture emerges in shares of employment. The aforementioned analysis suggests that over the last decade, in terms of value-addition share, manufacturing has become more and more concentrated in the textile and wearing apparel sector. Despite a 5 percentage point decline from 1999–2000, the share in total employment of agriculture, forestry, and fishing in 2013 remained high (45.1%). Industry’s share in total employment increased from around 10% in 1999–2000 to 20.8% in 2013, and construction also grew, from 2.8% to 3.7% during the same period. The share of employment in the service sector, however, was mostly flat, with a small decline to 45.1% in 2013 (Figure 3.2). Without going into the sectoral shifts within the service sector, both the output and employment numbers suggest that the transformation into a service economy has not yet taken place in Bangladesh. The subsectoral shares
Table 3.1: Subsectoral Shares of GDP at Constant Prices, 2006, 2010, and 2014 (%)
GDP = gross domestic product. Source: Bangladesh Bureau of Statistics, National Accounts data.
Subsector 2006 2010 2014
Agriculture, forestry, and fishing 19.01 18.38 16.50Mining and quarrying 1.53 1.65 1.63Manufacturing 16.15 17.19 19.48Food and beverage 1.42 1.32 1.65Tobacco 0.41 0.40 0.13Textile and wearing apparel 5.84 6.86 9.61Leather and footwear 0.44 0.39 0.34Wood and wood products 0.37 0.38 0.37Printing and publishing 0.34 0.32 0.27Chemical, rubber, and plastic 1.59 1.30 1.18Petroleum and petroleum
products0.01 0.00 0.00
Metal and mineral products 2.21 2.22 2.02Electrical machinery 1.84 2.15 2.01Other manufacturing 1.68 1.85 1.90Services and construction 53.33 62.77 62.40Electricity, gas, water, and waste management
1.21 1.28 1.42
Construction 6.52 6.65 7.03Trade, hotel, and restaurants 14.38 14.77 14.85Transportation, storage, and
communication10.16 11.05 11.49
Financial intermediation, real estate and other business activities
11.40 10.49 10.28
Public administration and defense 3.08 3.26 3.39Education 2.21 2.23 2.26Human health and social work
activities1.97 1.96 1.86
Other service activities 12.40 11.08 9.82TOTAL 100.00 100.00 100.00
Figure 3.1 : Share of Different Subsectors in Manufacturing GDP, 2006–2014 (%)
GDP = gross domestic product. Source: Bangladesh Bureau of Statistics, National Accounts data.
0
50
40
20
30
10
60
2006 2009 2012 2014
Food
and
beve
rage
Toba
cco
Text
ile a
ndw
eavi
ngap
pare
l
Woo
d an
dw
ood
prod
ucts
Petro
leum an
dpe
trole
umpr
oduc
ts
Chem
ical
, ru
bber
,an
d pl
astic
Leat
her a
ndfo
otw
ear
Elec
trica
lm
achi
nery
Prin
ting a
ndpu
blish
ing
Met
al a
ndm
iner
alpr
oduc
ts
Oth
erm
anuf
actu
ring

32
Bangladesh: Looking beyond Garments
Subsector Employment
Annual Average Growth Share of Employment
1999–2000 to 2005–2006
2005–2006 to 2009–2010
2009–2010 to 2012–2013 1999–2000 2005–2006 2009–2010 2013
Agriculture, forestry, and fishing 2.52 3.25 0.6 50.75 48.06 47.29 45.1Mining and quarrying (11.88) 29.5 37.33 0.45 0.11 0.2 0.4Food and beverage 1.54 10.42 19.34 1.33 1.2 1.48 2.19Tobacco 40.35 2.78 10.07 0.1 0.27 0.27 0.32Textile and wearing apparel 8.2 21.81 6.5 3.73 4.57 7.46 8.35Leather and footwear (7.37) (4.95) 2.23 0.49 0.22 0.16 0.16Wood and wood products 6.96 8.17 40.76 0.81 0.95 1.09 2.27Paper, printing, and publishing 11.03 (10.81) 52.12 0.17 0.24 0.12 0.28Chemical, rubber, and plastic 24.26 (14.65) 33 0.29 0.58 0.21 0.39Petroleum and petroleum products (8.33) 56.03 (4.53) 0.01 0 0.01 0.01Metal and mineral products 18.71 (5.45) 24.03 0.63 1.1 0.75 1.2Electrical machinery (7.74) (6.42) 111.8 0.14 0.06 0.04 0.17Other manufacturing 3.84 (13.38) 18.53 1.81 1.84 0.74 1.08Construction 6.46 17.9 (6.03) 2.82 3.22 4.81 3.69Electricity, gas, water, and waste management (6.35) 8.79 20.72 0.38 0.19 0.23 0.34Trade, hotel, and restaurants 4.47 1.75 0.02 15.86 16.55 15.42 14.45Transportation, storage, and communication 10.16 0.39 (2.42) 6.34 8.39 7.42 6.45Financial intermediation, real estate, and other
business activities 30 (7.35) (4.28) 0.67 1.54 0.94 0.77
Public administration and defense 1.87 (9.72) 13.93 2.03 1.86 0.99 1.32Education 4.24 (0.38) 15.25 2.67 2.76 2.37 3.23Human health and social work activities 2.33 7.19 20.8 0.75 0.71 0.79 1.2Other service activities (2.12) 12.1 (0.67) 7.77 5.58 7.21 6.62Total 21.4 14.2 7.4 100 100 100 100
Table 3.2: Subsectoral Annual Average Growth and Shares of Employment, 1999–2013 (%)
( ) = negative. Source: Bangladesh Bureau of Statistics. Various years. Labour Force Survey. Dhaka; and own calculations.____________________32 The health and education sectors represent predominantly public sector jobs. Any changes in the share represent a corresponding increase in the budgetary
allocation to these sectors during this period. Chapter 3 of ADB (2016) discusses the impact on inclusive growth of higher public spending in these sectors.33 ADB (2016) suggests that there has been a substitution from low-skilled labor to more mechanization, in part to increase economies of scale and in part a
response to rising average wages.
of employment are presented in Table 3.2. Among the services subsectors, except education and health subsectors,32 shares in all subsectors fell during the period under consideration.
Within manufacturing, there is no clear pattern and trend in changes in sectoral composition of employment Textile nd wearing apparel is the major subsector of employment, with its share in manufacturing output increasing from 39.0% in 1999–2000 to 45% in 2013 and its share in total manufacturing employment increased from 39.2% to to 50.8% in 2013.33
The annual average growth rate of subsectoral employment during three different periods confirms the fast absorption of employees in textiles and
Figure 3.2: Broad Sectoral Shares of Employment, 1999–2013 (%)
Source: Bangladesh Bureau of Statistics. Various years. Labour Force Survey. Dhaka.
1990–2000
36.47
9.96
50.75
2.82
37.58
11.14
48.06
3.22
35.37
12.52
47.29
4.81
34.38
16.83
45.10
3.69
2005–2006 2009–2010 2013
Agriculture, forestry, and fishing Industry
Construction Services

33
Economic Diversification, Structural Change, and Employment in Bangladesh
garments (Table 3.2). Employment in agriculture, forestry, and fisheries grew almost 3% per year on average, but growth slowed markedly from 2009 to 2013. Mining and quarrying contracted during the first period, though grew substantially during the later periods. Among the manufacturing subsectors that grew in all three periods were food and beverage, tobacco, textile and wearing apparel, and wood and wood products.
The experiences of all other manufacturing sectors have been mixed. During the latest period, electrical machinery is the sector with the highest growth (although from a low base). However, wood and wood products with positive growth rates in all three periods grew more than 40% during the third period. This sector is composed almost exclusively of unskilled
workers, with 94% of employment informal as of 2013 (Table 3.3). Growth in the textile and wearing apparel sector, a major employer in manufacturing, rose remarkably from 8.2% from 1999 to 2005 to 21.8% during 2006–2010. Growth declined to 6.5% after 2010, however. The construction sector grew in the first two periods then contracted in the third period. Among the service subsectors, trade, hotel, and restaurants; transportation, storage, and communication; and human health and social work activities had positive growth rates in all three periods, though other subsectors experienced both a rise and fall in growth rates.
As noted, economic structure is still far from well diversified. Figure 3.3 shows the trend in the calculated Herfindahl–Hirschman concentration index34 of
____________________34 The Herfindahl–Hirschman Index is a measure of the size of subsectors in relation to the sector and an indicator of the amount of competition among them. It is
defined as the sum of the squares of the market shares of the subsectors within the industry where the market shares are expressed as fractions. It can range from 0 to 1.0, where increases in the index indicate a decrease in competition and an increase of market power, and decreases the opposite.
Table 3.3: Share of Skills and Informality of the Labor Force, 2013
Source: Data from Bangladesh Bureau of Statistics. Various years. Labour Force Survey. Dhaka.
SubsectorShare of Gross Value
Added, %Number of Employed,
‘000Share of Unskilled
Labor, % Share of Informal Employment, %
Agriculture, forestry, and fishing 16.1 26,190 100.0 97.8Mining and quarrying 1.6 231 94.3 91.2Food and beverage 1.2 1,272 96.6 93.9Tobacco 0 188 93.2 96.1Textile and wearing apparel 10.5 4,847 96.8 93.2Leather and footwear 0.6 91 99.5 88.6Wood and wood products 0 1,321 99.7 93.9Paper, printing, and publishing 0.2 151 87.9 76.1Chemical, rubber, and plastic 0.7 227 61.9 85.3Petroleum and petroleum products 0 6 66.7 95.6Metal and mineral products 1.9 700 96.8 90.6Electrical machinery 1.9 83 78.1 82.9Other manufacturing 0.4 616 98.0 36.6Construction 1.4 2,144 92.8 92.2Electricity, gas, water, and waste
management7.1 198 77.5 62.6
Trade, hotel, and restaurants 14.5 8,393 96.7 79.4Transportation, storage, and
communication10.5 3,745 98.7 84.0
Financial intermediation, real estate, and other business activities
10.9 448 41.1 41.5
Public administration and defense 3.5 764 58.4 29.9Education 2.6 1,876 5.9 42.0Human health and social work
activities2.1 751 33.3 52.6
Other service activities 2.1 751 33.3 52.6

34
Bangladesh: Looking beyond Garments
Figure 3.3: Herfindahl–Hirschman Concentration Index of Value Added, 1989–2012
Source: Calculated using the data from the Bangladesh Bureau of Statistics, disaggregated national accounts.
ServicesManufacturing
0.08
0.28
0.18
0.13
0.23
Agriculture, forestry, and fishing
1989
–199
0
1991
–199
2
1993
–199
4
1995
–199
6
1997
–199
8
1999
–200
0
2001
–200
2
2003
–200
4
2005
–200
6
2007
–200
8
2009
–201
0
2011
–201
2
value-added for three major sectors in the economy. It appears that for agriculture, forestry, and fishing—even though the concentration index declined in general between 1989–1990 and 2004–2005—the concentration ratio did not fall but, rather, increased in recent years. In manufacturing, the concentration index has gradually risen and, since 2006–2007, the pace has increased quite considerably. This suggests that the manufacturing sector in recent years has become less and less diversified. Interestingly, the service sector in Bangladesh has remained well diversified and the situation did not change during 1989–1990 and 2011–2012.
Such lack of diversification in the overall economy is also reflected in the export basket in Bangladesh. Figure 3.4 shows the composition of exports in different periods. It is clearly evident that with the remarkable growth in total exports from 1995 to 2013, the export basket became more and more concentrated around the RMG sector. The growth of RMG exports was largely attributable to the international trade regime in textiles and clothing. Until 2004, the main preference
was governed by Multi Fibre Arrangement quotas, which restricted competition in the global market by providing reserved markets for a number of developing countries, including Bangladesh, where textiles and clothing items have not been traditional exports. The duty-free access for Bangladesh’s RMG products in the European Union has also greatly supported the growth of the sector. Finally, a number of incentives, put in place in the 1980s when the sector was just starting, still exist, helping to propel the sector substantially. ADB (2016, Chapter 5) discusses these in detail. The underlying dynamics of the structural transformation that has taken place is really a transfer of unskilled labor from rural areas and peri-urban areas to textiles and garments. However, few skills are being acquired by unskilled workers in textiles and garments, in particular, and there are few alternatives in other industries for on-the-job skills acquisition. The policy implication is that the lack of diversification of the manufacturing sector—where jobs are growing—may partly be stunting further job creation on more high-valued sectors.

35
Economic Diversification, Structural Change, and Employment in Bangladesh
3.4. Policy Environment
3.4.1. Trade policy
Bangladesh pursued an import-substituting industrialization strategy in the 1970s. However, facing the failure of the inward-looking strategy to deliver desired outcomes, along with rising internal and external imbalances, trade policy reforms were introduced in the early 1980s. Since then, trade liberalization has become an integral part of trade policy. The country has been able to reduce protection for the domestic sectors quite significantly by substantially reducing quantitative restrictions, drastically opening trade in many restricted items,
significantly rationalizing and reducing import tariffs, and considerably adjusting monetary and fiscal policies. Another important element of trade policy reform was the introduction of generous promotional measures for exports. Import and exchange rate liberalization were intended to correct the domestic incentive structure in the form of reduced protection for import-substituting sectors. The export incentives have indeed led to an impressive export performance.
However, one important concern is that export growth has been overwhelmingly dominated by RMG. The sector’s export success has also come hand in hand with less economic diversification, and has led to weak domestic linkages with other manufacturing and
Figure 3.4: Change in Export Composition, 1995–2013
Source: A. Simoes. Observatory of Economic Complexity. MIT Lab. http://atlas.media.mit.edu/en/
Articles of apparel and clothing accessories–
Not knitted/crocheted
42%
Articles of apparel and clothing accessoriesKnitted/crocheted
18%
Vegtext
fibersNesoi,yarns,
andwoven,
etc.
Made-uptext,
articles,Nesoi,
needlecraftsets,wom
clothing,rags
Headgearand
other parts
Toys, gamesand sportsequipment
Rawhides,skins,and
leather
Fertilizers
Fishand
crustaceans
Co�ee,tea, mate,
spices
6%
3% 2%
4%
7%7%
39%
Articles of apparel and clothing accessoriesKnitted/crocheted
37%
Vegtext
fibersNesoi,yarns,
andwoven,
etc.
Headgearand
otherparts
Rawhides,skins,and
leather
Fertilizers
Fishand
crustaceans
2%
1%
1%
0.91%
4%
Articles of apparel and clothing accessories–
Not knitted/crocheted
Articles of apparel and clothing accessories–
Not knitted/crocheted
45%
Articles of apparel and clothing accessoriesKnitted/crocheted
27%
Vegtext
fibersNesoi,yarns,
andwoven,
etc.
Made-uptext,
articles,Nesoi,
needlecraftsets,wom
clothing,rags
Headgearand
other parts
Rawhides,skins,and
leather
Fertilizers
Fishand
crustaceans
4%
3%
3%
3%
1%
6%
43%
Articles of apparel and clothing accessoriesKnitted/crocheted
42%
Headgearand other
parts
Rawhides,skins,and
leather
Fishand
crustaceans
1%
2%
Articles of apparel and clothing accessories–
Not knitted/crocheted
Composition of Exports, 1995
Composition of Exports, 2005
Composition of Exports, 2000
Composition of Exports, 2013

36
Bangladesh: Looking beyond Garments
supporting service sectors. This is in contrast to other economies, such as the People’s Republic of China and Viet Nam during their early structural transformation (ADB 2016). Part of the dominance is the result of back-to-back credit and the bonded warehouse system that has also led to a high reliance on imported inputs. Thus, the underlying weak links with the rest of the economy also translate to weak employment links. While there are a lot of direct jobs in RMG, the indirect job creation resulting from concentration in RMG exports is low.
The policy of trade liberalization is not a sufficient condition to guarantee the production and export success of other sectors. Apart from RMG, export responses of all other major commodities, such as raw jute, jute goods, tea, leather and leather products, and frozen food and shrimps, have been very weak. Better performance of these sectors could have accompanied the creation of more good jobs in manufacturing. Therefore, even though there are other more dominant reasons than liberalization for Bangladesh’s export success in RMG, performance of other exports, despite considerable policy reforms, has been disappointing. It is in this context that mere liberalization of the trade regime does not necessarily guarantee export success and the corresponding creation of new jobs.
3.4.2. Industrial policy
The Industrial Policy since 1991, revised in 1992, reemphasized the leading role of the private sector in the development of industries, and clearly stated that the objective was to shift the role of the government from a “regulatory” authority to a “promotional” entity. The revised Industrial Policy in 1986 aimed to promote private sector development and accelerate privatization of public enterprises. These were accomplished through the provision of substantial incentives and opportunities for private investment. In addition, restrictions on foreign investments were further relaxed, and in some cases removed. Several incentives were also provided for foreign investment (Rahman 1994). Apart from some reserved sectors, most sectors were opened to private investment. The industrial policy also allowed 100% foreign direct investment (FDI) and joint ventures, both with local
private partners and with the public sector. The Industrial Policy 2005 included a number of revenue and fiscal incentives, including export processing zones, special incentives for nonresident Bangladeshis; and special revenue facilities for thrust sectors, small and medium-sized enterprises, and cottage industries.
More recently, the 5-year plans continue to stress the target shares of GDP and employment for the manufacturing sector, although these tend to be very ambitious and are mostly linear growth targets desired rather than the results of committed investments. The Industrial Policy 2010 envisaged an increase in the industry sector’s share in GDP to 40% by 2021, with the proportion of the workforce employed in the sector concurrently rising to 25% of the country’s total labor force. While many of the provisions of the proposed policy were common to previous policies as well, it brought some improvements over the immediate past (2005) industrial policy, in particular about the classification of industry and redefinition of industry size in both fixed capital and the employment of labor (Bhuyan 2010). The draft Industrial Policy 2015 also included similar targets and identified six sectors as high priorities, including the agro-based and agro-processing industry, RMGs, computer software and information and communication technology, pharmaceuticals, leather and leather products, and jute and jute goods.
Close scrutiny of the industrial policies reveals that the course of action is not well defined. Other government policies are not commensurate with industrial policy targets. And the industrial policy lacks coordination with other agencies of government. As a result, the policy largely fails in implementation. To shape a realistic and acceptable policy, it needs to combine the interests of diverse stakeholder groups including banks, insurance companies, infrastructure agency, the Board of Investment, and ministries of planning and commerce, in addition to representatives from different industries.
The building of capacity for research and development is crucial to determine different aspects of industrialization growth prospects, analysis of trends, and other inputs in policy formulation. However, emphasis on research and innovation investment

37
Economic Diversification, Structural Change, and Employment in Bangladesh
for implementing the development agenda for the sector. Related policy documents include the New Agricultural Extension Policy 1996, National Food Policy 2006, National Fisheries Policy 1996, National Livestock Policy 2007, National Forestry Policy 1994, National Poultry Development Policy 2008, and the overarching National Sustainable Development Strategy 2013.
The prime objective of NAP 2013 was to ensure food and nutrition security for all and to improve the quality of life of rural people through greater productivity and agricultural diversification. For promoting agricultural research, NAP 2013 emphasized the urgency of ensuring sufficient budgetary provisions and coordination among different public–private research entities. NAP 2013 also emphasized developing the agricultural marketing system through improving infrastructure and establishing an uninterrupted value chain between producers and consumers. Although the initiatives are fairly new, more and more discussion is of strengthening agricultural value chains so farmers can get better information and bring produce to market, and to set the stage for cold chains and food regulations that could be the basis for agricultural exports.
In sum, the policies on exports, industries, FDI, and agricultural production in Bangladesh have very much encouraged the setup of businesses and greater production. While the reasons for the slow take-off of many sectors is beyond the scope of this paper, we look at some of the specific challenges that key sectors in Bangladesh have faced. If these challenges can be overcome, and the ensuing diversification takes off, this should encourage the creation of jobs in the future.
3.5. Potential Sectors for Diversification In the following subsections, we discuss the diversification potential and challenges of five key sectors. The draft Industrial Policy of 2015 mentions all of these as high-priority and priority sectors, with significant growth, export, and employment potential. These are agricultural products, leather and leather
needs significant improvement. Industrial policies need clearer direction to concretely address supply-side constraints.
Without a more effective industrial policy and/or the creation of new enterprises, the prospects for creating new types of jobs in manufacturing, particularly in higher value-added sectors, are slim. The possibility of moving up the value chain toward more high-end garments, for example, has not happened fast enough in part because the main external customers still look to Bangladesh for basic garments, where its real comparative advantage lies (see Chapter 5 of ADB 2016).
3.4.3. Foreign direct investment policy
Bangladesh has been pursuing a highly liberalized FDI policy since the early 1990s. The Industrial Policy of 1999 and the Industrial Policy of 2005 aimed to encourage domestic and foreign investments and promote export-oriented industries. The stated policy of the Bangladesh government was to pursue foreign investment actively and it made no major discrimination between foreign and domestic private investors in investment incentives or export and import policies. The industrial firms are registered with the Board of Investment or with the Bangladesh Export Processing Zones Authority or with the Bangladesh Small and Cottage Industries Corporation (small-scale industries) each of which provides services essential for the registering industries. The surge in FDI over the 10 years to 2015 is mainly driven by the increased flow of foreign capital in only a few sectors, like telecommunication and oil and gas. With the possible exception of finance and banking, as well as RMG, these sectors also tend to be capital intensive.
3.4.4. Policies for agricultural promotion and diversification
Several related national policies generally govern the development of the agriculture sector, which, like FDI policies, seem to support the creation of production and employment. The National Agriculture Policy (NAP) 2013 is obviously the key guiding document

38
Bangladesh: Looking beyond Garments
education and training or tertiary education, and levels of poverty and vulnerability are high. Rural poverty was high at 35% in 2010. Remoteness due to lack of transport and electricity also impact on economic activity. Continued structural transformation will thus depend significantly on the provision of better education and infrastructure services to rural areas to boost productivity from very low levels.
For agricultural diversification, Miah and Haque (2013) suggested reorganizing the Department of Agricultural Extension; facilitating agricultural credit to farmers; investing in transportation networks; training for farmers; ensuring irrigation infrastructure for non-cereal producing farmers; promoting better access to market; developing risk reduction strategy; institutional reforms; developing new technologies; and encouraging farm mechanization.
____________________35 Box 5.2 of ADB (2016) discusses why the fast fashion industry value chain is “segmented”, in other words, the consumer-driven nature of fashion globally requires
a close relationship between the final purchaser at the retail level and the research into new styles. Bangladesh is at the manufacturing stage, far away from factors that ultimately drive demand.
Figure 3.5: Average Monthly Income from Employment (Wage/Salary), 2013 (Tk)
IT = information technology. Source: ADB based on Bangladesh Bureau of Statistics. 2015. Labour Force Survey 2013. Dhaka.
0
5,000
10,000
15,000
20,000
25,000
30,000
35,000
40,000
45,000
50,000
Male Female
All i
ndus
tries
Agr
icul
ture
Leat
her
Phar
mac
y
Elec
troni
cs
Tour
ism(h
otel
s,re
stau
rant
)IT
goods, pharmaceuticals, electronics, jute and jute diversified products, information technology (IT), and tourism. The sectors are expected to develop in the medium term, assuming global economic trends stay mostly on course. The premise is that Bangladesh has a better chance of creating value added by diversifying, that is, moving to sectors outside garments rather than moving “within” the garment sector into higher value-added areas of the fashion industry.35
3.5.1. Diversification of agriculture
Miah and Haque (2013) argued that agricultural diversification toward products with higher value added contributes to more rapid income growth and employment in agriculture. Diversification of agriculture in Bangladesh is a manifestation of a shift of resources from rice to other cereal crops, from cereals to non-cereal crops, and from crops to non-crop agriculture. Miah and Haque (2013) showed that the average value of the Agricultural Diversification Index and its growth rate were 0.56% and 0.77% during 1993–2010, respectively. Agricultural diversification increased sharply in 2007, due to the combined effect of a sharp increase in the production of groundnut, garlic, turmeric, potato, mango and jackfruit, and the favorable prices of lentils, mustard, chili, pointed gourd, potato, okra, pineapple, and fish.
Employment in the agriculture sector is composed of self-sufficient farms, with high levels of informality and workers comprising family and unpaid labor in smaller plots, and seasonal workers in larger plots. The division of land over time into smaller parcels, land grabbing, and other land-tenure issues have also hurt yields and thus farmers’ incomes. Monthly wage income in agriculture is the lowest of any sector, at about Tk8,946 per month on average (about $115, see Figure 3.5), and nonpaid family labor is very common. Many workers have little education: 34% in the agriculture sector have no education, 34% have primary education, 23% have secondary education, and 6.4% have higher secondary education. Only 1.5% finished technical and vocational

39
Economic Diversification, Structural Change, and Employment in Bangladesh
There is indeed potential for agricultural productivity to increase further. Bangladesh, just like many net food-importing developing countries, has conflicting interests on many issues of agricultural negotiations, particularly on food security and market access. The sector has advanced in self-sufficiency in food grains and Bangladesh is referred to as an agro-based country with its fertile land and favorable weather for agricultural production.
An additional possible step would be to expand agro-products toward the export market. The contribution of agro-products to total export earnings has been around 10% in recent years. A list of products to be considered for export diversification includes goat meat, processed fruits and vegetables, and frozen food industry including shrimp processing. This can begin with expansion at the domestic level. Identifying niche products and markets to sustain the present trend of agro-export and increase the same to tap more and more benefits for sector development is needed. Closer interaction between the Ministry of Commerce and Ministry of Agriculture in the development of this sector could also help. In terms of the products, taking the proper steps to cope with international quality assurance and traceability problems like gaining certificates of EurepGAP for the European Union and “hazard analysis and critical control points” for other countries are among the needed steps.
Prospects are good for creating jobs in agro-processing, if some existing problems and constraints
can be overcome. To expand the production of goat meat, efforts on all sides are needed to prevent infectious diseases and epidemics of cattle through ensuring proper and available vaccinations. To improve the quality of fruits and vegetables, the supply of improved seeds need to be ensured. Additionally, initiating adequate training and skill development, and improvement in access to marketing, irrigation water, and storage facilities (to reduce postharvest loss) could all help rural employment thrive.
3.5.2. Prospects for leather and leather goods
The leather sector is one of the few sectors that can play an important role in the export diversification initiative in Bangladesh. The leather industry occupies a place of prominence in the Bangladesh economy in view of its large potential for employment and growth and exports. In fiscal year 2015, about $1.12 billion worth of leather and leather products were marketed abroad, as crushed leather, finished leather, leather garments, and footwear. However, the leather sector’s contribution to national GDP and employment has declined: the share of leather and leather goods in GDP was 0.4% in 1999–2000 and 0.34% in 2015.
The share of employment fell even faster, from 0.49% to 0.16% of total employment during the same period. In 2013, 32.4% of workers were under age 25 and 15% over age 65 (Figure 3.6). Data on workers from labor
Figure 3.6: Distribution of Employment in Key Sectors by Age Group, 2013
Source: Bangladesh Bureau of Statistics. 2015. Labour Force Survey 2013. Dhaka.
All industries Agriculture Pharmacy Leather Electronics InformationTechnology
Tourism(hotels andrestaurants)
0
90
70
30
50
10
80
60
20
40
100
Age 15–24 Age 25–44 Age 45–64 65 and above

40
Bangladesh: Looking beyond Garments
____________________36 Eid al-Adha is an Islamic festival to commemorate the willingness of prophet Ibrahim (also known as Abraham) to follow Allah’s (God’s) command to sacrifice
his son Ishmael. He was then asked to sacrifice an animal instead of his son. Muslims around the world observe this event by offering prayers and sacrificing an animal.
force surveys indicate that, in absolute terms, the number of leather sector workers in 2013 was up 6.7% over 2010, although that is still less than the number of workers the sector employed in 2005. About three-quarters were male.
The shortage of skilled personnel and trained manpower has also become pervasive in the leather sector, with a majority small and family-based firms with skills learned from elders rather than obtained through formal education. Many small leather firms are owned or managed by entrepreneurs with limited know-how and exposure to modern butchery skills, environment-friendly curing and tanning technologies, and proper waste management. Over time, the share of skilled workers has dwindled to less than 1% in 2013 from 7.6% in 2005–2006. In 2006, there were 12 less-skilled leather sector workers for every skilled worker; by 2013, this ratio had leapt to 183 to 1. The share of leather workers who have attained at least secondary education dropped to 15% in 2013 from 20% in 2006. The proliferation of less-skilled workers, together with their low level of education, bears on the sector’s net value-added potential. Around 26% of leather firms surveyed in the 2013 World Bank Enterprise Survey find an inadequately trained workforce to be a major business constraint, a situation exacerbated by the fact that only 13% of leather firms offer training, the smallest proportion among all types of manufacturing firms.
Another big issue among leather sector workers is their state of health—they are faced with the twin problems of earning their keep by working in a hazardous environment and residing in areas polluted by the very firms in which they work. Inside the factories, workers are exposed to toxic wastes and carcinogenic chemicals such as arsenic, chromium sulfate, and hexavalent chromium. Outside the factories, workers are forced to survive in what many organizations refer to as “one of the most polluted places on earth for residents and workers.” The fact that many leather firms are micro and small in size necessarily suggests these firms
do not have extra financial resources to spend on production measures to help preserve workers’ health. Box 5.3 of the Bangladesh Country Diagnostic Study (ADB 2016) profiles the leather sector’s performance, potential, and export outlook.
A number of other problems undermine the leather sector. Raihan and Ahmed (2009) and SANEM (2014) highlight a few: (i) most of the entrepreneurs in the leather and leather goods sector industry are first-generation businessmen and many lack the required knowledge in the export business; (ii) the leather and leather goods industry suffers from an acute shortage of technical personnel and trained manpower; (iii) supply bottlenecks of raw hides and skins to tanners are common, with limited availability throughout the year, particularly in Eid-al-Adha36 time; (vi) and the sector has not yet reached its full potential, primarily due to operating constraints stemming from its production base in Hazaribagh in Dhaka, where minimal waste management systems and inadequate industrial layout planning exist. The Hazaribagh-centered tannery industry is now legally bound to relocate all factories to a new, environmentally compliant tannery estate (under construction) on the outskirts of Dhaka. But the relocation has been stuck for many years due to unresolved issues on the cost sharing of various components of the new industrial estate.
Better regulations for workers in the leather sector and vocational training could help to improve some of the production problems it has encountered. The sector would be a crucial one for policy makers on which to focus vocational training, in line with the country’s National Skills Development Policy. Regulatory bodies tasked with carrying out enforcement and industry compliance functions would benefit from enhanced comprehensive capacity-building programs to enable them to execute their roles effectively. This would also encourage leather entrepreneurs to design and operate factories in ways least hazardous to workers’ health.

41
Economic Diversification, Structural Change, and Employment in Bangladesh
3.5.3. Pharmaceuticals
Ahmed (2014) suggests that the pharmaceutical industry is one of the sectors with the most potential for industrial diversification, with highly competitive firms that enjoy comparative advantages in both the short and medium terms. Bangladesh has comparative advantage in the sector due to its cheap labor and raw materials, and a favorable World Trade Organization legal regime as well as adequate supply of skilled manpower. Medicine sales in Bangladesh, worth $0.60 billion in 2007, reached $1.60 billion in 2014. Growth in 2011 alone was 24% against global growth of 8%. Bangladesh is now almost self-sufficient in manufacturing pharmaceuticals. According to Ahmed (2014), 267 pharmaceutical companies currently operate in Bangladesh, with the top 10 holding 67.6% of market share.
Pharmaceuticals is a prime sector for developing high-skilled jobs and employs the highest number of skilled workers in the industry. In 2013, it employed 115,000, almost twice as many skilled workers as in electronics and information technology combined. Half of its total workers have finished tertiary education and the share of skilled employees improved dramatically to 78% in 2013 from just 13% in 2006. In general, most employees are male. However, between 2006 and 2013, the number of female employees increased threefold, making pharmaceuticals the sector with the highest growth of female employees between 2006 and 2013 . Wage differentials on the basis of gender are not wide: on average, a woman worker earns Tk97 for every Tk100 earned by male pharmaceutical workers.
Given the specialized nature of high-value added of jobs in the pharmaceutical industry, collaborating with business schools and universities could help bridge the skills supply gap and enable academic institutions, in particular, to supply them with doctorate-level graduates and bio-processing technicians, human capital skilled in bioscience courses needed to accelerate the biologics production capacity of pharmaceutical firms and strengthen their capabilities to participate more in the global pharma sphere.
Executive education for middle managers may be promoted to enlarge the supply of marketing managers and business development staff with language and “call center” skills to support the export dimension of pharmaceutical manufacturing.
Ahmed (2014) highlights a number of challenges for the expansion of the pharmaceutical industry in Bangladesh. A challenge facing the local industry is the absence of a facility for bio-equivalence studies. The establishment of a full-fledged bio-equivalence laboratory is, therefore, urgent to boost exports and improve the quality of products.
Additional investments need to be made for the export market to guarantee quality and provide certification. Once this is achieved, since the share of labor in total production cost is low, and this is even more so when the cost of active pharmaceutical ingredients is included, high-skilled jobs could be generated. But there are other problems. For example, the incentives created by tariff policies have led to the private sector focus on import substitution instead of enhancing “reverse engineering” capacity to take advantage of the World Trade Organization Trade-Related Aspects of Intellectual Property Rights waiver (World Bank 2012a).
The Directorate General of Drug Administration under the Ministry of Health and Family Welfare is the drug regulatory authority in the country. But despite extensive rules, the pharmaceutical market remains under-regulated due to lack of capacity in administration. It is severely understaffed—against the backdrop of a rapidly growing pharmaceutical market, and it has large numbers of registered products and a huge population size. Enforcement measures suffer as a result. The drug-testing laboratories, including the two under the administration, also have insufficient capacity. On the positive side, this also suggests a sector ripe for the absorption of high-skilled workers, including the possibility of establishing foreign subsidiaries of other Asian developing countries with slightly more developed pharmaceutical industries.

42
Bangladesh: Looking beyond Garments
3.5.4. Electronics
The electronics industry in Bangladesh is one of the fastest-growing industries in the country, with great potential. At present, a handful of local and foreign trading or marketing companies are importing spare parts and assembling electronic goods to meet demand (such as LG Electronics, Singer, Walton, and so on). Walton is the largest local brand exporting electronic products to the world market; it has also established an automobile industry to produce motor bikes and other vehicles. Products with large demand in the domestic market include TVs, refrigerators, LED and fluorescent lightbulbs, cell phones, air conditioners, and others. Other popular Bangladeshi electronics brands include Marcel, Vicon, My One, LK, and Swan. The export of electronics in 2010-2011 almost tripled to $173.1 million by 2014-2015.
The learning-by-doing of small shops that repair machinery and transport equipment, including motors and bicycles, has been a key process in the structural transformation of the manufacturing sectors of other Asian countries. It has the highest multiplier of any sector in 2011, according to the input-output tables in ADB (2016). The products are generally repaired or reverse engineered for the local market, many times starting with imported spare parts. While limited hard evidence exists, Bangladesh has shown considerable growth in these types of activities, many occurring informally. These types of skills, if well mobilized, could be essential for creating more value added in machinery and electronics.
Semiconductor-manufacturing industries can be easily established in Bangladesh, and with high local and worldwide demand, can be turned into a high profit-generating industry. Amid rapid growth, Bangladesh will soon also become one of the largest cellular-phone-using countries in South Asia, thereby creating a huge market for cellular technology. And with a growing population, demand for electrical home appliances is rising as well. The country therefore has potential for investing in electronics firms to cater to the domestic market, with due growth in the export market. According to the Survey of Manufacturing Industries 2012, out of 34 sectors both “electrical
machinery” and “transport equipment” have the highest value added per employee relative to other manufacturing sectors.
Employment in the electronics sector is still very small, only 13,854 people in 2013, or 0.02% of total employment. Like the information technology (IT) sector, the electronics workforce is male dominated, with eight male employees for every female. This is already a great improvement though, as 2006 Labour Force Survey data indicated less than 5,000 workers and zero female employees. In addition, around 85% of electronics workers are in the informal sector.
The thrust of the National Skills Development Policy might need to be revisited for specific targets for the electronics sector given some negative trends. Between 2006 and 2013, the share of skilled workers in this sector dropped significantly to 38% in 2013 from 71% in 2006. The share of electronics workers who finished tertiary education had also dropped by more than half, from 57% in 2006 to 23% in 2013. Even the share of employees whose highest attainment is higher secondary education has dropped to 15% from 25% in 2006.
This unfortunate change in the skills and education profile is linked to the most significant weakness challenging this sector—the lack of modern technological adaptation along with a lack of adequate training and skills development. Other factors include lack of infrastructural facilities (especially inadequate supply of electricity), high transportation costs, lack of quality control facilities, high lead time for imports, high import duties for input machineries, lack of research and development facilities, and market access problems in a number of developed and developing countries.
3.5.5. Information technology37
In recent years, Bangladesh has made strides in laying the groundwork for a diverse and successful outsourcing market. In particular, its IT services industry has been growing, serving international clients and domestic clients in the banking and telecom sectors. Emerging IT outsourcing players
____________________37 This section draws largely from Chanda and Raihan (2016).

43
Economic Diversification, Structural Change, and Employment in Bangladesh
already have strong credentials, and the Bangladeshi freelancer community has supplemented IT exports; Bangladesh is consistently ranked among the top freelance work locations on employment websites such as oDesk, eLance, and the like (ITC and KPMG 2012).
The country offers a vast pool of young, trained, and English-speaking labor, which is available at costs almost 40% lower than in established destinations like India and the Philippines. Government has demonstrated a determination to promote the IT services industry, including by providing cheaper bandwidth and alternate international cables, setting up technology parks, and providing tax holidays for export-oriented industries. The government’s Digital Bangladesh initiative is helping set up information and communication technology (ICT) infrastructure for enhanced connectivity, ICT-based delivery of services to citizens, and an ICT-based education system. The country has positioned itself as a key destination for locating business process outsourcing (BPO) services by enhancing capabilities in delivering those services and the availability of skills, lowering the cost of operations, making focused investments in telecommunications and IT infrastructure, and highlighting success stories.
Simulation exercises using a CGE model by Raihan and Cheong (2013) suggest that under different scenarios relating to IT-export growth, the secondary effects would create positive macro, sectoral, and household impact. Higher exports in the IT sector would increase employment in all other sectors as well, while indirect employment generated will be much higher than direct employment.
Bangladesh’s IT-BPO subsector has grown from a negligible size to an industry worth $350 million in annual revenues in 2009. Related software exports nearly tripled from a little less than $13 million in 2005 to $35 million in 2009 and $47.3 million in 2011.38 IT and nonvoice IT-enabled services (ITeS) constitute the bulk of these exports. To be sure, IT-BPO constitutes a very small part of overall GDP and
exports. But such growth is significant at an average annual rate of 40% over 2004–09, driven by export trends as well as growing IT demand in the domestic market. According to ITC and KPMG (2012), over 800 IT and nonvoice ITeS companies operated in Bangladesh in 2012, of which around 200 worked globally for outsourcing and project-based delivery models.39 In 2012, Bangladesh had more than 60 call centers. According to the Bangladesh Association of Call Center & Outsourcing, over 15,000 agents were working in this segment in 2012. BPO service revenues were $2 million in 2010.
Considerable employment growth in this industry has accompanied the growth in IT-BPO exports. An estimated 20,000 or more skilled and semiskilled professionals are employed in the IT-ITeS sector. Another 35,000 IT-BPO professionals are employed in business enterprises, the government sector, and nongovernment organizations. Over 10,000 individuals are estimated to be engaged in freelance outsourcing jobs such as editing, proofreading, data entry, and web research. Freelance billings were worth over $7 million in 2010, placing Bangladesh seventh in freelance outsourcing earnings and Dhaka among the top-five cities for such work (ITC and KPMG 2012).
Yet, challenges remain to realizing the country’s export potential in IT-ITeS. Success will be measured in the ability to increase exports. This is reflected in earlier evidence on the low value and share of computer and information services exports in Bangladesh. Other developing countries do better by comparison, including the Philippines, where IT services exports have grown rapidly in the 10 years through 2015. In contrast, the share of software services exports in Bangladesh is less than 1% of total export earnings.
Although the government has taken steps to address information security, the country still suffers from a negative image on intellectual property rights protection. In addition, fragmentation in the sector and lack of scale economies makes it difficult for Bangladeshi companies to take up large contracts. According to Shinkai and Hossain (2010), there are also
____________________38 Bangladesh Association of Software & Information Services. http://www.basis.org.bd/index.php/resource39 According to the Bangladesh Association of Software & Information Services, more than 500 IT and ITeS companies are registered in Bangladesh, employing over
12,000 IT professionals. Of these, over 20% export their products and services to over 30 countries and around 6% have been set up with foreign capital. Numbers from other sources vary to some extent, but are broadly in this range.

44
Bangladesh: Looking beyond Garments
The industry has grown haphazardly in the last decade or so, but employment in the broader “hotels and restaurants” sector has not grown: the share of employment in this sector stands at 1.5% since 2006 up to 2013 (about 871,000 workers, see Table 3.4). In contrast to the agriculture sector, where 54% of working women are employed, tourism accounts for less than 1% of total female employment. The sector more broadly (directly and indirectly) employed 1.14 million workers in 2015 (about 4% of the labor force). Although annual employment growth from 2016 to 2026 is estimated to be only 0.9%, the sector is projected to generate up to 1.26 million jobs by 2026 (Figure 3.7).
Much more concerted and strategic intervention is required for the country to enter the global competitive arena. Tourism was not considered an industry in the first 28 years of the country’s existence and was recognized as such only in 1999. For now, the focus will be on promoting domestic tourism given the growing middle class. The tourism sector has experienced growth in recent years, particularly in the last decade. However, the growth pattern has been erratic, implying unstructured development and perhaps also the lack of proper planning from the government. Although Bangladesh has started making progress, the total contribution to GDP has declined: in 2000–2010, tourism contributed about 5.2%, to about 4.8% in 2011–2014 (Figure 3.7).
____________________40 This section benefited from Khondker and Ahsan (2015).
Industry/Sector
Number of Employed,
2013
Share of Male
Workers
Share of Unskilled Workers
Share of Informal Workers
Economy (all industries)
58,072,936 71% 92% 87%
Agriculture 26,189,986 66% 100% 98%Pharmaceuticals 79,042 87% 22% 85%Leather 90,696 76% 99% 89%Electronics 13,854 89% 62% 85%Information
technlogy 79,723 88% 63% 70%
Tourism (hotels and restaurants)
871,081 86% 95% 91%
Table 3.4: Profile of Bangladesh Employed Persons in Selected Sectors
Source: Calculations using data from Bangladesh Bureau of Statistics. 2015. Labour Force Survey 2013. Dhaka.
problems of infrastructure, especially in power and bandwidth reliability and backup costs, and problems with access to finance and venture capital funds. High telecommunication costs are a major limitation. Lack of marketing skills and middle management knowledge are additional domestic constraints. Firms face problems of employee turnover, absenteeism, and lack of the required skill sets. Low wages and intense competition are the main reasons for high mobility within the sector. Local workers also lack expertise in higher value-added IT-enabled services, owing to the small domestic market. Reports point to the need for more IT clusters and parks, more investment in skill building and infrastructure, and increased foreign direct investment (FDI) to facilitate growth. Finally, overseas awareness about Bangladesh as a potential software services provider is lacking.
Overall, as noted in a report on a Bangladesh IT-enabled services project, Bangladesh meets only the minimal requirements for software services exports, such as the availability of good telecommunication infrastructure, competitive labor costs, and good government policies (Carana Corporation 2011). The country’s only clear market advantage at present is low-cost labor. But this is offset by high communication costs and is not sufficient for Bangladesh to enter new markets, especially given the country’s lack of reputation as a quality provider and strong competition from other countries. To be more competitive internationally, a long-term growth strategy is required for building capacity, identifying target segments within the sector, and marketing—all of which will require considerable support from the government and development agencies.
3.5.6. Tourism40
Bangladesh is blessed with natural beauty, ranging from mountains to rivers to beaches to biodiversity. It boasts the longest natural beach in the world in Cox’s Bazaar as well as the largest mangrove forest in the world at the Sundarbans. Nevertheless, tourism is far from thriving and only in recent years has the potential been identified.
45
Economic Diversification, Structural Change, and Employment in Bangladesh
Active policies and legislation for the tourism sector include the Bangladesh Tourism Board Act, the Tourism Policy 2010, the Medium Term Budget Framework, and the Perspective Plan 2021. Khondker and Ahsan (2015) suggested to increase and focus on marketing, ensure an adequate supply of qualified human capital, improve the tourism environment, and roll out visa facilitation services.
Tourism could be a key service sector, as it can generate (low-skilled) jobs that could directly impact the poor. In 2013, for example, employment in tourism was at least three times the combined level of employment in other nonagriculture thrust sectors (pharmaceutical, IT, leather, and electronics). It is also one of few sectors where average monthly wage incomes for both male and female workers showed no gender disparity in 2013. Despite the benefits tourism can bring to income and employment, no clear strategy exists linking institutions of learning and training to tourism enterprises, leaving a wide education and skills gap and lack of qualified human capital that could persist or worsen.
3.6. Employment Multipliers
The direction of economic diversification and its impact on employment generation will depend on many factors: in addition to the policies mentioned earlier, the growth of domestic consumption and the opportunities afforded by the external markets
will determine which subsectors ultimately end up growing. Yet both the previous sections and the analysis in ADB (2016) provide evidence of the dire need for diversification in Bangladesh, specifically, by moving to higher value-addition sectors within manufacturing and providing supporting services. The question is which sectors have the capacity to generate employment in other sectors through supply and intermediate demand links?
To answer this question, we perform a simple simulation to see the direct and indirect effects of a $1 million increase in the demand for Bangladeshi products (either domestic or export demand) on employment by sector. Another way to formulate this question is to ask: given the current production technology of the economy and employment and skills profiles, if one were to hypothetically reallocate labor across sectors to maximize employment, what sectors would one choose? The thrust of the analysis is to use the input-output tables and employment data by sector, estimated to 2015, to define the production structure and its links, and infer the structural transformation in employment. Appendix 5 describes the methodology and derivation in more detail.
The results show that some manufacturing and service sectors have great potential to create jobs. Table 3.5 shows the main results by subsector, with employment by subsector in 2000 (column 1), estimates for 2015 (column 2), and total share (column 3). Five sectors (agriculture, retail trade, textiles and RMG, inland
Figure 3.7: Tourism’s Direct and Total Contribution to Employment and GDP, 2000–2026
GDP = gross domestic product, LHS = left-hand side, RHS = right-hand side.Note: Values after 2014 are estimates.Source: World Travel and Tourism Council. n. d. Travel and Tourism Economic Impact (2015).
2000
2001
2002
2003
2004
2005
2006
2007
2008
2009
2010
2011
2012
2013
2014
2015
2016
2017
2018
2019
2020
2021
2022
2023
2024
2025
2026
0
1,200
800
400
1,000
600
200
1,400 6
5
4
3
2
1
0
Direct employment (’000) Share of total employment (%, RHS) Direct GDP contribution (%, RHS) Total GDP contribution (%, RHS)

46
Bangladesh: Looking beyond Garments
Tabl
e 3.
5: D
irect
and
Indi
rect
Em
ploy
men
t Mul
tiplie
rs fr
om In
put-
Out
put A
naly
sis,
200
0 an
d 20
15
APO
= A
sian
Prod
uctiv
ity O
rgan
izatio
n, IC
T =
info
rmat
ion
and
com
mun
icat
ion
tech
nolo
gy, L
FS =
labo
r for
ce su
rvey
, RM
G =
read
y-m
ade
garm
ent,
UN
DES
A =
Uni
ted
Nat
ions
Dep
artm
ent o
f Eco
nom
ic a
nd S
ocia
l Affa
irs.
Not
e: S
ecto
r des
crip
tion
shad
es re
fer t
o di
visio
n in
to p
rimar
y act
iviti
es, in
dust
ry, s
ervi
ces a
nd go
vern
men
t.So
urce
s: W
orld
Inpu
t-O
utpu
t tab
les;
Bang
lade
sh B
urea
u of
Sta
tistic
s. Va
rious
year
s. La
bour
For
ce S
urve
ys. D
haka
; and
AD
B ca
lcul
atio
ns (s
ee A
ppen
dix 5
).
ioc1
Sect
or D
escr
iptio
n
Tota
l Eem
ploy
men
t (e
stim
ates
bas
ed o
n LF
S, A
PO d
atab
ase,
and
U
ND
ESA
pro
ject
ions
)
Shar
e in
Tot
al
Empl
oym
ent
(%)
EMPL
OYM
ENT
MU
LTIP
LIER
S
(num
ber o
f job
s cre
ated
for i
nitia
l dem
and
of $
1 milli
on c
urre
nt d
olla
rs)
Perc
ent o
f In
term
edia
te
Inpu
t of
Mac
hine
ry
and
Tran
spor
t20
15
Shar
e of
Sk
illed
W
orke
rs
to T
otal
(%
)20
15
Initi
al E
mpl
oym
ent
Coeffi
cien
ts
(num
ber o
f wor
ker/s
ne
eded
to p
rodu
ce $
1 m
illion
of o
utpu
t)Fi
rst R
ound
Eff
ects
Indu
stria
l Sup
port
Eff
ects
Tota
l Mul
tiplie
r20
0020
1520
1520
0020
1520
0020
1520
0020
1520
0020
151
Agr
icul
ture
19,0
58,0
5626
,822
,317
45.1
1,36
434
116
313
960
110
1,58
759
13.
70.
042
Min
ing a
nd q
uarry
ing
71,6
6723
6,63
70.
413
739
4726
2957
213
121
4.1
5.7
3Fo
od, b
ever
ages
, and
toba
cco
(incl
udes
food
pro
cess
ing)
563,
239
1,49
4,95
62.
598
4960
822
322
618
493
145
61.
233
.3
4Te
xtile
s and
RM
G1,
580,
002
4,96
4,22
78.
315
285
242
7829
410
268
826
41.
13.
25
Leat
her p
rodu
cts a
nd fo
otw
ear
67,1
5892
,886
0.2
110
2389
169
177
120
1,17
921
23.
20.
56
Woo
d pr
oduc
ts a
nd c
ork (
incl
udin
g ju
te)
803,
664
625,
900
1.1
989
280
409
180
252
146
1,65
060
61.
13.
8
7Pu
lp, p
aper
, and
serv
ices
104,
638
125,
378
0.2
191
3816
482
171
122
525
242
8.8
0.3
8Fu
el p
rodu
cts
1,51
35,
736
0.0
221
243
2911
213
835
718
828
.81.
29
Chem
ical
pro
duct
s (in
clud
es
phar
mac
eutic
als)
129,
292
163,
374
0.3
106
1940
493
157
194
667
306
5.8
2.6
10Ru
bber
and
pla
stic
s91
,313
68,7
310.
141
144
189
113
165
108
765
265
3.6
15.3
11O
ther
non
-met
allic
min
eral
252,
269
467,
589
0.8
512
6710
365
6294
677
226
5.8
3.6
12M
etal
pro
duct
s12
4,31
724
8,97
30.
478
1417
769
122
109
377
192
5.5
48.5
13N
on-e
lect
rical
mac
hine
ry16
6,75
253
,272
0.1
624
2811
754
167
172
908
254
10.2
13.3
14El
ectri
cal,
spec
ializ
ed e
quip
men
t57
,429
46,1
250.
121
98
190
115
283
110
692
233
2.7
10.5
15Tr
ansp
ort e
quip
men
t81
,839
73,9
040.
11,
550
3710
493
9011
91,
743
250
17.3
34.6
16O
ther
man
ufac
turin
g45
4,24
41,
298,
735
2.2
10,7
7965
518
713
713
114
211
,097
933
5.2
15.3
17El
ectri
city
, gas
, and
wat
er97
,879
171,
242
0.3
122
3762
2137
4522
110
30.
926
.218
Cons
truct
ion
1,17
7,34
52,
195,
276
3.7
145
5923
363
140
9351
821
60.
90.
519
Mot
or ve
hicl
es, t
rade
, ser
vice
s26
9,09
421
0,37
20.
42,
273
410
2890
1567
2,31
656
716
.25.
520
Who
lesa
le tr
ade
709,
222
1,98
2,09
73.
326
114
920
1914
2129
518
90.
541
.921
Reta
il tra
de4,
654,
428
5,51
0,92
79.
31,
415
253
3014
1832
1,46
329
912
.818
.122
Hot
els a
nd re
stau
rant
s (in
clud
ing
tour
ism)
564,
401
892,
112
1.5
461
122
462
177
347
188
1,26
948
7–
7.2
23In
land
tran
spor
t2,
408,
990
3,40
7,22
45.
754
914
681
4569
4369
923
47.
23.
324
Wat
er tr
ansp
ort
170,
187
86,4
930.
132
226
127
4410
611
855
518
917
.46.
225
Air
trans
port
76,9
9117
,601
0.0
305
1524
156
184
164
730
235
33.4
1.9
26A
uxilia
ry tr
ansp
ort a
ctiv
ities
51,1
2629
0,26
20.
530
917
093
3772
5247
425
93.
75.
027
ICT
and
tele
com
mun
icat
ions
97,5
0774
,256
0.1
162
1718
523
107
3845
578
6.5
7.5
28Fi
nanc
ial in
term
edia
tion
326,
225
458,
814
0.8
306
3512
143
7552
502
130
9.1
58.9
29Re
al e
stat
e ac
tiviti
es17
,122
75,4
980.
14
418
2013
2536
491.
165
.130
Busin
ess-
rela
ted
serv
ices
and
ac
tiviti
es13
6,39
586
7,53
81.
534
637
674
4454
5547
547
41.
135
.3
31Pu
blic
adm
inist
ratio
n78
6,77
178
2,72
71.
338
956
166
4188
5864
315
55.
641
.632
Educ
atio
n1,
165,
537
1,92
1,00
53.
298
923
345
3423
391,
057
305
1.6
94.1
33H
ealth
and
soci
al w
ork
323,
110
769,
482
1.3
239
9873
2671
3938
316
34.
566
.734
Soci
al a
nd p
erso
nal s
ervi
ces
1,65
3,29
61,
784,
095
3.0
505
7077
2542
3262
412
72.
719
.635
Hou
seho
lds w
ith e
mpl
oyed
per
sons
685,
984
1,18
9,28
92.
047
514
985
045
060
514
9–
0.0
Tota
l38
,979
,000
59,4
75,0
50

47
Economic Diversification, Structural Change, and Employment in Bangladesh
transport, and construction) account for just over 75% of total employment. But the five combined have less than 1% of the skilled workforce in the economy (most skilled workers are in education, health, and some specialized manufacturing). The next eight columns show the increasingly cumulative levels of different effects that come together to measure the employment multiplier.41 There are four phenomena indicated for each sector:
i. Initial effects (4th and 5th column) correspond to the number of jobs in that particular sector required to produce a million dollars of output in year t. This is akin to a labor intensity measure. The sectors with the highest numbers in 2015 are other manufacturing, motor vehicles trade and services, business activities, and agriculture. Interestingly, the number of workers required to produce 1 million fell in practically all sectors between 2000 and 2015, reflecting the higher labor productivity of the economy. Note that all these sectors are still relatively informal.
ii. First round effects (6th and 7th column) correspond to the additional employment generated in the economy if demand for the sector’s output increases by $1 million over and above current production. The sectors with the highest estimated first-round effects in 2015 were food, beverages, and tobacco; hotels and restaurants; wood products (mostly jute); and agriculture. All of these sectors have potential as discussed earlier, while jute is one of the more successful exports. Leather and footwear used to be one of the highest in 2000, but then fell in relative terms, reflecting difficult issues in the industry.
iii. Industrial support effects (8th and 9th column) take into account not only the first-round effects of a $1-million-dollar demand increase, but also additional demand for labor produced as a result of other sectors increasing production to provide inputs to the sector in question. The effect was
largest in 2015 for chemicals; food, beverages, and tobacco; hotels and restaurants; wood products and cork; and electrical equipment. Textiles and RMG used to have important industrial support effects in 2000, but not nearly as much thereafter, consistent with the discussion above and the findings in ADB (2016) that the lack of diversification of the economy has come hand in hand with fewer links of the RMG sector with other sectors.
iv. Finally, we define a total employment multiplier as the combination of the industrial-support effects and the effect of increased household consumption resulting from the $1 million additional demand. In other words, from the additional employment created by the industrial support effects, wage and salary incomes increased, and this gave Bangladesh households more income to spend on additional goods. This also created extra employment, which would be captured by the total employment multiplier. The sectors that have the greatest capacity to create jobs are thus other manufactures, motor vehicles trade, services, wood products and cork, agriculture, hotels and restaurants, and business activities, which had the highest multipliers in that order. The latter two are large in terms of initial employment, but the first two are emerging services that are growing and will likely continue to be job creators under the current economic structure. It is noteworthy that leather products and footwear had a relatively high employment multiplier in 2000, but no longer by 2015.42
Naturally, the structure of production and inter-sectoral linkages of intermediate inputs are changing over a 15-year period, particularly in a fast-growing country like Bangladesh. Table 3.5 shows that while total employment has grown an estimated 52.6% in the 15 years studied, both the total employment multiplier and the industrial-support effects have declined in many sectors, particularly motor vehicles and trade services, and other manufacturing,
____________________41 The methodology uses World Input-Output Database input-output tables with updates to construct updates for Bangladesh in 2011. The production multipliers
have been derived from ADB (2015a) and ADB (2016).42 Note that for many sectors, the effects on employment are larger in 2000 than in 2015; this is quite plausible, and could occur because the sector has become
more capital intensive (so there has been a substitution to other factors of production due to automation). In any case, the effects should be compared within the same period.

48
Bangladesh: Looking beyond Garments
which the same data shows have become heavy users of machine and transport equipment inputs. This is a natural expectation of the structural transformation. In very simple and general terms, it reflects a combination of the following phenomena: (i) the increased productivity of a particular worker, as he or she becomes more skilled through learning on the job; (ii) the possible substitution of low-skilled workers for high-skilled workers; and (iii) the substitution of labor for machines (an increase in capital intensity).
All of these factors can contribute to raising average labor productivity in a given sector. The sectors textile and garments and leather and footwear, which by 2015 had relatively lower employment multipliers compared with other sectors, developed weak intermediate input links with other domestic sectors, which may have led to a larger fall in the employment multiplier effect. The sectors with stronger links are ultimately the ones that can act as catalyzers of economic diversification.43 Ultimately, sectors that can increase employment across all sectors and raise labor productivity—even if they are also using more machines—are the types of sectors that have the most potential and should be fostered by policy makers.44
The issue of the increase in capital intensity (or automation) in some manufacturing sectors is already somewhat evident in the data as just discussed, particularly for textiles and garments (ADB 2016). As wages of low-skilled labor increase, there is a tendency for managers to substitute low-skilled labor for machines. Thus, the lack of diversification in manufacturing puts Bangladesh in a vulnerable position if the main employer—RMG—cannot absorb the same number of workers every year going forward. It is impossible to predict how quickly automation may come into play, but it clearly points to the urgency of diversifying the low-skilled labor into the other potentially important sectors just discussed.
The results of this exercise are very consistent with the analysis of section 3.5 regarding the potential of certain sectors to generate good jobs. Agriculture and ____________________43 For the economy as a whole, employment diversification across sectors has been negligible in the 15 years through 2015, as measured by the Simpson-Gini index
(from 75.5% in 2000 to 74.3%).44 Since this analysis cannot go into further detail within a sector, some of the areas discussed, such as pharmaceuticals, IT, and electronics sectors cannot be
simulated in isolation here.
tourism are sectors that could absorb more (mostly low-skilled) jobs, while pharmaceuticals, software, and IT could create high-skilled jobs. Somewhere in the middle are services such as other manufactures and motor-vehicle trade and services, which really depend on primary manufacturing.
3.7. Supply-Side Constraints for Diversification Several supply-side factors may have contributed to constraining economic diversification. These factors are directly associated with the domestic production and investment environment and are discussed in detail in Chapter 2 of ADB (2016). Some of the factors related to employment will be discussed here, namely: (i) shortage of skilled workers, (ii) technological bottlenecks, and (iii) lack of entrepreneurship and management skills.
3.7.1. Shortage of skilled workers
Although Bangladesh is labor abundant, a shortage of skilled workforce is perceived to be a major constraint on manufacturing production. This problem is particularly acute for medium-scale, export-oriented enterprises. Manufacturing goods now overwhelmingly dominate Bangladesh’s export basket, but a significant proportion of it comprises a very low domestic value addition because of limited backward linkages. To increase backward integration and expand production in other sectors, skilled manpower needs to increase.Therefore, supply capacity is preconditioned by the availability of skilled workers.
A certain level of formal educational attainment and job-specific training and experience are essential components of skill formation. Therefore, both the quality of general education, and availability and suitability of vocational and technical education or on-the-job training are vital for skill development, as discussed in Chapter 4. Bangladesh has made good

49
Economic Diversification, Structural Change, and Employment in Bangladesh
3.7.3. Lack of entrepreneurship and management skills
Entrepreneurship lies at the heart of business activity worldwide. A good entrepreneur recognizes the need for training staff and acts accordingly. However, due to many different reasons, scope and opportunities for training of workers and managers, even in the large firms, are limited. In fact, apart from learning-by-doing, the practice of professional and formal training on a regular basis does not characterize the working environment in Bangladesh. The reasons behind this are described in detail in Chapter 5, but have to do with the lack of general education and appropriate training that would allow a high school graduate to acquire the requisite problem-solving skills over and above just the application of simple technologies. Financial constraints, along with the information gap, makes firms less aware of the benefits they would obtain from management training and few see training as a strategic tool. Besides, facilities for such training are also lacking.
3.8. Conclusion
While Bangladesh has successfully created and migrated jobs from agriculture to manufacturing, particularly to textiles and garments, it has been unable to create a large pool of jobs in the non-RMG manufacturing sectors. And jobs in the service sector are, for the most part, informal, (particularly in wholesale and retail trade). Nonetheless, the analysis shows that some areas of manufacturing as well as some promising service sectors—such as IT, software, machinery repair, and tourism—have potential to grow further if the right incentives are set. Jobs in agriculture for the most part continue to be informal and not very productive, yet Bangladesh has the opportunity of investing more in agricultural cold chains, which would help to bring farmers to market and raise their incomes.
Policy frameworks thus need effective institutions for successful implementation. Employment policies need to be tied to industrial and trade policies as well as social security. In other words, it is institutions through which
progress in enrollment in primary and secondary schools, but the progress is not matched by the education requirements. While the improvement in the standard of education may require long-term planning and investment, to address the immediate need of the export industry it is most essential to arrange various short- to medium-term vocational and technical training programs and courses.
3.7.2. Technological bottlenecks
Upgrading of technology, adoption of superior technology, and effective use are important for improved productivity as well as competitiveness. Introducing new products in the world market and making better quality products requires using modern and up-to-date technology. The manufacturing sector is critically dependent on imported technology, as the capacity to operate and maintain machinery often does not exist. Financial constraints do not allow most firms to modernize their technological capacity on a regular basis. There is a need for technology policy, which among others will consider the relative benefits of labor-intensive relative to capital-rich techniques of production, incentives for acquiring environmentally friendly technology, and access to information on technological advancement.
The area of improved training of workers to operate and maintain new machines could make a large difference for upgrading technology. Anecdotally, managers complain that importing sophisticated machinery is a problem as it also requires the hiring of skilled operators, which are scarce in Bangladesh. ADB (2016) identifies the repair of machinery and transport equipment as a sector where Bangladesh has great potential. Learning how machines work is one of the basic skills of reverse engineering that allowed other Asian countries, notably the People’s Republic of China, to move up the manufacturing value chain. Of course, some may require a basic knowledge of computing. Perhaps the government could therefore provide financing for machine operating trainees to take the requisite courses abroad when a firm obtains a license to import a specific piece of sophisticated machinery.

50
Bangladesh: Looking beyond Garments
strategies are ultimately implemented. Besides, export policy usually encompasses a number of institutions or departments, and coordination of their tasks has important implications for all eligible exporting firms’ benefiting from incentives. Lack of coordination and integration in the various elements of policies has always been a major problem in Bangladesh. Since strategies remain too broad, it is difficult to analyze whether they ultimately work. It also becomes difficult to identify the reasons for the poor implementation of the strategies, and thus lessons to be learned for similar future exercises.
Though the latest industrial policy identifies a number of high-priority and priority sectors for economic diversification, several policy-induced and supply-side constraints have hindered the development of these sectors. Some of these factors are sector specific, while others are more general, affecting the overall economy. Sector-specific problems can be identified from in-
depth sectoral studies, some of which have been identified in this paper. Further research is needed to deal with each of these sectors comprehensively. The general factors affecting economic diversification are lack of working capital, shortage of skilled workers, lack of entrepreneurial and managerial skills, and technology upgrading. More general problems affecting all sectors are poor physical infrastructure, weak institutions, and the invisible costs of doing business.
One pragmatic way of dealing with such constraints is to consider a well-devised integrated approach, with better general education and training at the heart of the strategy. Under this approach, actions required at different levels can be brought together to make intervention schemes or support systems comprehensive. Such intervention schemes should be sector specific as well as economy-wide to ensure effective diversification of employment and economic activity.

51
Overseas Employment of Bangladeshi Workers: Trends, Prospects, and Challenges
Chapter 4Overseas Employment of
Bangladeshi Workers: Trends, Prospects, and Challenges
to about 8% of gross domestic product (GDP),46 the second biggest source of foreign exchange earnings after ready-made garment exports. As such, remittances contributed about 61% of foreign reserves in 2014–2015, forming a major part of a recent build up of reserves.47 In addition, during 2012–2014, about half a million people found jobs abroad every year, over one-fifth of the annual addition to the total labor force and over half the additional jobs created by the manufacturing sector.48 Overseas employment is clearly important macroeconomically.
A number of questions have emerged in recent years despite the importance to the economy of overseas employment and workers’ remittances.
• The first relates to sustainability. Amid a decline in workers from Bangladesh finding jobs abroad in recent years, people question how long overseas employment can serve as a future source of jobs. It is also important to ask whether dependence on overseas employment is good strategy given its dependence on demands and considerations
4.1. Introduction
International migration for employment is one of the three major channels through which economic globalization works and is intensified alongside trade in goods and services and the flow of capital. Although relatively less active than the other two channels, migration is growing in importance, especially as population and labor force are growing in different parts of the world. Workers from countries like Bangladesh, where the labor force is growing faster than employment, can fill the labor force gap in countries where the opposite is true, allowing workers from the former to move to the latter. Bangladesh has been a labor-sending country for a long time, but the flow has become increasingly substantial especially since 2000, albeit fluctuating.
Several indicators can gauge the importance of overseas employment for the Bangladeshi economy. Remittances, for example, increased to over $15 billion in 2014–2015, from less than $2 billion in 2000.45 In 2014–2015, remittances received were equivalent ____________________45 Data from the websites of the Bangladesh Bank and the Ministry of Expatriates Welfare and Overseas Employment.46 This figure has been calculated from data on remittances (Tk118,982.32) and GDP (Tk15,135,997 million) for that year obtained from the websites of Bangladesh
Bank and Bangladesh Bureau of Statistics: https://www.bb.org.bd/econdata/wageremitance.php# and http://www.bbs.gov.bd/PageWebMenuContent.aspx?MenuKey=296. In 2013–2014, the figure was 11%, according to the Ministry of Expatriates Welfare and Overseas Employment (2015).
47 This figure is estimated from data from the Bangladesh Bank website. https://www.bb.org.bd/econdata/wageremitance.php#. In 2013, it was 77% of the reserve (according to World Bank 2015).
48 During 2010–2013, 4 million people entered the labor force and 2.8 million additional jobs were created by the manufacturing sector. If the longer-term average of jobs created by the manufacturing sector is used for comparison, the figure would be much higher, because the annual average additional jobs created by the sector during 2006–2013 was a little over 600,000.

52
Bangladesh: Looking beyond Garments
in destination countries beyond the influence of domestic policies.
• And to what extent can overseas employment provide jobs for female workers. Although migration of female workers has been low in the past, it has increased notably in recent years. While the recent trend does seem to indicate the possibility of migration acting as an important source of employment for women’s employment as well, it would be important to look at concerns and issues in this area, especially quality of employment (much of their employment are in the garment industry and in domestic service), and safety and protection in their places of work.
• The majority of migrant workers are unskilled,49
although in recent years, the proportion of semiskilled and skilled workers has increased.50 While migration of skilled workers can bring higher paid jobs and hence higher remittances per worker, negative implications exist, especially in costs of training and brain drain.
• An important issue is the skills demanded in major destination countries and the skills possessed by workers from Bangladesh. Improvement is needed to fully exploit the potential for overseas employment.
• Less frequently asked, however, is what creates the incentive to emigrate for work, especially among women, and what needs to be done to improve the incentive structure so that optimal use can be made of overseas employment opportunities.
• High costs incurred by prospective workers and the uncertain environment in which they pursue overseas employment has emerged as a major concern.
• The rights of workers and rights at work are important concerns for all and are areas of special concern for migrant workers given risks of violations and abuse in sending and receiving countries.
• The issue of rights is closely linked to governance of migration, which suffers from a number of problems. What kind of improvements are needed in the governance of migration and how such improvements can be brought about to ensure orderly and abuse-free migration is a major concern and, as such, the regulatory framework for overseas employment is important.
• This chapter provides an evidence-based analysis of these issues mentioned above to help formulate appropriate strategies and policies. After a brief review of the relevant literature in section 2, section 3 presents data and analysis of trends, determinants, and impact of overseas employment. Section 4 looks at prospects for overseas employment of workers from Bangladesh. It makes projections supplemented by qualitative analysis and information on potential demand for Bangladeshi workers in major destination countries. Section 5 looks at issues relating to the skill composition of migrant workers and possible matching of skills needed in destination countries with those of workers from Bangladesh. Issues relating to the rights and welfare of migrant workers are dealt with in section 6, followed by concluding observations and policy recommendations.
4.2. Review of Literature
A sizeable and growing body of literature exists on overseas employment of Bangladeshi workers. It covers issues ranging from trends in the flow of workers and its determinants, their gender, and skill composition, to the flow and use of remittances, and the impact, economic and social. It also looks at the prospects for overseas employment, costs, governance of migration, and so on.
The literature review below focuses on the determinants and impact of overseas employment, prospects, skill composition, and the possibility of augmenting such employment for skilled workers and migrant worker rights.
____________________49 Instead of the term “unskilled,” official documents relating to migrant workers use the term “less skilled.” The present study uses the two terms interchangeably. 50 It is possible that Bangladesh has comparative advantage in sending less skilled and semiskilled workers to countries where they are in demand. If so, and if the
country’s surplus labor is mostly in this category, it may make sense to allow the present pattern to continue.

53
Overseas Employment of Bangladeshi Workers: Trends, Prospects, and Challenges
4.2.1. Determinants of international migration for employment
Several strands run through the general literature on the determinants of international migration. One of these represents an application of the human capital model in which migration is seen as an investment in well-being. In an international context, an individual’s decision to augment well-being through migration is influenced by international differences in the returns to factor supply—controlling for migration costs, skill levels, income inequality between countries, and immigration policies pursued by the potential receiving countries. These factors result in spatial disequilibrium in the labor market that induces migration.
The so-called “gravity model” has been used in the literature to test the relevance of variables such as differences in per capita GDP and the pressure of population and labor force between countries, the cost of migration (usually proxied by distance between countries), and so on.51 A modern variant of this approach is provided by the model of rural–urban migration within countries developed by Harris and Todaro (1970), in which migration is induced by differences in per capita income and the probability of finding jobs. Of course, it may not be appropriate to draw a parallel between domestic rural–urban migration where migration takes place amid uncertainty about the availability of jobs in urban areas, whereas short-term, work-related international migration takes place only when the migrant has a guaranteed job overseas.52
An alternative analysis of the determinants of migration looks at it as a result of an evolution in the situation of prospective migrants and their environment. The factors relating to the situation and its evolution may be classified as those (i) predisposing, (ii) proximate, (iii) precipitating, and (iv) mediating (Van Hear 2012). Examples of predisposing factors include poverty, demographic pressure, and adverse environmental conditions (such as river erosion, desertification, and so on). Proximate factors include a desire to improve
living standards, accumulate wealth and savings, and attain upward mobility. Precipitating factors include economic hardships caused by shocks such as those caused by natural calamities, loss of breadwinners in the family, and the search for temporary escape from adverse family and social situations, such as those caused by a broken marriage. The mediating factors include services provided by government and private agencies, ability to mobilize necessary resources, and so on.
Modern models of migration (which are not necessarily limited to short-term migration with assured jobs) also consider the influence of kinship networks and the history of relatives and friends migrating, the probability of finding work and the expected level of income, and the relative deprivation suffered by prospective migrants. Some of these, especially kinship networks and a sense of relative deprivation may actually induce short-term migration for work.
In Bangladesh, both quantitative and qualitative analysis has been done of drivers of short-term migration for employment. Ullah (2012) and World Bank (2012a) do quantitative analysis, especially providing tests of the gravity model or Harris–Todaro type model. Ullah (2012) formally tests the gravity model and shows that economic (GDP per capita in the destination country relative to the sending country), demographic (relative population size), and cultural factors (common religion) have significant influence on migration.53 World Bank (2012a) finds that external demand conditions, network effects, and domestic liberalization explain both stock and flow of migration quite well. Econometric analysis of household-level data indicates the importance of demographic and economic factors. While the relationship between migration and age and education is nonlinear, the influence of preremittance income of migrant households is found to be negative.
Siddiqui (2003) also points out the important influence of macro and microlevel factors relating to economic and social realities on the flow of migration,
____________________51 Bodvarsson and Van den Berg (2013) provides a useful survey of this literature and relevant references. 52 It may be possible to think of a situation where a prospective migrant worker migrates with support from relatives and friends even without a guaranteed job. But
it is highly unlikely for one to get an entry visa without a guaranteed job.53 This study uses panel data of emigrants from Bangladesh to 23 countries during 1995–2009.

54
Bangladesh: Looking beyond Garments
although no empirical testing is done. The specific factors mentioned in the study include colonial ties, lack of employment opportunities at home, better employment prospects in destination countries, peoples’ desires to improve their economic situations, and information about job opportunities abroad. Factors specific to women mentioned in that study include seeking an escape route from unhappy social and family situations and desire for independence and realizing one’s self-worth.
4.2.2. Impact of overseas employment and remittances
The impact of overseas employment and remittances from workers abroad can be traced at both the macro and micro levels. The macrolevel effects include the following:
• a positive impact on the balance of payments of the remittance-receiving country;
• a positive impact on foreign exchange reserves and the ability to augment imports without creating pressure on exchange rates;
• a positive effect on economic growth of the country when the foreign exchange reserve is utilized for importing raw materials and capital goods;
• a reduction of pressure on the domestic labor market; and
• the diaspora network can contribute to the transfer of skills and knowledge.
The micro effects of overseas employment and remittances include the following:
• an increase in the disposable income of remittance-receiving households and the possibility of such households getting out of poverty and improving their living standards;
• remittance receiving in expenditure on education and health, raising the level of human capital;
• a rise in investment in micro and small economic activities;
• a rise in women’s participation in the labor force; and
• an increase in the age composition of the remaining members of the household (migrants are primarily young, leaving behind relatively older household members).
For Bangladesh, Ratha et al. (2015) focus more on the macro impact of migration and World Bank (2012a), Mamun and Nath (2010), and Ray, Sinha, and Chaudhury (2007) on both macro and micro effects. In-depth analysis of microlevel impact can be found in Islam, Parvin and Kalam (2013), Kumari and Shamim ( 2010), the International Labour Organization (ILO) (2014d, 2014e). Main points from these studies include the following:54
• Remittances help balance the external account and contribute substantially to the foreign exchange reserves of Bangladesh and are much more important than official foreign aid and foreign direct investment.
• Remittances have significant impact on the growth of per capita GDP.
• When direct and indirect effects are taken into account, the effect of remittances on growth of manufacturing and exports is positive.
• Remittances helped significantly to reduce poverty and improve nutrition among the poor.
• Households spend remittances, in order, on food and clothing, repayments of loans, purchases of land, construction and repair of homes, and education and health.
____________________54 In the list of “impacts,” the positives far exceed the possible negative effects. But given the uncertainty and the dangers of abuse and trafficking faced by
prospective migrants, there may be cases where individuals end up on the losing side.

55
Overseas Employment of Bangladeshi Workers: Trends, Prospects, and Challenges
• Members of the diaspora contribute to the development of information and communication technology in Bangladesh, and when they return, become entrepreneurs, health care professionals, and educators (turning brain drain into brain gain).
• Migrant households enjoy greater social status and participate more in the political life of their communities.
• Female household members left behind play a greater role running their households and in the education and health of children.55
• Negative consequences from separation of family members nonetheless do exist.
4.2.3. Prospects of overseas employment
Not many studies projected overseas employment of Bangladeshi workers. Maxwell Stamp (2010) makes projections and examines the prospects of migrant workers from Bangladesh. It analyzes job prospects in selected countries among the major destinations of Bangladeshi workers, that is, the Gulf Cooperation Council countries, as well as Malaysia and Singapore. It also constructs a country attractiveness index for job seekers and analyzes factors likely to influence export of manpower from Bangladesh, which include the state of the global economy, price of crude oil, the competitive edge and reputation of Bangladeshi workers, skill development facilities in the country, and immigration policies in destination countries. The projection of demand made in this study covered 2010–2014.
Like the abovementioned study, ILO (2014c) also analyzes demand for workers (by category of skills) in Bahrain, Jordan, Kuwait, Lebanon, Malaysia, Oman, Saudi Arabia, Singapore, and the United Arab Emirates (UAE).
Ray, Sinha, and Chaudhury (2007), analyzing the range of possible remunerations by category of jobs and country, point to considerable variation between
countries. Salaries range from $150 per month for unskilled workers to $1,000 for professionals and $1,380 for doctors. Some point out that per worker remittances vary inversely with the level of skill and salary earned, perhaps indicating that because skilled workers and professionals may already belong to higher-income categories they do not need to remit money to relations left behind.
4.2.4. Rights of migrant workers
While migrant workers’ rights have been examined in international organizations’ publications (especially the ILO and Human Rights Watch), the analysis for Bangladesh has focused more specifically on costs of migration, harassment, and unfair practices during recruitment and migration, and conditions faced in destination countries (such as irregular wage payment, payment of wages below the contracted rate, denial of weekly holidays, poor conditions at work and in place of residence, and so on. For example, Wickramasekara (2014) provides a detailed analysis of these aspects with reference to South Asian countries including Bangladesh. Siddiqui (2005) provides a good account of the sufferings of workers during migration as well as in destination countries. A number of ILO reports (such as ILO 2010, 2014a, 2004b) and the 2008 report of the Global Migration Group (consisting of United Nations and other international agencies) outline the legal framework and challenges in ensuring the rights of migrant workers, including women.
Common findings include the following:
• Workers face undue hardship and abuse in low wages (as said, often lower than contracted), poor working conditions, the virtual absence of social protection, denial of basic rights like freedom of association, as well as discrimination, xenophobia, and social exclusion.
• Low skills compound vulnerability: while educated and highly skilled workers are better positioned to protect their own rights, the uneducated and low skilled suffer most.
____________________55 Migration of a male worker may have both positive and negative impact on the spouse’s participation in the labor force. A rise in household income may lead to
the spouse’s withdrawal from work while, at a lower-income level, the spouse may enter the labor force.

56
Bangladesh: Looking beyond Garments
• Female workers are most vulnerable to abuse of human rights, especially domestic workers.
4.3. Overseas Employment: Trends, Determinants, and Impact4.3.1. Trends and patterns
While emigration of people from Bangladesh has a long history,56 short-term migration for employment started in the 1970s and gathered pace gradually. From just over 6,000 in 1976, people going abroad for jobs increased to around 100,000 by the end of the 1980s, and gaining momentum during the 2000s. After 2005, the flow increased sharply for a couple of years (Figure 4.1).57 The sharp rise was short-lived, however, and recent numbers have hovered between 400,000 and 500,000 annually.
Although workers from Bangladesh find employment in many countries, a few countries in the Middle East (such as Bahrain, Kuwait, Oman, Qatar, Saudi Arabia, and the UAE) and in Malaysia and Singapore account for most of the jobs. Nonetheless, the mix of major
destination countries changes (Figure 4.2). A few points are worth noting in that regard:
• In recent years, especially after 2007, the flow of workers to Kuwait, Malaysia, and Saudi Arabia declined sharply.58
• This decline has been offset to some extent by a rise in the flow to Lebanon, Oman, Qatar, and Singapore.
• On the whole, destination countries for overseas employment of workers from Bangladesh have diversified slightly. Up to 2005, the major eight countries—Bahrain, Kuwait, Oman, Qatar, Saudi Arabia, the UAE, Malaysia, and Singapore—accounted for over 95% of the flow, but declined gradually to about 74% in 2014.59
By gender, the trend of overseas employment indicates that women used to account for a negligible proportion of migrant workers from Bangladesh, but female workers going abroad has increased notably in recent years.
____________________56 The first wave of emigration of people from the area that now constitutes Bangladesh started in the 1960s when the United Kingdom opened its doors. 57 It is difficult to say what caused this sharp but short-lived increase in the number of migrant workers. During discussions with experts in this field, it was mentioned
that the political situation of the country during those years may have been responsible for a large number of people leaving the country for jobs abroad. 58 Kuwait and Saudi Arabia did not recruit any workers from Bangladesh during 2008–2014, while Malaysia also had such a restriction during 2009–2012.59 What happens to this trend once countries like Malaysia and Saudi Arabia resume recruitment from Bangladesh remains to be seen.
Figure 4.1: Total Workers Going Abroad, 1990–2014
Source: Constructed using data from the website of the Ministry of Expatriates’ Welfare and Overseas Employment.
1990 1992 1994 1996 1998 2000 2002 2004 2006 2008 2010 2012 2014
0
600,000
700,000
800,000
y = 18534x + 92819R2 = 0.50608
900,000
400,000
200,000
500,000
300,000
100,000
1,000,000

57
Overseas Employment of Bangladeshi Workers: Trends, Prospects, and Challenges
While Figure 4.3 indicates a notable and consistent increase in the number of female workers going abroad, Figure 4.4 shows that the number remains rather small compared with total numbers, and it has fluctuated.60
Women also tended to choose differing destinations and occupations. For workers as a whole, as noted, the major eight countries account for an overwhelming
majority of migrant workers; for women, the share of these countries is much smaller (just half) (Figure 4.5, both panels). For women, Jordan and Lebanon are major destinations, but for men they are not important as destinations. The kind of work female workers migrate for is also quite different than what male workers go abroad for (Table 4.1).
____________________60 The rise in the number of female migrant workers since 2009 was mainly due to a change in the attitude in the government that came to power in that year toward
this issue. And the rising trend indicates that the “sociocultural argument” against the migration of women (unaccompanied by men) may be exaggerated.
Figure 4.2: Percentage Distribution of Overseas Employment by Destination, 1990–2014
UAE = United Arab Emirates. Source: Constructed using data from the Ministry of Expatriates Welfare and Overseas Employment.(2015).
Figure 4.3: Flow of Female Workers for Overseas Employment, 2000–2014
Figure 4.4: Total Number and Number of Female Workers Going Abroad, 2000–2014
Source: Constructed using data from the Ministry of Expatriates’ Welfare and Overseas Employment. (2015).
Source: Constructed using data from the Ministry of Expatriates’ Welfare and Overseas Employment. (2015).
0
50
60
40
20
30
10
70
1990 1995 2000 2005 2010 2014
Saudi Arabia
55.4
UAE Kuwait Oman Qatar Bahrain Malaysia Singapore Others
44.8
64.9
31.83
1.62.5
8 7.8
15.3
24.53
52
5.7 5.79.3
0.3
18.6
.010.7
13.511.2
2.1 .04.06
0.83.1
20.6
1.9
10.9
24.8
7.44.4
1.62.14.2 5.65.5
1.3
18.8
7.7
1.20.21.2 0.7 2
5 3.81.7
4.53.5
1012.9
26.1
16.313.1
0
80,000
60,000
50,000
40,000
30,000
20,000
10,000
70,000
2000
2001
2002
2003
2004
2005
2006
2007
2008
2009
2010
2011
2012
2013
2014
Total number
0
1,000,000
600,000
500,000
400,000
300,000
200,000
100,000
800,000
900,000
700,000
2000
2001
2002
2003
2004
2005
2006
2007
2008
2009
2010
2011
2012
2013
2014
Female

58
Bangladesh: Looking beyond Garments
The destination difference for women reflects occupational patterns. More than half of the female migrant workers during 2005–2015 were domestic workers (adding up what the government data classifies as “domestic workers” and “house workers”). About 10% represent occupations relating to the garment industry (Table 4.1),61 making clear women find work as either household help or in garment factories (the latter mainly in Jordan and Lebanon).
Two categories, “laborer” and “worker,” account for nearly 60% of male migrant workers. Although it is difficult to interpret these two categories, one can perhaps surmise that these represent unskilled workers (less skilled, in official terminology). It is also clear that male workers either work as general purpose workers, for which not much skill is required, or also work in the construction sector. The categories “waiter” and “private service” also do not appear for female workers.
____________________61 This is based on the assumption that occupations classified as “operator,” “machine operator,” and “sewing operator” represent work in the garment industry.
Figure 4.5a: Destination of Migrant Workers, 1976–2014 (total)
Figure 4.5b: Destination of Female Migrant Workers, 1999–2014
Note: The major eight are Bahrain, Kuwait, Malaysia, Oman, Qatar, Saudi Arabia, Singapore, and United Arab Emirates.Source: Constructed using data from the Ministry of Expatriates’ Welfare and Overseas Employment (2015).
Note: The major eight are Bahrain, Kuwait, Malaysia, Oman, Qatar, Saudi Arabia, Singapore, and United Arab Emirates.Source: Constructed using data from the Ministry of Expatriates’ Welfare and Overseas Employment (2015).
Table 4.1: Top-10 Occupations of Male and Female Migrant Workers, 2005–2015a
Male OccupationPercentage of Workers
Female Occupation
Percentage of Workers
Laborer 38.50 Domestic worker
42.70
Worker 21.29 House worker
19.20
Waiter 4.08 Labor 14.97Private service 3.99 Female
labor6.26
Mason 3.55 Machine operator
4.26
Cleaning labor 3.20 Sewing operator
2.29
Construction worker 2.61 Operator 2.09Carpenter 2.12 Machine
operator1.73
Driver 1.61 Cleaning labor
1.58
Painter 1.60 Worker 1.11
a A number of questions may be raised about the titles of “occupations” used in this table. For example, the differences between “laborer” and “worker,” “house worker” and “domestic worker,” “labor” and “female labor,” “operator” and machine operator” are not clear.Source: Ministry of Expatriates’ Welfare and Overseas Employment (2015).
Major eight Lebanon Jordan Others
90.79
7.04
0.93
1.24
Major eight Lebanon Jordan Others
50.64
12.86
10.59
25.93

59
Overseas Employment of Bangladeshi Workers: Trends, Prospects, and Challenges
4.3.2. Determinants of short-term international migration
As section 4.2 mentioned, a variety of factors—economic, demographic, and social— influence the flow of overseas migration of workers. But it is important to understand how these operate. For example, it may not be correct to assume that the flow of migration is influenced by a country’s economic performance and good performance would have a negative influence on migration.
For Bangladesh, one exercise (World Bank 2012a) actually shows a positive relationship (although not statistically significant) between migration flow and GDP growth. Indeed, for more than 2 decades since the early 1990s, Bangladesh has witnessed an acceleration in economic growth. And the long-term trend of overseas migration has also been positive over that period. It thus seem that the economic progress of the country has not led to a decline in the flow of overseas employment.
Does this imply that economic factors have no influence on migration? The answer to this question has to be sought not in how the economy itself is performing, but in various factors such as employment opportunities at home and the difference between the actual earnings of prospective migrants at home and what they expect to earn in countries with demand for migrant workers. One study (Ullah 2012) finds that the flow of migration is influenced, among other factors, by the per capita income of the sending countries relative to that in the destination countries.
Another way of looking at the importance of economic factors is to ask whether migration is induced by poverty. It would be natural for the poor to be more interested in overseas employment, and hence to see the probability of migration inversely associated with the premigration income of households. The World Bank (2012a) study mentioned above does find this in an econometric analysis based on the Household Income & Expenditure Survey 2010.
But does that imply that the poor benefit from migration more than the upper-income groups? The
answer is not straightforward: the same study points out that the high cost of migration and the difficulty of meeting such costs skews access to migration in favor of the upper-income groups. How ever much the poor may want to migrate for employment, most (especially the poorest) are unable to do so because of high costs: these include not only formal charges like the cost of an air ticket, visa, and the fees of the recruiting agencies, but other costs like payments made to intermediaries (section 4.6.1 provides more details).
A number of studies clearly identify the impact of demographic factors such as gender and age. A 2009 survey by the International Organization for Migration (IOM) cited in a World Bank (2012a) study shows that an overwhelming proportion (98%) of the migrants are males, and their average age is rather low (32 years). Most (three-quarters) have completed only primary education, with only 13% completing secondary education.
Econometric analysis (using probit model) of data from the Household Income & Expenditure Survey 2010 provides further insight into the influence of age and education on migration (World Bank 2012a). Both relationships are found to be nonlinear: for age, this implies that up to 43.3 years, the probability of migration increases and then declines. Likewise, the probability of migration increases up to 10.5 years of schooling and then declines. This analysis implies that people getting into middle age and those with a university education are less likely to migrate than younger and less educated people.
The results of a 2013 Bangladesh Bureau of Statistics survey on the use of remittances corroborate the findings on the age and education (BBS 2014). On age, the survey found that for both male and female workers, the percentage of migrants increases up to age 39 and then falls drastically, and more so for women (Table 4.2). One important difference between male and female workers is age: nearly 30% of female migrants are less than 25 years old and 19.16% of males are. In education, most migrants have less than a secondary school certificate. Only 5.5% are graduates.62
____________________62 Data on education is not available for male and female workers separately.

60
Bangladesh: Looking beyond Garments
current rate of growth, the economy is not able to create employment at a rate necessary to absorb the annual addition to the labor force, let alone the backlog of the unemployed and the underemployed.
Figure 4.6: Flow of Remittances and Foreign Exchange Reserves, 2005–2015 ($ million)
Figure 4.7: Current Account Indicators, 2006-2015
Source: Constructed using data from Bangladesh Bank (2015).
Remittances
0
45,000
25,000
20,000
15,000
10,000
5,000
35,000
40,000
30,000
2005
–200
6
2006
–200
7
2007
–200
8
2008
–200
9
2009
–201
0
2010
–201
1
2011
–201
2
2012
–201
3
2013
–201
4
2014
–201
5
Forex reserve
Current account balance,RHS (% of GDP)
–10
20
0
–5
10
15
5
–2.0
4.0
0.0
–1.0
2.0
3.0
1..0
2006
2007
2008
2009
2010
2011
2012
2013
2014
2015
Trade balance
Net income Net transfers
Net services
$ Bi
llion
Perc
ent
____________________63 In recent years (like 2013–2014 and 2014–2015) official transfers have been around 5% of total transfers.
4.3.3. Impact of overseas employment
Focusing first on the macro level impact of overseas migration, several points are noteworthy. First, remittances sent by Bangladeshi migrant workers are an important source of foreign exchange for the country, second only to ready-made garments. The increase in foreign exchange reserves in recent years owes at least partly to an increase in the flow of remittances, although the rise in the level of reserves since 2011–2012, for various reasons, has outstripped that of remittances (Figure 4.6). At their peak, remittances accounted for 77% of the foreign exchange reserves in 2012–2013, and fell to 61% in 2014–2015. The rise in foreign exchange reserves is a positive development that enables an increase in imports without putting pressure on exchange rates. To the extent foreign exchange is used for importing capital and intermediate goods, remittances make an indirect contribution to the growth of economic output.
Remittances also have a positive impact on the balance of payments and help offset deficits in the balance of trade in goods and services. As can be seen in Figure 4.7, Bangladesh has a chronic deficit in its trade balance and in the balance of services and net income. But that is usually offset by private and official transfers, and the net result is a positive balance in the current account (except in 2011). In addition, the amounts of official transfers are usually smaller than private transfers.63
Overseas employment is also important to reducing pressure on the domestic labor market. With the
Table 4.2: Percentage Distribution of Migrant Workers by Age and Education, 2013
HSC = higher secondary certificate, SSC =secondary school certificate.Source: Bangladesh Bureau of Statistics (2014).
Age (years) Male FemaleLevel of
EducationPercentage of Workers
Less than 25 19.16 29.75 Illiterate 9.5625–29 25.90 23.54 I to IX 61.5030–39 32.92 33.84 SSC 16.2540–49 16.00 8.07 HSC 7.1950 and over 5.73 4.79 Degree and
higher5.50
Source: Constructed using data from International Monetary Fund – Balance of Payment Statistics accessed January 2016.

61
Overseas Employment of Bangladeshi Workers: Trends, Prospects, and Challenges
In recent years, for example, around 1.8 million people have entered the labor force every year. The annual flow of migrant workers represents about 22% of this number. Accounting for the multiplier effect of consumption generated by the inflow of remittances as well as investment in economic activities by the remittance-receiving households, the contribution of overseas employment to improving the overall employment situation of the country would appear to be quite considerable.
While overseas employment is regarded as a positive phenomenon macroeconomically and for overall employment, negative implications also exist. It could also create a scarcity of skills as skilled workers go abroad, especially in the construction and transport sectors. Without research focusing specifically on the issue, however, it is not possible to say anything with confidence.
Nonetheless, because much of the migration for overseas employment is short term, at least some of them will return with new skills. This positive externality can be exploited with policies and programs for reintegration of returning migrant workers into the domestic economy.
At the micro level, the contribution of migration to poverty reduction is an important issue. It hinges on
the premigration incomes of the migrants’ households and the contribution of remittances to income and expenditure of remittance-receiving households. A key question is the extent to which migrant workers come from poor households. A good indicator of the premigration status of remittance-receiving households is provided by the landholding distribution of such households (Table 4.3). It is clear that very few migrant workers belong to the poorest of the poor, that is, to landless households. Obviously, as noted, such households have trouble to meet the costs of migration. Instead, more than one-third of the workers come from households with more than one acre of land, which are unlikely to be below the national poverty line.
World Bank (2012a) supports the above conclusion with an analysis based on the household expenditure survey data, which shows that the proportion of migrants rises continuously from 0.5% in the lowest decile to 6.8% in the ninth and tenth deciles.
That said, employment overseas of migrants and the remittances they send play an important role in helping left-behind households get out of poverty. Data from the Household Income & Expenditure Survey 2010 show that remittances boost household consumption and savings significantly: income, consumption and savings per month were on average 82%, 38%, and 107% higher,
Year Saudi Arabia UAE Kuwait Oman Qatar Bahrain Malaysia Singapore
2000 144,618 34,034 594 5,258 1,433 4,637 17,237 11,0952001 137,248 16,252 5,341 4,561 223 4,371 4,921 9,6152002 163,269 25,462 15,769 3,854 552 5,421 85 6,8562003 162,131 37,346 26,722 4,029 94 7,482 28 5,3042004 139,031 47,012 41,108 4,435 1,268 9,194 224 6,9482005 80,425 61,976 47,029 4,827 2,114 10,716 2,911 9,6512006 109,513 130,204 35,775 8,082 7,691 16,355 20,469 20,1392007 204,112 226,392 4,212 17,478 15,130 16,433 273,201 38,3242008 132,124 419,355 319 52,896 25,548 13,182 131,762 56,5812009 14,666 258,348 10 41,704 11,672 28,426 12,402 39,5812010 7,069 203,308 48 42,641 12,085 21,824 919 39,0532011 15,039 282,739 29 135,265 13,111 13,996 742 48,6672012 21,232 215,452 2 170,326 28,801 21,777 804 58,6572013 12,664 14,241 6 134,028 57,584 25,155 3,853 60,0572014 10,657 24,232 3,094 105,748 87,575 23,378 5,134 54,750
Table 4.3: Overseas Employment of Bangladeshi Workers to Major Destination Countries, 2000–2014
UAE = United Arab Emirates.Source: Bureau of Manpower, Employment and Training database.

62
Bangladesh: Looking beyond Garments
respectively, for the remittance-receiving households relative to those without remittances (World Bank 2012a).64 In 2010, only 13.1% of the remittance-receiving households were below the poverty line, compared with 33.6% of non-receiving households and the 31.5% national average poverty incidence.
Osmani et al. (2011), based on a large-scale household survey, show that although remittances are not the only variable to have a statistically significant effect on the probability of being nonpoor, of the variables examined (assets, education, access to micro credit, and so on), they have the largest effect (ADB 2016, Box 3.2). Remittances also have significant effect on the ability of households to accumulate assets.65
An important question about the microlevel impact of remittances is their contribution to human development. On this, the evidence is somewhat mixed. BBS (2014), a survey of the use of remittances, shows after expenditure on food (38.84%), purchase of land and loan repayment are the second and third most important items, at 17.39% and 9.26% respectively. Education and health account for 3.59% and 4.88%. It is clear that after essential expenditures such as food and clothing, the priority is to build up physical assets (such as land) rather than human capital. For poorer households who had to borrow to meet the cost of migration, allocation has to be made for the repayment of loans. Human development thus appears to take a back seat. This is corroborated by data on savings and investment by the remittance-receiving households. While only 57% of the households are savers and 25% are investors, of the latter, nearly 88% invest in the construction of houses and the purchase of apartments. Only about 7% reported making any investment in business or industry.
Nonetheless, that the impact of remittances on human development (through allocations to education and health of remittance-receiving households) is not very clear. Different studies based on small-scale surveys show different results. For example, the pattern of spending remittance income as reported by Mamun and Nath (2010) is very similar to that found by BBS (2014), with major allocation to food and clothing followed by repayments of loans, purchases of land, and construction and repairs of houses. Education and health comes low in the order. On the other hand, a survey by the IOM cited in a World Bank (2012a) study finds allocation to education and health above those on purchase of land and construction of houses. Kumari and Shamim 2010 report that female migrants attach higher priority to education and health than purchase of land than do males.
Socially, studies based on microlevel surveys (such as Kumari and Shamim 2010) report that the remittance-receiving households are able to improve their status in the society through greater participation in social life and by playing a leadership role. Moreover, migration contributes to the empowerment of women—both female migrants and female members left behind—because they play a greater role in household decision making, especially in education and health of children, as well as running economic activities.
Kumari and Shamim also point out the negative impact of migration on families left behind, and report problems like loneliness of spouses and children, disruptions in family life that in some cases lead to the break up of marriage, and adverse impact on child care in general and on their education in particular.66
____________________64 The following comparison may also be useful. According to the Household Income and Expenditure Survey (HIES) of 2010, average monthly household income
in that year was Tk11,479, which implies Tk137,748 for the year. The survey of remittance-receiving households carried out in 2013 reported an average annual income from remittances alone to be Tk205,642, about 75% of total household income of remittance-receiving households.
65 The kind of studies mentioned here are not based on longitudinal surveys, and hence, it is not possible to say what happens to households over time—for example whether the non-poor become more affluent or whether some poor households could also overcome poverty.
66 A number of micro level issues have not been covered here. They include the duration of stay overseas of typical migrant workers, whether they acquire new skills or upgrade their skills during their work overseas, whether they leave their own family or other dependents behind, and so on. Tracer studies are needed to address such questions.

63
Overseas Employment of Bangladeshi Workers: Trends, Prospects, and Challenges
4.4 Prospects for Overseas Employment of Workers from BangladeshAs Bangladesh depends on overseas employment both for providing employment to a large part of its labor force and for earning much-needed foreign exchange, how many workers can find employment overseas every year is a question of great importance. But it has no simple answer. Linear extrapolations of past trends may not provide a reliable basis for answering this question because the flow of workers going abroad depends on a variety of factors that often do not behave in a predictable and orderly fashion. Hence, projections of prospects require combining forecasts based on past trends with available information about possible departures from such trends. To do so, flows of workers to different countries and factors influencing them (including political relations with prospective destination countries) need to be examined carefully.
The sharp increase in the number of migrant workers in 2007 and 2008 and rapid decline thereafter are examples of departures from past trends. By country, the declines in the numbers going to countries such as Malaysia, Saudi Arabia, and the UAE are good examples of departures from past trends. The factors behind such changes will have to be understood to make realistic adjustments to forecasts.
Additional factors need to be taken into account to project overseas employment. The trend line based on the time series between 1990 and 2015 has already been shown in Figure 4.1. A projection for 2020 made by using this trend line yields a figure of 648,839 migrant workers, implying that if the past trend continues without much change, overseas employment could be of this order by that time.
Figure 4.1 shows unusual increases in the numbers finding jobs abroad in 2007 and 2008. The trend line affected by this bump will naturally have a higher slope than if no such bumps occurred. To avoid the effect
of that bump, a different trend line and an associated regression equation were fitted by excluding the figures for those 2 years. That trend line has a slightly smaller slope, and the fit is also better (as is indicated by the estimated R-squared). The projection for 2020 using this trend line yields a figure of 589,67567 implying that if the trend continues in this manner, overseas employment by that year could be around 600,000.
To understand why the above projections should not be taken literally, one simply has to look at the trend in employment of Bangladeshi migrant workers in major destination countries such as Kuwait, Malaysia, Saudi Arabia, and the UAE. The notable aspects that deserve attention in each country in this respect include the following:
Saudi Arabia
• Sharp increase in employment of Bangladeshi workers in 2007 and decline in the following year.
• Sharp decline in the number employed in subsequent years.
• A reversal in the declining trend since 2011, but the number remained very small compared with normal.
United Arab Emirates
• Sharp increase in the flow of workers in 2007 and 2008 and decline thereafter.
• Sharp decline since 2013.
Kuwait
• Almost closed for Bangladeshi workers after 2007.
• Some resumption in recruitment in 2014, but the number is very small compared with pre-2007 numbers.
____________________67 The trend line estimated is 93,895 + 16,526 X where X stands for year. As the first year for which data was used is 1990, 2020 would be the 30th year. Thus, the
projected figure for that year would be 93,895 + 16,526 × 30 = 589,675.

64
Bangladesh: Looking beyond Garments
Malaysia
• Sharp increase in numbers recruited in 2006 and 2007 and sharp decline thereafter.
• Almost negligible as a source of employment during 2010–2012.
• Recruitment resumed in 2013, but numbers remain very small.
Oman, Qatar, and Bahrain
• These countries, especially Oman and Qatar, have emerged as major destinations for overseas employment of Bangladeshi workers. Currently, they, along with Jordan, Lebanon, and Singapore are the major sources of such employment.
The changing destinations of overseas employment outlined above illustrate the complexity involved in making an assessment of the prospects for overseas employment. The first point is that the needs of workers in a potential source of employment is not the only determinant of the actual number of people that may be able to find jobs in that country. A variety of factors, especially the nature of bilateral relations, the reputation of workers from a particular country—which in turn has to be interpreted not simply in terms of workers’ skill and efficiency, but also in overall track record from the perspective of the destination country—governance of recruitment, and deployment of workers, and other such factors play an important
role in this regard. The importance of these factors is illustrated by the almost complete closure of the doors of Kuwait, Malaysia, and Saudi Arabia to workers from Bangladesh, even as these countries still need expatriate workers and have continued to recruit from other countries.68
Second, given the strong incentives to emigrate, the existence of kinship and other networks in many countries with need for expatriate workers and of recruitment agencies with good experience, a proactive and facilitating attitude of the government can help workers tap the potential for overseas employment. That many people were able to tap job markets in countries such as Bahrain, Oman, and Qatar and relatively smaller markets in other countries indicates this possibility. Considering this kind of a scenario, it does not seem unrealistic for the number of overseas employment to be around 600,000 by 2020.69 And if the labor markets in Kuwait, Malaysia, and Saudi Arabia can be accessed again, and those in Bahrain, Oman, Qatar, and Singapore remain, the number could be even higher.
Third, the economies of several destination countries, such as Bahrain, Kuwait, Saudi Arabia, and the UAE, are dependent on oil and gas, and hence may experience economic cycles of growth and recession at the same time. As demand for expatriate workers would vary with the economic cycle, it would be important to monitor such developments and assess their implications for overseas employment of workers from Bangladesh.
____________________68 For example, in Saudi Arabia, the number of labor permits granted more than doubled between 2005 and 2011, and during that period, almost 2.5 million jobs
were available to foreign laborers. That happened despite a worsening of the employment situation of nationals and a systematic campaign by the government to employ more nationals (De Bel-Air 2014; Fayad et al. 2012). From the side of labor-sending countries, employment of workers from Nepal continued to increase in both Malaysia and Saudi Arabia during 2008 to 2014. To Malaysia, the number rose from 29,320 to 206,719, and to Saudi Arabia, the increase was from 45,044 to 75,026 (Government of Nepal 2014). In 2013, the number of Pakistani workers going to Saudi Arabia and the UAE were 270,502 and 273,234 respectively (ILO 2015). These numbers should indicate that the prospects for employment of foreign workers in Malaysia, Saudi Arabia, and the UAE remain.
69 In this context, one might wonder what would be the right number for migration of workers from Bangladesh per year. While it is difficult to address such a question, some idea can be provided on the basis of the current employment situation (described in Chapter 2) and the number of workers who have found employment overseas in recent years. Given the labor absorptive capacity of the economy, overseas employment in the range of 400,000 workers per year is considered the minimum required to maintain the current situation and prevent unemployment from rising. If the country’s economic growth and labor absorptive capacity do not change much in the near future, and the surplus labor that is available needs to be absorbed, this number has to be higher. So, it would be good for the economy if half a million or more workers found jobs abroad every year. There would be a downside risk of declining oil price, which affects the number of overseas workers to the Middle East. However, the price decline does not seem to have much effect on the number of migrants from past experience. On the other hand, the recent decline in the number of migrants in Kuwait, Saudi Arabia, and Malaysia seems to be due to political reasons leading to a stoppage of recruitments.

65
Overseas Employment of Bangladeshi Workers: Trends, Prospects, and Challenges
4.5 Matching the Skills of Bangladeshi Workers with Those Needed in Receiving Countries To address the skills mismatch, policy makers need to know the types of skills needed by the receiving countries (or potential recipients). As mentioned, Bangladeshis are working in many countries; so it is not possible to obtain information from all of them. However, it should be possible to select major destinations or recent major destinations to get a read on the skills likely to be in demand. Given the current state of the availability of information, the present study will focus primarily on Bahrain, Kuwait,
Malaysia, Qatar, Saudi Arabia, Singapore, and the UAE. As Jordan and Lebanon are major destinations of female workers, skills that have been in demand in those countries will also be looked at. The pattern of skill requirements in such countries will be compared with the skill composition of workers from Bangladesh and a strategy for better match between the two will be formulated.
The skill composition of migrant workers is important to the kind of jobs they would be doing, the incomes they would earn, and the amounts they can remit. Figure 4.8 presents a very positive picture. First, “less skilled” (presumably used officially for unskilled
Figure 4.8: Share of Various Skill Categories in Total Migrant Workers, 1990–2014 (%)
Figure 4.9: Gender Difference in the Skill Composition of Migrant Workers, 2005–2014 (%)
Source: Constructed using data from Bureau of Manpower, Employment and Training.
Source: Constructed using data from Bureau of Manpower, Employment and Training.
0
70
50
60
40
20
30
10
80
Professional Skilled Semiskilled Less skilled
1990
5.78
34.339.88
1995 2000 2005 2010 2012 2014
20.03
3.39
31.94
47.58
17.09
4.79
44.73
38.6
11.88
0.77
44.98 44.54
9.72
0.10
23.19
73.52
3.190.13
34.45
62.05
3.37 0.41
34.95
45.43
16.47
0
70
50
60
40
20
30
10
80
Male Female
Less skilled Semiskilled Skilled Professional

66
Bangladesh: Looking beyond Garments
____________________70 The data in this table were compiled by ILO (2015) from various country sources, but data on India and Sri Lanka are not available in that publication. In addition,
because the skill classifications used in different countries are different, a precise comparison is not possible. However, a comparative idea can be formed.71 These studies are Jayaprakash (n. d.), Kanapathy (2014), Kolb (2014), Rumani (2014), Weston (2014), and ILO (2014c). The last mentioned provides useful
information about the skills of Bangladeshi workers in major destination countries.
workers) workers constitute an overwhelming majority of migrant workers. Notably, the share of this category has increased over time and remains stubbornly high, although it declined in this category between 2010 and 2014. The share of skilled workers went up during 1990–2005, declined during 2005–2010, and increased after that. The share of professionals has become negligible since 2005.
Data are not available on the skill composition of female migrant workers before 2005. Data for 2005–2014 show that the proportion of unskilled workers is higher for women than men. More detailed data show that more than 60% of female migrant workers go as domestic and household workers.
Data presented in Table 4.4,70 suggest two points. Since migrant workers from Nepal belong mostly to the unskilled category, Pakistan might be a more useful comparator for Bangladesh. And the percentage of skilled workers migrating from Pakistan is higher than that from Bangladesh.
ILO (2015) presents more detailed data on the common occupations of workers from Bangladesh and Pakistan in the Gulf Cooperation Council countries and suggest the following notable differences: in the “skilled” category, much higher percentage of workers from Pakistan are in occupations such as mason,
carpenter, welder, electrician, and mechanic, as well as in semiskilled occupations such as driver, painter, steel fixer, and plumber. While these differences point to the possible direction of skilling for workers from Bangladesh, it may not be appropriate to assume that the country could attain a similar skill composition for its workers, even in the same destination country.
The skill composition of workers from a sending country to a destination country depends on a variety of factors, of which skill needs in the latter is only one. Countries employing foreign labor usually associate particular occupations and skills with specific countries of origin. For example, for nurses, domestic help, and service sector workers, the Philippines is usually considered the appropriate source. Likewise, for highly skilled technicians, India is regarded as the right source, and for drivers, Pakistan, and so on. Based on studies of potential demand for workers in a number of destination countries, the following observations may be made:71
• In Saudi Arabia, the sectors with higher growth potential in the medium to long term are manufacturing, trade, and services. Construction sector growth is likely to taper off. In that kind of a growth scenario, skills and occupations likely to be in greater demand are higher level skills for manufacturing, and for the service sectors (education, health, retail trade, and so on).
• Employers in Saudi Arabia appear to have high confidence in training programs in the Philippines, and hence are more likely to recruit workers with high-level skills (technicians and associate professionals) from there. Employers often assume that Filipino workers will be qualified for technical or administrative roles. So, for trade and service sectors also, they are more likely to be employed. There seems to be no such perceptions about the construction sector, and hence the likelihood is greater that workers from Bangladesh can find jobs there. However, within that sector, there may be that require skills that may be targeted in future for Bangladeshi workers.
Bangladesh (1976–2012) %
Nepal (2013–2014) %
Pakistan (2008–2013) %
Professional 2.2 Professional Less than
1
Highly qualified
1.9
Skilled 31.5 Highly skilled Less than
1
Highly skilled 0.8
Semiskilled 14 Skilled 14 Skilled 42Less skilled 52.3 Semiskilled 12 Semiskilled 16.5
Unskilled 74 Unskilled 38.5
Table 4.4: Distribution of Migrant Workers from Bangladesh, Nepal, and Pakistan in the Gulf
Cooperation Council Countries by Skill Category
Source: ILO (2015).

67
Overseas Employment of Bangladeshi Workers: Trends, Prospects, and Challenges
• In the UAE, sectors likely to grow rapidly include construction and real estate, tourism and hospitality, manufacturing and logistics, education, and health care, with demand for qualified personnel in these areas expected to rise significantly. Employers in the UAE also have specific perceptions about the skills workers from different countries offer, such as that India is the better source for highly skilled and technical workers. This might be the reason that no new visas have been issued for workers from Bangladesh, since August 2012.
• In Kuwait, oil capacity, utilities, infrastructure (including residential cities), and services (especially health care and education) are targeted as growth sectors, and labor requirements in those are therefore likely to cover a broad range of skills in construction and services. But like the UAE, it has not recruited Bangladeshi workers in the 5 years since 2009.
• Meanwhile, Qatar is massively expanding its infrastructure as it prepares to host the soccer World Cup in 2022, with growth expected in the construction, hotel and restaurants, and service sectors. This will mean it needs workers with skills in those areas and increasing numbers of security guards, cleaners, waiters, waitresses, hospitality workers, maintenance staff, and so on to work in the newly constructed facilities.
• Malaysia’s economy is likely to post healthy growth in the medium term and therefore generate demand for labor in a wide variety of sectors, especially agriculture, palm oil, electrical and electronic industries, tourism, wholesale and retail trade, and education. In line with the government’s objective of reducing dependence on low-skilled foreign labor, there may be a strategic shift toward sectors like trade, tourism, education, and so on. However, growth in the plantation sector and labor-intensive industries is likely to generate demand for foreign, low-skilled labor for those sectors.
• In Jordan, apart from the construction sector, workers are needed in the garments industry. So, it is not surprising that that country is a major destination country for female workers from Bangladesh.
• Lebanon is also a major destination for female migrant workers from Bangladesh, but they are engaged mostly as care providers.
• In the Republic of Korea, domestic and care work, housekeeping in hospitals, construction (including skills like civil engineering, masonry and carpentry), and others are sectors using foreign labor.
Table 4.5 summarizes likely future skill demand in key destination countries for Bangladeshi workers and the major skill categories of the workers going to those countries, for easy comparison of the kinds of skills Bangladesh has supplied in recent years (2005–2012) and what might be required in the corresponding destination countries.72 A few points warrant discussion. First, most of the Bangladeshi workers going to the countries in the Middle East have been in categories such as laborers and workers whose skill type has not been specified and in other categories like construction, agriculture, miscellaneous (low-end) services like cleaning, cooking, and driving. But skill demands from these countries are likely to change substantially in the near future. Of course, countries like Qatar and Saudi Arabia may continue to need construction workers and may look to Bangladesh as a potential source for such skills.
Second, the type of skills supplied by Bangladesh to Malaysia and the country’s future skill needs correspond fairly closely. Malaysia is likely to need workers for its labor-intensive manufacturing industries and the low-end service sector, but is also going to demand qualified personnel in education. It remains to be seen whether Bangladesh can meet that requirement.
____________________72 The information provided here is based on studies that could be accessed, and is not comprehensive. Moreover, quantitative estimates are not available. This
is an area where agencies dealing with overseas employment may undertake some investigative work including analysis of economic and business prospects in prospective destination countries and possible requirement of skills and expatriate workers.

68
Bangladesh: Looking beyond Garments
To sum up, it is noteworthy that, first, in the major destination countries for migrant workers, there is demand for a broad range of skill categories—with a high level of technicians for manufacturing and professionals in service sectors at one end and workers in construction and maintenance that require very few skills. Second, the occupations for which a destination country demands workers from a particular country seems to depend on a variety of factors, on top of the simple availability of the required skills. The following conclusions from ILO (2015) are also noteworthy in this regard:
“In sum, the main determinants for low-skilled labor from South Asian countries appear to be price (wages), availability, general health and physique, perhaps connections, recruiter catchment area and such criteria as perceptions about the attitudes and behavior as well as experiences of certain nationalities. Their education and skill levels as well as their occupations prior to migration have a subordinate role” (ILO 2015, 11).
Countries of Destination Type of Skilled Workers Who Found Employment
Likely Future Demand for Skills
Bahrain Labor (not specified), worker (not specified), private service, construction workers like mason, carpenter, painter, welder), cook, driver, servant, cleaner, machine operator, tailor
Not known
United Arab Emirates Labor (not specified), worker (not specified), private service, construction workers like mason, carpenter, plumber, painter, welder), cook, driver, servant, cleaner, machine operator, tailor, salesman, agricultural workers
Qualified personnel in manufacturing, construction, real estate, tourism and hospitality, education and health care
Kuwait Labor (not specified), cook, driver, house boy, salesman, welder, technician (not specified), cleaner
Malaysia Agricultural worker, labor (not specified) construction worker, factory worker, cleaner, production worker, production manager, warehouse worker, private service
Agricultural worker, electrical and electronic industry, tourism, wholesale and retail trade, education
Oman Agricultural laborer, farmer, gardener, labor (not specified), construction workers (like mason, fitter, welder, painter), tailor, waiter, salesman, servant
Not known
Qatar Labor (not specified), construction workers (like mason, plumber, carpenter, painter), cook, driver, fitter, foreman, private service, engineer
Construction workers, security and cleaning services, workers for hotels and restaurants, waiters and hospitality workers
Singapore Labor (not specified), construction workers (like carpenter, fitter, electrician, painter, plumber, welder), waiter.
Not known
Saudi Arabia Laborer (not specified), agricultural workers and farmers, construction workers (like mason, carpenter), driver
Technicians and other higher level skills for manufacturing, qualified professionals in education and health, retail trade, construction workers
Jordan Garment workers Construction workers and garment workersLebanon Care providersRepublic of Korea Domestic and care work, construction
workers, housekeeping in hospitals
Table 4.5: Workers Who Found Employment during 2005–2012 and Likely Future Skill Demands, Selected Countries
Source: Compiled from Jayaprakash (n.d.), Kanapathy (2014), Kolb (2014), Rumani (2014), Weston (2014), and ILO (2014c).

69
Overseas Employment of Bangladeshi Workers: Trends, Prospects, and Challenges
In the situation described above, it may not be easy for Bangladesh (or for any other country) to attain a “desired” skill and occupational composition of its migrant workers simply through supply-side interventions such as skills training. Efforts are needed on several fronts.
Action is required to break the perceptions in the destination countries associating certain occupations with specific countries. While upgrading of skills training (to bring it in line with international standards) is an essential first step, creating awareness among potential employers about the supply of skills from Bangladesh (for example, through promotional work by missions in major destination countries), showcasing skills training facilities to prospective employers and such other market creation and penetration measures may be useful in changing stereotypes about perceptions. Bilateral negotiations and agreements could be a useful instrument for promoting Bangladesh as a potential supplier of skilled workers and for applying the strategy mentioned above.73
Another important area of action is international recognition of skills imparted to aspiring migrant workers from Bangladesh. A beginning in this area could be made as an extension of the current work on providing national recognition to the training being offered through the National Technical and Vocational Qualifications Framework, and the National Skills Quality Assurance System. Once the national system is in place that can be utilized for obtaining international recognition of the skills that have attained national recognition. Bilateral negotiations could include this as one area of agreement.
At this point, migration of more skilled workers is considered desirable, because those workers are expected to receive higher salaries and therefore to send more remittances per worker (although this is not automatic). However, producing skilled workers is costly, and much of that cost in places like Bangladesh is usually borne by the government in the form of subsidized training facilities in the public sector. These factors should be considered.
4.6. Rights and Welfare of Migrant Workers4.6.1. A brief overview of the current situation
In the globalized world where economies are driven primarily by markets, ensuring the rights of workers and rights at work is a challenge even where “rights holders” and “duty bearers” are located within national boundaries. The challenge becomes more difficult when the two sides are international. Be that as it may, certain basic rights of workers, such as the right to free association without external interference, to bargain collectively with employers, and to have social protection against unemployment, old age, and sickness are considered basic. Protection is also needed against injury and accident in places of work. In addition, rights relating to migrant workers include nondiscrimination between national and foreign workers in wages and other conditions of work, fair treatment of workers during employment, and adherence to contractual obligations.
Migration for work is beset with abuses and exploitation that include high costs and fees, attachment to a stipulated employer (which goes against the principle of freedom to choose employment), divergence between contractual obligations and real conditions at work (especially payment of wages lower than contracted), and so on. Particularly vulnerable are workers with low education, workers with no skills, and female workers. For the latter, especially for those who work as domestic help, sexual harassment is an additional risk.74 The ILO sums up the situation:
“While international migration can be a positive experience for migrant workers, many suffer poor working and living conditions, including low wages, unsafe working environments, a virtual absence of social protection, denial of freedom of association and workers’ rights, discrimination and xenophobia. Migrant integration policies in many destination countries leave much to
____________________73 The Philippines provides a good example of how this can be done. 74 A number of studies cover these issues, such as Siddiqui (2005, 2010), and Kumari and Shamim (n. d.).

70
Bangladesh: Looking beyond Garments
____________________75 This number is much smaller compared with the number in Sri Lanka, for example, where during 1994–2011, the number was 157,239. The percentage of complaints
settled was much higher (81%) in that country. 76 For a list and detailed description of conventions and agreements, see Global Migration Group (2008) and ILO (2010).
be desired. Despite a demonstrated demand for workers, numerous immigration barriers persist in destination countries. As a result, an increasing proportion of migrants are now migrating through irregular channels, which has understandably been a cause of concern for the international community. As large numbers of workers—particularly young people—migrate to more developed countries where legal avenues for immigration are limited, many fall prey to criminal syndicates of smugglers and traffickers in human beings, leading to gross violations of human rights. Despite international standards to protect migrants, their rights as workers are too often undermined, especially if their status is irregular” (ILO 2010, 2).
Another study on Bangladesh notes that
“… institutional arrangements to ensure rights at work for the Bangladeshi migrant workers are poor. Neither Bangladesh, nor the labor-receiving countries has ratified the international instruments on the rights of migrant workers. Successive Bangladesh governments have found it difficult to sign memoranda of understanding with the receiving countries. Meanwhile, the enactment of various laws at the national level since 1976, has failed to reduce the exploitation of potential migrants even in accessing work.” (Siddiqui 2005, 18)
Since the Siddiqui study (2005), the government has taken steps to protect the rights and welfare of migrant workers, although challenges remain.
Although the media regularly reports the abuses migrant workers suffer, it is difficult to get concrete data, except on costs involved in migration and fees charged by agents. Apart from media reports and anecdotal evidence, however, not much concrete data exists. Some data are available on the number of complaints received from migrant workers, but the
breakdown of such complaints by their nature is not available. One study (Wickramasekara 2014) reports that in Bangladesh, out of 3,116 complaints during 2009–2013, only about 55% were resolved.75
The high costs migrant workers incur is a major issue in many countries, but Bangladesh is at the top. In 2008, the actual cost per migrant going to the Middle East was between $2,991 and $3,263 than the next highest figures of $1,181 to $1,737 in India. The cost was lowest in Sri Lanka, at less than $800. Similar figures are reported for migrant workers going to Malaysia and Singapore (Wickramasekara 2014). The cost in Bangladesh was 4.5 times GDP per capita, compared with 0.5 in the Philippines and 0.25 in Sri Lanka.
Such sharp differences imply differences in administrative effectiveness. Notably, nearly 60% of the cost in Bangladesh is accounted for by so-called intermediaries, 18% by “helpers,” and another 10% “agency fees.” In other words, 88% of the cost is accounted for by “facilitators” of migration. It is thus clear that a prospective migrant worker from Bangladesh has to pay large sums to recruiting agents and other intermediaries at various stages—and the payments per worker are the highest in the region. International conventions and standards are aimed at protecting migrant worker rights, such as various ILO and United Nations conventions on migrant workers and the ILO’s Multilateral Framework on Labour Migration.76 Unfortunately, many of the destination countries have not ratified any such instrument (ILO 2014b, Tables 1 and 2). It is thus difficult to obtain any assessment on the rights of migrant workers from such countries. In fact, the absence of ratification itself is an indicator of the poor situation. The following observations may nevertheless be made:
• Often, a prospective migrant worker receives no formal contract (especially in a language he or she understands) before departure, although this is a basic element in the guidelines (Guideline 13.3) of the ILO’s Multilateral Framework on Labour Migration (MFLM) adopted in 2006. Moreover,

71
Overseas Employment of Bangladeshi Workers: Trends, Prospects, and Challenges
it is quite common to substitute the contract offered prior to departure with one that is inferior in terms of wages and other conditions of work.
• Several international instruments (such as the ILO’s MFLM and Conventions C181 and C189) specify that no fee should be levied on workers; and yet, charging of fees from prospective workers is a common practice (in Bangladesh and in other sending countries as well).
• Conventions 181 and 189 provide for negotiation of bilateral agreements to prevent abuses and fraudulent practices in recruitment and placement. But such issues are often left out of bilateral agreements.
• Guideline 13.2 of the ILO’s MFLM stipulates that recruitment and placement of workers respect their fundamental rights; and yet, given the system of tying workers to a specified employer, confiscation of passport upon arrival in destination countries, and the requirement of exit permit, many workers find themselves in situations of forced labor.
The Government of Bangladesh has undertaken a number of initiatives to address the challenges in the administration of migration for employment abroad, including the following (Box 4.1 and Box 4.2 present some good practices from Asian countries):
• District employment and manpower offices can now provide migration information to prospective migrant workers and their families.
• The Bureau of Manpower, Employment and Training (BMET) arranges to provide predeparture orientation to migrant workers.
• The government, in collaboration with nongovernment organizations and other stakeholders, is disseminating information to raise awareness of safe migration procedures.
• The BMET’s Wage Earners’ Welfare Board is mandated to provide various services to migrant workers that include predeparture briefing, scholarship for workers’ children, repatriation cost of deceased migrant workers, and grants for deceased workers’ families.
Box 4.1: Safeguarding Migrant Worker Rights: Good Practices
Abuse of prospective and actual migrant workers and the violation of their rights are widely known and acknowledged, and various countries are trying to tackle and improve the situation. Here are a few examples of efforts from major-sending countries in Asia.
• Monitoring of the recruitment agencies and intermediaries• The Government of Sri Lanka has taken steps to strengthen monitoring in rural areas by decentralizing the
administration of migration and opening offices in provinces. It has appointed migration promotion officers at the divisional level.
• Assisting the poor in meeting the costs of migration• Bangladesh has set up the Probashi Kalyan Bank, among other things, to assist prospective migrant workers with
loans on easy terms, providing an alternative means of meeting migration costs. • Overseas employment contract and wages In the Philippines, no worker can be deployed overseas without an employment contract signed by the employer
and worker and submitted to and approved by the Philippines Overseas Employment Agency (Box 4.2). The overseas employment contract clearly defines the terms and conditions of the work of the migrant workers during employment
continued on next page

72
Bangladesh: Looking beyond Garments
Box 4.2: Setting Standards for Domestic Worker Employment Contracts: Philippines
As Box 4.1 notes, no worker from the Philippines can migrate for work without a written contract that follows certain minimum provisions. For domestic workers, separate provisions include a minimum stipulated salary and the following conditions:
• Continuous rest for at least 8 hours per day
• Paid vacation of not less than 15 calendar days for every year of service
• Employer assistance in remitting a percentage of salary through proper banking channels
• No salary deductions
• No confiscation of passport and work permit
• Personal life, accident, medical, and repatriation insurance
• Free round-trip economy class air ticket or money equivalent in case of contract renewal
Source: Agunias (2008).
Box 4.1 continued
abroad. The contract includes wages and working hours and other allowances, such as transportation, food, and housing, as well as conditions for termination. In setting wages, the following are taken into account:
n the prevailing minimum rate for the same skill or occupation in the host country;n minimum wages set in the bilateral agreement, if any, or in relevant international conventions ratified by the host
country; and n the prevailing wage in the Philippines.
• Ratification of international conventions The Philippines has ratified the ILO Convention on Domestic Workers (C 189), while Bangladesh and Sri Lanka
have ratified the International Convention on Migrant Workers. These conventions provide useful guidelines and benchmarks for measures to safeguard migrant worker rights.
• Bilateral agreements Bangladesh, India, Nepal, Pakistan, and the Philippines have executed a number of bilateral agreements with
major destination countries, which have helped them to agree on basic frameworks for managing migration. One needs nonetheless to note that such agreements and memorandums of understanding do not provide comprehensive solutions as they usually leave out the more contentious aspects of the process and the rights of workers. However, they provide a useful mechanism for countries to better manage the process and safeguard the rights of their workers.
• Partnership and cooperation between sending and destination countries Sri Lanka and the Qatar National Commission on Human Rights signed a memorandum of understanding in 2012 to
provide greater protection to Sri Lankan migrant workers in Qatar.
Sources: Compiled from Agunias (2008), Wickramasekara (2014), and fieldwork.

73
Overseas Employment of Bangladeshi Workers: Trends, Prospects, and Challenges
• Bangladesh has bilateral agreements with Kuwait and Qatar and memorandums of understanding with Hong Kong, China; Iraq; Jordan; the Republic of Korea; Libya; Malaysia; the Maldives; Oman; and the UAE.
• Probashi Kalyan Bank (Expatriate Welfare Bank) has been set up to provide credit for meeting the costs of migration, smooth remittances at low cost, and encourage investment in productive sectors.
• In 2011, the government ratified the International Convention on the Protection of the Rights of All Migrant Workers and Members of their Families.
• Parliament passed the Overseas Employment and Migrant Welfare Act 2013, which provides for protection to migrant workers against possible abuses. Rules are being formulated for the implementation of the act.
4.6.2. Toward improving the situation regarding rights and welfare of migrant workers
As noted, the Government of Bangladesh is actively pursuing protection of the rights of migrant workers and improving their welfare. As such, this study makes suggestions for making the institutional framework more efficient, transparent, and effective.
The rights and welfare of migrant workers encompass a number of stages in the cycle of migration, work abroad, and return (Figure 4.10). The starting point is the decision to seek employment overseas, during which a prospective worker needs information on a variety of aspects including the costs involved, jobs that may be available (taking into account age, qualification, and so on), possible additional training, expected wage and salary, location and conditions in which the work is to be done, and so on. For an informed decision, it is important to make available as much information as possible.
Once a decision is made, the next stage is to begin looking for a job, and that is when the recruiting agents
and their subagents start playing a role, although a significant number may get a job through personal networks. Once the search for jobs is completed and negotiations have been undertaken with the subagents and a licensed recruiting agent, the worker should look for a clearly specified contract in hand.
Irrespective of the mechanism used for getting a job, the prospective worker would need to follow the existing procedure (including registration with BMET and the government’s approval) that is prescribed under government regulations.
Figure 4.10: Various Stages of International Migration for Employment
Landing in destination and engaged in work
(Check on actual work situation regarding type and location of job, wages, other
working conditions, and so on, check on grievance procedure if needed)
Preparation for departure
(Predeparture training and briefing, government approval)
Contract negotiation
(Type of job, duration, location, wages/salary, other
conditions)
Job search
(Personal network, subagents, recruiting agents, government
agency)
Decision making
(Information)
Return home and
reintegration

74
Bangladesh: Looking beyond Garments
Upon arrival at the destination country and the location of duty, important steps include registration with the nearest Bangladesh mission, checking whether the actual terms and conditions of the work match those in the contract, and checking the grievance procedure, if needed.
Measures are needed to protect the rights and promote the welfare of migrant workers at each of these stages. Depending on the stage of intervention and nature of action, they could be in the nature of facilitation, promotion, regulation, or protection. At decision making, the prospective migrant would benefit from information of different kinds (mentioned above), which could be provided through various channels ranging from conventional electronic and print media, social media, and awareness-raising campaign by both government and nongovernment organizations at the grassroots level. Apart from information about the prospect of jobs in different countries and qualifications required for jobs of different kinds, it would be particularly important to provide information about the excessive charges from recruiting agents and subagents, the dangers of migration through irregular channels, and possibilities of abuse and exploitation in certain destinations.
The mechanism for the search for jobs overseas can be made more efficient and transparent by requiring recruitment agencies to post information about jobs available on their websites. Likewise, for government recruitment (for example within the framework of the government-to-government [G2G] mechanism), information may be posted on the BMET website.
It is during job search that migrant workers face the highest probability of being misled and exploited by agents and subagents, meaning that measures will be needed at this stage to protect them from such dangers.77 While laws and regulations and punishment for offenders are essential, they alone will not be sufficient, especially where desire and incentive to migrate are very strong. It would be important to provide the prospective migrants with choices and alternatives to the “services” provided (or promised) by agents and subagents. Strengthening and extending the reach of the public sector recruitment agency as
well as innovative measures to help job seekers link up with employers or their legitimate agents can play a useful role. If properly mandated and strengthened, district employment and manpower offices may be able to provide an alternative to subagent “services.” For negotiating contracts, the government could play an important role by setting the basic standards on wages for different categories of workers and different destination countries, other conditions of work, such as weekly time off, health care, and care in case of emergencies, insurance against accidents, and so on. Government could use such model contracts to arrive at bilateral agreements and memorandums of understanding with other countries. Although such agreements are not a complete solution to all the issues involved in labor migration, they can be a useful instrument for protecting the rights of workers to a large extent.
Where bilateral agreements or memorandums of understanding do not exist, the government could still provide basic guidelines for negotiation of contracts with prospective employers in different countries, which recruitment agencies could use and that could provide prospective migrants a point of reference. In the destination countries, the labor wings section of embassies of Bangladesh, could be important in minimizing (if not completely eliminating) abuse of workers and rights violations. But to achieve the desired results, those offices would have to be strengthened in quantity and quality, that is, by increasing the number and improving the capability of responsible officials.
As mentioned already, few countries have ratified international conventions and instruments relating to international migration of workers, making it difficult to undertake and implement measures needed to provide protection to workers against possible exploitation and abuses. But they could be used as a basis for agreeing on frameworks for guiding orderly, humane, and safe migration for work. One example, the MFLM adopted in 2005, is a global framework of principles, guidelines, and good practices on a rights-based approach to labor migration. Although nonbinding, its basic principles and guidelines could be used as a basis for specific guidelines in bilateral
____________________77 Prospective migrant workers also need to be alerted about possibility for abuse and other dangers in destination countries.

75
Overseas Employment of Bangladeshi Workers: Trends, Prospects, and Challenges
agreements. Moreover, Bangladesh, along with other labor-sending countries, could lobby for standard frameworks for employment in destination countries that would be binding on employers.
It must be clear from the above description that the act of international migration for employment overseas is difficult and, likewise, managing the process can be quite complex. The complexity of the task of governance and management can be gauged from the simple fact that the relevant players are located all over the country of origin and the countries of destination, and hence are subject to the situation and rules and regulations of different countries.
A large number of players are involved. At the highest level, the Ministry of Expatriates’ Welfare and Overseas Employment oversees the whole process, and especially for handling political instruments like bilateral agreements and memorandums of understanding. The BMET is responsible for managing and regulating overseas employment. The Wage Earners’ Welfare Board is mandated to provide services to migrant workers that include predeparture briefing, scholarship for workers’ children, and grants for deceased workers’ families. In regulations, the Overseas Employment and Migrants Act 2013 and the Overseas Employment Policy draft of 2014 provide measures and actions that are needed to regulate the whole process and protect the rights of migrant workers. And yet, serious challenges remain, especially with regard to rights and welfare. One possibly relevant question is whether a case exists for a dedicated office for the task.
In this, it is important to note that the issues of rights and welfare of migrant workers cannot be attached to a particular stage in the “tree” depicting migration (Figure 4.9). They cut across all stages, and different actors are involved in different stages. Hence, it would be difficult, if not impossible, for a single agency to handle the task. What is required is to have a strong and efficient coordination mechanism that will ensure that the actors at various stages perform their tasks properly—at least as well as they can within the constraints they face. Without undertaking a careful review and functioning of the various units
of the Ministry of Expatriates’ Welfare and Overseas Employment and BMET, it will be unwise to provide any specific suggestion in this regard.78 However, based on the division of work and functioning of the various wings of the ministry and of BMET, a few observations may be made.
First, BMET’s mandate to manage migration for overseas employment can be broadened to include, in addition to regulation, provision of information, awareness raising about various aspects of migration, and facilitation. The tasks relating to information and awareness-raising could be particularly assigned to the district employment and manpower offices. The latter could forge links as appropriate with grassroots organizations in carrying out their tasks relating to information dissemination and awareness raising. The district employment and manpower offices could also link training providers, graduates from training institutes, and the recruiting agencies.
At the stage of matching demand for workers from destination countries and the job seekers from Bangladesh, BMET could forge a kind of public–private partnership in which each partner could take up tasks according to its comparative advantage. Based on experience gathered by the recruitment agencies, they may be in a good position to procure demand for workers from countries of destination. This expertise could be tapped in cases where there is no G2G arrangement. In situations with G2G or G2G plus arrangements also, the recruitment agencies could play a role, which may be identified through consultation so that the whole process could be turned into a win-win process for all partners.
At the level of the ministry, the “employment wing” needs to play the critical role of liaising with the destination countries at the policy level and undertake tasks relating to the conclusion of bilateral agreements and memorandums of understanding as well as of ensuring the optimum utilization of the labor wing in the Bangladesh missions in the destination countries.
Given all these tasks (and many more if one goes into detail), how could the coordination mechanism work? In answering, it is possible to adopt either an
____________________78 A review of BMET has already been undertaken and the report is under consideration.

76
Bangladesh: Looking beyond Garments
administrative or technical approach. In the former, the task of coordination would be allocated to the unit administratively suitable for the job. But in the latter, the task could be allocated on the basis of technical suitability. For example, it could be argued that in the whole process “tree,” the critical aspect from the point of view of protecting the rights of workers are agreements between the sending and the destination countries and the employment contract that provides the basis for workers to migrate for a job. These are tasks that are undertaken at the level of the ministry. On the other hand, tasks relating to the implementation and monitoring of employment contracts can be undertaken by the labor wing of the missions, which in turn can be coordinated by the ministry. In the domestic part of the migration “tree,” BMET has responsibility for much of the process, and hence would be in a good position to coordinate the relevant tasks. One is thus faced with a twin-engine aircraft type situation, and the need for an efficient pilot to fly it. The minister himself could perform this role through a “coordination office.”
Various international and regional forums also play an important role in the governance of international migration of workers. While international forums are provided by the United Nations and other international agencies, such as the ILO and the IOM, regional forums such as the Colombo Process and the Abu Dhabi Dialogue provide opportunities for the sending and receiving countries to coordinate policies.
The Colombo Process, which began in 2003, provides opportunities for policy coordination by labor-sending countries. The Abu Dhabi Dialogue provides a framework for cooperation among both sending and receiving countries (of the Gulf Cooperation Council) throughout the cycle of overseas employment. These forums could be used for agreeing general principles and frameworks that can be used in bilateral negotiations.
To strengthen Bangladesh’s voice in such forums, however, it would be necessary to better prepare necessary background information and analysis. Stronger research and analysis (see section 4.7) may be useful in that context as well.
4.7 Conclusion
As is clear, overseas employment and remittances play a major role in the Bangladesh economy. It provides valuable jobs for absorbing a burgeoning labor force and the remittances migrants send home are important for building up foreign exchange reserves and helping to balance the external account as well as for household economies left behind (in meeting current consumption expenditures, improving housing, and in building assets).
In the number of workers finding jobs abroad, the long-term trend is positive, with some fluctuation. In recent years, the annual flow of migrant workers has been around half a million, or over a fifth of the annual addition to the labor force of the country.
While people from Bangladesh migrate to many countries, a small number of countries account for a major proportion of short-term migration for work. Bahrain, Kuwait, Malaysia, Oman, Qatar, Saudi Arabia, Singapore, and the UAE accounted for over 95% of such migration up to 2005. But in recent years, the composition of destination countries has changed, and the “major eight” accounted for 74% of the flow of migrant workers in 2014. Within the eight, flows to Malaysia, Saudi Arabia, and the UAE have declined significantly in recent years, while Bahrain and Qatar have emerged as major destinations. For female migrant workers, Jordan and Lebanon are the major destination countries.
Most migrant workers are young men with low levels of education. Although the number of women going abroad with jobs has increased in recent years, as a proportion of the total, it remains small. Most migrant workers are below 40 years old (for women, more than half are below 30). A majority of them (that is, all migrant workers) have low levels of education (below Secondary School Certificate [SSC]), and another fifth completed SSC or Higher Secondary Certificate. Graduates account for just over 5% of the total.
Among factors driving migration, although the usual perception is that poverty acts as the major force, the reality is more complex. The probability of migrant

77
Overseas Employment of Bangladeshi Workers: Trends, Prospects, and Challenges
workers belonging to upper-income groups is lower than for lower-income groups, but the poorest cannot afford the high cost of migration. The real factors driving migration appear to be the lack of employment opportunities within the country and an aspiration for higher incomes and better living.
Remittances sent by migrant workers represented about 8% of GDP in 2014–2015, and 61% of the foreign exchange reserve in that year. They also play a major role in offsetting the deficit in the trade account and in balancing the overall external account of the country. In households, although a significant part of remittances is used to repay loans taken by the migrant worker for meeting the costs of migrating, they are basically used to meet the current expenditures of the households, to improve housing, and to build up assets. Allocations to education and health are usually small, although higher proportions of remittances sent by female migrants go to these items.
Looking at prospects for overseas employment, it should be possible for Bangladesh to increase the flow and send around 600,000 workers annually by 2020. That will of course depend on various factors such as the bilateral relationship between the major destination countries (the major eight), and on how the governance issues relating to migration management are addressed.
By skills, the majority of migrant workers are unskilled (or less skilled). The share of this category rose between 2005 and 2010 and declined thereafter. During 2010–2014, the proportion of semiskilled and skilled workers in the total number of migrant workers has increased. A common perception is that overseas employment of more skilled workers is desirable because their earnings will be higher, and hence, remittances per worker may also be higher. So, from the point of view of both household income and the macro economy, it may seem desirable to promote migration of skilled workers. But the positive relationship between remittances per worker and the level of education and skill and earnings of workers is not automatic. Moreover, production of skilled workers involves a cost, and in a country like Bangladesh, much of that cost is usually borne by the government in the form of subsidized training facilities in the public sector. Also
important would be to see that the migration of skilled workers does not lead to shortages and scarcities of important skills in the domestic economy. Hence, the case for encouraging overseas employment of more skilled workers is not so clear. It would be important to weigh the benefits and costs. That said, returning workers are likely to bring back skills they acquire while working abroad. This positive externality could be used through carefully designed programs. In addition, it may not be so easy for Bangladesh to raise the number of skilled workers for overseas employment.
One important factor that can influence what kind of workers a country can send to a destination country is the perception of potential employers in destination countries. While India and the Philippines are regarded as good sources of skilled workers, Bangladesh is considered a supplier of unskilled and semiskilled workers. Efforts (especially bilateral contacts and negotiations) will be needed to change this perception. A major element in the discourse on overseas employment in Bangladesh is the high costs migrant workers face in going abroad, much higher than in other countries of South Asia. While a migrant worker from Bangladesh could pay around $3,000 for landing a job in a country in the Middle East, the corresponding costs in India are about $2,000 and in Sri Lanka about $1,000. In Bangladesh, as noted, the cost per worker is about 4.5 times per capita GDP of the country against a figure of just a quarter of GDP per capita for a migrant worker from Sri Lanka.
Also common are fraudulent practices, substitution of contract (with one involving much worse terms and conditions than promised) in destination countries, unacceptable conditions of work and living. It is important to note that a very high proportion of this cost (around 88%) is accounted for by so-called facilitators. Hence, any efforts to reduce the cost of migration and address the issue of exploitation would have to focus primarily on this aspect.
Of course, abuse and exploitation of migrant workers occur at different stages in the cycle of migration, and it would take major effort to even minimize (not to speak of completely eliminating) such evils. This study recommends ways to work toward those goals, covering various stages of the migration cycle.

78
Bangladesh: Looking beyond Garments
At the grassroots level, where the migration process starts, district employment and manpower offices could work with nongovernment organizations and community-based organizations to provide alternative sources of information and raise awareness about various issues relating to overseas employment. But that would likely be inadequate, because those desperate for jobs abroad may still be prepared to pay the local subagents who promise employment. District employment and manpower offices could function as alternatives to subagents by helping prospective migrants link up with recruitment agencies with good track records. In other words, a kind of public–private partnership may be tried as an alternative to the current exploitative and expensive system.
At a higher level, BMET could work with recruitment agencies with long experience of procuring demand for workers and develop a system of recruitment that would minimize (and eventually eliminate) the role of subagents.
The role and functioning of the Labour Wing sections in Bangladesh embassies in countries of destination need to be made stronger and more effective in dealing with the implementation of contracts.
Although the ILO Multilateral Framework on Labour Migration is nonbinding, the basic principles and guidelines enshrined in the framework could be used as a basis for specific guidelines in bilateral agreements.
Collection and analysis of data and information on various aspects of overseas employment are important for efficient management of the process
and adoption of appropriate policies. Hence, it is important to strengthen research in this field. Such research and investigative work should cover, among other things, monitoring and analysis of labor markets (including the broad direction and skill composition) in prospective labor-receiving countries, monitoring of domestic labor supply in various skill categories, ways of linking skill providers with recruitment for overseas employment, flow of remittances and their utilization, monitoring and analysis of return migration including reintegration of returning workers in the domestic labor market, use of their savings and skills, and so on.
Also useful would be to link the database on aspiring migrant workers that the BMET has created with recruitment and potential employers. Efforts should be made to strengthen the research cell already established by the Ministry of Expatriates’ Welfare and Overseas Employment and improve its capacity to undertake this research. Links may be established with national research institutions (such as the Bangladesh Institute of Development Studies) as well as international donors like the Asian Development Bank, the World Bank, the ILO, and other bilateral donors.
Given the dispersion of relevant actors over different countries and throughout the countries at both ends, and the number of government agencies involved in managing migration, a strong mechanism for coordination is critical. This study takes the view that instead of setting up a new office for managing migration, a stronger coordination mechanism and strengthening of the existing setups could be used as a mechanism for protecting the rights and welfare of migrant workers.

79
Skills Development
Chapter 5Skills Development
5.1 Introduction
This chapter considers issues relating to education and skills development in Bangladesh. It focuses on technical and vocational education and training (TVET) and tertiary education, with a more limited discussion of general education. Section 5.2 provides relevant background on demographics and the current educational attainment of the workforce. Section 5.3 examines the structure of the educational system and briefly considers governance issues. Despite tremendous progress in increasing enrollment in primary and secondary schools, issues remain in access and equity. In this context, section 5.4 examines the extent to which skills and education provision match current and future needs of the labor market. To better evaluate the role education is playing in the economy, section 5.5 considers returns to education. While great progress has been made in the volume of education, significant questions remain regarding the quality and relevance of education; section 5.6 addresses these issues. Section 5.7 concludes and draws together several policy priorities.
5.2 Education and the People of BangladeshBangladesh is now experiencing a demographic dividend: a period with a proportionally large working-age population resulting from the rapid fall in birth
5.1 Introduction
Skills development and the development of human capital are critical for any economy: it is people and their knowledge, after all, that create all the goods in the world. But two features of the Bangladeshi economy make these specially important. The first is that the economy is beginning a transformation that will require it to move away from its current mode of combining traditional forms of production and exchange with a more modern sector focused on ready-made garments (RMGs). Chapter 3 already examined possible paths to diversification. But, whatever the eventual nature of a more diverse Bangladeshi economy, it is clear that it will require higher levels of education and more and different skills.
The second is that the skills and education are also of immediate concern because Bangladesh’s “demographic dividend,” created by a rapid fall in birth rates combined with a relatively small population of the elderly has created a proportionately very large working-age cohort. While boosting the country’s productivity, it also puts pressure on the educational system: the largest cohorts are in school now. Failure to educate them adequately will mean that the overall labor force may be inadequate for a modernized economy for decades to come.

80
Bangladesh: Looking beyond Garments
rates since the 1970s. In 1974, total fertility stood at 7.3, while by 2013 it had plummeted to only 2.2 (World Bank 2013b).
The large working-age population has resulted from relatively short life expectancies in the past and these lower birth rates. In 1989, people aged 15–64 made up only 54% of the population. By 2016, this share was estimated to be 66% and was forecast to continue to rise to 69% by 2022 and to stay in a narrow 69%–70% band all the way through 2044 (United Nations 2015).
In short, the large working-age population means that if there are decent employment possibilities, Bangladesh can be more productive in aggregate, with more people contributing to overall economic activity.
Figure 5.1 presents the demographic pyramid based on the 2011 census. The rapid transition has led to relatively large youth cohorts that have entered or will soon enter the workforce. The largest single 5-year age cohort, ages 5–9 in 2011, will be entering the labor force in just a few years from now.
Yet, even though this provides a great opportunity, it also creates a critical moment for improving the
quality of the labor force. With large cohorts preparing to enter the workforce and smaller cohorts coming behind, there is a special need to improve the quality and quantity of education and skills training more quickly. The large groups of Bangladeshi children and youth that will enter the labor force over the next decade will make up a large proportion of the workforce for decades to come. Subsequent cohorts will fall in size, making the upgrading of average workforce skills more difficult.
Table 5.1 contains basic information about the education of the Bangladeshi labor force. A little over one-fifth of the labor force has no formal education whatsoever, with a similar rate for men and for women. Another quarter of the labor force has received only some years of primary education, while around 30% has made it to secondary school. The remaining fifth of the labor force has attended upper secondary school or above, with just over 6% having received tertiary education. Overall educational attainment is higher for men in the labor force, with the largest proportional gender differences at the highest levels of education. Note that because this tabulation is only for the labor force, and because labor force participation is much lower for women than for men, the women represented here are somewhat better educated than the population as a whole. The gender differences reflect historic patterns of educational enrollment: gender parity in enrollment was achieved several years ago, through the upper secondary level, as will be discussed further in Chapter 6. Indeed, the labor force as a whole is somewhat better educated than the general population: overall, 26% of the population has received no education, while a further 30% have only some primary education. Nonetheless, for women, the difference in education between the general population and the labor force is large, because of different patterns in labor force participation.
These figures show that, consistent with Bangladesh’s overall level of economic development, the workforce has relatively low levels of education. As discussed in section 5.5, many Bangladeshis are employed in jobs where, by some measures, they do not have education adequate to their employment, with expected costs in terms of worker productivity. Unsurprisingly,
Figure 5.1: Demographic Pyramid, 2011 (%)
Source: Bangladesh Bureau of Statistics. 2011. Population and Housing Census. Dhaka.
0–4
65–6960–6455–5950–5445–4940–4435–3930–3425–2920–24
10–145–9
15–19
70+
Male Female
10 10
Age
Percent
8 86 64 42 20

81
Skills Development
educational attainment is lower on average in rural areas, with 58% of the labor force having no more than primary education. In urban areas, a substantial proportion, 15.3% of the workforce, has at least some tertiary education, though, as discussed in section 5.7, significant questions remain concerning the quality of education for many of these workers. Unfortunately, there are no systemic measures of the stock of individuals who have received skills training, or of the specific nature of any such training.
While the overall level of education of the workforce remains relatively low, it has improved tremendously in just a few years, as large young cohorts have entered the workforce and enrollment rates have increased dramatically. In 2010, 40% of the labor force had no education at all, while an additional 23% had only primary education, based on Labour Force Survey 2010 data. The proportion with higher secondary education also increased dramatically. Further, in 2010, the proportion with tertiary education was only 3.7%. These changes are enormous for a gap of only 3 years between the survey waves.
While some workers, especially those in more professional and technical positions, may be undereducated for their jobs, given the current enrollment rates and their ongoing improvements, the overall volume of education, at least in traditional academic forms, appears to be adequate for the current needs of the economy. As discussed in Chapter 2, the
economy remains focused on agriculture and relatively low-skilled manufacturing, especially of RMGs.
Significant issues remain regarding the quality and relevance of education, and are discussed in section 5.7. Naturally, if the Bangladeshi economy is to successfully diversify and move up the value chain, there will be concomitant increases in the skills and education required for the workforce. However, improving technical training may be a higher priority than expanding enrollment in general education, apart from guaranteeing access to the most disadvantaged, for whom school access remains a significant issue. Improving technical and scientific skills is also likely to speed the diffusion and adoption of more sophisticated technologies and, in this way, contribute to faster economic growth.
As discussed in Chapter 4, overseas labor and the associated remittances are of great importance to the Bangladeshi economy and the demand for overseas labor is an important component of labor force dynamics. In recent years, most overseas workers have been relatively poorly educated: over 2000–2010, on average, 57% of workers heading abroad were categorized by the Bureau of Manpower Employment and Training (BMET) as “less-skilled” or “unskilled.” Given the importance of overseas labor, improving the training of overseas workers could substantially increase the overall level of income in Bangladesh.
Although improving access and quality in general education will certainly be important, the focus in this chapter will primarily be on the TVET and tertiary educational systems, their performance, and the degree of access to these systems.
5.3 Structure of Education and Training SystemsWhile the structure of the general education system in Bangladesh is relatively simple, the system for TVET is complex and difficult to measure or evaluate in its entirety. The general education system is addressed first, then TVET.
Level of Education
Total Labor Force
Female Labor Force
Male Labor Force
Urban Labor Force
Rural Labor Force
None 21.2 21.3 21.2 5.7 27.3Primary (Class I–V) 28.2 33.5 25.9 21.6 30.8Secondary (Class VI–X)
30.4 29.0 31.1 36.2 28.2
Higher Secondary (Class XI–XII)
13.4 11.6 14.2 21.0 10.4
Tertiary (all degrees or diplomas)
6.3 4.3 7.2 15.3 2.8
Other/Unknown 0.4 0.4 0.5 0.2 0.5
Table 5.1: Education of the Labor Force, Aged 15 and Over (%)
Source: Analysis based on Bangladesh Bureau of Statistics. 2015. Labour Force Survey 2013. Dhaka.

82
Bangladesh: Looking beyond Garments
5.3.1. General education
Early childhood development has begun to become a formal component of the education system, although kindergarten in various forms has existed for many years. Globally, early childhood development has received much more attention since the adoption of the UNESCO Dakar Framework in 2000 and the widespread understanding that early childhood education is of special importance for the children of poor families. The National Education Policy of 2010 specified that “one-year preprimary schooling must be introduced for 5+ children. Later, this will be extended up to 4+ children.” By 2013, many public schools had added kindergarten, and the net enrollment in preprimary education for 5 years olds was 56% (Campe 2014).
Primary education consists of 5 years of formal schooling that are labeled as class, or grades, I through V, with a normal age of students from 6 to 11 years. Secondary education includes 7 years of formal schooling, divided into three groups: junior secondary school (grades VI–VIII) accounts for the first 3 years of secondary schooling; secondary schools (grades IX–X) is the next 2 years; followed by higher secondary (grades XI–XII).
Primary education comes under the jurisdiction of the Ministry of Primary and Mass Education, although the Directorate of Primary Education manages program implementation. Government operates about half of primary schools, accounting for some 58% of students (World Bank 2013a).
Madrassa schools are also important; some focus solely on Islamic religious education and others combine religious education with a general education conforming with government standards. Around 10% of primary school students attend madrassa schools, privately operated but under government supervision and that receive government funding. Additionally, some madrassa schools and non-registered private schools do not come under the purview of the Ministry of Primary and Mass Education. Schools operated by nongovernment organizations (NGOs) also play
a significant role, with more than 1 million primary school students enrolled in NGO-operated schools (World Bank 2013a). Of these, the Bangladesh Rural Advancement Committee, which operates more than 22,000 primary schools in the country, is the most important.
The structure of the secondary school system is quite different and is overseen by the Ministry of Education. Based on data from the Bangladesh Bureau of Educational Information and Statistics (BANBEIS), about 98% of secondary schools are nongovernment, accounting for 97% of student enrollment. Most receive financing from the Ministry of Education in a sort of public–private partnership model. Without ministry control, however, questions remain about the quality and uniformity of secondary education, particularly across regions and especially in the poorer ones. Fiscal and administrative functions are very much centralized, with the consequence that local level oversight is limited in some cases: visits from upazila secondary education officers to secondary schools typically occur only about once a year (World Bank 2013a).
5.3.2. Tertiary education
The Ministry of Education oversees tertiary education, as it does the secondary school system, while the University Grants Commission is responsible for quality standards in public universities. Of the latter, 37 such public institutions operate and are highly competitive.
Private universities were first permitted in 1992, meanwhile, and have proliferated rapidly, to the point where there are now 91 private universities, including some of dubious legality, according to the University Grants Commission.79 Many of these receive direct financial support from the government (World Bank 2014). Such rapid expansion of the private tertiary education sector naturally raises questions of quality. There is also a very large number of colleges, more than 2,000 including both government and nongovernment colleges that are affiliated with
____________________79 University Grants Commission of Bangladesh.http://www.ugc.gov.bd/en/home/ (accessed 5 January 2016).

83
Skills Development
the National University.80 These affiliated colleges account for a large majority of those enrolled in tertiary education in Bangladesh, though only a small minority grant Bachelor’s degrees (World Bank 2014). Curriculums for the affiliated colleges are designed centrally, at the National University.
5.3.3. Technical and vocational education and training
The TVET system is complex, as is its management, although it makes up a relatively small part of the overall educational system, at least in its formal version. Formal TVET education can be divided into three levels:
The basic training program focuses on manual skills. Such courses last between 3 and 6 months, with 360 hours of total instruction. The basic training program requires a minimum of eighth grade education, though with a waiver for those with 1 year of experience specific to the trade of the particular program. A patchwork of different institutions offers programs under the basic training program. These include technical training centers operated by the BMET, technical school and colleges, of which there are 64 in all districts, as well as polytechnic institutes and private institutions, and some programs operated by NGOs.
The second (certificate) level of TVET, consists largely of programs for the Secondary School Certificate in vocational programs (SSC Vocational) and additional 2-year program to earn a Higher Secondary Certificate in vocational. These can be thought of as vocational alternatives to the general education stream in secondary education. The entry requirement for SSC Vocational is eighth grade and for Higher Secondary Certificate in vocational, completion of SSC Vocational.
The third level of TVET is the diploma level, consisting of various 4-year, postsecondary programs largely offered at polytechnic institutes, both public and private. These programs focus primarily on
engineering and would in some countries be classified as tertiary education rather than TVET.
The Bangladesh Technical Education Board, under the Ministry of Education, is the lead body for quality assurance and is involved in multiple aspects of the administration of TVET nationally, including accreditation of providers, curriculum development, examination design, and skills certification. The board is not the overall manager of TVET provision, however, with many different ministries and agencies providing this within the formal system. Among the important providers of TVET are the BMET under the Ministry of Expatriates’ Welfare and Overseas Employment (focused on training for overseas workers), the Directorate of Technical Education in the Ministry of Education, as well as the Ministry of Youth and Sports. Altogether, some 20 ministries and departments deliver skills training of one sort or another.
A relatively recent addition to the TVET system in Bangladesh is the National Skills Development Council (NSDC), formed in 2008 and reactivated in 2011 to perform a centralized coordination and policy-making role among the TVET providers. Given the large number of ministries and bodies involved in TVET, it is hoped that the addition of a coordinating body will help add clarity to the policy formulation and implementation processes, which was part of the rationale for forming it.
The NSDC is a tripartite entity, with representatives from government, employers, and workers, and is headed by the Prime Minister. It holds at least one meeting a year, is intended more for consultation and broad policy direction than for routine management of the TVET system, and is supported by a secretariat intended to deal more with policy implementation. For the moment, however, the secretariat has a very large coordination job, but rather limited resources for carrying out that function. It is as yet unclear whether it has the power to effectively implement coordination among the responsible bodies.
In 2011, about 388,000 students were enrolled in basic, secondary, and postsecondary TVET programs,
____________________80 Based on college listings provided by the National University.

84
Bangladesh: Looking beyond Garments
less than 3% of students enrolled in general secondary education, making it a relatively small component of the educational system (ADB 2015b).81 This enrollment rate is very low compared with other countries in Asia that have had both rapid growth and technical education programs that are held in generally high regard. For example, in 1990, 35% of Republic of Korea high school students were in technical or vocational high schools.82 In the People’s Republic of China (PRC), in 2001, the proportion in technical secondary education was above 40% and has risen since then (Shi 2012). Although still very low compared with the PRC and the Republic of Korea, India’s TVET enrollment is still nearly double Bangladesh’s (Singh 2012).
In line with the enrollment figures, expenditures for TVET accounted for about 2.6% of the total education budget, including BMET expenditures and for monthly payment orders (government payments to private educational institutions involved in TVET).
Private training facilities are important to the TVET system. Most courses under the basic training program as well as most SSC Vocational and diploma programs are offered through private institutions. For the SSC Vocational, this is in keeping with the system for general education, with private provision of education but public funding. For SSC Vocational, however, government schools, accounting for 21% of enrollment in 2011, are actually more important than in the general education stream (ADB 2015b). Public funding is provided largely through monthly payment orders that cover teacher salaries.
In addition to the formal TVET system, an extensive system of nonformal technical education that, in essence, covers all technical education not accredited by the Bangladesh Technical Education Board. Many providers, however, offer preparation keyed to skills certification through the Bangladesh Technical Education Board. While some of these programs are highly structured and have well-organized curriculums, the sheer number and variety of such programs
make broad assessment difficult. Such programs are generally for less than 1 year, and may be much shorter. Some are targeted specifically at those looking for overseas employment and are affiliated with overseas employment agencies. The total number of providers of nonformal TVET appears to be unknown; the NSDC secretariat announced a TVET provider census, with data to be collected in 2015, but results are not yet available. More than 4,000 institutions offer TVET in one form or another according to the BANBEIS education database,83 or possibly more than 5,000 (ADB 2015b). In 2014, total enrollment in all forms of TVET, formal and nonformal was about 690,000.
Historically, the linkage between the TVET system and private industry has been relatively weak, making it difficult for the system to adequately supply the skills demanded in the job market. Nonetheless, several innovations in recent years have attempted to bridge the gap between government-run TVET programs and the market demands for skills. Establishment of a number of industry skills councils (ISCs) is one.84
The ISCs now participate in monitoring skill development practices, providing advice to the government on skill development needs. They also support the professional development of TVET instructors and to improve partnerships between industry and other training organizations. But the ISCs were largely created through donor initiatives and it is not yet clear whether sustainable funding for all ISCs or for expanding coverage to other industries is likely. Further, the current number of ISCs may be inadequate to future needs; some experts have put the desirable number at around 40.
Another initiative involves four Centres of Excellence established in the leather, agro-food, tourism, and RMG industries. These centers are intended to provide specific industry-centered training initiatives, with a mix of industry, donor, and government funding. Many stakeholders say they hold the leather sector Centre of Excellence in particularly high regard. The
____________________81 Another study places the share of TVET enrollment as compared with general secondary education at 1.1% (Campe 2013).82 Calculation based on data in Chae and Chung (2009).83 BANBEIS. Education and Statistics. http://www.banbeis.gov.bd/db_bb.htm (accessed 16 January 2016).84 Different counts are available of the number of ISCs operating in Bangladesh. One recent report counts 5 ISCs and 4 sector working committees, which serve
similar roles (ADB 2015b) and may sometimes be conflated. Other sources report 11 or 12 ISCs. It is likely that the number of fully operating ISC-type organizations is 9, but that others are in various stages of development.

85
Skills Development
center for the RMG sector also brings in an element of enterprise-based training, with some of it conducted inside associated factories.
The Centres of Excellence provide one model for direct industry participation in TVET and lessons are being learned that can be applied in other industries. Other successful examples of public–private partnerships in skills provision, include the Chittagong Skills Development Center; the BGMEA Institute of Fashion Technology; and the National Institute of Textile Training, Research and Design.
All these initiatives are important advances in linking the TVET system to industry and to market demands, yet publicly operated TVET institutions still do not normally consult employers in preparing and updating standards and there are no routine mechanisms for analyzing the state of labor market demand. Curriculums are generally modified only slowly, in part because of laborious administrative requirements and extended training programs for instructors (ADB 2015b).
In recent years, there has been substantial work on policy for developing and improving TVET in Bangladesh. At least five different current plans or policy statements involve TVET, notably the Education Policy 2010 and the National Skills Development Policy 2011. The policy also has a gender equality plan and a plan for people with disabilities.
The Education Policy largely focuses on expansion of existing TVET models, and indeed the number of students enrolled in TVET programs between 2010 and 2014 increased significantly. The National Skills Development Policy, meanwhile, calls for a more demand-oriented approach to TVET provision and specifies roles for industry in the TVET process. Policy documents, however, have tended to focus on targets and goals, while leaving details of implementation and specific policy proposals for later development. A significant part of the development
and implementation of innovative measures in TVET in recent years has been donor supported.85
One problem with the formal TVET system historically has been the requirement of the completion of 8th grade before admission. Most members of the Bangladeshi labor force have not completed 8th grade, so that this requirement has limited the demand for formal TVET programs and meant that some students that did attend were not interested in pursuing technical careers in the long term. Progress has been made, however, in recognizing prior learning, allowing students to enter the formal TVET stream based on job experience or on practical examinations. As of 2015, it does not appear that implementation was complete, but this new system will likely improve accessibility to formal TVET, especially for more economically disadvantaged students. The length of formal TVET programs, at least 2 years, apart from the basic courses, may also have discouraged participation in technical education among poorer students and workers, who may find forgoing years of labor income burdensome, even though direct costs are typically low.
Significant progress has been made on the National Technical and Vocational Qualifications Framework. The framework is the basis for implementing the National Skills Quality Assurance System, a systematic qualification system intended to provide nationally recognized standards for the training currently provided by many thousands of TVET providers that are not well regulated, as well as for qualifying workers. All TVET providers will ultimately be required to meet the requirements for registration under the National Skills Quality Assurance System. No systematic summary has apparently been made of the progress to date in implementing the framework. Although hopes have been expressed that the framework could assist in creating internationally recognizable qualifications, it is a set of national standards, not an international standard, so that it may be difficult to educate employers of Bangladeshi overseas workers to recognize the associated certifications.
____________________85 ADB (2015b) provides a summary of some of the many donor-supported TVET projects in Bangladesh. The ADB, the ILO, and the World Bank have been
particularly active in this area over a number of years.
86
Bangladesh: Looking beyond Garments
5.4 Access to Skills Training and Higher Education5.4.1 Technical and Vocational Education and Training
There does not appear to be any recent systematic measure of how many Bangladeshis have received technical or skills training. However, the Bangladesh Bureau of Statistics’ Labour Force Survey (LFS) does ask surveyed households if any members have received training in the past 12 months, and the answers provide a fairly detailed picture of the flow of people into training. There is also historical enrollment data for TVET and this will be discussed later in this section.
The 2013 LFS data indicate that more than 5.7 million Bangladeshis age 15 and over had received training of some type during the previous year, or about 5.4% of that population: given more than 500,000 enrolled in formal skills training in 2011 (BANBEIS Education and Statistics) the vast majority of these workers must have received nonformal skills training.86 However, that broad calculation includes many Bangladeshis who are not in the labor force and are unlikely to join; it also includes many older workers less likely to be looking to acquire new skills for the workplace. Considering only members of the labor force aged 16 to 34, this group accounts for 67% of all individuals who received training. Inside this group, the proportion receiving training is substantial: 13.5% of men received training, as did 9.3% of women. The gap between men and women is significant, especially since this is restricted to the labor force and the labor force participation rate is much lower for women than it is for men; concentrating on this age group, but including all women, not just those in the labor force, only 4.7% of women had received training in the previous 12 months. This is especially significant as additional training may help women gain skills that would allow them to enter the workforce and, as is discussed in Chapter 6, expanding the female labor force could be a significant contributor to inclusive growth in Bangladesh.
TVET has expanded rapidly in Bangladesh over the last 15 years. The LFS data provide detailed information concerning the recent flow of those receiving training, but cannot provide historical perspective; that can be provided by overall enrollment figures that are published by BANBEIS (BANBEIS Education and Statistics database).87 In 2000 only 110,000 people enrolled in formal TVET programs, but 448,000 by 2010 and 690,000 by 2014, the most recent year with data. The share of women in TVET enrollment has been and remains low, holding largely to the 24%–25% range throughout the 2000s and rising modestly to 27% in recent years. Notably, the proportion of women trained at public institutions is even lower, at 16% in 2014. The lack of improvement in women’s share of TVET instruction is especially striking given the rise in female labor force participation (FLFP) over this period.
There are also important regional variations in the provision of training. Table 5.2 shows the percentage of the labor force who had received training in the previous 12 months, with the greatest provision in Dhaka (9.9%) and Chittagong (8.4%). Those living in the more rural divisions were less likely to have received training, with the lowest rate being 5.8% in Rangpur. More generally, those in rural areas received much less training: in the general population, the proportion receiving training in urban areas was more than two and a half times higher than in rural areas. While it is not immediately obvious how much of this gap comes from the demand for training as opposed to the supply, it is certainly the case that in general there are more training facilities in urban areas than in rural areas. Further, the greater population density in urban areas necessarily means that, on average, workers will be closer to training facilities, making obtaining training less expensive and more convenient.
A large number of Bangladeshis in the workforce receive training, but the definition of “training” in the LFS is broad: it includes everything from very brief courses through to postgraduate study. Table 5.3 breaks down training received by length of training to
____________________86 It is also possible that, although the questionnaire specifically asks about training received in the last 12 months, respondents are answering more broadly, given
the magnitude of the measured flow into training.87 BANBEIS. Education and Statistics. http://www.banbeis.gov.bd/db_bb.htm (accessed 16 January 2016).

87
Skills Development
help understand the nature of the training received. Training was nearly evenly split between courses of 4 weeks or shorter and those of longer duration. About one quarter of trainees received at least 3 months of training. From these figures it can be seen that although many members of the labor force receive only brief training, a very substantial number are also receiving more extensive training.
As discussed above, there are many different types of training providers in Bangladesh, including private institutions, government institutions operated by a variety of ministries, as well as local and international NGOs. Displayed in Table 5.4 is the distribution of training source based on the number of individuals to whom training had been provided in the previous 12 months.88
The majority (59.3%) of people who received training received it from private institutions while another 22.4% received training from government institutions. It is possible that this understates the true contribution
of government training to some extent, as the BMET is a major source of government-provided training, but is focused on international migrant workers: to the extent that such workers are not present in the country to be surveyed, such training may be undercounted. It is also possible that respondents sometimes identified government-registered institutions that are privately operated as government institutions. Further, as discussed above, many NGOs provide different forms of training. Training by NGOs accounted for 11% of all trainees; but there is a substantial difference between men and women, with NGOs accounting for 16.8% of female trainees, but only 8.6% of male trainees. Despite this proportional difference, because of the much greater overall number of male trainees, NGOs still train more men than women. Thus, while NGOs focus more on the provision of technical skills to women than do other sorts of institutions, the focus is only relative. Other types of institutions account for the balance of about 7% of trainees. While government institutions are only one component of the overall training system and provide training only to a minority of students, they are more important in providing in-depth training; more than 40% of training lasting 3 months or longer was provided by government institutions.
One component of evaluating the economic significance and effectiveness of TVET in Bangladesh is to examine whether the training obtained is consistent with the present pattern of economic development and with the needs of economic diversification. To help address this question, Table 5.5 contains the
____________________88 Note that this may be quite different from the breakdown by number of individuals in training at any given time because of differing lengths of training. Over
the course of 12 months, one seat in a 1-month training course could be filled by 12 different individuals, all of whom would be enumerated (on a sampled basis) under the LFS. A 12-month program would only have one person. Unfortunately, the data do not allow for a comparison to the breakdown by provider of training enrollment at any given point in time.
Percentage Who Have Received Training
Barisal 8.0%Chittagong 8.4%Dhaka 9.9%Khulna 6.9%Rajshahi 7.2%Rangpur 5.8%Sylhet 7.9%
Length of Training Trainees (%)
Less than 1 Week 5.61–2 Weeks 28.42–4 Weeks 16.71–3 Months 22.23–6 Months 19.4More than 6 Months 7.7
Table 5.2: Training Received in Previous 12 Months
Table 5.3: Length of Training Received in Previous 12 Months
Table 5.4: Source of Training Received in Previous 12 Months (%)
Source: Analysis of Bangladesh Bureau of Statistics. 2015. Labour Force Survey 2013. Dhaka.
Source: Analysis of Bangladesh Bureau of Statistics. 2015. Labour Force Survey 2013. Dhaka.
Source: Analysis of Bangladesh Bureau of Statistics. 2015. Labour Force Survey 2013. Dhaka.
Overall Trained
Women Trained
Men Trained
Government Institute 22.4 23.9 21.7Private Institution 59.3 51.6 62.5Nongovernment Organization 11.0 16.8 8.6Foreign Institute 0.5 0.5 0.5Joint Venture 3.5 4.0 3.3Other Institutes 3.2 3.2 3.2
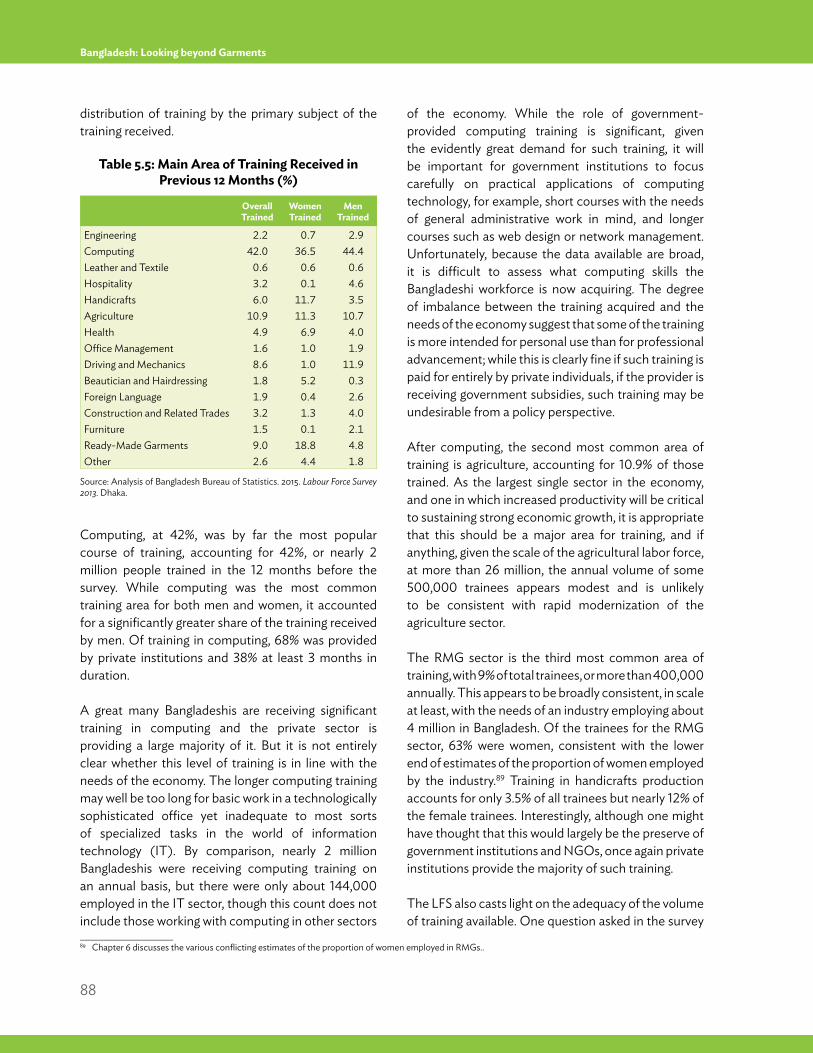
88
Bangladesh: Looking beyond Garments
____________________89 Chapter 6 discusses the various conflicting estimates of the proportion of women employed in RMGs..
distribution of training by the primary subject of the training received.
Computing, at 42%, was by far the most popular course of training, accounting for 42%, or nearly 2 million people trained in the 12 months before the survey. While computing was the most common training area for both men and women, it accounted for a significantly greater share of the training received by men. Of training in computing, 68% was provided by private institutions and 38% at least 3 months in duration.
A great many Bangladeshis are receiving significant training in computing and the private sector is providing a large majority of it. But it is not entirely clear whether this level of training is in line with the needs of the economy. The longer computing training may well be too long for basic work in a technologically sophisticated office yet inadequate to most sorts of specialized tasks in the world of information technology (IT). By comparison, nearly 2 million Bangladeshis were receiving computing training on an annual basis, but there were only about 144,000 employed in the IT sector, though this count does not include those working with computing in other sectors
of the economy. While the role of government-provided computing training is significant, given the evidently great demand for such training, it will be important for government institutions to focus carefully on practical applications of computing technology, for example, short courses with the needs of general administrative work in mind, and longer courses such as web design or network management. Unfortunately, because the data available are broad, it is difficult to assess what computing skills the Bangladeshi workforce is now acquiring. The degree of imbalance between the training acquired and the needs of the economy suggest that some of the training is more intended for personal use than for professional advancement; while this is clearly fine if such training is paid for entirely by private individuals, if the provider is receiving government subsidies, such training may be undesirable from a policy perspective.
After computing, the second most common area of training is agriculture, accounting for 10.9% of those trained. As the largest single sector in the economy, and one in which increased productivity will be critical to sustaining strong economic growth, it is appropriate that this should be a major area for training, and if anything, given the scale of the agricultural labor force, at more than 26 million, the annual volume of some 500,000 trainees appears modest and is unlikely to be consistent with rapid modernization of the agriculture sector.
The RMG sector is the third most common area of training, with 9% of total trainees, or more than 400,000 annually. This appears to be broadly consistent, in scale at least, with the needs of an industry employing about 4 million in Bangladesh. Of the trainees for the RMG sector, 63% were women, consistent with the lower end of estimates of the proportion of women employed by the industry.89 Training in handicrafts production accounts for only 3.5% of all trainees but nearly 12% of the female trainees. Interestingly, although one might have thought that this would largely be the preserve of government institutions and NGOs, once again private institutions provide the majority of such training.
The LFS also casts light on the adequacy of the volume of training available. One question asked in the survey
Table 5.5: Main Area of Training Received in Previous 12 Months (%)
Source: Analysis of Bangladesh Bureau of Statistics. 2015. Labour Force Survey 2013. Dhaka.
Overall Trained
Women Trained
Men Trained
Engineering 2.2 0.7 2.9Computing 42.0 36.5 44.4Leather and Textile 0.6 0.6 0.6Hospitality 3.2 0.1 4.6Handicrafts 6.0 11.7 3.5Agriculture 10.9 11.3 10.7Health 4.9 6.9 4.0Office Management 1.6 1.0 1.9Driving and Mechanics 8.6 1.0 11.9Beautician and Hairdressing 1.8 5.2 0.3Foreign Language 1.9 0.4 2.6Construction and Related Trades 3.2 1.3 4.0Furniture 1.5 0.1 2.1Ready-Made Garments 9.0 18.8 4.8Other 2.6 4.4 1.8

89
Skills Development
concerns whether individuals in surveyed households want training in any particular area. The answer must be considered advisedly, because it may represent mere whim for some: it is easy to say one wants to become an engineer, but rather more difficult to actually do so. However, the clear correlation between answers given and other factors that will be discussed below indicate that responses to this question do contain valuable information.
Table 5.6 contains data, by division, on the proportion of the labor force expressing desire for training. First, it is important to note that a large majority of the Bangladeshi labor force expresses no desire for further training: only 20.3% of the labor force wants training.90 Such a low rate appears to indicate a lack of faith in the efficacy of available training, a lack of adequate information, or both.
Comparison with Table 5.2 provides some insight into the structure of training availability: Rangpur division, with the smallest proportion of workers receiving training, is also the division with the largest proportion of people who would like to receive training; this strongly suggests that the current level of training provision is inadequate in Rangpur. The survey does not ask any follow-up questions about the reasons training has not been pursued if it is desired, so it is not clear from this evidence whether the barriers to receiving training are associated with location of training facilities, cost of training, or other factors. Dhaka division, in which the
highest proportion of workers received training, has relatively low implied demand for training, suggesting that the availability of training in the capital’s division is reasonable: about 2 years of the gross training flow would cover those desiring further training. Rajshahi division displays yet another pattern; a relatively low level of training provided, but also a low level of desire for training.
While individual desires for training may be based on limited information concerning the demands of the economy, they can still cast light on whether the training provided is responding to what workers consider valuable. Table 5.7 breaks down training wants by area of study.
Comparison with Table 5.5 shows substantial gaps between the areas of training being received and the areas of training desired. Computer training is the most desired area of study, as it is the most commonly received, but the proportion desiring such training is lower than the proportion receiving it, suggesting that the current training situation for computing skills may be reasonably adequate. By contrast, the proportion of workers wanting training in agriculture is substantially
Division %
Barisal 22.0Chittagong 22.6Dhaka 18.5Khulna 21.0Rajshahi 14.2Rangpur 30.0Sylhet 17.3
Area All Women Men
Engineering 1.3 0.5 2.1Computing 30.8 27.7 33.8Leather and Textile 0.4 0.2 0.6Hospitality 1.0 0.4 1.5Handicrafts 13.4 22.6 4.6Agriculture 15.1 4.9 24.9Health 1.9 1.8 2.0Office Management 1.5 0.7 2.3Driving and Mechanics 5.8 0.7 10.7Beautician and Hairdressing 1.8 3.2 0.4Foreign Language 1.2 0.4 2.0Construction and Related Trades 4.4 0.9 7.7Furniture 1.1 0.1 2.2Ready-Made Garments 19.1 35.0 3.8Other 1.2 0.9 1.4
Table 5.6: Labor Force Wanting Training of Any Type
Table 5.7: Main Area of Training Desired (%)
Source: Analysis of Bangladesh Bureau of Statistics. 2015. Labour Force Survey 2013. Dhaka.
Source: Analysis of Bangladesh Bureau of Statistics. 2015. Labour Force Survey 2013. Dhaka.
____________________90 The LFS results may understate the demand for training, because the survey respondent is in some cases answering as to the demands of other members of the
surveyed household. This potential source of inaccuracy naturally applies to other questions in multi-person households.

90
Bangladesh: Looking beyond Garments
greater than the proportion that receives such training, especially among men.
The demand for training related to the RMG sector is significantly larger than the proportion receiving such training. Indeed, RMG training is the single area of training most desired by women, accounting for 35% of implicit demand. Given that the RMG sector is by far the largest employment sector of female regular employees, this demand is unsurprising. The fit between training supplied and training demanded for women is substantially worse than for men.91 At least in public institutions, the direct cost of obtaining vocational training is low. The direct costs present are in many cases offset by grants and stipends that are not means-tested (ADB 2015b). Indeed, in some cases, extra incentives may not need to be given to make training accessible. However, as noted, most TVET-providing institutions are private. For lower-income families, forgone earnings are the most important barrier to pursuing either formal TVET or general education. One study focused on TVET found that those earning more than $2.00 a day took up formal, longer-duration TVET at almost twice the rate of those earning less than $1.00 day (Campe 2013). The same study found that students incur substantially greater cost to take up formal TVET programs than for general education.
In 2012, the NSDC secretariat, in cooperation with the ILO, published its National Strategy for Promotion of Gender Equality in TVET, partly in response to historically low rates of female participation in TVET. As of 2014, this had not succeeded in increasing the share of women in TVET programs, likely because of lags in policy implementation.
5.4.2. Tertiary education
The LFS, since it looks at level of education, allows for a tabulation of members of the labor force who have gained tertiary education, by division. The figures in Table 5.8 indicate that, unsurprisingly, Dhaka division has the largest share of workers with tertiary education, at 8.1%. The Sylhet division has the lowest
share, with 3.7%. While these are very different figures, the huge difference by division in the share of workers with tertiary education versus those with the lowest education may not, without further information, necessarily mean a significant degree of difference in access to higher education by division. The observed patterns of location will also reflect demand for workers, so that those who have obtained education, in whatever location, may be more likely to locate in Dhaka for career reasons. One study, however, reports that more than 60% of tertiary education seats are available in the urban or semi-urban regions, while more than 65% of Bangladeshis live in rural areas (World Bank 2014). The lack of local sources for tertiary education is likely to be particularly restrictive for young women, as many rural families do not want to send their daughters so far away from home, even if the costs could feasibly be borne. Most of the public universities are located in the divisional towns and in the metropolitan cities.
Apart from regional access to higher education, access to higher education for women is also a potential issue. Table 5.9 includes counts of people with some form of higher education by age and sex. Note that, consistent with the notable expansion of private universities, the number of individuals receiving higher education has increased rapidly. The gender parity ratio has also improved rapidly: based on the LFS data, the 20–24 age group has very close to complete gender parity, though this result is very much inconsistent with BANBEIS enrollment data.92
Table 5.8: Tertiary Education in the Labor Force, by Division (%)
Source: Analysis of Bangladesh Bureau of Statistics. 2015. Labour Force Survey 2013. Dhaka.
____________________91 The difference between men and women in the fit of training provided compared with training desired is clear from comparison of the two tables, but can be
verified by comparing the mean squared differences for men and women.92 The School-to-Work Transition Survey actually finds more women with higher education than men;: see Toufique (2014), Table 3.2. It is unclear whether different
sampling structures, different questions, or both, account for the difference.
DivisionLabor Force Aged 15 or above
with Tertiary Education
Barisal 6.5Chittagong 4.7Dhaka 8.1Khulna 6.0Rajshahi 6.0Rangpur 5.2Sylhet 3.7

91
Skills Development
These data indicate that women made up only 41% of students enrolled in degree programs in colleges and universities in 2014 (calculation based on BANBEIS Education and Statistics database), so that there was an 18 percentage point gender gap. As women complete degrees at higher rates than men, this might account for some of the difference between survey data and enrollment data. Further, when attention is concentrated on universities, as opposed to colleges, the gender gap becomes even more pronounced: in 2014, only 30% of the students enrolled in public and private universities were women, based on BANBEIS enrollment figures.93
Costs for tertiary education vary greatly, depending on the type of institution involved. Public universities in urban areas and public rural colleges charge the lowest costs (World Bank 2014). For such institutions, average costs, at least for tuition and fees, were below Tk10,000 annually. In some cases, tuition is nominal and, where not, substantial scholarships are available. However, the public universities are generally very competitive for admissions and are largely attended by those from higher socioeconomic backgrounds. Most students come from the top quintile of the income distribution (World Bank 2014). Thus, the low tuition prices do not reflect a broad accessibility of these institutions.
The burgeoning private university system comes at a high financial cost to students. Tuition and fees are typically Tk40,000–Tk80,000, out of reach for many
families. Student loans are available through some banks, but there is no system of government-provided loans or loan guarantees, making such loans relatively expensive.
Tuition and fees, however, are not the only costs students face in tertiary education. Many, likely most, tertiary school students pay for private tuition or coaching, on top of regular tuition fees. This pattern continues to be seen in lower levels of education; by 10th grade, more than 80% of students receive private tutoring (Campe 2008). There are many anecdotal reports of the instructors themselves engaging in private tutoring to compensate for low official salaries, even to the extent of neglecting their regular classroom duties. Some argue that tutoring is in fact the main learning modality in higher education in Bangladesh (World Bank 2014).
5.5 Skills Mismatch
Data on skills mismatch in Bangladesh are limited.One important source of information is the School-to-Work Transition Survey of 2012–2013, which collected detailed representative data on Bangladeshis aged 15–29. Using the results of the survey, combined with the International Standard Classification of Occupations system of job classification and the International Standard Classification of Education, analysis reported in Toufique (2014) shows that as many as 62% of young working Bangladeshis may be undereducated for the work they do.94 The undereducated are concentrated in skilled agriculture and fishery work as well as craft and related trades work. By contrast, very few Bangladeshi youth are found to be overeducated for their occupations. These findings suggest not so much skills mismatch, as simply a remaining lack of education among Bangladeshi youth, despite the tremendous progress that has been made in primary and secondary enrollment rates in recent decades.
Rates of under-education are especially high among the occupational categories that incline toward the
Age Group Male Female Female (%)
20–24 263,104 256,882 0.4925–29 627,366 429,972 0.4130–34 600,518 277,906 0.3235–39 523,664 171,762 0.2540–44 347,649 103,716 0.2345–49 264,120 62,507 0.19
Table 5.9: People with Tertiary Education by Sex and Age
Source: Analysis of Bangladesh Bureau of Statistics. 2015. Labour Force Survey 2013. Dhaka.
____________________93 BANBEIS. Education and Statistics. http://www.banbeis.gov.bd/db_bb.htm (accessed 26 January 2016).94 This type of analysis, involving classifying workers by broad occupational classes, assigning broad educational categories to occupational classes, and then seeing
how many workers meet those educational standards is likely to overstate the degree of mismatch in most cases. This is the result of mis-categorization of educational requirements and of jobs to the occupational categories, which is inevitable. Any broad occupational category will contain many jobs that have higher and lower educational requirements. Further, the “educational requirement” for particular jobs is difficult to determine objectively. Nonetheless, the very large degree of under-education found in the Bangladeshi jobs and education data is very unlikely to have arisen solely from such measurement problems.

92
Bangladesh: Looking beyond Garments
professions. The School-to-Work Transition Survey results indicated that about two-thirds of young managers, 62% of young professionals, and 92% of young technicians and associate professionals had not received the level of education expected for their jobs. This may partly represent a “middle-management” gap that many sources have indicated as a problem in Bangladesh.
As discussed in section 2.4, unemployment rates are actually higher among people with higher levels of education, especially among youths. While that might, in part, suggest that the particular education they have received does not match the demands of the current job market, questions asked in the School-to-Work Transition Survey suggest a more complex situation. Among unemployed youth, 62% cited lack of education as the main obstacle to employment, while only a tiny proportion cited lack of available jobs. Another 16% mentioned lack of training. Together, these facts suggest that neither the volume nor the nature of education and training are adequate to the demands of the job market.
Limited statistical evidence indicates that the skills imparted by much of the TVET system are not those the market requires. Unfortunately, this information is scanty because of the paucity of tracer studies. In one tracer study, 47% of graduates from formal TVET programs reported being unemployed when surveyed at least 2 years after their graduation (World Bank 2007a).95 Most of the remainder was continuing their education, so that very few were actually employed. If these results are correct then they are very dramatic: TVET is not providing skills in demand, whether because of the quality of the education or the nature of the skills imparted.
A variety of skills are needed by emerging and growing sectors of the Bangladeshi economy. Although, with assistance from the ILO, Bangladesh is beginning to create an electronic skill-needs database, there is, as yet, no large-scale systematic collection of skill-needs
data. Some of new skill needs are being addressed by the Centres of Excellence, such as in the leather footwear sector and the tourism and hospitality sectors. Other sectors have specific needs, that are difficult to meet. One recent study (Kathuria and Mezghenni 2016) has provided detailed analysis of value chains and constraints to expansion of a selected set of promising industries—the particular focus was on industries that may have substantial export potential. Their analysis provides substantial insight into the limitations imposed on industries by skill gaps.
One common theme of Kathuria and Malouche’s investigation into constraints to expansion in key growth industries was simply low levels of basic education. In many industries, participants identified low literacy among workers as a key brake on productivity and industry expansion. Even in the RMG industry, where one might think of basic jobs as requiring little education, many RMG factories prefer workers with secondary school education (Heath and Mobarak 2015). In the cut and sew processes that dominate the Bangladeshi RMG industry, and are considered the lowest end of the garment value chain, Bangladeshi workers are less productive than workers in the PRC: for example, in Bangladesh, polo shirts are produced at a rate of 13–27 polo shirts per person, whereas in the PRC, the rate of 18–35 shirts is achieved in similar factories (Kathuria and Malouche 2016).
Even in the informal sector, the lack of basic education and basic skills impedes expansion and movement up the value-added ladder. For example, the domestic bicycle market is largely served by very small shops providing relatively low-quality products. Typically, the workers have no formal training and are often illiterate. There will be at least one more skilled worker, who will pass on knowledge of basic production processes to other workers. While such traditional, small-scale production provides a substantial volume of employment, it cannot easily adapt to new technologies or move up to manufacturing the higher quality parts needed for the international market.
____________________95 The unemployment rate in the surveyed group is so high as to strain credibility: since many of the respondents were in higher education, the unemployment rate
by standard definitions would be in the neighborhood of 80%. However, although the study was conducted as a mail-in survey, it had a very high response rate for such a survey design and a reasonable total sample size. Even if most of the non-respondents were employed, the unemployment rate in total would still be extremely high.

93
Skills Development
The local bicycle industry is only one example; lack of basic education and skills are problems faced by many industries.
Naturally, specific industries also have specific skill needs, some of which have been described by Kathuria and Mezghenni. In bicycle production, finding experienced welders is difficult, even though welders are paid substantially more than most other types of production workers. This seems to be exactly the sort of gap that should be filled relatively easily by the TVET system, but either because of lack of responsiveness or lack of information about market demands, it remains a significant constraint.
In the shipbuilding industry, skills gaps create one of the most important problems for a potentially large heavy industry. Many technical management positions are filled by foreign nationals or Bangladeshis who have been educated abroad. Relevant universities are aware of the issue and are attempting to improve education in the appropriate areas.
The pharmaceutical sector has been something of a success in Bangladesh, with the country now nearly self-sufficient in pharmaceutical products even though, as an export sector, its success has been more limited. The industry has the highest demand for managerial skills in Bangladesh. However, with the domestic market nearly served and exports currently limited, it is unclear if this industry will be a major source of demand for further managerial talent.
Finally, the IT sector is expanding rapidly and already employs more than 70,000 workers. Here again, one of the key complaints is not that particular technical skills are missing, but more that the core educational competencies are insufficiently strong in the workforce. IT firms in most countries assume that there will be substantial acquisition of specific skills on the job, or with firm-provided training. But workers need to have an adequate fundamental education to quickly acquire the needed skills: it is this basis that many industry participants view to be missing.
5.6 Returns to Education
The returns to education, that is, the extra income that accrues to workers with higher levels of education, provide valuable information about the supply and demand patterns for skills and education. Returns to education are modest in Bangladesh, likely suggesting a combination of limited demand for current high-skilled jobs and relatively low quality of supply, at least in terms of meeting employers’ requirements.
Table 5.10 contains basic summary information on monthly income by broad level of education. As would be expected, each higher level of education results in higher monthly income.96 However, the scale is moderate; as discussed, international estimates of returns to education produce substantially higher returns to education. Individuals with tertiary degrees or diplomas report incomes that are a little more than double those of individuals with no education at all. Further, those with secondary education (Class VI–X) report only modestly higher income than those with only primary education. Yet, many factors can affect labor income; in particular, income typically increases with age, other things equal, so that younger generations have significantly higher education than older generations in Bangladesh may be causing raw figures to understate the effects of education on earnings.
Level
Monthly Employment Income (Tk)
Overall Rural Urban
None and Never Attended School
8,985 8,996 8,884
Primary (Class I–V) 10,550 10,202 11,243Secondary (Class VI–X) 11,122 10,792 11,620Higher Secondary (Class
XI–XII)13,469 12,770 14,195
Tertiary (All degrees or diplomas)
19,566 14,413 21,715
____________________96 Monthly income is the standard measure of wage income in the LFS data. Although this could be converted to an hourly figure, errors in reported hours worked
may lead to greater measurement error if income is expressed in hourly terms.
Table 5.10: Employment Income and Returns to Education, 2013
Source: Analysis of Bangladesh Bureau of Statistics. 2015. Labour Force Survey 2013. Dhaka.

94
Bangladesh: Looking beyond Garments
areas, at 25%, than it is in Bangladesh as a whole, where the average is 17%. The Higher Secondary Certificate, the certification associated with completion of higher secondary school (classes XI and XII), has a significant return in terms of higher earnings, with a larger effect of 7% compared with an SSC in urban areas. A bachelor’s degree offers only a small premium of 3% over upper secondary education, while a master’s degree leads to incomes about 9% above a bachelor’s degree. The proportional impact on income of tertiary education is similar in urban and rural areas, which may not be obvious from Figure 5.2: the cumulated return through lower levels of education makes the income of those with tertiary education considerably higher in urban areas.
Figure 5.2: Estimated Income Relative to Having No Education, 2013
HSC = higher secondary certificate, SSC = secondary school certificate.Note: The bars come from the results of separate multiple regression analyses for all sample households and for only urban households. The dependent variable is the natural logarithm of monthly individual income. Other control variables include age, as well as industry, division, and gender indicator variables. Source: Bangladesh Bureau of Statistics. 2015. Labour Force Survey 2013. Dhaka.
1.00
1.45
1.40
1.20
1.30
1.35
1.25
1.10
1.15
1.05
1.50
All areas Urban
Clas
s 1–5
Clas
s 6–8
Clas
s 9–1
0
SSC
Bach
elor
’s
HSC
Mas
ter’s
Regression analysis allows a more detailed evaluation of the effects of education on labor earnings. Displayed in Figure 5.2 are results from a regression analysis of individual monthly income evaluating the returns to education based on the 2013 LFS data. The regression analysis controls for a range of other variables, including age as well as industry, division, and gender.97 These income premiums attempt to answer the question: “how much more would I expect to make if I were to acquire a particular level of schooling as compared to no schooling?”98 In the figure, the bar heights represent income relative to an individual with no education. So, for example, a level of 1.1 would indicate that someone with the given level of education on average earns 10% more than someone with no education, other things equal. It may be useful to inform students and their families about the expected wage premiums to help them make informed decisions about education and training.
Having achieved any level of primary education leads to a modest wage premium of 6%, but with a much higher return of 15% in urban areas.99 Going beyond that basic education to Class VI–VII appears to add little, if any, private economic value.100 For some Class IX–X education, there appears to be modest gains relative to some primary education for all of Bangladesh, but in urban areas there is no statistically significant additional premium. It is not clear that such modest increases in income are sufficient to provide adequate recompense for foregone income while attending high school, at least without going on to achieve the Secondary School Certificate (SSC). The SSC, granted based on examinations written after the completion of Class X, marks completion of high school. For all of Bangladesh and for urban areas specifically, the income for those with the SSC certification, the premium is about 6% higher than for those who have only some Class IX and X education. However, relative to no education, the reward for completing the SSC is substantially higher in urban ____________________97 This type of earnings regression has been estimated in many countries and for many groups, since the original regression results of Mincer (1974). Most typically,
such regressions are estimated with hourly wage or earnings data, but these are not available in the LFS. The full list of additional covariates in the regression analysis consists of age, age squared, seven indicator variables for education level, indicator variables for marriage status and Muslim religion, indicator variables for division, an indicator variable for daily laborers, and eight indicator variables for economic sector of employment.
98 This type of earnings–education regression has always been subject to questions about whether or not the results are causal in that, for a given individual, the effects actually correspond to an expected increase in wages; alternatively, for example, it may be that individuals who are more broadly talented find it easier or more worthwhile to pursue further schooling. Many of the attempts to use specialized datasets or alternative econometric techniques to isolate causal effects have found quantitatively similar results to simpler results such as used here. For one detailed discussion of the issues involved, see Card (1999).
99 For concision, only the results for all of Bangladesh and for urban areas are included here. As the working population is predominantly rural, the results for rural areas are similar to those for the country as a whole.
100 The changes in income relative to any primary education are statistically insignificant.

95
Skills Development
The basic pattern of returns to education has not changed recently. Similar analyses were conducted using the two earlier LFS: 2005–2006 and 2010. There appears to have been some decline in the return to master’s degrees, but otherwise the general results are similar. This in itself is interesting, since the supply of more educated individuals in the workforce has increased extremely rapidly in recent years, as described in section 5.2. Since supply of more educated individuals is increasing rapidly and returns to education remain similar, this suggests that demand for educated workers is increasing quickly. As the increase in the supply of more educated workers must necessarily slow down, this indicates the possibility of substantial increases in the returns to education in the near future.
The returns to education found in the LFS are very low by international standards. The present analysis only looks at increase in income associated with educational attainment, it does not take into account the potential income that is foregone by being in school rather than being employed, and even counting those costs, the return is modest. In developed countries, annual returns from education that are found in similar regressions are typically around 8%, while returns in poorer countries tend to be substantially higher. The results presented above are not in annual terms, but can be converted to be comparable: excepting the relatively small number of people with master’s degrees, the highest annual rate of return for any of the educational categories is 4% for Class IX and X with SSC completed. One survey of international findings on returns to education found cross-country average returns to education of nearly 10% for poor and middle-income countries (see Psacharopoulos and Patrinos [2004]).101
As such, the returns to education estimated using LFS data are far below those in most comparable countries. If, however, the results estimated from the LFS are correct, then there appears to be an indication that Bangladesh’s rapid increase in educational attainment has not been matched by job opportunities created by the economy. Supply does not always create its own demand, at least not immediately.
It is possible that problems with the LFS measure of income lead to poor estimates of the returns to education: most analyses of this type use wage data. Alternative estimates of returns to education in Bangladesh are sparse. Sen and Rahman (2015) use earlier waves of the LFS and estimate similar earnings regression. Their results for 2010 are similar to those obtained with the present methodology. One older study that used the Household Income and Expenditure Survey (HIES) from 1999 to 2000 found an annual return to education of about 7% (Asadullah 2006). A more recent study using a relatively small sample of self-employed individuals found a rate of return of 11% (Kolstad, Wiig, and Moazzem 2014). These estimates are more in line with what would be expected based on comparison with other countries. However, even if the absolute level of the returns estimates is inaccurate, the relative return at different levels of education may still be informative. In this context, the minimal return to schooling between primary and SSC is striking. It suggests that there may be an important role for education at this level that could potentially be better filled by TVET. It also suggests that issues with educational quality may be especially important at this level.
The labor income of the employed does not necessarily provide a full picture of the returns to education. It clearly matters whether or not workers are able to find employment. Table 5.11 contains data on unemployment rates by educational class.
To some extent, higher unemployment rates for higher education individuals undercut the effects of the significant wage premiums for education. The highest level of unemployment is among those with
None and Never Attended School 3.2%Primary (Class I–V) 2.7%Secondary (Class VI–X) 4.4%Higher Secondary (Class XI–XII) 7.9%Tertiary (All degrees or diplomas) 6.7%
____________________101 The authors do not report estimates for Bangladesh.
Table 5.11: Unemployment Rates by Broad Educational Category
Source: Bangladesh Bureau of Statistics (2015).

96
Bangladesh: Looking beyond Garments
higher secondary education. The unemployment rate is more than twice as high for workers with higher secondary or tertiary education than it is for those with only primary education. First, these higher rates may simply reflect that better educated individuals are likely to have more resources available to support themselves during periods of unemployment, whereas those with lower levels of education may simply need to be working all the time, at whatever work is available. The more educated sometimes have the advantage of being able to wait to find an appropriate employment opportunity. Second, the higher rates of unemployment do not reverse the overall picture: even allowing for unemployment, overall returns to labor are higher for those with higher levels of education.102
Youth unemployment is particularly important for decisions regarding education, as the likelihood of long spells of unemployment after years of education may deter many young people. The School-to-Work Transition Survey examined the question of youth (aged 15–29) unemployment in detail, and also found that unemployment rates were higher among those with higher levels of education.103 Table 5.12 contains figures on youth unemployment, as reported in the School-to-Work Transition Survey.104 For youths, the unemployment rates are uniformly higher than for the overall labor force, and in this critical group, unemployment rates are especially high for those with the highest levels of education: the youth unemployment rate for those with tertiary education is 26.1%. Unemployment rates are uniformly higher for women than for men.
Given the relatively small proportion of women receiving higher education, the extremely high unemployment rate for female graduates is especially troubling. The high unemployment rates also suggest that simply improving access to higher education for women may not be enough to resolve the gender imbalance in Bangladeshi universities and colleges: enrollments may also be constrained by lack of demand for female graduates. This suggests that
achieving gender equity in higher education may also require policies to encourage employers to hire the best-educated women. Despite higher unemployment rates, the quality of jobs that were eventually gained by youths with tertiary education was significantly higher: such youth were 50% more likely to find a stable job than youths with only primary-level education (Toufique 2014).
To gain a better understanding of skills demand in different industries and the structure of the returns to education, Table 5.13 includes monthly earnings for key industries by education level. Earnings are expressed as a percentage of earnings for those with primary school education only. Note that within a sector, those with different levels of education may be performing substantially different jobs.
Unsurprisingly, the returns to education are modest for those employed in agriculture; those with primary education do slightly better than those with none, but secondary education has little economic benefit. But this is not just for agriculture: consistent with the aggregate estimates, there appears to be little earnings impact of secondary education in any industry. Transportation and construction have the highest wage premiums for upper secondary education: such workers earn about a quarter more than workers with only primary education. Several industries had very high skill premiums for employees with tertiary education, notably in manufacturing, information technology,
Table 5.12: Youth (Aged 15–29) Unemployment Rates by Broad Educational Category
Source: Toufique (2014).
____________________102 This conclusion is reached by comparing incomes for the employed multiplied by the respective unemployment rates.103 The School-to-Work Transition Survey definition of unemployment is of standard form. The unemployed are defined to be those who neither did work for wage
or profit at least 1 hour during the reference week, nor were absent from work temporarily, nor performed some work for family gain; but did actively search for a job or took concrete action to start their own business, and were available to start work within the 2 weeks following the reference week.
104 Note that female unemployment rates as found in the School-to-Work Transition Survey are substantially higher than those found in the LFS. This may have to do with the strong dependence of measures of female labor force participation (FLFP) on the exact questions used in different surveys and the survey methodologies. The issue of measuring FLFP is addressed in detail in Chapter 6.
Total Male Female
None and Never Attended School
3.2% 2.1% 7.3%
Primary 6% 3.2% 17.1%Secondary 11.7% 8.3% 21.6%Tertiary (All degrees or
diplomas)26.1% 22.5% 31.5%

97
Skills Development
finance, and insurance and other services.105 Perhaps surprisingly, earnings in the education sector are effectively independent of the level of education achieved. This could well be connected with some of the problems in education quality discussed below.
5.7 Quality of Education and Skills TrainingAs discussed, many industry participants have serious concerns about the basic level of education of their employees. There is substantial evidence that these concerns are not simply the griping of employers who would always be happy to have better workers. Only 25% of grade 5 students master Bangla, and only 33% master mathematics competencies (World Bank 2013). At the grade 8 level, competencies in Bangla, English, and Mathematics are 44%, 44%, and 35%,
respectively. There are substantial regional differences in educational performance; students in Dhaka and Chittagong do better than the national average, but those in Rajshahi and Sylhet lag (World Bank 2013a).
Quality differences across schools are huge, indicating reasonable possibilities for intervention; that is there are schools that are performing very well and these schools could provide practical lessons about best practices that could potentially be replicated elsewhere (World Bank 2013a). Many teachers do not have effective training and use rote-learning styles. However, that sort of teaching style is effectively encouraged by the system. There is an elaborate system of frequent, high-stakes public examinations that largely focus on recalling textbook content, as opposed to focusing on comprehension and competency. These examinations tell students what the school system values and that does not appear to be comprehension, nor do they encourage teaching that fosters competency.
Teachers are poorly motivated and teaching is seen as low status. While teachers are relatively well paid, the teaching profession has a low profile, and has limited opportunities for professional advancement, with little penalty for poor performance. Low motivation is evidenced by 10% teacher absenteeism, with a further group of more than 20% of teachers who arrived an average of half an hour late for school (Campe 2015). Further, many teachers engage in tutoring on the side, and may be more focused on that source of private income (Campe 2008).
As discussed, there are still limited linkages between employers and most institutions that provide TVET. This has led to little responsiveness of TVET provision to job market demands—with no systematic feedback concerning industry requirements and no tracer studies of graduates, there is little scope for such responsiveness. The formal TVET track reaches a limited portion of the labor force because it requires 8th grade, though recognition of prior learning is in the process of being adopted. Because of that 8th grade requirement, many SSC vocational students do not intend to pursue manual or technical labor as they are already better educated than most of the workforce on
Table 5.13: Monthly Earnings as a Percentage of Earnings of Those with Primary School Education,
Key Industries (%)
… = no individuals in the survey belonged in this cell.Note: Earnings are for regular employees (wage earners) only.Source: Bangladesh Bureau of Statistics. 2015. Labour Force Survey 2013. Dhaka.
Industry
Level of Education
None Primary SecondaryUpper
Secondary Tertiary
Agriculture 95 100 98 102 131Manufacturing 87 100 101 113 204Construction 92 100 101 127 177Wholesale and
retail trade100 100 101 115 177
Transportation and storage
82 100 93 125 137
Accommodation and food
90 100 109 112 166
Information and communication
… 100 53 63 444
Financial and insurance
85 100 73 111 224
Public administration and defense
90 100 89 99 144
Education 98 100 98 99 103Human health
and social work 71 100 101 116 149
Other service activities
94 100 104 119 198
____________________105 Note that in information and communication, only a handful of survey respondents have primary education only. However, the relative returns for higher levels of
education have sample sizes large enough for reliability; note that this makes the income in this sector for those tertiary education relative to secondary education more than 800%. For finance and insurance, the number of sampled individuals with no education was also small. However, since the income for those with primary education was the same as those with no education this does not affect the interpretation of income ratios for higher education levels.

98
Bangladesh: Looking beyond Garments
entry. TVET curriculum development is centralized, somewhat rigid and slow-moving and as such is not suitable for an evolving economy (ADB 2015b). Centralization, with little delegation of authority also makes it difficult for local institutions to cater to local demand.
While curriculums are centrally developed, there is limited capacity to provide regulation and inspection for accredited institutions to see that they are following the curriculums in any meaningful way. With more than 3,000 accredited private institutions, the Bangladesh Technical Education Board visited only 146, which was at the limit of its inspection staff (ADB 2015b).
There is extremely limited capacity to train instructors, leaving many underqualified. At the same time there are few opportunities for in-service training, so that unqualified instructors are likely to remain so. Salaries are low, and there are many vacant teaching positions—the vacancy rate for sanctioned positions may be as high as 50% (ADB 2015b).
While TVET has expanded rapidly, there has been little assurance that greater learning has accompanied the greater number of seats. While at a high level, there have been many lofty goals set, those have not translated easily into improved educational outcomes. Further increasing the scale of TVET seems unwise at present until quality assurance can be improved. While some institutions and some public–private partnerships have been successful, there is limited evidence that a large proportion of the many students in TVET institutions are acquiring the skills that they need to succeed in a growing and diversifying economy
5.8. Conclusion
Bangladesh has an urgent need to improve the education and quality of its workforce, as huge numbers of young people are entering the job market just as the country is looking to diversify and modernize its economy. Huge advances have been made in providing basic education for most of the population, but major challenges remain. This concluding section makes note of key findings and highlights some of the policy issues that have been discussed throughout.
The evidence is clear that the skills of the workforce are not meeting the demands of emerging, or indeed established industries. Many employers state that the difficulty of finding appropriately skilled workers is a substantial constraint to growth of their firms. Private economic returns to education remain fairly modest, though this may be in part due to the huge expansion in the number of workers with at least basic education. As the economy grows and modernizes, it is likely that the lifetime rewards to education will be significant.
While provision of basic general education has expanded greatly, areas and populations remain underserved, especially among the poorest. Efforts should be continued to bring all children into the educational system. Perhaps because of the rapid expansion of the general education system and because of a tradition of rote learning, average educational quality remains low and many students are not reaching achievement targets. Better enforcement of standards for teaching and a policy to discourage side employment of teachers, along with attempts to improve the status of teachers, may help. A modernization of curriculums to make them more flexible and relevant and less memorization-focused will be helpful, along with potential de-emphasis of high-stakes testing.
Private tertiary institutions have proliferated extremely quickly and it is not clear that adequate quality standards are in place. High unemployment rates among young graduates suggest that the skills being obtained are not those required by the marketplace. A more careful program for oversight of such institutions may help to improve quality of education.
TVET is a key area of concern. Many of the rapidly developing countries and recently developed countries of Asia made TVET a central focus of their education systems as a way of preparing for rapid industrialization. In Bangladesh, formal TVET education makes up only a tiny portion of secondary education, and evidence suggests that some TVET resources are underutilized because of low demand from students. A unified and simplified system of TVET management and provision, promotional efforts to students and their families, and, perhaps most importantly, a continuous system of communication, coordination, and cooperation with private industry could help to make TVET an important element of development.

99
Women at Work
Chapter 6Women at Work
5.1 Introduction
ranks ahead of Nepal, India, and Pakistan. On another measure of gender inequality, the ratio of male HDI to female HDI, Bangladesh is ranked 105th in the world, with women having an HDI of 91% of that of men. While that rank is relatively low, the ratios are much lower in India and Pakistan at 83% and 75%, respectively. Thus, outcomes for women are generally poor, but to a substantial extent that reflects the overall level of development. In comparisons to men, Bangladeshi women are doing somewhat better than women in other countries in the region.
Despite the remaining hurdles, the status of Bangladeshi women has improved in many ways over the last 40 years in Bangladesh. In 1974, the total fertility rate was a remarkably high 7.3, while by 2013 it had fallen to 2.2 (World Bank 2013b). This in itself reflects an enormous change in the lives that women live and tremendously increases the potential scope of women’s participation in the economy. Maternal mortality rates have also fallen dramatically: from 650 per 100,000 live births in 1986 to 216 in 2010.107 Much of this fall has been accounted for by improved
6.1 Introduction
Women in the labor force have been at the forefront of Bangladesh’s recent successful economic growth, making up the majority of workers in the ready-made garment sector (RMGs), the country’s flagship export-oriented industry. The creation of a large microfinance system focused on women, a subject of much study and emulation around the world, has also changed the economic position of women. Further participation of women in measured economic activity outside the home has the potential to make a substantial additional contribution to economic growth, and to improve the status of women in many other ways.
The 1972 Constitution of Bangladesh enshrined equal rights for women and paved the way for remarkable measurable progress in their status. The country ranks 115th in the world on the United Nation’s Gender Inequality Index, falling behind Nepal, but ahead of both India and Pakistan.106 By coincidence, Bangladesh also ranks 115th in the Human Development Index (HDI) calculated only for women; by this measure it ____________________106 This particular index is based, in part, on labor force participation figures that are inconsistent with, and much higher than, those reported by the Bangladesh
Bureau of Statistics (BBS); the BBS figures are derived from the Labor Force Survey (LFS), as are many of the statistics in this report. Using the official labor force participation figures would result in a lower ranking.
107 Estimates of maternal mortality in Bangladesh differ depending on data sources and analytical methods. The figures above are based on BBS analysis of data from the Sample Vital Registration System, as presented in BBS (2013a). The most accurate recent figures are likely those from the Bangladesh Maternal Mortality Survey 2010 (National Institute of Research and Training 2012), though they cannot provide a long-term perspective. Based on an academic analysis of that survey, the maternal mortality rate from 2007 to 2010 was 194 (Arifeen et al. 2014). The authors find that about half of the reduction in maternal mortality since the late 1990s was the result of falling fertility rates and of high-risk pregnancies as opposed to improvements in health care, though even half of the reduction as a result of public health initiatives is a major accomplishment.

100
Bangladesh: Looking beyond Garments
access to health care. Bangladesh has easily reached the Millennium Development Goal of primary and secondary school gender equality: in 2011, there were 110 girls enrolled in primary and secondary schools for every 100 boys (World Bank various years). Parity for primary school had already been achieved by 2000 (BBS 2013a). The successes in educational parity have been due, at least in part, to substantial cash-based programs to support the families of girls attending secondary school. Improved education for girls has, naturally enough, improved literacy rates; while in 1974 the adult literacy rate was 20 percentage points higher for men than for women, by 2011 the gap had fallen to less than 4 percentage points, and this gap was on the basis of a much higher average literacy rate.
One area in which Bangladesh is unusual compared with most of the world is the relatively young age of marriage and of mothers at their first birth, although these ages have been getting somewhat older in recent years. In 2011, 51% of married women aged 20–24 were married before they were 18, despite 18 being the minimum legal age for marriage (BBS 2013a).108 Further, as of 2012–2013, 24% of women aged 15–49 were first married or in a union before aged 15 (BBS 2013b) Correspondingly, teen pregnancy is very high: nearly a quarter of 17-year-old women in Bangladesh have already had at least one child (BBS 2015b).
Importantly, women’s labor force participation, based on International Labour Organization (ILO) definitions of economic activity, increased significantly until, apparently, the last few years. This apparent fall and the difficulties in measuring labor force participation is discussed in detail in section 6.3. Nonetheless, it is clear that there has been a long-term increase in women’s labor force participation, and that this has been an important contributor to the development process.
The RMG sector has been at the forefront of industrial development in Bangladesh and is estimated to employ some 4 million workers109 and the large majority of these are women, with most estimates ranging
between 64%–90%.110 Despite the progress women have made in entering the world of work outside the home, female labor force participation (FLFP) rates remain low by international standards.
Within this context, this chapter examines trends and issues related to women and work in Bangladesh. The following section provides an overview of some of the relevant issues regarding women and work, including attitudes and institutions, as well as the potential broad role of women in the economic development process. Section 6.3 examines labor force participation in detail. Section 6.4 addresses existing barriers to women’s full participation in the world of work, with reference to some of the overarching issues of women’s status discussed in section 6.2. Section 6.5 then discusses avenues through which it may be possible to expand women’s labor force participation. Issues related to the status of women in the workplace are addressed in Section 6.6, while Section 6.7 concludes and draws together some of the policy implications.
6.2 Women and Work in Bangladesh6.2.1. Attitudes toward women and work
Bangladesh is located in a region, including North Africa, most of the Middle East, and South Asia, that anthropologists and sociologists have sometimes identified as the “classic patriarchal belt,” characterized by sharply delineated gender roles in labor and substantial sex segregation in many spheres. Two key cultural features in this belt have historically had adverse effects on many aspects of women’s status: (i) patriarchy—the senior male in a household is often regarded as the supreme authority; and (ii) patrilinearity—descent and inheritance are traced through the male line.
Sociocultural attitudes toward women’s work in Bangladesh are important in determining labor force participation and the nature and conditions of
____________________108 In principle, this result could be misleading, in the sense that women who marry later than aged 24 are not included in the calculation. However, data from earlier
survey waves indicate that the fraction of women who marry before age 18 increases when older cohorts of women are considered. 109 Bangladesh Garment Manufacturers and Exporters Association. http://www.bgmea.com.bd/home/pages/aboutus (accessed 17 April 2016).110 The difficulties in measuring the share of women in the RMG workforce are discussed in detail in section 6.4.2.

101
Women at Work
women’s work. One important cultural limitation to women’s employment outside of the home has been the tradition of purdah. Prevalent in Bangladeshi rural society, it loosely refers to the sequestration of women from the male world outside of the family environment. The meaning of purdah in Bangladesh has been heavily contested; at a minimum, it is clear that it means very different things to different people, with some paying more attention to the requirements of female modesty, as expressed for example by the wearing of the burka, and others more to the specific construction of female and male spheres and dominance relations.
Nonetheless, from the point of view of the economic study of women and work, the most salient feature of purdah is that this tradition has often been viewed as placing substantial restrictions on the physical mobility of women and on their participation in the labor force and in many particular kinds of work. There are large variations in the effective implications of purdah for Bangladeshi women, in part varying by geographic location and by socioeconomic status.111 Traditionally, geographic mobility of poor women in rural Bangladesh has been remarkably circumscribed: in a 1996 survey in the rural area of Matlab, 93% of women interviewed had never been to the local bazaar, 92% had never been to the local mosque, and 68% left their residential compound at most once a week (Anderson and Eswaran 2009). Effective restriction of mobility for women outside of the household can still be fairly severe today. In 2011, 44% of married women aged 20–24 said that they were not generally free to make decisions about visiting their own relatives (BBS 2013e).
A minority of women face even more severe restrictions. The same survey found that 22% of women were not free to travel to a health center either alone or with their children. The above figures may well understate the impact of purdah and other cultural norms on women’s movements. If women are asked whether they are comfortable moving around outside the household, as opposed to whether they are allowed to, very different answers emerge. Kabeer, Mahmud, and Tasneem (2011) surveyed over 5,000 Bangladeshi
women and found that only 18% reported being comfortable visiting a health facility by themselves. While it is unclear whether such responses indicate an internalization of societal restrictions or an accurate evaluation of the risks to unaccompanied women, mobility restrictions can have serious consequences for the health of women and children.
The early age of marriage and first pregnancy in Bangladesh has significant effects on women’s working lives. Early marriage has been, in many places, associated with high fertility and maternal mortality. In Bangladesh, however, it coexists with a relatively low rate of fertility, a rapidly falling rate of maternal mortality, and major strides in secondary education for women, a combination one study referred to as a “negative paradox” (World Bank 2007b). Early marriage for women is partly a result of a culture in which, traditionally, young women join their husband’s household after marriage so that such marriages may reduce the economic burden on the parents of the bride when there are limited economic options available to young women. Further, although banned by law, dowries are frequently paid to the groom’s family by the bride’s family, and there is survey evidence to suggest that the practice of dowry has actually become more and not less common over time (World Bank 2007b).
6.2.2. Effects of labor market participation on women’s lives
By removing barriers to mobility, FLFP may also help to provide women with greater autonomy and potentially with other benefits. However, these effects are uncertain, as women’s paid work is sometimes regarded as a temporary measure that may be necessary, but is nonetheless undesirable.112 Even women who do travel to work may still need permission from their husband or other male relative to travel elsewhere. Salway, Jesmin, and Rahman (2005) examined married urban slum dwellers and found that 60% of women who worked outside of their residential area still needed spousal permission to visit a friend.
____________________111 Indeed, the variety of practices referred to under the term purdah is so great that, by some measures, it is difficult to find statistical differences between women
who say they practice purdah and those who say they do not (World Bank 2007b).112 For example, see Salway, Jesmin, Rahman (2005).

102
Bangladesh: Looking beyond Garments
Traditional economic theory, based on rational bargaining models, has viewed opportunities for labor force participation as empowering for women: in such models an increase in outside opportunities increases bargaining power within the family and in other possibly influential social circles by increasing the so-called “threat-point.”113 However, in practice, there is no general agreement about the meaning of the word “empowerment,” as it involves different dimensions of women’s lives, and evaluating the relative importance of these dimensions requires value judgments. Certainly women’s labor force participation should not be viewed as a cure-all for problems with gender equality. As Salway, Jesmin, and Rahman (2005) have argued, gender norms are embedded in diverse sociocultural structures that constrain women’s options and reinforce their subordinate identity regardless of their work status. Nevertheless, alongside the fact that there are obvious and measurable effects of increased labor force participation on gross domestic product (GDP) growth, the broader effects of increased labor participation for women’s lives bear serious consideration.
Some studies have found that women with wage employment are better off in other respects than women without. Anderson and Eswaran (2009) found that various measures of female autonomy—largely focused on family purchasing decisions—increased with higher female earned income, but not with unearned income. Mahmud, and Tasneem (2011), using a more recent sample, found that women engaged in formal work outside of their residences had higher measures of autonomy, looking at both mobility and at decision-making power within the household. Salway, Jesmin, and Rahman (2005), with a survey of urban women, also found increased mobility and other measures of autonomy to be positively associated with women’s paid work outside the home. While carefully conducted, these studies encountered difficulty in determining the causality of the statistical
relationships that they found. Even controlling for characteristics of the women that are surveyed, the fundamental problem of selection bias remains: women who choose to work outside of the home are likely to be different from women who do not so choose, and these differences may come in forms that are not easily measured and included in quantitative analysis. It is, for example, easy to imagine that the sort of women who work outside the home would have more autonomy, whether or not they were, in fact, working outside of the home. Nonetheless, the balance of the evidence collected in Bangladesh suggests that employment, in particular formal employment outside of the home, contributes positively to some measures of empowerment and autonomy for women.
Heath and Mobarak (2015) have attempted to parse causality more directly using an identification strategy based on geographic proximity to RMG factories. By combining the location of a village with the year in which garment factories open nearby, the authors were able to directly identify the effects on women of expanding opportunities for wage employment.114 The results are striking: women who have increased access to employment opportunities have much higher labor force participation rates, get more education, marry later, and have children later.115 Their estimates suggest that a substantial fraction of the increase in female educational attainment seen in recent years may result from expansion of the RMG industry and the expansion in demand for female labor that it has brought. The results strongly indicate that expansion of employment opportunities for women can improve their lives in a range of different ways, apart from simply the increase in income that they can bring.
On the other hand, entering the world of wage labor may also create risks for women, including the risk of violence or harassment in the workplace or when traveling to and from the workplace. Further, some researchers have suggested that a possible
____________________113 In the terminology of economic theory, a “threat point” is what an agent has if she walks away from bargaining: independent income increases the threat point for
women in standard bargaining models. See Udry (1996) for one discussion of some of the relevant issues.114 Technically, they use an explanatory variable that measures years of exposure to a nearby RMG factory. This also allows controlling for characteristics of individual
villages that do not change over time and for village-level time trends.115 This study is not comparable to other studies on labor force participation in some respects. First, it does not examine variables that are direct measures of
autonomy or “empowerment.” Rather, it measures outcomes that are independently important to women’s lives and that are plausibly correlated with autonomy. Second, it does not look at outcomes as a result of labor force participation, but looks at the effects of increased employment opportunities. While it is reasonable to think that the effects of these opportunities should come about via increased employment, that is not a question that the study addressed. From the point of view of evaluating the effects on women of policies that affect the labor demand side, however, examination of the expansion of employment opportunities is precisely the approach that is needed.

103
Women at Work
consequence of FLFP is that it may challenge men’s identity as a provider and thus potentially increase the possibility of domestic violence in households in which the woman is working. For Bangladesh, this may be a potentially important issue as the base level of domestic violence is high by international standards.116
One multivariate analysis based on a survey of urban slum dwellers found that working women were significantly less likely to suffer physical abuse at the hands of their husbands (Salway, Jesmin, and Rahman 2005). Another, more recent, study based on a survey conducted in 2009 of women in peri-urban areas near Dhaka, found higher rates of domestic violence in households in which the woman worked outside of the home, but found the effect only for women with very low levels of education and women who had married at very young ages (Heath 2014). The different findings may be accounted for by the way that the sample is split in the latter study, examining the effects of labor force participation on different types of women. In any case, the evidence indicates that increased domestic violence may, for some women, be a consequence of increased labor force participation.
6.2.3. Women and economic development
Women can contribute to economic development in many ways, as elaborated in Duflo (2012); another, more policy-focused discussion is in IMF (2013). As of 2013, the labor force participation rate was 82% for men and 34% for women.117 If the labor force participation rate for women were raised to the same rate as for men, the labor force of Bangladesh would be increased by 43%. Using the simplest possible model of production, this would be associated with a 27% increase in GDP, even without any increase in the capital stock.118 Naturally, this calculation illustrates that such a change could not occur overnight and that increased FLFP would lead to substantial structural changes in the Bangladeshi economy. Nonetheless, it indicates the overall scale of the possible
contribution of an increased female labor force for economic growth.
Low FLFP is only one consequence of issues regarding the status of women in Bangladesh. A number of recent academic studies have attempted to quantify the effects of labor market discrimination faced by women. Though the methods these studies have used are fairly complex, the intuition is simple; different people have different talents and an efficient economic system will have the people with the right talents in jobs that use those talents effectively. If some people are discriminated against in the labor market, for whatever reason—sex, ethnicity, religion, or caste—then it is unlikely that the process of matching people to jobs based on their talents will proceed efficiently. If only half of possible candidates are considered for a job, there is only a 50% chance of finding the best person.
Hsieh et al. (2013), using United States data, have estimated that between 1960 and 2008, changes in the occupational barriers facing blacks and women were responsible for 15%–20% of United States growth in output per worker. They find that almost all of that gain in productivity was the result of women moving into higher skill jobs. Cuberes and Teigner (2012) looked at gaps in the numbers of female and male entrepreneurs as a measure of limitations to female access to entrepreneurial activities, and considered the effects across most of the countries in the world. For Bangladesh, their calibrated model indicates a 6.5% loss of output, solely on account of barriers to female entrepreneurship.
The Government of Bangladesh has made many significant efforts to improve conditions for women, including in the working world. This may in part be accounted for by the fact that Bangladesh has had only female prime ministers since 1991. Given that Bangladesh became an independent country in 1971, it may be the only country in the world to have spent more time governed by women than by men.
____________________116 Solotaroff, Pande, and Lopez-Acevedo (2014) report that, of countries for which comparable data are available, Bangladesh has the second-highest rate of
intimate partner violence.117 This is based on the Bangladesh Bureau of Statistics, 2013 Labour Force Survey. There are substantial issues in connection with the measurement of labor force
participation; some of these are discussed in section 6.3.118 This calculation is based on a Cobb-Douglas production function with a 67% labor share, a standard simple production function used in many economic studies.
The calculation assumes that women and men are equally productive. It may overstate the welfare impact of growth in the sense that women who are not in the labor force are often engaged in important economic tasks such as child care and home production that are not measured in GDP. This, however, is an inherent problem with using standard measures of economic growth.

104
Bangladesh: Looking beyond Garments
For many years, hiring by the central government has had specific reservations for women. Each ministry must submit reports concerning both its programs in support of women and the progress made in hiring and promoting women internally, with results published by the Ministry of Finance as a “gender budget.” Other programs in support of women include those that encourage girls to stay in school through their secondary education, as well as policies such as the 2012 National Strategy for Promotion of Gender Equality in Technical and Vocational Education and Training.
6.3 Labor Force Participation
There are both theoretical and practical issues associated with measuring labor force participation in any country. There are also particular issues specific to the measurement of FLFP in Bangladesh that make collecting and interpreting such data more difficult. Official data on labor force participation, reported by the BBS and collected through periodic labor force surveys, are based on the ILO’s definition of an economically active person.119
Some authors have argued that the survey data collected by the labor force survey (LFS) significantly undercount the number of women in labor force. In particular, Mahmud and Tasneem (2011) have argued that unpaid work in family enterprises may not be correctly reported, noting that “work” in Bangladesh is commonly understood as an activity that produces goods and/or services having a market value, and by extension as generally the activity of adult males. As a result of such attitudes, they argue that women themselves, especially poor women, do not always identify their work as economic activity.
In their own survey, conducted in eight villages, they find a FLFP rate of 67%, far higher than recorded in the official statistics. Certainly it is the case that the women in Bangladesh villages are hardworking, as time-use studies clearly indicate. It should be noted however that other surveys, such as the Household
Income and Expenditure Survey (HIES), indicate even lower rates of FLFP than does the LFS.
Amin (2005) has even argued that the long-term upward trend in FLFP may be simply the result of improved remuneration over time, though Mahmud and Tasneem (2011) argue that that is not consistent with other labor market trends, in particular, the types of activity associated with increased labor force participation. Despite the potential limitations associated with the LFS data, it provides the only reasonably consistent longer-term measure for trends in labor force participation.
Table 6.1 shows measures of the labor force participation rate from 2003 through 2013. Recent years have seen some modest decline in male labor force participation and may, in part, be due to larger numbers of male workers working overseas, a trend that was discussed in Chapter 2. If more of the men who are able and willing to work are abroad, one would naturally expect the labor force participation rate for those remaining at home to fall. While the Bureau of Manpower, Employment and Training provides detailed data on the number of workers leaving to work abroad, it is much more difficult to evaluate the total of those working abroad at any particular time. However, the “missing men” form a large enough group that they are easy to observe in graphic depictions of Bangladesh’s demographic pyramid: for example, the 2013 LFS records 300,000 more women than men in the aged 30–34 cohort, whereas among the oldest working-age cohorts, men outnumber women.
Factor 2003 2006 2010 2013
57.3 58.5 59.3 57.1Male 87.4 86.7 82.5 81.7Female 26.0 29.3 36.1 33.5Urban 56.8 55.9 57.3 56.7Rural 57.5 59.4 59.9 57.3
____________________119 “…a person aged 15 years and above, who was either working one or more hours for pay or profit or working without pay in a family farm or enterprise or organization
during the reference period (week preceding the interview date) or found not working but had a job or business from which he/she was temporarily absent during the reference period.”
Table 6.1: Labor Force Participation Rates, 2003–2013 (%)
Source: Bangladesh Bureau of Statistics. 2015. Labour Force Survey 2013. Dhaka; as well as reports for earlier years.

105
Women at Work
The FLFP rate increased from 2003 to 2006 and then increased dramatically from 2006 to 2010, reaching 36.1%. The most recent LFS has found a decline in women’s participation, to 33.5% most recently, or a 2.6 percentage point fall between the two surveys.120 Questions remain concerning consistency of measurement of labor force participation in earlier surveys, but, for comparison, the 1995–1996 rate of female participation was only 15.8%.
Some insight into the reduction of overall FLFP can be found by looking at the participation of different age cohorts of women (Table 6.2).121 FLFP in the youngest cohort (aged 15–19) fell somewhat, possibly on account of increasing secondary school enrollment rates. Slightly older women (aged 20–29) increased their labor market participation substantially, with the participation rate approaching 50%. The increase in participation of women in their 20s, however, is overbalanced by large declines in participation rates among older cohorts, in particular among the 30–49 age group. While the increases in the oldest cohorts have been noted, they make up a relatively small part
of the total workforce and their levels of participation remain low.
The aging of the workforce also contributes to the decline in the overall participation rate. While the older age cohorts have lower labor force participation, those cohorts make up a larger part of the 2013 population than they do of the 2010 population, and this demographic change has a mechanical effect, reducing measured labor force participation rates, both for women and for men. The overall fall in FLFP was 2.5 percentage points; of this 0.9% percentage points was accounted for simply by changes in the population’s age distribution.122
The change in FLFP comes alongside very important changes in the composition of the economic sectors providing employment to women. Table 6.3 contains a breakdown by sector for those sectors employing large numbers of women. The breakdown reveals extremely rapid changes in the structure of employment of women; these structural changes are far more significant than the simple drop in the overall FLFP
____________________120 Official figures on labor force participation in Bangladesh rely on a definition that is the labor force divided by the population 15 years of age and over, in
accordance with international standards. But this definition is unusual, as it includes workers under the age of 15 in the numerator, but not the denominator. In the past it was standard to report participation rates based on workers and the underlying population only up to age 64, with the notion that 65 is in some sense a customary retirement age, so that very different participation behavior would be expected in this older population. By extending the reference population to age 15 and above, the new standard takes into account the impact of aging population.
121 Note that the overall participation rates in this table differ slightly from those presented previously, because the earlier figures include those under the age of 15 who are in the labor force, while this table excludes them.
122 This is calculated by applying the 2013 labor force participation rate by cohort to the cohort sizes from 2010 to calculate what the overall labor force participation rate in 2013 would have been, had the demography of 2010 still been in place.
Age Group
2010 2013
Population (‘000)
Female Labor Force (‘000) FLFP (%)
Population (‘000)
FemaleLabor Force
(‘000) FLFP (%)
Total 47,738 17,174 36.0 54,209 18,155 33.515–19 6,888 2,025 29.4 7,476 1905 25.520–24 7,257 2,974 41.0 7,966 3906 49.025–29 6,251 2,795 44.7 7,121 3538 49.730–34 5,866 2,735 46.6 6,121 2207 36.135–39 4,699 2,240 47.7 4,932 1672 33.940–44 4,407 2,038 46.2 3,962 1320 33.345–49 3,186 1,516 47.6 3,775 1192 31.650–54 2,779 285 10.3 3,370 938 27.855–59 2,084 233 11.2 2,610 543 20.860–64 1,583 105 6.6 2,587 395 15.365+ 2,738 228 8.3 4,289 538 12.5
Table 6.2: Female Labor Force Participation by Age Cohort, 2010 and 2013
FLFP = female labor force participation. Source: Bangladesh Bureau of Statistics. 2015. Labour Force Survey 2013. Dhaka; and Bangladesh Bureau of Statistics. 2012. Labour Force Survey 2010. Dhaka.

106
Bangladesh: Looking beyond Garments
more than 400,000 fewer in wholesale and retail trade and “other services” taken together.
These declines in employment were counterbalanced by an increase of more than 1.9 million jobs in manufacturing. While the survey does not provide a breakdown into particular categories of manufacturing sectors, it is likely that most of the employment growth was in the RMG sector. There were also large increases in employment in services, education, and health and social work. While of smaller absolute magnitude, there were very large proportional increases in women’s employment in the areas of accommodation and food service, public administration, and financial activities. The rate of growth of women’s employment in these areas is so great that should it continue for only a few more years, they will become important arenas for women’s participation in the Bangladeshi economy, though there are some questions concerning measurement—both finance and public administration saw large reported declines between the LFS 2005–2006 and the 2010 LFS. This suggests that there may have been issues with the industry classifications in the 2010 LFS. However, if real, the expansion in the range of women’s employment activities over a period of just 3 years is startling. It appears to indicate a much broader opening in the range of employment opportunities for women, with an extraordinarily fast movement from more traditional employment to more modern and higher-skilled work.
There are indications that the labor market for women in Bangladesh is in the midst of a major transition. Using the data from the 2010 LFS, the participation rate for women based on status as a paid employee was 5.4%. By 2013, in just 3 years, this had nearly doubled, to 10.2%.123 This is particularly significant given the difficulty in measuring the overall FLFP rate. Rahman and Islam (2013), are among those who have noted the difficulty, and suggest that alternative measures be examined, such as the number of paid employees, that it may be more accurately measured. Participation in the category of “unpaid family worker” or “contributing family helper” has declined. While the overall employment of women has increased
____________________123 For the purposes of these calculations, domestic servants are not included as “employees,” even if they report working for pay or profit. This is because of the
potentially complicated status of domestic servants. Thus, the reported participation rates likely understate the share of women working as paid employees.
rate. The most important quantitative change was a huge fall in women’s agriculture-related employment; this amounted to a reduction of employment by nearly 1.5 million. While from the raw number, it is impossible to judge whether this is the result of changes in supply or demand, or some combination, given that in Bangladesh the roles of women in agriculture are largely traditional, it is likely that the reduction in employment largely comes from labor supply.
Consistent with this idea is that, while overall FLFP declined between 2010 and 2013 in both urban and in rural areas, the decline was substantially less steep in urban areas, where it fell by only 1.6 percentage points. This strongly suggests that a large part of the drop in female participation is the result of reduction of participation of women in the agriculture sector. However, another possibility is that the fall in agricultural employment of women was, at least in part, the result of more attractive opportunities in other industries. Other traditional sectors for female employment also saw shrinkage. There were nearly 50,000 fewer women employed in construction and
Industry 2010 2013
Total 16,202 16,846Agriculture, forestry, and fishing 10,506 9,008Manufacturing 1,907 3,782Construction 227 168Wholesale and retail trade 1,027 776Transportation and storage 245 114Accommodation and food services 56 120Financial and insurance activities 52 80Public administration and defense 36 108Education 326 712Human health and social work
activities165 292
Other service activities 718 553Activities of households as
employers845 974
Table 6.3: Employment of Women by Industry for Key Industries, 2010 and 2013 (‘000)
Note: Only industries with at least 50,000 women employed in either year are included in the table, but the totals include all industries.Sources: Bangladesh Bureau of Statistics. 2015. Labour Force Survey 2013. Dhaka; and Bangladesh Bureau of Statistics. 2012. Labour Force Survey 2010. Dhaka.

107
Women at Work
significantly since 2010, the number of female unpaid family helpers fell from 9.11 million to 8.75 million. Further, the number of female own-account workers in agriculture fell by nearly 1.5 million. This confirms the idea that the largest part of the overall fall in FLFP rate is associated with falls in reported agricultural employment of women, and in particular among and in particular among own-account agricultural workers.
One part of the structural change in the employment of women is the changing composition of the sectors that employ women documented above. Sectors where female employment is declining are more traditional: by far the largest part of the drop in employment is in the agriculture sector. The expanding sectors are generally more modern and require more education and skills than do the shrinking sectors. Table 6.4 shows this difference. While only 6% of the women employed in agriculture have higher secondary education or more, women with such high levels of education make up the majority of female workers in information technology and in education, and nearly half of
those in the health sector. Chapter 5 discussed the overall need for improvements in skills and education in the Bangladeshi labor force as part of structural transformation and development of the economy. The evidence here suggests that this transformation may be even more important for women, because new employment opportunities are concentrated in high-education sectors.
There are significant regional variations in FLFP rates in Bangladesh. Participation is highest in the Dhaka and Chittagong divisions (Table 6.5), where most of the RMG factories are located. In general, the participation rates vary with the degree of urban population in the division. Rangpur and Khulna both have FLFP rates below 30%, though the changes in different direction in different divisions relative to the 2010 LFS suggest that there may be significant sampling or other errors in the survey data, possibly associated with the general difficulty in measuring FLFP.
Level
Agriculture, Forestry
and Fishing Manufacturing
Accommodation and
Food ServiceInformation and Communication Education
Human Health and Social Work
Activities
None 27 12 17 0 1 8Primary 46 25 28 3 6 12Secondary 21 49 35 36 20 29Higher Secondary 5 11 12 32 36 30Tertiary 1 3 9 29 35 16Other 0 1 0 0 1 6
2010 Labour Force Survey 2013 Labour Force Survey
Division
Female Population 15 and
Older(‘000)
Female Labor Force(‘000)
FLFP Rate (%)
Female Population 15 and
Older(‘000)
Female Labor Force(‘000)
FLFP Rate (%)
Barisal 949 2,944 32.2 3,058 945 30.9Chittagong 2,743 8,846 31.0 9,809 3,568 36.4Dhaka 5,565 15,300 36.4 18,401 6,614 35.9Khulna 2,093 5,747 36.4 6,516 1,754 26.9Rajshahi 4,891 12,100 40.4 7,328 2,500 34.1Rangpur 6,163 1,830 29.7Sylhet 942 2,796 33.7 2,934 945 32.2
Table 6.4: Women with Different Education Levels in Selected Industries, 2013 (%)
Table 6.5: Female Labor Force Participation by Division, 2010 and 2013
Source: Bangladesh Bureau of Statistics. 2015. Labour Force Survey 2013. Dhaka.
FLFP = female labor force participation. Source: Analysis of Bangladesh Bureau of Statistics (BBS). 2015. Labour Force Survey 2013. Dhaka; and BBS. 2012. Labour Force Survey 2010. Dhaka.

108
Bangladesh: Looking beyond Garments
The role of poverty in determining FLFP through the development process has received significant study since Goldin (1995) described a “U-shaped” pattern, in which FLFP is high during the early stages of development, falls as a country becomes richer and then rises again as a country approaches rich-nation status. Such a pattern persists in the cross-country data, though not especially strongly (Verick 2014 and IMF 2013). One view of the U-shaped pattern is that poverty compels FLFP at low levels of development; in this view, in poor countries dominated by subsistence farmers, families need all of the labor that they can access, including labor supplied by women.
Some authors have suggested that the role of poverty in female labor supply may be particularly acute in traditional patriarchal cultures, such as that of Bangladesh. For example, Amin (1997) writes that, “when women work for cash, the fact of their publicly engaging in work in violation of purdah causes them to lose status.” Later research has confirmed that such attitudes continue to be present in at least some parts of the population.124 Salway, Jesmin, and Rahman (2003) found that even among poor women in Dhaka, a woman’s employment may cause a loss of prestige for her family and may be considered a sign of poverty; such attitudes have been traditionally internalized by women, who may regard employment as implying loss of status and honor. If such factors are indeed operative, then they will create a stronger relationship between poverty and FLFP.
Using the HIES data, Bridges Lawson, and Begum (2011) found a positive link between poverty and the FLFP rate. However, Rahman and Islam (2013) caution that there are potential problems in using the HIES data to measure labor supply, in particular the fact that it reports an extremely low overall level of FLFP. Salway, Jesmin, and Rahman (2005) also find a strong statistical relationship between poverty and FLFP in their survey of Dhaka slum dwellers. While the LFS is likely more reliable for labor supply than the HIES, it does not include data on poverty. Rahman and Islam (2013) use land holding, which is included in the LFS, as a proxy for studying the poverty-female labor-supply nexus. The analysis in Table 6.6 follows on that
approach. It contains different measures of FLFP for different categories of landholding.
The overall rate of FLFP declines with the size of land holdings, though there is little variation across landholdings greater than 2 acres. Paid labor follows a similar pattern: the landless have the highest rate of paid employment, then there is limited variation among smallholders, and much lower labor supply among those with holdings of 20 acres and above. The pattern for own-account and family labor is less clear. There is a somewhat lower rate of such employment for the landless, but no clear pattern across different sizes of holdings.
This differs from the results of Rahman and Islam (2013 ), who found, using the 2010 LFS, that there was quite a strong pattern of increasing own-account and family employment with increasing land holdings. This may reflect a real change between the two surveys. Recall that the drop in overall FLFP between the two surveys appears to be accounted for primarily by a fall in own-account and family agricultural labor. This would be consistent with a poverty-driven labor-supply explanation: as poverty has declined in the Bangladeshi countryside, own-account and family labor have declined. Paid labor on the other hand, has increased across the different categories of land holding. But a good deal of the increase in paid labor is different, including more high-skill jobs that may be less subject to social stigma. To help examine that
Land Holdings FLFP RateFemale Rate of Paid Labor
Female Rate of Own-
Account or Family Labor
No land 41.3% 18.6% 16.7%land >0, <2 acres 38.2% 12.0% 19.4%land >=2, <5 acres 33.0% 11.7% 17.1%land >=5, <10 acres 34.2% 9.6% 20.6%land >=10, <20 acres 32.8% 10.2% 19.4%land >=20 acres 30.6% 6.4% 21.5%
Table 6.6: Land Holdings and Female Labor Force Participation
FLFP = female labor force participation. Source: Analysis of Bangladesh Bureau of Statistics. 2015. Labour Force Survey 2013. Dhaka.
____________________124 For example, see Salway, Jesmin, and Rahman (2005).

109
Women at Work
question, we now turn to education and labor force participation.
Table 6.7 contains figures on different measures of FLFP by level of education. Overall FLFP has a nonlinear relationship with education. Those with no education have the lowest labor force participation, but this group is mostly older, as primary enrollment rates have now been high for many years. The primary education group has a high level of labor force participation, with lower levels for secondary and higher secondary education. Women with tertiary education have the highest participation rates. However, the patterns differ strongly between paid labor and own-account or family labor. The rate of paid employment increases strongly and consistently with education. Own-account or family labor has a nearly opposite pattern, with a high level among those with only primary school education and declining rates as education rises.
Multivariate regression analysis confirms that these basic patterns persist when controlling for other variables. The overall pattern suggests a labor market for women that is somewhat bifurcated. There is the traditional home production and agricultural support role followed by many women with relatively low education and limited land holdings. There are low-status, low-wage paid jobs that are also held by poor women with low education. Then there is an expanding range of paid employment that is more accessible to better-educated women; it is this last category where the increase in employment appears to be largest.
6.3.1. Female labor force participation and unemployment
Unemployment for women is much higher for women than for men in Bangladesh. Through much of this section, the focus has been on the supply of female labor as a contributor to FLFP, as opposed to the demand side. Women who would like to work outside the home, but cannot find appropriate employment, may become discouraged and leave the labor force. Though difficult to quantify based on available data, the likelihood of it happening in Bangladesh may be substantial. In 2013, in rural areas the unemployment rate for women was 5.8% as compared with 2.8% for men, while in urban areas, the respective figures were 10.9% and 3.6%. These figures may not entirely represent discrimination in hiring; with men often regarded as the primary earners in families and many families being very poor, many men may accept any sort of employment that is available. Women, being in some cases regarded as secondary earners, may be able to wait until more appropriate jobs become available. However, women facing higher unemployment may also be more likely to become discouraged and thus drop out of the labor force.
Perhaps a better indicator of difficulties faced by women in the job market comes from comparing young men and women with higher levels of education; highly educated youth of either sex are more likely to have the financial resources to wait for appropriate employment. As discussed in Chapter 5, the School-to-Work Transition Study, based on a survey conducted in 2012, found extremely high rates of female unemployment for young women (aged 15–29): 21.6% for those with secondary education and 31.5% for those with tertiary education, as opposed to 8.3% and 22.5% for men with the same educational levels. These rates strongly indicate a lack of employment opportunities for better-educated women. It is not just that many women or their families do not want to engage in paid labor; there are also many women who want to work, who are looking for work, but cannot find positions appropriate to their educational level.
Level of Education FLFP RateFemale Rate of Paid Labor
Female Rate of Own-
Account or Family Labor
None 21.1% 3.9% 13.8%Primary 52.4% 9.7% 39.4%Secondary 33.0% 14.2% 15.7%Higher Secondary 35.6% 15.2% 13.1%Tertiary 54.2% 35.1% 10.0%
Table 6.7: Education and Female Labor Force Participation
FLFP = female labor force participation. Source: Analysis of data from Bangladesh Bureau of Statistics. 2015. Labour Force Survey 2013. Dhaka.

110
Bangladesh: Looking beyond Garments
6.3.2. Women and migration
As discussed in Chapter 4, international migration provides a significant source of employment for Bangladeshi workers, with many of them working in the states of the Persian Gulf. Historically, the vast majority of migrant workers have been men, however. It has already been noted above that Bangladesh has a large block of “missing men,” in the sense that the working-age population of women exceeds that of men by 2 million. Data from the 2013 Survey on the Use of Remittances (BBS 2014) indicates that only about 3% of migrants are women, with most working in domestic service. Through 2003, female migration abroad was insignificant, with fewer than 2,500 migrants in any 1 year. By 2011, migration began to rise quite rapidly, reaching more than 30,000; by 2014, a record 76,000 Bangladeshi women traveled abroad for work, and in 2015 migration was on track to exceed that level.
The main destinations for female migrants are Jordan, Oman, Saudi Arabia, Qatar, and the United Arab Emirates.125 It is difficult to track the economic impact of female migrants, because remittances are not recorded separately for men and for women. Female migrants from Bangladesh work in a relatively narrow range of positions, domestic service the most important. Some also work in garment factories, likely after gaining experience in Bangladesh (ILO 2014d).
While, as discussed in Chapter 4, most Bangladeshi migrants are less skilled overall, more than 90% of female migrants are less-skilled (ILO 2014d). One small but growing category of higher-skilled female emigrants is nurses. Historically, Bangladesh has trained relatively few nurses, compared with doctors, but the Ministry of Health and Family Welfare is trying to increase the number of nurses. As that happens, some of the newly trained nurses are looking at working abroad, given higher wages and a well-developed international market for nursing skills. Some participants in health care in Bangladesh have stated that they believe this will soon create problems in the supply of nurses, as Bangladeshi health facilities attempt to expand their staffing of nurses in the face of competition from higher-paying foreign markets.
It is clear that female migrants may face vulnerabilities when working abroad to a greater extent than men. In the primary destination countries for female migrants, there are few regulations or rights regarding domestic workers. Mistreatment of domestic workers has been reported on in international news in each of the top destination countries for female Bangladeshi emigrants. The nature of the work means that female migrants are often isolated, making them especially vulnerable; that same isolation and lack of regulation also makes it extremely difficult to build an accurate picture of the level of risks faced by female migrants. With female migration rising sharply, it is difficult for potential migrants to be reasonably informed of the risks that they face when there is very little understanding of those risks. At current rates of growth, migration will soon become a substantial source of employment for Bangladeshi women, and it is not yet clear whether or not this will be a positive development.
6.4 Barriers to Full Participation in the Working World6.4.1. Attitudes of men and of women
Attitudes toward women and work are clearly difficult to change, being embedded in an overall social system involving specification of gender roles and power dynamics in families and in communities. The rapid increase in the share of Bangladeshi women who are employed in paid labor indicates that these attitudes are subject to change, even though the women in paid employment still make up a small minority of the working-age population. That said, for many women, labor force participation might be a limited option, which may make it more difficult to design policies to increase it, or to increase it past a certain level.
One case in point is a study of slum dwellers in Dhaka (Salway, Jesmin, and Rahman 2005) which found “…many examples of male heads ‘sending’ female members to work or ‘withdrawing’ them from the labor market as and when they saw fit. Young women who had worked before marriage were found to often
____________________125 Bureau of Manpower, Employment and Training. http://www.bmet.org.bd/BMET/stattisticalDataAction (accessed 29 June 2016).

111
Women at Work
give up their job once married at the demand of their new husband.”
Quantitatively, the same study found that 38% of surveyed women reported that their husband’s objection was the main reason for not working; 53% reported that their husband would simply not allow them to work under any circumstances. These types of attitudes are corroborated by statistical results that find lower labor supply among married women (Rahman and Islam [2013] using the LFS 2010 data.) These kinds of constraints mean that, at least for certain segments of the population, female labor supply will not respond properly to market signals.
External constraints may exist on female labor supply, imposed by husbands or male relatives, as well as problems associated with internalized values on the part of women. Bridges, Lawson, and Begum (2011) note that the traditional view that men should be the main provider still holds in many parts of the country, especially in rural areas, with a greater weight attached to a woman’s domestic rather than market activities. Men’s economic activity is therefore valued as within the proper sphere of males, while female economic activity is not valued in the same way, because it violates the traditional spheres of activity. So, for the same sorts of reasons that women may be reluctant to identify their activity on the family farm or business as “labor,” leading to an undercount of the FLFP rate, women may regard market economic activity as providing an inferior contribution as compared with domestic activities. This in turn may create an attitude in which female market labor is regarded as an emergency fallback for families—a temporary violation of norms that is necessary in hard times. This would be one pathway that could create the poverty–labor force participation relationship that appears to exist in Bangladesh.
6.4.2. Gendered economic spheres
The designation of certain kinds of labor as either for women or men, still exists strongly in traditional agricultural activities. As time use studies have
shown, the division is sharp between tasks considered appropriate to men and tasks considered appropriate to women, with some of the distinction resting within the tradition of purdah, designating what is allowable or forbidden for female labor inside or outside the home. For example, processing of paddy into rice for family consumption is normally a “female job,” as is taking care of poultry, whereas most fieldwork is assigned to men.126 Because the traditional division is focused on inside versus outside work, it can be difficult for women to enter into market activities in agriculture or most other rural economic activities, because the market activities are largely “outside” work. The exceptions would include certain kinds of crafts production for which the work can be conducted at home.
Outside of the traditional rural agricultural household setting, there are also significant restrictions on the scope of women’s work, especially the work of poor women. Salway, Jesmin, and Rahman (2005) observes that there is a relatively short list of possible market economic activities available and one of those is factory work in the RMG industry, which is an exception to the traditional gender division of economic spheres.
The proportion of women in the RMG industry is somewhat unclear. Based on the 2012 Survey of Manufacturing Industries, the workforce of the industry was 64% female, and a similar figure has been reported from a survey conducted by the Department of Textiles (Government of Bangladesh 2009) as cited by World Bank (2012b). However, the 2012 Survey of Manufacturing Industries only reports total employment of 2.75 million in the sector, as compared with the 4.00 million figure reported by the Bangladesh Garment Manufacturers and Exporters Association.
The Survey of Manufacturing Industries figures from 2012 are also inconsistent with the 2013 LFS figures: the Survey of Manufacturing Industries estimates a total number of women in the entire manufacturing sector as 2.2 million, as compared with 3.8 million estimated by the 2013 LFS. Some sources also suggest that knitwear production, which has become an increasingly large proportion of the RMG sector over the last decade, uses a more heavily male labor force,
____________________126 See Rahman and Islam (2013) for a discussion of some of the division of tasks between men and women and the implications for measurement of the FLFP rate.

112
Bangladesh: Looking beyond Garments
but this is not supported by the Survey of Manufacturing Industries data, in which similar proportions of women in the woven and knit sectors are reported. Industry participants have stated figures closer to the 80% range, or even 90% for the fraction of women working in the RMG sector. Given that all sources agree that the vast majority of female manufacturing workers are in the RMG sector, a female employment share of around 75%–80% would be consistent with the Bangladesh Garment Manufacturers and Exporters Association and LFS figures. A recent survey conducted by academic researchers found that about 80% of operators were women (Macchiavello, Menzel, and Woodruff 2014). Whatever the true share of women in the RMG industry, it is clear that the industry’s labor force is dominated by women and that the industry dominates women’s employment in the manufacturing sector.
Different narratives illustrate the story of how women came to dominate employment in the RMG industry. Tailors in Bangladesh have traditionally been men and, indeed, custom tailoring remains largely a male preserve. Even within the RMG sector, jobs for women and jobs for men are largely segregated. For example, sewers are generally women and cutters are generally men. Some industry participants attribute the difference to greater needs for physical strength for cutters and greater need for dexterity in sewing that is met by the smaller hands of women. The “nimble fingers” argument would not, of course, explain the traditional role of men in tailoring.
Most accounts of the origins of the RMG industry put emphasis on the role of the Desh Garment Company and its founder Noorul Quader, who opened one of the first modern RMG factories in Bangladesh, in cooperation with the firm, Daewoo, from the Republic of Korea. Quader visited apparel factories in the Republic of Korea in the late 1970s and, reportedly, was so amazed by the number of women working in the factories there that he appealed to the government to allow women to be trainees for his new enterprises (Rhee 1990 as cited by Feldman 2009). Many commentators from the industry, academic, and
from international organizations, argue that the main reason for employing women in the RMG industry in Bangladesh has been their low cost, on account of limited alternative sources of employment, and the belief on the part of employers that women are more docile and less likely to organize into unions than men.127
Some economic theory suggests that the first motivation, the low wages that can be paid to women, is a central mechanism by which market economics can work to reduce or even eliminate labor market discrimination (Becker 1957). If these are indeed the motivations for employing women in the RMG sector, it is not clear that they would not motivate employers to look for female workers in other industries as well. The only connection to traditional gender roles in work would be that women typically engage in sewing in the household, though the pattern sewing with machines in modern RMG factories bears little resemblance to traditional tasks. Thus, on the whole, the history of the RMG industries indicates that the power of traditional gender roles, traditions, and purdah have, taken together, great but limited power.
New industries may move into the sphere of women’s work; however, because of traditions of gender segregation, it may be helpful to focus on some subset of the emerging industries in Bangladesh (see Chapter 3) as ones appropriate for women’s employment. In the long-run, breaking through the barriers that create gendered divisions of work will be necessary for women’s full participation in the working world, but in the shorter term it may be helpful to create new domains for women in growth sectors.
Apart from the RMG sector, even in urban areas, there are relatively few types of jobs that are available to women. Construction work, where women’s employment has been falling, finds women concentrated in brick-breaking.128 Another avenue open to poor urban women is domestic service. Opportunities for more educated women, however, are expanding. More positions are now open to women in health, public administration,
____________________127 For example, see Kabeer (2001).128 Construction work, often outdoors and highly visible, appears to be something of an exception to the traditional spheres of women’s work. However, following the
discussion of FLFP and poverty in section 6.3, part of the decline in female employment in construction may be the result of falling poverty rates (Salway, Jesmin, and Rahman [2005], and Choudhury [2013]).

113
Women at Work
and education. Nonetheless, while reason exists for cautious optimism, based on the success of women in the RMG sector and from the expansion of women’s employment into new areas, the entrenched idea of separate economic spheres for women and men is likely to remain a significant barrier to women’s employment prospects for the foreseeable future.
6.4.3. Lack of supporting infrastructure for women’s employment
One factor that limits the employment prospects of women is the availability of safe and affordable public transportation. Women do not necessarily feel safe walking long distances to a work site, especially if it means coming home at night. One study of poor women in Dhaka found that a lack of affordable public transport also hampers women’s participation in the labor force. As has been reported in local media, many have complained of harassment of women on buses in Dhaka, such that some bus drivers prefer not to carry female passengers and may not stop for them; and conductors may not even make change for women (Rahman 2010). A limited number of women-only buses are available in Dhaka, but because of the limited route coverage, they serve as a solution for only a small fraction of women.
Lack of availability of child care is another issue that limits women’s participation in the labor market. A negligible number of employers make child care available to their employees and the number of young children in a family predicts lower female labor supply (Rahman and Islam 2013, as well as analysis of the 2013 LFS data). Some workers in RMG factories who have young children leave them in their home villages while paying a monthly stipend for their care, but there is concern that the level of quality of child care in such arrangements may be poor. However, the rapid decline in fertility has led to some reduction in the importance of child care as a constraint to female labor market participation.
6.4.4. Violence against women
One potential effect of FLFP is increased domestic violence, at least for some segments of the population of working women. Another area of concern is violence at the workplace and on the way to or from work. A survey on violence against women conducted by the BBS in 2011, provides some information on workplace violence against women. In this survey’s representative sample, 0.4% of women report having experienced physical violence at the hands of a co-worker or boss. While this rate may initially appear fairly low, it should be multiplied by about three to adjust for the relatively low rate of FLFP.129 At this rate, a woman who works outside of the home for 20 years would have a 21% chance of experiencing violence in the workplace.130 Another measure of workplace violence can be obtained from the LFS 2013 data; the survey asks whether a worker has ever been beaten or physically hurt at work. By this measure, 1.3% of women have experienced violence at work, though this may well understate the true level, because the survey respondent is not necessarily the woman affected. There are no internationally standardized statistics to which this can be compared, but it is clear from Bangladesh survey data that violence in the workplace poses a significant hazard for female workers. While there are no high-quality statistics on sexual harassment in the workplace, it is safe to say that this is also a significant problem.
6.4.5. Early marriage and motherhood
More than half of young married Bangladeshi women were married before the age of 18 and a substantial fraction were married before 15. Analysis of factors involved in female labor supply finds significant reductions in the expected level of labor force participation for women who are married. Many married women report that their husband substantively controls their ability to participate in the labor force and that, in many cases, the husband categorically refuses to allow his wife to work outside the home.
____________________129 The adjustment used, multiplying by three, is approximate. The correct scaling factor would be the inverse of the fraction of women working outside of their
homes in any given week. Since this is not available, a rounded adjustment has been used. Given the estimated level of the FLFP rate, this adjustment likely understates the true level of workplace violence.
130 A survey conducted by the nongovernment organization, War on Want (War on Want 2011), found a much higher rate of workplace violence in RMG factories, though this is inconsistent with other reports that women feel that work in RMG factories is safer than other work available to poor women, because of the large numbers of women present in the factories.
114
Bangladesh: Looking beyond Garments
On the other hand, if unmarried women are being forced to join the labor market by economic circumstances, that is because not having a husband to provide economic support forces them into paid work, but would prefer to be married but not working, then the early age of marriage would not be an issue. It is very likely that this is the case for at least some women.
However, there is evidence that this does not apply for all women and that the early age of marriage has potential economic costs. Heath and Mobarak (2015) find that the availability of potential work in garment factories leads to a significant reduction in the chances of early marriage, an indication that given the option of working outside the home rather than marrying and staying at home, a significant number of women will take that option, at least for some period of time. Such opportunities also lead to a reduced chance of early childbirth and its associated medical risks. As discussed, the number of young children that a mother has is negatively associated with labor supply—unsurprisingly given the limited availability of appropriate child care.
Thus, for both early marriage and early childbirth, there is a complex relationship with female labor supply, and associated cultural norms such as male control over female labor supply act as brakes on FLFP. On the other hand, causality also runs from the labor-demand side. When paid work, such as RMG factory work, is available, some young women will choose that work, instead of choosing early marriage. Not all women, of course, have a great deal of say in the matter, but the evidence is that either some do, or at least that the opportunity to bring home cash income provides enough bargaining power within the family to allow the delay of marriage. The tradition of early marriage is, in part, the result of a traditional family structure in which daughters are viewed as an economic burden to their parents, so that early marriage is in the economic interest of the family. If daughters instead, have a substantial ability to earn cash income, then that economic calculus is upended. Given the different
factors at work, it is difficult to evaluate the overall effect of early marriage and childbirth as limiters to the growth of female labor supply. It may be that if sufficient opportunities become available for women, that women, at least younger women, will be able to change the course of their lives to take advantage of those opportunities.
6.4.6. Age
By cohort, FLFP rates decline substantially after age 30, based on the 2013 LFS, as compared with the 2010 LFS data, which did not indicate substantially declining labor force participation rates until much older cohorts. However, the cohort data cannot be interpreted to show directly that age is, in itself, acting as a limit on the FLFP rate. Despite the modest fall in the measured FLFP rate between the 2010 and the 2013 labor force surveys, the overall trend has been toward increased FLFP over time. Older cohorts, on average, have different attitudes toward women in the labor force, with younger generations being generally more open to women’s economic contribution. Thus, when we observe lower labor force participation rates in older female cohorts, it is impossible, without further information or analysis, to evaluate whether that is the result of changes over time in societal attitudes or of barriers to labor force participation that are more prevalent for older women.
In the RMG industry, the issue of the age of workers has been examined to some extent, but there appears to be more discussion than data. Many observers have noted that almost all women working in RMG factories are young. However, there are no high-quality recent data that shows the age distribution of such workers. Older data indicate a very young workforce, but one that appears to have been getting older over time. Surveys in 1990 and in 1997 found that more than half of female RMG workers were 19 years old or less and that less than 10% were 30 years old or older (Majumder and Begum 2000). A recent study involving nearly 100 factories found the average age of female workers

115
Women at Work
to be 23.6 years, more than 3 years older than the average in the earlier years (Macchiavello, Menzel, and Woodruff 2014).
Despite the lack of comprehensive data on the age of female workers in RMG factories, most workers are undoubtedly young, with only a small fraction over 30 and hardly any over 40. There appears to be very little information concerning the reasons for why women leave the industry. Some have argued that employers discourage older workers from staying on in the factories because of a perception that they are slower or more error prone (Rahman and Islam 2013). Others have suggested the possibility that employers do not want employees who stay for many years because they are increasingly likely to become involved with union organizations or otherwise fight for workers’ rights. Finally, studies in which female workers in RMG factories have been interviewed have found that many workers indicate that they consider employment in the factories a relatively short-term arrangement. Some express the opinion that the work is too difficult to be sustained for many years and others that once they have more children they intend to leave the factories. Yet, another possible explanation is that women leave because there is little opportunity for advancement; as discussed in section 6.6.4, the vast majority of supervisors and managers at RMG factories are men, leaving few avenues for women to improve their positions. Of course, all of these factors may be in play, but there has been very little systematic research on this question. Further, there appears to be little or no research on the question of what women do after they leave RMG factories. Understanding more about the long-term effects on workers in RMG factories would be very helpful for analyzing FLFP and the economic effects on women of the expanding RMG industry.
6.5 Avenues for Expansion of Labor Force Participation6.5.1. Women in traditional and emerging sectors
As the discussion so far indicates, there are at least some young women who would become available to the labor market where good job opportunities are available. Given the history of the RMG sector, new growth sectors could become important sources of paid employment for women, especially if some factories focused on recruiting large numbers of female employees at once. The LFS does not contain detailed industry information, only the broad sectors for which statistics have been reported above. As such, the 2012 Survey of Manufacturing Industries contains the most detailed information on women by more detailed industry, even though it appears to undercount overall female employment in manufacturing.
Table 6.8 shows male and female employment in selected manufacturing industries in 2012. The table includes all 2-digit BSIC manufacturing industries with 20,000 or more female employees as well as the pharmaceutical industry, which has been promoted by some as a potentially important growth industry.131
____________________131 The Bangladesh Standard Industrial Classification (BSIC) is the standardized system of industrial classification used by the BBS. The two-digit level is the second
highest level of aggregation.
Table 6.8: Employment in Selected 2-Digit BSIC Manufacturing Industries, 2012
BSIC = Bangladesh Standard Industrial Classification. Source: Bangladesh Bureau of Statistics, Survey of Manufacturing Industries 2012.
Manufacturing IndustryFemale
EmployeesMale
EmployeesWorkforce
Female
Food products 63,884 207,337 23.6%Tobacco products 34,654 51,550 40.2%Textiles 233,111 559,230 29.4%Wearing apparel 1,765,985 987,567 64.1%Leather and related
products 22,064 51,583 30.0%Non-metallic mineral
products 55,003 411,693 11.8%Pharmaceuticals 9,983 60,990 14.1%

116
Bangladesh: Looking beyond Garments
Apart from employment in the RMG sector, textile manufacturing is the only 2-digit industry employing more than 100,000 women, accounting for nearly 30% of the workforce in the industry, many of whom are working in traditional production modes, such as in the jute industry and handloom manufacturing. However, the Survey of Manufacturing Industries data are not sufficiently detailed to determine the exact percentage working in traditional versus modern production. The next largest industry employing women is food products, with the majority of the estimated 60,000 women working in traditionally female areas of rice and tea processing.132 There are some 55,000 women employed in non-metallic mineral products, with the vast majority involved in brick-making; about 35,000 women work in the tobacco industry, mostly in traditional roles, such as bidi rolling. Thus, apart from the RMG sector, most women in Bangladesh’s manufacturing sector work in fairly traditional manufacturing processes in industries not focused on exports.
The leather sector employs more than 20,000 women, the vast majority of whom are manufacturing footwear. A recently modernizing sector, it has started to find significant export markets and women make up a substantial fraction of the workforce. As such, the footwear industry is one industry that may provide significant employment opportunities for women in the future. The pharmaceutical industry, while only currently employing about 10,000 women who make up 14% of the industry’s workforce, is viewed as a candidate industry that may contribute to the diversification of the economy. The country’s very small consumer electronics industry, which employed only about 4,500 people in 2012, of which 45% are women, also merits an examination. This is significant for Bangladesh because many countries, especially in Asia, on the way to moving to middle-income status, have built substantial industries in electronics assembly, often with a largely female workforce.Industry participants have begun hiring women, and a rapid expansion in this industry could provide another source of paid employment for Bangladeshi women.
In addition to the manufacturing sector, some expanding service sectors, such as information technology and finance, are employing increasing numbers of women, though the current aggregate effect on female labor demand is small. In information technology, women made up only 5.5% of workers in 2010, but nearly 15% in 2013, and many reports suggest that women’s demand for information technology education is very strong. This is a sector that could quite rapidly become important in Bangladesh, as it has in India, so that the increase of women’s involvement in the sector is potentially important.
Based on the pattern of women’s employment and the relative size of industries, it is clear that the RMG and textile industries will remain women’s main source of nonagricultural employment for some years. In the medium term, the footwear sector is most likely poised to produce substantial further employment for women. While there are very encouraging signs in several other potential growth sectors, these are unlikely to be quantitatively important for some years, they may provide more opportunities for more highly skilled and educated women.
6.5.2. Expanding women’s sphere of economic activities
The existence of discrete spheres of economic activity for men and women has created strong separation in employment for men and women, with, as we have seen, women concentrated into a very narrow range of employment types. So long as this structure exists, there will be no way to find productive employment for a share of Bangladeshi women even approaching the share of men in the labor force. Thus, without broadening the sphere of women’s economic activities, there will be no way to achieve the sort of additional growth from FLFP that was discussed in the first section of this chapter. As we have seen, some barriers are beginning to break down. The range of employment available to women, especially paid employment, has expanded greatly, though from an exceedingly
____________________132 Lower-level industry breakdowns here and below are based on 3- and 4-digit data, also from the 2012 Survey of Manufacturing Industries.

117
Women at Work
narrow base. Further, much of the expansion, such as in education and health services, has been into areas that in other countries are highly female concentrated, as opposed to opening up into more traditionally male areas. Expanding policies to increase female participation in nontraditional activities will be one of the keys to opening the world of work to women.
6.5.3. Policies for increasing women’s labor force participation
Government policies can affect FLFP rates, positively or otherwise. Some important policies are already in place, and appear to have had positive effects. The various programs that have been implemented for increasing female primary and secondary education have been notably effective in eliminating the gender education gap. Because higher female education is associated with higher FLFP rate, it is likely that these increases in education are partly responsible for the sharp increase in paid employment for women, and the expansion of women’s employment in sectors such as education, health, and information technology. Programs to improve the availability of family planning along with the increases in female education have been partly responsible for the dramatic reductions in fertility in Bangladesh. Since reduced fertility is also associated with higher female participation, this is likely also a contributor to the expansion of women’s roles.
The Government of Bangladesh has long had a policy of reservation of 10% of positions for women, though it is not clear that this has invariably been enforced, and in the 2010 LFS less than 7% of public administration employment was of women. However, in the 2013 LFS, the comparable figure was 14%, indicating compliance, at least in the aggregate. The published figures in the Department of Finance’s Gender Budget indicate that not all ministries are meeting targets for women’s employment and advancement. As such, the first step should be to ensure that existing policies that positively impact the FLFP rate are fully implemented. In addition, the 10% figure, which may have seemed reasonable when the policy was first promulgated, should be revisited. Most of the emerging service sectors employ more than 10% women, and through
secondary school, educational attainment for women is higher than that for men. A substantially higher target would appear both feasible and desirable.
Bangladesh already has a relatively generous maternity leave policy in place. Employers are required to provide 16 weeks of paid maternity leave, as specified by the 2006 Labor Law. While, in principle, this is a policy that is likely to increase female participation rates, it is unclear how much impact it has in practice. It is unlikely to have any effect at all on anything but formal, paid employment, which limits it to a small minority of working women. No systematic evaluations appear to exist, but there are reports that paid maternity leave is generally not granted at most RMG factories and that most workers are not aware of their rights in this regard. One survey of about 1,000 women working in RMG factories, conducted by a British nongovernment organization, found that only about half of the interviewed women reported any form of maternity leave at their workplace and that two-thirds did not understand their rights to maternity leave; however, it is unclear how systematic or representative this particular survey was (War on Want 2011). If these reports are indeed correct, it would mean that only a tiny fraction of Bangladeshi working women, which would be largely those working for the government, is in practice provided with paid maternity leave.
As a first step, it would be helpful to conduct a more systematic survey of RMG workers to determine what the current status of maternity leave actually is. This could be combined with questions concerning other Labor Law compliance issues. While general compliance issues in the RMG sector are a serious concern, enforcement of rights to maternity leave should not be left out of attempts to improve compliance in the industry. Further, since female enrollment rates are now so high, it would be a low-cost intervention to simply mandate a curriculum unit on existing rights for women, both under the general legal system, and specifically in the workplace.
Several specific issues were discussed above as barriers to FLFP, including child care and transportation. In child care, policies could be put in place to assist employers in providing child care facilities and to help certify child care facilities in residential areas. Realistically,

118
Bangladesh: Looking beyond Garments
such facilities would have to be of limited scope in the short to medium term, but their establishment could help to move associated norms and accelerate the progress of women in the workplace. On the issue of transportation, public transportation is a challenge for all Bangladeshis that goes well beyond the scope of this chapter. However, expansion of women-only buses in Dhaka, and introduction in other areas with significant presence of RMG factories, along with enforcement of women’s seating areas on other buses, would provide some assistance to working women.
A recent study, Gonzales et al. (2015), has found an empirical connection between equal legal treatment for women under a country’s legal system and higher labor force participation. Although this is a very recent finding, and it leaves important questions about measurement of legal structures across countries and whether the statistical relationships found are causal,133 it nonetheless raises the important possibility that legal reform, guaranteeing women’s equality could help increase female labor supply. This is a promising avenue in part because such reforms could be executed with little ongoing expense. In Bangladesh, for instance, there are restrictions on the nature of women’s employment that do not apply to men.134 As discussed above, inheritance rights are also not equal between men and women. A comprehensive discussion of legal equality for women would go well beyond the scope of this chapter, but detailed information can be found in the World Bank’s Women Business and the Law database; there are several other areas in which women are not treated as legally equal to men in Bangladesh.
Since a large part of the Bangladeshi economy is informal and encouraging female entrepreneurship could potentially increase economic growth, policies that encourage women’s participation in small and medium-sized enterprises could be of great benefit (Cuberes and Teigner 2012). The Asian Development Bank has demonstrated the feasibility of such an approach, supporting the development of women-owned small and medium-sized enterprises from 2009 to 2013, including the training of women in business
development, accounting, loan processes, and in business regulation. In districts where the program operated, the number of women-owned small and medium-sized enterprises increased by more than 10%. Formal adoption of programs to support female entrepreneurship has thus been demonstrated to be an effective route to expanding female leadership in the small and medium-sized enterprises sector and merit serious consideration. Continued support for microcredit programs could also help in this regard.
Finally, very recent research on women’s labor force participation in India provides some potential insight into avenues for increasing women’s labor force participation in Bangladesh. India is an especially useful basis for comparison because the overall level of female participation is similar in India to that in Bangladesh and because at least some aspects of the traditional roles of women are similar in the two countries. Das et al. (2015) find many of the same drivers for FLFP as discussed in section 6.3, based on analysis of Bangladeshi data, providing confidence in the comparison, but have several additional variables that have not been examined with Bangladeshi data. In particular, they find that areas with better infrastructure as measured either by the availability of surfaced roads or by the efficiency of electricity transmission, have higher FLFP, other things equal. Ease of travel increases the scope of jobs available to women, especially when such opportunities are relatively limited; if there are only a few jobs available, a random woman’s chance of being near a job site is low.
The study also examines the effect of a specific employment program that has been implemented by India’s government, a program that guarantees 100 days of annual wage employment for all registered unskilled manual workers. While the guarantee is for all, the program seeks to ensure that at least 33% of participants are women, provides for child care at work sites, and stipulates work should be available within 5 kilometers of an applicant’s residence, all factors intended to increase women’s participation. The study finds that this program has increased labor force participation for both men and women significantly,
____________________133 For instance, it may be that unequal legal structures for women are simply the consequence of patriarchal social structures that constrain female labor supply, as
opposed to causing the constraints in and of themselves.134 Bangladesh Labour Act, 2006 (XLII of 2006). Articles 39, 40, 42, and 87.

119
Women at Work
but that the increase has been greater among women, and that this difference is statistically significant. This program has some similarities to the Employment Generation Program for the Poorest (EGPP) that has been operating in Bangladesh since 2010; this program also provides wage employment, with one-third of positions reserved for women. The findings in India suggest that the EGPP is likely to have been successful in increasing FLFP and also that it may be possible to increase the program’s impact on women. It also suggests that the expansion of EGPP, which now operates on a seasonal basis and is targeted only at the very poorest, may be helpful in providing employment opportunities for Bangladeshi women and may potentially help in breaking down the traditional gender spheres of economic activity.
6.6. Status of Women in the Workplace6.6.1. Legal environment
Some of the issues regarding the legal environment for working women in Bangladesh have already been discussed. There is mandated maternity leave, 10% of government positions are reserved for women and, at least in principle, equal pay for work of equal value is required (Bangladesh Labour Act 2006, Article 345). As will be discussed below, it is unclear to what extent the equal pay provision has been enforced. As noted, there are some restrictions on the types of work that women can undertake—in particular, the same restrictions that apply to adolescents also apply to women (Bangladesh Labour Act, Article 87).
The requirements to provide maternity leave are undercut by the absence of other legal protections. Employers may ask potential employees about their family situation, and there are no laws forbidding discrimination in hiring based on family situation. Further, employers are not forbidden from firing women because of pregnancy, nor are they required to rehire mothers returning from maternity leave. They are also not required to provide flexible working hours for women with young children.135
In a similar fashion, the requirement for equal pay is undercut by the lack of any specific provisions forbidding gender discrimination in hiring. Further, the degree of gender segregation in employment makes it more difficult to implement equal pay requirements: if all workers sewing in a factory are women, there is no easy comparison to be made for their wages, and if cutters happen to be paid more, who is to say that the work is equal?
While there are substantive legal provisions against sexual harassment, including sexual harassment in the workplace and in education, as well as criminal penalties136 for some forms of sexual harassment, the overall picture is one of substantial, but incomplete, legal protections for women in the working world. The level of enforcement of all of these legal provisions is, however, in question, an issue that has already been raised with regard to maternity leave.
6.6.2. Working hours
To begin our quantitative examination of the status of women in the workplace, we examine weekly hours worked, comparing men and women. Table 6.9 contains average hours worked per week by industry, based on the 2013 LFS. Some of the caveats discussed above concerning survey responses on women’s labor force participation will also apply to hours worked; especially for unpaid family labor, women may not count fully the time that they spend working when they answer survey questions. On average, women worked somewhat fewer hours than did men: 43 per week compared with 47 for men. In most industries, average working hours for women appear to be at reasonable levels, but two categories stand out for the length of their hours: manufacturing, dominated by the RMG sector for women and activities of households as employers. In manufacturing, women have, on average, a 51-hour work week, compared with 49 hours for men. In family activities, women work an average of 52 hours, with men putting in the same.
Reported average working hours for women increased substantially between the 2010 and 2013 LFS, but this
____________________135 Information on legal structures comes from the World Bank’s Women Business and the Law database (accessed July 2015); and the Labour Law of 2006.136 Criminal Code, Art. 509, The Prevention of Oppression Against Women and Children Act 2000, Sec. 10.

120
Bangladesh: Looking beyond Garments
was almost entirely accounted for by more hours in the agriculture sector. However, as discussed above, there has been a large decline in the number of women who report to be employed in the agriculture sector. It is possible that some women who were effectively working part time in agriculture in 2010 are now reporting themselves as out of the labor force, thus increasing the average hours of those remaining.
Mean hours worked do not give a complete picture of the demands placed on working women, as they do not show the high degree of variation in hours worked across individuals. Indeed, 26% of women work 55 hours a week or more, with the same level in the manufacturing sector as overall, and 10% worked 59 hours a week, with men working about 1 hour longer. Thus, as has often been reported, many women in the RMG industry are working very long hours indeed, but the same is true for women working in other industries in Bangladesh. There is relatively little variation in the fraction of women working more than 55 hours based on education.
6.6.3. Vulnerability of employment
Most Bangladeshis remain in vulnerable employment, as was discussed in Chapter 2. Table 6.10 contains data on employment status for men and women. By these categories, based on the ILO definition of vulnerability as the sum of own-account work and unpaid family labor, 62.6% of Bangladeshi women are in vulnerable employment, as are 57.5% of men. However, most of the women working in the “other” category are employed as servants, and it is reasonable to think that most of them should be broadly considered to be in vulnerable employment. If one were to make this adjustment, then more women than men are in vulnerable employment, by a margin of nearly 10 percentage points. That said, the large increase in the number of women working as employees has led to a decline in the fraction of women in vulnerable employment since 2010.
Apart from vulnerability, there is also an issue of employment in the formal or informal sector, although there are multiple definitions of the concept of
2010 2013
Industry
Men,Average Weekly Hours Worked
Women,Average Weekly Hours Worked
Men,Average Weekly Hours Worked
Women,Average Weekly Hours
Worked
Total 51 35 47 43Agriculture, forestry, and fishing 49 31 44 40Manufacturing 51 48 49 51Construction 52 50 51 47Wholesale and retail trade 53 46 50 44Transportation and storage 55 43 50 44Accommodation and food services 56 44 50 44Financial and insurance activities 48 46 49 46Public administration and defense 49 45 44 40Education 48 47 42 39Human health and social work activities 52 50 48 44Other service activities 53 26 48 42Activities of households as employers 53 32 52 52
Table 6.9: Weekly Hours Worked, by Selected Industry, 2010 and 2013
Note: The industries with the largest numbers of female workers are included.Source: Analysis of data from Bangladesh Bureau of Statistics. 2011. Labour Force Survey 2010. Dhaka; and Bangladesh Bureau of Statistics. 2015. Labour Force Survey 2013. Dhaka.
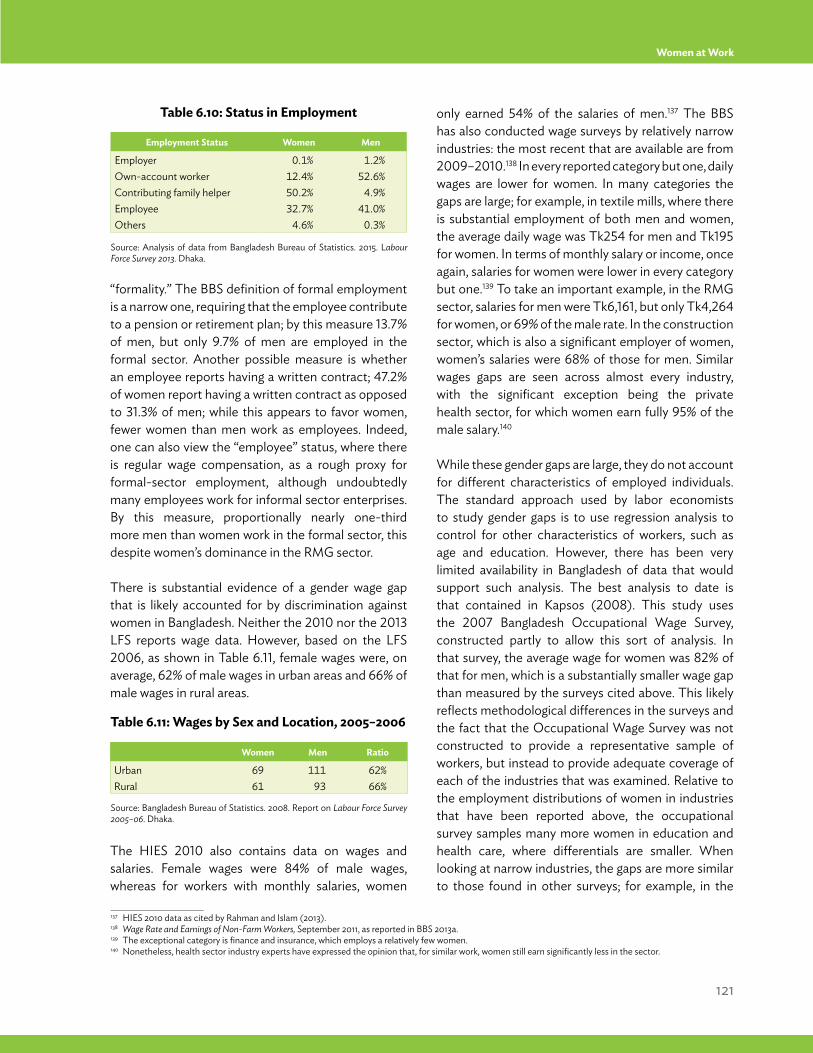
121
Women at Work
“formality.” The BBS definition of formal employment is a narrow one, requiring that the employee contribute to a pension or retirement plan; by this measure 13.7% of men, but only 9.7% of men are employed in the formal sector. Another possible measure is whether an employee reports having a written contract; 47.2% of women report having a written contract as opposed to 31.3% of men; while this appears to favor women, fewer women than men work as employees. Indeed, one can also view the “employee” status, where there is regular wage compensation, as a rough proxy for formal-sector employment, although undoubtedly many employees work for informal sector enterprises. By this measure, proportionally nearly one-third more men than women work in the formal sector, this despite women’s dominance in the RMG sector.
There is substantial evidence of a gender wage gap that is likely accounted for by discrimination against women in Bangladesh. Neither the 2010 nor the 2013 LFS reports wage data. However, based on the LFS 2006, as shown in Table 6.11, female wages were, on average, 62% of male wages in urban areas and 66% of male wages in rural areas.
The HIES 2010 also contains data on wages and salaries. Female wages were 84% of male wages, whereas for workers with monthly salaries, women
only earned 54% of the salaries of men.137 The BBS has also conducted wage surveys by relatively narrow industries: the most recent that are available are from 2009–2010.138 In every reported category but one, daily wages are lower for women. In many categories the gaps are large; for example, in textile mills, where there is substantial employment of both men and women, the average daily wage was Tk254 for men and Tk195 for women. In terms of monthly salary or income, once again, salaries for women were lower in every category but one.139 To take an important example, in the RMG sector, salaries for men were Tk6,161, but only Tk4,264 for women, or 69% of the male rate. In the construction sector, which is also a significant employer of women, women’s salaries were 68% of those for men. Similar wages gaps are seen across almost every industry, with the significant exception being the private health sector, for which women earn fully 95% of the male salary.140
While these gender gaps are large, they do not account for different characteristics of employed individuals. The standard approach used by labor economists to study gender gaps is to use regression analysis to control for other characteristics of workers, such as age and education. However, there has been very limited availability in Bangladesh of data that would support such analysis. The best analysis to date is that contained in Kapsos (2008). This study uses the 2007 Bangladesh Occupational Wage Survey, constructed partly to allow this sort of analysis. In that survey, the average wage for women was 82% of that for men, which is a substantially smaller wage gap than measured by the surveys cited above. This likely reflects methodological differences in the surveys and the fact that the Occupational Wage Survey was not constructed to provide a representative sample of workers, but instead to provide adequate coverage of each of the industries that was examined. Relative to the employment distributions of women in industries that have been reported above, the occupational survey samples many more women in education and health care, where differentials are smaller. When looking at narrow industries, the gaps are more similar to those found in other surveys; for example, in the
Employment Status Women Men
Employer 0.1% 1.2%Own-account worker 12.4% 52.6%Contributing family helper 50.2% 4.9%Employee 32.7% 41.0%Others 4.6% 0.3%
Women Men Ratio
Urban 69 111 62%Rural 61 93 66%
____________________137 HIES 2010 data as cited by Rahman and Islam (2013).138 Wage Rate and Earnings of Non-Farm Workers, September 2011, as reported in BBS 2013a.139 The exceptional category is finance and insurance, which employs a relatively few women.140 Nonetheless, health sector industry experts have expressed the opinion that, for similar work, women still earn significantly less in the sector.
Table 6.10: Status in Employment
Table 6.11: Wages by Sex and Location, 2005–2006
Source: Analysis of data from Bangladesh Bureau of Statistics. 2015. Labour Force Survey 2013. Dhaka.
Source: Bangladesh Bureau of Statistics. 2008. Report on Labour Force Survey 2005–06. Dhaka.

122
Bangladesh: Looking beyond Garments
manufacturing sector, dominated by the RMG sector for women, women earned 76% of male wages, while in construction the figure is 60%. Controlling for other factors, such as level of education, this analysis finds a gender wage gap of between 16% and 23%.141
Ahmed and McGillivray (2015) used multivariate regression analysis to examine gender wage gaps in Bangladesh. While the study may be problematic because of its use of data on monthly income from the LFS (1999–2000, 2005–2006, 2010), which are thought likely to contain large amounts of measurement error,142 the study nonetheless finds a 2010 gender income gap of 11% as opposed to gaps of 16% and 24% in 2005 and 1999, respectively. While the levels of these estimated wage gaps should be taken very much advisedly, the trend in the estimated gap may be better measured and is reassuring; the gender wage gap has been falling over time.143
Qualitative research also supports the findings of surveys and statistical analysis. The women interviewed by Salway, Jesmin, and Rahman (2005), poor women in Dhaka, and the Choudhury (2013) sample of women working in the construction industry, report in a straightforward way that they are paid less than men doing similar work, but that there is nothing they can do about it. Women are paid less than men in Bangladesh, even with the same level of education. This is, however, true in most countries, including developed economies and the magnitude of the wage gap for Bangladesh, though uncertain, appears to be within the range seen in other low- and medium-income countries. For example, the unexplained wage gap is 13% in Viet Nam, 15% in Mexico, 23% in the People’s Republic of China, and 35% in Brazil. However, this does not mean that there are no potential policy actions that could help to address the gender gap in Bangladesh; in particular, the large gender wage gap in the RMG industry could be subject to improved enforcement of equal pay laws because
of the large number of factories with fairly standard employment roles.
6.6.4. Opportunities for advancement
Part of the gender wage gap is undoubtedly accounted for by limitation on professional advancement for women. Women are very much underrepresented in management positions in Bangladesh. For example, based on data from the Survey of Manufacturing Industries 2012, women made up 68% of production workers in the RMG industry, but only 11% of managers and administrators; even among clerical and sales workers in the industry, the fraction of women was only slightly higher. In other manufacturing industries, the shares of women in management positions were even smaller. In many RMG factories, none of the line managers are women, despite the years of experience that the production workers have gained working on the lines. However, from simply observing the outcomes, it is difficult to evaluate how much of the result is discrimination and how much is accounted for by education and training. Nonetheless, one recent study (Macchiavello, Menzel, and Woodruff 2014) examines the process directly using an experimental approach.
Macchiavello, Menzel, and Woodruff (2014) examined the feasibility of expanding the number of female managers in RMG factories in Bangladesh. In the 96 factories surveyed, they found that about 75% of production workers were female, while 13% of the supervisors were female; they note that because of the nature of their sample, the fraction of female supervisors likely overstates the industry-wide average, which is consistent with the Survey of Manufacturing Industries statistics, and when they remove two outliers from their sample the fraction of female managers falls to 8%. The main part of the study involved providing supervisory training for four
____________________141 The difference between the 16% and 23% estimates is based on the inclusion or exclusion of controls for industry and occupation. The lower wage gap estimate
is found when industry and occupation are included as controls. Since wages do differ by industry and occupation, there is an argument for including them. However, when there is gender segregation by occupation and industry, as there is in Bangladesh, the industry and occupation variables will act as proxies, to some extent, for discrimination that is mediated through segregation. As such the two estimates essentially provide upper and lower bounds for the size of the gender wage gap, as within this analysis.
142 In the LFS, this is a retrospective measure of total gross income, not a wage measure. It is likely that it contains large amounts of measurement error, may conflate the earnings of men and women, and it combines cash and in-kind payments (which cannot be separated) as well as income from primary and secondary employment, which also cannot be separated.
143 This study includes control variable for occupation, so that the estimates of wage gaps do not include possible discrimination via occupational segregation. Thus, even the trend in the gender wage gap does not consider possible changes in occupational segregation over time.

123
Women at Work
women and one man at each of the factories that they examined. This provision of training is significant, as only 15% of supervisors at the surveyed factories reported having received any formal training for their positions.
All of the factories agreed in advance to try out all of the trainees as supervisors, although some did not; and even with the valuable training provided, which was substantive at 288 hours in total, male trainees were 10% more likely to actually receive a trial. Thus, even with free intensive training, far beyond that of existing supervisors, many factories were unwilling to provide female workers even a trial as a supervisor, when they had previously agreed to do so. Ten months after the training period, 88% of the male trainees had been promoted, while only 53% of the women had been. The experimental intervention was a success, in the sense that it increased the fraction of female supervisors at the factories that were studied, but the results show dramatically the barriers to the promotion of women.
These results demonstrate very specifically the sort of misallocation of talent resulting from discrimination that can prevent a country from reaching its full economic potential. As discussed in Chapter 3, there is evidence that Bangladesh suffers a shortage of middle-management skills, yet in its most important industry, perhaps 75% of workers are being largely ignored for potential promotion to middle management. Simply utilizing the abundant resources that are already present in factories, in the form of the female workforce, could potentially go a long way to addressing the shortage of management skills.
6.6.5. Working Conditions
Working conditions are poor in many industries in Bangladesh, as is the case in most low-income countries, but this is true for both men and women. Some issues that are more specific to women, such as violence and harassment, have been discussed above. However, because of the predominance of women in the RMG workforce, and the fact that the products of the sector are largely exported to high-income countries, working conditions in this sector are a topic
of special focus. Many commentators have noted that general labor compliance has historically been weak in Bangladesh.144 Some of the more common issues that have been noted in the RMG industry include failure to pay the minimum wage, long working hours, lack of holidays, and late payment of wages. As of 2012, it was reported that government investigations had found that 30% of RMG factories are noncompliant and that over 90% of the factories claiming compliance still had one or more remaining problems (World Bank 2012b).
Since the Rana Plaza disaster of 2013, in which an eight-story building containing several RMG factories collapsed, killing at least 1,134 people, of which the large majority were women, safety in the sector has been an issue of national and international concern. Rana Plaza was the worst industrial disaster ever in the global garment industry, but it followed on a series of disasters in Bangladesh, including the 2012 fire in the Tazreen Fashion factory, which killed at least 117 people.
Since Rana Plaza, substantial actions have been taken, with the assistance of international organizations as well as organizations of buyers of Bangladeshi garments, to improve safety in the sector. Meetings with the ILO and other organizations led to modifications to the National Tripartite Plan of Action on fire safety and structural integrity, which had been developed after the Tazreen fire. Programs under way include building and fire safety assessments, labor inspection reforms, rehabilitation and skills training, as well as the launch of Better Work Bangladesh.
The Bangladesh Accord on Fire and Building Safety and the Alliance for Bangladesh Worker Safety, representing buyers, have carried out inspections of factories from which their members source. Outside organizations are also supporting the government initiative to carry out inspections of the remaining 1,827 RMG factories; as of July 2015, the national initiative had led to inspections of 1,100 of these factories. Combined with the Accord and Alliance inspection programs, some 85% of the target total factories have been inspected.
____________________144 For example, see World Bank (2012b).

124
Bangladesh: Looking beyond Garments
The Tazreen and Rana Plaza disasters made clear that the labor inspectorate required a major overhaul to protect workers effectively, and in response, the government made commitments to rebuild the Department of Inspections of Factories and Establishments. The service was upgraded to a department in 2014, with new leadership, and positions for 392 new inspectors created, of which 199 (51 female) had been recruited by May 2015, bringing the total to 284. These figures make clear the inadequacy of earlier inspection procedures. Programs are under way, with ILO assistance, to improve training of inspectors and the governance of the inspection system. Further, there are training programs in initial stages of implementation to improve the knowledge and awareness of occupational health and safety issues in RMG factories.
A substantive presence of trade unions at Rana Plaza could potentially have averted the disaster; reports suggest that workers were ordered back into the building after structural cracks had been found in the building and an initial evacuation had taken place.145 Programs organized in part by the ILO aim to create an environment conducive to worker participation in occupational safety and health as well as worker rights, and many new unions have been organized in the past 2 years, although overall unionization rates remain low.
6.7 Conclusion
Women’s lives have changed tremendously in Bangladesh over the last 30 years, and in many ways have improved. The dramatic fall in birth rates, the equally dramatic increase in school enrollment rates for girls, and improvements in maternal and neonatal health have transformed the life of the average Bangladeshi woman. But in the economic sphere, change is under way, but much room for progress remains.
The growth of the RMG industry has provided the first mass formal employment for Bangladeshi women and growth in the sector is expected to continue to provide employment opportunities. Attitudes to women and
work inevitably have changed as females, work outside of the home has gone from being an anomaly to being a core part of the Bangladeshi economy. The number of women in regular paid employment has increased tremendously in recent years, though it still remains a small proportion of women overall. Nonetheless, FLFP remains very low by international standards and while women’s education to higher secondary level and above is now widespread, highly educated women face frighteningly high unemployment rates, much higher than those for comparably educated men.
Numerous possible policies for improving labor market outcomes for women have been discussed above, and this concluding section will attempt to highlight some of the more important options and provide priorities. Providing full legal economic rights to women, and fully enforcing those rights is a critical step: it provides a strong signal of the direction of the country and may help to make discrimination against women less socially acceptable. Changing laws is also a low-cost endeavor. Protection of women’s employment rights with respect to changes in family status is particularly important.
As discussed throughout this study, Bangladesh is undergoing economic transformation and it is important for women to be part of it. The experience of the RMG industry teaches important lessons: it was a new industry that employed women from the very beginning. If there are to be new industries that are to be the focus of economic diversification efforts, any planning should involve a key role for the potential employment of women in large numbers. The concentration of women in the RMG sector has made women more comfortable working there and may have made their work more socially acceptable. While breaking down the whole idea of separate spheres for working men and women is surely the long-run goal, in the shorter run, identifying new “women’s jobs” may help move toward a future where all walls are eventually broken down. This is a critical priority as industries will only be in their formative periods for a few years.
The youthfulness of the RMG workforce underscores the fact that female employment is often viewed as
____________________145 Murder charges were subsequently filed, in May 2015, against dozens of people in connection with the Rana Plaza disaster.

125
Women at Work
a transitional phase for young women. Increasing FLFP will require keeping women in the workforce for longer, and that means providing opportunities for advancement. Women-focused programs in management training could be an important tool for breaking down barriers.
The Government of Bangladesh has attempted to take a lead position in the employment of women from the beginning. However, the reservation of positions for women has been maintained at the same low level, even as the number of women in the workforce, and in particular the number of well-educated women has increased tremendously. Increasing employment of women in government should be nearly costless; indeed, there may be an increase in efficiency gained by reducing discrimination.
Experience in other countries with guaranteed work programs has found important effects of FLFP. In this context, the EGPP is a powerful tool both to improve the welfare of the poorest but also to integrate women more fully into the working world. The EGPP should, for this reason, be maintained, or expanded if
possible, with some additional focus on the needs of women. Improved transportation and infrastructure will benefit all Bangladeshis, and will help in economic transformation, but they may be especially valuable for working women.
Participation of women in small and medium-sized enterprises has already been much encouraged by successful microcredit programs and support for such programs should be continued. Women’s entrepreneurship is another resource that has not always been made the most of and training programs for women have been successfully piloted and should be emulated.
Changing attitudes and power relations is not something that can be done overnight. One of the great lessons of the economics of discrimination is that with the right economic incentives, the motivation for profit may outstrip traditions. The challenge is to produce the legal and economic frameworks that will lead to long-run changes that allow Bangladeshi women the widest range of work opportunities.

126
Bangladesh: Looking beyond Garments
Chapter 7Policy Recommendations to Improve Productive Employment Outcomes and Creating Quality Employment
The construction sector has greater potential for employment, although in recent years the sector has shown some degree of instability. Policies are needed to bring about stability in the sector.
Unemployment of the educated has always been a problem, but its precise nature, differences in unemployment rates for job seekers with different levels of education, and differences in the rates of return to different levels of education, provide interesting insights. Higher secondary education does not seem to add much in potential return. But the rate of return for tertiary education is quite attractive. So, for the latter, unemployment may reflect a “queueing” phenomenon, and the policy suggestion may be to smooth the functioning of that segment of the labor market. More efficient mechanisms for job search and job matching would be important in that context. For those with higher secondary education, the problem may be more fundamental and structural. Issues relating to quality and the relevance of education from the point of view of labor market needs may be more serious at that level.
Differences in earnings between different levels of education seem to be narrowing —with the exception of the difference between primary and secondary. This
7.1 Introduction
Bangladesh has sustained reasonably strong economic growth for over 2 decades now, but its creation of productive employment for its growing labor force and for the underemployed has been less satisfactory. Despite some signs of labor market tightening, the economy still has surplus labor, as indicated by significant vulnerable employment, time-related underemployment, and availability of labor for manufacturing at fairly low and stagnant real wage rates.
To create productive employment at high rates, high employment growth needs to be combined with high output growth. With the overall economic growth around 6.5% a year, absorption of surplus labor is not possible. To fully utilize surplus labor within about 15 years, GDP growth of 8% a year is needed.
For high output growth to be combined with high growth of employment, growth in manufacturing output has to be higher—in the order of 12% to 15% a year. In addition, the manufacturing sector needs diversification: more labor-intensive sectors like garments will have to grow. The policy regime needs to be neutral for all industries with growth potential.

127
Policy Recommendations
general trend is positive in the sense that education does not seem to be exerting a disequalizing influence on income distribution. And it is of relevance for policies needed to address the issue of rising inequality. Raising the level of education at lower levels may have a positive impact on income distribution.
For quality of employment to improve, the first important element is a rise in real wages in tandem with growth in labor productivity. In addition, conditions of work (overall environment and safety) have to improve. If the experience of the garment industry is any indicator, labor policies relating to minimum wages and workplace safety do not seem to have higher positive nor adverse effect on employment numbers as it was stagnated at 4 million for 3 consecutive years from 2011.
7.2 Promoting Economic Diversification and Creating Better JobsAlong with sustained economic growth, the economy of Bangladesh has attained a degree of structural change, as manifested in the decline in the share of agriculture and rise in the shares of industry and services in total output. Indeed, this is the pattern of structural transformation that is expected to take place alongside economic growth. However, the structural change in output has not been able to deliver adequately on the challenge of creating productive employment and decent work. Several points are worth highlighting in this respect. First, the share of employment in agriculture has declined at a much slower rate compared with that in the sector’s share in output. And that has been due to the slow growth of productive employment outside the sector. In other words, diversification in employment has been slower than in output.
Second, the manufacturing sector has been highly concentrated on ready-made garments (RMG), which shows no sign of abating. This, by itself, should not have been a reason for further slowing the manufacturing
sector’s growth. Although the latter has attained decent growth in output in recent years, that is not sufficient from the point of view of absorbing the large volume of surplus labor that exists in the economy. If the experience of East and Southeast Asian countries that have been successful in attaining growth and in absorbing surplus labor is any guide, the growth of manufacturing industries has to be nearly double that of overall gross domestic product (GDP). On that count, manufacturing in Bangladesh needs to attain an annual output growth of around 14%. And such growth has to be in labor-intensive industries. That is where the experience of Bangladesh falls short of successful growth with labor absorption. Only one labor-intensive industry has grown up to now; and there is a need for diversification, with more such industries growing.
For nearly 4 decades, Bangladesh has pursued a policy of trade liberalization. But the experience shows that such a policy is not a guarantee for the success of diversified export-led growth. For such growth to take place, the incentive structure within the economy has to be neutral between exports and import substitutes, and there should not be any favor toward or discrimination against any of them.
In the Republic of Korea, for example, there was no discrimination against exports, and in addition, export-oriented industries were provided with additional support through a variety of measures. According to one authoritative analysis of the economy of Bangladesh (Khan 2015), policy reforms have not led to the creation of a neutral incentive structure. How, then, did the ready-made garment industry attain the success it has? This has been made possible first by the erstwhile quota-based regime and subsequently through a series of industry-specific ad hoc measures. The abovementioned study argues that this kind of industry-specific discriminatory support cannot engender a real process of export-led growth. For the latter to take hold, it is essential for the incentive structure to be neutral between exports and imports and for export-oriented sectors to receive ex ante, nonarbitrary and time-bound support.146 If such an environment could be assured and other obstacles like
____________________146 For examples of ex post and often arbitrary support received by the RMG industry, one simply has to compile the list of such measures that were undertaken for
that industry. Khan (2015) provides some such examples. While the incentive regime across exports has equalized recently, the non-RMG sectors have a long way to go to reach the level of exports and employment of RMG.

128
Bangladesh: Looking beyond Garments
infrastructure could be removed, “many non-RMG manufactures might have become profitable exports” (Khan 2015, 161).
The present report has looked at the challenges faced by a few industries and services outside the RMG industry and has provided a number of sector-specific recommendations for addressing such challenges. A look at some of those challenges and facilities provided to specific industries would show policy incentives are not equally distributed. A couple of examples illustrate:
• While the pharmaceutical industry147 receives reduction or exemption of duty on imports of machinery, it is not clear whether other industries—especially those in need of upgrading technology (such as leather and leather products)—receive this facility.
• The pharmaceuticals industry is entitled to income tax exemption for export earnings, export credit at reduced rates, assistance in marketing abroad through participation in export fairs, and so on.
The present report has identified a number of supply-side bottlenecks that constrain the growth of manufacturing industries and its diversification. They include physical infrastructure, high costs of ports and transport, shortage of skilled workers, difficulty in upgrading technology, and shortage of entrepreneurial and managerial skills. Some of these may appear generally applicable to all industries, but in reality, they may have different cost implications for different industries. For example, a large-scale RMG factory may be able to solve the problem of energy by installing its own power generator, while a small or medium-scale enterprise in the leather industry may find it far more difficult (and not cost-effective) to do so. The same remark applies to other costs like port and transport, accessing market information, and getting around bureaucratic procedures. Hence, a general improvement in these supply-side bottlenecks should be of help in creating a level playing field for different industries.
Apart from manufacturing, there is potential for diversification of agriculture itself. While crop agriculture will continue to remain important for Bangladesh (especially given the food requirement of the large and growing population), as income increases, demand for food undergoes a shift toward non-crop items like fruits, milk, meat, and processed food. Non-crop agriculture has good potential for growth in view of the growing domestic market for such items—even without considering the export market.
Despite the existence of various policies relating to agriculture, (for example, the National Agricultural Policy of Bangladesh 2013), the non-crop agriculture sector continues to face a number of difficulties. High cost of inputs—especially of imported ones—is often cited as a problem. A major constraint faced by the export-oriented units is their lack of knowledge and access to technology for meeting health and sanitary standards. There is also the general problem of ability to explore and access export markets. Appropriate measures of support could be designed in all these areas, and relevant government institutions could be more active in this field.148
7.3. Finding More and Better Jobs Abroad and Promoting the Rights and Welfare of Migrant WorkersBangladesh has done quite well in maintaining a steady flow of international migration of workers. But there is potential for raising this number and changing the skill and occupational composition of workers. To find more jobs abroad for Bangladeshi workers, it would be necessary to tap both existing and new markets. Different markets and their prospects can be studied by employing a variety of means like analysis of the economies and their business prospects, and intensifying bilateral contacts.
Such contacts would also be important for changing the image of Bangladesh as a supplier of workers with low skills. Marketing efforts are required to provide information about facilities that the country
____________________147 This, by the way, is not a labor-intensive industry, although it mainly employs highly educated and skilled manpower and a high proportion of its employees are
women. 148 A few specific suggestions have been made in the chapter on economic diversification (Chapter 3) of this report.

129
Policy Recommendations
has for producing skills that are on demand in various destination countries. Showcasing of training facilities by inviting prospective employers or their representatives may be useful. On the supply side, awareness needs to be created among prospective job seekers about possible benefits of migrating with higher-level skills, and training facilities that exist in the country.
The high cost of international migration from Bangladesh is a major issue. The cost not only includes the costs of air tickets, visas, and so on, but also fees paid to recruiting agencies and to intermediaries. Apart from financial cost, fraudulent practices, substitution of contract (with one involving much worse terms and conditions than promised) in destination countries, unacceptable conditions of work and living are common. It is important to note that a very high proportion of this cost (around 88%) is accounted for by so-called facilitators. Hence, any effort at reducing the cost of migration and addressing the issue of exploitation would have to focus primarily on this aspect.
Of course, abuse and exploitation of migrant workers occur at different stages in the cycle of migration, and it would take major effort to even minimize (not to speak of completely eliminating) such evils. The present report offers a number of recommendations that cover various stages of the migration cycle. At the grassroots level, where the process starts, district employment and manpower offices could work together with nongovernment organizations and community-based organizations to provide alternative sources of information and raise awareness about various aspects relating to overseas employment. Even that would not be adequate, because those desperate for jobs abroad may still be prepared to pay the local subagents who come up with promises for such jobs. District employment and manpower offices could function as alternative to such subagents by helping prospective migrants to link up with recruitment agencies with good track records. In other words, a kind of public–private partnership may be tried as an alternative to the current exploitative and expensive system.
At a higher level, the Bureau of Manpower, Employment and Training could also work together with recruitment agencies with long experience of procuring demand for workers and develop a system of recruitment that would minimize (and eventually eliminate) the role of subagents.
The role and functioning of the Labour Wings in countries of destination need to be made stronger and more effective in dealing with the implementation of contracts.
Given the spread of relevant actors over different countries and throughout the countries at both ends, and the number of government agencies involved in managing the migration process, a strong mechanism for coordination is critical for increasing efficiency in the governance of migration. Instead of setting up a new office for managing migration, a stronger coordination mechanism and strengthening of the existing setups could be used as a mechanism for pursuing the goal of protecting the rights and welfare of migrant workers.
7.4. Improving Opportunities for Skills Development and Higher EducationWhile Bangladesh has made notable progress in increasing enrollment in primary education, significant challenges remain in the areas of education and skills development. In general education, challenges include high rate of dropouts at the primary level, low enrollment at higher levels of education, and low quality of education at different levels. In the area of technical and vocational education and training (TVET), the challenge is not only to expand numbers with such qualifications, but also to ensure quality and relevance of the education and training provided. Such challenges give rise to a number of issues of relevance to policy, which may be broadly categorized under the following heads: (i) access to education and training at various levels and the issue of numbers, (ii) quality of general education, (iii) costs and the related issue of equity, (iv) skills mismatch —with regard to both the

130
Bangladesh: Looking beyond Garments
type of skills produced (relative to needs of the labor market) and the quality of the skills imparted. In the following paragraphs, recommendations that arise out of the analysis of the present report are recounted.
There are notable degrees of regional variation in both general tertiary education and in TVET. In the proportion of the labor force with tertiary education, Dhaka division stands out while Sylhet, Chittagong, and Rangpur lag behind. Based on the percentage who received training during the past 12 months (in the Labour Force Survey of 2013), Dhaka and Chittagong do much better while Rangpur, Rajshahi and Khulna lag. Careful spatial planning of institutions for education and training can help ameliorate such regional disparities. Of course, supply-side measures of this kind alone may not be adequate to address the issue, which may be linked to more fundamental factors like regional variation in economic growth and demand for educated and skilled manpower in certain regions. It would, therefore, be important to look at the issue from an overall regional development perspective.
There is a substantial gender difference in the access to skills training: in the Labour Force Survey 2013, a much lower proportion of women reported receipt of training than men. Attaining gender equity in a country like Bangladesh is a complex issue in general. However, achievement of parity in enrollment at the primary level shows that determined and carefully conceived public policy can help. Of course, for skills training, the issue is linked to a variety of factors like costs and possible use of the training received in terms of remunerative employment. One possible avenue for policy intervention in this area is to look at the gap between training desired and training received. In the case of women, it is found that there is unmet demand in areas like garments and handicrafts. In general, it would be useful to assess the efforts made to increase women’s access to skills training and the outcome of such efforts. Further policy interventions could be designed on the basis of such an assessment.
Quality of education of different categories and at different levels is a major issue—the worst being primary education, where only 25% of grade 5 students master Bangla and a third of them master mathematics. It is slightly higher for grade 8 students, but much lower than half. Serious effort is needed to address this issue. Measures required would range from conceptual and methodological approaches to administration of education. Some examples are a shift from the current focus on rote learning and obtaining certificates toward alternative indicators of learning, raising the quality of teaching (through carefully conducted training and continuous learning), and creating incentives for teachers.
Analysis of the rate of return to different levels of education point out notable differences between the ability of education to increase the capacity to raise earnings. In particular, the difference in the returns to schooling between primary and Secondary School Certificate levels is so small that it raises the issue of quality of education at that level. One may also ask whether investment in TVET may be more worthwhile. But this question cannot be answered, because of a lack of data on returns to TVET at various levels. Nevertheless, there seems to be sufficient ground to warrant a serious look at the quality of general education, undertake steps for its improvement, and to examine the desirability of shifting emphasis toward TVET. In any case, the need for a technically trained labor force is likely to increase as the economy continues to grow and undergoes structural transformation.149 And meeting the need for required skills is an important challenge that policy makers will have to address.
The shortage of required skills is widely regarded as a problem in Bangladesh, and there are some widely held perceptions in that respect. First, scarcity of mid-level management is manifested perhaps in large numbers of expatriate workers in such positions. Second, the level of productivity of workers in Bangladesh is found to be low compared with other countries, such as the
____________________149 As an economy grows, it is likely to undergo structural transformation in its sector composition and of the types of goods produced within a sector. Such changes
are expected to result in changes in the demand for skills that are required. This is already happening in Bangladesh and the pace is likely to accelerate. For a detailed discussion of the issue, see Islam (2014c).

131
Policy Recommendations
People’s Republic of China, India, and Viet Nam, and that is often linked to the low levels of skills, although a precise causal linkage is yet to be established. Third, industry-specific studies point out the shortage of specific skills in some key industries, although such studies cover a small number of industries. Fourth, based on tracer studies, the relevance of skills provided by TVET institutions for the demands of the labor market comes out as a problem. Fourth, studies of school-to-work transition point out that the low level of education is a general problem for the young entrants into the labor force.
While the above diagnostics of the nature of the challenge in skills training appears quite persuasive, there seems to be a degree of uncertainty about the precise nature of the problem. There is of course very little doubt about the generally low level of education of the labor force, which is apparent from data coming out of the labor force surveys. Hence, the complaint about the paucity of human resources for middle-level management seems to be well grounded. However, whether the low level of productivity of production workers is due more to lack of general education or skills training is a question that remains to be addressed. As for the latter, whether it is simply a problem of numbers or also of quality is an issue. And for quality, it is important to understand whether the mismatch is between what is produced and required or whether the limitations are in the content of the training.
For a growing economy like that of Bangladesh, skill needs is expected to be diverse and to evolve. And it is not clear whether the policy makers have a comprehensive picture of the situation and a way of monitoring changes. There is of course an ongoing effort at creating an electronic database on skill needs (with assistance from the International Labor Organization [ILO]). But that needs to be upgraded to a large-scale system of regular collection and monitoring of data.
The limitations of skills imparted by the TVET system are often ascribed to the lack of interaction between skill providers and the industries. Recent innovations to address this issue include the setting up of industry skills councils and Centres of Excellence. while such
innovations are limited to a few industries and are largely donor driven, the impact of these efforts and the case for replication need to be looked into. Likewise, the progress made in the ongoing efforts at applying the National Technical and Vocational Qualification Framework and the Quality Assurance System needs to be assessed.
Access to education and skills training can also have implications for equity in the distribution of earnings from work. A few points may be worth noting in this respect. First, in the area of higher education, higher-income groups have greater access to public sector tertiary educational institutions. To the extent the quality of education imparted by them is generally superior (with the exception of a small number of private institutions), this could have implications for perpetuating and accentuating inequality in the distribution of income.
Second, although the TVET system appears to attract more students from lower-income households, the cost of this strand is higher than the general public sector education (which is almost free). Given the absence of data on relative returns to the different types of education, it is difficult to say whether the cost differences are justified or whether they act as another factor on inequality. This is an area where careful investigation and policy intervention is needed.
7.5. Enhancing Outcomes for Women in the Labor MarketIn Bangladesh, women’s participation in the labor market has increased. While the expansion of microcredit created opportunities for self- employment for them, the emergence and growth of the RMG industry has opened up the world of large-scale wage employment. The former type of employment still kept them in their traditional surroundings and environment, but the latter is employment far away from home (often involving migration from rural homes to urban areas) in typical modern industrial setting. Far-reaching changes as they are, they by no means imply that all is well with regard to women in the labor market of Bangladesh. A number of challenges remain, and policy measures

132
Bangladesh: Looking beyond Garments
are required to address them. Chapter 6 of this report looks systematically at the barriers to women’s greater participation in the labor market, avenues for expanding their participation, and policies needed to attain that goal. The following paragraphs highlight some of the major policy recommendations in this regard.
Barriers to fuller participation of women in the labor market include the following:
• attitudes of both men and women toward the latter’s participation in the labor market, and the absence of full decision-making power of women;
• women’s withdrawal from the labor force after a certain age;
• early marriage and reproductive responsibilities;
• “gendered economic spheres”—some activities regarded as fields of women’s work and others as not suitable;
• absence of infrastructure to facilitate and support women’s employment, such as child care facilities, near women’s places of work; and
• violence against women—both in places of work and outside—impeding work.
Some of the above barriers may not be so amenable to policy intervention, but there are several that can certainly be addressed through policy measures. The latter would include the age at marriage, violence against women, and infrastructure needed to facilitate women’s work. The first two can be addressed through legal measures, but the implementation of laws would also be very important. For example, despite a legal minimum age for marriage, many girls are married off before they attain that age. Determined efforts are required to stop this practice. As for violence against women, the existing framework for legal protection of women needs careful review and corrective measures if needed. Likewise, the application of laws in this regard has to be made much stricter.
Infrastructure for facilitating women’s work, such as child care facilities, and facilities for lactating mothers, is an area where action is needed by both public and private sectors. But the former may take the lead and set examples. In addition, private sector initiatives may be provided with economic incentives such as tax rebates.
When it comes to raising women’s participation in the labor force, one needs to consider two different aspects. The first relates to activities where women participate in larger numbers. Within manufacturing, the RMG industry is a major employer of female workers. There are industries, such as electronics and pharmaceuticals, which currently employ small numbers as a whole, but the proportion of women are quite high. Shoe making can be another such industry—they employ a large number of women in Indonesia and Viet Nam. Growth of such industries will naturally be conducive to a rise in women’s participation in the labor force. Policies for economic diversification (discussed in Chapter 3 and in section 7.2 above) would be relevant in this context.
In addition to activities that are women friendly, there are variables that influence female participation in the labor force; they include education, fertility rate, affirmative action and direct intervention, and other measures like maternity leave.
• As female participation in the labor force is seen to be related positively to education, the spread of education among women would be a good policy.
• Likewise, making family-planning services more easily available would be helpful.
• The existing policy of reservation of a certain proportion of jobs in the public sector has been useful in increasing women’s participation in the sector. The case for raising the quota may be looked at.
• The implementation of the existing provision for maternity leave needs careful examination.

133
Policy Recommendations
Apart from women’s participation in the labor force, their status at the place of work is another major concern. Issues that are relevant in that area include the nature of employment and their vulnerability, differences in wages, working conditions, and opportunities for advancement. Some of these may be addressed through legislation and better implementation of laws while others require action on a broader front. Differences in wages and working conditions belong to the first category, and an appropriate legal framework for overcoming discrimination in the workplace is important. But the problem of vulnerability of employment and opportunities for advancement in one’s career are areas where action of different types would be needed. The issue of vulnerability is linked to the availability of good jobs for women in large numbers, and that in turn is related to further growth and diversification of the economy and growth of sectors where women can find good jobs. Of course, policies aimed at growth and diversification of the economy will have to be accompanied by policies for raising the levels of education and skills of women so that they can access better quality jobs. In addition to raising the level of general education, a larger number of women need to be put into the TVET system.
Promoting opportunities for women to advance in their careers is a complex and challenging issue faced not only by developing countries like Bangladesh but also by developed countries. In Bangladesh, the issue becomes more challenging because in addition to factors such as education and managerial ability, there is an attitudinal factor reflected in the reluctance to accept women in supervisory positions (Chapter 6). While the latter may not be amenable to policy intervention and it may be a while before the society and employers undergo a change in attitude, it would be desirable to gear policy toward empowering women for higher-level positions, including managerial.
Providing full legal economic rights to women, and fully enforcing those rights is a critical step: it provides a strong signal of the direction of the country and may help to make discrimination against women less socially acceptable. Changing laws is also a low-cost endeavor. Protection of women’s employment rights
with respect to changes in family status is particularly important.
7.6. The Way Forward
The need for an employment strategy
This report has provided an analysis and overview of achievements made and challenges faced by Bangladesh in the pursuit of the goal for attaining productive employment and decent work for all. It may be recalled that one of the Sustainable Development Goals adopted in 2015 commits all countries of the world to this goal. Promotion of employment is mentioned as a key priority in the Seventh Five-Year Plan (2015–2020) of the country. To address the challenges involved in pursuing this goal, the country needs a comprehensive strategy for accelerating the growth of employment alongside output growth. In the above context, it would be appropriate to fully articulate a detailed strategy for pursuing this important goal. The ILO’s Convention 122 on employment also encourages member states to pursue the same goal.
Filling gaps in research
Good analysis and data are needed for formulating sound strategies and policies; and the same can be said about employment. A number of gaps in research were found in the course of the present study. Without attempting to provide a comprehensive picture of the gap in research, a few key issues are mentioned below:
• the trend in productivity (including that of labor) in manufacturing industries and its implication for competitiveness and diversification of the sector;
• factors responsible for the decline in the employment intensity of growth in the service sector;
• factors responsible for the recent fluctuations in growth and employment in the construction sector;

134
Bangladesh: Looking beyond Garments
• analysis of the trends in real wages in the major sectors of the economy and their relationship with labor productivity;
• factors responsible for unemployment of the educated, especially of youth, and possible ways of addressing the issue;
• evolving markets for overseas employment, skills on demand, and mismatches between skill requirements and supplied;
• reintegration of returning migrant workers in the domestic labor market (including utilization of their acquired skills);
• direct and indirect contributions of remittances to employment generation;
• the nature of skill requirements (in the domestic labor market) and mismatches, and ways of addressing the issue;
• an analysis of the trend in the FLFP rate, including factors responsible for the recent decline; and
• profile of workers in the RMG industry and an examination of the sector’s role as a source of sustainable employment for women of different age groups.

135
Appendixes
Appendix 1: Macroeconomic Performance
Year GDP Agriculture Manufacturing Construction Services
2005–2006 6.67 5.44 10.81 8.69 6.402006–2007 7.06 6.04 10.54 6.74 6.922007–2008 6.01 3.87 7.33 5.99 6.492008–2009 5.05 3.09 6.69 6.58 6.322009–2010 5.57 6.55 6.65 7.21 6.532010–2011 6.46 3.89 10.01 6.95 6.222011–2012 6.52 2.41 9.96 8.42 6.722012–2013 6.01 1.47 10.31 8.04 5.512013–2014 6.12 2.46 8.68 8.56 5.832014–2015 6.46 2.07 10.32 8.63 5.83
Year Annual Inflation (%)
Budget Balance
Without Grant With Grant
2005–2006 7.16 (3.4) -2.82006–2007 7.20 (3.2) -2.82007–2008 9.94 (5.3) -4.62008–2009 6.64 (3.5) -2.82009–2010 7.31 (3.9) -3.42010–2011 8.80 (3.8) -3.32011–2012 8.69 (4.4) -4.02012–2013 6.78 (4.1) -3.72013–2014 7.35 (4.4) -4.0
Table A1.1: Annual Growth of GDP and Major Sectors, 2005–2015 (%)
Table A1.2: Rate of Inflation and Budgetary Balance, 2005–2014 (% of GDP)
GDP = gross domestic product. Source: Bangladesh Bureau of Statistics. Various years. Labour Force Survey. Dhaka.
( ) = negative, GDP = gross domestic product.Sources: Figures on inflation are from Bangladesh Bank, Bangladesh Bank Quarterly, various issues; figures for budget balance are from Bangladesh Bureau of Statistics, Economic Survey, various years.

136
Figure A1.1: Annual Growth of GDP and Manufacturing, 1990–2013 (%)
GDP = gross domestic product. Source: Constructed with data from the Ministry of Finance (various years).
GDP growth Manufacturing output growth
0
12
8
6
4
2
10
1993
–199
4
1992
–199
3
1991
–199
2
1990
–199
1
1994
–199
5
1995
–199
6
1996
–199
7
1997
–199
8
1998
–199
9
1999
–200
0
2000
–200
1
2001
–200
2
2002
–200
3
2003
–200
4
2004
–200
5
2005
–200
6
2006
–200
7
2007
–200
8
2008
–200
9
2009
–201
0
2010
–201
1
2011
–201
2
2012
–201
3
Appedix 2: Definitions and Methodologies Used in Labor Force Surveys in Bangladesh
Labour Force Surveys in Bangladesh use standard definitions and concepts used internationally. For example, “economic activity” is defined in the same way as in the United Nations System of National Accounts (SNA-1993), while for labor force (or the economically active population), employment, and unemployment, definitions recommended by the International Labour Organization are used. Except for surveys carried out during the 1980s, the cut-off age for the economically active population is 15 years. The reference period for the surveys is 1 week prior to the date of enumeration.
The economically active population/labor force is defined as people 15 years and over either employed or unemployed during the reference period of the survey. It excludes the disabled, the retired, income recipients, full-time students, housewives, beggars, and people who did not work for pay or profit even for an hour during the reference period.
“Employed person” is defined as a person either working 1 or more hours for pay or profit or working without pay on a family farm or enterprise during
the reference period. A person who was not working during the reference period but had a job or business from which he or she was temporarily absent during the reference period was also regarded as employed.
“Unemployed person” was defined as someone involuntarily out of gainful employment during the reference period but either (i) actively looking for work, or (ii) willing to work but not looking for work because of illness or believing that no work was available.
Up to the survey of 2010, underemployed was defined as working less than 35 hours during the reference week. In the survey of 2013, the definition was changed in two ways. First, the threshold for the weekly number of working hours is 40 hours (instead of 35 in the earlier surveys). Second, two additional criteria were applied to determine whether a person was underemployed: willingness and availability to work additional hours.
Survey year and period of the survey: The survey year was defined as 1 year preceding the survey. In some surveys (such as 2002–03 and 2010), enumeration was carried out during a short period, while in others it was carried out throughout the year to take into account the possibility of seasonal variation. The survey of 2002–03 was carried out during October–November 2002, while that of 2010 was carried out during May 2010.
Appendixes 2

137
The definition of employment in the informal sector has changed. Up to the survey of 2010, informal sector was defined by the number of workers employed: units employing less than four workers were classified as informal sector and both rural and urban areas were covered by the definition. In the survey of 2013, “informal employment” was broadened to include such employment in the informal as well as the formal sectors. “Informal sector” has been defined as “unregistered and/or small unincorporated private enterprises engaged in the production of goods and services for sale or barter.” Informal employment is
defined as a “job-based concept and encompasses those jobs that lack basic social or legal protections or employment benefits and may be in the formal sector, informal sector or households” (Bangladesh Bureau of Statistics 2015).
As for wage rates and earnings, for both “day labor” and “paid workers”, the questions asked were how much the person earned (in cash, in kind, and both) during the reference week. However, in the reports, the terms weekly wage and weekly income have been used.
Definitions and Methodologies Used in Labor Force Surveys in Bangladesh

138
Appendix 3: Basic Data on Labor Force and Employment in South Asian Countries
Bangladesh India Nepal Pakistan Sri Lanka
2005–2006 2010 2004–2005 2011–2012 1998–1999 2008 2005–2006 2010–2011 2004 2011
All population 58.5 59.3 60.4 53.4 85.8 83.4 52.9 53.4 57.1 53.0Male 86.7 82.5 82.9 78.8 90.2 87.5 83.9 81.9 76.7 74.0Female 29.3 36.1 37.3 27.2 81.9 80.1 21.1 24.4 39.5 34.4
Bangladesh India Nepal Pakistan Sri Lanka
2005–2006 2010 2004–2005 2011–2012 1998/1999 2008 2005–2006 2010–2011 2004 2011
Persons 4.2 4.6 4.4 3.6 1.8 2.1 6.1 5.7 6.5 4.2Male 3.2 4.1 4.1 3.4 2.0 2.2 5.2 4.8 4.7 2.7Female 7.4 5.8 5.0 4.2 1.7 2.0 9.6 8.9 9.7 7.0
Bangladesh India Nepal Pakistan Sri Lanka
2005–2006 2010 2004–2005 2011–2012 1998/1999 2008 2005–2006 2010–2011 2004 2011
Self-employed 42.2 41 41.1 42.0 16.0 16.9 35.8 36.3 31.2 34.3Unpaid family 21.7 21.8 12.6 12.3 40.5 37.3 26.9 27.7 9.4 10.8Paid employees 36.1 37.8 46.3 45.7 43.5 45.8 37.3 36 59.4 54.9Total 100 100 100 100 100 100 100 100 100 100
Bangladesh India Nepal Pakistan Sri Lanka
2010 2011–2012 2008 2010–2011 2011
Total 20.3 11.7 6.7 15.1 2.8Male 14.4 5.9 7.2 7.9 2.6Female 34.2 28.8 6.1 40.1 3.3
Total
Bangladesh India Nepal Pakistan Sri Lanka
2010 2011–2012 2008 2010–2011 2011
Formal Sector 12.5 15.3 7.9 14.4 37.3Informal Sector 87.5 84.7 92.1 85.6 62.7Total 100 100 100 100 100
Table A3.1: Labor Force Participation Rate (% for ages 15 and over)
Table A3.3: Employment Status (%)
Table A3.4: Underemployment by Time Criterion (% of the employed population)
Table A3.5: Employed Persons in the Formal and Informal Sector (%)
Table A3.2: Unemployment Rate (% ages 15 and over)
Source: Compiled using data from the labor force surveys of various countries.
Compiled using data from the labor force surveys of various countries.
Note: South Asian countries define the informal/formal sector as follows:Bangladesh: Formal sector consists of enterprises with size of employment >4 and registered and maintain regular accounts. It includes both agriculture and nonagriculture.Nepal: Formality and informality was considered for the nonagriculture sector only. Formal sector is defined in terms of size of units only. If number of regular paid employees in an enterprise is at least 10 workers it is considered as formal sector. The share of formal sector was calculated on the basis of total employed persons age 15 and over.Pakistan: Formal sector excludes enterprises engaged in agricultural activities; excludes all own-account enterprises and include enterprises with at least 10 people engaged.Sri Lanka: Formal sector includes organizations that are registered, maintain formal accounts, and have a total of more than 10 regular employees.
Appendixes 3

139
Appendix 4: Labor Force Growth and Employment Elasticity Used in the Employment Projections
Rates of growth of the labor force calculated from the figures reported by the labor force surveys of different years turn out to be very different for different intersurvey periods. As reported in Table 2.1, the annual rate of growth was 2.25% during 2002–03 to 2005–06, rose to 3.45% during 2005–06 to 2010, and came down to 2.30% during 2010 to 2013. It is not easy to explain such short-term fluctuations in labor force growth—especially the sharp decline in the last 3-year period. Hence, this report considers it unwise to use the figure for the latest intersurvey period (2010–2013) for making projections and is of the view that in order to overcome the possible effect of such short-term fluctuations in labor force growth, a longer-term growth figure should be used. As for the choice of a longer-term period, 2002–03 was ruled out because the survey of that year was carried out during the lean period of the year and is suspected to yield figures that are underestimates of the labor force. The choice was thus for the period 2005–06 to 2013, and the annual growth of labor force for that period worked out to be 2.96%.
Elasticity of employment with respect to output for the economy as a whole for the period 2010–2013 worked out to be 0.3887, much lower than the figure of 0.55 estimated for 2005–2010. It is very difficult to explain this sharp decline in employment elasticity over such a short period of time—the sectoral pattern of growth during 2010–2013 does not appear to be consistent with that decline. Hence, it was considered unwise to use the elasticity figure for 2010–2013 for making projections. Instead, it was assumed that while the
pattern of growth is not likely to change much, there may be some increase in labor productivity, resulting in some decline in employment elasticity in the medium term. Based on this consideration, the figure used by the Planning Commission (0.45) was considered plausible and was used. However, this report argues that it may be possible to raise the elasticity of employment (without compromising on labor productivity) by changing the strategy of development whereby manufacturing would contribute more to overall GDP growth and the sector will consist of labor-intensive subsectors for some more years. Based on this argument, a higher overall employment elasticity of (0.55—the figure estimated for 2005–2010) was used for simulating employment projections.
It may be noted here that the Planning Commission, Government of Bangladesh in its projection for the Seventh Plan period (2015–2020), has used higher labor force growth of 3.1% a year (Government of Bangladesh 2015, p. 53). That has resulted in a much higher base year labor force (67.20 million in 2015 as opposed to 61.58 million according to our projection). Although the labor force figure used by the Planning Commission appears to be at odds with both the observed labor force growth and the actual labor force figure reported by the Labour Force Survey 2013—and results in a higher base year estimate, their projection of additional employment is very similar to the study (10.9 million compared with 10.7 million). Thus, they are able to conclude that there will be “excess employment” (over addition to labor force), which will enable the absorption of surplus labor. We also conclude that with GDP growth of over 7%, the economy can absorb some surplus labor. However, we also show that unless the economy attains GDP growth of 8% a year, it will be unable to absorb all surplus labor within a reasonable span of 15 years (by 2030).
Labor Force Growth and Employment Elasticity Used in the Employment Projections

140
Appendix 5: Methodology for Deriving Employment MultipliersThe methodology derives employment multipliers as summarized below based on McLennan (2012). The vectors of multipliers for each sector for 2000 to 2015 have been estimated for Bangladesh using data from Bangladesh 2006 and 2012 input-output tables, the World Input-Output Database input-output tables, together with the Bangladesh gross domestic product (GDP) statistics and Labour Force Survey, various years. A detailed explanation of the derivation is in ADB (2015a). The distribution of employment and skills across sectors was estimated to 2015 using the Asian Productivity Organization database and United Nations Department of Economic and Social Affairs population estimates.
Denoted by e the [35X1] vector of employment coefficients for each of the sectors, which is obtained by dividing sector employment by the corresponding sector output (inverse of labor productivity per sector). Denote by A the direct requirements matrix of output multipliers.
Then the vector VFR = e*A denotes the (1x35) vector of first-round effects;
ViIE = e*L= e*(1-A) denotes the (1x35) vector of industrial-support effects
where: L=(A-1)-1 is the Leontief matrix of technical coefficients. Finally, define the vector:
VTM =e*B’, where B’ is a (35+1)x(35+1) matrix that includes one additional row at the bottom: the wage income per sector; and one additional column: the consumption of households in Bangladesh in 2015. B therefore includes additional indirect effects on employment of an increase in $1 million in demand. It takes into account the fact that with additional employment created in the economy, there is additional wage income which households in turn use to demand additional products. The production multipliers in the matrix A and L for Bangladesh are analyzed in more detail and compared with other countries in ADB (2016).
Appendixes 5
141
References
References
Agunias, D. R. 2008. Managing Temporary Migration: Lessons from the Philippine Model. Washington, DC: Migration Policy Institute.
Ahmed, H. U. 2014. Challenges Pharmaceutical Industry Faces. The Daily Financial Express. 25 October. http://www.thefinancialexpress-bd.com/2014/10/25/62771
Ahmed, S. and M. McGillivray. 2015. Human Capital, Discrimination, and the Gender Wage Gap in Bangladesh. World Development. 67 (March). pp. 506–524.
Amin, S. 1997. The Poverty-Purdah Trap in Rural Bangladesh: Implication for Women’s Roles in the Family. Development and Change. 28 (2). pp. 213–233.
_______. 2005. Selective Inclusion or Active Discrimination? Women and Labour Market in Bangladesh. In Emerging Issues in Bangladesh Economy: A Review of Bangladesh’s Development 2005–06. Centre for Policy Dialogue. Dhaka: The University Press Limited.
Anderson, S. and M. Eswaran. 2009. What Determines Female Autonomy? Evidence from Bangladesh. Journal of Development Economics. 90 (2). pp.179–91.
Arifeen, S. E., K. Hill, K. Z. Ahsan, K. Jamil, Q. Nahar, and P. K. Streatfield. 2014. Maternal Mortality in Bangladesh: A Countdown to 2015 Country Case Study. Lancet 2014. 384. pp. 1366–74.
Asadullah, M. 2005. Returns to Education in Bangladesh. QEH Working Paper Series. Oxford: University of Oxford.Asadullah, M. N. 2006. Returns to Education in Bangladesh . Education Economics. 14 (4). pp. 453–468.Asian Development Bank (ADB). 2015a. Part IV - Global Value Chains: Indicators for International Production
Sharing. In Key Indicators for Asia and the Pacific 2015. Manila. _______. 2015b . Innovative Strategies in Technical and Vocational Education and Training for Accelerated
Human Resource Development in South Asia: Bangladesh. Manila._______. 2016. Bangladesh Country Diagnostics Study: Consolidating Export-Led Growth. Manila.Asian Productivity Organization (APO). APO Productivity Database. http://www.apo-tokyo.org/wedo/
measurement (accessed April 2016).Bangladesh Bank. 2015. Quarterly Review on RMG: January-March 2015. Dhaka.Bangladesh Bureau of Educational Information and Statistics (BANBEIS). http://www.banbeis.gov.bd/webnew/
(accessed April 2016).Bangladesh Bureau of Statistics (BBS). 2011. Labour Force Survey 2010. Dhaka._______. 2011a. Report of the Household Income & Expenditure Survey 2010. Dhaka._______. 2013a. Gender Statistics of Bangladesh 2012. Dhaka. _______. 2013b. Multiple Indicators Cluster Survey 2012–2013: Key Findings. Dhaka._______. 2013c. Survey of Manufacturing Industries 2012. Dhaka._______. 2013d. Report on Violence Against Women (VAW) Survey 2011. Dhaka._______. 2013e. Bangladesh Demographic and Health Survey 2011. Dhaka._______. 2014. Report on Survey on the Use of Remittances 2013. Dhaka.

142
References
_______. 2015. Labour Force Survey 2013. Dhaka._______. Various years. Labour Force Survey. Dhaka.Bangladesh Labour Act, 2006 (XLII of 2006). Articles 39, 40, 42, 87, and 345. Dhaka.Becker, G. 1957. The Economics of Discrimination. Chicago: University of Chicago Press.Bhuyan, A. R. 2010. Bangladesh Industrial Policy 2010: A Critical Appraisal. Thoughts on Economics. 20 (3).Bhuyan, A. R. and M. A. Rashid. 1993. Trade Regimes and Industrial Growth: A Case Study of Bangladesh. Dhaka:
Bureau of Economic Research, University of Dhaka.Bodvarsson, ö.B. and H. Van den Berg. 2013. The Economics of Immigration Theory and Policy. New York: Springer.Bridges, S., D. Lawson, and S. Begum. 2011. Labour Market Outcomes in Bangladesh: The Role of Poverty and
Gender Norms. European Journal of Development Research 23 (3). pp. 459–87.Bureau of Manpower Education and Training. http://www.bmet.org.bd/BMET/stattisticalDataAction (accessed
June 2016).Byron, R. K. 2015. Dependence on Others for Livelihood Declines. The Daily Star. 15 July. Campaign for Popular Education (Campe) Bangladesh. 2008. Education Watch 2008. State of Primary Education in
Bangladesh: Progress Made, Challenges Remain. Dhaka: Campe._______. 2013. Education Watch 2013. New Vision, Old Challenges: The State of Primary Education in Bangladesh.
Dhaka: Campe._______. 2014. Whither Grade V Examination: An Assessment of Primary Education Completion Examination in
Bangladesh. Dhaka: Campe. _______. 2015. Education Watch 2015. Moving from MDG to SDG: Accelerate Progress for Quality Primary Education.
Dhaka: Campe.Carana Corporation. 2011. Information Technology Enabled Services (ITES) – Bangladesh. USAID Bangladesh IT
Enabled Services Project. Dhaka.Card, D. 1999. The Causal Effect of Education on Earnings. In O. Ashenfelter and D. Card, eds. Handbook of Labor
Economics. Amsterdam: Elsevier Science.Centre for Policy Dialogue (CPD). 2011. Labour and Social Trends Report. Report prepared for International Labour
Organization. Dhaka: CPD.Chae, C. and J. Chung. 2009. Pre-Employment Vocational Education and Training in Korea. SP Discussion Paper
#0921. Washington, DC: World Bank.Chanda, R. and S. Raihan. Forthcoming. Least-Developed Countries Services Waiver and Market Access for
Services Exports from Bangladesh: Opportunities and Challenges. Choudhury, T. 2013. Experiences of Women as Workers: A Study of Construction Workers in Bangladesh.
Construction Management and Economics. 31 (8). pp. 883–898.Cuberes D. and M. Teignier. 2012. Gender Gaps in the Labor Market and Aggregate Productivity. Sheffield
Economics Research Paper Series. No. 2012017. Sheffield, UK: University of Sheffield.Das, S., S. Jain-Chandra, K. Kochhar, and N. Kumar. 2015. Women Workers in India: Why So Few Among So Many?
International Monetary Fund Working Paper. Washington, DC: International Monetary Fund.De Bel-Air, F. 2014. Demography, Migration and Labour Market in Saudi Arabia. Explanatory Note No. 1/2014. Gulf
Labour Markets and Migration. http://gulfmigration.euDuflo, E. 2012. Women Empowerment and Economic Development. Journal of Economic Literature 2012. 50 (4). pp.
1051–1079.European Commission. 2015. Bangladesh Sustainability Compact. Technical Status Report. www.trade.ec.europa.
eu/doclib/docs/2015/april/tradoc_153390.pdf Fayad, G., M. Raissi, T. Rasmussen, and N. Westelius. 2012. Saudi Arabia: Selected Issues. International Monetary
Fund Country Report. No. 12/272. Washington, DC: International Monetary Fund.Feldman, S. 2009. Historicizing Garment Manufacturing in Bangladesh: Gender, Generation, and New Regulatory
Regimes. Journal of International Women’s Studies. 11 (1). pp. 268–28.Felipe, J. 2009. Inclusive Growth, Full Employment and Structural Change: Implications and Policies for
Developing Asia. The Anthem-Asian Development Bank Series. Manila: ADB.Global Migration Group. 2008. International Migration and Human Rights: Challenges and Opportunities on the
Threshold of the 60th Anniversary of the Universal Declaration of Human Rights. New York.Goldin, C. 1995. The U-Shaped Female Labor Force Function in Economic Development and Economic History.
In T. P. Schultz, ed. Investment in Women’s Human Capital and Economic Development. Chicago: University of Chicago Press.

143
References
Gonzales, C., S. Jain-Chandra, K. Kochhar, and M. Newiak. 2015. Fair Play: More Equal Laws Boost Female Labor Force Participation. IMF Staff Discussion Note. Washington, DC.
Government of Bangladesh, Department of Textiles. 2009. Survey of the Bangladesh Textile Industry to Assess the Requirement of Textile Technologists. Dhaka.
Government of Bangladesh, Ministry of Education. 2010. National Education Policy 2010 . Dhaka.Government of Bangladesh, Planning Commission. 2011. Bangladesh Sixth Five Year Plan FY2011–FY2015:
Accelerating Growth and Reducing Poverty. Part 1: Strategic Directions and Policy Framework. Dhaka._______. 2014. Millennium Development Goals Bangladesh Progress Report 2013. Dhaka._______. 2015. Bangladesh Seventh Five-Year Plan FY2016–FY2020 Accelerating Growth, Empowering Every Citizen.
Part 1: Strategic Directions and Policy Framework. Dhaka.Government of Nepal. 2014. Labour Migration for Employment: A Status Report for Nepal: 2013/2014. Ministry of
Labour and Employment. Kathmandu.Harris, J. R. and M. P. Todaro. 1970. Migration, Unemployment and Development: A Two-Sector Analysis.
American Economic Review. 60 (1). pp. 126–42.Heath, R. 2014. Women’s Access to Labor Market Opportunities, Control of Household Resources, and Domestic
Violence: Evidence from Bangladesh. World Development. 57. pp. 32–46.Heath, R. and A. M. Mobarak. 2015. Manufacturing Growth and the Lives of Bangladeshi Women. Journal of
Development Economics. 115 (2015). pp. 1–15.Hsieh, C., E. Hurst, C. Jones, and P. Klenow. 2013. The Allocation of Talent and U.S. Economic Growth. NBER
Working Paper No. 18693. Cambridge, MA: National Bureau of Economic Research.International Labour Organization (ILO). 2010. International Labour Migration: A Rights-Based Approach. Geneva._______. 2012. Macroeconomic Stability, Inclusive Growth and Employment. Thematic Think Piece from ILO,
UNCTAD, UNDESA, WTO. UN System Task team on Post-2015 UN Development Agenda._______. 2013a. Bangladesh: Seeking Better Employment Conditions for Better Socioeconomic Outcomes,
Studies on Growth with Equity, International Institute for Labour Studies, International Labour Organization. Geneva.
_______. 2013b. Decent Work Country Profile: Bangladesh. Geneva._______. 2013c. Statistics of Work, Employment and Labour Underutilization. Report II of the 19th International
Conference of Labour Statisticians. 2–11 October. Geneva. _______. 2014a. Fair Migration: Setting an ILO Agenda. Report of the Director-General, Report 1 B, 103rd Session,
International Labour Conference. Geneva: ILO._______. 2014b. Promoting Cooperation for Safe Migration and Decent Work. ILO. Dhaka._______. 2014c. Skilling the Workforce: Labour Migration and Skills Recognition and Certification in Bangladesh. ILO.
Dhaka._______. 2014d. Gender and Migration from Bangladesh. ILO. Dhaka._______. 2014e. In the Corridors of Remittance: Cost and Use of Remittances in Bangladesh. ILO. Dhaka._______. 2015 . Labour Market Trends Analysis and Labour Migration from South Asia to Gulf Cooperation Council
Countries, India and Malaysia. Geneva: ILO.ILO, UNICEF, and World Bank. 2011. Understanding Children's Work in Bangladesh Country Report. Understanding
Children's Work Programme, Rome. www.ucw-project.orgInternational Monetary Fund (IMF). 2012. Fiscal Policy and Employment in Advanced and Emerging Economies.
IMF Board Paper. Washington, DC._______. 2013. Women, Work, and the Economy: Macroeconomic Gains from Gender Equity. IMF Staff
Discussion Note No. SDN/13/10. Washington, DC.International Institute of Labour Studies (IILS). 2013. Bangladesh: Seeking Better Employment Conditions for Better
Socioeconomic Outcomes, Studies on Growth with Equity. Geneva.Islam, R. 2009. What Kind of Economic Growth is Bangladesh Attaining? In Q. Shahabuddin and R. I. Rahman,
eds. Development Experience and Emerging Challenges Bangladesh. Dhaka: The University Press._______. 2010. Pattern of Economic Growth and its Implication for Employment. In L. Banerjee, A. Dasgupta, and
R. Islam, eds. Development, Equity and Poverty: Essays in Honour of Azizur Rahman Khan. Delhi and New York: Macmillan and United Nations Development Programme.
_______. 2014a. Expanding Employment Opportunities: Policy Challenges for the Post-2015 Development Agenda. Paper presented at the International Symposium on Human Development in Global South: Emerging Perspectives in the Era of Post-Millennium Development Goals organized by the Institute of Human Development, Delhi. New Delhi. 28–29 April 2014.

144
References
_______. 2014b. The Employment Challenge Faced by Bangladesh : How Far is the Lewis Turning Point ? The Indian Journal of Labour Economics 57 (2).
_______. 2014c. Human Capital and Inclusive Growth: The Challenges for Bangladesh ». Paper presented at the workshop on Vision 3030: A Framework for Economic Policy Making and Strategy Formulation in a Pluralistic Democracy organized by the Bangladesh Economists’ Forum in Dhaka. 21–22 June 2014.
Islam, S., S. Parvin, and A. Kalam. 2013. Socioeconomic Impacts of International Migration in Bangladesh. Journal of Economics and Sustainable Development. 4 (4). pp. 9–18.
ITC and KPMG. 2012. Bangladesh Beckons: An Emerging Destination for IT-ITeS Outsourcing. Geneva: International Trade Centre.
Jayaprakash, A. n. d. Assessing Labour Market Trends in Qatar. SDC, GIZ, ILO study .Kabeer, N. 2001. Bangladeshi Women Workers and Labour Market Decisions: The Power to Choose. Dhaka: UPL.Kabeer, N. S. Mahmud, and S. Tasneem. 2011. Does Paid Work Provide a Pathway to Women’s Empowerment?
Empirical Findings from Bangladesh. IDS Working Paper No. 375. Brighton: Institute of Development Studies, University of Sussex.
Kanapathy, V. 2014. Labour Market Trends Analysis for Labour Migrants from South Asia to Selected Gulf Cooperation Council Countries, India and Malaysia. Deutsche Gesellschaft für Internationale Zusammenarbei (GIZ) and ILO study. Kathmandu: GIZ and ILO.
Kapsos, S. 2008. The Gender Wage Gap in Bangladesh. ILO Asia-Pacific Working Paper Series. Geneva: ILO.Kathuria, S. and M. Mezghenni. 2016. Toward New Sources of Competitiveness in Bangladesh: Key Findings of the
Diagnostic Trade Integration Study. Directions in Development Series. Washington, DC: World Bank.Khan, A. R. 2015. The Economy of Bangladesh: A Quarter Century of Development. London: Palgrave Macmillan.Khondker, B. H. and T. Ahsan. 2015. Background Paper on Tourism Sector. Background paper for the 7th Five Year
Plan. Government of Bangladesh, Planning Commission.Kolb, J. 2014. Country of Destination Report United Arab Emirates. SDC, GIZ, ILO study. Kolstad, I., A. Wiig, and K. G. Moazzem. 2014. Returns to Education among Entrepreneurs in Bangladesh. Journal
of Asian Economics. 34. pp. 54–65.Kumari, R. and I. Shamim. 2010. Gender Dimensions of International Migration from Bangladesh and India: Socio
Economic Impact on Families Left Behind. http://www.saneinetwork.net/ Files/10_07___Ranjana_Kumari.pdf
Labowitz, S. and D. Baumann-Pauly. 2014. Business as Usual is Not an Option: Supply Chains and Sourcing After Rana Plaza. New York: Center for Business and Human Rights at NYU, Leonard N. Stern School of Business.
Lewis, W. A. 1954. Economic Development with Unlimited Supplies of Labour. Manchester School. 22 (2). 139–191.Macchiavello, R., A. Menzel, and C. Woodruff. 2014. Managerial Capital and Productivity: Evidence from a Training
Program in the Bangladeshi Garment Sector. Working paper .Mahmud, S. and S. Tasneem. 2011. The Under Reporting of Women’s Economic Activity in Bangladesh: An
Examination of Official Statistics. BDI Working Paper No. 1. Dhaka: BRAC Development Institute.Majumder, P. P. and A. Begum. 2000. The Gender Imbalances in the Export Oriented Garment Industry in
Bangladesh. Working Paper Series. No. 12. Washington, DC: The World Bank.Mamun, K. and H. Nath. 2010. Workers' Migration and Remittances in Bangladesh. WCOB Faculty Publications.
Paper 84. http://digitalcommons.sacredheart.edu/wcob_fac/84Maxwell Stamp Ltd. 2010. Study on the International Demand for Semi–skilled and Skilled Bangladeshi Workers.
Report prepared for ILO Country Office. Dhaka.McLennan, W. 2012. Information Paper Australian National Accounts Introduction to Input-Output Multipliers,
Catalogue No. 5246.0. Canberra: Australian Bureau of Statistics. http://staff.estem-uc.edu.au/taipham/files/2012/03/52460-Information-Paper-Introduction-to-Input-Output-Multipliers.pdf
Miah, H. 2014. Agriculture Sector Development Strategy. Background Study for the Seventh Five-Year Plan. Government of Bangladesh, Planning Commission.
Miah, M. A. M. and A. K. E. Haque. 2013. Policy Options for Supporting Agricultural Diversification in Bangladesh. Study conducted under the Department of Agricultural Economics Bangladesh Agricultural Research Institute. Dhaka: National Food Policy Capacity Strengthening Programme.
Mincer, J. A. 1974. Age and Experience Profiles of Earnings. In Schooling, Experience, and Earnings. Cambridge, MA: National Bureau of Economic Research.

145
References
Ministry of Expatriates' Welfare & Overseas Employment. 2015. Contribution to the Seventh Five-Year Plan (2016–2020). Dhaka.
Osmani, S. R., Md. A. Latif, B. Sen, R. I. Rahman, M. Ahmed, T. F. Khan, and R. Islam. 2011. Dynamics of Poverty in Rural Bangladesh: Report of the Benchmark Survey. Institute of Microfinance. Dhaka.
Psacharopoulos, G. and H. A. Patrinos. 2004. Returns to investment in education: a further update. Education Economics. 12 (2). pp. 111-134.
Rahman, M. S. 2010. Bus Service for ‘Women Only’ in Dhaka City: An Investigation. Journal of Bangladesh Institute of Planners. 3 (December). pp. 17–32.
Rahman, R. I. 2012. Bangladesher Arthaneeti O Unnayan: Swadhinotar Por 40 Bachhar (in Bengali). Sahitya Prakash. Dhaka.
_______. Forthcoming. Bangladesh: Growth, Employment and Social Change. Dhaka: University Press Limited. Rahman, S. H. 1994. Trade and Industrialization in Bangladesh. Chapter 8 in G. K. Helliner, ed. Trade and
Industrialisation in Turbulent Times. Abingdon-on-Thames: Routledge.Rahman, R. I. and R. Islam. 2013. Female Labour Force Participation in Bangladesh: Trends, Drivers and Barriers.
ILO Asia-Pacific Working Paper Series. Geneva: ILO. Raihan, S. and D. Cheong. 2013. Impact of Trade in Services on Employment in Bangladesh: Special Reference to the IT
Sector. Geneva: ILO.Raihan, S. and M. Ahmed. 2009. Supply-Side Capacity and Export Response in Leather and Home Textile Sectors
in Bangladesh. MPRA Paper No. 37895. Munich: University Library of Munich.Ranis, G. and J. Fei. 1961. A Theory of Economic Development. American Economic Review 51.Ratha, D. et al. 2015. Migration and Remittances: Recent Developments and Outlook. Migration and Development
Brief 24. Washington, DC: World Bank. Ray, S., A. K. Sinha, and S. Chaudhury. 2007. Making Bangladesh a Leading Manpower Exporter: Chasing a Dream
of US$30 Billion Annual Migrant Remittances by 2015. Dhaka: Royal Danish Embassy.Rhee, Y. W. 1990. The Catalyst Model of Development: Lessons from Bangladesh’s Success with Garment Exports.
World Development. 18 (2). pp. 333–46.Rumani, I. 2014. Labour Market Trends Study. Country of Destination Report: Kuwait. SDC , GIZ, and ILO study. Salway, S., S. Jesmin, and S. Rahman. 2003. A Profile of Women’s Work Participation Among the Urban Poor of
Dhaka. World Development. 31 (5). pp. 881–901._______. 2005. Women’s Employment in Urban Bangladesh: A Challenge to Gender Identity? Development and
Change. 36 (2). pp. 317–349.South Asian Network on Economic Modeling (SANEM). 2014. Estimating the Benefits of Leather Sector
Relocation. Paper prepared for the Asia Foundation. Dhaka. Sattar, Z. New Directions for Trade Policy. Unpublished.Sen, A. 1975. Employment, Technology and Development. Oxford: Clarendon Press.Sen, B. and M. Rahman. 2015. Earnings Inequality, Returns to Education and Demand for Schooling: Addressing
Human Capital for Accelerated Growth in the Seventh Five-Year Plan of Bangladesh. Background study for Seventh Five-Year Plan. Dhaka: Government of Bangladesh, Planning Commission.
Shi, W. 2012. Development of TVET in [People's Republic of] China: Issues and Challenges. In M. Pilz, ed. The Future of Vocational Education and Training in a Changing World. Berlin: Springer.
Shinkai N. and M. Hossain. 2010. Impact of the Global Financial Crisis on the IT Sector in Bangladesh: Lessons Learnt and Policy Recommendations. Discussion Paper No. 181. Graduate School of International Development. Nagoya, Japan: Nagoya University.
Siddiqui, T. 2001. Transcending Boundaries: Labour Migration of Women from Bangladesh. Dhaka: University Press.
_______. 2003. Migration as a Livelihood Strategy for the Poor: The Bangladesh Case. Paper presented at a workshop organized jointly by DFID and RMMRU. Dhaka.
_______. 2005. International Labour Migration from Bangladesh: A Decent Work Perspective. Working Paper No. 66. Policy Integration Department. Geneva: ILO.
_______. 2010. Recruitment Cost in Bangladesh: Challenges of Governing Migration in the Countries of Origin. Working Paper Series No. 25. Dhaka: RMMRU .
_______. 2015. Migration Augments Development. Interview in The Daily Star, September 24. 2015. Singh, M. 2012. India's National Skills Development Policy and Implications for TVET and Lifelong Learning. In M.
Pilz, ed. The Future of Vocational Education and Training in a Changing World. Berlin: Springer.

146
References
Sobhan, R. 1990. The Political Economy of South Asian Economic Cooperation. Bangladesh Journal of Political Economy. 10 (1). pp. 26–48
Solotaroff, J. L., R. Pande, and G. Lopez-Acevedo. 2014. Violence against Women and Girls: Lessons from South Asia. Washington, DC: World Bank.
Toufique, K. A. 2014. Labour Market Transition of Young Women and Men in Bangladesh. Work4Youth Publication Series No. 13. Geneva: ILO.
Tuck-Primdahl, M. 2011. Structural Change, Growth and Jobs. World Bank Blog. http://blogs.worldbank.org/developmenttalk/structural-change-growth-and-jobs
Udry, C. 1996. Gender, Agricultural Production, and the Theory of the Household. Journal of Political Economy. 104 (5). pp. 1010–46.
Ullah, M. S. 2012. Determinants of International Labor Migration from Bangladesh: A Gravity Model of Panel Data. Shiga, Japan: Graduate School of Economics, Ritsumeikan University Noji-Higashi.
United Nations. 2015. World Population Prospects: The 2015 Revision. The United Nations Population Division. New York: United Nations.
United Nations Department of Economic and Social Affairs (UNDESA). Population Projections for Bangladesh. (accessed April 2015).
United Nations Development Programme (UNDP) and International Labour Organization (ILO). 2012. Growth, Structural Change and Employment. Report of the first thematic consultation on the post-2015 framework for development. Tokyo. 15–16 May.
United Nations Educational, Scientific and Cultural Organization (UNESCO). 2000. The Dakar Framework for Action.
United Nations Development Programme (UNDP). 2013. Human Development Report. New York: UNDP.United Nations Research Institute for Social Development (UNRISD). 2010. Combating Poverty and Inequality:
Structural Change, Social Policy and Politics. Geneva: UNRISD.University Grants Commission of Bangladesh. http://www.ugc.gov.bd/en/home/Van Hear, N., O. Bakewell, and K. Long. 2012. Drivers of Migration. Migrating Out of Poverty Project. Brighton,
United Kingdom: University of Sussex.Verick. S. 2014. Female Labor Force Participation in Developing Countries. IZA World of Labor: 87 .War on Want. 2011. Stitched Up: Women Workers in the Bangladeshi Garment Industry. London.Weston. C. 2014. Labour Market Trends. Study Country of Destination Report: Kingdom of Saudi Arabia. SDC,
GIZ, ILO study . Wickramasekara, P. 2014. Regulation of the Recruitment Process and Reduction of Migration Costs: Comparative
Analysis of South Asia. In ILO (2004b). World Bank. 2004. Trade Policies in South Asia: An Overview. Report No. 29949. Washington, DC: World Bank. _______. 2007a. Learning for Job Opportunities: An Assessment of the Vocational Education and Training in
Bangladesh. Bangladesh Development Series Paper No. 16. Washington, DC: World Bank._______. 2007b. Whispers to Voices: Gender and Social Transformation in Bangladesh. Washington, DC: World Bank._______. 2012a. Bangladesh: Towards Accelerated, Inclusive and Sustainable Growth—Opportunities and Challenges
(In Two Volumes) Volume II: Main Report. Washington, DC: World Bank. _______. 2012b. Sewing Success: Employment, Wages, and Poverty Following the End of the Multi-Fibre
Arrangement. In G. Lopez-Acevedo and R. Robertson, eds. Washington, DC._______. 2013a. Bangladesh Education Sector Review, Seeding Fertile Ground - Education That Works for Bangladesh.
Dhaka: World Bank._______. 2013b. World Development Indicators. Washington, DC._______. 2014. A Study on National University and Affiliated Colleges in Bangladesh. Report No. 65.
Washington, DC._______. Various years. World Development Indicators. Washington, DC.World Input-Output Database. World Input-Output Tables. http://www.wiod.org/new_site/home.htm (accessed
April 2016).World Travel and Tourism Council. n. d. Travel and Tourism Economic Impact 2015. https://www.wttc.org/-/media/
files/reports/economic%20impact%20research/regional%202015/world2015.pdf
BANGLADESH: Looking Beyond Garments Employment Diagnostic Study
Economic growth in Bangladesh, above 6% in most years since the 2000s, has been on the fast track since the 1990s. Not many developing countries, especially the least developed, have been able to achieve this consistently for such a long period. Yet despite the jobs generated in the export-oriented ready-made garment industry, the fruits of growth have not been widely shared. This joint study by the Asian Development Bank and the International Labour Organization examines the nature and magnitude of the employment challenge Bangladesh faces. It looks at the nature of productive employment and its role in transmitting the benefits of growth into incomes for the poor, thus reducing poverty. It also examines the importance of overseas employment, changing gender roles in employment in Bangladesh, quality of education, and skills development.
About the Asian Development Bank
ADB’s vision is an Asia and Pacific region free of poverty. Its mission is to help its developing member countries reduce poverty and improve the quality of life of their people. Despite the region’s many successes, it remains home to half of the world’s extreme poor. ADB is committed to reducing poverty through inclusive economic growth, environmentally sustainable growth, and regional integration.
Based in Manila, ADB is owned by 67 members, including 48 from the region. Its main instruments for helping its developing member countries are policy dialogue, loans, equity investments, guarantees, grants, and technical assistance.
About the International Labour Organization
The International Labour Organization (ILO) is the United Nations agency for the world of work. It sets international labor standards, promotes rights at work, and encourages decent employment opportunities, the enhancement of social protection and the strengthening of dialogue on work-related issues. The ILO has a unique structure, bringing together governments, employers’ and workers’ representatives.
ASIAN DEVELOPMENT BANK6 ADB Avenue, Mandaluyong City1550 Metro Manila, Philippineswww.adb.org
INTERNATIONAL LABOUR ORGANIzATION4 route des Morillons1211 Geneva 22, Switzerlandwww.ilo.org