Embed Size (px)
Citation preview

May 2019 Southern California Association of Governments
Profile of
Los Angeles County
Southern California Association of Governments (SCAG) Regional Council includes 69 districts which represent 191 cities and 6 counties in the SCAG region
LOCAL PROFILES REPORT 2019
This profile report was prepared by the Southern California Association of Governments and shared with Los Angeles County. SCAG provides local governments with a variety of benefits and services including, for example, data and information, GIS training, planning and technical assistance, and sustainability planning grants.

May 2019 Southern California Association of Governments
TABLE OF CONTENTS
I. Introduction .......................................................................................................... 1
II. Population ............................................................................................................ 4
III. Households ........................................................................................................... 9
IV. Housing ............................................................................................................... 12
V. Transportation .................................................................................................... 18
VI. Active Transportation ......................................................................................... 20
VII. Employment ....................................................................................................... 21
VIII. Retail Sales ......................................................................................................... 29
IX. Education ............................................................................................................ 30
X. Public Health ....................................................................................................... 33
XI. SCAG Regional Highlights .................................................................................... 34
XII. Data Sources ....................................................................................................... 35
XIII. Methodology ...................................................................................................... 36
XIV. Acknowledgments .............................................................................................. 41

2019 Local Profiles Los Angeles County
THIS PAGE INTENTIONALLY LEFT BLANK

2019 Local Profiles Los Angeles County
Southern California Association of Governments
1
I. INTRODUCTION
The Southern California Association of Governments
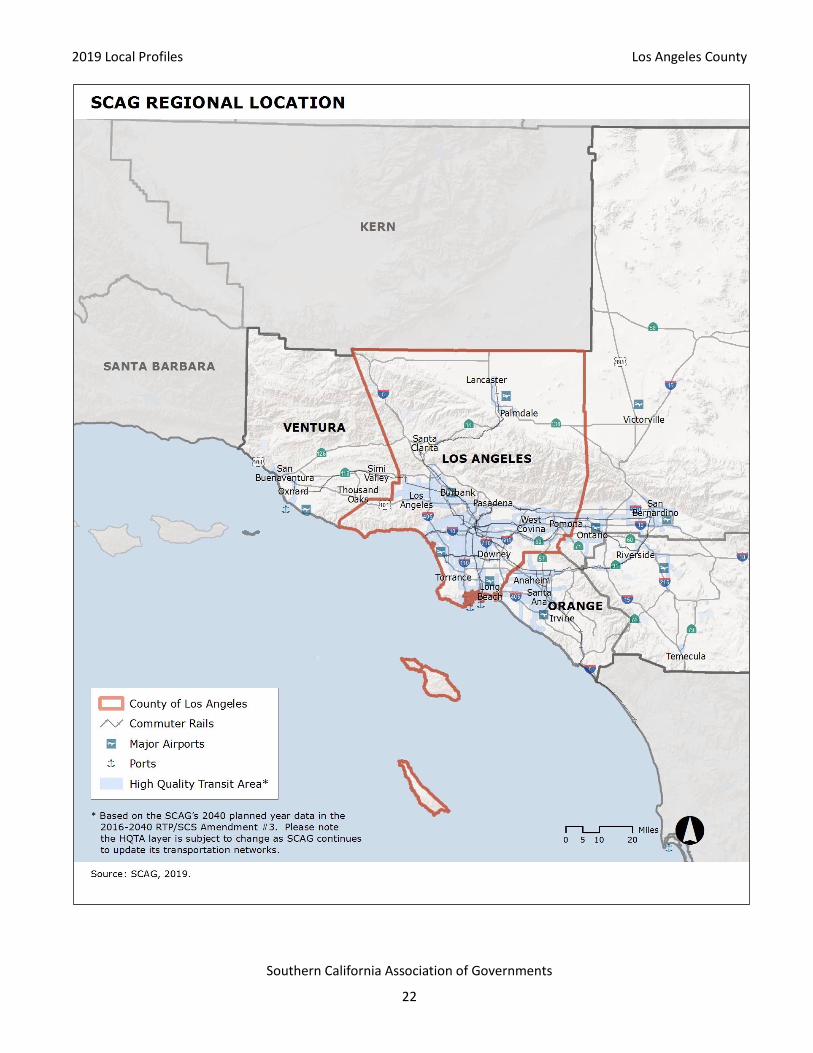
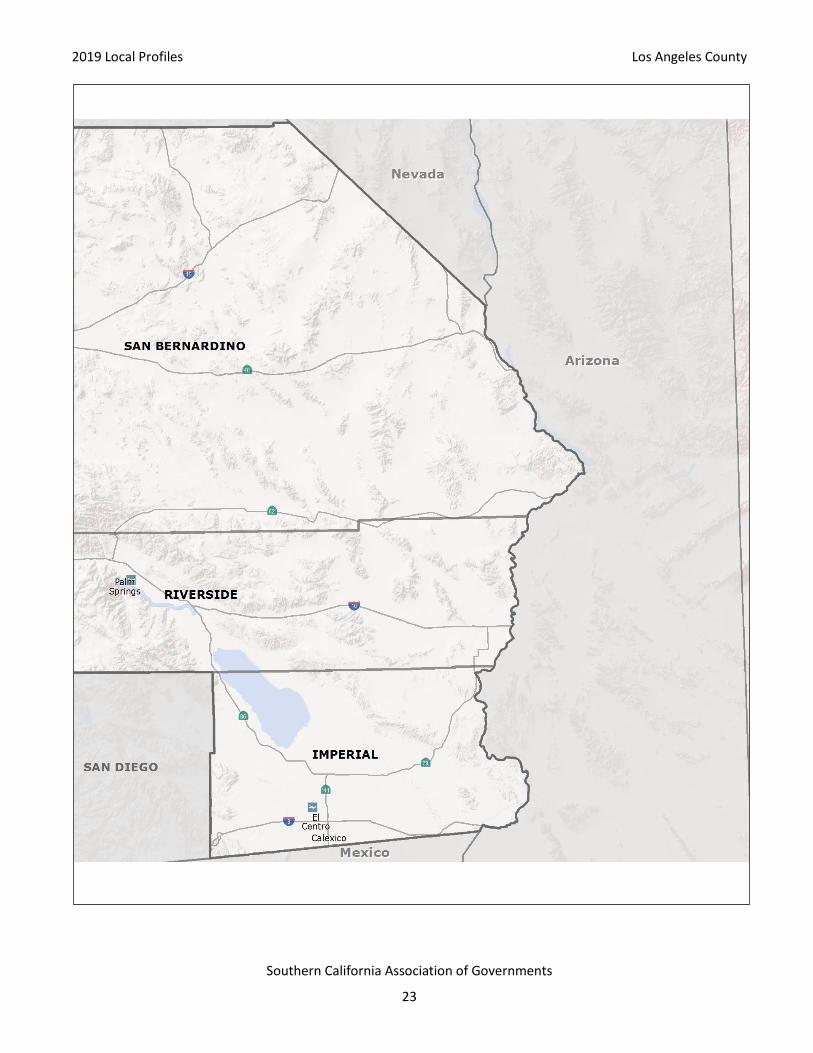
The Southern California Association of Governments (SCAG) is the largest Metropolitan Planning Organization (MPO) in the nation, with nearly 19 million residents. The SCAG region includes six counties (Imperial, Los Angeles, Orange, Riverside, San Bernardino, and Ventura) and 191 incorporated cities. In addition, the SCAG region is a major hub of global economic activity, representing the 16th largest economy in the world and is considered the nation’s gateway for international trade, with two of the largest ports in the nation. The SCAG region is the also the most culturally diverse region in the nation, with no single ethnic group comprising a majority of the population. With a robust, diversified economy and a growing population substantially fueled by international immigration, the SCAG region is poised to continue its role as a primary metropolitan center on the Pacific Rim.
SCAG Activities
As the designated MPO, SCAG is mandated by federal law to research and develop a Regional Transportation Plan (RTP), which incorporates a Sustainable Communities Strategy (SCS) per California state law. Additionally, SCAG is pursuing a variety of innovative planning and policy initiatives to foster a more sustainable Southern California. In addition to conducting the formal planning activities required of an MPO, SCAG provides local governments with a wide variety of benefits and services including, for example, data and information, GIS training, planning and technical assistance, and support for sustainability planning grants.
The Local Profiles
In 2008, SCAG initiated the Local Profiles project as a part of a larger initiative to provide a variety of new services to its member cities and counties. Through extensive input from member jurisdictions, the inaugural Local Profiles reports were released at the SCAG General Assembly in May 2009. The Profiles have since been updated every two years.
The Local Profiles reports provide a variety of demographic, economic, education, housing, and transportation information about each member jurisdiction including, but not limited to, the following:
How much growth in population has taken place since 2000?
Has the local jurisdiction been growing faster or slower than the county or regional average?
Have there been more or fewer school-age children?
Have homeownership rates been increasing or decreasing?
How and where do residents travel to work?
How has the local economy been changing in terms of employment share by sector?
Answers to questions such as these provide a snapshot of the dynamic changes affecting each local jurisdiction.

2019 Local Profiles Los Angeles County
Southern California Association of Governments
2
The purpose of this report is to provide current information and data for Los Angeles County for planning and outreach efforts. Information on population, housing, transportation, employment, retail sales, and education can be utilized by the city to make well informed planning decisions. The report provides a portrait of the County and its changes since 2000, using average figures for SCAG Region as a comparative baseline. In addition, the most current data available for the region is also included in the Statistical Summary (page 3). This profile report illustrates current trends occurring in Los Angeles County.
Factors Affecting Local Changes Reflected in the 2019 Report
Overall, member jurisdictions since 2000 have been impacted by a variety of factors at the national, regional, and local levels. For example, the vast majority of member jurisdictions included in the 2019 Local Profiles reflect national demographic trends toward an older and more diverse population. Evidence of continued economic growth is also apparent through increases in employment, retail sales, building permits, and home prices. Work destinations and commute times correlate with regional development patterns and the location of local jurisdictions, particularly in relation to the regional transportation system.
Uses of the Local Profiles
Following release at the SCAG General Assembly, the Local Profiles are posted on the SCAG website and are used for a variety of purposes including, but not limited to, the following:
As a data and communication resource for elected officials, businesses, and residents
Community planning and outreach
Economic development
Visioning initiatives
Grant application support
Performance monitoring
The primary user groups of the Local Profiles include member jurisdictions and state and federal legislative delegates of Southern California. This report is a SCAG member benefit and the use of the data contained within this report is voluntary.
Report Organization
This report includes three sections. The first section presents a ‘Statistical Summary’ for Los Angeles County. The second section provides detailed information organized by subject area and includes brief highlights of some of the trends identified by that information. The third section, ‘Methodology’, describes technical considerations related to data definitions, measurement, and sources.
2019 Local Profiles Los Angeles County
Southern California Association of Governments
3
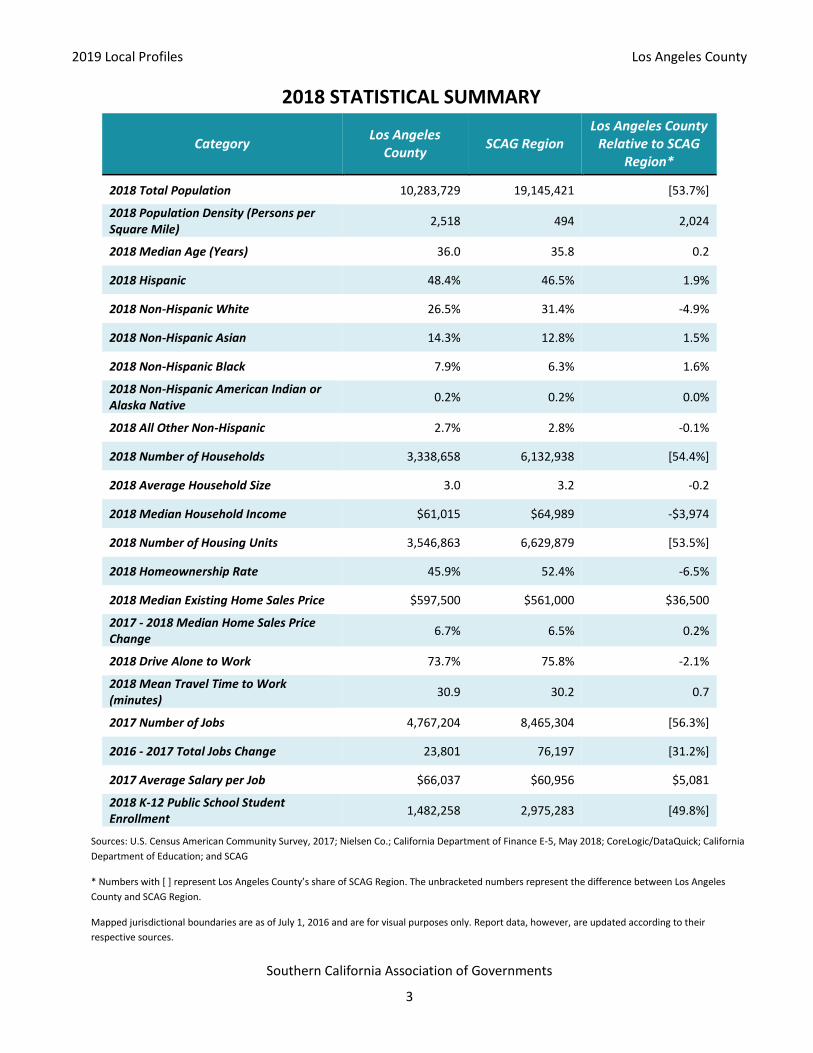
2018 STATISTICAL SUMMARY
Category Los Angeles
County SCAG Region
Los Angeles County Relative to SCAG
Region*
2018 Total Population 10,283,729 19,145,421 [53.7%]
2018 Population Density (Persons per Square Mile)
2,518 494 2,024
2018 Median Age (Years) 36.0 35.8 0.2
2018 Hispanic 48.4% 46.5% 1.9%
2018 Non-Hispanic White 26.5% 31.4% -4.9%
2018 Non-Hispanic Asian 14.3% 12.8% 1.5%
2018 Non-Hispanic Black 7.9% 6.3% 1.6%
2018 Non-Hispanic American Indian or Alaska Native
0.2% 0.2% 0.0%
2018 All Other Non-Hispanic 2.7% 2.8% -0.1%
2018 Number of Households 3,338,658 6,132,938 [54.4%]
2018 Average Household Size 3.0 3.2 -0.2
2018 Median Household Income $61,015 $64,989 -$3,974
2018 Number of Housing Units 3,546,863 6,629,879 [53.5%]
2018 Homeownership Rate 45.9% 52.4% -6.5%
2018 Median Existing Home Sales Price $597,500 $561,000 $36,500
2017 - 2018 Median Home Sales Price Change
6.7% 6.5% 0.2%
2018 Drive Alone to Work 73.7% 75.8% -2.1%
2018 Mean Travel Time to Work (minutes)
30.9 30.2 0.7
2017 Number of Jobs 4,767,204 8,465,304 [56.3%]
2016 - 2017 Total Jobs Change 23,801 76,197 [31.2%]
2017 Average Salary per Job $66,037 $60,956 $5,081
2018 K-12 Public School Student Enrollment
1,482,258 2,975,283 [49.8%]
Sources: U.S. Census American Community Survey, 2017; Nielsen Co.; California Department of Finance E-5, May 2018; CoreLogic/DataQuick; California
Department of Education; and SCAG
* Numbers with [ ] represent Los Angeles County’s share of SCAG Region. The unbracketed numbers represent the difference between Los Angeles
County and SCAG Region.
Mapped jurisdictional boundaries are as of July 1, 2016 and are for visual purposes only. Report data, however, are updated according to their
respective sources.

2019 Local Profiles Los Angeles County
Southern California Association of Governments
4
II. POPULATION
Population Growth
Population: 2000 - 2018
Source: California Department of Finance, E-5, 2000-2018
Between 2000 and 2018, the total population of Los Angeles County increased by 764,399 to 10,283,729.
During this 18-year period, the County’s population growth rate of 8 percent was lower than the SCAG Region rate of 15.9 percent.
53.7 percent of the total population of SCAG Region is in Los Angeles County.
Population values for 2000 and 2010 are from the U.S. Decennial Census.
Values for other years are estimates by the California Department of Finance.
0
2,000,000
4,000,000
6,000,000
8,000,000
10,000,000
12,000,000
2000 2002 2004 2006 2008 2010 2012 2014 2016 2018
Po
pu
lati
on

2019 Local Profiles Los Angeles County
Southern California Association of Governments
5
Population by Age Range
Population Share by Age: 2000, 2010, and 2018
Sources: 2000 & 2010 U.S. Decennial Census; American Community Survey, 2017; Nielsen Co.
Between 2000 and 2018, the 55-64 age group experienced the largest increase in share, growing from 7.3 to 11.5 percent.
The age group that experienced the greatest decline in share was 5-20, decreasing from 24.6 to 18.9 percent.
Population by Age: 2000, 2010, and 2018
Sources: 2000 & 2010 U.S. Decennial Census; American Community Survey, 2017; Nielsen Co.
The 55-64 age group added the most population, with an increase of 485,709 people between 2000 and 2018.
0%
5%
10%
15%
20%
25%
30%
35%
0-4 5-20 21-34 35-54 55-64 65+
Shar
e o
f C
ou
nty
Po
pu
lati
on
2000 2010 2018
0
500,000
1,000,000
1,500,000
2,000,000
2,500,000
3,000,000
3,500,000
Po
pu
lati
on
2000 2010 2018

2019 Local Profiles Los Angeles County
Southern California Association of Governments
6
Population by Race/Ethnicity
Hispanic or Latino of Any Race: 2000, 2010, and 2018
Sources: 2000 & 2010 U.S. Decennial Census; American Community Survey, 2017; Nielsen Co.
Between 2000 and 2018, the share of Hispanic population in the County increased from 44.6 percent to 48.4 percent.
Non-Hispanic White: 2000, 2010, and 2018
Sources: 2000 & 2010 U.S. Decennial Census; American Community Survey, 2017; Nielsen Co.
Between 2000 and 2018, the share of Non-Hispanic White population in the County decreased from 31.1 percent to 26.5 percent.
Please refer to the Methodology section for definitions of the racial/ethnic categories.
44.6%47.7% 48.4%
0%
10%
20%
30%
40%
50%
60%
2000 2010 2018
Shar
e o
f C
ou
nty
Po
pu
lati
on
31.1%
27.8%26.5%
0%
5%
10%
15%
20%
25%
30%
35%
2000 2010 2018
Shar
e o
f C
ou
nty
Po
pu
lati
on

2019 Local Profiles Los Angeles County
Southern California Association of Governments
7
Non-Hispanic Asian: 2000, 2010, and 2018
Sources: 2000 & 2010 U.S. Decennial Census; American Community Survey, 2017; Nielsen Co.
Between 2000 and 2018, the share of Non-Hispanic Asian population in the County increased from 11.9 percent to 14.3 percent.
Non-Hispanic Black: 2000, 2010, and 2018
Sources: 2000 & 2010 U.S. Decennial Census; American Community Survey, 2017; Nielsen Co.
Between 2000 and 2018, the share of Non-Hispanic Black population in the County decreased from 9.5 percent to 7.9 percent.
11.9%
13.5%14.3%
0%
2%
4%
6%
8%
10%
12%
14%
16%
2000 2010 2018
Shar
e o
f C
ou
nty
Po
pu
lati
on
9.5%
8.3%7.9%
0%
1%
2%
3%
4%
5%
6%
7%
8%
9%
10%
2000 2010 2018
Shar
e o
f C
ou
nty
Po
pu
lati
on

2019 Local Profiles Los Angeles County
Southern California Association of Governments
8
Non-Hispanic American Indian or Alaska Native: 2000, 2010, & 2018
Sources: 2000 & 2010 U.S. Decennial Census; American Community Survey, 2017; Nielsen Co.
Between 2000 and 2018, the share of Non-Hispanic American Indian or Alaska Native population in the County decreased from 0.3 percent to 0.2 percent.
All Other Non-Hispanic: 2000, 2010, and 2018
Sources: 2000 & 2010 U.S. Decennial Census; American Community Survey, 2017; Nielsen Co.
Between 2000 and 2018, the share of All Other Non-Hispanic population group in the County decreased from 2.8 percent to 2.7 percent.
0.27%
0.22%
0.20%
0.0%
0.1%
0.2%
0.3%
2000 2010 2018
Shar
e o
f C
ou
nty
Po
pu
lati
on
2.8%
2.5%
2.7%
0.0%
0.5%
1.0%
1.5%
2.0%
2.5%
3.0%
2000 2010 2018
Shar
e o
f C
ou
nty
Po
pu
lati
on

2019 Local Profiles Los Angeles County
Southern California Association of Governments
9
III. HOUSEHOLDS
Number of Households (Occupied Housing Units)
Number of Households: 2000 - 2018
Sources: California Department of Finance, E-5, 2000-2018
Between 2000 and 2018, the total number of households in Los Angeles County increased by 204,887 units, or 6.5 percent.
During this 18-year
period, the County’s household growth rate of 6.5 percent was lower than the SCAG region growth rate of 12.8 percent.
54.4 percent of SCAG Region’s total number of households are in Los Angeles County.
In 2018, the
County’s average household size was 3.0, lower than the SCAG region average of 3.2.
Average Household Size: 2000 - 2018
Source: California Department of Finance, E-5, 2000-2018
3,133,771
3,146,495
3,166,669
3,196,157
3,224,053
3,239,280
3,253,396
3,278,408
3,308,022
3,338,658
0
500,000
1,000,000
1,500,000
2,000,000
2,500,000
3,000,000
3,500,000
4,000,000
2000 2002 2004 2006 2008 2010 2012 2014 2016 2018
Nu
mb
er o
f H
ou
seh
old
s
0.0
0.5
1.0
1.5
2.0
2.5
3.0
3.5
2000 2002 2004 2006 2008 2010 2012 2014 2016 2018
Ave
rag
e H
ou
seh
old
Siz
e
Los Angeles County SCAG Region
2019 Local Profiles Los Angeles County
Southern California Association of Governments
10
Households by Size
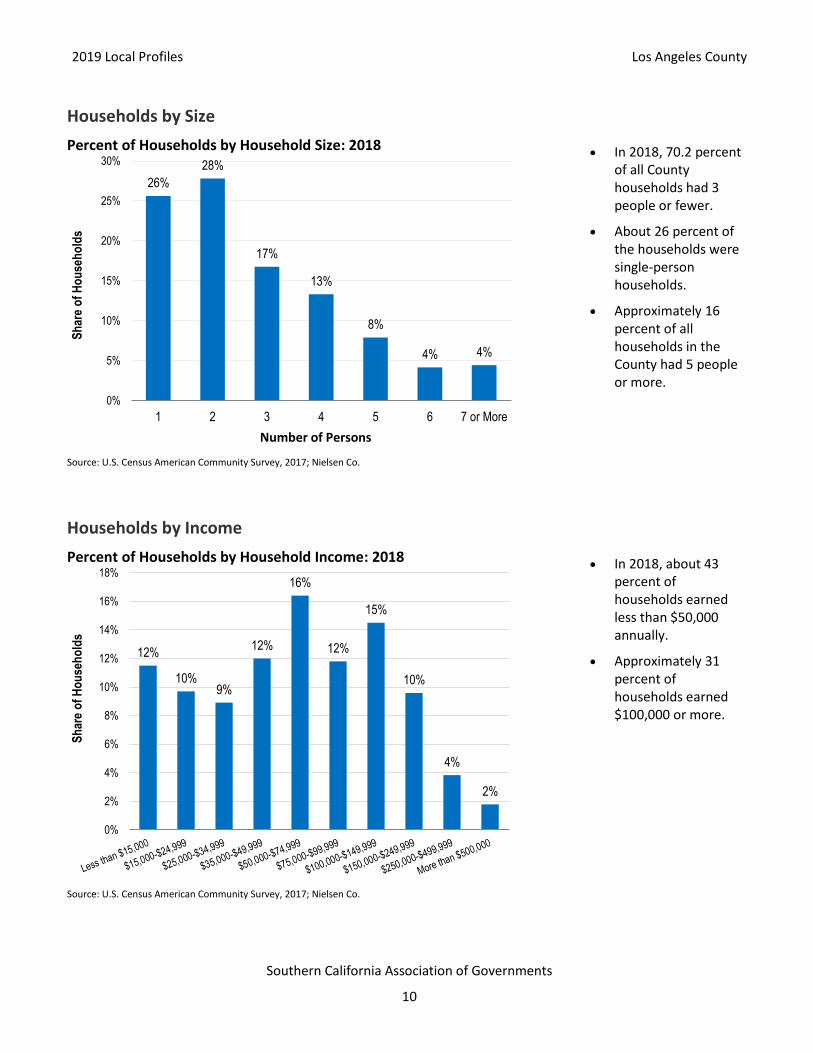
Percent of Households by Household Size: 2018
Source: U.S. Census American Community Survey, 2017; Nielsen Co.
In 2018, 70.2 percent of all County households had 3 people or fewer.
About 26 percent of the households were single-person households.
Approximately 16 percent of all households in the County had 5 people or more.
Households by Income
Percent of Households by Household Income: 2018
Source: U.S. Census American Community Survey, 2017; Nielsen Co.
In 2018, about 43 percent of households earned less than $50,000 annually.
Approximately 31 percent of households earned $100,000 or more.
26%
28%
17%
13%
8%
4% 4%
0%
5%
10%
15%
20%
25%
30%
1 2 3 4 5 6 7 or More
Sh
are
of
Ho
use
ho
lds
Number of Persons
12%
10%9%
12%
16%
12%
15%
10%
4%
2%
0%
2%
4%
6%
8%
10%
12%
14%
16%
18%
Sh
are
of
Ho
use
ho
lds

2019 Local Profiles Los Angeles County
Southern California Association of Governments
11
Household Income
Median Household Income: 2000, 2010, and 2018
Source: 2000 & 2010 U.S. Decennial Census; American Community Survey, 2017; Nielsen Co.
From 2000 to 2018, median household income increased by $18,826.
Note: Dollars are not adjusted for annual inflation.
Renters and Homeowners
Percentage of Renters and Homeowners: 2000, 2010, and 2018
2000
2010
2018
Sources: 2000 & 2010 U.S. Decennial Census; American Community Survey, 2017; Nielsen Co.
Between 2000 and 2018, homeownership rates decreased and the share of renters increased.
$42,189
$55,476
$61,015
$0
$10,000
$20,000
$30,000
$40,000
$50,000
$60,000
$70,000
2000 2010 2018
Med
ian
Ho
use
ho
ld In
com
e
Rent52.1%
Own47.9% Rent
52.3%
Own47.7% Rent
54.1%
Own45.9%
2019 Local Profiles Los Angeles County
Southern California Association of Governments
12
IV. HOUSING
Total Housing Production
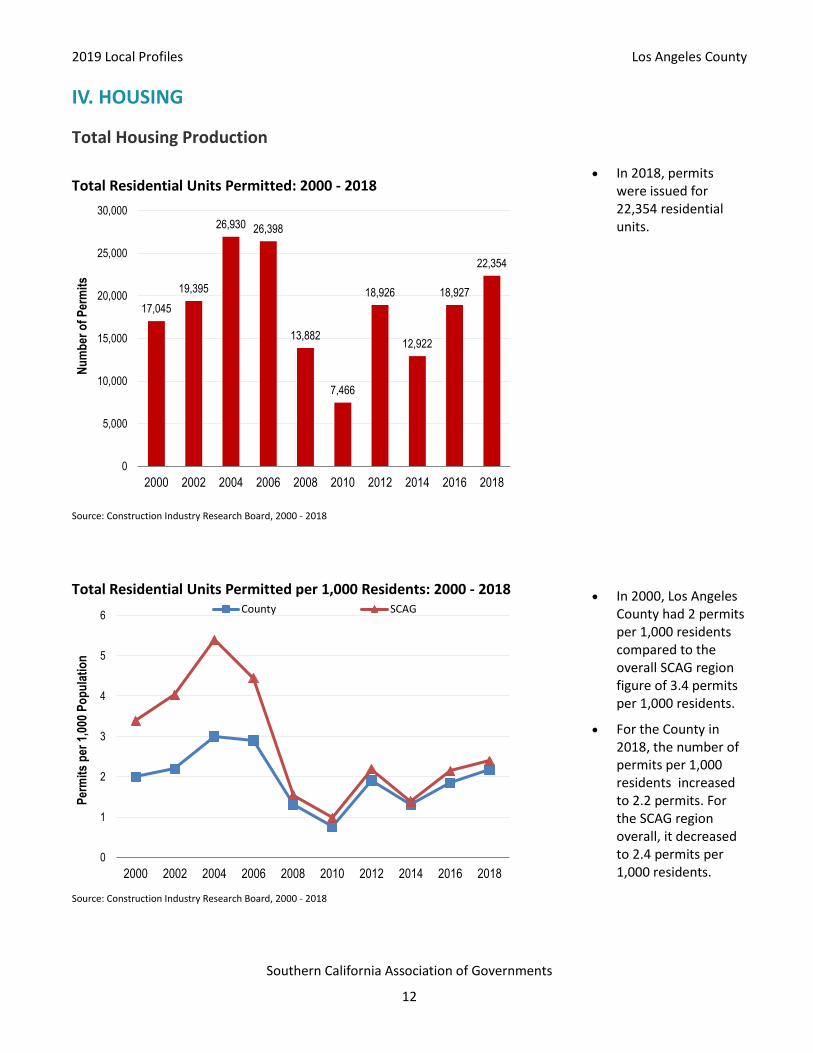
Total Residential Units Permitted: 2000 - 2018
Source: Construction Industry Research Board, 2000 - 2018
In 2018, permits
were issued for 22,354 residential units.
Total Residential Units Permitted per 1,000 Residents: 2000 - 2018
Source: Construction Industry Research Board, 2000 - 2018
In 2000, Los Angeles County had 2 permits per 1,000 residents compared to the overall SCAG region figure of 3.4 permits per 1,000 residents.
For the County in 2018, the number of permits per 1,000 residents increased to 2.2 permits. For the SCAG region overall, it decreased to 2.4 permits per 1,000 residents.
17,045
19,395
26,930 26,398
13,882
7,466
18,926
12,922
18,927
22,354
0
5,000
10,000
15,000
20,000
25,000
30,000
2000 2002 2004 2006 2008 2010 2012 2014 2016 2018
Nu
mb
er o
f P
erm
its
0
1
2
3
4
5
6
2000 2002 2004 2006 2008 2010 2012 2014 2016 2018
Per
mit
s p
er 1
,000
Po
pu
lati
on
County SCAG

2019 Local Profiles Los Angeles County
Southern California Association of Governments
13
Single-Family Housing Production
Single-Family Units Permitted: 2000 - 2018
Source: Construction Industry Research Board, 2000 - 2018
In 2018, permits were issued for 5,721 single family homes.
Single-Family Units Permitted per 1,000 Residents: 2000 - 2018
Source: Construction Industry Research Board, 2000 - 2018
In 2000, Los Angeles County issued 0.9 permits per 1,000 residents compared to the overall SCAG region figure of 2.3 permits per 1,000 residents.
For the County in 2018, the number of permits issued per 1,000 residents decreased to 0.6 permits. For the SCAG region overall, it decreased to 1.1 permits per 1,000 residents.
8,417 8,217
11,752
10,120
3,527
2,439
4,370
3,000
4,218
5,721
0
2,000
4,000
6,000
8,000
10,000
12,000
14,000
2000 2002 2004 2006 2008 2010 2012 2014 2016 2018
Nu
mb
er
of
Pe
rmit
s
0.0
0.5
1.0
1.5
2.0
2.5
3.0
3.5
4.0
2000 2002 2004 2006 2008 2010 2012 2014 2016 2018
Pe
rmit
s p
er
1,0
00
Re
sid
en
ts
County SCAG

2019 Local Profiles Los Angeles County
Southern California Association of Governments
14
Multi-Family Housing Production
Multi-Family Units Permitted: 2000 - 2018
Source: Construction Industry Research Board, 2000-2018
In 2018, permits were issued for 16,633 multi-family residential units.
Multi-Family Units Permitted per 1,000 Residents: 2000 - 2018
Source: Construction Industry Research Board, 2000-2018
For the County in 2018, the number of permits per 1,000 residents increased to 1.6 permits. For the SCAG region overall, it increased to 1.3 permits per 1,000 residents.
8,628
11,178
15,177
16,275
10,357
5,029
14,556
9,922
14,709
16,633
0
2,000
4,000
6,000
8,000
10,000
12,000
14,000
16,000
18,000
2000 2002 2004 2006 2008 2010 2012 2014 2016 2018
Nu
mb
er
of
Pe
rmit
s
0.0
0.5
1.0
1.5
2.0
2000 2002 2004 2006 2008 2010 2012 2014 2016 2018
Per
mit
s p
er 1
,000
Po
pu
lati
on
County SCAG
2019 Local Profiles Los Angeles County
Southern California Association of Governments
15
Home Sales Prices
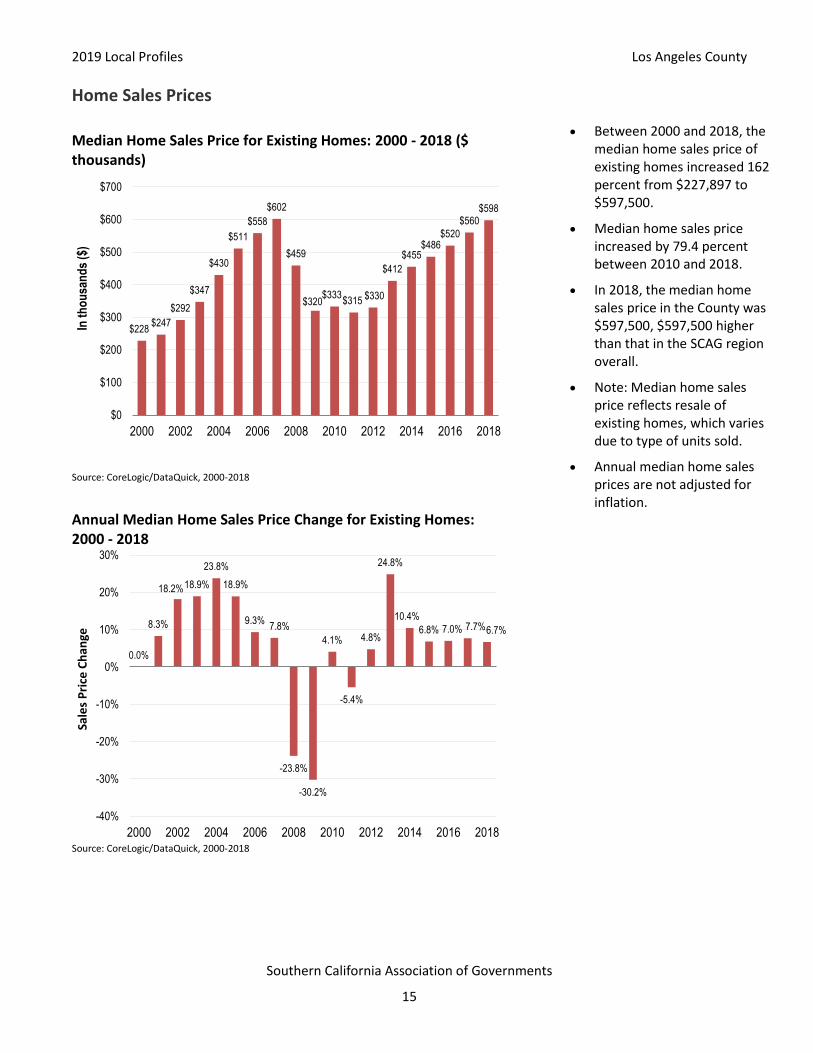
Median Home Sales Price for Existing Homes: 2000 - 2018 ($ thousands)
Source: CoreLogic/DataQuick, 2000-2018
Annual Median Home Sales Price Change for Existing Homes: 2000 - 2018
Source: CoreLogic/DataQuick, 2000-2018
Between 2000 and 2018, the median home sales price of existing homes increased 162 percent from $227,897 to $597,500.
Median home sales price increased by 79.4 percent between 2010 and 2018.
In 2018, the median home sales price in the County was $597,500, $597,500 higher than that in the SCAG region overall.
Note: Median home sales price reflects resale of existing homes, which varies due to type of units sold.
Annual median home sales prices are not adjusted for inflation.
$228$247
$292
$347
$430
$511
$558
$602
$459
$320$333
$315 $330
$412
$455$486
$520
$560$598
$0
$100
$200
$300
$400
$500
$600
$700
2000 2002 2004 2006 2008 2010 2012 2014 2016 2018
In t
ho
usa
nd
s ($
)
0.0%
8.3%
18.2%18.9%
23.8%
18.9%
9.3%7.8%
-23.8%
-30.2%
4.1%
-5.4%
4.8%
24.8%
10.4%
6.8% 7.0% 7.7%6.7%
-40%
-30%
-20%
-10%
0%
10%
20%
30%
2000 2002 2004 2006 2008 2010 2012 2014 2016 2018
Sale
s P
rice
Ch
ange

2019 Local Profiles Los Angeles County
Southern California Association of Governments
16
HOUSING TYPE
Housing Type by Units: 2018
Housing Type Number of
Units Percent of Total Units
Single Family Detached 1,726,593 48.7 %
Single Family Attached 232,359 6.6 %
Multi-family: 2 to 4 units 288,033 8.1 %
Multi-family: 5 units plus 1,241,589 35.0 %
Mobile Home 58,289 1.6 %
Total 3,546,863 100.0 %
Source: California Department of Finance, E-5, 2018
The most common housing type is Single Family Detached.
Approximately 55.3 percent are single family homes and 43.1 percent are multi-family homes.
Age of Housing Stock: 2018
Source: U.S. Census American Community Survey, 2017; Nielsen Co.
61 percent of the housing stock was built before 1970.
39 percent of the housing stock was built after 1970.
14.9%
10.7%
20.7%
14.7%13.9%
11.7%
6.4% 5.7%
1.4%
0%
5%
10%
15%
20%
25%
Sh
are
of
Ho
mes

2019 Local Profiles Los Angeles County
Southern California Association of Governments
17
Foreclosures
Number of Foreclosures: 2018
There were 1,560 foreclosures in 2018.
Between 2007 and 2018, there were 166,848 foreclosures.
Source: CoreLogic/DataQuick, 2002-2018
Housing Cost Share
Percentage of Housing Cost for Renters and Homeowners: 2017
Housing costs accounted for an average of 37.2 percent of total household income for renters.
Housing costs accounted for an average of 25 percent of total household income for homeowners.
Source: U.S. Census American Community Survey, 2017
4,877
2,174
900 5872,002
12,472
35,254
29,830
26,854
25,438
14,967
6,432
4,5633,964
3,188
2,326
1,560
0
5,000
10,000
15,000
20,000
25,000
30,000
35,000
40,000
2002 2004 2006 2008 2010 2012 2014 2016 2018
Nu
mb
er
of
Fore
clo
sure
s
37.2%
25.0%
0%
5%
10%
15%
20%
25%
30%
35%
40%
Renters Homeowners

2019 Local Profiles Los Angeles County
Southern California Association of Governments
18
V. TRANSPORTATION
Journey to Work for Residents
Transportation Mode Choice: 2000, 2010, and 2018
Sources: 2000 & 2010 U.S. Decennial Census; American Community Survey, 2017; Nielsen Co.
Between 2000 and 2018, the greatest change occurred in the percentage of individuals who traveled to work by carpool; this share decreased by 6 percentage points.
‘Other’ refers to
bicycle, pedestrian, and home-based employment.
Average Travel Time (minutes): 2000, 2010, and 2018
Sources: 2000 & 2010 U.S. Decennial Census; American Community Survey, 2017; Nielsen Co.
Between 2000 and 2018, the average travel time to work increased by approximately 2 minutes.
73%
16%
7%5%
75%
12%8%
5%
74%
10%6%
10%
0%
10%
20%
30%
40%
50%
60%
70%
80%
Drive Alone Carpool Public Transit Other
Pe
rce
nt
of
Co
un
ty R
esi
de
nts
2000 2010 2018
2931 31
0
5
10
15
20
25
30
35
2000 2010 2018
Trav
el T
ime
(m
inu
tes)

2019 Local Profiles Los Angeles County
Southern California Association of Governments
19
Travel Time to Work (Range of Minutes): 2018
In 2018, 49.6 percent of Los Angeles County commuters spent more than 30 minutes to travel to work.
Travel time to work figures reflect average one-way commute travel times, not round trip.
Sources: U.S. Census American Community Survey, 2017; Nielsen Co.
Household Vehicle Ownership: 2018
43.5 percent of Los Angeles County households own one or no vehicles, while 56.5 percent of households own two or more vehicles.
Sources: U.S. Census American Community Survey, 2017; Nielsen Co.
18%
33%25%
11%
14%
<15 15-30 30-45 45-60 60+
9%
34%
35%
21%
None 1 Vehicle 2 Vehicles 3+ Vehicles

2019 Local Profiles Los Angeles County
Southern California Association of Governments
20
VI. ACTIVE TRANSPORTATION
Over the course of the next 25 years, population growth and demographic shifts will continue to transform the character of the SCAG region and the demands placed on it for livability, mobility, and overall quality of life. Our future will be shaped by our response to this growth and the demands it places on our systems.
SCAG is responding to these challenges by embracing sustainable mobility options, including support for enhanced active transportation infrastructure. Providing appropriate facilities to help make walking and biking more attractive and safe transportation options will serve our region through reduction of traffic congestion, decreasing greenhouse gas emissions, improving public health, and enhanced communities.
For the 2017 Local Profiles, SCAG began providing information on the active transportation resources being implemented throughout our region. The 2019 Local Profiles continues the active transportation element with a compilation of bicycle lane mileage by facility type at the county level. This data, provided by our County Transportation Commissions for the years 2012 and 2016, provides a baseline to measure regional progress in the development of active transportation resources over time.
The Local Profiles reports will seek to provide additional active transportation data resources as they become available at the local jurisdictional level. Information on rates of physical activity (walking) is available in the Public Health section of this report.
Bike Lane Mileage by Class: 2012-2016
County Class 1 Class 2 Class 3 Class 4 Total Lane Miles
2012 2016 2012 2016 2012 2016 2012 2016 2012 2016 Change
Imperial 3 3 4 4 82 82 0 0 89 89 0.0%
Los Angeles 302 343 659 1,054 519 609 2 7 1,482 2,013 35.8%
Orange 259 264 706 768 87 103 0 0 1,052 1,135 7.9%
Riverside 44 44 248 248 129 129 0 0 421 421 0.0%
San Bernardino 77 96 276 293 150 107 0 0 503 496 -1.4%
Ventura 61 76 257 333 54 77 0 0 372 486 30.6%
SCAG Region 746 826 2,150 2,700 1,021 1,107 2 7 3,919 4,640 18.4%
Source: County Transportation Commissions: 2012, 2016
Class 1 (Bike Path): Separated off-road path for the exclusive use of bicycles and pedestrians.
Class 2 (Bike Lane): Striped on-road lane for bike travel along a roadway.
Class 3 (Bike Route): Roadway dedicated for shared use by pedestrians, bicyclists, and motor vehicles.
Class 4 (Protected Bike Lane): Lane separated from motor vehicle traffic by more than striping (grade separation or barrier).

2019 Local Profiles Los Angeles County
Southern California Association of Governments
21
VII. EMPLOYMENT
Employment Centers
Top 10 Places Where Los Angeles County Residents Commute to Work: 2016
Local Jurisdiction Number of Commuters
Percent of Total Commuters
1. Los Angeles County 3,029,802 81.1 %
2. Orange County 297,558 8.0 %
3. San Bernardino County 97,921 2.6 %
4. San Diego County 55,238 1.5 %
5. Ventura County 53,285 1.4 %
6. Riverside County 52,339 1.4 %
7. San Francisco County 17,803 0.5 %
8. Kern County 16,391 0.4 %
9. Santa Clara County 13,719 0.4 %
10. Alameda County 11,312 0.3 %
All Other Destinations 91,136 2.4 %
Source: U.S. Census Bureau, 2017, LODES Data; Longitudinal-Employer Household Dynamics Program: https://lehd.ces.census.gov/data/lodes/
This table identifies the top 10 locations where residents from Los Angeles County commute to work.
81.1% work and live in Los Angeles County, while 18.9% commute to other places.
2019 Local Profiles Los Angeles County
Southern California Association of Governments
22
2019 Local Profiles Los Angeles County
Southern California Association of Governments
23

2019 Local Profiles Los Angeles County
Southern California Association of Governments
24
Total Jobs
Total Jobs: 2007 - 2017
Sources: California Employment Development Department, 2007 - 2017; InfoGroup; & SCAG
Total jobs include wage and salary jobs and jobs held by business owners and self-employed persons.
The total job count does not include unpaid volunteers or family workers, and private household workers.
In 2017, total jobs in Los Angeles County numbered 4,767,204, an increase of 6.5 percent from 2007.
Jobs by Sector
Jobs in Manufacturing: 2007 - 2017
Sources: California Employment Development Department, 2007 - 2017; InfoGroup; & SCAG
Manufacturing jobs include those employed in various sectors including food; apparel; metal; petroleum and coal; machinery; computer and electronic products; and transportation equipment.
Between 2007 and 2017, the number of manufacturing jobs in the County decreased by 14.4 percent.
0
1,000,000
2,000,000
3,000,000
4,000,000
5,000,000
6,000,000
2007 2008 2009 2010 2011 2012 2013 2014 2015 2016 2017
Nu
mb
er o
f Jo
bs
0
50,000
100,000
150,000
200,000
250,000
300,000
350,000
400,000
450,000
500,000
2007 2008 2009 2010 2011 2012 2013 2014 2015 2016 2017
Nu
mb
er o
f Jo
bs
2019 Local Profiles Los Angeles County
Southern California Association of Governments
25
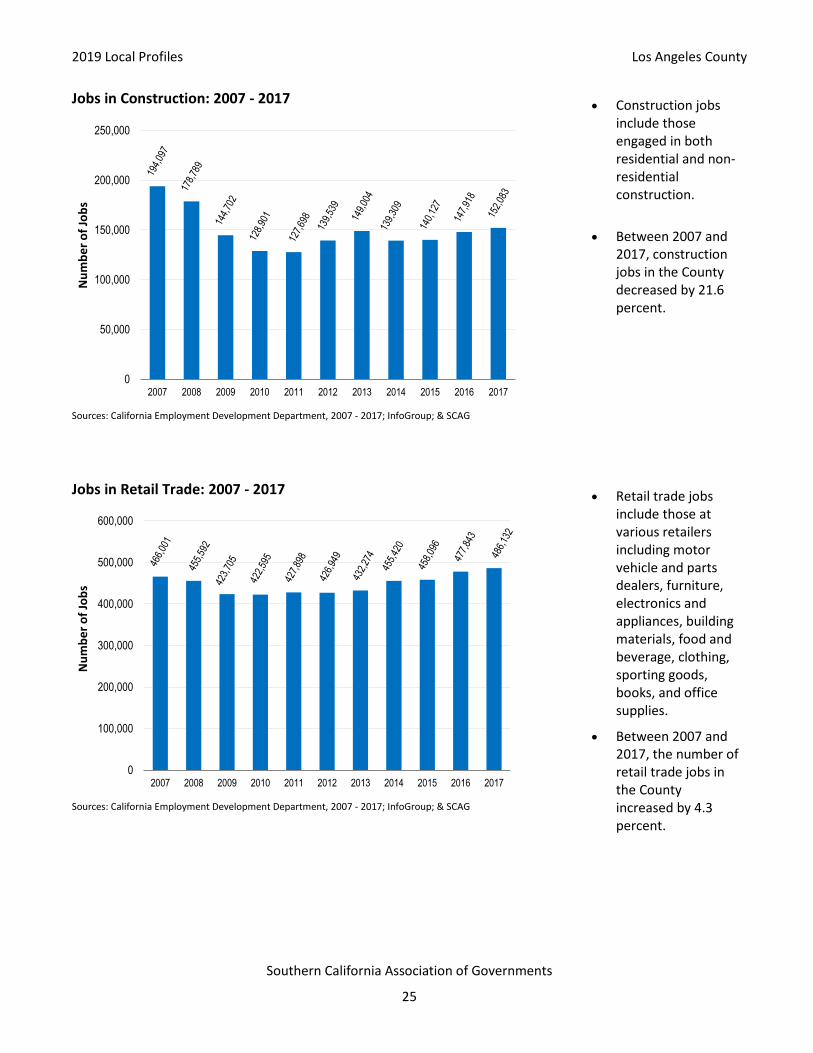
Jobs in Construction: 2007 - 2017
Sources: California Employment Development Department, 2007 - 2017; InfoGroup; & SCAG
Construction jobs include those engaged in both residential and non-residential construction.
Between 2007 and 2017, construction jobs in the County decreased by 21.6 percent.
Jobs in Retail Trade: 2007 - 2017
Sources: California Employment Development Department, 2007 - 2017; InfoGroup; & SCAG
Retail trade jobs include those at various retailers including motor vehicle and parts dealers, furniture, electronics and appliances, building materials, food and beverage, clothing, sporting goods, books, and office supplies.
Between 2007 and 2017, the number of retail trade jobs in the County increased by 4.3 percent.
0
50,000
100,000
150,000
200,000
250,000
2007 2008 2009 2010 2011 2012 2013 2014 2015 2016 2017
Nu
mb
er
of
Job
s
0
100,000
200,000
300,000
400,000
500,000
600,000
2007 2008 2009 2010 2011 2012 2013 2014 2015 2016 2017
Nu
mb
er
of
Job
s

2019 Local Profiles Los Angeles County
Southern California Association of Governments
26
Jobs in Professional and Management: 2007 - 2017
Sources: California Employment Development Department, 2007 - 2017; InfoGroup; & SCAG
Jobs in the professional and management sector include those employed in professional and technical services, management of companies, and administration and support.
Between 2007 and 2017, the number of professional and management jobs in the County increased by 1.2 percent.
0
100,000
200,000
300,000
400,000
500,000
600,000
700,000
800,000
2007 2008 2009 2010 2011 2012 2013 2014 2015 2016 2017
Nu
mb
er o
f Jo
bs

2019 Local Profiles Los Angeles County
Southern California Association of Governments
27
Jobs by Sector: 2007
Sources: California Employment Development Department, 2007; InfoGroup; & SCAG
From 2007 to 2017, the share of Education jobs increased from 20.5 percent to 24.6 percent.
See Methodology Section for industry sector definitions.
Jobs by Sector: 2017
Sources: California Employment Development Department, 2018; InfoGroup; & SCAG
In 2017, the Education sector was the largest job sector, accounting for 24.6 percent of total jobs in the County.
Other large sectors included Professional (15.3 percent), Leisure (10.8 percent), and Retail (10.2 percent).
Agriculture0.3%
Construction4.3%
Manufacturing10.2%
Wholesale5.3%
Retail10.3%
Transportation5.0%
Information4.9%
Finance6.0%
Professional15.9%
Education20.5%
Leisure9.6%
Other4.1%
Public3.5%
Agriculture0.2%
Construction3.2%
Manufacturing8.3%
Wholesale5.2%
Retail10.2%
Transportation4.7%
Information5.6%
Finance5.4%
Professional15.3%
Education24.6%
Leisure10.8%
Other3.6%
Public3.0%

2019 Local Profiles Los Angeles County
Southern California Association of Governments
28
Average Salaries
Average Annual Salary: 2003 - 2017
Source: California Employment Development Department, 2003 - 2017
Average salaries for jobs located in the County increased from $42,591 in 2003 to $66,037 in 2017, a 55 percent change.
Note: Dollars are not adjusted for annual inflation.
Average Annual Salary by Sector: 2017 ($ thousands)
Source: California Employment Development Department, 2017
In 2017, the employment sector providing the highest salary per job in the County was Information ($131,333).
The Retail sector provided the lowest annual salary per job ($36,359).
$42,591$45,880
$50,666 $51,493
$56,700
$66,037
$0
$10,000
$20,000
$30,000
$40,000
$50,000
$60,000
$70,000
2003 2009 2011 2013 2015 2017
Ave
rage
An
nu
al S
alar
y
$66
$66
$65
$73
$65
$36
$131
$109
$82
$52
$48
$90
$44
$0 $20 $40 $60 $80 $100 $120 $140
All
Agriculture
Construction
Manufacturing
Wholesale
Retail
Information
Finance-Insurance-Real Estate
Professional-Management
Education-Health
Leisure-Hospitality
Public Administration
Other Services

2019 Local Profiles Los Angeles County
Southern California Association of Governments
29
VIII. RETAIL SALES
Real Retail Sales
Real Retail Sales (in 2017 $ millions): 2001 -2017
Source: California Board of Equalization, 2001-2017
Real (inflation adjusted) retail sales in Los Angeles County was $111,879 million in 2017.
Real Retail Sales per Person (in 2017 $ thousands): 2001 - 2017
Source: California Board of Equalization, 2001-2017
Real retail sales per person for the County was $10.9 thousand in 2017.
$103
,388
$104
,408
$108
,385
$114
,246
$116
,679
$115
,892
$112
,828
$101
,853
$89,
676
$93,
942
$96,
337
$98,
929
$99,
113
$104
,314
$108
,147
$109
,997
$111
,879
$0
$20,000
$40,000
$60,000
$80,000
$100,000
$120,000
$140,000
2001 2003 2005 2007 2009 2011 2013 2015 2017
Sal
es (
$ m
illio
ns)
$10.8 $10.8$11.1
$11.6$11.9 $11.8
$11.5
$10.4
$9.1$9.6 $9.8
$10.0 $9.9
$10.4 $10.6 $10.7 $10.9
$0
$2
$4
$6
$8
$10
$12
$14
2001 2003 2005 2007 2009 2011 2013 2015 2017
Sal
es (
$ th
ou
san
ds)
Los Angeles County

2019 Local Profiles Los Angeles County
Southern California Association of Governments
30
IX. EDUCATION
Total Student Enrollment
K-12 Public School Student Enrollment: 2000 - 2018
Source: California Department of Education, 2000 - 2018
Between 2000 and 2018, total K-12 public school enrollment for schools within Los Angeles County decreased by 147,648 students, or about 9.1 percent.
Student Enrollment by Grade
K-6 Public School Student Enrollment: 2000 - 2018
Source: California Department of Education, 2000 - 2018
Between 2000 and 2018, total public elementary school enrollment decreased by 167,557 students or 17.5 percent.
0
200,000
400,000
600,000
800,000
1,000,000
1,200,000
1,400,000
1,600,000
1,800,000
2,000,000
2000 2002 2004 2006 2008 2010 2012 2014 2016 2018
Nu
mb
er
of
Stu
de
nts
955,813 974,158 953,656913,056
850,142 828,667 818,885 813,234 799,903 788,256
0
200,000
400,000
600,000
800,000
1,000,000
1,200,000
2000 2002 2004 2006 2008 2010 2012 2014 2016 2018
Nu
mb
er
of
Stu
de
nts
2019 Local Profiles Los Angeles County
Southern California Association of Governments
31
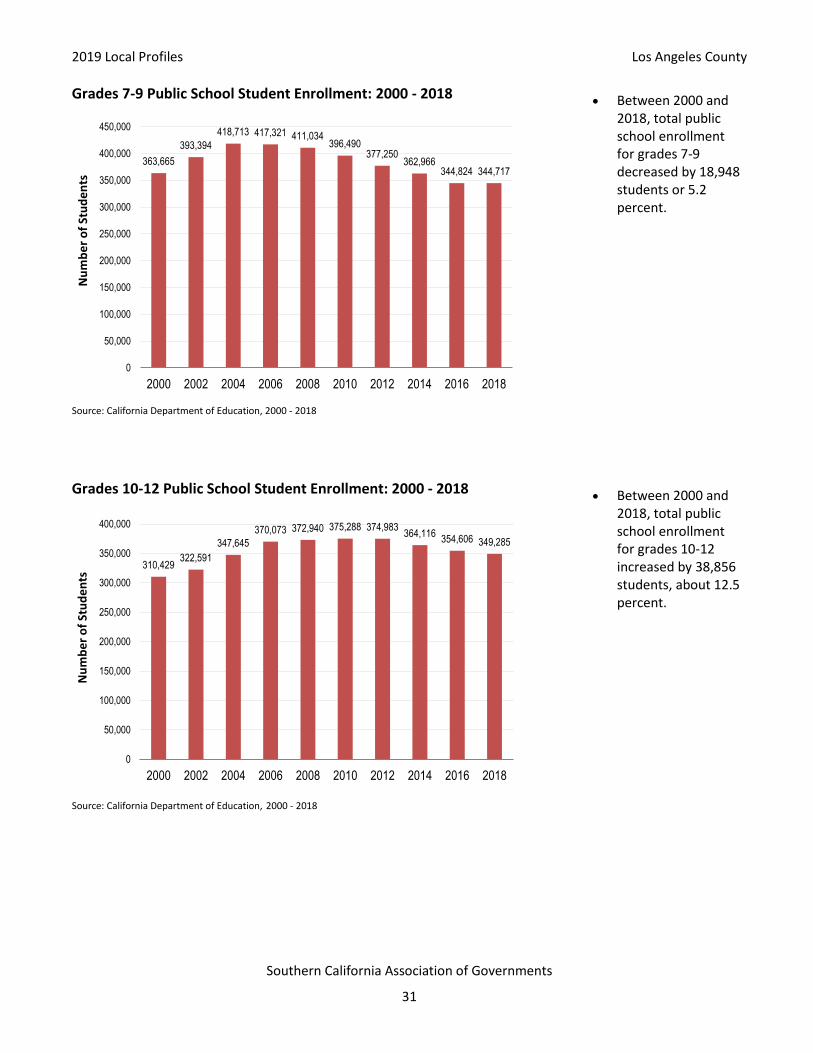
Grades 7-9 Public School Student Enrollment: 2000 - 2018
Source: California Department of Education, 2000 - 2018
Between 2000 and 2018, total public school enrollment for grades 7-9 decreased by 18,948 students or 5.2 percent.
Grades 10-12 Public School Student Enrollment: 2000 - 2018
Source: California Department of Education, 2000 - 2018
Between 2000 and 2018, total public school enrollment for grades 10-12 increased by 38,856 students, about 12.5 percent.
363,665
393,394
418,713 417,321 411,034396,490
377,250362,966
344,824 344,717
0
50,000
100,000
150,000
200,000
250,000
300,000
350,000
400,000
450,000
2000 2002 2004 2006 2008 2010 2012 2014 2016 2018
Nu
mb
er
of
Stu
de
nts
310,429322,591
347,645
370,073 372,940 375,288 374,983364,116
354,606 349,285
0
50,000
100,000
150,000
200,000
250,000
300,000
350,000
400,000
2000 2002 2004 2006 2008 2010 2012 2014 2016 2018
Nu
mb
er
of
Stu
de
nts

2019 Local Profiles Los Angeles County
Southern California Association of Governments
32
Percent of City Population Completing High School or Higher
Sources: 2000 & 2010 U.S. Decennial Census; American Community Survey, 2017; Nielsen Co.
In 2018, 78.2 percent of the population 25 years old and over completed high school or higher, which is higher than the 2000 level.
Percent of City Population Completing a Bachelor’s Degree or Higher
In 2018, 31.2 percent of the population 25 years old and over completed a Bachelor’s degree or higher, which is higher than the 2000 level.
Sources: 2000 & 2010 U.S. Decennial Census; American Community Survey, 2017; Nielsen Co.
69.2%
75.9% 78.2%
0%
10%
20%
30%
40%
50%
60%
70%
80%
90%
100%
2000 2010 2018
Pe
rce
nt
of
Po
pu
lati
on
24.9%
29.0%
31.2%
0%
5%
10%
15%
20%
25%
30%
35%
2000 2010 2018
Pe
rce
nt
of
Po
pu
lati
on

2019 Local Profiles Los Angeles County
Southern California Association of Governments
33
X. PUBLIC HEALTH
Many adverse public health outcomes related to obesity and poor air quality may be preventable through the implementation of a more sustainable and integrated program of community and transportation planning at the regional and local levels. Evidence has shown that built environment factors play an important role in supporting healthy behavior and reducing rates of chronic diseases and obesity. For example, improved active transportation infrastructure, better accessibility to recreational open space, and the development of more walkable communities enhance opportunities for physical exercise and thereby result in a reduction of obesity rates, along with the chronic diseases associated with physical inactivity.
Obesity/Physical Activity Rates (18 Years & Older)
Source: California Health Interview Survey, 2018
The obesity rate in Los Angeles County was 28.2 percent, which was higher than the County rate.
‘Obesity’ is defined as a Body Mass Index (BMI) of 30 or higher.
‘Physical Activity’ refers to walking a minimum of 150 minutes per week.
Chronic Disease Rate (18 Years & Older)
Source: California Health Interview Survey, 2018
The share of population in Los Angeles County who were ever diagnosed with asthma was 15.1 percent; for diabetes the rate was 12.1 percent; and for heart disease 6.6 percent.
28.2%
39.2%
27.5%
37.1%
0%
5%
10%
15%
20%
25%
30%
35%
40%
45%
Obesity Physical Activity
Shar
e o
f P
op
ula
tio
n
Los Angeles County SCAG Region
15.1%
12.1%
6.6%
14.7%
11.8%
7.0%
0%
2%
4%
6%
8%
10%
12%
14%
16%
Asthma Diabetes Heart Disease
Shar
e o
f P
op
ula
tio
n
Los Angeles County SCAG Region

2019 Local Profiles Los Angeles County
Southern California Association of Governments
34
XI. SCAG REGIONAL HIGHLIGHTS Regional Median Sales Price for Existing Homes: 2002 - 2018
Source: CoreLogic/DataQuick, 2002-2018
After peaking in 2007, the median sales price for existing homes in the SCAG region dropped by half by 2009.
By 2018, the median sales price had increased by more than 100 percent since 2009 to a new high of $561,000.
Median home sales price was calculated based on total existing home sales in the SCAG region.
Regional Retail Sales: 2005 - 2017
Source: California State Board of Equalization, 2005-2017
Retail sales tend to follow regional trends in personal income, employment rates, and consumer confidence.
Between 2005 and 2009, real (inflation adjusted) regional retail sales decreased by 25 percent.
Total retail sales in the SCAG region increased by about 33 percent between 2009 and 2017.
$2
79
,00
0
$3
30
,00
0
$4
10
,00
0
$4
91
,00
0
$5
31
,00
0
$5
52
,00
0
$3
87
,00
0 $2
76
,00
0
$2
91
,00
0
$2
80
,00
0
$2
98
,00
0
$3
72
,00
0
$4
26
,00
0
$4
37
,00
0
$4
66
,00
0
$5
27
,00
0
$5
61
,00
0
$0
$100,000
$200,000
$300,000
$400,000
$500,000
$600,000
2002 2004 2006 2008 2010 2012 2014 2016 2018
Me
dia
n S
ale
s P
rice
$2
17
,26
1
$2
16
,33
1
$2
08
,28
3
$1
84
,91
8
$1
62
,22
9
$1
70
,20
5
$1
79
,95
7
$1
88
,94
7
$1
91
,58
3
$2
01
,62
1
$2
07
,38
9
$2
11
,90
6
$2
16
,20
8
$0
$25,000
$50,000
$75,000
$100,000
$125,000
$150,000
$175,000
$200,000
$225,000
$250,000
2005 2007 2009 2011 2013 2015 2017
In $
Mill
ion
s (2
01
7)

2019 Local Profiles Los Angeles County
Southern California Association of Governments
35
XII. DATA SOURCES
California Department of Education
California Department of Finance, Demographic Research Unit
California Employment Development Department, Labor Market Information Division
California Health Interview Survey
California State Board of Equalization
Construction Industry Research Board
CoreLogic/DataQuick
InfoGroup
Nielsen Company
U.S. Census Bureau

2019 Local Profiles Los Angeles County
Southern California Association of Governments
36
XIII. METHODOLOGY
SCAG’s 2019 Local Profiles reports utilize the most current information available from a number of public resources, including the U.S. Census Bureau, California Department of Finance, and the California Department of Education. In cases where public information is not available, or is not the most recent, SCAG contracts with a number of private entities to obtain regional data. The following sections describe how each data source is compiled to produce the information provided in this report.
Statistical Summary Table
In the Statistical Summary Table (page 3), the values in the field ‘Jurisdiction Relative to County/Region’ represent the difference between the jurisdiction’s value and the county/region value, except for the following categories which represent the jurisdiction’s value as a share of the county (or in the case of an entire county as a share of the region): Population, Number of Households, Number of Housing Units, Number of Jobs, Total Jobs Change, and K-12 Student Enrollment.
Median Age, Homeownership Rate, and Median Household Income are based on data provided by the American Community Survey and the Nielsen Company. Number of Housing Units is based on the 2010 Census and estimates from the California Department of Finance. Data for all other categories are referenced throughout the report.
Population Section
Where referenced, data for 2000 through 2018 was obtained from the California Department of Finance E-5 estimates, which were published in May, 2018. This dataset is benchmarked to population data from the 2000 and 2010 U.S. Decennial Censuses. Data relating to population by age group and by race/ethnicity was derived from the 2000 and 2010 U.S. Decennial Censuses, the American Community Survey, and the Nielsen Company. The 2000 value is based on U.S. Decennial Census data for April 1, 2000 and the 2010 value is based on U.S. Decennial Census data for April 1, 2010.
Below are definitions for race and ethnicity, as provided by the U.S. Census Bureau.
The ‘Hispanic or Latino Origin’ category refers to:
Persons of Cuban, Mexican, Puerto Rican, South or Central American, or other Spanish culture or origin, regardless of race.
The ‘Race’ categories include:
American Indian or Alaska Native: Persons having origins in any of the original peoples of North and South America (including Central America), and who maintain tribal affiliation or community attachment.
Asian: Persons having origins in any of the original peoples of the Far East, Southeast Asia, or the Indian subcontinent including, for example, Cambodia, China, India, Japan, Korea, Malaysia, Pakistan, Philippines, Thailand, and Vietnam.
Black or African American: Persons having origins in any of the black racial groups of Africa, including those who consider themselves to be Haitian.

2019 Local Profiles Los Angeles County
Southern California Association of Governments
37
White: Persons having origins in any of the original peoples of Europe, North Africa, or the Middle East.
Some Other Race: This category includes Native Hawaiian or Other Pacific Islander (persons having origins in any of the original peoples of Hawaii, Guam, Samoa, or other Pacific Islands) and all other responses not included in the ‘American Indian or Alaska Native’, ‘Asian’, ‘Black or African American’, or ‘White’ racial categories described above.
Charts for population based on age were tabulated using data obtained from the 2000 and 2010 U.S. Decennial Census, the American Community Survey, and the Nielsen Company. Charts for race/ethnicity were tabulated using data from the 2000 and 2010 U.S. Decennial Census, the American Community Survey, and the Nielsen Company.
Households Section
Households refer to the number of occupied housing units. The 2000 figure is based on U.S. Decennial Census figures for April 1, 2000 and the 2010 figure is based on U.S. Decennial Census figures for April 1, 2010. Information for inter-census years was supplied by the U.S. Census American Community Survey. Average household size was calculated using information provided by the California Department of Finance. Households by Size calculations are based on data provided by the American Community Survey and the Nielsen Company.
Housing Section
Housing units are the total number of both vacant and occupied units. Housing units by housing type information was developed using data from the California Department of Finance. Age of housing stock data was provided by the U.S. Census American Community Survey and the Nielsen Company.
The number of residential units with permits issued was obtained using Construction Industry Research Board data, which are collected by counties and are self-reported by individual jurisdictions. It represents both new single family and new multi-family housing units that were permitted to be built, along with building permits that were issued for improvements to existing residential structures. Please note that SCAG opted to report the annual number of permits issued by each jurisdiction which may be different than the number of housing units completed or constructed annually. This was done using a single data source which provides consistent data for all jurisdictions. The Construction Industry Research Board defines ‘multi-family’ housing to include duplexes, apartments, and condominiums in structures of more than one living unit.
Median home sales price data was compiled from information obtained from CoreLogic/DataQuick, and was calculated based on total resales of existing homes in the jurisdiction, including both single family homes and condominiums. The median home sales price does not reflect the entire universe of housing in the jurisdiction, only those units that were sold within the specified calendar year.
Housing Cost Share refers to the percentage of household income devoted to housing expenses. Housing cost share data for homeowners and renters is provided by the American Community Survey.

2019 Local Profiles Los Angeles County
Southern California Association of Governments
38
Transportation Section
The journey to work data for the year 2000 was obtained by using the 2000 U.S. Decennial Census Summary File 3. Data for 2010 is based on the 2010 U.S. Decennial Census. Data for inter-census years was obtained through the U.S. Census American Community Survey and the Nielsen Company.
Active Transportation Section
Data sources for county bike lane mileage by facility classification was provided by the six County Transportation Commissions in the SCAG region.
Employment Section
Data sources for estimating jurisdiction employment and wage information include the 2010 U.S. Census Bureau Local Employment Dynamics Survey, and information from the California Employment Development Department, InfoGroup, and SCAG for years 2007-2015. In many instances, employment totals from individual businesses were geocoded and aggregated to the jurisdictional level.
Employment information by industry type is defined by the North American Industry Classification System (NAICS). Although the NAICS provides a great level of detail on industry definitions for all types of businesses in North America, for the purposes of this report, this list of industries has been summarized into the following major areas: agriculture, construction, manufacturing, wholesale, retail, information, finance/insurance/real estate, professional/management, education/health, leisure/ hospitality, public administration, other services, and non-classified industries.
A brief description of each major industry area is provided below:
Agriculture: Includes crop production, animal production and aquaculture, forestry and logging, fishing hunting and trapping, and support activities for agriculture and forestry.
Construction: Includes activities involving the construction of buildings, heavy and civil engineering construction, and specialty trade contractors.
Manufacturing: Includes the processing of raw material into products for trade, such as food manufacturing, apparel manufacturing, wood product manufacturing, petroleum and coal products manufacturing, chemical manufacturing, plastics and rubber products manufacturing, nonmetallic mineral product manufacturing and primary metal manufacturing.
Wholesale: Includes activities in the trade of raw materials and durable goods.
Retail: Includes activities engaged in the sale of durable goods directly to consumers.
Information: Includes activities that specialize in the distribution of content through a means of sources, including newspaper, internet, periodicals, books, software, motion pictures, sound recording, radio and television broadcasting, cable or subscription programming, telecommunications, data processing/hosting, and other information media.
Finance/Insurance/Real Estate: Includes businesses associated with banking, consumer lending, credit intermediation, securities brokerage, commodities exchanges, health/life/medical/title/ property/casualty insurance agencies and brokerages, and real estate rental/leasing/sales.

2019 Local Profiles Los Angeles County
Southern California Association of Governments
39
Professional/Management: Includes activities that specialize in professional/scientific/ technical services, management of companies and enterprises, and administrative and support services. Establishment types may include law offices, accounting services, architectural/engineering firms, specialized design services, computer systems design and related services, management consulting firms, scientific research and development services, advertising firms, office administrative services, and facilities support services.
Education/Health: Organizations include elementary and secondary schools, junior colleges, universities, professional schools, technical and trade schools, medical offices, dental offices, outpatient care centers, medical and diagnostic laboratories, hospitals, nursing and residential care facilities, social assistance services, emergency relief services, vocational rehabilitation services, and child day care services.
Leisure/Hospitality: Includes activities involved in the performing arts, spectator sports, museums, amusement/recreation, travel accommodations, and food and drink services.
Public Administration: Includes public sector organizations, such as legislative bodies, public finance institutions, executive and legislative offices, courts, police protection, parole offices, fire protection, correctional institutions, administration of governmental programs, space research and technology, and national security.
Other Services: Includes, for example, automotive repair and maintenance, personal and household goods repair and maintenance, personal laundry services, dry-cleaning and laundry services, religious services, social advocacy organizations, professional organizations, and private households.
Non-Classified: All other work activities that are not included in the North American Industry Classification System.
Retail Sales Section
Retail sales data is obtained from the California Board of Equalization, which does not publish individual point-of-sale data. All data is adjusted for inflation.
Education Section
Student enrollment data is based on public school campuses that are located within each jurisdiction’s respective boundary. Enrollment numbers by grade within a given jurisdiction are tabulated based upon data obtained from the California Department of Education. Enrollment year is based on the end date of the school year; for example, enrollment data for the year 2000 refers to the 1999-2000 school year. City boundaries used in the dataset for all years is based on data provided by the Local Agency Formation Commission for each county in the region.
Public Health Section
Data sources for city and county obesity rates (share of population with a BMI of 30 or higher) and rates of physical activity (share of population that walked a minimum of 150 minutes each day) was obtained through the California Health Interview Survey (AskCHIS: Neighborhood Edition). Chronic disease incidence rates were also obtained through the California Health Interview Survey.

2019 Local Profiles Los Angeles County
Southern California Association of Governments
40
Regional Highlights
Information for this section was developed through data from CoreLogic/DataQuick and the California Board of Equalization.
Data Sources Section
In choosing data sources for use in this report, the following factors were considered:
Availability for all jurisdictions in the SCAG region
The most recognized source on the subject
Data sources available within the public domain
Data available on an annual basis
The same data sources are used for all Local Profiles (except where noted) to maintain overall reporting consistency. Jurisdictions are not constrained from using other data sources for their planning activities. The preparation of this report has been financed in part through grants from the Federal Highway Administration and Federal Transit Administration, U.S. Department of Transportation, under the Metropolitan Planning Program, Section 104(f) of Title 23, U.S. Code. The contents of this report do not necessarily reflect the official views or policy of the U.S. Department of Transportation. Additional assistance was provided by the California Department of Transportation.

2019 Local Profiles Los Angeles County
Southern California Association of Governments
41
XIV. ACKNOWLEDGMENTS
SCAG Management
Kome Ajise, Executive Director Darin Chidsey, Chief Operating Officer Debbie Dillon, Deputy Executive Director, Administration Joann Africa, Chief Counsel/Director, Legal Services Basil Panas, Chief Financial Officer Julie Loats, Chief Information Officer Art Yoon, Director of Policy & Public Affairs Sarah Jepson, Acting Director of Planning
Department Manager
Ping Chang, Manager, Compliance & Performance Monitoring
Project Manager
Michael Gainor, Senior Regional Planner
Project Core Team
Anita Au, Associate Regional Planner Carolyn Camarena, SCAG Intern Diana Chamberlain, Senior Graphics Designer Jung Seo, Regional Planner Specialist Divya Sunkara, Senior Application Developer
Reproduction
Pat Camacho, Office Services Specialist
Assistance from the following SCAG staff members is also recognized:
Ludlow Brown, Senior Graphics Designer John Cho, Senior Regional Planner Lyle Janicek, Assistant Regional Planner Gurpreet Kaur, Programmer Analyst Rachel Krusenoski, SCAG Intern Cheol-Ho Lee, Senior Regional Planner Jeff Liu, Manager, Media & Public Affairs Matthew Louie, SCAG Intern Joshua Miyakawa, SCAG Intern Ariel Pepper, Assistant Regional Planner Tess Rey-Chaput, Clerk of the Board Arnold San Miguel, Public Affairs Officer IV Jianhong Sun, Database Administrator Tom Vo, Senior Regional Planner Brittany Webber, SCAG Receptionist Ying Zhou, Program Manager II
Southern California Association of Governments
42
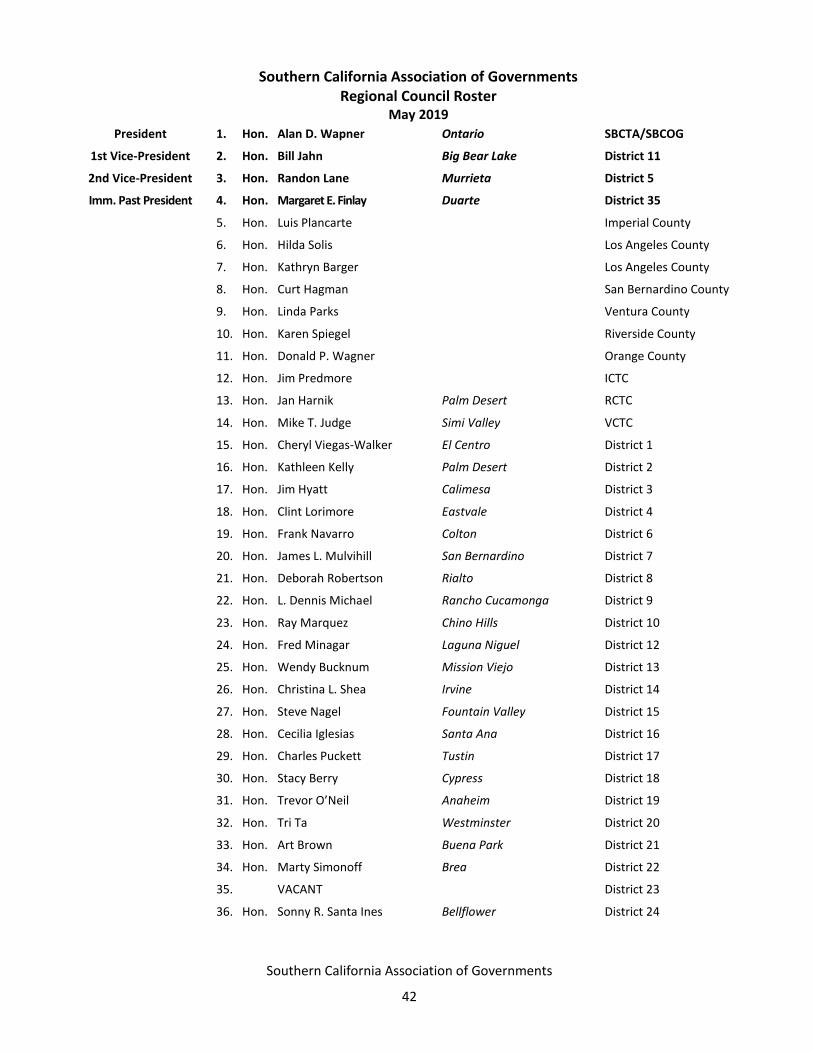
Southern California Association of Governments Regional Council Roster
May 2019
President 1. Hon. Alan D. Wapner Ontario SBCTA/SBCOG
1st Vice-President 2. Hon. Bill Jahn Big Bear Lake District 11
2nd Vice-President 3. Hon. Randon Lane Murrieta District 5
Imm. Past President 4. Hon. Margaret E. Finlay Duarte District 35
5. Hon. Luis Plancarte Imperial County
6. Hon. Hilda Solis Los Angeles County
7. Hon. Kathryn Barger Los Angeles County
8. Hon. Curt Hagman San Bernardino County
9. Hon. Linda Parks Ventura County
10. Hon. Karen Spiegel Riverside County
11. Hon. Donald P. Wagner Orange County
12. Hon. Jim Predmore ICTC
13. Hon. Jan Harnik Palm Desert RCTC
14. Hon. Mike T. Judge Simi Valley VCTC
15. Hon. Cheryl Viegas-Walker El Centro District 1
16. Hon. Kathleen Kelly Palm Desert District 2
17. Hon. Jim Hyatt Calimesa District 3
18. Hon. Clint Lorimore Eastvale District 4
19. Hon. Frank Navarro Colton District 6
20. Hon. James L. Mulvihill San Bernardino District 7
21. Hon. Deborah Robertson Rialto District 8
22. Hon. L. Dennis Michael Rancho Cucamonga District 9
23. Hon. Ray Marquez Chino Hills District 10
24. Hon. Fred Minagar Laguna Niguel District 12
25. Hon. Wendy Bucknum Mission Viejo District 13
26. Hon. Christina L. Shea Irvine District 14
27. Hon. Steve Nagel Fountain Valley District 15
28. Hon. Cecilia Iglesias Santa Ana District 16
29. Hon. Charles Puckett Tustin District 17
30. Hon. Stacy Berry Cypress District 18
31. Hon. Trevor O’Neil Anaheim District 19
32. Hon. Tri Ta Westminster District 20
33. Hon. Art Brown Buena Park District 21
34. Hon. Marty Simonoff Brea District 22
35. VACANT District 23
36. Hon. Sonny R. Santa Ines Bellflower District 24

Southern California Association of Governments
43
Southern California Association of Governments Regional Council Roster
May 2019
37. Hon. Sean Ashton Downey District 25
38. Hon. Emma Sharif Compton District 26
39. Hon. Ali Saleh Bell District 27
40. Hon. Dan Medina Gardena District 28
41. Hon. Rex Richardson Long Beach District 29
42. Hon. Lena Gonzalez Long Beach District 30
43. Hon. Steve De Ruse La Mirada District 31
44. Hon. Margaret Clark Rosemead District 32
45. Hon. Jorge Marquez Covina District 33
46. Hon. Teresa Real Sebastian Monterey Park District 34
47. Hon. Jonathan Curtis La Cañada/Flintridge District 36
48. Hon. Carol Herrera Diamond Bar District 37
49. Hon. Tim Sandoval Pomona District 38
50. Hon. James Gazeley Lomita District 39
51. Hon. Judy Mitchell Rolling Hills Estates District 40
52. Hon. Meghan Sahli-Wells Culver City District 41
53. Hon. Jess Talamantes Burbank District 42
54. Hon. Steven Hofbauer Palmdale District 43
55. Hon. David J. Shapiro Calabasas District 44
56. Hon. Carmen Ramirez Oxnard District 45
57. Hon. David Pollock Moorpark District 46
58. Hon. Tim Holmgren Fillmore District 47
59. Hon. Gilbert Cedillo Los Angeles District 48
60. Hon. Paul Krekorian Los Angeles District 49
61. Hon. Bob Blumenfield Los Angeles District 50
62. Hon. David Ryu Los Angeles District 51
63. Hon. Paul Koretz Los Angeles District 52
64. Hon. Nury Martinez Los Angeles District 53
65. Hon. Monica Rodriguez Los Angeles District 54
66. Hon. Marqueece Harris-Dawson Los Angeles District 55
67. Hon. Curren D. Price, Jr. Los Angeles District 56
68. Hon. Herb J. Wesson, Jr. Los Angeles District 57
69. Hon. Mike Bonin Los Angeles District 58
70. VACANT Los Angeles District 59
71. Hon. Mitch O’Farrell Los Angeles District 60
Southern California Association of Governments
44
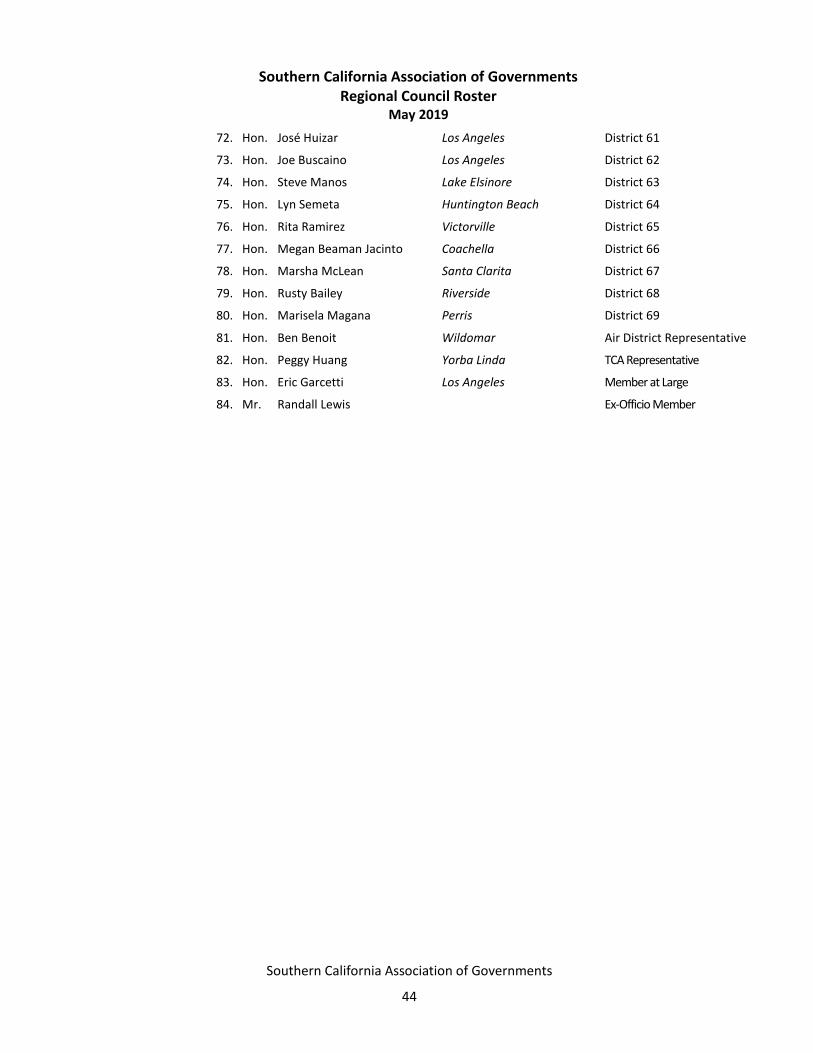
Southern California Association of Governments Regional Council Roster
May 2019
72. Hon. José Huizar Los Angeles District 61
73. Hon. Joe Buscaino Los Angeles District 62
74. Hon. Steve Manos Lake Elsinore District 63
75. Hon. Lyn Semeta Huntington Beach District 64
76. Hon. Rita Ramirez Victorville District 65
77. Hon. Megan Beaman Jacinto Coachella District 66
78. Hon. Marsha McLean Santa Clarita District 67
79. Hon. Rusty Bailey Riverside District 68
80. Hon. Marisela Magana Perris District 69
81. Hon. Ben Benoit Wildomar Air District Representative
82. Hon. Peggy Huang Yorba Linda TCA Representative
83. Hon. Eric Garcetti Los Angeles Member at Large
84. Mr. Randall Lewis Ex-Officio Member

Southern California Association of Governments
45
Notes:

SOUTHERN CALIFORNIA
ASSOCIATION OF GOVERNMENTS
900 Wilshire Boulevard, Suite 1700 Los Angeles, CA 90017
T: (213) 236-1800
www.scag.ca.gov
REGIONAL OFFICES
Imperial County
1503 North Imperial Avenue, Suite 104 El Centro, CA 92243
T: (760) 353-7800
Orange County
OCTA Building
600 South Main Street, Suite 1233 Orange, CA 92868
T: (714) 542-3687
Riverside County
3403 10th Street, Suite 805 Riverside, CA 92501
T: (951) 784-1513
San Bernardino County
Santa Fe Depot
1170 West 3rd Street, Suite 140
San Bernardino, CA 92418
T: (909) 806-3556
Ventura County
4001 Mission Oaks Drive, Suite L
Camarillo, CA 93012
T: (805) 642-2800