Embed Size (px)
Citation preview
REFERENCES AND NOTES
1 W Dansgaard etal. , Nature 364, 21 8 (1 993) Green- land Ice-core Project Members, Nature 364 203 (1993); P. M Grootes, M Stuiver, J. W. C White. S. Johnsen, J. Jouzel, ibid. 366, 552 (1993): M. Stuiver, P M . Grootes, T. F. Braziunas, Quaternary Res. 44, 341 (1995)
2 R. B. Alley et ai . Nature 362, 527 (1 993). 3. E. J. Brook, T. Sowers, J Orchardo, Science 273, 1087
(1996); J . Chappelaz et a/., Nature 366, 443 (1993); P. A Maye\n!sk et ai., Science 261, 195 (1 993).
4. G. Bond et ai., Nature 365, 143 (1993), S. J Leh- mann and L. D Keg\n!in, ibid. 356, 757 (1992) K. A. Hughen, J. T. Overpeck L. C. Peterson, S. Trum- bore, ibid. 380, 51 (1996), R. J. Behl and J P Ken- nett, ibid. 379, 243 (1996).
5. L D. Kegwn and G. A. Jones, J. Geophys. Res 99, 12397 (19941, W. B. Curry and D. W. Oppo, Paie- oceanography 12, 1 (1 997).
6. A. E Bainbridge GEOSECSAtlantic Ocean Ex,oedi- tion, Voi, 2, Sections and Profiies (Government Print- ing Office, Washington DC, 1980).
7 E A Boyle and L. D. Keigwln Science 218, 784 (1 982); D Oppo and R G. Fairbanks Earth Pianet Sci. Lett 86, 1 (1 987). Paleoceanography 5, 277 (1 990)
8 E. A Boyle and L D Keigwin Nature 330 35 (1 987). 9. J. C. Duplessy et a/. Paleoceanography 3 343
(1 988) 10. M Sarnthein et ai., ibid. 9, 209 (1 994) 11 D. W. Oppo and S. J. Lehman Science 259, 1148
(1 993). 12. J E. Smith. M J Risk, H P. Schwarcz T. A. McCon-
naughey Nature 386 81 8 (1 997) 13. H. Cheng J. F. Adkins R L. Edwards E A Boyle,
unpublished data 14. S. D Cairns and G D Stanley Jr Proc Fouith int.
Coral Reef Symp. Maniia I , 61 1 ( I 981) 15. Aqe screeninq was done by measuring '"Th, 232Th
and L38U by kotoue dut ion in cleaned samples on an nductivel;/ coupled plasma-mass spectrometer at the Massachusetts Institute of Technology.
16 R L Ed\n!ards et a/. , Science 260, 962 (1 993). 17. Samples were cleaned of exterior organic carbon
and coatings of manganeseliron oxides with suc- cessve leaches in a 50.50 mixture of 309' peroxide and 1 M NaOH A f n a short leach in a50:50 mixture of perox~de and 14' perchloric acid was used to remove all remaining organic stains. These preclean- ing steps removed 15 to 25% of the origna coral weight Immediately before final dissolution and graphitization corals were soaked in 10% HCI to remove an addltlonal 7 to 30% of aragonite This procedure overcomes contamnation problems from modern carbon that result from storage and handing and organic carbon from polyp and crust materal Samples were carefully chosen to avoid secondary calc~f~cat~on from endoithc activity
18 The i4C~12C ratio is expressed with the b notation where b14C IS the per m i deviation from the 14C!"C ratlo in 19th-centuly wood [M Stulver and H A. Poach Radiocarbon 19 355 (1 977)]
19. J. F. Adkns and E A. Boyle, Paieoceanography 12 337 (1 997)
20. E Bard etal. Earth Pianet. Sci. Leti. 126 275 (1 994); W. E. N Austin, E. Bard J B. Hunt D. Kroon, J. D Peacock Radiocarbon 37, 53 (1995); K. Gronvod et a/. Earth Planet. Sc i Lett 135. 149 (1995) H H. Brks S Guliksen, H. Hafldason, J Mangerud. G Possnert. Quaternay Res 45 1 19 (1 996).
21 E. Bard M. Arnold. R. Fairbanks B Hamein, Radio- carbon 35, 191 (1 993).
22. W S. Broecker G. Bond, M. Klas, G. Bonanl, W. Wolfl~, Paieoceanography 5, 469 (1 990). G E. Birch- fleld and W. S. Broecker, ibid. 5, 835 (1990).
23 M Stuiver and H G. Ostlund, Radiocarbon 22, 1 (1980); W S. Broecker, R. Gerard, M. Ewng, B. C. Heezen, J. Geophys. Res. 65, 2903 (1960).
24. We measured the spatial variation in Cd/Ca ratos from within a single modern D. cristagalli to check for vital effects. These b~ologically induced nonther- modynamc deviatons from equibrium for a par- ticular tracer have been found to dominate the sta- ble carbon and oxygen isotope signatures of deep-
sea corals (12) A coral from 550 m n the South Pacific Ocean had an average CdlCa value of 0.172 pmol!mol w ~ t h 1 SD of 0.016 pmol!mol. There was no within-coral spatial pattern to this variaton Although D cristagalli lnay contan vital effects for CdlCa this 10% SD IS smaller than the slgnal in JFA 24.8 and does not have the top-to- bottom coherence we f n d in the 15 4-ka sample For these reasons we believe sample JFA 24.8 has fa~thfully captured a change in the [Cd] of the past water masses.
25 The carbon isotopic ratlo IS deflned as follows 8'" = [('%/"C) ,,,, el('3C/'LC) ,,,,,,,, - I ] X 1000 relat~ve to the f%e Dee ~e lkmnl te standard [see H. Craig, Geochim. Cosmochim Acta 3 53 (1 95311.
26. The coral Cd distribution coeffcient 1s the rato of CdlCa In the coral to Cd!Ca n the water S m a r to a core top calbraton in foraminifera, we measured Cd!Ca ratos In a sute of modern D, cristagalli that span a range of 0.5 to 3 2 p M [PO,]. Six of these coral fall on a n e ~ 4 t h a slope of 1.6 coral per water Cd!Ca ratio This value mpies a [PO,] of 3.6 p M for the top of sample JFA24 8. However, there are three other samples from this calibration that have signif- canty higher Cd!Ca ratios in the coral than was pre- dcted by the water [Cd]. On the basis of t hs study, we believe the d s t r b ~ ~ t i o n coezicient for D. cristagalli is 1.6 or higher and that the 3 6 p M [PO,] estimate for JFA 24 8 is a maximum value.
27. W S Broecker, S Banton M. Smethe Jr., G Ost- und. Giobal Bioaeochem. Cvcles 5 87 (1991).
28 H K~tagawa a& J van der Pl~cht Science 279 11 87 11 998) - $ - - - ,
29 S J Lehmann and L. D Keigwln, Nature 356, 757 (1 992).
30 S Lehman, personal communicat~on. 31 L. D Kelgwln, G A Jones S. J. Lehman, E. A.
Boyle J Geophys Res. 96, 1681 1 (1 991) 32. AMS radocarbon dates were measured by standard
procedures at the Lawrence L~vermore National Laboratory Center for Accelerator Mass Spectrom- etry (CAMS) Vent~lation ages were calculated w ~ t h the 14C projecton age method described in (19). In three of the corals there is a slight elevation n in ta l 6234U, indicating a small degree of exchange w~ th a hgh 6'"U resewoir. From the obsewaton that there IS no significant correlation between '"Th age and 6'"U in different fragments of the same coral ( Is ) , we infer that the effect of this exchange on '"OTh age IS small.
33. We thank S Griffln, C. Masielo, and B Grant for laboratory assstance. Discussons with D. Sigman, W S. Broecker, and A. L van Geen helped Improve the manuscript Supported by the National Science Foundation. J F.A was supported by a NASA Global Change felowshp and a grant from Tokyo Eectrc and Power Company.
18 November 1998; accepted 18 March 1998
Local Orbital Forcing of Antarctic Climate Change During the Last Interglacial
Seong-Joong Kim,* Thomas J. Crowley, Achim Stossel
During the last interglacial, Antarctic climate changed before that of the Northern Hemi- sphere. Large local changes in precession forcing could have produced this pattern if there were a rectified response in sea ice cover. Results from a coupled sea ice-ocean general circulation model supported this hypothesis when it was tested forthree intervals around the last interglacial. Such a mechanism may play an important role in contributing to phase offsets between Northern and Southern Hemisphere climate change for other time intervals.
O n e of the perplexing problems in Pleisto- cene cliinatology involves the factors re- sponsible for Antarctic climate change. Al- though orbital insolation variations play a major role in driving Pleistocene cliinate change ( 1 ), the precessional component of orbital forcing is almost out of phase be- tween the Northern Hemisphere (NH) and Southern Hemisphere (SH), so any condi- tions favorable for glaciation and deglacia- tion in the NH should result in the o~oosite response in the SH. For more than 20 years it has been known that although SH cool- ing in the Pleistocene accornpallied NH glaciation, SH climate led NH cl~mate into and out of the last (and other) interglacials. That is, the SH warmed and cooled before the NH ( I ). Carbon dioxide also increased before NH glacial retreat (2 ) . Yet standard
Department of Oceanography Texas A&M University, College Station. TX 77843, USA.
-To whom correspondence should be addressed. E-mall: [email protected]
explanations for SH climate change rarely ~OCLIS on local forcing changes around Ant- arctica. hlost explanations ~nvolve more re- inote processes such as changes in atmo- spheric carbon dioxide concentratlon ( 3 ) , variations in North Atlantic Deep Water (NADW) heat transport to the Antarctic (4), or lowering of sea level causing expan- sion of the Antarct~c ice sheet. There IS,
howje\rer, a modest (-1°C) contribution from mean annual changes in the local radiation budget at the highest latitudes as a result of synchronous NH-SH obliquity changes at the 41,000-year period (5).
Here, we show that local forc~ng at the precessional period (19,000 and 23,000 years), which is out of phase between the NH and SH, may also be important in SH climate change. We based our study on the hypothesis that seasonal changes in the Ant- arctic summer may be proportionately more important than in the Antarctic winter be- cause sea ice is much closer to the freezing point in summer. This relation may allow a
728 SCIENCE VOL. 280 1 M.4Y 1998 ww~?~.sciencernas.org
rectified response to orbital insolatio~l l~ari- ations and may account for some of the phase offsets in climate change between the NH and SH. W e tested our nlodel with a coupleLl sea ice-ocean general circulation model (OGCXI).
W e used the Hamburg Ocean Primitive Equation (HOPE) model (6) , \i.hich is based o n the primitive equations with a prognostic free surface (7). T h e equations are dis- cretized o n the bas~s of the Arakawa-E grid (8), and the model has horizontal resolution of an effecti1.e 3.5" by 3.i0, with 11 vertical lavers. T h e model includes a comnrehensive dynamic-thermodynamic sea ice model (9) . T h e ocean is forced by clilnatological monthly meall winds (1L1), except for the Southern Ocean sea ice, which is forced by daily winds from the European Center for hledium-Range 'Weather Forecast analyses. T h e treatment of surface temverature anLl salinity is depenilent o n the presence of sea Ice. In ice-free grid cells, sea surface temper-
8 / . (
4 o d d V O O ; 1 8 ? ,
ature anil salinity are relaxed to prescribed air temperature (1 1 ) and salinity (12).
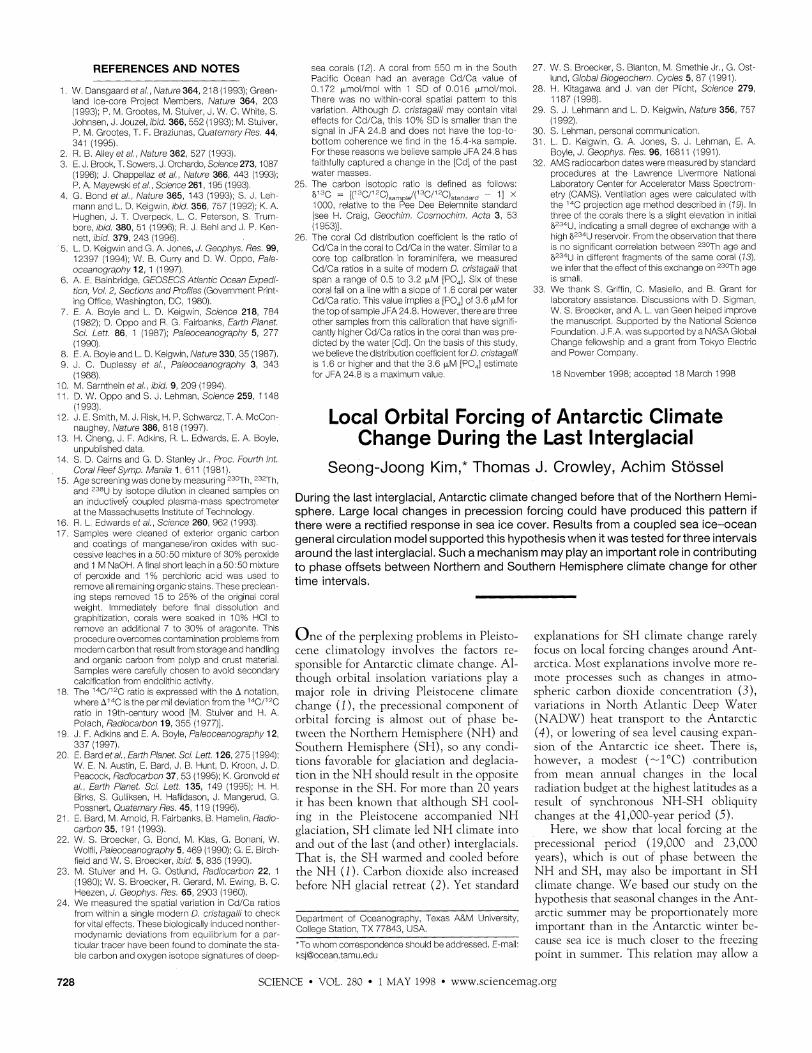
T o obtain the surface temperature re- sponse to the orbital insolation change dur- ing the Pleistocene, we used a linear version of an energy balance nod el (EBM) (13). This is a two-dimensional tnodel that re- solves the temperature response to seasonal insolatioll forcing as it is lllodified by geog- raphy. Although the EBM is a simplified model. numerous sensitivity experiments (14) indicate that its response to orbital insolation changes is approsinlately the same as that of atmospheric general circula- tion models. W e chose three time periods (Fig. I ) : 106 ka (thousand years ago) and 125 ka, at ~vhich local summer insolations are at minima (15), and 135 ka, at which surnlner insolation is at a maximum. These time intervals were chosen because at the beginn~ng of the last ~nterglacial (130 to 135 ka), CO, and temperature increased before N H ice sheet rnelt~ng ( 2 . 16), and tempera- ture then decreased before N H Ice growth (1). T h e mid- to high latitudes of the S H
cooled altnost as much as a t the glacial max- imum at 106 ka. Earlier linear EBbI calcula- tions (Fig. 1 ) suggested that local orbital forcing could play an important role in phase shifts and seasonal coolille for these time periods, but some feedback would be re- qu~red to translate the forcing into mean annual temperature changes, such as are es- timated for the Vostok site (1 7).
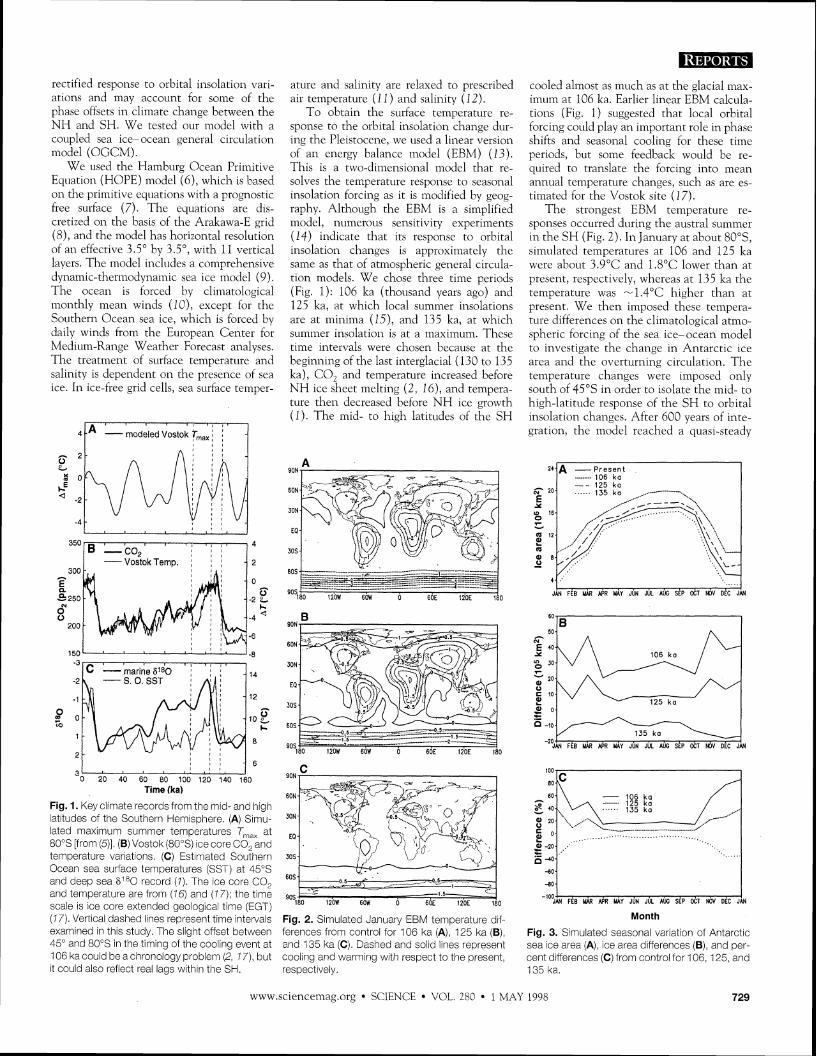
T h e strongest EBM temperature re- sponses occurred 'luring the austral summer in the S H (Fig. 2). In January at about 8C0S, simulated temperatures a t 106 and 125 ka were about 3.9"C and 1.8"C lower than at present, respectively, whereas a t 135 ka the temperature was -1.4OC higher than a t uresent. L ie then itnuosed these temoera- ture differences o n the climatological atmo- spheric forcing of the sea ice-ocean model to investigate the change In Antarctic Ice area and the overturning c ~ r c u l a t ~ o n . T h e temperature changes were ~nlposed only south o f 4 j 0 S III order to sola ate the mid- to high-latitude response of the S H to orbital insolation changes. After 600 years of inte- gration, the model reached a quasi-steady
8 8 , 3 A 2b 4b 6b 80 i bo 120 ,ko iAo Time (ka)
Fig. 1. Key climate recordsfrom the mid- and high iat~tudes of the Southern Hemisphere. (A) Simu- lated maxlmum summer temperatures T,,, at 80% [from (5)]. (B) Vostok (80%) ice core CO, and temperature var~at~ons. (C) Estimated Southern Ocean sea surface temperatures (SST) at 45"s and deep sea 6 ' a 0 record (7). The ice core CO, and temperature are from (76) and ( 7 7): the time scaie is ice core extended geologicai time (EGT) ( I 7). Veriica dashed lines represent time inter~als examined in this study. The slight offset between 45' and 80's in the timing of the cooiing event at 106 ka could be a chronology problem (2, 7 7). but t could also reflect real lags wthn the SH.
90N B
CON
30N
EQ
30s
605
90s 0
Fig. 2. Simulated January EEL4 temperature df- ferences from control for 106 ka (A). 125 ka (B), and 135 ka (C). Dashed and sol~d lines represent cooling and warming with respect to the present, respective)!.
nmn.iclencemag.org SCIENCE VOL 28L1 1 X1.4'1' 1998 729
4 0
-80
-100 . . . JM FEE LUR @R I&Y J ~ J N JLR AN SEP KT MV DEC JM
Month
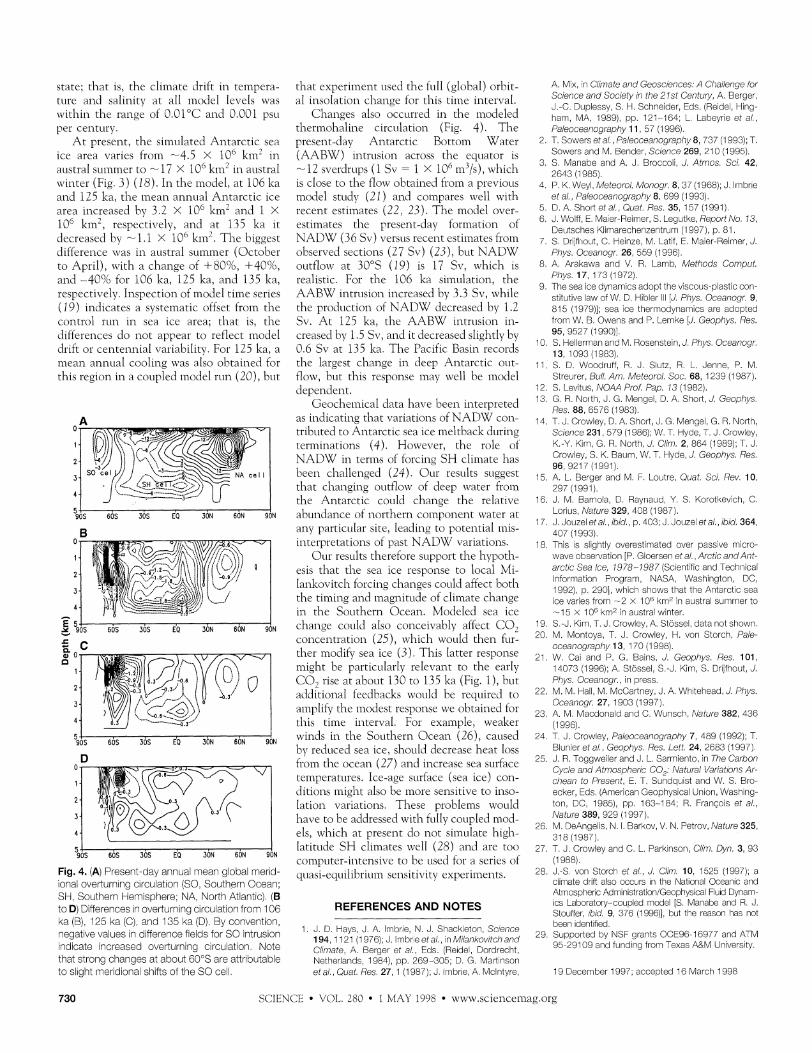
Fig. 3. Simulated seasonal variation of Antarctic sea ice area (A), ice area dfferences (B), and per- cent d~fferences (C) from control for 106, 125, and 135 ka.
state: that is, the clilnate drift in tempera- ture and salinity at all nod el levels n7as ivithin the range of 2.01°C and 0.021 psu per century.
A t present, the simulated Antarctic sea ice area varies from -4.5 X 12" km' in austral sulnmer to - 17 x lo6 kin2 In austral nlnter (Fig. 3 ) (1 8). In the model, at 106 ka and 125 ka, the mean annual Antarctic ice area increased by 3.2 X 10" km: and 1 X 1L7"nm2, respectir-ely, and a t 135 ka it decreased by -1.1 x 12"nm2. T h e biggest difference was in austral summer (October to April) , with a change of +S2(?b, +40(?6, and -40% for 126 ka, 125 ka, and 135 lia, respecti~ely. Inspection of model time series (1 9 ) ~ndicates a systematic offset from the control run in sea ice area; that is, the differences do not appear to reflect model drift or centennial var~abillty. For 125 ka, a mean a n i l ~ ~ a l cooling \vas also obtained for this region in a coupled rnodel run (2C), but
Fig. 4. (A) Present-day annual mean global merid- ional overturnng c~rculat~on (SO, Southern Ocean; SH, Southern Hemsphere. NA, North Atlantc) (B to Dl Differences In o\ieriurning c~rculat~on froln 106 ka (B). 125 ka (C), and 135 ka (Dl. By con\iention, negative values in difference fields for SO intrusion Indicate increased overturning c~rculat~on Note that strong changes at about 60"s are attrbutabe
that experiment used the full (global) orhit- a1 insolation chailoe for this time ~nterval.
'3
Changes also occurred in the modeleil thermohaline c i r c ~ ~ l a t ~ o n (Fig. 4) . T h e present-day Antarctic Bottom Water (AABK') intrusion across the equator is - 12 s\.erdrups ( 1 Sv = 1 X 1 25n3/s), n.hich is close to the tlon- obtained fl.om a prevlous model study (21 ) and cornpares \\ell with recent estimates (22. 23). T h e model over- estiinates the present-day formation of N A D W (36 Sv) versus recent esti~nates from obser\~ed sections (27 Sv) ( 2 3 ) , hut N A D W outflow at 32"s (19) is 17 Sv? which is realistic. For the 106 ka simulation, the AABW intrusion increased by 3.3 Sv, while the production of NADK' decreased hy 1.2 Sv. A t 125 ka, the AABW intrusion in- creased hy 1.5 Sv, and it decreased sl~ghtly by 0.6 Sv at 135 ka. T h e Pacific Basin records the largest cha~lge in deep Antarctic out- t lo~v, but this response may \yell he lnodel dependent.
Geochelll~cal data have been interpreteil as indicating that var~ations of NADLV con- tributed to Antarctic sea ice meltback during terrninatiorls (4) . Howel~er, the role of K A D W in terms of forcing SH cli~nate has been challenged (24) . Our results suggest that challgi~lg outtloiv of deep r a t e r fro111 the Antarctic could change the relative abundance of northern component water at any particular site, leading to potential mis- interpretations of nast NADK' variations.
Our results therefore support the hypoth- esis that the sea ice response to local Mi- lankovitch forcillg changes could affect both the timing and magn i t~de of cli~nate chailge in the Southern Ocean. b\/loileleil sea ice change could also conceivahly affect C02 concentration 125). ~vh ich n.ould then fur- , ,
ther moilifv sea ice (3). This latter response might he particularly relevant to the early CO, rise at about 130 to 135 ka (Fig. I ) , but additional feedbacks n.oulil be required to amplify the modest response we ohtaineil for this time interval. For example, Iveaker n-inds in the Southern Ocean 126), caused by reduced sea ice, s h o ~ ~ l d decrease heat loss from the ocean (27) and increase sea surface temperatures. Ice-age surface (sea ice) con- ditions might also he Inore sensitive to inso- lation variations. There problems \vould have to he aildressed with f~llly coupled mod- els, vr-hich at present do not simulate high- latitude SH cllmates n-ell (28) and are too computer-intetlsive to be ~lsed for a series of q~lasi-equilibrium sensiti~ity experiments.
REFERENCES AND NOTES
J. D Pays. J A, mbr~e , N. J Shac*leton Scieqce 194, 1 1 21 (1 976). J, lmbre eta/. , In i~,71/a~kovirch and Cli,mate. A. Berger et a / . , Eds. ;Reide8, Dordrecbt, Netieriands, 198L1. pp. 269-305: D G. Mart~nson
A, ivl~x, In Climate and Geosciences: P Challelige for Srience and Soriety 111 the 27st Centan', A Berger, J.-C, Dupessy, S H. Schneider, Eds. (Reidel, Hng- ham. MA. 1989) pp. 121-16a; L Labeyr~e et a l . Paleoceaiiography 11, 57 (1 996)
2 T. Sowers et a/. , Pa!eoceaiiograp/~y 8, 737 (1 993); T. Sovlers and hil. Bender, Soence 269. 210 (1995)
3 S Manabe and A, J Broccol~, J. Atmos Sri . 42, 2643 (1 985).
a P K Weyl, Pdeteorol, ivfo~~ogr 8, 37 (1968); J, m b r e eta/. , Pa!eoceanogiaphv 8. 699 :I9933
5. C A. Shori et a1 , Cuat. Res. 35, 157 (1 991). 6 J. iVoff, E. Maer-Remer, S Lecutke. Repoi t i f !~ . 73.
Ceutsches Ki~marechenzentrum :I 997) p 81. 7, S. Drijfi~out, C, Henze, Id Latif E Maier-Reimer J.
Phys. Oceaiiogr 26, 559 (1 996). 8. A Arakawa and V. R. Lamb, ivfethook Comput.
PIivs 17 173 (1972). 9. The sea Ice dynamcs adopt the vscous-pastc con-
stitutive law of iV. D Hiber I [J. Phys. Oreanogr. 9, 815 (1979)], sea ce thermodynamics are adopted f r o ~ r VV B, Owens and P. Lemke rJ. Geophys. Res. 95, 9527 ( I 993);
' 3 S. Helerman and M. Rosensten. J Phys Oceanogr 13. 1093 (1 983)
1 1 S. D, Woodruff. R. J Slutz. R L Jenne. P. ivl. Streurer, Bu!!. Am. ivlereoro!. Soc. 68. 1239 (1987).
12. S Lev~tus. )"\OM Prof Pap, 13 (1 982). 13, G. R. North, J. G. Menael. 3. A Shod, J. Geophys
Res. 88, 6576 (1 983). I d . T. J Crowey, D A. Shori. J G. Mengel, G R. North.
Srieiice 231, 579 (1 986): L?'. T Hyde, 7. J. Ct'owey. K.-Y. Kim. G. R. North J. Clim. 2 S64 (1989). T. J. Crowey, S. X. Baum, VV. T. Hyde J. Geophys. Res. 96, 921 7 (1991).
15. A. L Berger and M. F. Loutre Quat. So. Rev. 10, 297 (1 991).
16. J. M 3arnola, C. Raynaud, Y S. Korotkev'ch, C. Lorus Nat~ire 329, 408 (1 987;.
17 J Jouze ei a/. , ib id. p, a33, J. Jouze era!. , ibid. 364 a07 ( I 993).
18. Ths s s c h t y overestmated over Gassve mcro- wave obsewation [P. Goersen eta!. . Arctic and Ant- arctic Sea Ice 7978-7987 (Scentfic and Techtical lnformat~on Program, NASA, iVash~ngton CC: 1992) p 2901, which shows tllat the Antarctc sea Ice vares from -2 x 1 3 kmi in austral summer to -1 5 x 1 OF h2 in austral w~nter.
19 S -J. Xm, T. J. Crov~ley. A. Stossel. data not sbown. 23. M. Montoya, T. J. Crowley, H, von Storch. Pale-
oceanography 13, 170 il998i. 21 W/. Cai and P. G. Ba~ns, J. Geophysvs. Res. 101.
1 a373 (1 996): A. Stossel, S -J. Kim. S. Cr~fClout. J. PI-iys. Oceanogr., in press.
22. M. M. H a , M. McCartney, J. A. Wbtehead, J. Phys. Oceanogr. 27, 1903 (1 997).
23, A. M. Macdonad and C. W/l~nsch, ,AIa!iire 382, a36 (1 996).
2a T. J. Crowey, Paleoceanography 7. a89 (1992); T. Buner et a!. , Geophys. Res. Lett. 24. 2683 (1 997).
25. J. R. Toggweiler and J. L Sarmiento, in The Carbon Cyc!e aiio' Atmospheric CO,: Natural L/ariatioiis Ar- chean to Present, E T, Sundyuist and W/. S. Bro- ecker, Eds, (Amercan GeopClysica Lnon . Wasbng- ton. DC, 1985). pp. 163-1 8a; R Fran~ois et a! . Nature 389. 929 (1 997).
26. M. DeAngeis N. I. Barkov. \I. N. Petrov, Nature 325, 318 (1987)
27. T J. Crowiey and C L Parknson, Clim. Dyn. 3, 93 (' 988).
28 J -S von Storch er a / . J Cim. 10, 1525 11997;, a climate drift also occurs in :be National Oceanc and Atmospheric Administrat'on:Geophysical Fluid Dynam- ics Laboratorj-coupled model [S Manabe and R J. S:ouffer ib~d 9, 376 il996iI but the reason has not been identified.
29 Suppofied by NSF grants OCE96-16977 and ATM 95-291 39 and fundng f r o t ~ Texas A&M Unversty.
to sght lneridiona shfis of the SO cell. era:. . Qua: Res. 27, 1 ;1 987;. J mbre , A. Mcntyre 19 December 1997; accepted 16 March 1998
730 SCIENCE VOL. :dL? 1 LI.%Y 139s x\vw.sciencemag.org