Embed Size (px)
Citation preview

1
LOCAL INCOMES AND POVERTY IN SCOTLAND
Developing Local and Small Area Estimates and Exploring Patterns of Income Distribution, Poverty
and Deprivation
Report of Research for the Improvement Service on behalf of four Local Authorities (Edinburgh, Falkirk, Fife and Highland) and the
Scottish Government
Final Report
March 2013
Glen Bramley and David Watkins

2
ANNEXES ............................................................................................................................... 4
Glossary................................................................................................................................. 5
Initials and Acronyms ........................................................................................................ 5
Technical Terms ................................................................................................................. 5
Aims and Scope ................................................................................................................. 7
Methodology ..................................................................................................................... 7
Broad Trends and Patterns ................................................................................................ 7
Local Patterns .................................................................................................................... 8
Determinants of Income and Poverty ................................................................................ 9
Incidence of Different Measures ........................................................................................ 9
Implications ....................................................................................................................... 9
Chapter 1: Introduction ........................................................................................................ 11
Overview .......................................................................................................................... 11
Aims and Objectives ......................................................................................................... 11
Relevance to Policy and Practice ....................................................................................... 12
Background ...................................................................................................................... 13
Guide to the Report .......................................................................................................... 14
Chapter 2: Research Methodology ....................................................................................... 15
General Approach ............................................................................................................. 15
Steps in the process .......................................................................................................... 15
Survey Data Sources ......................................................................................................... 16
Area Groupings ................................................................................................................. 16
Timing and Updating ........................................................................................................ 18
Choice of models .............................................................................................................. 18
Precision ........................................................................................................................... 19
Chapter 3: Wider Patterns of Income and Poverty ................................................................ 20
National trends ................................................................................................................. 20
Local variation .................................................................................................................. 21
UK Income Comparisons ................................................................................................... 22
UK Poverty Comparisons .................................................................................................. 24
Local Poverty Variations ................................................................................................... 26
Chapter 4: Patterns in Case Study Local Authorities .............................................................. 28
Income Distribution .......................................................................................................... 28
3
Comparing Average Income Measures and Local Authorities ............................................ 31
Comparing Poverty Measures and Local Authorities ......................................................... 34
Patterns of Poverty Distribution ....................................................................................... 36
Demographic sub-groups .................................................................................................. 40
Correlations ...................................................................................................................... 44
Mapping Incomes ............................................................................................................. 45
Income distributions ......................................................................................................... 48
Affordability ..................................................................................................................... 49
‘Anomalies’ ....................................................................................................................... 50
Changes since 2002 .......................................................................................................... 51
Chapter 5: Determinants of Income and Poverty .................................................................. 52
Levels of Explanation ........................................................................................................ 52
Important Drivers ............................................................................................................. 52
Area Effects ...................................................................................................................... 53
Drivers of Poverty ............................................................................................................. 53
Interpretation ................................................................................................................... 55
Chapter 6: The Incidence of Benefits, Low Income, and Material Deprivation ...................... 57
Motivation ........................................................................................................................ 57
Reasons for Differences .................................................................................................... 57
The Area Dimension ......................................................................................................... 58
Who are the ‘Non-Benefit Income-Poor’? ......................................................................... 59
Geographical Incidence .................................................................................................... 60
Discussion ......................................................................................................................... 63
Chapter 7 Implications of Findings ................................................................................... 65
National Picture ................................................................................................................ 65
Different Measures ........................................................................................................... 65
Local Variation .................................................................................................................. 65
Comparing the measures .................................................................................................. 66
Drivers of income and poverty .......................................................................................... 66
Exploring the discrepancies .............................................................................................. 66
Demographic divide .......................................................................................................... 67
Changing policy context .................................................................................................... 67
Potential Uses ................................................................................................................... 67
Updating ........................................................................................................................... 68
References ........................................................................................................................... 69

4
ANNEXES
A. Technical Details of Models, Methods and Sources [Word]
B. Guide to Variables [Excel]
C. Predictive Models [Excel]
D. Area Typologies [Excel]
E. Precision of Estimates [Word]
F. Income and Poverty Summary for All Local Authorities [Excel]
G. Income and Poverty Measures for four Case Study Local Authorities [Excel]

5
Glossary
Initials and Acronyms
AHC After Housing Costs (i.e. income, net of tax/NI, minus housing costs) APS Annual Population Survey ASHE Annual Survey of Hours and Earnings BHC Before Housing Costs (i.e. income, net of tax/NI, before deduction of housing
costs) BHPS British Household Panel Survey DZ Scottish Datazone (standard geographical unit comprising c.500-1000
population) EU-SILC European Union – Statistics of Income and Living Conditions FRS Family Resource Survey GIS Geographic Information Systems HMRC Her Majesty’s Revenue and Customs IMD Index of Multiple Deprivation (England) IZ Scottish Intermediate Zone LSOA Lower Super Output Area (England & Wales standard geographical unit
comprising c. 750-1500 population) OLS Ordinary Least Squares Regression procedure (i.e. ‘standard’ regression
method for quantifying the relationship between a group of ‘independent’ variables and a ‘dependent’ variable)
ONS Office for National Statistics PSE Poverty and Social Exclusion Survey (1999 ‘Millenium Poverty Survey’
reported in Pantazis et al 2006, and 2012 UK Poverty and Social Exclusion Survey, whose results are expected during 2013, see http://www.poverty.ac.uk/ )
SAS Census Small Area Statistics SG Scottish Government SHS Scottish Household Survey SIMD Scottish Index of Multiple Deprivation SPSS Statistical Package for the Social Sciences (former name of software package
now sometimes known as ‘Predictive Analytical Software’, or PASW) US Understanding Society, UK-wide longitudinal household survey and successor
to BHPS. Technical Terms
Bi-Modal Distribution – a frequency distribution which has two peaks (most commonly-occurring values).
Controlling – proportionally adjusting predicted income or poverty rate values for particular types of small area so that their average value equals the target average value, based on actual observed values in the original survey(s).
6
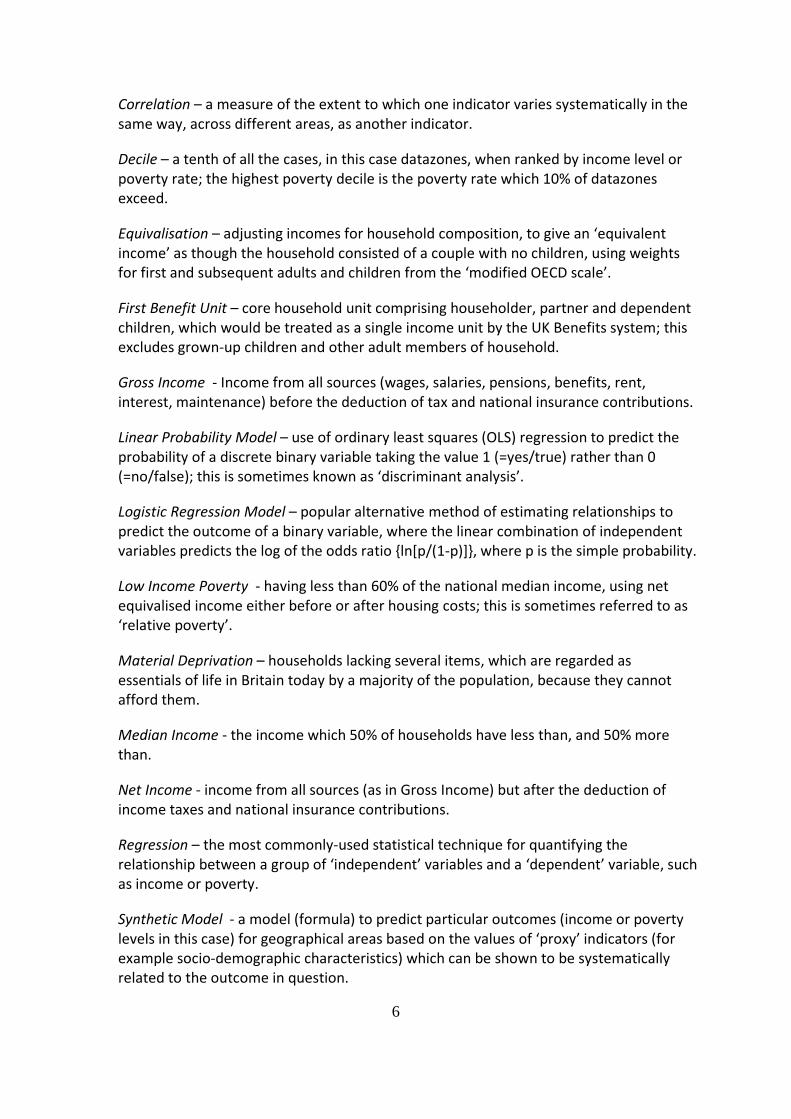
Correlation – a measure of the extent to which one indicator varies systematically in the same way, across different areas, as another indicator.
Decile – a tenth of all the cases, in this case datazones, when ranked by income level or poverty rate; the highest poverty decile is the poverty rate which 10% of datazones exceed.
Equivalisation – adjusting incomes for household composition, to give an ‘equivalent income’ as though the household consisted of a couple with no children, using weights for first and subsequent adults and children from the ‘modified OECD scale’.
First Benefit Unit – core household unit comprising householder, partner and dependent children, which would be treated as a single income unit by the UK Benefits system; this excludes grown-up children and other adult members of household.
Gross Income - Income from all sources (wages, salaries, pensions, benefits, rent, interest, maintenance) before the deduction of tax and national insurance contributions.
Linear Probability Model – use of ordinary least squares (OLS) regression to predict the probability of a discrete binary variable taking the value 1 (=yes/true) rather than 0 (=no/false); this is sometimes known as ‘discriminant analysis’.
Logistic Regression Model – popular alternative method of estimating relationships to predict the outcome of a binary variable, where the linear combination of independent variables predicts the log of the odds ratio {ln[p/(1-p)]}, where p is the simple probability.
Low Income Poverty - having less than 60% of the national median income, using net equivalised income either before or after housing costs; this is sometimes referred to as ‘relative poverty’.
Material Deprivation – households lacking several items, which are regarded as essentials of life in Britain today by a majority of the population, because they cannot afford them.
Median Income - the income which 50% of households have less than, and 50% more than.
Net Income - income from all sources (as in Gross Income) but after the deduction of income taxes and national insurance contributions.
Regression – the most commonly-used statistical technique for quantifying the relationship between a group of ‘independent’ variables and a ‘dependent’ variable, such as income or poverty.
Synthetic Model - a model (formula) to predict particular outcomes (income or poverty levels in this case) for geographical areas based on the values of ‘proxy’ indicators (for example socio-demographic characteristics) which can be shown to be systematically related to the outcome in question.

7
Executive Summary
Aims and Scope
The main aim of this project is to provide a robust and transparent set of estimates of household incomes and poverty for local and small areas in Scotland. In doing so it provides more insight into the determinants of income and poverty levels and the significance of differences between different measures. This evidence supports both national and local Community Planning action to tackle poverty (Chapter 1).
The research builds on previous studies, and picks up on recent work by the Scottish Government comparing measures of poverty derived from household surveys with the Scottish Index of Multiple Deprivation (SIMD). It will complement other new studies of poverty and social deprivation and rural income standards and be of value in responding to the effects of welfare reform.
Methodology
The aim of the methodology is take national survey evidence and to link it to what we know about local and neighbourhood populations, their household characteristics and circumstances, so as to infer from this what we would expect their income patterns to be (Chapter 2). It involves three steps: (1) statistical models to predict individual household incomes in sample surveys; (2) using these relationships to predict values for small area populations, given their characteristics; (3) controlling for consistency at the level of groups of similar areas. Three different national survey datasets are used, with many other sources contributing to the local area estimates. 28 distinct measures are provided for (nearly) every datazone in Scotland. Approximate estimates of likely error/uncertainty margins are provided.
Broad Trends and Patterns
Average income levels in Scotland rose moderately from 2000 to 2009 before falling with the recession in 2010. There has been significant progress in reducing relative poverty since 1999 (Chapter 3).
Incomes (equivalised and before housing cost, BHC) vary between £340 and £480 per week at local authority level. Poorer areas include some rural and island areas as well as major cities and mixed industrial areas, while the most affluent authorities are in the commuting hinterland of major cities.
Median household incomes for Scotland are lower than those in the south of England, similar to the Midlands and Yorkshire, but higher than those in the North East and North West regions of England. For given types of locality, Scottish areas are generally comparable with similar areas in England, but there are considerable variations within geographical types, for example between poorer and more affluent cities.
Material deprivation varies more than low income poverty, when comparing types of locality. In the poorest local authorities between a quarter and a third of households are

8
poor in terms of low income and/or material deprivation. However, in rural local authorities in Scotland poverty levels are generally lower.
There are marked differences between the SIMD measure of low income and the survey-based numbers, particularly in rural areas.
Local Patterns
There are marked differences between local authorities in their distribution of datazones across the income levels, with Edinburgh standing out as particularly distinctive through having many zones with higher incomes, though also having some of the poorest zones in Scotland. (Chapter 4).
Although Glasgow is generally the poorest authority in Scotland, the income gap with other authorities varies markedly according to which measure is used; for example Glasgow is £91 per week below Fife on gross income but only £18 lower on equivalised income. The poorest zone in Glasgow is £85 per week below the poorest zone in Edinburgh, but in equivalised income the difference is only £15, underlining the importance of household composition.
Edinburgh and Glasgow generally tend to have high variability between zones and Highland lower, with Western Isles particularly low. The most extreme (poor) zones are generally in Glasgow, but the most affluent zones are in a variety of authorities depending on the measure. However, the poorest zone in Edinburgh is almost as low as the poorest in Glasgow.
However, Glasgow has a majority of zones which have high levels of poverty, a pattern shared to some extent with some other industrial areas, whereas in other authorities these high poverty zones tend to be a smallish minority.
Material deprivation tends to vary more than low income (BHC) and may be a better discriminator for pinpointing poverty. It is more similar in its distribution to SIMD, as confirmed by correlation evidence. Areas with high scores tend to be large public /social sector housing areas.
Patterns for families and working age adult households tend to be similar, except that the latter show markedly lower material deprivation in Edinburgh. The results for older households suggest less variation in income-based measures but more in material deprivation, but these findings must be treated with more caution.
Correlations between the measures suggest a fair degree of correspondence, in terms of relative scores or rankings, between SIMD 2012 low income score and several of our poverty measures including material deprivation and low income after housing costs (AHC). However, the absolute poverty rates may differ between these indicators, and particular types of anomalous areas may not conform to the same patterns on all indicators. Low income before housing costs (BHC) has a rather different pattern.

9
The models can estimate distributions of income for households within particular small areas, showing what proportion would be expected to have incomes below or above particular thresholds (e.g. £300 per week). These can also be used to estimate housing affordability rates.
Changes since 2002 in absolute and relative income and poverty rates at neighbourhood scale do appear to be mainly related to the impact of new housing developments in different tenures.
Determinants of Income and Poverty
The statistical models used to predict income and poverty levels can explain much of the variation at individual level and most of the variation between small areas in these levels (Chapter 5). The most important predictors, which are indicative of the drivers of income differences, relate to economic activity, occupational class, car ownership, demographic factors including age, household types and ethnicity, housing consumption and values. These factors are mainly individual household attributes rather than area-level effects, although there are some influences from rurality, local earnings and employment rates, and SIMD scores (particularly on the education domain).
Incidence of Different Measures
The fact that different measures of income or poverty present a somewhat differing story for different types of locality can be partly explained by the differential effects of eligibility and takeup of benefits, age and tenure effects (Chapter 6). Further light is shed on these differences by looking at individual households in surveys who are ‘poor’ on one measure but not another (whose numbers typically exceed those who are poor on both). A large group of older households appear poor in terms of income, although not receiving low income benefits; but after allowing for housing costs, or looking at material deprivation, many of this group do not appear to be poor.
Housing costs may push more families into poverty. Other groups who appear poor in income terms, or in terms of material deprivation, although not receiving income-related benefits, include younger households , single adults, larger families, private renters and non-white ethnic groups.
Groups who have low income (including after housing costs) but are not receiving income-related benefits are found fairly uniformly across all SIMD deprivation bands, whereas people receiving such benefits but not on low income are heavily concentrated in the most deprived bands. Correspondingly, the former group are found more in rural areas, while the latter group is more concentrated in West Central Scotland.
Implications
Relative poverty has improved over the last decade, but absolute poverty and deprivation may be increasing since the recession (Chapter 7). There is also a picture of working age households being harder hit by recent changes than the retired population.

10
It is important to monitor poverty using more than one indicator, and distinguishing different broad demographic groups. Families with children are particularly susceptible to poverty after housing costs and to suffer material deprivations, especially in the poorest cities.
Scotland’s income and poverty levels are quite comparable with England, particularly for comparable types of locality (and leaving aside London). Scotland does not have uniquely different poverty concentrations, and nor is rural poverty more marked overall.
Total household incomes are affected by household composition and the more robust equivalised measures show smaller differences between the poorest areas in different localities.
Local authorities differ markedly in the pattern of distribution of incomes, whether measured in terms of small areas or households. While some have just a very few ‘very poor’ zones, others (notably Glasgow) have a very large number of these; Edinburgh has a notably large number of affluent zones alongside a significant minority of poor zones; more remote rural areas tend to show less variation between zones of given population size.
The SIMD 2012 low income domain seems to function quite well as a method to identify and rank poor neighbourhoods, in terms of its correspondence with material deprivation and some low income measures, although it may be less reliable as a measure of the absolute extent of poverty and the degree of variation in this extent.
Changes to the benefit system related to UK deficit-reduction and welfare reform will have significant impacts on both income levels and on the measured takeup of income-related benefits. Reliance solely on the latter to monitor poverty could in this context be seriously misleading, and it will be even more important to refer to independent survey-based measures, and derived local estimates such as those reported here.
The study has generated a wide range of local measures which can be used for a range of purposes, including but not confined to the targeting and monitoring of efforts to tackle poverty nationally and locally. Although not benefitting yet from 2011 Census data, the study shows how it is possible to update most of the inputs, and so roll the estimates forward in future years.

11
Chapter 1: Introduction
Overview
This report presents the main findings of a research project carried out during 2012 for the Improvement Service, acting on behalf of four Scottish Local Authorities and the Scottish Government, to develop improved measures of local incomes and poverty in Scotland. There is a shared commitment to tackling poverty and inequality in Scotland, reflected in EU commitments, in UK legislation on Child Poverty, in Scottish national objectives and performance frameworks and at local level in Community Planning. Hitherto, locally-focussed efforts have been somewhat hampered by a lack of local data on key indicators of poverty which are central in national policy frameworks, although local deprivation indices (SIMD) have been a valuable resource. Nevertheless, efforts at reconciling different approaches to measuring income and poverty have posed questions and challenges, particularly about the adequacy of certain measures to capture all the dimensions of poverty in different types of area. The project was born of a desire to increase the range of profiling tools available at local level while at the same time shedding more light on these issues of concern.
Aims and Objectives
The general aims of this project reflect the policy and technical issues just mentioned.
1. To develop a robust and transparent method to provide a set of estimates of household income levels and distributions, including poverty measures, for local authorities and small areas across Scotland.
2. To provide insight into the determinants of local household income levels and distributions for different groups
3. To inform the debate about the value, meaning and implications of different ways of measuring household income patterns, where these may appear to give a different picture.
4. To provide benchmarks and tools for the assessment of a range of problems related to income, including housing affordability, fuel poverty, financial stress/indebtedness, and benefit take-up, in the context of local Community Planning.
More specific objectives in practice have included the following
a) Establish and agree a framework for analysis, including geographical levels of output, geographical typologies for broader localities and for neighbourhood level factors, household groups and income definitions, and the datasets to be used
b) Assemble and link datasets and estimate mixed predictive models within micro dataset(s) for average income levels and income levels below a set of thresholds.

12
c) Create specific household groups and income measures to be used (see below) and estimate predictive models for these specific measures
d) Using these model results and available data at local and small area level, generate predictions at these levels (for the whole of Scotland), controlling as necessary to higher order values from official surveys (ideally for more than one point in time)
e) Examine characteristics of households identified as ‘income poor’ but not receiving low income benefits, including their location, and whether materially deprived (using different sources of data);
f) Combining findings from d) and e) with basic SIMD data, to provide a geographical profile of low income groups not captured by SIMD low income domain.
The research project was commissioned at the end of 2011 by the Improvement Service, acting on behalf of four local authorities (Edinburgh, Falkirk, Fife and Highland) and the Scottish Government. It has been overseen by an advisory group comprising representatives of these bodies.
Relevance to Policy and Practice
The main relevance of this proposal arises in the context of local Community Planning, where issues of income levels and poverty incidence at local authority and neighbourhood levels are important to monitoring progress under Single Outcome Agreements and to targeting action under Anti-Poverty Strategies. This relates to the Scottish Government’s overarching strategy Achieving Our Potential: A Framework to Tackle Poverty and Inequality in Scotland. This focus on poverty is reinforced by the UK Child Poverty Act 2010 which embodies the commitment to eradicate child poverty and creates duties to meet targets for relative, absolute and persistent poverty and material deprivation.
The author undertook a review for the Scottish Government of the potential scope for a ‘Poverty Toolkit’. The overall aim of the toolkit would be to provide support to Community Planning Partnerships (CPPs) in developing, implementing, monitoring and evaluating policies to tackle poverty – to ensure that these are based on the best available evidence and user involvement, including local intelligence on good practice. In reviewing the available evidence and taking on the views of local practitioners, it became clear that the most glaring information gap was on the local incidence of poverty measured in a way which was consistent with these national goals.
In the current policy juncture, where significant real reductions in public spending on welfare and services are required to reduce the UK Budget Deficit, both Scottish and Local Government should have regard to the impact of their decisions on different groups within the community and on different geographical areas, and particularly on those who are relatively worst off. This project would help with pinpointing those areas and groups.

13
In housing, problems of diminished supply and funding are compounding problems of affordability, and there are pressures to focus more on intermediate rents and tenures, where affordability is a particular issue. The nature of housing need and affordability problems tends to be distinctive in rural versus urban areas, and this study would help to illuminate this. Similarly, real rises in fuel prices, and potential further rises, will make fuel poverty even more of an issue in the coming period.
Background
The first trigger for this exercise was an enquiry from Fife Council into the possibility of updating and extending some proxy-based income estimates provided as part of work by the authors in developing a ‘Social Justice Analysis System’ for Fife, subsequently incorporated in the KnowFife information system. This was a simple estimate of mean income at datazone and higher geographical levels based on a regression model linking the local authority level income estimates in our ‘Scottish Local Housing Need and Affordability model’ (Bramley et al 2006) to socio-demographic variables from Census and other sources.
A second trigger was the idea of following up work done for the (former) National Housing and Planning Advice Unit in England with Steve Wilcox (Wilcox & Bramley 2010) which was concerned with improving and benchmarking estimates of housing affordability at local authority level. This generated local authority level estimates of income levels and distributions, based on the Family Resources Survey (FRS) but using updated local data from a range of sources.
The third trigger was the ongoing examination of local measures of poverty being undertaken by the Scottish Government. This work stemmed from the attempt to enhance the Scottish Household Survey (SHS) income data by imputing values for other adult household members drawing on FRS data. Comparisons between the results of this exercise and the existing Scottish Index of Multiple Deprivation (SIMD) income domain, which is based on administrative benefit and tax credit data, showed significant apparent discrepancies in the geography of poverty from these two different approaches. In the light of past investigation into the limitations of benefit take-up as a measure of poverty (Bramley, Lancaster & Gordon 2000), that should not have been a total surprise. However, it was clear that further investigation and explanation of the differences between these differently based measures of poverty, including geographical differences, would be needed.
Related to these points, there has been long-standing concern about the adequacy of measures of income and poverty for rural areas, and particularly for the remoter rural parts of Scotland. SIMD has been subject to critical scrutiny as a basis for poverty and deprivation measurement because of both its focus on urban concentration and its reliance on benefit take-up (Bramley 2005). A survey-based methodology can provide valuable additional evidence on the incidence of poverty in different kinds of area and for different socio-demographic groups. Recent data developments, particularly the enhancement of FRS samples and questions since 2003, make this now more opportune.

14
The 2012 UK Poverty and Social Inclusion Survey will also have enhanced coverage of rural Scotland and will provide further evidence on a range of poverty and deprivation measures for these areas taken together. There is also ongoing work on the application of a Minimum Income Standard (MIS) approach to rural Scotland. But there will still be a need for developing the implications of both of these research studies in terms of local and small area profiles and indicators.
A final concern for the future is that cuts and changes to benefit systems and welfare reform more generally may make it difficult to continue to derive consistent poverty indicators from benefit systems, as is currently central to the SIMD. Again this suggests that a different, survey-based approach may be of greater value as a complement to the administratively driven indicators.
Guide to the Report
• Chapter 2 presents a high level overview of the methodology. Fuller details are provided in Annex A, along with Annex D which describes the area typologies used, while Annex E reports on the degree of precision associated with the estimates.
• Chapter 3 presents a broader picture of income and poverty patterns across England and Scotland and broad groups of households, with a particular emphasis on geographical patterns at the local authority level (fuller detailed outputs are provided in Annex F).
• Chapter 4 takes the four commissioning local authorities as case studies, along with some more extreme comparators, and reports in detail on the patterns of income and poverty estimated at the level of small geographical areas (datazones and intermediate zones), with Annex G containing the detailed figures.
• Chapter 5 discusses the determinants of income and poverty, drawing out main findings from the modelling work undertaken to predict these measures for smaller areas. Fuller details of these models and the underlying data are given in Annexes B and C.
• Chapter 6 explores the issue of the differences between the different measures of poverty, using the surveys to drill down into the characteristics of households who are poor on one measure but not another.
• Chapter 7 summarises the conclusions and implications and discusses some wider uses for the models and estimates.

15
Chapter 2: Research Methodology
General Approach
The broad method for this work follows in a general fashion the approach of Wilcox & Bramley (2010) in their recent study, which estimated household income distribution for English local authorities. However, the approach has been adapted extensively for application in the Scottish context and to reflect the greater interest in small area estimates and in various measures of poverty. In doing this we reflect on and take account of other work on small area estimation of income and deprivation (e.g. Fay & Herriot 1979, Drew et al 1982, Singh et al 2006, Williamson 2002; Marshall & Acik-Toprak 2012), including for example the Office for National Statistics (ONS) ward level income estimates for England, and exploratory studies on poverty incidence.
Most of what we know about the detailed patterns of household income for different types of household in different circumstances is derived from official government sample household surveys, particularly the Family Resources Survey (FRS). These give a rich picture at national level, and a reasonable picture at regional level, but little reliable at local or small area level, due to limited sample numbers. The aim of the methodology is to take this national evidence and to link it to what we do know about local and neighbourhood populations, their household characteristics and circumstances, so as to infer from this what we would expect their income patterns to be. This mapping down from national to local and neighbourhood level depends of course on assumptions about the underlying relationships between household characteristics and circumstances, as revealed in the national data, applying in more or less the same way across the system. Insofar as these relationships vary locally, we aim to capture these variations through the use of wider area-level predictors (e.g. labour or housing market factors) and also by making use of area typologies in our analysis of the national sample survey data.
Steps in the process
The modelling of each income measure essentially comprises three steps
1. Within the micro sample household survey dataset, regression or similar models are developed to predict income level or poverty status of individual households in the sample, using characteristics of the individual households and of the areas where they live.
2. Within a separate dataset of local or small areas, using data from a range of sources, equivalent predictor variables are developed and combined in a ‘synthetic model’, using the formulae from step 1., to predict income levels or poverty incidence for these areas.
3. At an intermediate level of groups of similar areas, predictions from step 2. are controlled for consistency with actual data from step 1.
16
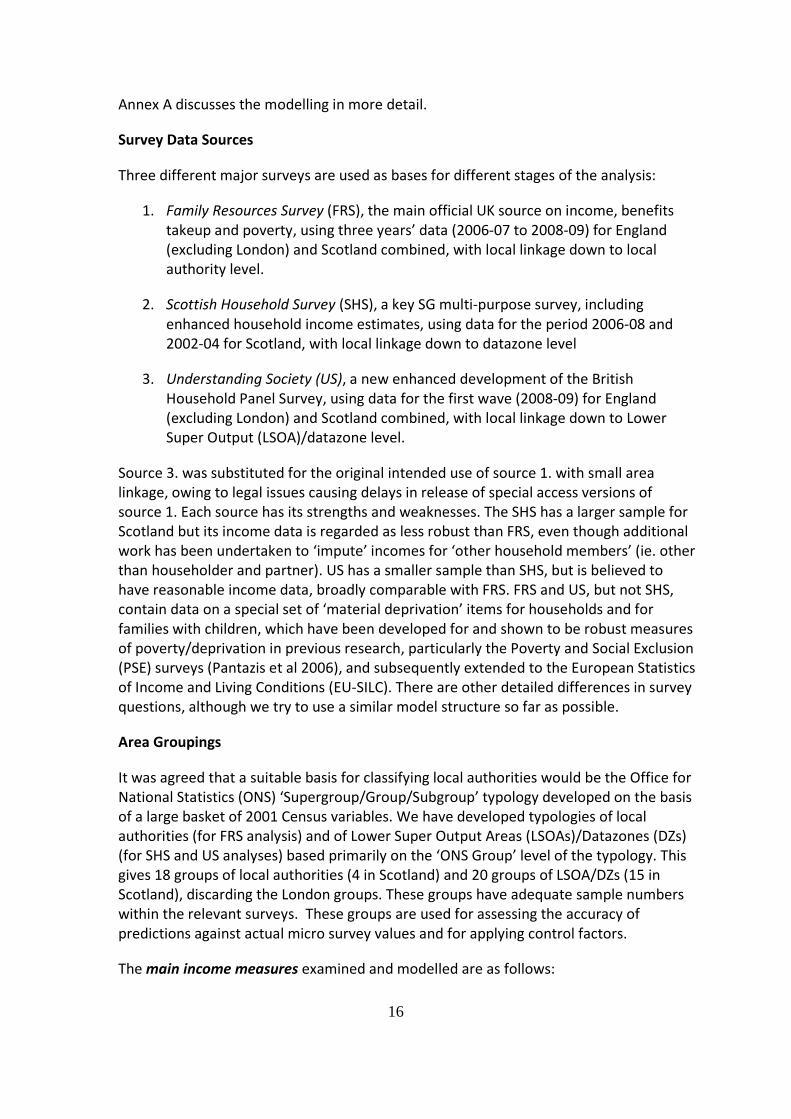
Annex A discusses the modelling in more detail.
Survey Data Sources
Three different major surveys are used as bases for different stages of the analysis:
1. Family Resources Survey (FRS), the main official UK source on income, benefits takeup and poverty, using three years’ data (2006-07 to 2008-09) for England (excluding London) and Scotland combined, with local linkage down to local authority level.
2. Scottish Household Survey (SHS), a key SG multi-purpose survey, including enhanced household income estimates, using data for the period 2006-08 and 2002-04 for Scotland, with local linkage down to datazone level
3. Understanding Society (US), a new enhanced development of the British Household Panel Survey, using data for the first wave (2008-09) for England (excluding London) and Scotland combined, with local linkage down to Lower Super Output (LSOA)/datazone level.
Source 3. was substituted for the original intended use of source 1. with small area linkage, owing to legal issues causing delays in release of special access versions of source 1. Each source has its strengths and weaknesses. The SHS has a larger sample for Scotland but its income data is regarded as less robust than FRS, even though additional work has been undertaken to ‘impute’ incomes for ‘other household members’ (ie. other than householder and partner). US has a smaller sample than SHS, but is believed to have reasonable income data, broadly comparable with FRS. FRS and US, but not SHS, contain data on a special set of ‘material deprivation’ items for households and for families with children, which have been developed for and shown to be robust measures of poverty/deprivation in previous research, particularly the Poverty and Social Exclusion (PSE) surveys (Pantazis et al 2006), and subsequently extended to the European Statistics of Income and Living Conditions (EU-SILC). There are other detailed differences in survey questions, although we try to use a similar model structure so far as possible.
Area Groupings
It was agreed that a suitable basis for classifying local authorities would be the Office for National Statistics (ONS) ‘Supergroup/Group/Subgroup’ typology developed on the basis of a large basket of 2001 Census variables. We have developed typologies of local authorities (for FRS analysis) and of Lower Super Output Areas (LSOAs)/Datazones (DZs) (for SHS and US analyses) based primarily on the ‘ONS Group’ level of the typology. This gives 18 groups of local authorities (4 in Scotland) and 20 groups of LSOA/DZs (15 in Scotland), discarding the London groups. These groups have adequate sample numbers within the relevant surveys. These groups are used for assessing the accuracy of predictions against actual micro survey values and for applying control factors.
The main income measures examined and modelled are as follows:
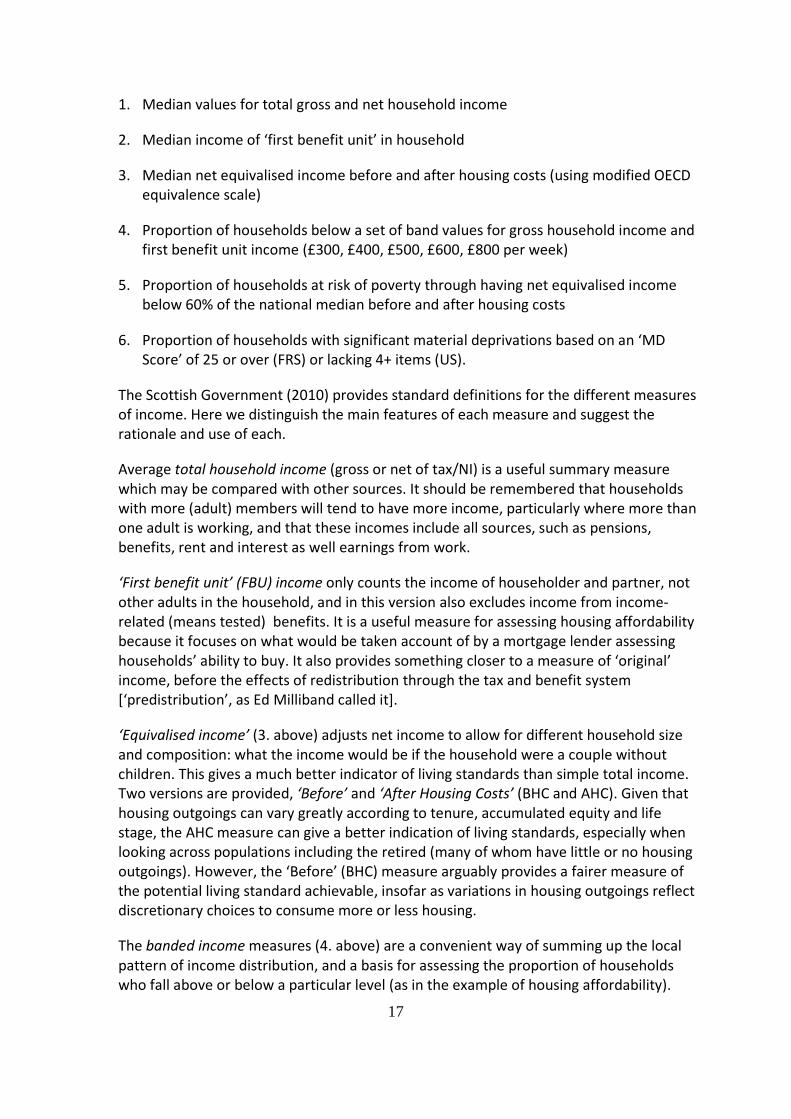
17
1. Median values for total gross and net household income
2. Median income of ‘first benefit unit’ in household
3. Median net equivalised income before and after housing costs (using modified OECD equivalence scale)
4. Proportion of households below a set of band values for gross household income and first benefit unit income (£300, £400, £500, £600, £800 per week)
5. Proportion of households at risk of poverty through having net equivalised income below 60% of the national median before and after housing costs
6. Proportion of households with significant material deprivations based on an ‘MD Score’ of 25 or over (FRS) or lacking 4+ items (US).
The Scottish Government (2010) provides standard definitions for the different measures of income. Here we distinguish the main features of each measure and suggest the rationale and use of each.
Average total household income (gross or net of tax/NI) is a useful summary measure which may be compared with other sources. It should be remembered that households with more (adult) members will tend to have more income, particularly where more than one adult is working, and that these incomes include all sources, such as pensions, benefits, rent and interest as well earnings from work.
‘First benefit unit’ (FBU) income only counts the income of householder and partner, not other adults in the household, and in this version also excludes income from income-related (means tested) benefits. It is a useful measure for assessing housing affordability because it focuses on what would be taken account of by a mortgage lender assessing households’ ability to buy. It also provides something closer to a measure of ‘original’ income, before the effects of redistribution through the tax and benefit system [‘predistribution’, as Ed Milliband called it].
‘Equivalised income’ (3. above) adjusts net income to allow for different household size and composition: what the income would be if the household were a couple without children. This gives a much better indicator of living standards than simple total income. Two versions are provided, ‘Before’ and ‘After Housing Costs’ (BHC and AHC). Given that housing outgoings can vary greatly according to tenure, accumulated equity and life stage, the AHC measure can give a better indication of living standards, especially when looking across populations including the retired (many of whom have little or no housing outgoings). However, the ‘Before’ (BHC) measure arguably provides a fairer measure of the potential living standard achievable, insofar as variations in housing outgoings reflect discretionary choices to consume more or less housing.
The banded income measures (4. above) are a convenient way of summing up the local pattern of income distribution, and a basis for assessing the proportion of households who fall above or below a particular level (as in the example of housing affordability).

18
The proportion of households with low income (5. above), based on equivalised BHC income being below 60% of the national median, corresponds to the national headline target poverty measure (see Figure 3.2 in Chapter 3). However, the AHC measure may be more sensitive.
The proportion of ‘materially deprived’ households is based on lacking several ‘socially perceived necessities’ through being unable to afford them, derived from the PSE 1999 and predecessor research and now used in official measures across the whole of the EU. The items used are particularly appropriate for families with children, and probably less discriminating for older households. A combined measure of being below 70% of median income and materially deprived is also provided (this is shown for children in Figure 3.2 in Chapter 3)
Several of these indicators are also estimated separately for three demographic groups: families with children; other working age households; older households. Comparisons are made with the SIMD income domain and with recent small area estimates of children in receipt of out-of-work benefits or tax credits where income is less than 60% of the national median income, published by Her Majesty’s Revenue and Customs (HMRC).
Timing and Updating
The estimates made are for 2008/09 (‘2008’ for short), given the key data sources available for the research. Median household income levels in Scotland did not actually change between 2008 and 2010, and subsequent increases have been modest. Therefore the estimates provide a reasonable picture of the recent situation.
The variables used as predictors at local authority or LSOA/DZ level are those which we have been able to compile on a common basis across England and Scotland. Some of these still rely on 2001 Census, but a range of measures are derived from the Annual Population Survey (APS), the Annual Survey of Hours and Earnings (ASHE) on Earnings, the Driver and Vehicle Licensing Authority (DVLA) on car ownership, the (Scottish) Indices of Multiple deprivation ((S)IMD,) which itself reflects Department of Work and Pensions (DWP) benefits and HMRC tax credits data), Council Tax administration systems and the Regulated Mortgage Survey (RMS) for house prices, which are all relatively up-to-date. To counter sampling variation and data noise we pool three years of data from several of these sources. We adjust the tenure, occupational class and economic activity characteristics for those zones which have experienced significant housing development based on site-level completions data; earlier estimates of neighbourhood change based on Bramley et al (2007) have been applied in England.
Choice of models
The final estimates chosen vary in terms of which survey source they are based on, partly based on availability of indicators and partly based on judgement as to which models are best.
• Gross, net and first benefit unit (FBU) household income are based on the SHS, controlled to FRS levels at LA group level
19
• Net equivalent income before and after housing costs, and low income poverty (<60% of median net equivalent income) before and after housing cost, are based on the average of SHS and US models, controlled to FRS
• Material deprivation-based poverty measures are based on US models
• Before Housing Cost (BHC) income and poverty measures for sub-groups of households (families, working age, and older) are based on US models.
• Distribution of gross and FBU income by bands (£300 pw, £400 pw, etc) are based on SHS models
Precision
The relative performance of models can be assessed by various statistics for the proportion of variance explained at individual level or at various area or area-grouping levels. We can also compare models calibrated on up to three different national survey sources; these are generally similar. Although the mixed methodology does not allow formal confidence interval calculation, we can provide a reasonable estimate of the likely margin of error for units the size of datazones, as discussed in Annex E. This suggests that nearly all datazone (DZ) estimates of average income will be within +/- 8-10% of the true value while poverty incidence estimates will be within 18-25% of the true value (3-4% points).
A couple of examples may illustrate this more clearly. Edinburgh Datazone S01001790 is in Balerno, characterized by ONS as an ‘Affluent Urban Commuter’ type of area. It has an estimated median net equivalised household income before housing costs of £450 pw, rather above the city-wide average value of £426. We estimate that there is a 95% chance that the true value lies within the range +/- 9% of the estimate (based on Table E.2 in Annex E), that is between £410 and £490. As shown in Table 4.1 in Chapter 4, estimates of this measure of income vary between £255 and £607 across Edinburgh’s datazones, so one could say that this Balerno datazone is close to the City-wide average, clearly well above the poorest areas and well below the richest. This same zone has an estimated low income poverty after housing costs rate of 15% of all households. We estimate that there is a 95% change that the true value lies within +/-25% of this rate (Table E.2, Annex E), that is between 11% and 19% of all households (25% of 15% is 3.8 percentage points, or 4% points after rounding). This compares with a city-wide rate of 22% poor after housing costs, with a range between 8% and 45% across datazones. Therefore we can say that this Balerno datazone is less poor than average for the city on this measure, but that there are some zones with less poverty.

20
Chapter 3: Wider Patterns of Income and Poverty
The first part of this chapter discusses broader income patterns across Scotland over time and in comparison with England, drawing mainly on the FRS-based analyses. It goes on to provide a picture of local variations in poverty measured in different ways.
National trends
Overall income levels in Scotland increased moderately over the period from 2000 to 2010, as shown in Figure 3.1. The most commonly-used measure of household income is probably that shown here, median net income after tax but before deducting housing costs (BHC), and adjusted for the size and composition of the household (‘equivalised’). This rose from around £377 pw in 2000 to £439 in 2009 before falling back to £416 in the recession-hit 2010. The After Housing Cost (AHC) series follows in parallel with this trend.
Figure 3.1: Income Trends Before and After Housing Costs
Source: Scottish Government Statistics http://www.scotland.gov.uk/Topics/Statistics/Browse/Social-Welfare/TrendData
One of the Scottish Government’s national targets is to increase the share of income going to the bottom 30% of households. Broadly this share seems to be relatively static at around 13-14%, falling slightly after 2006 but rising slightly in 2010.
Important targets on overall poverty and child poverty link with UK-wide objectives associated with the Child Poverty Act and European-wide commitments. Figure 3.2 below shows progress for Scotland against the general poverty target and the child poverty target. It should be noted that the general poverty target is about relative poverty, based on net equivalised income before housing costs below 60% of the UK median. There has been a general improvement in Scotland against this criterion since
Median equivalised net weekly income, Scotland 2000/01 to 2010/11
0
50
100
150
200
250
300
350
400
450
500
2000/01 2001/02 2002/03 2003/04 2004/05 2005/06 2006/07 2007/08 2008/09 2009/10 2010/11
Year
Med
ian
wee
kly
inco
me
(£)
Before Housing CostsAfter Housing Costs

21
1999, with a fall from 21% to a low of 15% in 2010/11. Contributory factors to this improvement include the extension of tax credits, increases in some benefits, and fuller employment in the early 2000s. Paradoxically, the recent recession has led to the sharpest increase, because the general working population have experienced falling living standards (earnings rising less than prices) so lowering the median against which the threshold is set.
The child poverty headline indicator combines relative income poverty (at a 70% threshold) with experiencing more than a certain number of material deprivations, from a standard set derived mainly from previous PSE research (Pantazis et al 2006) and now incorporated in both FRS and EU-SILC. Child poverty/deprivation appears to have fallen in the last two years, partly for the same reason as overall relative poverty; prior to that it appeared to fluctuate somewhat, in the range 16% down to 13%.
Figure 3.2: Relative Poverty and Child Poverty
Source: Households Below Average Income, based on FRS, published on Scotland Performs website http://www.scotland.gov.uk/About/Performance/scotPerforms/indicator/
Local variation
There is of course considerable variation across localities in Scotland in the general level of incomes. Figure 3.3. illustrates this using again the most common single measure of average income, median net equivalised income before housing cost, comparable with Figure 3.1. These estimates are based on the models developed in this research.
The variation at the broad scale of local authority does not appear very dramatic on this presentation. Incomes vary from £340 per week in Dumfries & Galloway to £480 per week in East Renfrewshire. While the most affluent authorities are the ‘usual suspects’, commuting hinterlands of major cities, the poorest include rural and island authorities as well as major cities and mixed areas. A lot of local authorities appear to occupy a similar position on a middle plateau with incomes around £400 per week.
Poverty In Scotland 1999-2010
0.0%
5.0%
10.0%
15.0%
20.0%
25.0%
1999 2000 2001 2002 2003 2004 2005 2006 2007 2008 2009 2010
Year-
Perc
ent
Relative Poverty AllCombined Poverty Children

22
Figure 3.3: Household Incomes across Scottish Local Authorities
Source: modelled by researchers, based on SHS data and FRS controls.
A picture of wider variation is revealed by different measures. For example, After Housing Costs (AHC) income varies from £299 per week in Dundee to £448 in East Renfrewshire, while median gross income ranges from £349 (Dundee) to £666 (East Renfrewshire). A comparison in terms of mean gross income would show even wider variation. The poorest cities (Glasgow and Dundee) stand out more on this measure, and this is even more true when we go on to consider poverty measures below.
UK Income Comparisons
We can compare incomes for different types of locality across England and Scotland using the analysis of FRS, and also in the process illustrate the forecasts generated using the synthetic models. Table 3.1 illustrates this for two measures of income (median gross and net equivalent BHC) using an area typology combining ONS groups and broad regions, and also a slightly more detailed typology for Scotland.
Median household incomes for Scotland are lower than those in the south of England, similar to the Midlands and Yorkshire, but higher than those in the NE and NW regions of England. The variation is narrower for equivalised incomes (which adjust for household composition) but in this case Scotland is slightly better off than the Midlands and Yorkshire.
Scotland’s regional centres (i.e. cities) have lower total incomes than their English equivalents, but equivalised incomes in Scotland are slightly above those for northern cities while below those for southern cities. However, cities which are more industrial in the English midlands have slightly lower total incomes than the Scottish cities.
It is perhaps surprising that ‘prosperous small towns’ in Scotland have higher incomes than their equivalents in England, even in the south. However, it should be noted that this group is quite small in Scotland, and also there is another area type called
Median Net Equivalised Household Income Before Housing Costs 2008/09
0
100
200
300
400
500
600
Dumfrie
s & G
allow
ay
North A
yrshir
e
Eilean
Siar
Dunde
e City
Glasgo
w City
Inverc
lyde
West Dun
barto
nshire
East A
yrshir
e
Scottis
h Bord
ers
Argyll &
Bute Fife
North L
anarks
hire
East L
othian
Falkirk
Angus
South
Ayrshir
e
South
Lana
rkshir
eMora
y
Midloth
ian
Clackman
nans
hire
Highland
Edinbu
rgh, C
ity of
Renfre
wshire
West Lo
thian
Aberde
en C
ity
Orkney
Islan
ds
Stirling
Perth &
Kinros
s
Shetla
nd Is
lands
Aberde
ensh
ire
East D
unba
rtonsh
ire
East R
enfre
wshire
Local Authority
£ pe
r w
eek

23
‘prospering England South’, which has higher incomes than these Scottish areas. Also perhaps surprising is the finding that coastal and countryside LAs in Scotland have higher incomes (on both measures) than their equivalents in England, even in the south, and slightly higher incomes than the overall average for England and Scotland (excluding London).
Table 3.1: Actual and Predicted Median Incomes by Locality Type and Region 2008 (£pw – based on FRS analysis – Scotland and England excluding London)
Area Category Gross Hshld Income Net Equiv Inc BHC Actual Predicted Actual Predicted
Broad Region-Group Reg Cent Sth 478 485 393 383 Reg Cen Nth 451 446 368 355 Cent Ind Mids 410 411 334 332 Cent Ind Nth 433 413 351 341 Prosp Sm Town Sth 575 578 426 428 Prosp Sm Town Mids 536 545 414 421 Prosp Sm Town Nth 527 546 406 415 New Grow Town Sth 567 562 421 419 Prosp Eng Sth 722 728 505 510 Coast Cside Sth 458 435 376 360 Coast Cside Nth 451 430 381 358 Ind Hint Nth 415 393 358 335 Man Town Mids 475 475 373 370 Man Town Nth 450 436 362 351 Reg Cent Scot 417 412 372 390 Prosp Sm Town Scot 611 596 456 462 Coast Cside Scot 506 495 405 397 Ind Hint Scot 460 460 383 379
SCOTLAND 468 465 388 390 Lowest Region (NE) 423 410 357 346 Highest Region (SE) 617 618 454 462 All England excl London 502 502 393 392 Total 498 498 392 392
Scottish Sub-groups Prosperous Cities 512 528 407 446 Poorer Cities 356 355 347 342 Prosperous Small Towns 611 596 456 462 Prosperous Rural 538 526 426 410 Poorer Rural 445 454 370 373 Prosp Indust Hinter 477 479 390 387 Poorer Indust Hinter 412 404 357 355
Sources: Researchers’ analysis of FRS and modelled incomes. Note: predicted incomes before the application of control factors.

24
Industrial hinterland areas in Scotland have lower than average incomes but these are still higher than the equivalent areas in northern England, and quite similar to manufacturing towns in the midlands.
We can break three of these Scottish groups down further, lower in the table (Scottish sub-groups). The more prosperous Scottish cities have incomes slightly above the overall average, while poorer Scottish cities have the some of the lowest incomes in these tables (£356 total gross income). More prosperous rural LAs have above-average incomes while poorer rural LAs have below average incomes, although not as low as poorer industrial hinterlands or the poorer cities. Even the more prosperous industrial hinterlands have below average incomes.
UK Poverty Comparisons
Table 3.2 looks at key poverty measures from the FRS, focussing mainly on typical high and low income LAs across GB and on the Scottish groups of LAs. Overall, 19% have low income (<60% median) before housing costs, and 21% have low income after housing costs, while 11% have a material deprivation score above 25.
Table 3.2: Poverty Measures from FRS by selected LA Types, 2008 (England and Scotland excluding London, 2008, proportion of all households)
Area Type <60% median eq inc Material Before hsg After hsg Depriv % % % Total Excl London 19% 21% 11% Income Level Low Income LA 25% 27% 18% Middle Income LA 20% 21% 11% High Income LA 13% 16% 6% Scottish Groups Prosperous Cities 18% 22% 9% Poorer Cities 24% 28% 17% Prosperous Sm Towns 14% 15% 6% Prosperous Rural 16% 15% 6% Poorer Rural 19% 18% 10% Prosp Indust Hinter 18% 19% 11% Poorer Indust Hinter 23% 22% 15% Scotland 19% 20% 11%
Source: FRS pooled actual data, 2006/7-08/9.
The range of variation in the two income-based indicators is not as wide as might be expected, ranging from 13% in high income LAs to 25% in low income LAs on a BHC basis (16% to 27% AHC). The variation is proportionately wider for material deprivation (6% to 18%). The highest poverty area type is centres with industry in the midlands (28% BHC, 31% AHC), while the lowest is Prosperous England South (13%/16%). In Scotland, prosperous small towns are similarly low (14%/15%) with poorer Scottish cities worse off (24%/28%), although this is still slightly better than centres with industry in the midlands. Poorer rural areas in Scotland are still not worse than average (19%/18%) while poorer industrial hinterlands are somewhat

25
worse than average but a bit better than the poorer cities (23%/22%). Material deprivation is noticeably worse in poorer Scottish cities than in the other types of Scottish areas (17%), although poorer industrial hinterlands have a fairly high figure (15%).
Families with children are somewhat more likely to experience poverty, and it is particularly useful here to compare the income measures with the material deprivation measures. Table 3.3 makes this comparison. Low income (BHC) is similar to that for all households, but low income AHC is markedly more common for families (27% vs 20%). This reflects the fact that many older households have low housing costs. Material deprivation has an incidence among families which lies between these two figures (23%). The combination of low income (<70% BHC) and material deprivation (25 plus) has a somewhat lower incidence (14%), underlining that there is far from being a complete overlap between low current income and material deprivation (see further discussion in Chapter 6). Low current income may reflect transitional factors whereas material deprivation is likely to reflect the assets and resources households have acquired over time.
Table 3.3: Poverty Measures for Families with Children, FRS 2008 England & Scotland
Families with Children <60% med <60% med Materially <70% med inc BHC inc AHC Deprived & MD 25 % % % % Total 20% 27% 23% 14% LA Income Level Low Income LA 31% 38% 35% 25% Middle Income LA 20% 27% 22% 14% High Income LA 11% 20% 14% 7% Scottish subgroups Prosperous Cities 14% 20% 21% 12% Poorer Cities 31% 37% 37% 28% Prosperous Small Towns 16% 19% 13% 10% Prosperous Rural 14% 17% 11% 7% Poorer Rural 16% 19% 15% 10% Prosp Indust Hinter 19% 24% 20% 13% Poorer Indust Hinter 31% 34% 30% 26% Scotland 20% 24% 23% 14%
Source: FRS pooled actual data, 2006/-08/9
Comparing low and high income LAs, low income (BHC) varies by a factor of nearly 3, whereas the AHC measure, although higher, varies less (by a factor of less than 2). Material deprivation varies by a factor of two-and-a-half, while combined low income and deprivation varies by three-and-and-a-half times. Because housing costs are higher in the South of England, the difference between BHC and AHC poverty tends to be greater there than in the North of England or Scotland. Generally, the material deprivation indicator tends to lie between the values for BHC and AHC poverty.

26
In England, the poorest areas for families are again centres with industry in the midlands, with the least poverty in prospering southern areas, and this is true across all of the indicators. In Scotland, the poorest localities are the poorer cities, with 37% poor on both the after housing cost (AHC) and material deprivation measures. However, the lowest poverty in Scotland is in the prosperous rural areas, which score about 2% less than the prosperous small towns. Poorer rural LAs in Scotland have less than average family poverty. Poorer industrial hinterlands in Scotland have 34% of families on low income AHC and 30% with material deprivation, and 26% poor on the combined measure (quite close to the 28% for poorer cities).
As will be clearer from findings in the next chapter, there is diversity within urban and rural areas, so that some rural or small town areas may exhibit high levels of poverty and/or material deprivation, even though this is not really apparent at LA group level.
Local Poverty Variations
As with income measures it is useful to look at the pattern of variation across local authorities, and in particular to contrast the picture given by the SIMD (which is very well-known) with the picture in terms of the standard national target measure of poverty, being below 60% of median net equivalised income (BHC). Figure 3.4 makes this comparison.
The SIMD low income score measure drops steadily from its high of 22.2% in Glasgow to a low of 6.7% in Shetland. Practically all of the top group of authorities are urban or predominantly urban industrial/former industrial areas, and nearly all (apart from Dundee) are in West Central Scotland. The authorities with lowest scores are rural, island and affluent suburban areas.
Figure3.3: Comparison of Modelled Low Income and SIMD Low Income Indicators at Local Authority Level
Sources: Modelled estimate of low equivalent income BHC; SIMD 2012.
Poverty Measures by Local Authority
0.000
0.050
0.100
0.150
0.200
0.250
Glasgo
w City
West Dun
barto
nshire
Inverc
lyde
Dunde
e City
North A
yrshir
e
North L
anarks
hire
East A
yrshir
e
Renfre
wshire
Clackman
nans
hire
South
Lana
rkshir
e
South
Ayrshir
eFife
Falkirk
West Lo
thian
Dumfrie
s & G
allow
ay
Eilean
Siar
Midloth
ian
Angus
Argyll &
Bute
Edinbu
rgh, C
ity of
East L
othian
Highland
Stirling
Scottis
h Bord
ersMora
y
Aberde
en C
ity
Perth &
Kinros
s
East R
enfre
wshire
East D
unba
rtonsh
ire
Orkney
Islan
ds
Aberde
ensh
ire
Shetla
nd Is
lands
Local Authority
Prop
ortio
n
< 60% Median BHC
SIMD Low Income Score
27
The pattern with regard to low income (BHC) is quite a bit different. There is less downward slope, from around 24% to around 15%. There is not a close correspondence with SIMD. In a few LAs (among the poorest) the two measures are similar. But there are many LAs where low income (BHC) is markedly more prevalent than being on low income benefits as recorded by SIMD. The differences are most marked in the cases of rural areas, including both poorer areas Dumfries & Galloway and Eilean Siar and areas which appear, on the basis of SIMD, to have relatively little poverty – Orkney, Moray, Borders, Aberdeenshire, Shetland.
This phenomenon illustrates in clearly one of the areas of concern that has motivated this research. In Chapter 6 we try to unpack these discrepancies in various ways to gain more insight into what is going on.

28
Chapter 4: Patterns in Case Study Local Authorities
In this chapter we report on detailed results from the modelled estimates of income and poverty measures at small area level, primarily for the four case study LAs in this Scottish study: Edinburgh, Falkirk, Fife, Highland, but also for some other comparator local authorities which represent extremes within Scotland. The estimates are contained in full in Annex G (Excel workbook), where they are given for both individual datazone and for ‘intermediate zones’ – the latter are groupings of datazones which have approximately 1500 households and enable somewhat more concise presentation. In this chapter we present a range of summary statistics, in table or chart form. As explained in Chapter 2, these are all modelled estimates, and different measures are derived from different survey sources, alone or in combination.
Income Distribution
One of the remarkable findings from this analysis is revealed by a simple chart of the frequency distributions of datazone income levels in the different authorities. Figures 4.1 and 4.2 show Edinburgh and Falkirk. Edinburgh is unusual in having a ‘bi-modal’ distribution, with a large number of zones in medium-high and higher income bands. Falkirk is skewed the other way, with a large group of zones with low income, and relatively low numbers in the middle, and a paucity of high values. Figure 4.3 looks at Fife. Here the distribution is more like Falkirk than Edinburgh, but with a bit more spread out into the middle and upper-middle categories. Figure 4.4 shows Highland. Here there is less of a cluster of poor zones, a somewhat bi-modal distribution, and a paucity of any zones with incomes much above £500 per week.

29
Figure 4.1: Distribution of Datazone Level Median Incomes in Edinburgh (net equivalent income BHC, 2008)
Figure 4.2: Distribution of Datazone Level Median Incomes in Falkirk (net equivalent income BHC, 2008)

30
Figure 4.3: Distribution of Datazone Level Median Incomes in Fife (net equivalent income BHC, 2008)
Figure 4.4: Distribution of Datazone Level Median Incomes in Highland (net equivalent income BHC, 2008)
Distribution of datazones by their median income level is not of course the same thing as distribution of households by their individual income level within zones. We return to income distributions near the end of this chapter. First, however, we focus more closely on the pattern of variation in our case study and some comparator local authorities, comparing both different income measures and different authorities.

31
Comparing Average Income Measures and Local Authorities
We now move on to look at all of the average income measures for all households taken together and compare the levels and patterns of variation in not just our four case study local authorities but also four other authorities which represent some extremes in Scotland. Table 4.1 below presents ‘summary statistics’ (average, standard deviation, minimum and maximum) for each income measure for each local authority. The average is, it should be noted, the average of the median estimates for each zone; the minimum and maximum show the maximum extent of variation between zones in each authority, while the standard deviation shows the general amount of variability.
Table 4.2 complements this by showing the degree of variability through the ‘coefficient of variation’ (standard deviation as a percentage of the average) for each measure and authority. Table 4.2 shows that in general net total income is a bit more variable than gross income, with ‘first benefit unit income’ (excluding means-tested benefits) the most variable, and net equivalent income before housing costs the least variable.
Looking at the median figures in Table 4.2 suggests that total household incomes in Edinburgh are rather higher than in the other case studies, with Fife generally the lowest, although on the ‘First Benefit Unit’ (FBU) measure Highland looks similar to Edinburgh. Edinburgh is also clearly higher on the equivalised incomes, with Fife only marginally lower that Falkirk.
However, these four authorities are not extreme cases within Scotland. Glasgow is clearly much lower on median total incomes or equivalised incomes, and is generally the lowest authority in Scotland. Median gross income in Glasgow is £150 per week below Edinburgh and £91 below Fife; but it should be noted that the gap narrows when looking at equivalised income before housing costs (BHC, £66 per week below Edinburgh, but only £18 below Fife). Eilean Siar is also quite low, compared with Fife. At the other extreme, East Renfrewshire has substantially higher median incomes than Edinburgh or any of our other four authorities (£162 per week higher on gross income, but only £35 on equivalised BHC income).
The absolute variation in income between zones in each authority is captured by the standard deviation in Table 4.1 (or as a percent of the mean in Table 4.2). Within our four case studies, Edinburgh tends as expected to have greater variability, although it is not much greater than Falkirk on total income measures. Highland generally has the lowest variability.

32
Table 4.1: Summary Statistics for Median Income Measures Comparing Case Study and Selected Other Local Authorities in Scotland
Local Average Weekly Gross Net
1st Benefit Net Equiv
Net Equiv
Authority Household Unit before hsg after hsg Income 2008 £pw £pw £pw £pw £pw Edinburgh Median* 508 402 460 426 378 Std. Deviation 96 94 115 80 73 Minimum 286 218 203 255 222 Maximum 753 677 746 607 545 Falkirk Median* 467 378 453 387 349 Std. Deviation 93 95 119 60 55 Minimum 259 197 222 308 277 Maximum 747 678 792 555 495 Fife Median* 449 365 437 378 340 Std. Deviation 83 86 109 56 52 Minimum 301 234 244 286 254 Maximum 922 785 1053 534 487 Highland Median* 468 396 461 391 355 Std. Deviation 62 69 83 43 41 Minimum 272 216 209 281 244 Maximum 667 599 727 528 486 Glasgow Median* 358 305 302 360 314 Std. Deviation 87 84 103 76 66 Minimum 201 175 145 248 215 Maximum 726 699 696 574 515 North Median* 466 377 428 371 333 Lanarkshire Std. Deviation 97 99 121 57 51 Minimum 282 222 206 279 248 Maximum 831 766 842 639 581 East Median* 666 518 643 461 422
Renfrews Std. Deviation 122 119 144 69 68 Minimum 414 290 302 307 269 Maximum 1029 857 1026 621 580 Eilean Siar Median* 405 330 364 358 334 Std. Deviation 31 29 34 15 16 Minimum 344 273 296 322 289 Maximum 475 380 443 391 367 Total Median* 468 381 433 389 349 Scotland Std. Deviation 113 104 131 67 62 Minimum 201 175 145 248 215 Maximum 1029 877 1053 639 581

33
Table 4.2: Degree of Variation in Median Income Measures by Measure and Selected Local Authority (coefficient of variation*)
Variation in Median Gross Net
1st Benefit Net Equiv Net Equiv
Household Unit before hsg after hsg Income 2008 £pw £pw £pw £pw £pw Edinburgh 19 23 25 19 19 Falkirk 20 25 26 16 16 Fife 18 24 25 15 15 Highland 13 17 18 11 12 Glasgow 24 28 34 21 21 North Lanarkshire 21 26 28 15 15 East Renfrewshire 18 23 22 15 16 Eilean Siar 8 9 9 4 5 Scotland 24 27 30 17 18
* standard deviation as a percentage of the average of ‘medians’ across zones in each local authority.
Glasgow appears to show high relative variability of income, particularly in terms of total income and notably in terms of FBU income (which excludes means tested benefits) (Table 4.2). This would be compatible with a picture of a city which, like Edinburgh, has big contrasts between affluence and poverty, but with the overall average slanted more towards the poverty end. East Renfrewshire has some high standard deviations in absolute £ pw terms, but as a percentage of the authority median they are quite moderate (similar to Edinburgh and Fife). North Lanarkshire shows similar or greater relative variability. Eilean Siar stands out for displaying a notably low level of variability between zones in average income.
It is worth offering a geographical interpretation of the finding that the larger cities have more variability of income than the most rural and remoter island areas. Edinburgh is a large city and large cities generally have the potential for greater segregation or polarisation in terms of residential location by income level, particularly when the geographical unit of measure is uniform in size and relatively small, as with datazones. By contrast, authorities comprised mainly of rural areas and small towns are inherently more likely to contain variation between individual households within these datazones – in a rural area a datazone would well comprise a village and its hinterland.
The most extreme datazones are represented by the ‘maximum’ and ‘minimum’ values in Table 4.1 They are not always in the local authorities which are most extreme in terms of averages, although they are more likely to be in one which combines extremely low or high average income with high variability. Thus, it turns out that the lowest zones for average income are all in Glasgow across the five

34
measures (values shaded in yellow in Table 4.1). However, the highest zones in Scotland for average income are not in Edinburgh, but (depending on the measure) in East Renfrewshire, Aberdeenshire, Fife, or North Lanarkshire.
The poorest zone in Glasgow has a median total income £85 per week lower than the poorest zone in Edinburgh. However, comparing the poorest in terms of equivalised income the difference is only £15 per week. This comparison, like other differences underlined above between total and equivalised comparisons, shows the importance of household composition. In this instance, the relevant zone(s) in Edinburgh must have larger household size than the comparable Glasgow zone(s).
Comparing Poverty Measures and Local Authorities
Table 4.3 compares the level and variability of five poverty measures for the same local authorities. Each measure refers to the percentage of households in a datazone who are below that poverty threshold. Because the summary statistics are weighted by the relative size (number of households) in each datazone, the overall average does represent the percentage of households in the local authority as a whole who are poor.
The big picture is that our four case study local authorities have rather similar levels of poverty on average. Edinburgh and Fife have slightly more low income households than Highland; Edinburgh and Falkirk have slightly more materially deprived households than Highland, but when low income and material deprivation are combined Highland appears to have slightly more. Using SIMD 2012 low income score, Falkirk and Fife have slightly more than Edinburgh and Highland.
When we look at the selected wider comparators, we find that Glasgow has much more poverty on average on all measures. North Lanarkshire is similar to our cases on low income but a bit worse on material deprivation, combined deprivation & low income, and SIMD. East Renfrewshire is better on all measures. Eilean Siar is a bit worse on low income BHC, similar on low income AHC, better on material deprivation, worse on combined deprivation, and similar on SIMD.
In proportional terms, Edinburgh has the most variable low income poverty incidence (Table 4.4.), with relatively low variability exhibited by Highland and very low variability in Eilean Siar. On material deprivation, Fife has as much variability as Edinburgh, while East Renfrewshire has dramatically higher variability, Glasgow and North Lanarkshire having lower relative variability. This is also reflected in the combined measure, for which East Renfrewshire has the highest variability followed by Edinburgh.
However, the indicator which is overall most variable is SIMD 2012. Nevertheless, the differences in relative variability between authorities reflect those just described for material deprivation and combined – highest in East Renfrewshire and Edinburgh, lowest in Eilean Siar, and quite low in Glasgow and North Lanarkshire.

35
Table 4.3: Summary Statistics for Poverty Measures Comparing Case Study and Selected Other Local Authorities in Scotland (percent of households)
Households Low Income Low Income Material Combined
SIMD2012
Local 'Poor' Before Housing After Hous-
Deprivation Low Inc Low
Authority on various Costs Ing Costs (lack 4+) Depriv'n Income Measures % % % % % % Edinburgh Mean 19% 22% 18% 5% 11% Std. Deviation 6% 7% 9% 4% 9% Minimum 6% 8% 4% 1% 1% Maximum 38% 45% 34% 18% 42% Falkirk Mean 18% 18% 17% 6% 14% Std. Deviation 4% 5% 8% 4% 9% Minimum 7% 8% 3% 1% 1% Maximum 26% 28% 30% 13% 37% Fife Mean 19% 20% 16% 6% 14% Std. Deviation 4% 5% 8% 4% 9% Minimum 7% 9% 3% 1% 0% Maximum 31% 36% 32% 14% 47% Highland Mean 17% 18% 16% 7% 11% Std. Deviation 3% 3% 7% 4% 7% Minimum 6% 7% 6% 1% 1% Maximum 30% 30% 43% 31% 39% Glasgow Mean 24% 26% 25% 11% 22% Std. Deviation 6% 7% 8% 5% 12% Minimum 9% 10% 5% 1% 0% Maximum 38% 46% 37% 20% 65% North Mean 19% 20% 20% 9% 18% Lanarkshire Std. Deviation 5% 5% 8% 4% 9% Minimum 4% 5% 4% 1% 2% Maximum 29% 32% 34% 16% 48% East Mean 14% 14% 11% 3% 9% Renfrewshire Std. Deviation 3% 3% 8% 4% 8% Minimum 8% 9% 3% 1% 1% Maximum 23% 26% 34% 15% 41% Eilean Siar Mean 22% 20% 14% 8% 13% Std. Deviation 2% 1% 3% 2% 3% Minimum 19% 17% 8% 4% 7% Maximum 29% 23% 23% 17% 18% Total Mean 19% 20% 17% 7% 14% Scotland Std. Deviation 5% 6% 9% 4% 10% Minimum 4% 5% 3% 1% 0% Maximum 38% 46% 43% 31% 65%

36
Table 4.4: Degree of Variation in Proportion of Households Poor by Measure and Selected Local Authority (coefficient of variation*)
Variation in % Low Income Low Income Material Combined SIMD2012 'Poor' on Before After Deprivation Low Inc Low various measures Housing Housing (lack 4+) Depriv'n Income Edinburgh 30 33 49 84 81 Falkirk 25 25 47 56 62 Fife 23 24 50 61 64 Highland 18 20 44 61 61 Glasgow 26 27 33 44 54 North Lanarks 24 24 39 42 52 East Renfrews 20 23 75 103 90 Eilean Siar 10 7 21 30 24 Scotland 27 30 50 65 69 * standard deviation as a percentage of the mean across zones in each local authority.
Table 4.3 also looks at extremes of poverty. The datazones with the lowest incidence of low incomes (BHC and AHC) have about 4-5% of households ‘poor’, which is an interesting insight in its own right – implying that there are no neighbourhoods which are exclusively high income; there are always a few households present whose incomes would count as low. These minimum low income zones are to be found in Fife and in North Lanarkshire, echoing some of the earlier findings on extremes in terms of income levels.
Maximum levels of low income poverty are 38% (BHC) and 46% ( AHC), both of which occur in Glasgow. However, Edinburgh runs extremely close on this with 38% and 45%. Fife has the next worse examples among the authorities considered here with 31% and 36%
Using the material deprivation approach we find that poverty incidence ranges at datazone level between 3% and 43%, comparable with low income. The lowest incidence level is found in Falkirk, Fife and East Renfrewshire, while the highest is actually in Highland (43%, vs 37% in Glasgow and 34% in Edinburgh, North Lanarkshire and East Renfrewshire).
Patterns of Poverty Distribution
There are distinctive patterns in the distribution of poverty rates across zones within different local authorities, which are brought out more by Figures 4.5-4.6. These show the poverty rates at each local decile on that indicator. Figure 4.5a looks at the low income BHC indicator in our four case studies. The greater extent of variation in Edinburgh is apparent, in particular contrasted with the lesser variation in Highland.

37
It can be seen that although at the 50th decile Fife has a higher score, in the poorest 20% of zones (80th and 90th decile) Edinburgh has clearly higher poverty rates.
Figure 4.5a: Low Income Poverty Levels across Local Deciles of Datazones in four Case Study Local Authorities
Figure 4.5b: Low Income Poverty Levels across Local Deciles of Datazones in four Comparator Local Authorities
Figure 4.5b compares the same analysis for the four contrasting authorities, on the same scale. Glasgow has not only a higher rate of poverty in the worst zones but a bunching of high rates across the top half of the distribution, rather than a rapid drop in poverty rates as you move away from the worst areas. North Lanarkshire’s worst areas are less bad than Glasgow’s, but quite comparable with Fife’s; however, like Glasgow there is something a a bunching of areas with quite high poverty in the top half of the distribution, and only a few low-poverty zones at the bottom. East Renfrewshire shows almost the opposite, with most zones on below-average poverty and quite similar, and just a few zones in the worst 10% standing out, although even these are not as a group very poor. Finally, Eilean Siar shows a relatively uniform
Deciles of Zones on Low Income Poverty BHC by Local Authority
0%
5%
10%
15%
20%
25%
30%
35%
40%
Edinburgh Falkirk Fife Highland
Authority
Prop
ortio
n Po
or
90
80
70
60
50
40
30
20
10
Deciles of Zones on Low Income Before Housing Costs for Selected Other Local Authorities
0%
5%
10%
15%
20%
25%
30%
35%
40%
Glasgow North Lanarkshire East Renfrew shire Eilean Siar
Authority
Perc
ent L
ow In
com
e 90
80
70
60
50
40
30
20
10

38
pattern whereby the worst tenth of zones have 25% poor while the best tenth still have nearly 20% on low income.
Figures 4.6a and b provide a similar analysis for material deprivation.

39
Figure 4.6a: Material Deprivation Levels across Local Deciles of Datazones in four Case Study Local Authorities
Figure 4.6b: Material Deprivation Levels across Local Deciles of Datazones in four Comparator Local Authorities
Material deprivation has a similar average value and range of variation between extremes as low income BHC, although its overall variability measured by coefficient of variation (Table 4.4) is noticeably higher. This could mean that it is a better discriminator of areas which are really likely to be suffering poverty. This greater variability is clearly reflected in Figure 4.6a in relation to our case study authorities. Edinburgh again shows the highest peak and a wide variation across the range, with a similar lowest decile score to the other authorities. This time the worst 30% of areas stand out from the rest, as at the other end of the scale do the beset 10 or 20%. In Falkirk and Fife the worst zones are slightly less deprived but there is a bunch of zones up to the 40th decile or more which have above average deprivation, while the top one (Falkirk) or two (Fife) deciles stand out. Highland resembles Edinburgh in that it is the top three deciles which stand out, although their level of deprivation is lower.
The patterns for the four comparator authorities in Figure 4.6b show similar contrasts as were found with low income. Glasgow has higher top end values and a bunching of zones with high scores up to about the 6th decile. North Lanarkshire
Deciles of Zones on Material Deprivation
0%
5%
10%
15%
20%
25%
30%
35%
40%
Edinburgh Falkirk Fife Highland
Authority
Perc
ent M
ater
ially
Dep
rived 90
80
70
60
50
40
30
20
10
Deciles of Zones on Material Deprivation in Selected Other Authorities
0%
5%
10%
15%
20%
25%
30%
35%
40%
Glasgow North Lanarkshire East Renfrew shire Eilean Siar
Authority
Perc
ent M
ater
ially
Dep
rived 90
80
70
60
50
40
30
20
10

40
shows some similarity in terms of bunching but at a lower level of poverty, and notably lower-poverty decile at the other end of the scale. However, six of East Renfrewshire’s deciles are at this level of below 7% deprived, although its worst decile has around 26% deprived (similar to Edinburgh’s second-worst decile). Eilean Siar appears as usual rather more uniform, with a rate of material deprivation which appears quite moderate (between 10% and 15% deprived up to the 90th decile). In general this island authority’s problem appears to be more one of a generally low income level rather than prevalent or concentrated material deprivation.
The SIMD 2012 scores can be plotted in a similar way, and tend to generate a similar pattern to material deprivation, but with slightly wider variation and less bunching.
The ‘combined deprivation’ measure tends to show a skewed distribution, with a few high scores and many very low minimum scores. We have some concerns that the highest individual zone scores on this indicator might be ‘outliers’, that is cases where the predictive formulae yield an extreme result, and would caution against putting excessive weight on extreme scores for an individual zone. [this outlier is datazone S01003743 which is in the Izone ‘Badenoch & Strathspey South’]
These patterns are interesting and potentially revealing, particularly when interpreted with local knowledge through inspection of detailed results in Annexes G and F. The bunching of higher scores on material deprivation is generally associated with large public sector housing areas. Areas with very low scores tend to be mature private residential suburbs with large, valuable houses or newly developed private estates catering to two-earner professional households.
Demographic sub-groups
Models have also been developed for selected income and poverty measures for three sub-groups of households: families with children, working age households without children, and older households. These models are based on the analysis of Understanding Society for England and Scotland combined, excluding London.
Table 4.5 shows the mean scores on three measures from this study – median net equivalent income before housing costs (BHC), low income (<60% median) BHC, and material deprivation (including child items) – plus the recent HMRC estimate based on out-of-work benefits and tax credits. Edinburgh has higher median income while the other three areas are quite similar. Low income poverty for families is very similar across the all four cases, but slightly lower in Falkirk and Highland, with the Scotland average slightly above these four authorities. Material deprivation for families is also very similar in these four cases, which are again somewhat below the Scottish average. The HMRC measure shows Fife similarly higher to Edinburgh, with Highland markedly lower.

41
Table 4.5: Average scores for income and poverty measures for families with children by local authority cases
Local Authority Families Families Families Children Median Equiv Low Income Material Low Income Income BHC Before Hsg Deprivation Benefits/Credits £ pw Cost % >3 item % HMRC % Edinburgh 412 17% 17% 19% Falkirk 389 16% 17% 17% Fife 376 17% 17% 19% Highland 382 16% 17% 14% Scotland 377 18% 19% 19%
Note: ‘BHC’ means ‘before housing costs’.
Figure 4.7: Variation in Child Poverty Measures by Local Authority
Source: Based on modelled estimates, except HMRC.
Figure 4.7 shows the degree of variation for these indicators, again using the coefficient of variation to normalise each indicator relative to its mean value. Median income shows the least variation, with highest variation in Edinburgh and lowest in Highland. Low income poverty (BHC) shows somewhat higher variation with a similar ranking. Material deprivation shows markedly higher variation, with a similar ranking. The HMRC indicator shows the highest relative variation, still with Edinburgh highest but now with Highland in second place.
Table 4.6 and Figure 4.8 show a comparable analysis for working age households without children. The story on relative levels of income and low income BHC is similar. However for material deprivation, the average level is markedly lower in Edinburgh, while Falkirk and Highland are both noticeably higher. There is no specific benefit-based comparator indicator.
Variation in Poverty Measures for Households with Children (Coefficient of Variation, %)
0.0%10.0%20.0%30.0%40.0%50.0%60.0%70.0%80.0%90.0%
100.0%
R o Scotland Edinburgh Falkirk Fife Highland
Local Authority
Median Equiv Inc BHC
<60% Median Equiv Inc BHC
Material Deprivation
HMRC Benefits/Credits

42
Table 4.6: Average scores for income and poverty measures for working age households without children by local authority cases
Local Working Age Working Age Working Age Authority Median Equiv Low Income Material Income BHC Before Hsg Deprivation £pw Cost % (< 3 items) % Edinburgh 508 17% 13% Falkirk 485 16% 17% Fife 468 17% 16% Highland 468 16% 17% Total Scotland 471 18% 17%

43
Figure 4.10: Variation in Working Age Poverty Measures by Local Authority
Source: Based on modelled estimates
As for variation, the story is similar to families for the first two indicators. For material deprivation, however, Edinburgh has high variation while Highland comes next highest.
The results for older households are shown in Table 4.7 and Figure 4.11. Some cautionary notes are in order here. The predictive models for older households are less good than those for the other two groups, although the US-based models are better than those previously tested on FRS and SHS. Although no benefit-based comparator is shown, data are available on pension credit which could be compared. However, tests indicated that pension credit did not improve the performance of the models. The material deprivation indicators used are the standard set available in US, not the recently-developed special set for older households applied in more recent FRS data. The issue of outlier values for material deprivation predictions at datazone level appears to be more serious for these older households (there is a number of outlying zones with implausibly high predicted values).
Average incomes for older households are higher in Edinburgh , followed by Highland, with Falkirk and Fife similar. Yet low income poverty is also higher in Edinburgh, with the other three areas similar. For material deprivation, average levels are markedly higher in Highland, and relatively low in Fife and Falkirk.
Variation in Poverty Measures for Working Age Households without Children
(Coefficient of Variation, %)
0.0%10.0%20.0%30.0%40.0%50.0%60.0%70.0%80.0%90.0%
100.0%
R o Scotland Edinburgh Falkirk Fife Highland
Local Authority
Median Equiv Inc BHC
<60% Median Equiv Inc BH
Material Deprivation

44
Table 4.7: Mean scores for income and poverty measures for older households by local authority cases
Local Authority Older House- Older House- Older House- Holds Median Holds Low Holds Mater Equiv Income Income Deprived BHC £ pw BHC % > 3 items % Edinburgh 379 23% 7% Falkirk 348 21% 6% Fife 347 22% 6% Highland 357 22% 10% Total Scotland 352 23% 7%
Figure 4.11: Variation in Working Age Poverty Measures by Local Authority
Source: Based on modelled estimates
Figure 4.11 shows that both average and low income scores for older households display low variance between datazones in all cases, although rather higher in Edinburgh. The material deprivation scores are more discriminating, showing quite considerable variation (relative to the rather low mean scores). Highland stands out for having much more variation in this case. (However, there is a problem of outliers apparent, particularly in Highland, with this indicator).
Correlations
At various points we have remarked upon similarities and differences between patterns based on examination of a number of local authorities’ results compared with Scotland as a whole. An emerging conclusion is that low income BHC tends to show less variation, with typically significant proportions poor even in affluent areas.
Variation in Three Poverty Measures for Older Households (Coefficient of Variation, %)
0.0%
20.0%
40.0%
60.0%
80.0%
100.0%
120.0%
R o Scotland Edinburgh Falkirk Fife Highland
Local Authority
Median Equiv Inc BHC
<60% Median Equiv Inc BHC
Material Deprivation

45
The material deprivation indicators seems to vary more and to provide more ‘discrimination’ between degrees of poverty. In this respect it could be seen as being more similar to SIMD or the HMRC measure for children.
Further evidence on similarity or difference between these indicators may be derived from correlations of scores across small areas (at datazone level) or groupings of small areas (‘cellcode’ areas used for assessing model precision, see Annex E). Taking indicators for all households, we can start by asking which are actually closely correlated with SIMD 2012 (low income score). Interestingly, the most closely correlated is percent of households with FBU income below £300 pw (r=0.889), closely followed by low income poverty after housing costs (AHC; r=0.880), followed by material deprivation (r=0.843), then by low income BHC (0.828) and by combined deprivation and low income (0.828).
Approaching it the other way, if we take the view that one or more of our indicators represents our ‘best’ or most ‘independent’ indicator or poverty, we can see how well other indicators (including SIMD) relate to it. There is a good case for either material deprivation or the combined indicator to be used in this way. Taking material deprivation, the most closely correlated indicators are the combined deprivation/low income measure (r=0.932), the SIMD low income score (r=0.843). and low income AHC or the median FBU income (both r=0.821). Taking combined deprivation/low income, the most closely correlated indicators are material deprivation (r=0.932), SIMD (r=0.828) and average equivalised income AHC (r=0.799).
When we look at the specific indicators for household groups, there is a close correlation between our combined deprivation/low income measure for families and the SIMD 2012 general low income score (r=0.932), which is (surprisingly) closer than the correlation with the HMRC measure based on benefits and tax credits (r=0.855). The correlation is also best with SIMD when looking at material deprivation for working age and older households, although the correlation is poor in the latter case (r=0.702).
We conclude this section by suggesting that this evidence does provide support for the use of SIMD 2012 (low income score) as a general measure of poverty, because it is closely associated with the best independent measures we can derive (material deprivation and combined) and also with poverty after housing costs and FBU incomes. Low income BHC has a different pattern, but this reflects a reality that there is a different pattern and that looking at low current income alone is not enough to fully pinpoint poverty. SIMD will be an effective way of ranking most if not all areas, but it may not give the best estimate of the actual percentage of households who are ‘poor’.
Mapping Incomes
Clearly all of the measures generated in this study are capable of being presented in map form. Maps 1 and 2 illustrate this, by showing a standard mapping of banded values of average equivalised income BHC and the percentage of low income

46
households BHC, for the four case study authorities. Note that the scales are different for each authority, but that the bandings are the same.

47
Map 1: Median Incomes (BHC) in Edinburgh, Falkirk, Fife and Highland
Map 2: Low Incomes (BHC) in Edinburgh, Falkirk, Fife and Highland

48
Income distributions
The suite of indicators modelled for all zones in Scotland includes two income distributions across individual households within each zone, measured by the percent of households with incomes less than five band levels (£300 pw up to £800 pw). These are provided for gross household income and FBU income. The models used to generate these are essentially similar to those used for low income, and they are generated for Scotland within the SHS dataset but controlled to FRS values for 2008 (see Annex C).
The resulting values are included within Annex G. Figures 4.12 and 4.13 below illustrate the outputs of these income distribution estimates, contrasting Edinburgh and Highland. The black line with yellow triangles shows the average position for the city, with 28% of households having less than £300 per week (gross), 49% of households having less than £500, and just over 71% having less than £800 . The red line at the top shows the proportions in the worst-off datazone, where 62% have less than £300, 92% less than £500 and 98% less than £800. The blue line at the bottom shows the situation in the best-off datazone in Edinburgh, where only 10% have less than £300, 18% have less than £500, and 29% have less than £800 (thus implying that 71% have more than £800, or £41,600 pa).

49
Figure 4.12: Household Income Distributions In the Poorest and Richest Neighbourhoods and Overall in Edinburgh
Figure 4.13: Household Income Distributions In the Poorest and Richest Neighbourhoods and Overall in Highland
Affordability
The distributions of FBU income are particularly intended to support the estimation of housing affordability indicators. This indicator captures the income likely to be taken account of by a mortgage lender, i.e. discounting means tested benefits and the income of other adults than the householder or partner. Ideally it would be calculated for a younger age group of households rather than all households (e.g.
Gross Household Income Distribution At Zonal Level - Edinburgh
0.0%
10.0%
20.0%
30.0%
40.0%
50.0%
60.0%
70.0%
80.0%
90.0%
100.0%
200 300 400 500 600 700 800 900
£ /week
Cum
ulat
ive
% b
elow Min DZ
Min IZ
Average
Max IZ
Max DZ
Gross Household Income Distribution At Zonal Level - Highland
0.0%
10.0%
20.0%
30.0%
40.0%
50.0%
60.0%
70.0%
80.0%
90.0%
100.0%
200 300 400 500 600 700 800 900
£ /week
Cum
ulat
ive
% b
elow Min DZ
Min IZ
Average
Max IZ
Max DZ

50
‘under 40s’, as in Wilcox and Bramley 2010, but adjustment factors could be applied for this purpose).
Just to illustrate the potential of this approach, Table 4.8 below shows the estimated proportion of all households with enough income to buy a 2 bedroom home at the lower quartile price prevailing in 2008.
Table 4.8: Distribution of ‘Affordability’ by Zone and Local Authority (percent of all households with enough income to afford 95% mortgage on lower quartile* two-bedroom house, 2008)
Local Lowest Median Highest Authority DZ DZ DZ Edinburgh 8 30 71 Falkirk 12 50 88 Fife 18 50 95 Highland 7 44 67 Dundee 13 32 80 Glasgow 5 30 85 North Lanarkshire 13 50 90 East Renfrewshire 23 57 88 *Note: lower quartile price across whole local authority
Table 4.8 suggests that in this time period East Renfrewshire has the greatest affordability, that Falkirk, Fife and North Lanarkshire have a similar rate (around 50%) while Edinburgh and Glasgow are similarly low (at 30%).
‘Anomalies’
Inspection of the detailed indicator scores in Annex G may help to clarify views, based on local knowledge, about the general credibility of these results. This may also reveal possible anomalous cases. The IZ level tables are ranked on one of the component indicators with the poorest areas at the top, to facilitate this process. Anomalous area scores may arise because of (a) inadequacies of the predictive models, which may fail to include relevant characteristics; (b) unusual combinations of characteristics; (c) the reliance on linear models, particularly at the extremes; (d) areas which have changed population composition a lot since 2001, chiefly due to new housing development or redevelopment, although we do now try to take account of this (as explained further below and in Annex A).
The most obvious anomalies are areas which appear to have quite high incidence of low income poverty yet which have relatively low scores on material deprivation and SIMD. Examples include Marchmont-Sciennes-Meadows in Edinburgh, and St Andrews Central in Fife. Obviously, these areas have a lot of students, who would typically have fairly low incomes, would not be eligible for benefits, and would perhaps not report a lot of material deprivation. So the result may still be ‘right’ even though it is an example of (b).
51
Other areas to look at might be those which have rather high predicted material deprivation (and low income) but low scores on the SIMD income score. Examples include parts of Rosyth, Dunfermline and Glenrothes in Fife and some remoter parts of Highland (Sutherland NW, Lochalsh, Lochaber). While these may be reflecting a genuine aspect of remoter rural poverty, it is interesting to note that it is not particularly reflected in the low income poverty scores.
Geographical differences in the incidence of different measures of poverty are discussed further in Chapter 6.
Changes since 2002
It is also possible to look at changes over the period 2002-2008, using the measures derived from SHS (see ‘Compar’ sheet in Annex G). Relatively large changes seem to be most in evidence in Edinburgh. The most marked reductions in poverty tended to be associated with areas experiencing quite a bit of new housing development in the inner city and some of the poorer public housing estates subject to regeneration. Intermediate zones which saw a large number of private completions and either or both of large increases in income or reductions in poverty include: Abbeyhill/Meadowbank/Marionville; Bonnington/Pilrig; Broughton; Gorgie East; Great Junction Street; Greendykes/Niddrie Mains; Leith Docks; Lorne; Southside/Canongate.
Relatively few areas stand out in Falkirk but higher income increases are suggested in Bainsford and Langlees and Falkirk Town Centre. In Fife, higher income increases or poverty reductions are noticeable in Ballingry and parts of Kirkcaldy and Methil. In Highland, income increases/poverty reductions are quite common and include Alness, Caithness NE and S, Invergordon, Inverness Merkinch (the most deprived area), Seaboard, Skye NW and most of Sutherland. Poverty seems to have increased noticeably in Inverness Drakies.

52
Chapter 5: Determinants of Income and Poverty
In this Chapter we first report on the main findings from the ‘stage 1’ modelling of incomes or poverty incidence using micro data from three national surveys. We then discuss some implications in terms of different contexts and changes over time.
Levels of Explanation
The models for gross and first benefit unit income explain up to three-fifths of total variation in income , which is quite a high proportion for a micro model for something which is as variable as income. The models for net equivalised income explain a lower proportion of the variance (rather under two-fifths), although it should be noted that this measure of income varies less. However, at the level of small area groupings comparable to Datazones, correlations reported in Annex E imply that the models explain between 85% and 96% of variation at this level.
It is also found that most of the work in these models is being done by the individual household level variables rather than the LA area level variables; i.e. there are more of the former type of variables included and their effects are generally stronger and more significant. This supports the general approach we have adopted, of using compositional information at the individual level. Levels of explanation are somewhat lower in the US dataset than in the other two, although this seems to be better for some of the poverty models for demographic sub-group.
Important Drivers
Table 5.1 summarises the models used to predict average income and low income within the SHS and that used to predict material deprivation within US. Generally, similar models are used in each survey, but subject to variation in exactly which variables are available. Models were first developed using FRS; then similar models were applied to SHS, and refined; finally comparable models were applied to US.
Across these models, the variables which have the largest and most significant effects are related to economic activity – whether anyone in the household is working, whether there are 2 or more workers, the number of part-time workers (negative) - and occupational class – particularly professional-managerial (soc13). Car ownership is generally significant when included (not available in FRS). Certain demographic effects apply consistently, particularly the finding that older (over retirement age) households have higher incomes after allowing for all the other factors in the model (economic activity etc), and the lower incomes of non-white/UK ethnic groups. Very young household heads (under 25) have lower incomes. Measures of housing consumption including number of rooms, detached houses and flats, and living in a more valuable home (Council Tax Bands G-H, versus A-B), owner occupation (implicitly), and LA area level house prices, are associated with higher income.

53
Other demographic variables have different effects depending on the measure of income used, particularly because of the effects of equivalisation. So larger households have higher total income but lower net equivalised income; single person households have lower total income but higher equivalised; multi-adult households have higher total but lower ‘first benefit unit’ (FBU) income; lone parents only have significantly lower incomes in the FBU analysis (which excludes their income-related benefits). However, lone elderly households have lower incomes across all three measures. Although receipt of income-related benefits reduces income in each case, the size of the reduction is much greater with the first benefit unit measure (because here the income is discounted, whereas in the other cases the benefit income is counted and helps to offset the low level of income from other sources).
Area Effects
The ‘area level’ effects include in some cases modest negative effects from sparsity (rurality), an expected positive effect from the (log of) median earnings, an (unexpected) positive effect from social renting share, a positive effect from higher occupational group share, a positive effect from the local employment rate (of working age), and the positive effect of local house prices as noted above. IMD/SIMD indicators make a moderate contribution in this context, with the education score having a bigger impact than the low income score in models for average income, and the access (distance to services) score having a moderate positive (worsening) effect on poverty in Scotland.
In addition, it should be remembered that the ‘controlling’ process based on groupings of similar area types provides a further way of taking account of systematic area effects.
Drivers of Poverty
Broadly, models for poverty incidence see the same variables having similar but opposite effects, with some detailed differences. Larger households, households with no car, and nonworking households are generally much more likely to be poor. In this instance(S)IMD low income score is more important than the education score in this context, but it should be noted that in some of the models actually receiving income-related benefits is negatively associated with poverty, once other factors have been controlled for (the benefits are serving to alleviate poverty).
The models for income and, more particularly, for poverty can be improved somewhat by including indicators for households having no other income sources (e.g. savings/investments), no house contents insurance because can’t afford it, and reporting various symptoms of financial difficulty. Some more complicated multi-criteria variables capable of replication in the census have also contributed something to the explanation. The former variables can only be incorporated in the synthetic stage 2 models by using ONS ‘Group’ level values, but the multivariate census counts have been obtained at small area level for Scotland, and could play a stronger role post-2011 Census results being available.

54
Table 5.1: Summary of effects of explanatory variables in predictive models for average income, low income and material deprivation
Variable Variable Effect Effect Effect
Short Name Description Ave
Income Low
Income Mater Depr
SHS SHS US ageu25 Propn HRP aged 16-24 -- + - eldhh Propn HRP aged 65+ (-)/+ + -- working Someone working +++ --- - hh2wkr 2+ workers +++ -- - hihpoorhlth HRP in poor health + nptwkr No. of part time wkrs -- ++ nlti No. with l.t. illness/disab - (+) Socr Social renting (-) Privr Private renting + - - soc13 Professional/mgt occups ++ - - soc67 Routine occupations - + + soc89 Unskilled & unclass occs - + Hhsize Household size ++ + ++ hh1 One person non-eld hhd -- hh1k Lone parent hhd - - + hh3 Multi-adult hhd ++ - - hh1p Lone elderly hhd -- - rooms Number of rooms ++ irben Income-related benefit ++ - ++ nonwhhh Non-white household - (-) hnocar No-car household -- ++ (+) hcars2 Household with 2+ cars ++ - - disben Disability benefit ++ + nocent No central heating + elddisben Elderly disab benefit -- noothinc No other income -- ++ ++ nohci No home contents insur - + +++ findiff Financial difficulty - + +++ famnocar Family with no car + femylp2dc Female lone par 2+ch - (-) yhrpuninrnt Young HRP not work, rent + mhrp5064in Male HRP 50-64 inactive + ncplhin Couple wkg age inactive + + famnotwork Family not working + ctbab08 Council Tax Bands A&B - + ctbgh08 Council Tax Bands G&H + educscr SIMD Education Score - + accscr Geographic access score - +

55
lapsocr LA % social rent + - tprice08am House price 2008 £m + - + pelt300a Propn earnings <£300 + dzspars DZ level sparsity +
Note: +/- indicates direction of effect, number of +/- signs indicates size and significance of effect measured by standardised beta coefficient and t-statistic respectively.
Interpretation
The broad picture of what drives variation in local incomes from this summary of the models is in many respects consistent with what we would expect. The major drivers of variation in prosperity are levels of employment and economic activity, and the quality/skill level of jobs. There are recognisable structural relationships between household composition and incomes, whereby for example households with more (adult) household members are likely to have more total income. Some combinations of household and economic circumstances are likely to increase the risk of poverty, for example being a female lone parent with 2 or more dependent children.
However, the relationships in these regression models should not all necessarily be regarded as directly causal. They indicate that there is a systematic correlation between each variable included and the income/poverty measure in question, while taking account of the other variables in the model. Some variables are justified for inclusion because they help us to make a more accurate prediction (or estimate) of incomes in different areas – we are using regression here for prediction, not for determining causality. There are some obvious instances where one would say that the association arises because of causality running in the other direction. Car ownership is high because incomes are high, rather than the other way round (although there may be some causation both ways – e.g. car ownership may enable people to work or earn more). House prices and Council Tax bandings are other examples of indicators of households or areas who have been able to achieve a high standard of housing consumption, probably because they have a high income. At the same time, owning a valuable house is indicative of a higher general level of wealth, which is likely to be associated with having other sorts of assets which are protective against suffering poverty and material deprivation. Variables like ‘no home contents insurance’ and ‘financial difficulty’ are clearly picking up the consequences of low income, although there may be an additional element of poor financial management/judgement involved.
It is interesting to note that the Education domain of (S)IMD is more effective as an area-level predictor of average income levels than the income or employment domains. Our interpretation is that this better reflects occupational class, qualification and skill-based earning potential, which is more important further up the income distribution, as reflected in average measures. The income domain becomes more relevant when predicting poverty, but is also included in the stage 2 model as the equivalent of the individual variable ‘receives income-related benefits’.

56
It is also important to consider other cases where the direction of effect is not necessarily as expected. For example, older (retirement age) households have higher incomes in some of the models, and less material deprivation, allowing for the other factors included. This may reflect a broad tendency for today’s retirement generation to enjoy a better economic position than younger working age households, due to more generous benefit rates, accumulated occupational pensions and housing and other assets. However, the material deprivation items are not particularly geared to older people. The rural indicators (access score or sparsity) tend to show a negative effect on income, but this may be acting partly to compensate in the model for the effects of the car ownership variable (in rural areas people may be forced to run a car even when their income is low). Social or private rented tenures do not necessarily have the negative effect on predicted incomes that might be expected. This suggests that most of the factors associated with the low incomes of social tenants are captured elsewhere in the model, in terms of occupation and work intensity, and might be interpreted as evidence that tenure itself is not causal. Disability is not strongly related to income, perhaps because of the effects of disability-related benefits in neutralising its impact.

57
Chapter 6: The Incidence of Benefits, Low Income, and Material Deprivation
Motivation
A significant motivator for this study has been to try to gain a greater understanding of what lies behind the differences between alternative measures of poverty. While in what has been presented so far there have been apparent differences revealed in the spatial pattern of incidence of measures based on modelling from surveys and measures based on administrative data on claiming of benefits and tax credits, we have not discussed the reasons for these differences in detail. It is useful to identify the factors which could account for such differences, a priori, and then to drill down into the survey data itself to see what this suggests about the degree of overlap and which groups are most affected.
Reasons for Differences
Firstly, there may be differences between survey measures of benefit receipt and administrative counts. Surveys like SHS and US suffer from some limitations in the coverage and accuracy of the recording of benefit receipt. The FRS is probably best, given its purpose and thoroughness, but there may still be issues arising from FRS non-response bias, sampling error, poor recall by FRS respondents, or possibly fraud or overclaiming in the actual takeup figures.
Secondly, there may be differences within the survey (e.g. FRS) between receipt of income-related benefits and being on a low income against the 60% of median net equivalent income. These could be due to the ineligibility of certain low income groups for benefits, non-takeup of benefits or tax credits, as well as differences in the effects of household composition and equivalence scales (which push some groups but not others just over the thresholds). Differences of this kind are crucial to the debate about the relative merits of the different approaches and were considered in an earlier study by Bramley et al (2000).
Thirdly, there may be differences between an independent measure of poverty, material deprivation, and poverty measured by either low income or receipt of benefit. These differences could be due to cost of living, assets, longer term experience versus transitional low income, availability of family support (gifts etc), benefits in kind, and the grey/black economy.
Overlaps at Individual Level
It is clear from analysis of all of the surveys that the overlaps at individual household level are not as great as one might expect, and so these issues are potentially important. We illustrate this here in Table 6.1 using simple two-way tables from one of the surveys (US).

58
Table 6.1: Overlap between Poverty Incidence at household level (% of all households, Understanding Society, England & Scotland excluding London 2008)
Income-related
benefits? Total No Yes
Low Income BHC?
No 65.6% 11.4% 77.1% Yes 16.0% 7.0% 22.9%
Total 81.6% 18.4% 100.0%
Income-related
benefits? Total No Yes
Materially Deprived? (> 3 items)
No 73.2% 10.2% 83.4% Yes 8.4% 8.2% 16.6%
Total 81.6% 18.4% 100.0%
Materially Deprived (>3
items)? Total No Yes
Low Income BHC?
No 66.5% 10.6% 77.1% Yes 17.0% 6.0% 22.9%
Total 83.4% 16.6% 100.0%
Taking the three generic types of measure, which have a similar general level of incidence, we find that between 66% and 73% of households are not poor on either of each pair of measures. The proportion who are poor on both of each pair is only between 6% and 8%. The ‘off-diagonal’ cells in each sub table contain a lot of cases. For example, 11% of households are receiving income-related benefits but not on an income below 60% of the median, while 16% are below 60% but not receiving income related benefits. These off-diagonal proportions are a bit less when material deprivation is compared with benefit receipt, but they still add up to 18.6%.
The Area Dimension
From the FRS analysis we found that areas where FRS low income estimates are lower than the actual claims based figures include Regional Centres (cities) in the south and Scotland, centres with industry in the midlands, prosperous small towns and other areas in southern England, and rural areas in the north. Areas where FRS estimates are higher include centres with industry in the north, prosperous small towns in the midlands, north and Scotland, and poorer industrial hinterlands in Scotland.
Areas where low income poverty according to the official government measure (<60% BHC) is lower than the benefit claims based estimate of poverty include: regional centres in the south (also London, not shown in table); Scottish cities,

59
particularly the more prosperous ones; new and growing towns in south. Areas where surveyed low income poverty is greater than benefit-based poverty include: centres with industry in midlands and north; prosperous small towns in midlands, north and Scotland; rural Scotland; poorer industrial hinterlands in Scotland.
Areas where material deprivation indicates greater poverty than the benefit based measures include: regional centres (cities) in most regions including Scotland (especially poorer cities); prosperous small towns in midlands and north; new growth towns in south; rural areas in south and north of England , but not Scotland; industrial hinterlands in north and Scotland (especially poorer hinterland areas).
Who are the ‘Non-Benefit Income-Poor’?
We have shown that there are a lot of households who are income poor but not on benefit, and others who are on benefit but not income poor. But who are they? We can look at evidence from the surveys to illuminate this.
Table 6.2 takes four of the main ‘non-overlapping’ groups and reports their incidence against a range of selected household characteristics where there are noticeable differences from the overall average position, based on FRS for England and Scotland.
The non-benefit income poor group are much more prevalent among older households and less so among families, although the differences are narrowed when we take AHC poverty. However, the non-benefit materially deprived are more common among families, as are the non-low-income materially deprived.
Non-benefit income-poor households are much more common among non-working households, but these would be predominantly retired. For the same reason this situation is much more common for outright owners, although few of these are non-benefit materially deprived. A lot of renters are non-benefit income-poor, when using the AHC measure of low income. These would include both low paid social renters and private renters facing higher rents.
Certain household types are more likely to be non-benefit income-poor, particularly single adults and pensioners. Lone parents are more likely to be materially deprived even if not on benefit or not technically low income. Couples with 3+ children are somewhat more likely to be non-benefit income poor (AHC) or non-benefit materially deprived.
Younger households are more likely to be non-benefit income poor AHC. Older households (75+) are very much more likely to be non-benefit income-poor BHC.
Nonwhite households (HRPs) are somewhat more likely to be in all of the non-overlap groups identified here.

60
Table 6.2: Households in Non-Overlapping Poverty Categories by Selected Household Characteristics (% FRS, England & Scotland excl London, 2008)
Not on Not on Not on Not Low Selected Household Benefit Benefit Benefit Inc Characteristics Low Inc Low Inc Mater Mater BHC AHC Depriv Depriv Hhd w Dep Chn 5.8% 11.2% 11.0% 9.0% Other Wkg Age Hhld 13.3% 16.6% 6.6% 3.6% Older Post-RA Hhld 23.6% 18.1% 3.2% 2.0% Not Working 27.8% 24.4% 6.9% 4.1% Working 6.6% 10.4% 6.8% 5.0% Owns it outright 22.6% 14.5% 2.3% 1.5% Buying w mortgage 5.7% 8.9% 5.2% 4.1% Rents 15.2% 25.5% 14.6% 9.4% Single Ad 20.4% 24.6% 10.3% 4.6% Lone Parent 4.9% 11.7% 16.9% 15.5% Cpl+3kid 8.5% 15.0% 12.7% 9.2% Lone Pens 28.1% 20.2% 4.1% 2.6% Age 16 to 24 14.8% 26.1% 10.2% 5.7% Age 75 to 84 27.2% 19.2% 2.2% 1.5% Age 85 or over 29.5% 22.4% 1.2% 0.9% Non-White HRP 18.2% 23.2% 12.9% 7.1% Total 14.3% 15.5% 6.8% 4.7%
Geographical Incidence
Table 6.3 looks at the incidence of the non-overlap groups as between income poor and benefit receiving across the deciles of low income deprivation in Scotland (based on SIMD 2012), this time using SHS. This shows that as expected benefit receipt is strongly correlated with SIMD-based low income deprivation, even benefit receipt by households who are not on low income according to the survey. By contrast, non-benefit income-poor (BHC) households occur relatively uniformly across all deciles, except for a slight falloff in the least deprived tenth. Non-benefit income poor (AHC) shows some modest decline in four deciles with the least low income according to SIMD 2012, but is still relatively uniform.

61
Table 6.3: Non-Benefit Income-Poor and Non-Poor Benefit-Receiving Households by SIMD 2012 low income deciles (%, 2008, SHS, Scotland)
2012 SIMD low income deciles Non-Benefit Income-
Poor BHC
Non-Benefit Income-
Poor AHC
Non-Poor on Income Benefits
Most deprived 10% datazones 9.8% 8.9% 29.3% 2.00 9.2% 8.5% 24.6% 3.00 9.6% 8.5% 22.1% 4.00 9.7% 8.8% 17.6% 5.00 10.2% 9.0% 15.3% 6.00 10.1% 9.1% 12.3% 7.00 9.0% 7.7% 9.7% 8.00 9.3% 7.2% 8.6% 9.00 9.6% 7.9% 5.7% Least deprived 10% datazones 8.7% 7.0% 4.0% Total 9.5% 8.3% 15.3%
Again using SHS, we can identify local authorities with relatively more of the non-benefit income-poor group (Table 6.4). The highest incidence is in some more rural areas (Eilean Siar, Orkney, South Ayrshire, Dumfries & Galloway, Angus) but also in some more urban areas including Edinburgh, South Lanarkshire and Stirling. . Authorities with more benefit-receiving non-income-poor households are headed by Glasgow, Inverclyde, Renfrewshire, North Lanarkshire and North Ayrshire (all over 18%).

62
Table 6.4: Low Income Households not on Benefit, and Households on Benefit but not Low Income by Local Authority (Scottish Household Survey, Scotland, 2006/7-2008/9)
Local Authority Non-Benefit Non-Benefit Not Low Low Income Low Income Income, on BHC AHC Benefit Aberdeen 7.3% 7.4% 13.7% Aberdeenshire 9.4% 8.4% 8.6% Angus 9.9% 8.8% 11.6% Argyll 9.7% 8.6% 13.6% Clackmannanshire 7.4% 6.6% 15.5% Dumfries 12.5% 10.6% 11.1% Dundee 11.1% 9.7% 15.6% East Ayrshire 7.4% 7.1% 18.8% East Dunbartonshire 9.5% 7.8% 10.7% East Lothian 12.0% 10.9% 11.4% East Renfrewshire 8.5% 7.0% 9.5% Edinburgh 11.2% 10.5% 10.1% Eilean Sar 13.7% 10.9% 13.8% Falkirk 11.7% 9.5% 13.8% Fife 9.3% 7.6% 16.3% Glasgow 8.5% 7.6% 23.9% Highland 8.5% 6.8% 13.9% Inverclyde 9.2% 8.2% 17.7% Midlothian 9.5% 8.9% 12.0% Moray 11.4% 8.4% 10.1% North Ayrshire 9.6% 8.3% 19.4% North Lanarkshire 8.3% 7.1% 20.5% Orkney 13.1% 11.1% 10.7% Perth & Kinross 9.0% 7.9% 16.2% Renfrewshire 7.4% 5.5% 16.4% Scottish Borders 10.5% 9.6% 10.2% Shetland 6.0% 5.6% 10.6% South Ayrshire 13.4% 11.5% 16.8% South Lanarkshire 10.0% 8.3% 15.5% Stirling 10.2% 9.6% 11.2% West Dunbartonshire 8.0% 5.5% 20.0% West Lothian 8.7% 6.9% 13.8% Total Scotland 9.5% 8.3% 15.3%

63
Discussion
The impression formed in an earlier study (Bramley et al 2000) was that there were a lot of households in Scotland on low income who were not receiving income-related benefits. It was suggested that this reflected a combination of non-eligibility and non-takeup, which were more prevalent among groups such as the elderly, owner occupiers and private tenants, and working households with low or unstable earning. Older retired households have historically tended to underclaim benefits even where they might have a partial eligibility. Home-owners are not eligible for Housing Benefit (HB), which has a high takeup among social tenants and is often a trigger for the claiming of other benefits. Outright owners have low housing outgoings and for them a given ‘low’ BHC income may not mean hardship. Private tenants have traditionally had a low takeup of HB, now known in this sector as Local Housing Allowance (LHA), partly because they may have only partial or fluctuating eligibility and because they tend to be quite mobile.
This profile helped to account for the geographical pattern, whereby these groups tended to be quite prevalent in rural areas and in suburban or small town areas, rather than in the major cities with major concentrations of poverty as conventionally measured through the SIMD.
At the time of this earlier study it was not possible to check the hypothesis that many of these lower income non-benefit households had an adequate standard of living because of their housing and other assets. In the context of the present study, we are able to utilise the measures of material deprivation to triangulate the income-based measures of poverty. It is clear from analyses such as Tables 6.1-6.2 that a large proportion of low income (BHC) households are not materially deprived at the threshold set (4 items in US), although this set of deprivation markers is better geared for families than for older households. It is also clear from the area analysis of the different indicators that material deprivation shows a more similar pattern to SIMD than to the low income BHC measure.
What has changed since 2000? One significant change has been the development of a more extensive tax credit system for working households, families and pensioners. This will have both increased the coverage of the SIMD-type measures and at the same time lifted some households out of low income poverty, as reflected in the downward trend recorded in Chapter 3. Working the other way, there has been a rapid recent growth in private renting, and taken in conjunction with reforms to LHA and recent cuts in this system this could lead to more households being vulnerable to poverty AHC and not receiving benefit-based income. Also, the proportion of adults and households in work increased, up to the recent recession, and even now numbers working remain high although often on a part-time basis. This could also work to increase the numbers in low income poverty but not eligible for benefit. This danger is substantially increased by some of he current welfare reforms, particularly the loss of eligibility for tax credits of people working limited hours.

64
Table 6.2 shows that for some groups, particularly the elderly, although quite a lot are non-benefit income-poor (BHC), this proportion drops when AHC low income is considered, and drops a lot more when material deprivation is considered. Retired households and outright owners have nearly a quarter on low income BHC and not on benefits, but only 2-3% are materially deprived on the index used. By contrast, for working households and especially families, material deprivation is quite significant for some households despite not receiving benefits: this applies to 7% of all working age or working households, 15% of private renters, 13% of couples with 3+ children, 10% of 16-24 year olds and of single adults, and 13% on nonwhite household representatives.
This suggests the need to make a clear distinction between retired households and working age households, and to continue to take account of material deprivation as well as income when monitoring poverty.

65
Chapter 7 Implications of Findings
National Picture
Scotland has experienced (until recently) a gradual rise in income and living standards and a gradual fall in low income relative poverty, in parallel with the UK as a whole. The recession has led to a fall in real incomes, and a lot of underemployment as much as unemployment. Thus although (perhaps perversely) relative poverty has improved in this context, absolute poverty and deprivation may be increasing. There is also a picture of working age households being harder hit by recent changes than the retired population.
Overall average (median) household incomes are broadly similar to those found in England for similar types of local authority. In terms of regions Scotland is similar to the Midlands and Yorkshire & Humber regions. Scottish rural and coastal areas as a whole have slightly higher incomes than their English equivalents, although a poorer group within this have lower than average incomes, but still above the level of poorer industrial hinterlands or poorer cities (the lowest income type of locality).
Different Measures
Measures of poverty based on having less than 60% of the median equivalised income vary less than measures based on material deprivation. In the former case even affluent localities have 13-14% of households ‘poor’ on this standard measure of being ‘at risk of poverty’. However, material deprivation affects three times as many households in poorer cities as in the most affluent areas (17% vs 6%). Families with children are more likely to be at risk of poverty after housing costs, and there is more variation between areas in this measure as well as in material deprivation, with 37% of families in poorer cities poor after housing costs or materially deprived.
Local Variation
Edinburgh’s average scores on income and poverty tend to be slightly better than the other case study authorities, but other authorities in Scotland are more extreme, particularly Glasgow which is poorest overall, and a small group of affluent suburbs headed by East Renfrewshire. However, averages at local authority level may conceal the extent of variation between small areas and groups of households. How much poorer or richer these areas are differs depending which measure is used, with the more robust equivalised income measures showing smaller differences than total household income. This underlines the importance of household composition, and is confirmed when looking at the poorest neighbourhoods.
All of these measures vary more between neighbourhood types than between local authority types. Analysis at small area (datazone) level reveals large differences between case study local authorities in their overall distributions of household income, with Edinburgh having a large number of zones in medium and higher

66
income bands, in contrast with the other authorities. In general, for most indicators except material deprivation, Edinburgh has more variation between zones than the other authorities considered, with Highland and Island areas having lower variability. Across a number of indicators Glasgow stands out for having a majority of its zones in relatively high poverty categories.
Comparing the measures
In all cases the low income measures vary less than the material deprivation or combined indicators, but even these vary less than the SIMD low income score (based on benefit take-up). Material deprivation for working age non-family households displays a somewhat different pattern, with lower levels in Edinburgh than in Falkirk and Highland. Incomes for older households are most difficult to model reliably, and generally show less variation, but material deprivation may vary more, particularly in Highland.
Inspection of the poverty measures within the case studies and across the whole country suggests that measures based on material deprivation come closer to matching the range and pattern of variation in the SIMD and related benefit-based measures than do measures based on low equivalent income.
Incomes or poverty estimated for small areas may display apparently anomalous results, for various reasons some of which may be to do with model or data inadequacies and others of which may be genuine features of certain areas, for example the presence of students.
Drivers of income and poverty
The modelling work to predict income and poverty levels reveals important insights into the determinants of these outcomes. In general household composition effects dominate over area effects. The strongest predictors relate to economic activity, occupational class, and car ownership, with significant effects also from age, ethnicity and housing consumption. Area effects include some negative effects from rurality, and some positive effects from employment rates and social class.
Exploring the discrepancies
Different measures of poverty display different geographical patterns of incidence, and we can identify a priori a range of reasons for such differences. Analysis of the surveys at individual household level reveals a substantial lack of overlap between the different measures, with many more households poor on one but not both of any pair of measures than are poor on both. These non-overlapping groups have quite differential incidence geographically.
The group we may term ‘non-benefit income-poor’ are much more prevalent among older households, single adults, non-working households and outright owners, although if we take ‘income-poor’ after housing costs there are also a lot of renters in

67
this category. ‘Non-benefit materially deprived’ households are common among families (as are non-low-income materially deprived households).
Whereas by definition households receiving income-related benefits (including those who are not income poor) are systematically much more present in the most deprived zones using SIMD, those not on benefit but income-poor are distributed uniformly across SIMD bands. At local authority level, non-benefit income-poor households are more prevalent in more rural areas as well as some urban areas (including Falkirk and Edinburgh), whereas non-income-poor households on benefit are more prevalent in Glasgow and some other former industrial areas. These differences reflect a range of factors including different eligibility for and take-up of benefits.
Demographic divide
In interpreting these differences, we would argue that it is important to differentiate between retired households and working age households. It would appear that most retired households who are income-poor (BHC) and not on benefit are not materially deprived, whereas many working age households in this position are. For this group of working age households the monitoring of both incomes and material deprivation levels are very important.
Changing policy context
Furthermore, changes to the benefit system following the UK deficit-reduction strategy and with the implementation of welfare reform will have significant impacts on both income levels and on the measured take-up of income-related benefits. Where benefits (e.g. including tax credits, Employment Support Allowance) which are counted in the SIMD low income measure are cut back, there will be simultaneously a reduction in income and a reduction in poverty measured from benefit receipt.. Other benefits which are not counted as poverty measures are also be being curbed, including for example HB, LHA and (in England) Council Tax Benefit. Reliance solely on administrative benefit records to monitor poverty could in this context be seriously misleading, and it will be even more important to refer to independent survey-based measures, and derived local estimates such as those reported here.
Potential Uses
This study has generated a wide range of measures which can be used for a variety of purposes. A key aim has been to inform local efforts to tackle and respond to poverty and the study adds substantially to the measures currently available through SIMD and based on administrative benefits data. Although we have mainly emphasized average incomes and poverty incidence, the estimates of banded income levels can also contribute to the assessment of inequality at different geographical scales. We believe the measures can play a role in helping to support and interpret other ongoing research on minimum income standards for rural Scotland. Given new estimates of income requirements for minimum adequate living standards in

68
particular types of location, we can estimate proportions of different household groups who fall short of these standards in those places. The study has triangulated measures and models by reference to three independent surveys, and as such should help to inform the Scottish Government on the robustness of the income measures derived from its key survey, the SHS.
Other potential uses include the assessment of housing affordability in Strategic Housing Need and Demand Analyses (SHNDAs), assessment of the risk and incidence of fuel poverty, or the forecasting of travel demand in transport models. Although it has not been possible to exemplify this fully within the limited time available to this study, the foundations have been laid for a relatively quick and easy assessment of housing affordability, particularly utilising the banded ‘first benefit unit’ (FBU) income measure designed for this purpose along with readily available house price information (it would however be valuable to obtain better market rents data).
Updating
A potential weakness of the current study is the datedness of census data for small areas, although we have tried to update components where possible. Overall, we have shown that the bulk of key driver variables can be updated, using a range of sources creatively, including housing completions data which are a key indicator of differential local change. When 2011 Census results become available at the detailed level, it will be possible to rebase the models, and carry out a closer study of changes over the last decade. This in turn would provide a basis for further rolling forward in the future. At the same time lessons and insights from the 2012 Poverty and Social Exclusion (PSE) Survey can be taken account of. We also suggest that this would provide an opportunity to test further refinements of the statistical modelling approach.

69
References
Bramley, G. (2005) Scotland’s Index of Multiple Deprivation: Assessing its statistical validity, and its appropriateness as a mechanism for targeting resources on deprivation Research Report to the Scottish Parliamentary Corporate Body. Edinburgh: SPICE.
Bramley, G. & Karley, N.K. (2005) ‘How much extra affordable housing is needed in England?’, Housing Studies, 20:5, 685-715.
Bramley, G. & Lancaster, S. (1998) ‘Modelling local and small area income distributions in Scotland’, Environment & Planning C: Government and Policy 16, 681-706.
Bramley, G. & Smart, G. (1996) ‘Modelling local income distributions in Britain’, Regional Studies, 30:3, 239-55.
Bramley, G., Lancaster, S. & Gordon, D. (2000) ‘Benefit Take-up and the Geography of Poverty in Scotland’, Regional Studies, 34:6, 507-519.
Bramley, G., Karley N. K., & Watkins, D. (2006) Local Housing Need and Affordability Model for Scotland – Update (2005-based) A Report to the Scottish Executive and Communities Scotland. Communities Scotland Report 72.
Bramley, G., Karley, N.K., Leishman, C., Morgan, J. & Watkins, D. (2007) Transforming Places: Housing Investment and Neighbourhood Market Change. York: Joseph Rowntree Foundation.
Deas, I., Robson, B., Wong, C. & Bradford, M. (2003) ‘Measuring neighbourhood deprivation: a critique of the index of multiple deprivation’, Environment & Planning C: 21:6, 883-904.
Drew, J.D., Singh, M.P. and Choudhry, G.H. (1982) ‘Evaluation of Small Area Estimations Techniques for the Canadian Labour Force Survey’, Survey Methodology, 8, pp. 17-47.
Fahmy, E. & Gordon, D. (2007) Updating the Fuel Poverty Indicator for England. Report for Centre for Sustainable Energy. Bristol University: Townsend Centre for International Poverty Research.
Fay, R. E. and Herriot, R. A. (1979). Estimation of income from small places: An application of James-Stein procedures to census data. Journal of the American Statistical Association, 74, 269–277.
Lee, P., Murie, A. & Gordon, D. (1995) Area Measures of Deprivation; a study of current methods and best practices in the identification of poor areas in Great Britain. Birmingham: University of Birmingham, Centre for Urban and Regional Studies.
Noble, M., Smith, G., Wright, G., Dibben, C., (2006) ‘Measuring multiple deprivation at the small are level’, Environment & Planning A 38:1, 161-185
Noble, M., Smith, G., Wright, G., Dibben, C., Lloyd, M., McLellan, D., Antilla, C., Barnes, H., Mokhtar, C., Avenell, D., Gardner, H., Covizzi, I. (2004) The English Indices of Deprivation 2004 (Revised). Neighbourhood Renewal Unit. ODPM Publications.
Pantazis, C., Gordon, D. & Levitas, R. (2006) Poverty and Social Exclusion in Britain: the millennium survey. Bristol: Policy Press.

70
Pawson, H. & Wilcox, S. (2012) UK Housing Review2011/2012. Coventry: Chartered Institute of Housing.
Scottish Government (2010) Poverty and Income Inequality in Scotland 2010-11. Edinburgh: Scottish Government. http://www.scotland.gov.uk/Publications/2012/06/7976
Singh, B.B., Shukla, G.K. and Kundu, D. (2006): Spatio-Temporal Models in Small Area Estimation, Survey Methodology, 31, 2, 183-195.
Wilcox, S. (2003) Can Work, Can’t Buy. York: Joseph Rowntree Foundation.
Wilcox, S. (2005) Affordability and the Intermediate Market York: Joseph Rowntree Foundation.
Wilcox, S. (2007) The affordability of private housing in Great Britain: Local measures of the affordability of owner occupied and private rented housing. Hometrack.
Wilcox, S. & Bramley, G. (2010) Evaluating the Requirements for Market and Affordable Housing. Titchfield: National Housing & Planning Advice Unit (now reabsorbed into DCLG).
Williamson, P. (2002) Identifying the Cash-Rich and the Cash-Poor: lessons from the Census Rehearsal. Powerpoint Presentation: ESRC Census Development Programme. University of Liverpool.

71
Authors’ Contact Details
Glen Bramley and David Watkins
Institute for Housing, Urban and Real Estate Research, School of the Built Environment, Heriot-Watt University, Edinburgh EH14 4AS 0131 451 4605 [email protected])