Embed Size (px)
Citation preview
LNG Technology: The Weathering in Above-Ground Storage TanksLaura A. Pellegrini,† Stefania Moioli,*,† Fabio Brignoli,† and Camilla Bellini‡
†Dipartimento di Chimica, Materiali e Ingegneria Chimica “G. Natta”, Politecnico di Milano, Piazza Leonardo da Vinci 32, I-20133Milano, Italy‡Universita Commerciale Luigi Bocconi, via Sarfatti 25, I-20136 Milano, Italy
ABSTRACT: Liquefied natural gas (LNG) is an energy source with worldwide steady growth: natural gas supply, as gasdemand, is expected to grow in the near future. LNG is stored in tanks at pressure slightly higher than the atmospheric value andat its boiling point. Despite the high degree of insulation in the tank walls, it is impossible to avoid a net input heat transfer fromthe surroundings, so that vaporization is always present. It causes an increase in the pressure of the tank and a consequent boiloffin order to avoid overpressure. The change in composition and density of the liquid phase is called LNG aging or weathering.This phenomenon has been studied in order to obtain a model that can predict the variations that occur in the tank over time.Unlike other previously developed models, the proposed model does not require knowledge of the boiloff rate; instead, itcalculates the rate directly from the heat flow to the tank. As a consequence, from a comparison with experimental data, it isproved that a more reliable representation of the phenomenon can be obtained.
1. INTRODUCTION
Since the beginning of the new century, energy markets andtheir sustainability have been the focus of both public andprivate interest. Security of supply, economic efficiency, andenvironmental protection have become the main topics in thedebate about energy and its future, promoting the collaborationof both engineers and economists, lawyers, and public spheres.In this work, the attention is strictly centered on the highlygrowing market of natural gas, i.e., the liquefied natural gas(LNG) state-of-art technology that will increase gas supply viasea transportation1,2 and also, although to a much lesser extent,via ground transportation (micro LNG plants).According to the economic theory, economic growth and
energy consumption are strictly correlated: indeed, the highgrowth rates expected from developing countries (i.e., Chinaand India) are one of the main causes for the rising concernabout the amount and portability of natural resources fromproduction countries to new markets. Based upon InternationalMonetary Fund and Asian Development Bank estimates,through 2035, China will be able to achieve an average growthrate of 5.6% annually.However, although economic development has been
nourished by coal, until recently, and coal consumption hasbeen increasing by 8% per year for the past decade, increasingenvironmental burden of coal have moved the general interestup to other energy sources (i.e., natural gas), whoseconsumption doubled within a few years. Indeed, among fossilfuels, natural gas is projected, to 2030, to have up the highestgrowth rate (2.1% per year), mainly in non-OECD countriesand in the Middle East. Continuing with the Chinese case, thiscountry is expected to diversify its fuel mix away from coal,reaching a level of gas use estimated to be ∼46 Bcf, which is thesame level as that for the European Union in 2010.3,4
Also, the natural gas supply, as gas demand, is expected togrow in the near future. A major contribution is certainlycoming from the Middle East and the former Soviet Union(FSU), with 26% and 19% of the global growth, respectively.
However, new entrants are being projected to change the ruleof supply and competition in the gas market. West Africa,North Western Australia, South America, Caribbean, Indonesia,Malaysia, and Alaska are opening a market that has beentraditionally dominated by a maximum of three playersRussia, Algeria, and Norwayto competition, a hazardousmonopoly to prices and security of supply.The United States now plays a role apart: natural gas from
shales is treated in micro LNG plants from which LNG forautomotive applications is transported by train or other above-ground facilities to the final destination.However, it is noteworthy to specify that such a
diversification in importers’ choice is mainly made possible bythe introduction of LNG technology in the natural gas logisticsand transportation system. Indeed, until the introduction ofLNG, the low density of natural gas has made gas trans-portation costs higher than those of either oil or coal, limitingmovements and connections to those allowed by a long-termfixed infrastructure (i.e., pipelines).5 However, since 1964,when the first LNG cargo was sent from Algeria to the UnitedKingdom, the number of participants and the number of routesin the gas market have increased significantly. Thanks to LNG,which currently accounts for 32.3% of the global gas trade,6
moving natural gas from low-cost/low-value resources todistant, high-value markets has become not only feasible, butalso efficient, especially if the route is more than 1000 km long.At the same time, this requires appropriate technologies for
the transport and storage. This article proposes a model thatallows to predict the dynamic behavior of the LNG containedin a storage tank with boiloff. This topic is fundamental in LNGtechnology for mainly two reasons: the necessity to meetquality specifications when blending LNGs from different
Received: July 2, 2013Revised: January 27, 2014Accepted: February 18, 2014Published: February 18, 2014
Article
pubs.acs.org/IECR
© 2014 American Chemical Society 3931 dx.doi.org/10.1021/ie404128d | Ind. Eng. Chem. Res. 2014, 53, 3931−3937
sources and the safety requirement to avoid stratifications andpossible roll-over phenomena inside the LNG tank.7
During its residence within a tank, LNG slowly changes incomposition due to heat flux received from the surroundings:nitrogen is the first to escape, while methane vaporizes at ahigher rate than ethane and propane. After a long period, thatcan last months or years in the case of a tank for peak shavingadjustments, LNG is warmer and denser, as confirmed by theresults obtained in the present paper. This has importantconsequences when a cooler and lighter stock is mixed with theheel (i.e., the old LNG present in the tank). The resultingstratification can cause instability inside the tank with thesudden release of LNG vapors and rollover. At best, such asituation results in the loss of valuable fuel while, at worst, it canbe dangerous. Therefore, a reliable tool for predicting the LNGtime behavior is fundamental.
2. STATE OF THE ART
Many publications regarding facilities, safety, and atmosphericdispersion are available, often approaching LNG as a substancecharacterized by methane properties, and neglecting theinfluence of changes in chemical composition. However, inthe literature, studies on the unsteady evolution of LNG duringstorage are limited.Aspelund et al.8 developed a program for calculation of the
gas quality in a small-scale LNG chain by considering aconstant heat flow. The model, as well as the one by Kountz,9 isbased on equilibrium between liquid and vapor phases, withgood approximation of experimental data, as reported by Mianaet al.10 Conrado and Vesovic11 proposed a model to estimatethe rate of vaporization of LNG and LPG cryogenic mixturesspreading on unconfined water surfaces, showing that thebehavior of LNG can be very different from that of puremethane. Similar conclusions had been previously obtained byBoe12 in 1997. Miana et al.10 proposed an algorithm for marinetransportation, developed on the basis of two parameters thatshould be known: the boiloff rate (BOR) and the ship capacity.In general, then, it can be inferred that, in the majority ofstudies present in the literature, certain drastic simplifyingassumptions are considered, in particular as for the boiloff gas(BOG) amount and the composition. These assumptions maybe acceptable for preliminary evaluation, but they should beremoved for detailed thermo-economic evaluations andoptimization analysis. This is also remarked by Dimopoulosand Frangopoulos,13 who stated that “the handling of the boil-of fgas during the LNG vessel operation and the assessment of itsthermodynamic properties are key issues in the technical andeconomic assessment” of the energy system of LNG vessels.The proposed model, then, aims at removing these
simplifying assumptions, in order to best describe the evolutionof the system during time.
3. DEVELOPMENT OF THE MODEL
LNG is stored in tanks at a pressure slightly higher than theatmospheric value; since the vapor−liquid equilibrium hypoth-esis is made, storage temperature is the bubble pointtemperature of the mixture.Unlike other models that can be found in the literature,10,14
the proposed model does not require knowledge of the boiloffrate (BOR), which is the amount of evaporated gas in one day,in terms of the amount of liquid volume relative to the initialvolume of LNG. As a matter of fact, the flow rate of gas that
leaves the tank is determined by knowing the heat flow to thetank, which can be calculated using generalized curves15 or adedicated model of heat transfer through the insulations.From the equilibrium relation
=y k xi i i (1)
the LNG boiling point conditions can be found computing thenumerical root of
∑ ∑= == =
y k x 1i
ii
i i1
NC
1
NC
(2)
Molar balances for LNG and for each of its components,coupled to the enthalpy balance, generate the following systemof differential equations:
= − Mt
Wd
dtot
(3)
= − x Mt
yWd( )
di
itot
(4)
∑∑
= − + =
=
x H M
tyH W Q
d( ( ))
d( )i i i
ii i
1NS L
tot
1
NSV
(5)
Differentiating eq 2 with respect to time, the followingcorrelation that expresses the temperature dependence on timeis obtained:
= −∑ + −
∑
=∂∂
∂∂
=∂∂
⎡⎣⎢
⎤⎦⎥( ) ( )T
t
k x k x
x
dd
i ixt i
kt i
Pt i
kP
ikT i
1NC d
ddd
1NC
i i i
i(6)
Introducing eqs 1 and 4 into eq 6 and then equating with(dT/dt) obtained from the energy balance (eq 5), anexpression correlating the evaporated moles at the consideredtime with the heat loss at the same time is found:
=
+ ∑ Δ ∑ ∑ + − + ∑
∑ =
= =∂∂ =
∂∂
=∂∂
⎜ ⎟⎡⎣⎢
⎛⎝
⎞⎠
⎤⎦⎥ ( )
( )
WQ
k x H( )x C x x k k x
x i i i i
( ) ( 1)
1NC
ev,
i i P i i i ikixi
i iPt i i
kiP
i ikiT
1NC
,L
1NC d
d 1NC
1NC
(7)
where the first term in the denominator represents thecontribution of sensible heat, which is much smaller than thesecond term, which represents the latent heat (and usually isnot considered in the literature).16,17
(∂ki/∂xi) is, for LNG systems, usually negligible, compared to(∂ki/∂T), while (dP/dt) has a non null value only for systemswith variable pressure, in which case a trend of pressure overtime must be assigned.Equations 1, 3, 4, and 7 constitute a system of ordinary
differential equations (ODEs) and algebraic equations that canbe solved using a simple numerical method (i.e., fourth-orderRunge−Kutta). At each time step, the total mass (MTOT) andthe molar fraction of the LNG components xi are calculated bysolving the differential equations of the total and componentbalances while the temperature and the boiloff are obtained byrooting eq 1 and directly from eq 7, respectively.Alternatively, if the boiloff is assumed constant, W = nev/
86400 (kmol/s), eq 7 is not needed. This alternative will bediscussed in section 4.
Industrial & Engineering Chemistry Research Article
dx.doi.org/10.1021/ie404128d | Ind. Eng. Chem. Res. 2014, 53, 3931−39373932
4. EQUILIBRIUM AND DENSITY CALCULATIONAn appropriate thermodynamic description of LNG cannot usean ideal scheme,18−20 because of the proximity to criticalconditions at least for nitrogen, if present, and sometimes alsofor methane.To calculate the equilibrium condition represented by the
boiling point, eq 1, the Soave−Redlich−Kwong (SRK)Equation of State (EoS),21 has been used.The same EoS can be used to predict density values,
although it is well-known that, near critical conditions, cubicEoSs fail in predicting reliable values of volumetric properties.On the other hand, density requires accurate calculation,because it is the difference in densities that causes stratificationsand, consequently, rollover in LNG plants.In the literature, the Peneloux correction22 is widely applied
so that density can be calculated according to
ρ= = −v v c
1 SRK
(8)
with
= −c RT Z0.40768( )(0.29441 )R RA
where ZRA is the Rackett compressibility factor23, estimated as0.29056 − 0.08775 ω.A better prediction can be obtained by assuming24
= + +c T AT BT D( )R R2
R (9)
where A, B, and D depend on the reduced normal boiling pointof the given compound (NBPR), and are expressed as
= + +A a a aNBP NBP1 R2
2 R 3 (10)
= + +B b b bNBP NBP1 R2
2 R 3 (11)
= + +D d d dNBP NBP1 R2
2 R 3 (12)
After a long period inside the tank, LNG is warmer anddenser, and the stratification resulting when a cooler and lighterstock is added can cause the sudden release of LNG vapors androll-over. By considering an accurate thermodynamic method,the proposed model allows a reliable prediction ofcompositions and densities inside the tank during time. Thishelps in evaluating whether, when adding new LNG into thetank, the difference in composition and, consequently, thedifference in density and temperature, can be so high to resultin a dangerous scenario.
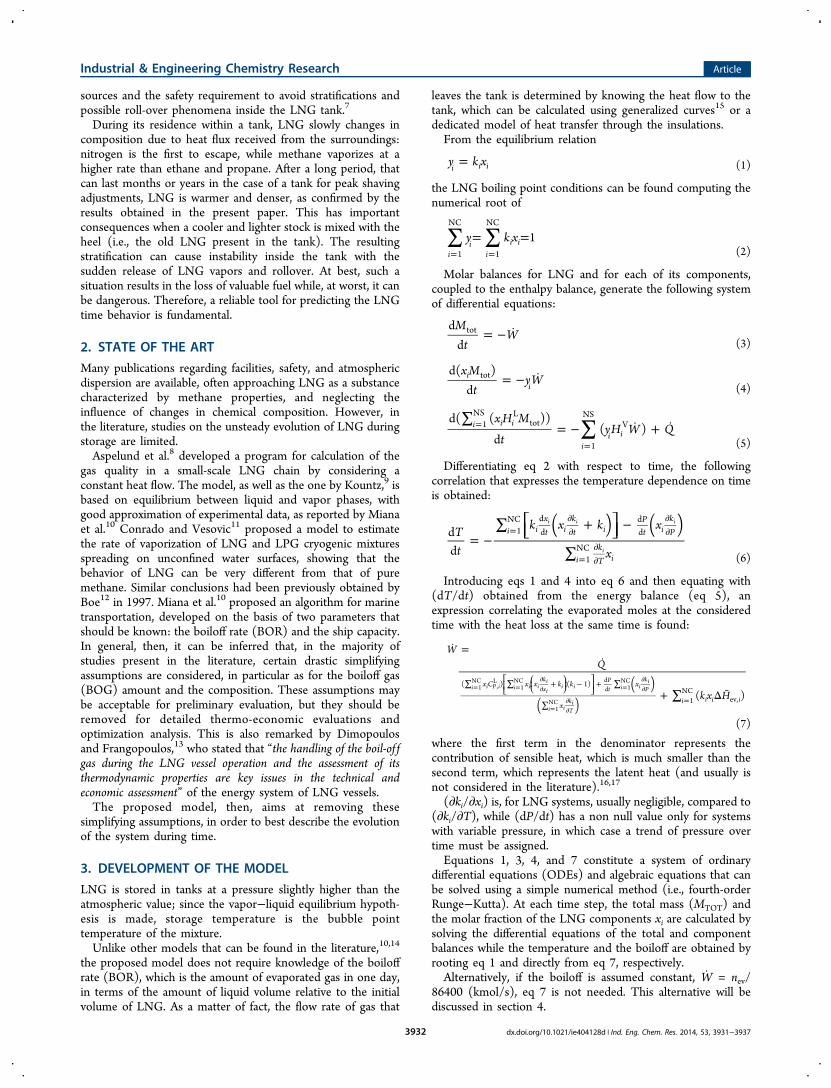
5. RESULTS AND DISCUSSIONThe procedure illustrated in section 3 has been applied to twosample cases studied in the literature9 and reported also inanother reference.10 A small tank containing 190 L of LNGreceives a constant heat flow by means of a catalytic heater.Pressure is kept constant and equal to 7.7 bar, except during thelast three days, when it is slightly reduced (to 7.397 bar). Suchexperimental conditions do not reproduce the usual operatingconditions of above-ground tanks, where the pressure is almostatmospheric and the BOR is ∼0.5% per day, but they have beenassumed to accelerate the aging process by experimentalresearchers. Experimental data reproduced in the simulation arereported in Table 1. Because of the unavailability of the reportby Kountz,9 which presented data for many cases, experimentalvalues have been directly taken from Miana et al.,10 whoreported data for only Case 5 and Case 6.
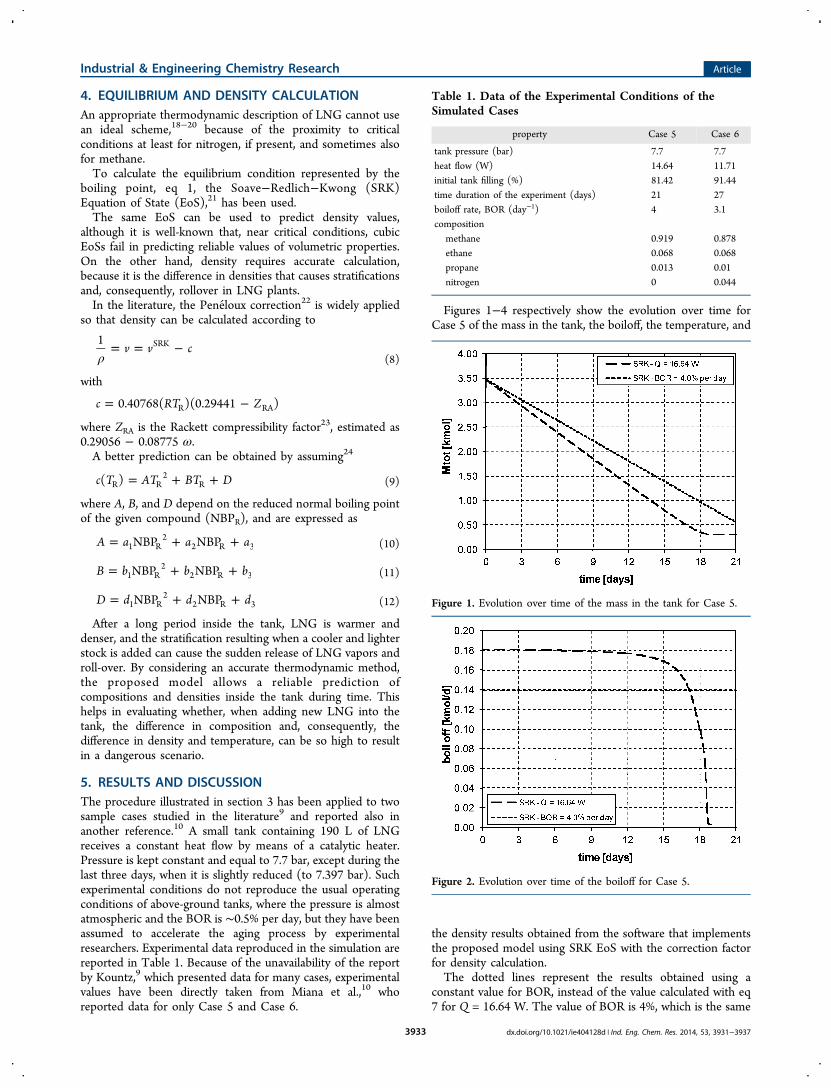
Figures 1−4 respectively show the evolution over time forCase 5 of the mass in the tank, the boiloff, the temperature, and
the density results obtained from the software that implementsthe proposed model using SRK EoS with the correction factorfor density calculation.The dotted lines represent the results obtained using a
constant value for BOR, instead of the value calculated with eq7 for Q = 16.64 W. The value of BOR is 4%, which is the same
Table 1. Data of the Experimental Conditions of theSimulated Cases
property Case 5 Case 6
tank pressure (bar) 7.7 7.7heat flow (W) 14.64 11.71initial tank filling (%) 81.42 91.44time duration of the experiment (days) 21 27boiloff rate, BOR (day−1) 4 3.1composition
methane 0.919 0.878ethane 0.068 0.068propane 0.013 0.01nitrogen 0 0.044
Figure 1. Evolution over time of the mass in the tank for Case 5.
Figure 2. Evolution over time of the boiloff for Case 5.
Industrial & Engineering Chemistry Research Article
dx.doi.org/10.1021/ie404128d | Ind. Eng. Chem. Res. 2014, 53, 3931−39373933
mean value used in the literature,10 where the simplifyingassumption of a constant BOR is applied to all the simulations.As shown in Figures 1 and 2, BOR can be assumed constant
only in the first part of the transient since, for t > 12 days, theevolution of the variables characterizing the system becomesfully nonlinear. It is evident also that the assumption ofconstant BOR gives an incorrect representation of temperatureand density for t > 10 days. This is obtained by employing theproposed model, which considers a BOR that varies with timeand depending on the heat flux.Moreover BOR, which is defined as
=VV
BOR evL
inL
(13)
can be assumed equal to nev/nin only at times far from thosecorresponding to the tank emptying when density cannot beconsidered constant, as shown in Figure 4.In Case 5, nitrogen, which is the supercritical component, is
not present; therefore, a comparison of densities can be madebetween the results obtained using SRK with the correction fordensity and the results obtained assuming an ideal thermody-namic model i.e., ki = (Pev,i(T))/P with Pev,i(T) calculated from
the Antoine equation,25 while the density is obtained fromHBT correlation:25−27
ρω= = − *δv v v v
1[1 ]
ss R
0SRK R
(14)
= + − + − + − + −
< <
v a T b T c T d T
T
1 (1 ) (1 ) (1 ) (1 )
0.25 0.95R0
R1/3
R2/3
R1/3
R4/3
R (15)
=+ + +
−< <δv
e fT gT hTT
T( 1.00001)
0.25 1.0RR R
2R
3
RR
(16)
where values of the constants a−h and of the pure componentcharacteristic volume (v*) can be found in the literature.23
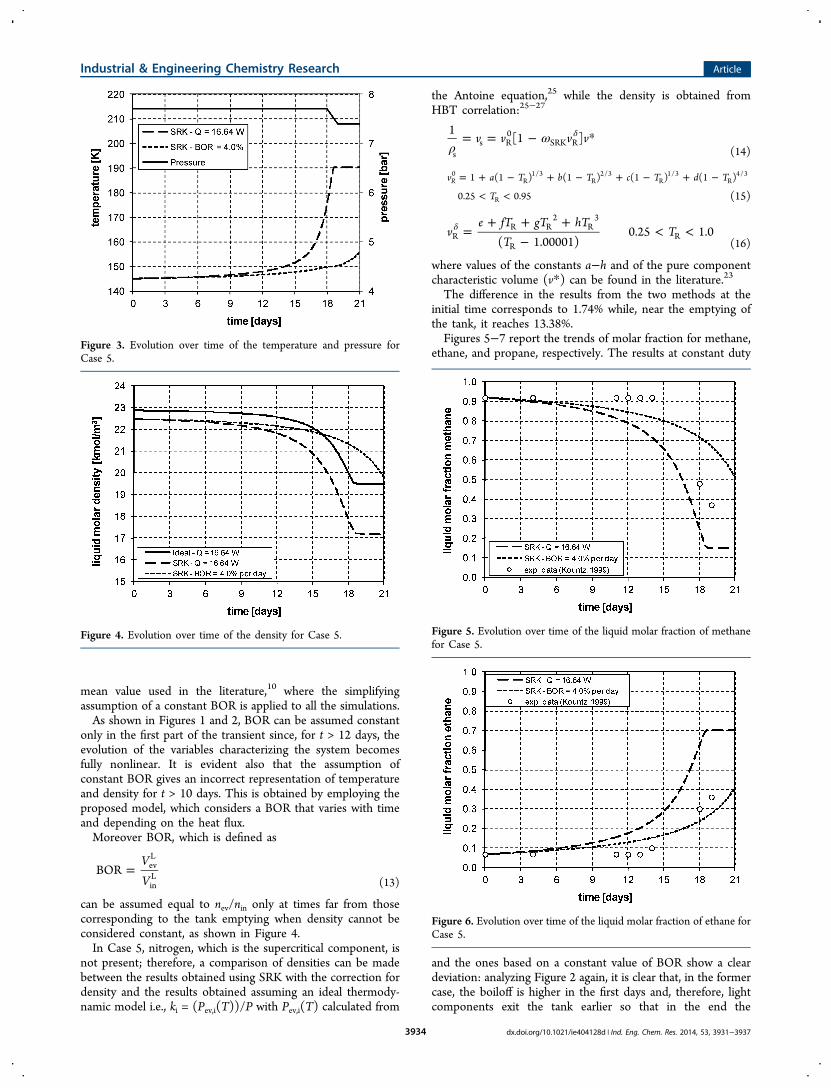
The difference in the results from the two methods at theinitial time corresponds to 1.74% while, near the emptying ofthe tank, it reaches 13.38%.Figures 5−7 report the trends of molar fraction for methane,
ethane, and propane, respectively. The results at constant duty
and the ones based on a constant value of BOR show a cleardeviation: analyzing Figure 2 again, it is clear that, in the formercase, the boiloff is higher in the first days and, therefore, lightcomponents exit the tank earlier so that in the end the
Figure 3. Evolution over time of the temperature and pressure forCase 5.
Figure 4. Evolution over time of the density for Case 5. Figure 5. Evolution over time of the liquid molar fraction of methanefor Case 5.
Figure 6. Evolution over time of the liquid molar fraction of ethane forCase 5.
Industrial & Engineering Chemistry Research Article
dx.doi.org/10.1021/ie404128d | Ind. Eng. Chem. Res. 2014, 53, 3931−39373934
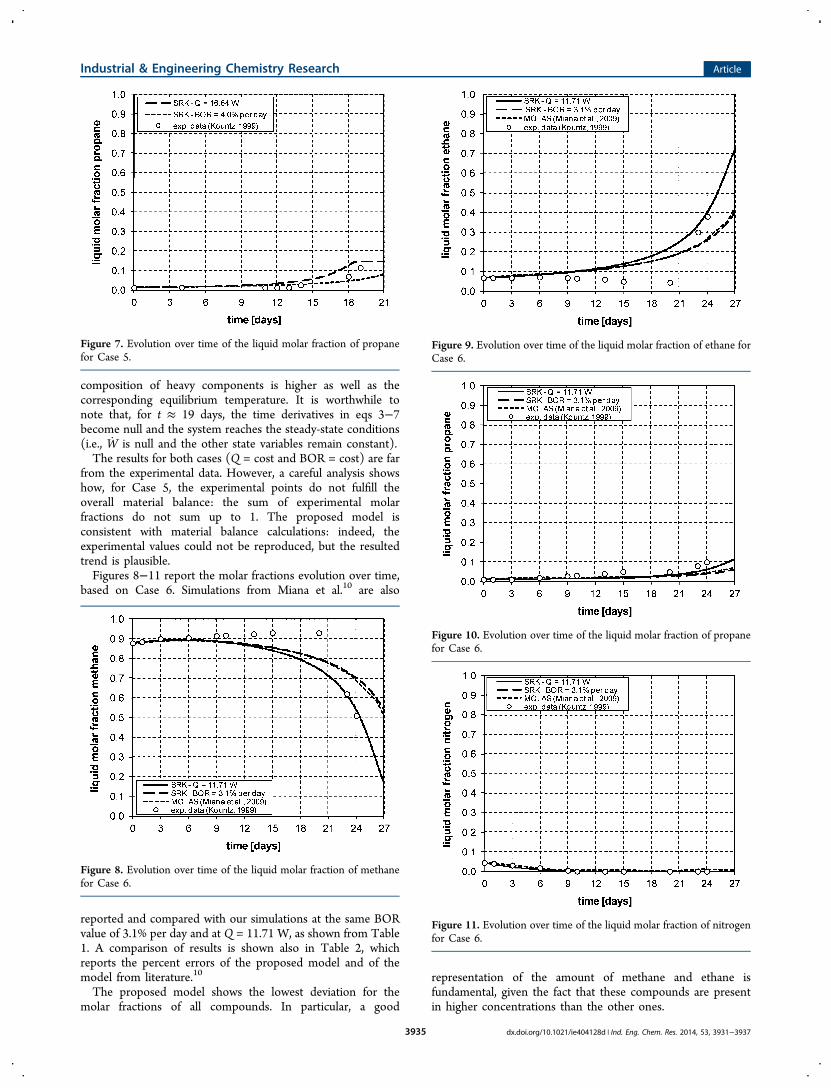
composition of heavy components is higher as well as thecorresponding equilibrium temperature. It is worthwhile tonote that, for t ≈ 19 days, the time derivatives in eqs 3−7become null and the system reaches the steady-state conditions(i.e., W is null and the other state variables remain constant).The results for both cases (Q = cost and BOR = cost) are far
from the experimental data. However, a careful analysis showshow, for Case 5, the experimental points do not fulfill theoverall material balance: the sum of experimental molarfractions do not sum up to 1. The proposed model isconsistent with material balance calculations: indeed, theexperimental values could not be reproduced, but the resultedtrend is plausible.Figures 8−11 report the molar fractions evolution over time,
based on Case 6. Simulations from Miana et al.10 are also
reported and compared with our simulations at the same BORvalue of 3.1% per day and at Q = 11.71 W, as shown from Table1. A comparison of results is shown also in Table 2, whichreports the percent errors of the proposed model and of themodel from literature.10
The proposed model shows the lowest deviation for themolar fractions of all compounds. In particular, a good
representation of the amount of methane and ethane isfundamental, given the fact that these compounds are presentin higher concentrations than the other ones.
Figure 7. Evolution over time of the liquid molar fraction of propanefor Case 5.
Figure 8. Evolution over time of the liquid molar fraction of methanefor Case 6.
Figure 9. Evolution over time of the liquid molar fraction of ethane forCase 6.
Figure 10. Evolution over time of the liquid molar fraction of propanefor Case 6.
Figure 11. Evolution over time of the liquid molar fraction of nitrogenfor Case 6.
Industrial & Engineering Chemistry Research Article
dx.doi.org/10.1021/ie404128d | Ind. Eng. Chem. Res. 2014, 53, 3931−39373935
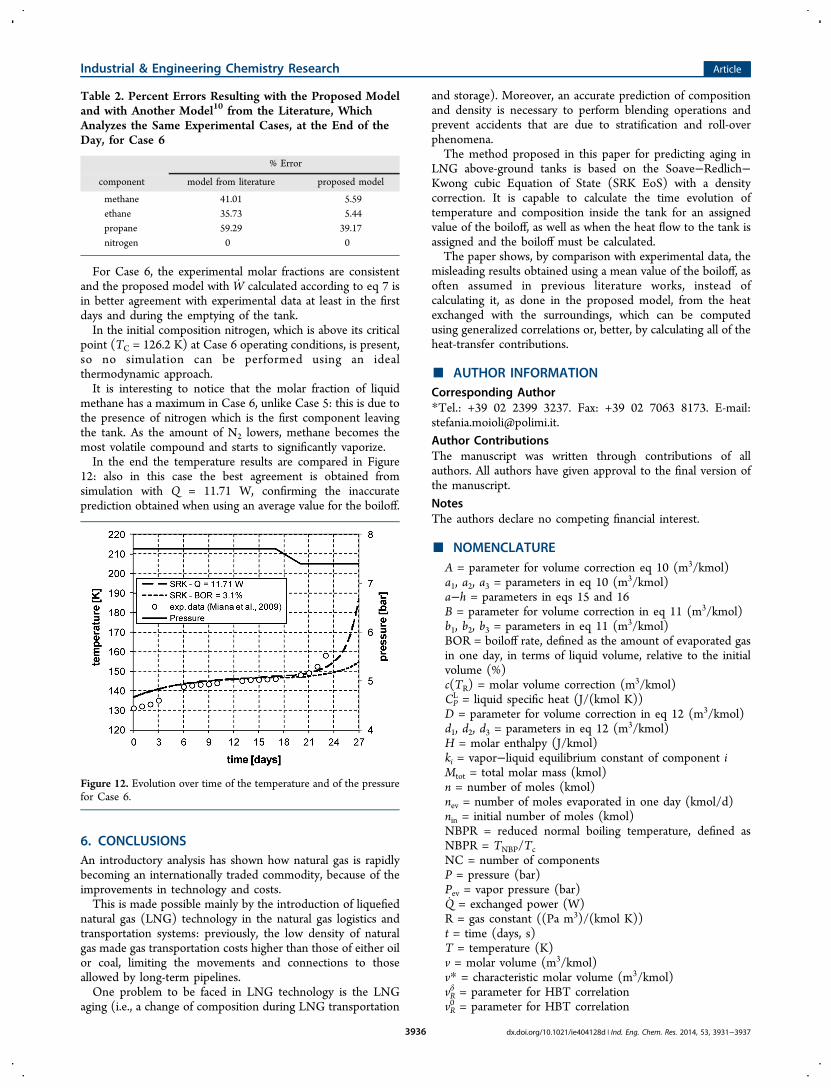
For Case 6, the experimental molar fractions are consistentand the proposed model with W calculated according to eq 7 isin better agreement with experimental data at least in the firstdays and during the emptying of the tank.In the initial composition nitrogen, which is above its critical
point (TC = 126.2 K) at Case 6 operating conditions, is present,so no simulation can be performed using an idealthermodynamic approach.It is interesting to notice that the molar fraction of liquid
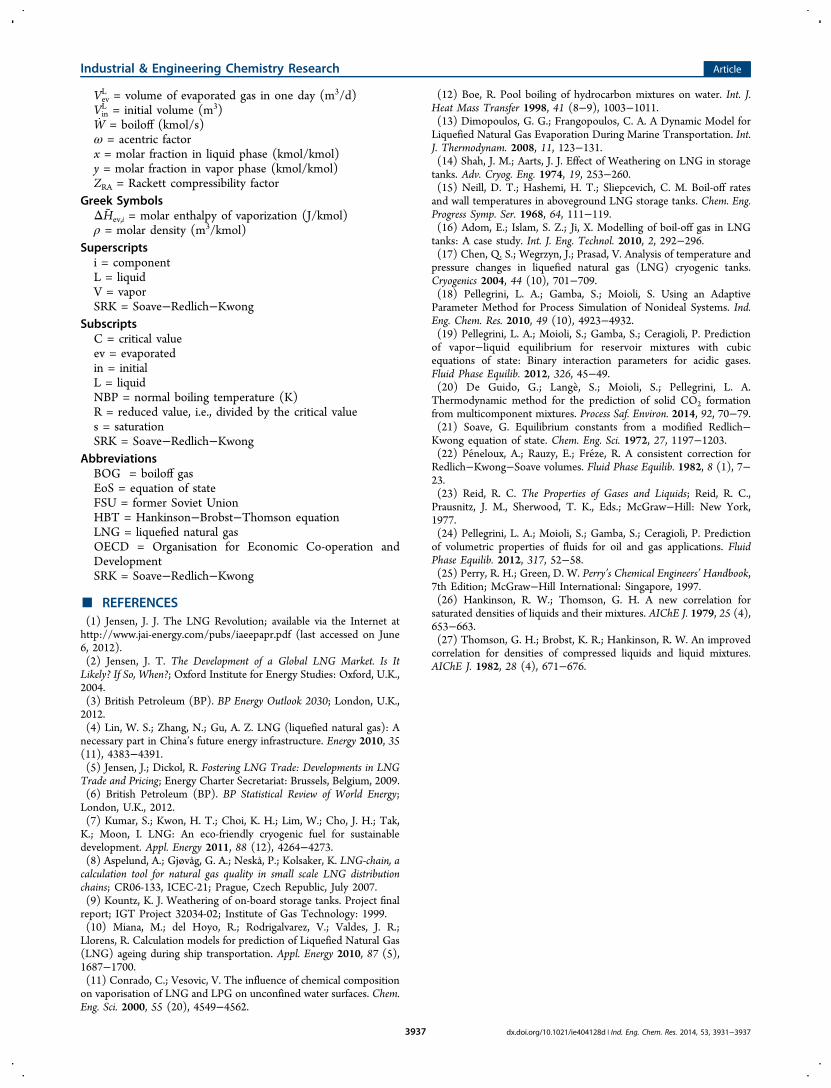
methane has a maximum in Case 6, unlike Case 5: this is due tothe presence of nitrogen which is the first component leavingthe tank. As the amount of N2 lowers, methane becomes themost volatile compound and starts to significantly vaporize.In the end the temperature results are compared in Figure
12: also in this case the best agreement is obtained fromsimulation with Q = 11.71 W, confirming the inaccurateprediction obtained when using an average value for the boiloff.
6. CONCLUSIONSAn introductory analysis has shown how natural gas is rapidlybecoming an internationally traded commodity, because of theimprovements in technology and costs.This is made possible mainly by the introduction of liquefied
natural gas (LNG) technology in the natural gas logistics andtransportation systems: previously, the low density of naturalgas made gas transportation costs higher than those of either oilor coal, limiting the movements and connections to thoseallowed by long-term pipelines.One problem to be faced in LNG technology is the LNG
aging (i.e., a change of composition during LNG transportation
and storage). Moreover, an accurate prediction of compositionand density is necessary to perform blending operations andprevent accidents that are due to stratification and roll-overphenomena.The method proposed in this paper for predicting aging in
LNG above-ground tanks is based on the Soave−Redlich−Kwong cubic Equation of State (SRK EoS) with a densitycorrection. It is capable to calculate the time evolution oftemperature and composition inside the tank for an assignedvalue of the boiloff, as well as when the heat flow to the tank isassigned and the boiloff must be calculated.The paper shows, by comparison with experimental data, the
misleading results obtained using a mean value of the boiloff, asoften assumed in previous literature works, instead ofcalculating it, as done in the proposed model, from the heatexchanged with the surroundings, which can be computedusing generalized correlations or, better, by calculating all of theheat-transfer contributions.
■ AUTHOR INFORMATIONCorresponding Author*Tel.: +39 02 2399 3237. Fax: +39 02 7063 8173. E-mail:[email protected] ContributionsThe manuscript was written through contributions of allauthors. All authors have given approval to the final version ofthe manuscript.NotesThe authors declare no competing financial interest.
■ NOMENCLATUREA = parameter for volume correction eq 10 (m3/kmol)a1, a2, a3 = parameters in eq 10 (m3/kmol)a−h = parameters in eqs 15 and 16B = parameter for volume correction in eq 11 (m3/kmol)b1, b2, b3 = parameters in eq 11 (m3/kmol)BOR = boiloff rate, defined as the amount of evaporated gasin one day, in terms of liquid volume, relative to the initialvolume (%)c(TR) = molar volume correction (m3/kmol)CPL = liquid specific heat (J/(kmol K))
D = parameter for volume correction in eq 12 (m3/kmol)d1, d2, d3 = parameters in eq 12 (m3/kmol)H = molar enthalpy (J/kmol)ki = vapor−liquid equilibrium constant of component iMtot = total molar mass (kmol)n = number of moles (kmol)nev = number of moles evaporated in one day (kmol/d)nin = initial number of moles (kmol)NBPR = reduced normal boiling temperature, defined asNBPR = TNBP/TcNC = number of componentsP = pressure (bar)Pev = vapor pressure (bar)Q = exchanged power (W)R = gas constant ((Pa m3)/(kmol K))t = time (days, s)T = temperature (K)v = molar volume (m3/kmol)v* = characteristic molar volume (m3/kmol)vRδ = parameter for HBT correlationvR0 = parameter for HBT correlation
Table 2. Percent Errors Resulting with the Proposed Modeland with Another Model10 from the Literature, WhichAnalyzes the Same Experimental Cases, at the End of theDay, for Case 6
% Error
component model from literature proposed model
methane 41.01 5.59ethane 35.73 5.44propane 59.29 39.17nitrogen 0 0
Figure 12. Evolution over time of the temperature and of the pressurefor Case 6.
Industrial & Engineering Chemistry Research Article
dx.doi.org/10.1021/ie404128d | Ind. Eng. Chem. Res. 2014, 53, 3931−39373936
VevL = volume of evaporated gas in one day (m3/d)
VinL = initial volume (m3)
W = boiloff (kmol/s)ω = acentric factorx = molar fraction in liquid phase (kmol/kmol)y = molar fraction in vapor phase (kmol/kmol)ZRA = Rackett compressibility factor
Greek SymbolsΔHev,i = molar enthalpy of vaporization (J/kmol)ρ = molar density (m3/kmol)
Superscriptsi = componentL = liquidV = vaporSRK = Soave−Redlich−Kwong
SubscriptsC = critical valueev = evaporatedin = initialL = liquidNBP = normal boiling temperature (K)R = reduced value, i.e., divided by the critical values = saturationSRK = Soave−Redlich−Kwong
AbbreviationsBOG = boiloff gasEoS = equation of stateFSU = former Soviet UnionHBT = Hankinson−Brobst−Thomson equationLNG = liquefied natural gasOECD = Organisation for Economic Co-operation andDevelopmentSRK = Soave−Redlich−Kwong
■ REFERENCES(1) Jensen, J. J. The LNG Revolution; available via the Internet athttp://www.jai-energy.com/pubs/iaeepapr.pdf (last accessed on June6, 2012).(2) Jensen, J. T. The Development of a Global LNG Market. Is ItLikely? If So, When?; Oxford Institute for Energy Studies: Oxford, U.K.,2004.(3) British Petroleum (BP). BP Energy Outlook 2030; London, U.K.,2012.(4) Lin, W. S.; Zhang, N.; Gu, A. Z. LNG (liquefied natural gas): Anecessary part in China’s future energy infrastructure. Energy 2010, 35(11), 4383−4391.(5) Jensen, J.; Dickol, R. Fostering LNG Trade: Developments in LNGTrade and Pricing; Energy Charter Secretariat: Brussels, Belgium, 2009.(6) British Petroleum (BP). BP Statistical Review of World Energy;London, U.K., 2012.(7) Kumar, S.; Kwon, H. T.; Choi, K. H.; Lim, W.; Cho, J. H.; Tak,K.; Moon, I. LNG: An eco-friendly cryogenic fuel for sustainabledevelopment. Appl. Energy 2011, 88 (12), 4264−4273.(8) Aspelund, A.; Gjøvåg, G. A.; Neskå, P.; Kolsaker, K. LNG-chain, acalculation tool for natural gas quality in small scale LNG distributionchains; CR06-133, ICEC-21; Prague, Czech Republic, July 2007.(9) Kountz, K. J. Weathering of on-board storage tanks. Project finalreport; IGT Project 32034-02; Institute of Gas Technology: 1999.(10) Miana, M.; del Hoyo, R.; Rodrigalvarez, V.; Valdes, J. R.;Llorens, R. Calculation models for prediction of Liquefied Natural Gas(LNG) ageing during ship transportation. Appl. Energy 2010, 87 (5),1687−1700.(11) Conrado, C.; Vesovic, V. The influence of chemical compositionon vaporisation of LNG and LPG on unconfined water surfaces. Chem.Eng. Sci. 2000, 55 (20), 4549−4562.
(12) Boe, R. Pool boiling of hydrocarbon mixtures on water. Int. J.Heat Mass Transfer 1998, 41 (8−9), 1003−1011.(13) Dimopoulos, G. G.; Frangopoulos, C. A. A Dynamic Model forLiquefied Natural Gas Evaporation During Marine Transportation. Int.J. Thermodynam. 2008, 11, 123−131.(14) Shah, J. M.; Aarts, J. J. Effect of Weathering on LNG in storagetanks. Adv. Cryog. Eng. 1974, 19, 253−260.(15) Neill, D. T.; Hashemi, H. T.; Sliepcevich, C. M. Boil-off ratesand wall temperatures in aboveground LNG storage tanks. Chem. Eng.Progress Symp. Ser. 1968, 64, 111−119.(16) Adom, E.; Islam, S. Z.; Ji, X. Modelling of boil-off gas in LNGtanks: A case study. Int. J. Eng. Technol. 2010, 2, 292−296.(17) Chen, Q. S.; Wegrzyn, J.; Prasad, V. Analysis of temperature andpressure changes in liquefied natural gas (LNG) cryogenic tanks.Cryogenics 2004, 44 (10), 701−709.(18) Pellegrini, L. A.; Gamba, S.; Moioli, S. Using an AdaptiveParameter Method for Process Simulation of Nonideal Systems. Ind.Eng. Chem. Res. 2010, 49 (10), 4923−4932.(19) Pellegrini, L. A.; Moioli, S.; Gamba, S.; Ceragioli, P. Predictionof vapor−liquid equilibrium for reservoir mixtures with cubicequations of state: Binary interaction parameters for acidic gases.Fluid Phase Equilib. 2012, 326, 45−49.(20) De Guido, G.; Lange, S.; Moioli, S.; Pellegrini, L. A.Thermodynamic method for the prediction of solid CO2 formationfrom multicomponent mixtures. Process Saf. Environ. 2014, 92, 70−79.(21) Soave, G. Equilibrium constants from a modified Redlich−Kwong equation of state. Chem. Eng. Sci. 1972, 27, 1197−1203.(22) Peneloux, A.; Rauzy, E.; Freze, R. A consistent correction forRedlich−Kwong−Soave volumes. Fluid Phase Equilib. 1982, 8 (1), 7−23.(23) Reid, R. C. The Properties of Gases and Liquids; Reid, R. C.,Prausnitz, J. M., Sherwood, T. K., Eds.; McGraw−Hill: New York,1977.(24) Pellegrini, L. A.; Moioli, S.; Gamba, S.; Ceragioli, P. Predictionof volumetric properties of fluids for oil and gas applications. FluidPhase Equilib. 2012, 317, 52−58.(25) Perry, R. H.; Green, D. W. Perry’s Chemical Engineers’ Handbook,7th Edition; McGraw−Hill International: Singapore, 1997.(26) Hankinson, R. W.; Thomson, G. H. A new correlation forsaturated densities of liquids and their mixtures. AIChE J. 1979, 25 (4),653−663.(27) Thomson, G. H.; Brobst, K. R.; Hankinson, R. W. An improvedcorrelation for densities of compressed liquids and liquid mixtures.AIChE J. 1982, 28 (4), 671−676.
Industrial & Engineering Chemistry Research Article
dx.doi.org/10.1021/ie404128d | Ind. Eng. Chem. Res. 2014, 53, 3931−39373937