Embed Size (px)
Citation preview
1
LNG CONCEPTUAL DESIGN STRATEGIES
Arif Habibullah, Peter Lardi, Matthew Passmore WorleyParsons
Arcadia, California, USA
Presented at the 88th GPA Annual Convention in San Antonio, TX, March 2009
ABSTRACT
In the past decade several LNG projects have been built and commissioned and new projects currently in construction are scheduled to be on stream within the next 2-3 yrs. However, due to the rapidly changing market conditions, escalating equipment costs, scarcity of resources for owners, contractors and suppliers, marginal projects will be put on the back burner but will continue to be evaluated for improved economics in the future.
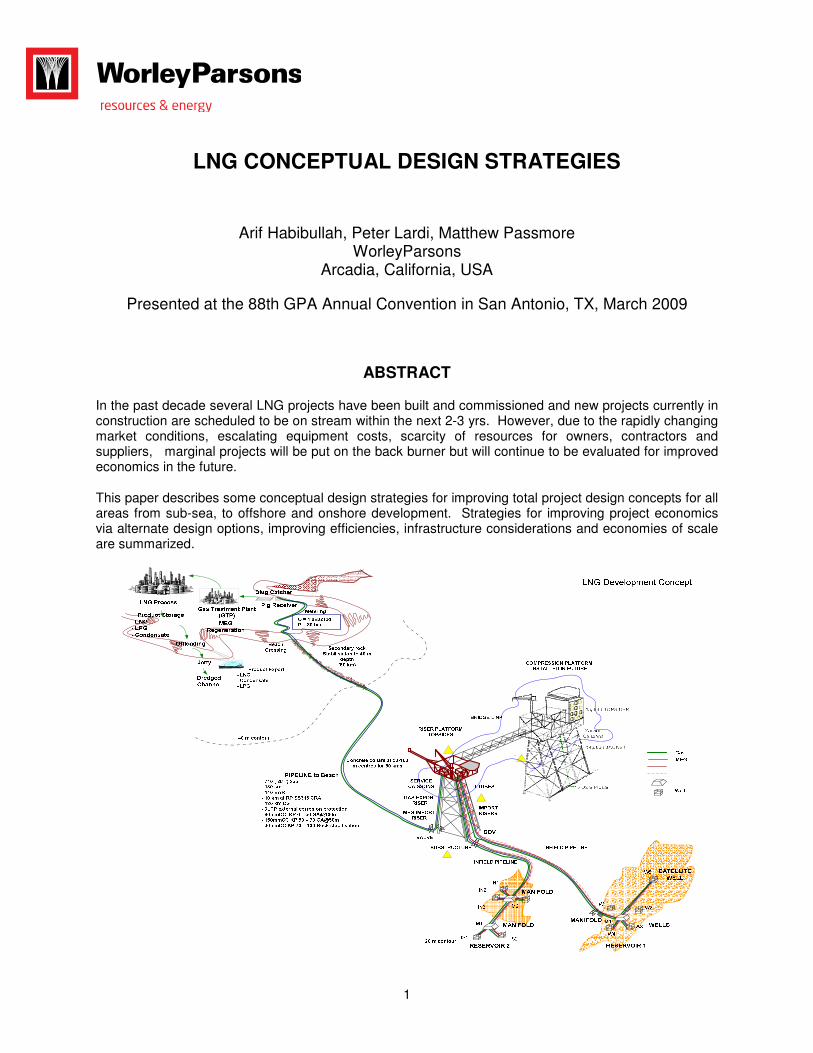
This paper describes some conceptual design strategies for improving total project design concepts for all areas from sub-sea, to offshore and onshore development. Strategies for improving project economics via alternate design options, improving efficiencies, infrastructure considerations and economies of scale are summarized.
2
INTRODUCTION
In order to fully evaluate project viability and assess and identify areas for improving the total project economics, a comprehensive approach is needed that encompasses all components from the sub-sea to offshore and onshore facilities. As such, a clear understanding of each component and its contribution to the total project cost is needed in order to properly identify areas for improvement that will result in enhancing the project economics.
In today’s challenging economic environment projects that were until recently considered ‘a-go’ are now getting a second look and are under close scrutiny to further assess viability. Our goal is to highlight a few strategies that could improve total project economics and help make marginal projects viable.
LNG Development Case Study
A schematic of a LNG Development Concept is shown on the cover page forms the basis for the issues discussed in this paper.
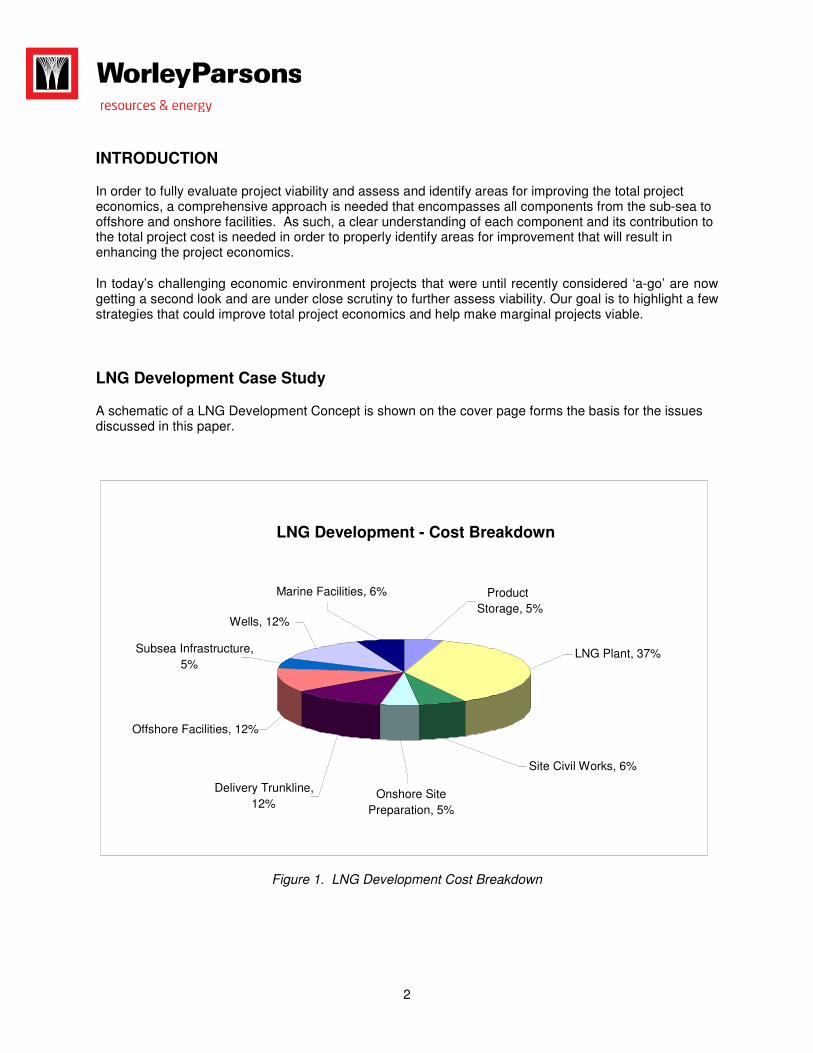
Figure 1. LNG Development Cost Breakdown
LNG Development - Cost Breakdown
Onshore Site
Preparation, 5%
Product
Storage, 5%
Marine Facilities, 6%
Wells, 12%
Subsea Infrastructure,
5%
Offshore Facilities, 12%
Delivery Trunkline,
12%
Site Civil Works, 6%
LNG Plant, 37%
REVIEW OF SITE SELECTION
Site Identification
The site identification is normally driven by assessing a number of selection criteria. Once a site hbeen nominally chosen, a rigorous review utilizing a multiowner will regret until the end of operations.
Some of the site identification issues may impact project success include:
• Fully understanding government preferences in order to minimize approval time
• Distance from reservoir to onshore site and impact on technology limits
• Indigenous (Native) title and land ownership
• Environmental Constraints
3
REVIEW OF SITE SELECTION
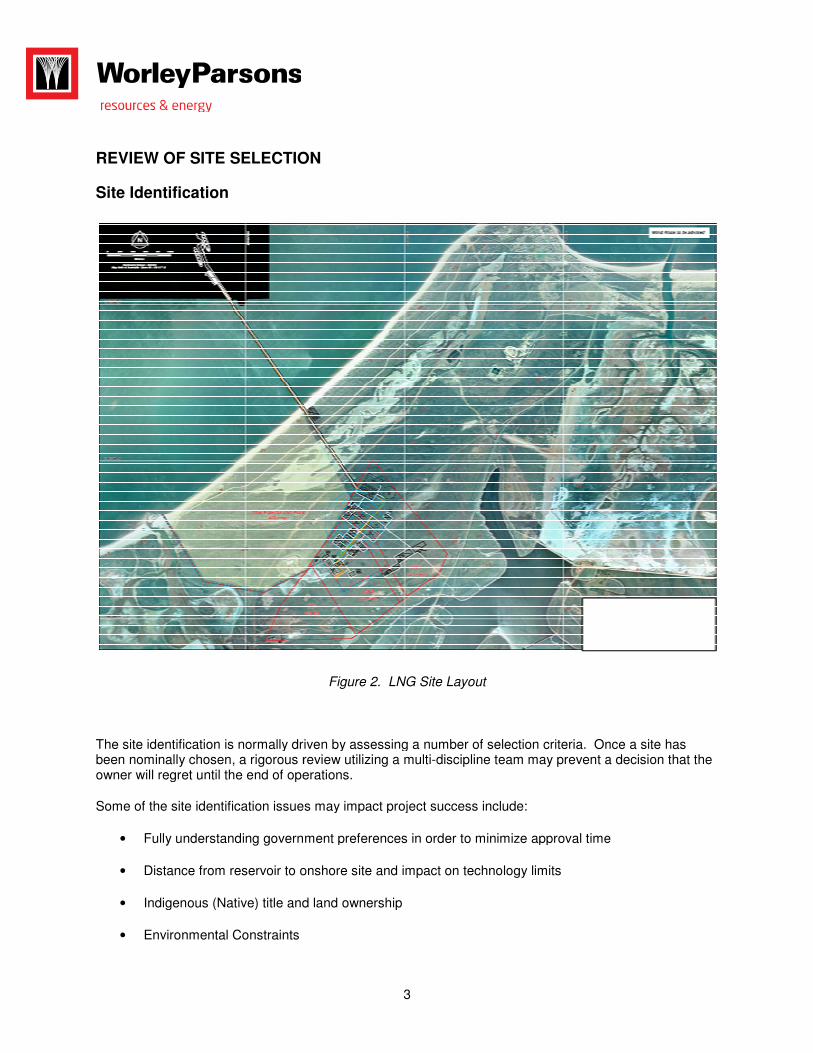
Figure 2. LNG Site Layout
The site identification is normally driven by assessing a number of selection criteria. Once a site hbeen nominally chosen, a rigorous review utilizing a multi-discipline team may prevent a decision that the owner will regret until the end of operations.
Some of the site identification issues may impact project success include:
vernment preferences in order to minimize approval time
Distance from reservoir to onshore site and impact on technology limits
Indigenous (Native) title and land ownership
The site identification is normally driven by assessing a number of selection criteria. Once a site has discipline team may prevent a decision that the
vernment preferences in order to minimize approval time
4
• Need for a deep water harbor and unrestricted shipping access
• Impact of site works and material availability on project cost
• Access to supporting infrastructure (e.g. Airport, rail)
Experience has shown that a well chosen site may reduce site preparation and marine costs (i.e. earthworks and dredging) by up to 5% of total capital cost.
Environmental Issues
Typically there is a resistance to pre-invest prior to project sanction. However, experience would suggest that the availability of accurate environmental data can significantly reduce design risk especially in areas such as subsea, pipelines, offshore structures, onshore foundations and marine facilities.
Environmentally sensitive aspects may include:
• Site for the offshore facilities
• Site for onshore plant
• Trunkline route
• Trunkline beach crossing
• LNG tanker operations
• Dredging
• LNG jetty
• Construction rock availability and quality
Poor definition of environmental criteria can result in extensive rework in areas such as offshore foundations, trunkline routing and operations (i.e. quarantine management).
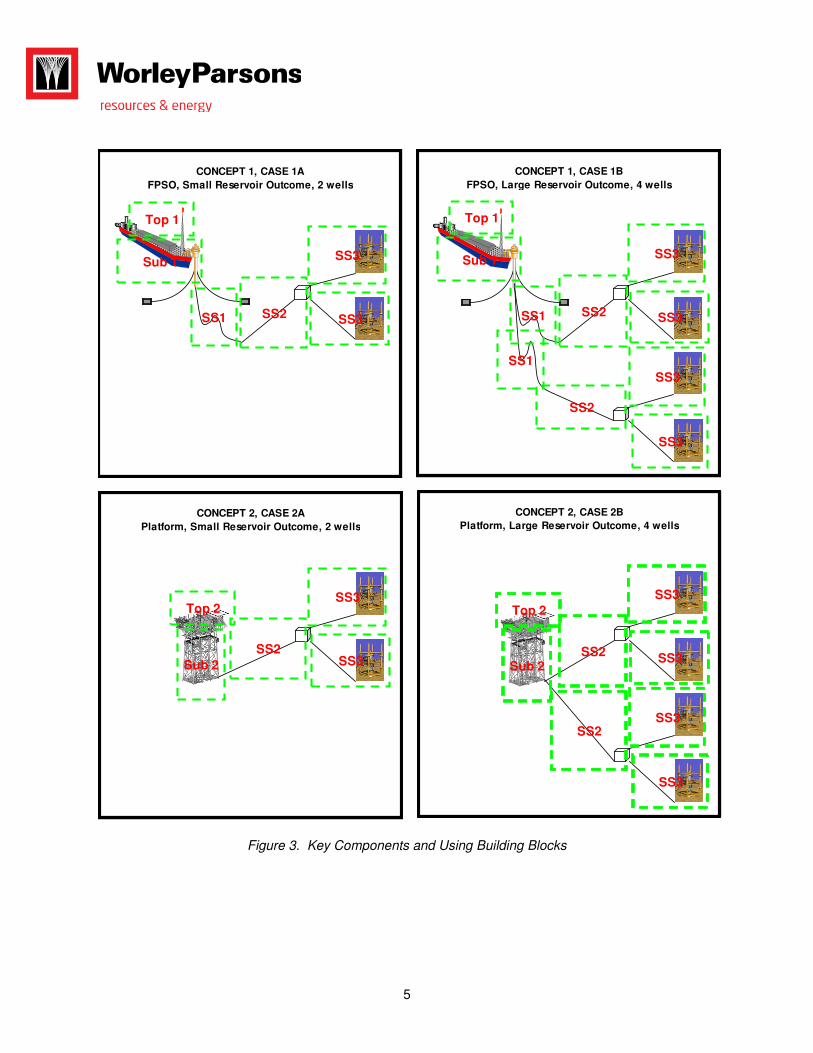
5
Figure 3. Key Components and Using Building Blocks
SS3
SS3
SS2SS1
Top 1
Sub 1
SS3
SS3
SS2
SS1
CONCEPT 1, CASE 1B
FPSO, Large Reservoir Outcome, 4 wells
SS3
SS3
SS2
SS3
SS3SS2
Top 2
Sub 2
CONCEPT 2, CASE 2B
Platform, Large Reservoir Outcome, 4 wells
SS3
SS3
SS2
Top 2
Sub 2
CONCEPT 2, CASE 2A
Platform, Small Reservoir Outcome, 2 wells
SS3
SS3
SS2SS1
Top 1
Sub 1
CONCEPT 1, CASE 1A
FPSO, Small Reservoir Outcome, 2 wells
SS3
SS3
SS2SS1
Top 1
Sub 1
SS3
SS3
SS2
SS1
CONCEPT 1, CASE 1B
FPSO, Large Reservoir Outcome, 4 wells
SS3
SS3
SS2
SS3
SS3SS2
Top 2
Sub 2
CONCEPT 2, CASE 2B
Platform, Large Reservoir Outcome, 4 wells
SS3
SS3
SS2
Top 2
Sub 2
CONCEPT 2, CASE 2A
Platform, Small Reservoir Outcome, 2 wells
SS3
SS3
SS2SS1
Top 1
Sub 1
CONCEPT 1, CASE 1A
FPSO, Small Reservoir Outcome, 2 wells
6
OFFSHORE DEVELOPMENT
Drilling
Well costs can make up 12-15% (Refer to Figure 1) of the complete development depending on geographic region, water depth, reservoir characteristics, number required and installation technique. Selecting the optimal installation technique can save up to 50% of the well installation costs. Typically, the owner must make an early decision on whether to use a full subsea development versus having an offshore production facility.
If an offshore facility is considered, then it is necessary to evaluate:
• Drilling “wet wells” using a Semi Submersible (Semi-Sub) Drilling Rig
• Drilling “dry wells” by Tender Assist (TAD)
• Drilling “dry wells” from facility based integrated drilling module
• Drilling a combination of the previous three items
Note: Wet wells are subsea wells which utilize subsea Christmas trees while dry wells are installed on the platform topsides.
A well developed component based (building blocks) approach (See Figure 3), has been shown to enable quick response to changing reservoir and well constraints and quickly allow reconfiguration of options.
Subsea Recovery Systems
A full subsea recovery system removes the need for expensive offshore real estate and the ongoing associated operating cost. This needs to be balanced against reduced access to wells and reduced flexibility in process design. The decision is often closely linked to the results from flow assurance. Options include:
• Complete subsea development with remote controls at onshore facility
• Complete subsea development with spar supported controls
• Subsea infrastructure complimented by offshore facility (See Figure 4)
• A variety of subsea configurations such as ring main and daisy chain
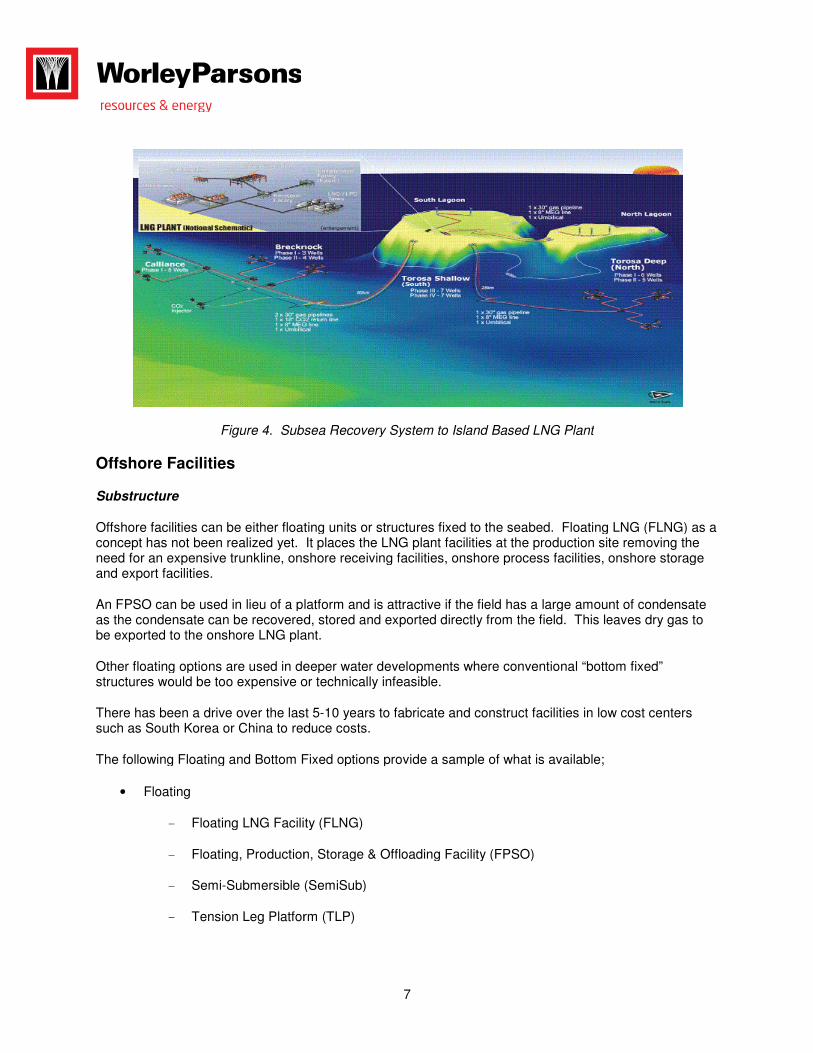
Figure 4. Subsea Recovery System to Island Based LNG Plant
Offshore Facilities
Substructure
Offshore facilities can be either floating units or structures fixed to the seabed. Floating LNG (FLNG) as a concept has not been realized yet. It places the LNG plant facilities at the production site removing the need for an expensive trunkline, onshore receiving facilities, onshore process facilities, onshore storage and export facilities.
An FPSO can be used in lieu of a platform and is attractive if the field has a large amount of condensate as the condensate can be recovered, stored and exported directly from the field. This leaves dry gas to be exported to the onshore LNG plant.
Other floating options are used in deeper water developments where conventional “bottom fixed” structures would be too expensive or technically
There has been a drive over the last 5such as South Korea or China to reduce costs.
The following Floating and Bottom Fixed options provide a sample of what is available;
• Floating
- Floating LNG Facility (FLNG)
- Floating, Production, Storage & Offloading Facility (FPSO)
- Semi-Submersible (SemiSub)
- Tension Leg Platform (TLP)
7
Subsea Recovery System to Island Based LNG Plant
Offshore facilities can be either floating units or structures fixed to the seabed. Floating LNG (FLNG) as a concept has not been realized yet. It places the LNG plant facilities at the production site removing the
pensive trunkline, onshore receiving facilities, onshore process facilities, onshore storage
An FPSO can be used in lieu of a platform and is attractive if the field has a large amount of condensate ed, stored and exported directly from the field. This leaves dry gas to
be exported to the onshore LNG plant.
Other floating options are used in deeper water developments where conventional “bottom fixed” structures would be too expensive or technically infeasible.
There has been a drive over the last 5-10 years to fabricate and construct facilities in low cost centers such as South Korea or China to reduce costs.
The following Floating and Bottom Fixed options provide a sample of what is available;
Floating LNG Facility (FLNG)
Floating, Production, Storage & Offloading Facility (FPSO)
Submersible (SemiSub)
Tension Leg Platform (TLP)
Offshore facilities can be either floating units or structures fixed to the seabed. Floating LNG (FLNG) as a concept has not been realized yet. It places the LNG plant facilities at the production site removing the
pensive trunkline, onshore receiving facilities, onshore process facilities, onshore storage
An FPSO can be used in lieu of a platform and is attractive if the field has a large amount of condensate ed, stored and exported directly from the field. This leaves dry gas to
Other floating options are used in deeper water developments where conventional “bottom fixed”
10 years to fabricate and construct facilities in low cost centers
8
• Bottom Fixed
- Steel Jacket
- Jack-up
- Concrete
- Hybrid
- Proprietary (custom made and installed – i.e. “float outs”)
Topside Facilities
There are many potential decisions with topsides layout and phasing which can impact the overall CAPEX of offshore facilities. One of the primary decisions is to how to handle future compression. As the pressure of a gas field declines, compression is required to maintain feed gas flow. The decision on the compression installation and phasing needs to address:
• Cost to accommodate future gas compression on the start-up facility vs construction of a future additional facility (pre-investment)
• How this decision affects the configuration of the subsea recovery system
• Impact on operations
Decision to pre-invest is largely dependent on the pressure decline period. Typically if compression is required within 6-8 years after start-up then pre-investment may be an attractive option.
Trunkline
The function of the trunkline is to transport gas from the offshore field to the LNG Plant. The trunkline can be operated wet, dry or wet with MEG injection. Operating wet reduces offshore equipment and simplifies offshore facilities making it possible to operate an “unmanned” facility. The downside is higher pipeline material costs, cost of chemical injection, regular pigging and the potential for flow assurance issues such as hydrate formation. As installed trunklines can cost as much as $US10 million/mile, then small improvements can result in large savings.
Dry pipelines typically use carbon steel but require costly separation, dehydration and dew point control facilities offshore. MEG injection reduces some of the flow assurance issues but requires a costly recovery and recirculation plant either offshore or onshore.
For field life of over 15 years, a dry trunkline concept will most likely provide a lower lifecycle cost than a wet trunkline option. A primary input into this decision is the impact lost production in the LNG facility.
In certain parts of the world, the process discussion can be complicated by the necessity to provide extensive stabilization for the pipeline. While providing protection from the environment, the stabilization media can significantly alter the pipeline temperature profile and therefore the physical properties of the production fluids.
9
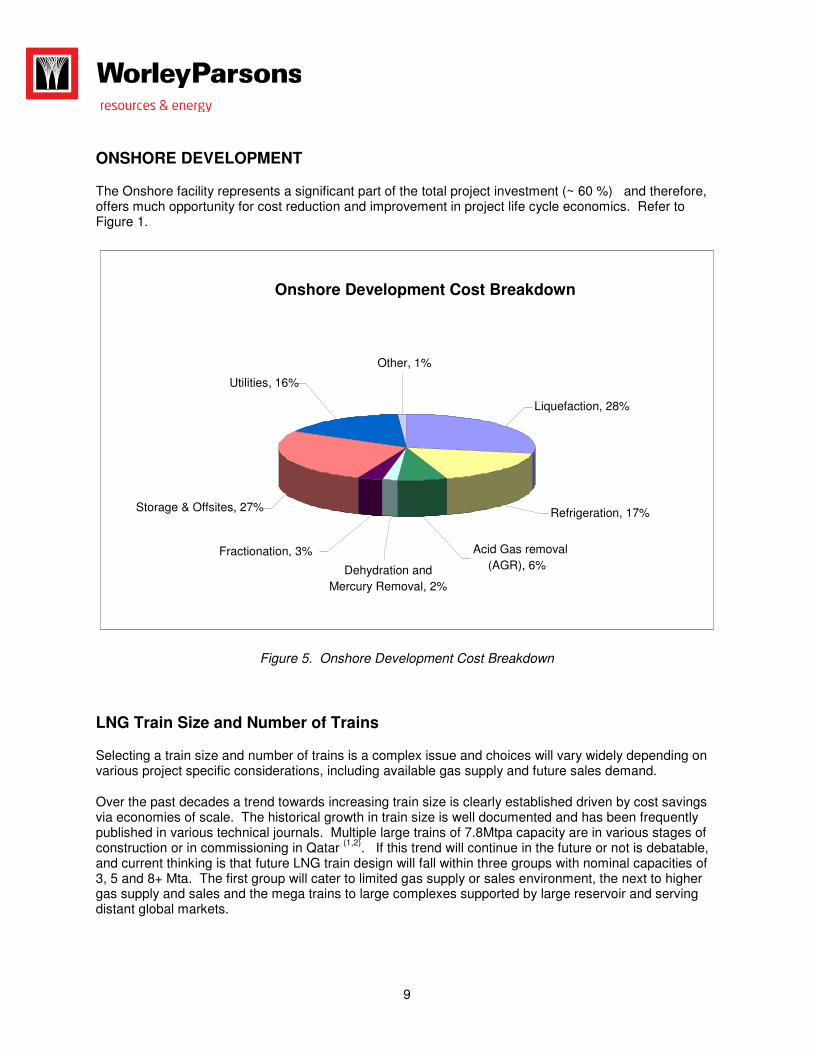
ONSHORE DEVELOPMENT
The Onshore facility represents a significant part of the total project investment (~ 60 %) and therefore, offers much opportunity for cost reduction and improvement in project life cycle economics. Refer to Figure 1.
Figure 5. Onshore Development Cost Breakdown
LNG Train Size and Number of Trains
Selecting a train size and number of trains is a complex issue and choices will vary widely depending on various project specific considerations, including available gas supply and future sales demand.
Over the past decades a trend towards increasing train size is clearly established driven by cost savings via economies of scale. The historical growth in train size is well documented and has been frequently published in various technical journals. Multiple large trains of 7.8Mtpa capacity are in various stages of construction or in commissioning in Qatar
(1,2). If this trend will continue in the future or not is debatable,
and current thinking is that future LNG train design will fall within three groups with nominal capacities of 3, 5 and 8+ Mta. The first group will cater to limited gas supply or sales environment, the next to higher gas supply and sales and the mega trains to large complexes supported by large reservoir and serving distant global markets.
Onshore Development Cost Breakdown
Dehydration and
Mercury Removal, 2%
Liquefaction, 28%
Other, 1%
Utilities, 16%
Storage & Offsites, 27%
Fractionation, 3% Acid Gas removal
(AGR), 6%
Refrigeration, 17%
10
Reservoir size must support the plant capacity through the duration of the project life. For a given plant capacity the number of trains may be depend on various factors including some of those listed below.
• Reservoir size
• Site conditions including plot space
• Existing infrastructure
• Phased-in capacity to meet LNG market and future expected demand (initially build smaller trains and add trains as demand grows)
• Greenfield or expansion of existing facility, e.g. replicating existing trains
• Economies of scale ( a single train facility saves over 10% of capital cost of 2x50% trains)
• Provisions for future expansion in a base case design
• Equipment limits (e.g. AGR absorber, main cryogenic exchanger, C3 compressor)
• Vendor base to build large equipment
• Transportation constraints
• In a modularized plant the maximum module size can limit train size depending on site conditions
Modularization
The costs of modular units are generally 10-15% higher than field erected units since modules are designed to withstand the rigors of shipping and require more structural steel. However, higher cost of modularization is often offset by performing the work at the fabrication site instead of the field. It reduces the overall project cost due to lower field construction costs and shorter construction schedule.
Few LNG modularization concepts have been applied to-date. However, alternate modularization approaches will continue to be developed in order to further reduce costs.
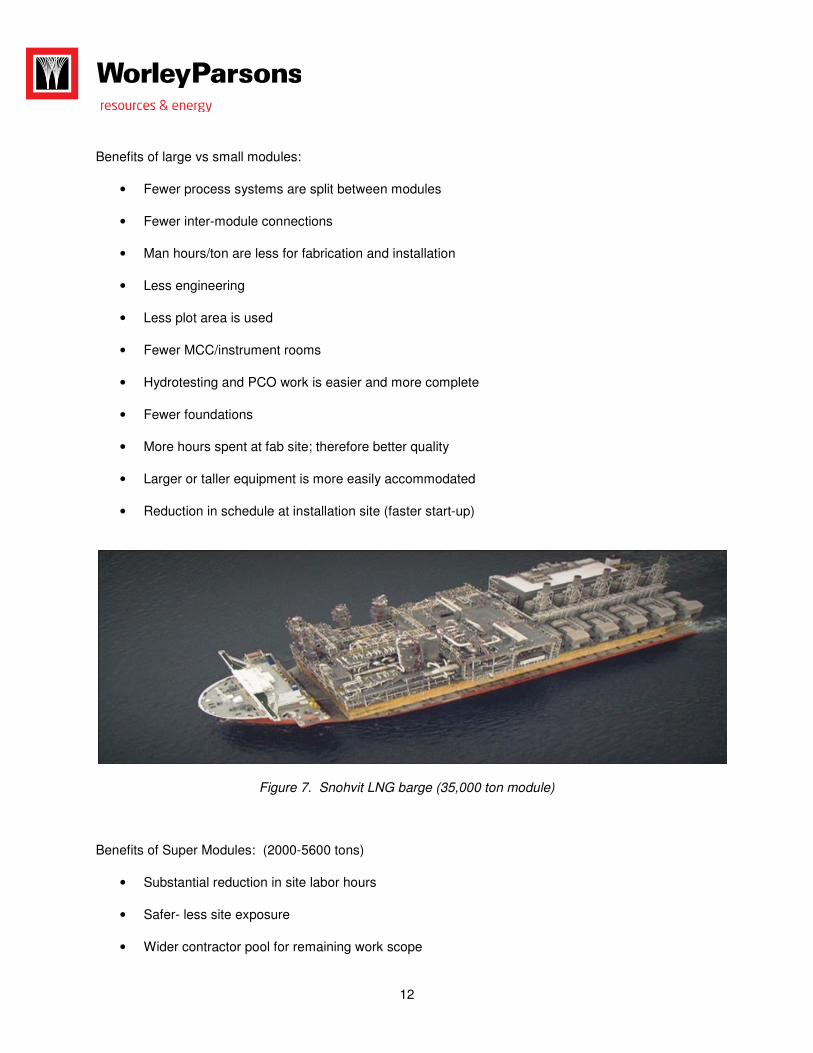
The Snovhit project (See Figure 7) was based on stick-building the LNG train on a custom designed barge in Spain and then shipped to site on a heavy lift vessel. This strategy reduced the construction schedule particularly due to the site’s narrow construction window. An alternative approach may involve building the barge and modules concurrently prior to final module assembly, resulting in further schedule reduction.
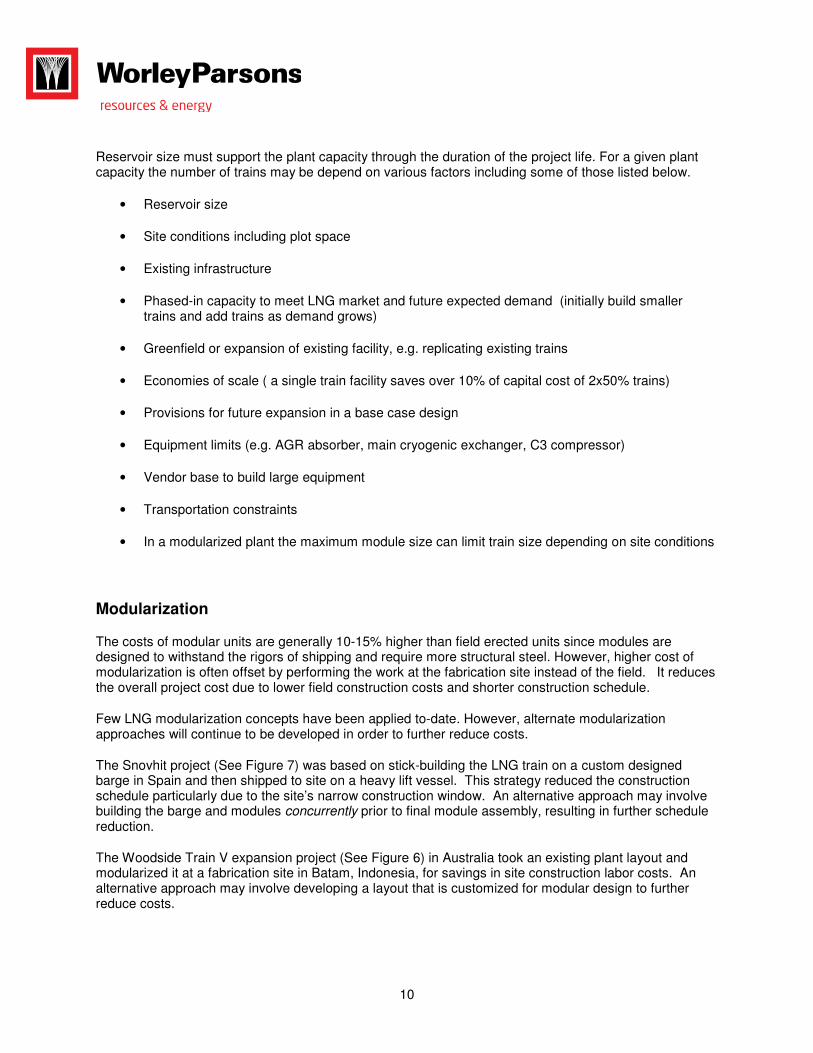
The Woodside Train V expansion project (See Figure 6) in Australia took an existing plant layout and modularized it at a fabrication site in Batam, Indonesia, for savings in site construction labor costs. An alternative approach may involve developing a layout that is customized for modular design to further reduce costs.
11
Figure 6. Woodside Train V Expansion Project module (35-1800tons module range) 18,000 tons total module weight.
Modularization can reduce costs, however, site specific issues should be addressed:
• Environmental regulation - including cost of environmental issues related to bringing in modules to construction site
• Where lengthy permitting process is involved the project schedule can be reduced by early start of work at the fabrication site
• Local skilled labor availability
• Site access
• Plot space limitation
• Potential of weather related delays and issues with construction window
• Extent of dredging requirements to bring large modules in larger modules can reduce costs.
12
Benefits of large vs small modules:
• Fewer process systems are split between modules
• Fewer inter-module connections
• Man hours/ton are less for fabrication and installation
• Less engineering
• Less plot area is used
• Fewer MCC/instrument rooms
• Hydrotesting and PCO work is easier and more complete
• Fewer foundations
• More hours spent at fab site; therefore better quality
• Larger or taller equipment is more easily accommodated
• Reduction in schedule at installation site (faster start-up)
Figure 7. Snohvit LNG barge (35,000 ton module)
Benefits of Super Modules: (2000-5600 tons)
• Substantial reduction in site labor hours
• Safer- less site exposure
• Wider contractor pool for remaining work scope
13
• Up to 50% reduction in plot space
• Significant CAPEX savings
• Site directs substantially reduced
• Reduced camp requirements
Plot Space Reduction
A smaller plant footprint can reduce costs. Reduction in foot print may also be necessary when adding LNG trains to an existing complex within limited space. Either way, various strategies include:
• Common facilities- utilities are often located in a common area. However, it may be possible to combine other units to service multiple trains, e.g. Inlet facilities, common fractionation plant, LPG treating, etc.
• Stacking of equipment - e.g., Refrigeration suction scrubbers, propane chillers (including multi-level structure).
• Use of proprietary internals (e.g. Centrifugal devices) to reduce vessel diameters.
• Use of new low finned and double enhanced tube technology (using nucleate boiling structures for small delta TS), for significant reduction in C3 chiller and condenser diameters and length.
• Reduce controlling flare load and hence radiation circle by eliminating C3 compressor blocked discharge case, (see flare minimization).
• Combine all flare stacks in a derrick retractable flare system, including spare stack.
• Use inlet gas heating for hydrate control vs e.g., TEG.
• Consider DLN (dry low NOx) vs SCR which requires significant plot space and higher opex and capex. DLN also improves plant availability.
• Use GT exhaust heat for regenerating molesieves (eliminates regeneration fired heaters).
Motor Driven LNG plant
A motor driven LNG plant increases thermal efficiency of the facility providing higher LNG production. The larger and more efficient GTs in a centralized power plant (possibly CCGT) can provide an overall efficiency increase of 5-10%. This could translate into an incremental LNG production up to 0.5%, depending on project specific requirements and conditions.
Large motor drivers are now being considered as an option for driving refrigeration compression. Statoil’s Snohvit LNG plant opted for 65MW motors for refrigeration compressors powered by a centralized power
14
plant consisting of LM6000 GTGs. However, the facility is connected to the grid for back-up which is unusual for most LNG projects under consideration. The LNG trains coming on stream in Qatar use Frame 9Es with 45MW (rated) motor/generators for refrigeration compression
(1,2).
The commercial benefits of a motor driven plant are:
• Higher production efficiency (i.e. more LNG production)
• Higher thermal efficiency
• Lower CO2 emissions
• Shorter delivery schedule of motors vs GTs reduces overall schedule
• Motors are better suited for a modular designs, hence lower installed cost.
CAPEX for the electric motor driven plant option is higher, primarily due to the addition of a large power plant. However, there is a net increase in NPV due to the higher availability compared to a GT driven plant, and a shorter project schedule. These two factors alone often outweigh the higher cost of the larger power plant.
Improving Plant Efficiency via aeroderivative GTs
The two areas that influence the LNG plant efficiency are turbo-machinery and cryogenic heat exchange. Given the maturity of LNG liquefaction processes, there is little room for further tightening of exchanger temperature approaches.
That leaves two areas that significantly impact plant efficiency:
• Refrigeration compressors
• GT drivers.
Compressor efficiencies are already in the high 80s, therefore, selection of the GT will determine the thermal efficiency and CO2 emissions for the liquefaction turbo-machinery. With increasing emphasis on reducing greenhouse gas and the higher value of fuel, the more efficient aeroderivative GTs offer commercial benefits. With a thermal efficiency of over 40% comes a reduction in CO2 emissions. CO2 emissions are one-third less per HP generated with an aeroderivative vs a frame unit (see Table-1).
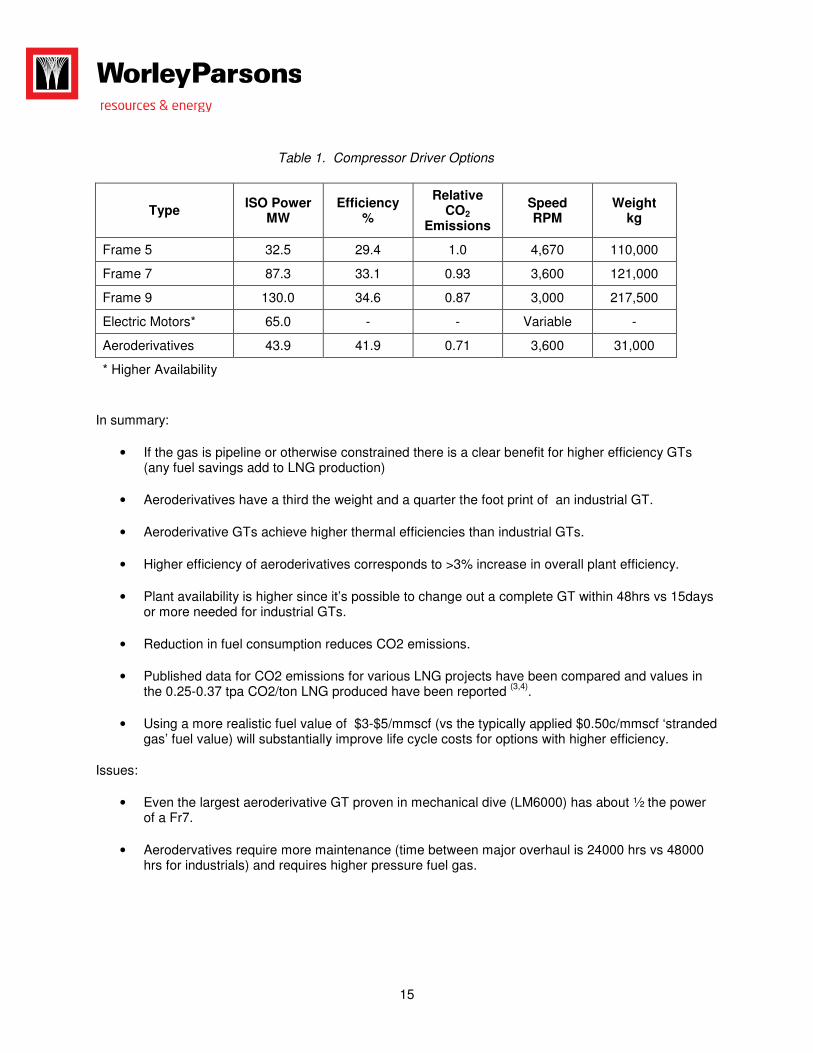
15
Table 1. Compressor Driver Options
Type ISO Power
MW Efficiency
%
Relative CO2
Emissions
Speed RPM
Weight kg
Frame 5 32.5 29.4 1.0 4,670 110,000
Frame 7 87.3 33.1 0.93 3,600 121,000
Frame 9 130.0 34.6 0.87 3,000 217,500
Electric Motors* 65.0 - - Variable -
Aeroderivatives 43.9 41.9 0.71 3,600 31,000
* Higher Availability
In summary:
• If the gas is pipeline or otherwise constrained there is a clear benefit for higher efficiency GTs (any fuel savings add to LNG production)
• Aeroderivatives have a third the weight and a quarter the foot print of an industrial GT.
• Aeroderivative GTs achieve higher thermal efficiencies than industrial GTs.
• Higher efficiency of aeroderivatives corresponds to >3% increase in overall plant efficiency.
• Plant availability is higher since it’s possible to change out a complete GT within 48hrs vs 15days or more needed for industrial GTs.
• Reduction in fuel consumption reduces CO2 emissions.
• Published data for CO2 emissions for various LNG projects have been compared and values in the 0.25-0.37 tpa CO2/ton LNG produced have been reported
(3,4).
• Using a more realistic fuel value of $3-$5/mmscf (vs the typically applied $0.50c/mmscf ‘stranded gas’ fuel value) will substantially improve life cycle costs for options with higher efficiency.
Issues:
• Even the largest aeroderivative GT proven in mechanical dive (LM6000) has about ½ the power of a Fr7.
• Aerodervatives require more maintenance (time between major overhaul is 24000 hrs vs 48000 hrs for industrials) and requires higher pressure fuel gas.
16
RAM Analysis
A conceptual RAM analysis will predict the facility production performance and identify key contributors to production loss by unit. This type of preliminary analysis helps identify areas with the highest potential for increasing Production Efficiency (PE) and hence more LNG production. Results from an analysis of this type varies widely and depends on the technology applied, plant configuration, sparing philosophy and type of compression drivers, etc.
For GT driven LNG plants studies show that the refrigeration drivers are the largest contributors of the losses through scheduled and unscheduled outages. Up to about 2/3
rd of the total losses can be
attributed to refrigeration drivers. Therefore, any reduction in the durations needed for scheduled turbine inspections can improve PE substantially. Using the owner’s plant inspection history vs manufacturer’s recommendations should be reviewed for possible reduction in scheduled downtime.
In summary, some areas for increasing availability are:
• For GT driven plants the production efficiency is driven by the GT turbine drivers.
• The largest production loss is caused by the scheduled GT turbine maintenance schedule which governs the performance of the LNG plant.
• The second largest contributors to the losses are the unscheduled failures of the GTs and compressors (up to 70% of losses due to GT, 25% due to compressors) that drive the refrigeration trains.
• The third largest contributors are the restart losses after a plant trip
• Annual production efficiency varies year by year and is highest during the years with no gas turbine maintenance and can drop by up to 5% or more during years with Major Inspection (MI), and up to 3% during the Combustion Inspections (CI) and Hot Gas Path Inspections (HGPI).
• Reduction in scheduled maintenance durations for both HGPI and MI by say 5 days, PE can potentially be increased by ~ 0.4%.
• Consider use of GE Extendor ™ kits, if applicable, to increase CI intervals to twice as long; e.g. PE increase of up to 0.8%.
• Single train restart time is dominated by the required cool down time and a reduction can increase PE by up to 0.2-0.3%.
• ‘What-if’ scenarios should be run to evaluate impact of sparing selective equipment on PE. For example, sparing the off-gas compressor in the inlet facility can result in PE increase of up to 0.5%.
Further increase in plant availability is possible:
• Review if flaring is acceptable during FG compressor trip vs a train trip.
• Review if SRU trip and acid gas flaring is acceptable vs a train trip.
17
Flare Minimization
With increased emphasis on taxing CO2 emissions and the high cost of fuel, flare minimization reduces project life cycle cost. Flaring reduction can potentially be achieved by the following considerations:
• Review of various HIPS applications have been successfully employed in the LNG industry for reducing costs without jeopardizing overall safety.
(5)
• Design the facility for 2:1 or higher turndown to minimize flaring.
• Incorporate sufficiently high % of fuel-from-feed in the fuel balance to allow for better control and trimming of fuel to maintain plant fuel balance without excess flaring.
• Design the fuel gas compressor with a good margin to allow for future increase in end flash gas production (as throughput increases) to avoid flaring excess fuel gas.
• Provide means to recycle flared gas to front end of the plant (e.g. collect derime gas and recycle to dehydration unit inlet via fuel gas compressor); also recycle gas during pre-cool down instead of flaring.
• Consider increasing design pressure of C3 refrigeration compressor (often the controlling case for flare sizing) to reduce flare size (by up to half) during blocked discharge scenario.
• Consider routing streams normally going to flare, where possible, to fuel systems.
• Upgrade specs to include double isolation on all connections to flare to minimize losses due to leaks; include 150# systems which would normally have single isolation.
• Critical control valves fitted with isolation to allow for removal of malfunctioning valve without purging entire unit.
• If sufficient driver HP is available, consider the possibility of a full pressure restart/or partial depressurization for faster restart of the liquefaction plant after a trip; also increases plant availability.
Nitrogen Rejection
Typical nitrogen spec of 1mol% is often met using an end flash. However, and any further reduction in nitrogen content allows shipment of more LNG. In addition, today’s large ships are equipped with re-liquefaction plants for which the higher nitrogen content is not optimum.
In summary, the modest incremental capital investment in a stripper column increases revenue:
• High Btu, low N2 LNG provides greater annual revenue .
• Increases LNG shipping efficiency and produces more LNG .
• Provides incremental condensate sales revenue.
18
• Newer ships (e.g. Q-flex LNG carriers) are fitted with re-liquefaction units, therefore more cargo is delivered with each voyage.
• Provides better control on the amount of N2 in fuel gas (important for meeting gas quality for DLN combustors).
Issues:
• No incremental LNG if feed gas limited.
• Fuel gas from the column has a higher nitrogen content and may require blending with other sources to meet DLN requirements.
SUMMARY
As a result of the current global economic slump marginal projects will be deferred but will continue to be evaluated for improved economics in the future. Unique conceptual design strategies are needed to re-assess these projects to improve their economic viability.
Developing strategies for improving project economics requires revisiting project design concepts of all components including sub-sea, offshore and onshore development. A total project evaluation capability is required to properly identify areas of improvement with potential for enhancing project economics.
REFERENCES
1. Salisbury, et al, Design, Manufacture and Test Campaigns of the World’s largest LNG Refrigeration Compressor Strings, 2007 LNG15 Conference, Barcelona, Spain.
2. Pillarella, et al., LARGE LNG TRAINS: Developing the Optimum Process Cycle
3. C.Yost, R.DiNapoli, Benchmarking study compares LNG costs, O&GJ 4/14/03.
4. Jeff, Sawchuk et al, “BP’s Big Green Train: Benchmarking Next Generation LNG Plant Designs, Gastech 2005.
5. Thomas, C., Bourjeous, P., High Integrity Protective Systems, OGJ May 8, 2000.