Embed Size (px)
Citation preview

Living Standards Measurement Study-Integrated Surveys on Agriculture:
Innovations Built on Tradition
Innovations In Survey Design for PolicyPREM week
April 26, 2011

MOTIVATIONImportance of agriculture for poverty
reduction, yet: Poor data: low quality, inadequate periodicity
and comparability, lack of policy relevance Failure to address high levels of
diversification, linkages to non-farm, poverty, health, …
Lack of panel data Institutional constraints in agricultural data
production and analysis Lack of analytical capacity Poor dissemination of data and findings Overall, too little attention to agriculture and
agricultural statistics

OPTIONS Strengthen Farm Surveys
Agricultural production units (rural) only Single sector coverage Weak statistical capacity Organizational structure/data quality control
Strengthen Multi-purpose Surveys (LSMS) Thematic trade-offs Sampling issues (minor crops, commercial
farms, …) Global Strategy for the Improvement of
Agricultural and Rural Statistics Integration
LSMS-Integrated Surveys on Agriculture

APPROACH In the tradition of the LSMS, not
“one-size-fits-all” Build on existing systems Cross-country “convergence” over
time Inter-institutional, inter-agency effort Work on 4 fronts:
Household survey data collection Methodological validation/research Capacity Building Dissemination

MAIN FEATURES• Panel
– Frequency (varies by country)– Tracking of movers– Tracking of split-offs
• Sample design– Population-based frame– Sample size
• Relatively small at baseline (3,000-5,000 HHs)
• Few domains of inference
MAIN FEATURES (cont’d)
Integrated approach Multi-topic survey instrument
Agriculture plus non-farm, poverty, nutrition, inter alia
Build on existing/planned surveys Local partners: National Statistical Office,
MoA National Strategy for the Development of
Statistics (NSDS) Improved links to other data sources
PopCensus, AgCensus (Small Area Estimation) Geo-referencing Multiple instruments

MAIN FEATURES (cont’d) From Centralized to Field-based data
entry (concurrent) to Computer Assisted Personal Interviews (CAPI)
Use of GPS for plot location and measurement
Public Access Data Policy Inter-agency collaborations
Global: WFP, IFAD, WFC, IFPRI, FAO, ARD, …
In-country: USAID, DFID, GTZ, Stat Norway, …

COUNTRIES Tanzania National Panel Survey: wave 2 in the
field; wave 1 data available Uganda National Panel Survey: Wave 2 in the
field, wave 1 linked to 2005/06 UNHS Malawi Integrated Panel Household Survey:
Wave 1 completed Nigeria General Household Survey Panel: Wave
1 completed Niger Enquête National sur les Conditions de
Vie Des Ménages: Wave 1: Spring 2011 Ethiopia Agriculture Sample Survey: Wave 1:
Fall 2011 Mali Integrated Agricultural Survey: Spring
2012; pilot activities in Fall 2011

METHODOLOGY• Recall vs. Diary (vs. crop cutting) for
production estimates• GPS vs. self-reported area
measurement (vs. compass and rope)• Use of mobile phones• Measurement of income components• Livestock
– Milk– Stocks by breed– Pastoralists

SOURCEBOOKS• Tracking• Sampling Weights in Panel Surveys• Fishery• Livestock• Climate Change
– “Land-based”– “Water-based”

Example 1: USING GPS Non-sampling errors in agricultural statistics known
to be large data collection methodology and techniques interviewer’s effect, respondents’ interpretation questions motivation/incentive to provide accurate answers
Use of GPS offers opportunity to improve land, and thus yield, measures
Differences with self-reporting may be substantial Difference varies by farm size, thus potential effect
on yields and Inverse Farmsize-Productivity Relationship (IR)
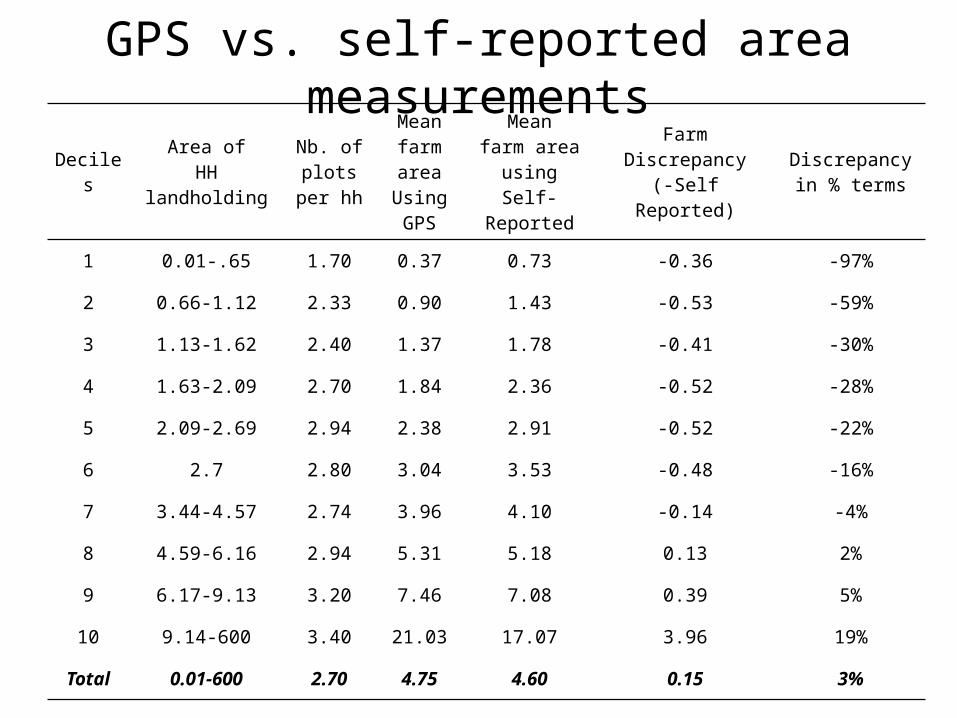
GPS vs. self-reported area measurements
Deciles Area ofHH landholding
Nb. of plots per
hh
Meanfarm area
UsingGPS
Meanfarm area
usingSelf-Reported
Farm Discrepancy(-Self Reported)
Discrepancy in % terms
1 0.01-.65 1.70 0.37 0.73 -0.36 -97%
2 0.66-1.12 2.33 0.90 1.43 -0.53 -59%
3 1.13-1.62 2.40 1.37 1.78 -0.41 -30%
4 1.63-2.09 2.70 1.84 2.36 -0.52 -28%
5 2.09-2.69 2.94 2.38 2.91 -0.52 -22%
6 2.7 2.80 3.04 3.53 -0.48 -16%
7 3.44-4.57 2.74 3.96 4.10 -0.14 -4%
8 4.59-6.16 2.94 5.31 5.18 0.13 2%
9 6.17-9.13 3.20 7.46 7.08 0.39 5%
10 9.14-600 3.40 21.03 17.07 3.96 19%
Total 0.01-600 2.70 4.75 4.60 0.15 3%

Yield and farmsize
LandholdingAverage
land areas Yield (GPS)
Yield (Self Reported)
Bias in yield (GPS-Self Reported)
Acres
Acres
USD/acre USD/acre %
Small Farms 0.01-1.45 0.7 236 170 28%
Medium Farms 1.46-3.57 2.4 208 193 7%
Large Farms 3.58- 600 10.3 77 100 -30%

Bias in land measurement: “Heaping”
05
10
15
20
25
% (
Are
a s
elf
Re
po
rte
d)
02
64
8%
(A
rea G
PS
)
0 1 2 3 4x...
GPS Farmers' Estimate
Plot Size Measured with GPS and Farmers ' Estimate

Testing the IR
iiii
i uBXAA
Y 3210 lnln
Yi /Ai = Yield (value of output per acre)Ai =land area cultivatedXi = vector of HH characteristicsBi = Bias land Ui = error term
IR=
Beta1 (-)

(1) (2)
Dep. Variable Agric.Yield Self-Reported GPS
Log Land Size -0.62*** -0.83***
Observations 2860 2861
R-squared 0.60 0.63

Yields and farm size
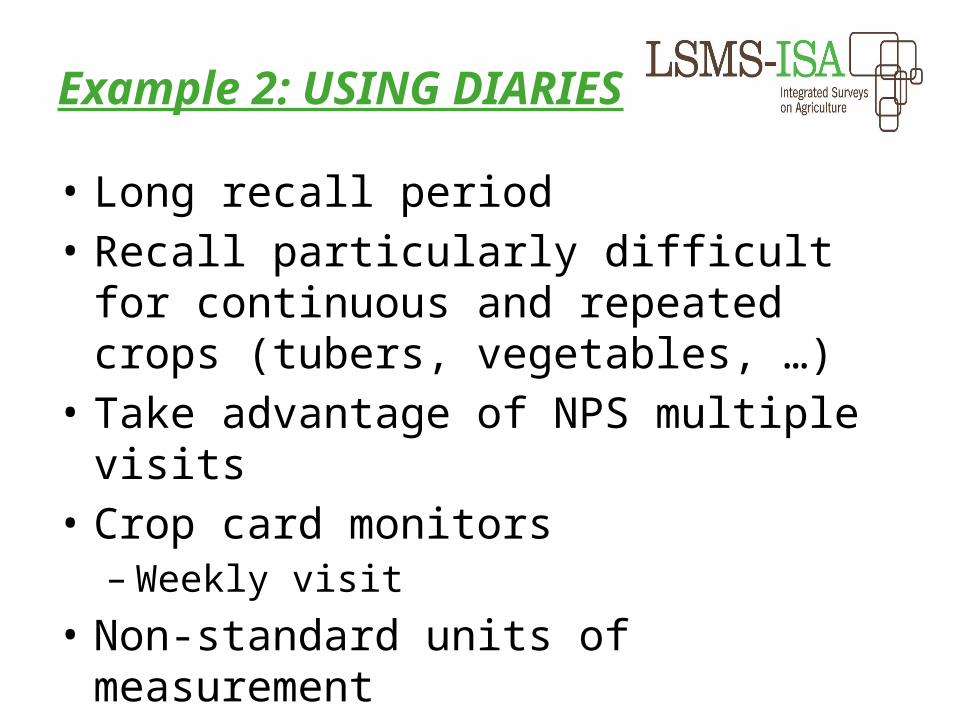
Example 2: USING DIARIES
• Long recall period• Recall particularly difficult for
continuous and repeated crops (tubers, vegetables, …)
• Take advantage of NPS multiple visits
• Crop card monitors– Weekly visit
• Non-standard units of measurement

Diaries vs. recall Frequency (%) Production value ($) No. of entries
Diary Recall Diary Recall DiaryCash crops Coffee 21.69 31.89 10.63 29.69 6.99Rice 12.29 5.43 15.74 8.96 5.11Cotton 0.57 9.14 0.5 6.12 2.61Sugarcane 17.36 4.21 0.37 3.85 6.64All cash crops 27.24 48.62Food crops seasonalMaize 73.93 76.8 66.45 60.38 11.41Groundnuts 41.42 30.37 46.94 15.14 6.94Beans 78.36 71.67 124.38 37.71 21.49All seasonal food 297.43 135.4Food crop continuousBanana 75.62 59.4 120.03 98.14 34.11Sweet potatoes 83.16 59.02 81.09 33.25 28.66Cassava 82.01 58.82 55.36 41.93 26.47All cont. food 275.58 178.07
Fruit & Vegetables 14.87 10.85
All crops 615.12 372.94

FOCUS OF FUTURE WORK
• Soil fertility measurements• GPS measurements
– Bias in measurement– Effect of slope and weather– Small plots
• Labor inputs• Water measurements• Cognitive and non-cognitive skills
CHALLENGES
• Integration• Institutional framework• Analytical capacity• Level of representativeness
(sampling)• Burden on respondents• Donor coordination• Managing expectations