Embed Size (px)
Citation preview
Participant Guide
This document contains both information and form fields. To read information, use the Down Arrow from a form field.
Employment Ontario
Literacy and Basic Skills
Performance Management Reports Training
for Service Providers
Participant Guide
MTCU Foundation Skills Unit, Program Delivery Support Branch (FSU-PDSB) Corporate Streamlining Company, Inc.
Participant Guide
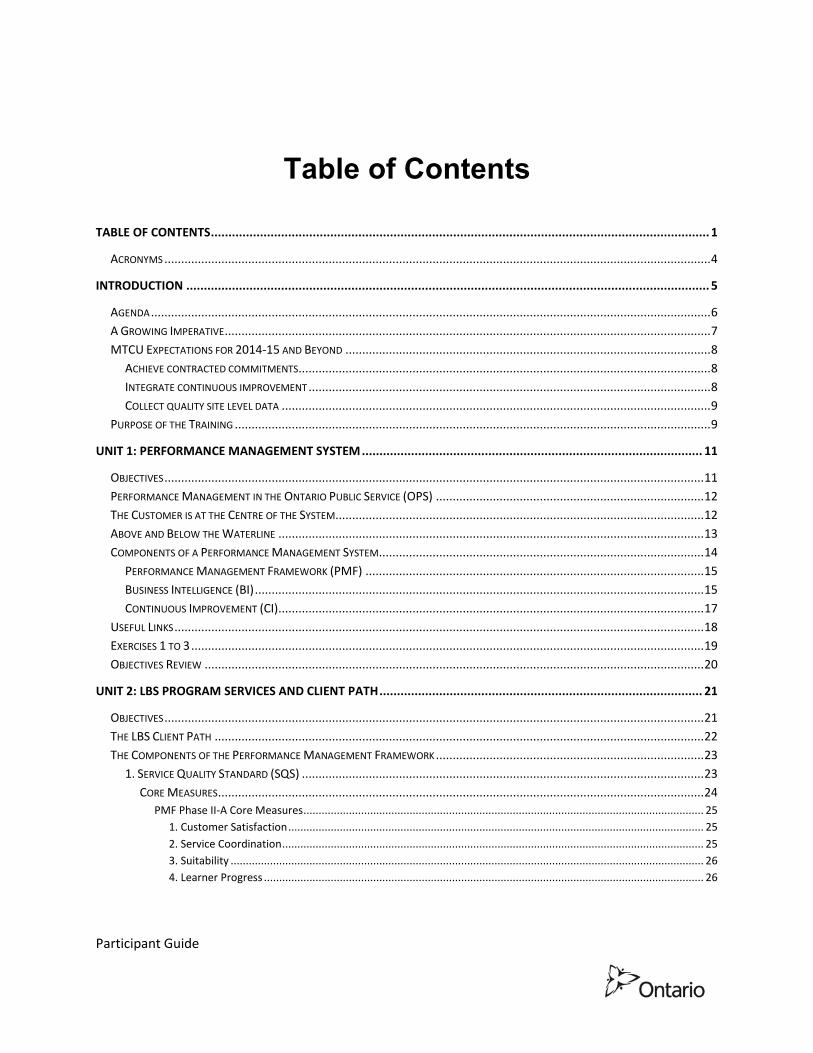
Table of Contents
TABLE OF CONTENTS .............................................................................................................................................. 1
ACRONYMS ................................................................................................................................................................... 4
INTRODUCTION ..................................................................................................................................................... 5
AGENDA ....................................................................................................................................................................... 6
A GROWING IMPERATIVE ................................................................................................................................................. 7
MTCU EXPECTATIONS FOR 2014-15 AND BEYOND ............................................................................................................. 8
ACHIEVE CONTRACTED COMMITMENTS ........................................................................................................................... 8
INTEGRATE CONTINUOUS IMPROVEMENT ........................................................................................................................ 8
COLLECT QUALITY SITE LEVEL DATA ................................................................................................................................ 9
PURPOSE OF THE TRAINING .............................................................................................................................................. 9
UNIT 1: PERFORMANCE MANAGEMENT SYSTEM ................................................................................................. 11
OBJECTIVES ................................................................................................................................................................. 11
PERFORMANCE MANAGEMENT IN THE ONTARIO PUBLIC SERVICE (OPS) ................................................................................ 12
THE CUSTOMER IS AT THE CENTRE OF THE SYSTEM .............................................................................................................. 12
ABOVE AND BELOW THE WATERLINE ............................................................................................................................... 13
COMPONENTS OF A PERFORMANCE MANAGEMENT SYSTEM ................................................................................................. 14
PERFORMANCE MANAGEMENT FRAMEWORK (PMF) ..................................................................................................... 15
BUSINESS INTELLIGENCE (BI) ...................................................................................................................................... 15
CONTINUOUS IMPROVEMENT (CI) ............................................................................................................................... 17
USEFUL LINKS .............................................................................................................................................................. 18
EXERCISES 1 TO 3 ......................................................................................................................................................... 19
OBJECTIVES REVIEW ..................................................................................................................................................... 20
UNIT 2: LBS PROGRAM SERVICES AND CLIENT PATH ............................................................................................ 21
OBJECTIVES ................................................................................................................................................................. 21
THE LBS CLIENT PATH .................................................................................................................................................. 22
THE COMPONENTS OF THE PERFORMANCE MANAGEMENT FRAMEWORK ................................................................................ 23
1. SERVICE QUALITY STANDARD (SQS) ........................................................................................................................ 23
CORE MEASURES ................................................................................................................................................. 24
PMF Phase II-A Core Measures .................................................................................................................................... 25
1. Customer Satisfaction ......................................................................................................................................... 25
2. Service Coordination ........................................................................................................................................... 25
3. Suitability ............................................................................................................................................................ 26
4. Learner Progress ................................................................................................................................................. 26
Participant Guide T a b l e o f C o n t e n t s | 2
5. Learners Served .................................................................................................................................................. 26
PMF Phase II-B Core Measures .................................................................................................................................... 26
Completions (of Goal Path) ..................................................................................................................................... 26
(Learner) Gains ....................................................................................................................................................... 27
Exercise 1 ..................................................................................................................................................................... 27
SERVICE QUALITY STANDARD (SQS) CALCULATION .................................................................................................... 29
Exercise 2 ..................................................................................................................................................................... 31
Mock-Up A - Report 64 Detailed Service Quality Report ............................................................................................. 32
2. ORGANIZATIONAL CAPACITY ................................................................................................................................... 33
3. COMPLIANCE TO THE LBS AGREEMENT AND LBS SERVICE PROVIDER GUIDELINES ............................................................. 33
CONNECTING INPUT TO REPORTS .................................................................................................................................... 33
USEFUL LINKS .............................................................................................................................................................. 37
OBJECTIVES REVIEW ..................................................................................................................................................... 37
UNIT 3: DATA INTEGRITY ..................................................................................................................................... 39
OBJECTIVES: ................................................................................................................................................................ 39
WHAT IS ‘DATA INTEGRITY’? .......................................................................................................................................... 40
WHO ARE THE BUSINESS OWNERS OF THE LBS PROGRAM REPORT DATA? .............................................................................. 40
WHAT ARE THE ROLES OF SERVICE PROVIDER STAFF AND MANAGEMENT IN DATA INTEGRITY? ............................................... 40
HOW DOES MTCU USE LBS REPORT DATA? ..................................................................................................................... 41
HOW DOES A SERVICE PROVIDER USE LBS REPORT DATA? ................................................................................................... 41
DATA COLLECTION ........................................................................................................................................................ 41
WHAT EFFECT DOES ORDERLINESS IN AN ORGANIZATION’S OPERATIONS HAVE ON ITS ABILITY TO DELIVER SERVICES? ..................... 43
USEFUL LINKS .............................................................................................................................................................. 43
EXERCISE 1 ................................................................................................................................................................. 43
OBJECTIVES REVIEW ..................................................................................................................................................... 44
UNIT 4: REPORT ANALYSIS ................................................................................................................................... 45
OBJECTIVES ................................................................................................................................................................. 45
LEARNERS SERVED - PRO-RATED DENOMINATOR ............................................................................................................... 46
CONTINUOUS IMPROVEMENT PROCESS ............................................................................................................................ 48
REPORTS AVAILABLE ..................................................................................................................................................... 48
THE LBS CLIENT PATH (EXPANDED) ................................................................................................................................. 49
WHAT THE REPORT DATA COULD BE TELLING YOU .............................................................................................................. 52
INFORMATION AND REFERRAL .................................................................................................................................... 52
REFERRALS IN .......................................................................................................................................................... 53
INTAKE AND ASSESSMENT .......................................................................................................................................... 53
SUITABILITY ............................................................................................................................................................ 53
SERVICE PLAN ......................................................................................................................................................... 54
LEARNER ACTIVITIES ................................................................................................................................................. 54
MILESTONES ........................................................................................................................................................... 55
CULMINATING TASKS ................................................................................................................................................ 56

Participant Guide T a b l e o f C o n t e n t s | 3
REFERRALS OUT....................................................................................................................................................... 57
COMPLETIONS ......................................................................................................................................................... 57
FOLLOW-UPS .......................................................................................................................................................... 58
EXERCISE 1 ................................................................................................................................................................. 59
REPORT 61 CASE ACTIVITY (CLIENT LEVEL) ........................................................................................................................ 60
DATA COMBINATIONS ................................................................................................................................................... 61
STAFF ........................................................................................................................................................................ 61
THE BIG PICTURE ......................................................................................................................................................... 62
QUARTERLY STATUS AND ADJUSTMENT REPORTS (QSAR) ............................................................................................... 62
LBS BUSINESS PLAN ................................................................................................................................................. 62
ROLL-UP REPORTS ................................................................................................................................................... 63
USEFUL LINKS .............................................................................................................................................................. 63
EXERCISES 2 TO 6 ......................................................................................................................................................... 64
OBJECTIVES REVIEW ..................................................................................................................................................... 65
SUMMARY ........................................................................................................................................................... 66
RESOURCES ................................................................................................................................................................. 67
EXERCISE 1 ................................................................................................................................................................. 68
GLOSSARY ............................................................................................................................................................ 69
APPENDICES......................................................................................................................................................... 74
APPENDIX 1 - MOCK-UP 1 - REPORT 64 DETAILED SERVICE QUALITY REPORT ..................................................................... 75
APPENDIX 2 - SAMPLE EXTRACT FROM DATA DICTIONARY (INFORMATION & REFERRAL) ....................................................... 76
APPENDIX 3 - SAMPLE EXTRACT FROM THE REPORT 60A EOIS-CAMS USER GUIDE ............................................................. 77
APPENDIX 4 - SAMPLE REPORT 19A FOLLOW-UP CASES (CLIENT LEVEL) ............................................................................ 78
APPENDIX 5 - SAMPLE REPORT 20 INACTIVE CASES (CLIENT LEVEL) ................................................................................... 79
APPENDIX 6 - SAMPLE REPORT 60A ALL DATA – INFORMATION AND REFERRAL .................................................................. 80
APPENDIX 7 - SAMPLE REPORT 60D OUTCOMES ........................................................................................................... 81
APPENDIX 8 - MOCK-UP 2 - REPORT 64 DETAILED SERVICE QUALITY REPORT ..................................................................... 86
APPENDIX 9 - MOCK-UP 3 - REPORT 64 DETAILED SERVICE QUALITY REPORT ..................................................................... 87
APPENDIX 10 - REPORT 64 DSQR: ‘YTD ALL PARTICIPANTS - ACTUAL %’ CALCULATION ..................................................... 88
APPENDIX 11 - MOCK-UP 4 - REPORT 64 DETAILED SERVICE QUALITY REPORT ................................................................... 90
APPENDIX 12 - REPORT 64 DSQR: ‘% YTD OF TARGET’ CALCULATION ............................................................................. 91
APPENDIX 13 - MOCK-UP 5 - REPORT 64 DETAILED SERVICE QUALITY REPORT ................................................................... 92
APPENDIX 14 - MOCK-UP 6 - REPORT 64 DETAILED SERVICE QUALITY REPORT ................................................................... 93
Participant Guide A c r o n y m s | 4
….. .................................
.......................................
................................
......................
................................
...................................
..........................
................................
................................
....................................
...................................
..................................
................................
...................................
.....................................
...................................
Acronyms BI Business Intelligence
CI Continuous Improvement
DSQR Detailed Service Quality Report
EOIS-CaMS Employment Ontario Information System - Case Management System
EOPG Employment Ontario Partners’ Gateway
LBS Literacy and Basic Skills
LBS-PMS Literacy and Basic Skills Performance Management System
MTCU Ministry of Training Colleges and Universities
ODSP Ontario Disability Support Program
OW Ontario Works
PMF Performance Management Framework
PMS Performance Management System
QSAR Quarterly Status and Adjustment Report
SDS Service Delivery Site
SP Service Provider
YTD Year-to-Date (fiscal year April 1 to March 31)

Participant Guide I n t r o d u c t i o n | 5
Introduction
Participant Guide I n t r o d u c t i o n | 6
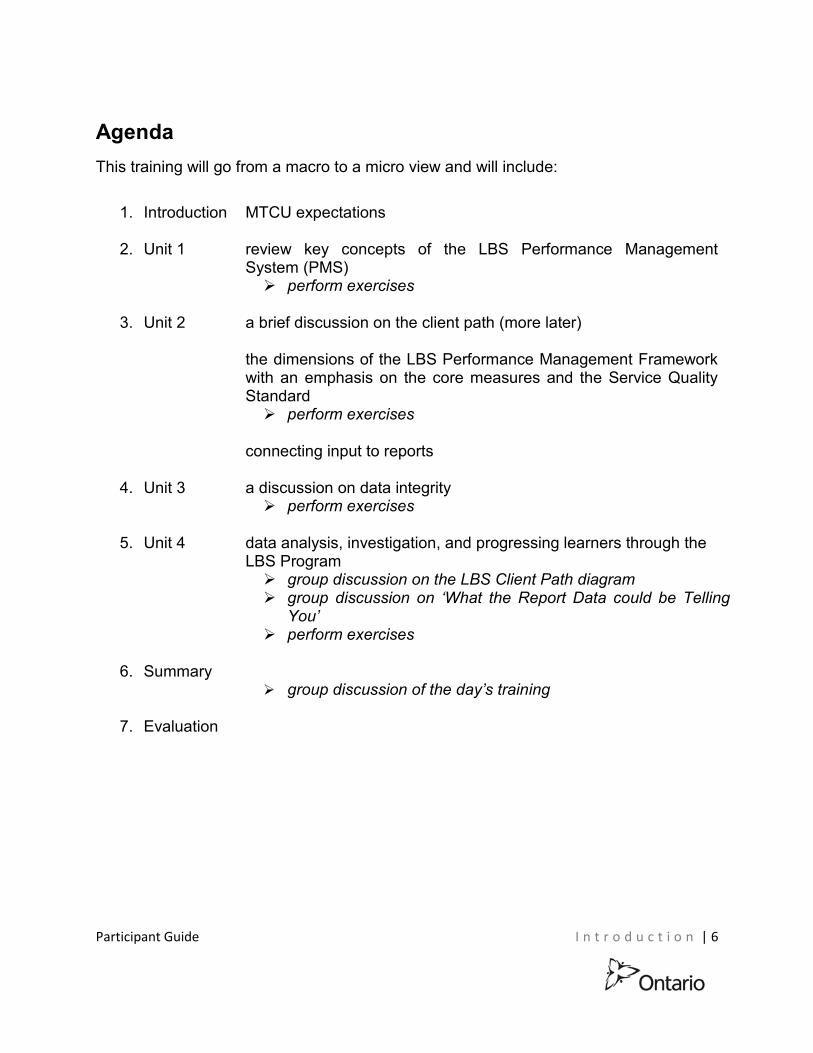
Agenda This training will go from a macro to a micro view and will include:
1. Introduction MTCU expectations
2. Unit 1 review key concepts of the LBS Performance Management System (PMS)
perform exercises
3. Unit 2 a brief discussion on the client path (more later)
the dimensions of the LBS Performance Management Framework with an emphasis on the core measures and the Service Quality Standard
perform exercises
connecting input to reports
4. Unit 3 a discussion on data integrity perform exercises
5. Unit 4 data analysis, investigation, and progressing learners through the LBS Program
group discussion on the LBS Client Path diagram group discussion on ‘What the Report Data could be Telling You’ perform exercises
6. Summary group discussion of the day’s training
7. Evaluation

Participant Guide I n t r o d u c t i o n | 7
A Growing Imperative
Significant changes to the Literacy and Basic Skills (LBS) Program such as the implementation of the Ontario Adult Literacy Curriculum Framework (OALCF), Employment Ontario Information System-Case Management System (EOIS-CaMS), eChannel reporting, and the LBS Performance Management System (LBS-PMS), continue to require changes to the Ministry of Training, Colleges and Universities’ (MTCU) program delivery practices, such as business planning, contracting, data gathering and reporting, and fiscal management.
These changes have and will continue to require service providers to make changes as well. These changes will support MTCU and service providers in making informed, evidence-based decisions about the LBS Program. The LBS-PMS is being implemented in stages and will take several years to fully implement.
These changes have required service providers to change service delivery practices and build new management processes. MTCU expects service providers to collect, monitor, analyze and report data, and develop strategies to improve service delivery. Service providers are encouraged to be creative and innovative; the aim is to “find the right ideas” and focus on continuous improvement.
Adjusting to these changes can have a significant impact on team members at a personal level. Many team members have a strong, healthy desire to help as many people as fast as possible. As a result, there is a tendency to cut back on administrative activities such as the timely and complete entering of data into EOIS-CaMS. It is important that service provider leaders help team members to understand the importance of data integrity and how the analysis of report data can result in better outcomes for learners in the long run.
Eventually, leaders and team members will become even more comfortable with the LBS-PMS, the OALCF, and the collecting and analyzing of data. Performance management and measurement will be ingrained in the culture of the LBS services.
Participant Guide I n t r o d u c t i o n | 8
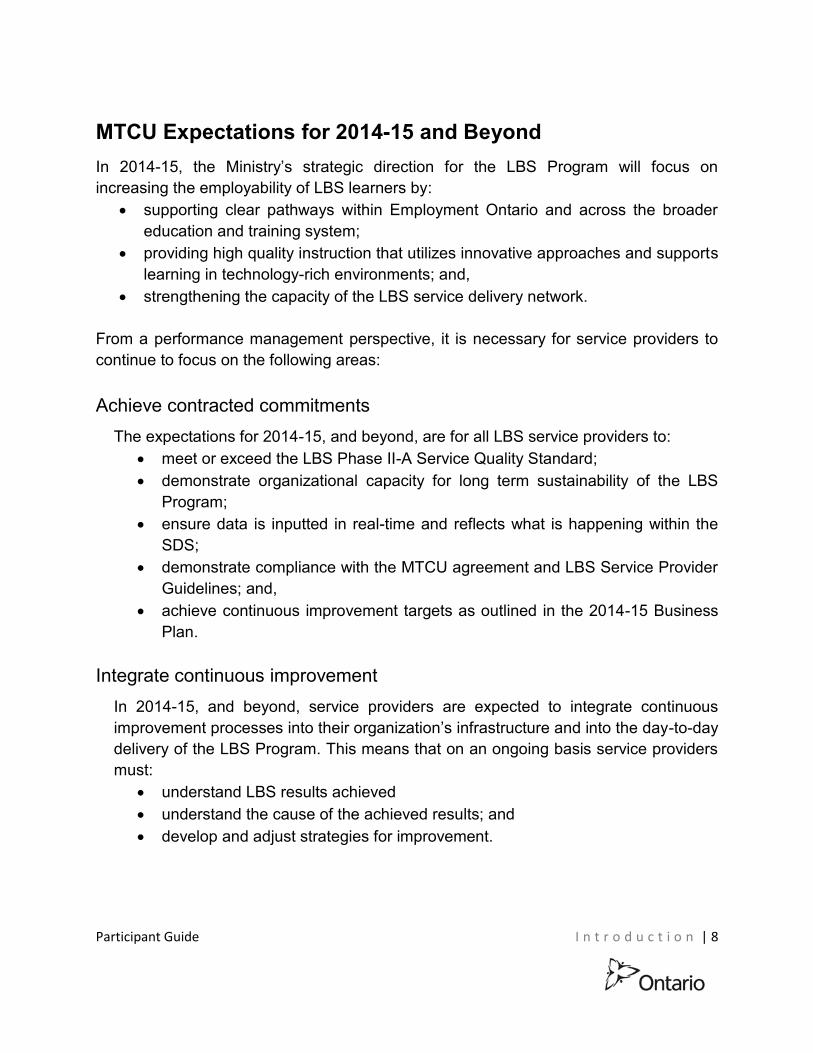
MTCU Expectations for 2014-15 and Beyond In 2014-15, the Ministry’s strategic direction for the LBS Program will focus on increasing the employability of LBS learners by:
supporting clear pathways within Employment Ontario and across the broader education and training system;
providing high quality instruction that utilizes innovative approaches and supports learning in technology-rich environments; and,
strengthening the capacity of the LBS service delivery network.
From a performance management perspective, it is necessary for service providers to continue to focus on the following areas:
Achieve contracted commitments The expectations for 2014-15, and beyond, are for all LBS service providers to:
meet or exceed the LBS Phase II-A Service Quality Standard; demonstrate organizational capacity for long term sustainability of the LBS
Program; ensure data is inputted in real-time and reflects what is happening within the
SDS; demonstrate compliance with the MTCU agreement and LBS Service Provider
Guidelines; and, achieve continuous improvement targets as outlined in the 2014-15 Business
Plan.
Integrate continuous improvement In 2014-15, and beyond, service providers are expected to integrate continuous improvement processes into their organization’s infrastructure and into the day-to-day delivery of the LBS Program. This means that on an ongoing basis service providers must:
understand LBS results achieved understand the cause of the achieved results; and develop and adjust strategies for improvement.
Participant Guide I n t r o d u c t i o n | 9
Collect quality site level data MTCU expects service providers to collect, monitor, analyze and report data for the purpose of continuous improvement. Service providers and MTCU require real-time, accurate and verifiable data to make informed business decisions and plan effectively. As the LBS-PMS is evidence-based, MTCU may adjust baseline standards to reflect changes to system-wide performance and confirm any new performance baselines for the following year. However, making such adjustments is not possible until MCTU and service providers are fully confident that there is integrity in the data.
Data integrity is defined as “completeness, consistency, timeliness and accuracy” of data entered into EOIS-CaMS, other SDS systems and hard copy client files. Data must be reliable, accurate, complete and relevant in order to make evidence-based decisions. As the “business owners of data” service providers are responsible for the verification and integrity of data at an SDS level. Although managers may not require data for all their day-to-day tasks, understanding data and how it is used increases a service provider’s organizational capacity by allowing them to link information, performance and strategy more effectively.
The value of the information contained in operational and performance reports is only as good as the data input into EOIS-CaMS. To ensure high quality, correct, consistent and accessible data, all users of EOIS-CaMS must have a consistent understanding of data definitions, data entry processes and the EOIS-CaMS system. Without this understanding users may depend on their own interpretation and the resulting data and reports may not reflect what is actually happening at an SDS. These discrepancies can have a large impact on the quality of data at the local level and an even larger impact as the information is combined at the provincial level.
Purpose of the Training This training will support the LBS third-party network to build the capacity required to deliver on the commitments identified in their business plans and to comply with LBS Service Provider Guidelines and contracted agreements. It will support service providers to deliver effective, efficient, customer-focused and sustainable services, and highlight areas where organizational capacity can be enhanced across the LBS network. Regular analysis supports effective service delivery and ensures services meet the needs of learners and supports them as they transition to their goals.
Participant Guide I n t r o d u c t i o n | 10
By the end of this training, participants will:
understand the LBS Performance Management System;
understand the importance of data integrity;
understand what “business intelligence” (BI) entails as well as understand service provider BI roles and responsibilities;
understand how the data collected in EOIS-CaMS is used to evaluate SDS performance and make appropriate business decisions at the SDS, regional, and provincial levels;
recognize the importance of performing service delivery analysis; and
understand the resources available to support data integrity and data analysis.
Participant Guide U n i t 1 : P e r f o r m a n c e M a n a g e m e n t S y s t e m | 11
Unit 1: Performance Management System
Objectives
By the end of this unit you will:
recognize that the customer is at the centre of the LBS System;
understand the concept of ‘above and below the waterline’;
understand the components of the Performance Management System;
understand the components of the Performance Management Framework;
understand what business intelligence entails; and
know where to find additional resources related to the Performance Management System.
Participant Guide U n i t 1 : P e r f o r m a n c e M a n a g e m e n t S y s t e m | 12
Performance Management in the Ontario Public Service (OPS) Performance management systems evaluate service effectiveness, provide service benchmarks, and help service providers to continuously improve services. The Ontario Public Service (OPS) relies on transparent and accountable performance management systems to support high quality customer service throughout the province.
In a transparent performance management system, all stakeholders know what level of service is expected, how it is measured, how the service system is performing and where there is room for improvement. Clients and learners will see improved service and results, while the Ontario government receives improved outcomes and value for money.
The Performance Management System is a vital tool for both service providers and the Ministry for service planning, delivery and management. It assists service providers to be more effective, client-centred and efficient in achieving a high standard of overall service quality.
The Customer is at the Centre of the System It is important that service providers are always aware of the fact that the LBS Program is a learner-centred, goal-directed, transitions-oriented and results-based service. Although there are many very important stakeholders, the service delivery revolves around primary customers1: the clients and learners2 accessing services.
1 Primary customers are defined as “the person(s) or organization(s) without whose support your program would cease to exist.
2 As identified in the LBS Service Provider Guidelines “clients” refer to individuals utilizing information and referral (IR) services while “learners” are those entered into the full LBS service i.e. those with learning plans and EOIS-CaMS service plans.
They access LBS services because they require support and trust the service provider is able to help them achieve their goals. This does not mean that the service provider must respond to every whim and wish of the client and/or learner. It means that service providers must engage clients and learners to determine their needs and to deliver timely and appropriate solutions and/or refer them to other service providers, if appropriate. This collaborative relationship between the service provider and learner is critical.
Another important primary customer to service providers is MTCU. MTCU continues to make significant financial contributions to the LBS delivery network and is committed to
Participant Guide U n i t 1 : P e r f o r m a n c e M a n a g e m e n t S y s t e m | 13
building consistent, quality, sustainable LBS services across the province. LBS service provider agreements and guidelines clearly outline MTCU’s expectations and success measures, define the roles and responsibilities of the service provider and MTCU3, and highlight the importance of working in collaboration to increase service excellence.
3 More detail about these roles can be found in the LBS Service Provider and Support Organization Guidelines.
The data collected in EOIS-CaMS reports are indicators of how well activities are working and how well these activities are meeting the purpose of the LBS Program. Reports data is designed to support decision-making and strategic planning by highlighting areas of strength and identifying areas for continuous improvement.
The value and success of the LBS Program and the third-party service providers delivering LBS service is measured by the ability of learners to transition to their chosen goal whether it be employment, apprenticeship, secondary school credit, post-secondary education or increased independence.
Above and Below the Waterline
Think of an iceberg, where 10% of its mass is above the waterline and 90% is below the waterline. Relate this to the LBS service. The “iceberg” analogy is used throughout the training.
“Above the waterline” Similar to an iceberg, what the customer sees is “above the waterline”—these are the products and services service
providers deliver to respond to customer needs—it is the service location, the services delivered, customer service practices, etc. Within a performance management system this includes performance measures within the performance management framework. “Below the waterline” Similar to an iceberg, the largest part, typically 90%, is “below the waterline”. It is the solid business foundation of the service provider, or organizational capacity (plan, measure, communicate, resource) to deliver on commitments to customers and to deliver sustainable customer focused, effective and efficient services.
Participant Guide U n i t 1 : P e r f o r m a n c e M a n a g e m e n t S y s t e m | 14
It is the responsibility of the service provider to manage well “below the waterline” to deliver on results promised to MTCU, communities, clients and learners. It involves integrating continuous improvement into the day-to-day business; to collect and use data to assess activities and results and to make solid business decisions to continuously improve the LBS Program “below the waterline”.
All successful, sustainable organizations, regardless of business sector, manage above and below the waterline including MTCU. Experience indicates that if organizations appropriately and consistently manage business systems “below the waterline” the results will be achieved for customers “above the waterline”.
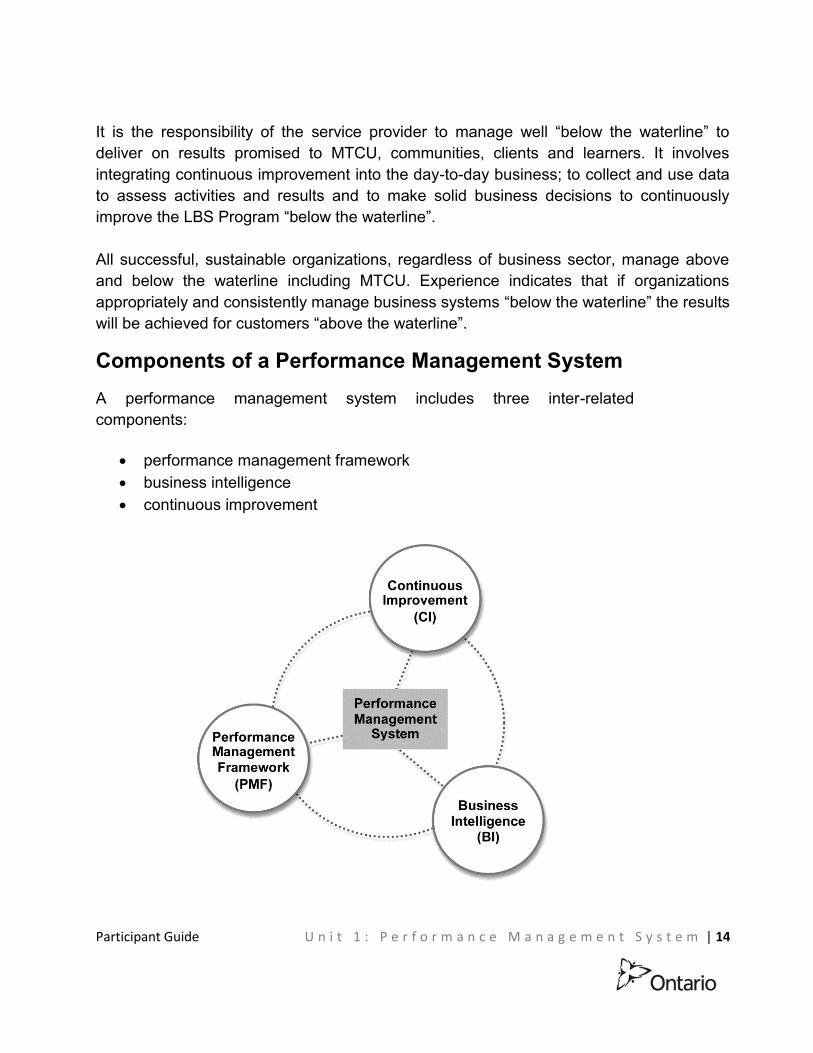
Components of a Performance Management System A performance management system includes three inter-related components:
performance management framework business intelligence continuous improvement
Participant Guide U n i t 1 : P e r f o r m a n c e M a n a g e m e n t S y s t e m | 15
Service Quality Standard
Organizational capacity
Compliance (agreement & guidelines)
Performance Management Framework
Performance Management Framework (PMF) The LBS Performance Management Framework (PMF) includes dimensions of service delivery and core measures to assess service provider performance and the overall performance of the LBS Program. In a mature model, standards will be based on verified data about what is being delivered provincially.
A provincial PMF means that performance measures, data indicators, data definitions and data sources are the same for every service provider agreement. This does not mean that there is a “cookie cutter” or “one size fits all” approach to the delivery of LBS services. In fact, the LBS Program is designed to be flexible so service providers can respond to the unique needs of their clients, learners, and communities.
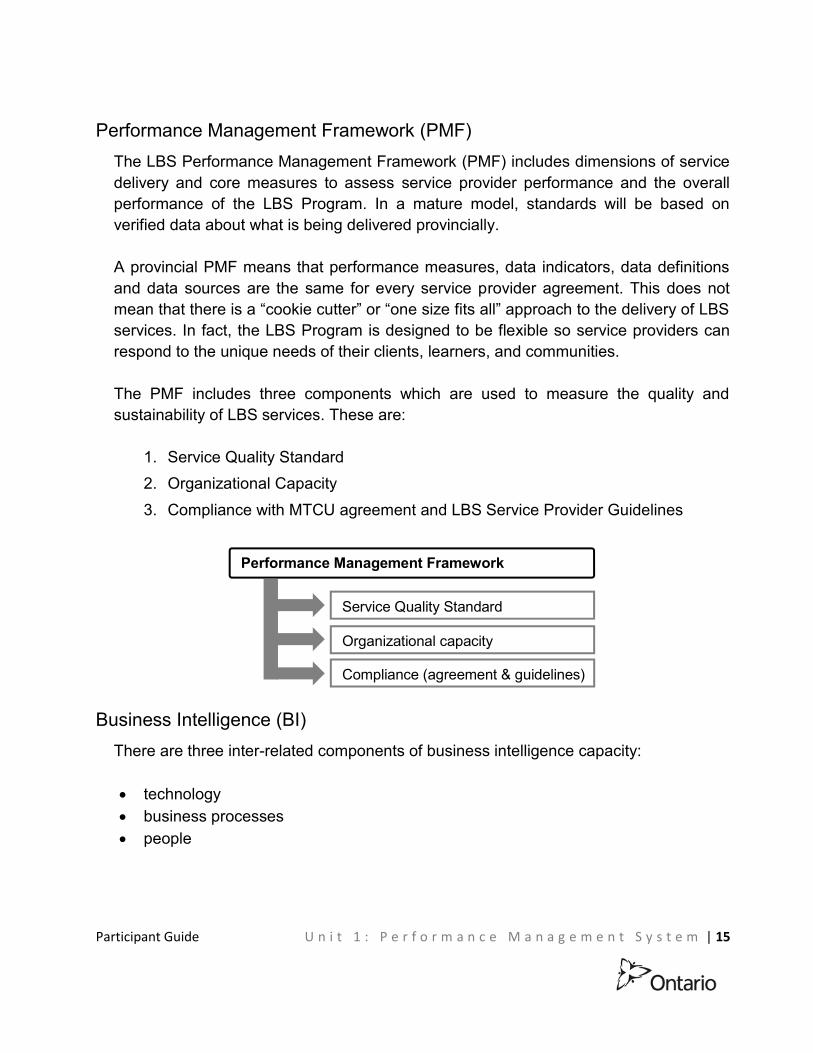
The PMF includes three components which are used to measure the quality and sustainability of LBS services. These are:
1. Service Quality Standard 2. Organizational Capacity 3. Compliance with MTCU agreement and LBS Service Provider Guidelines
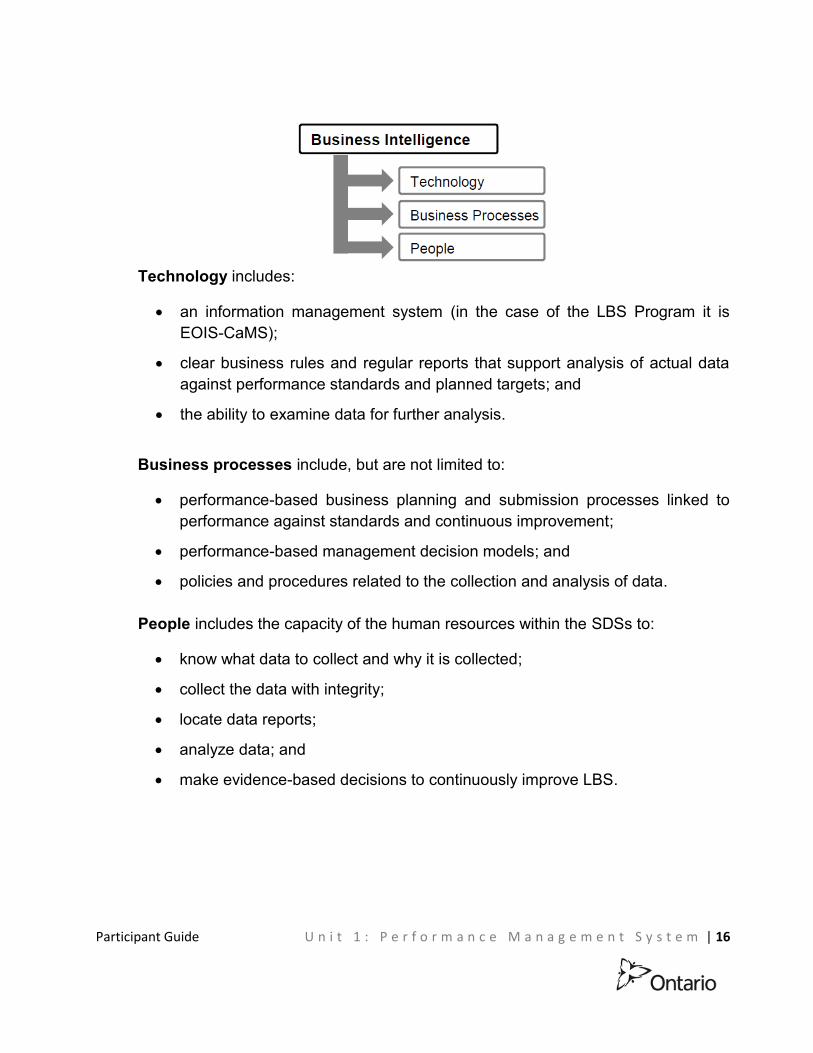
Business Intelligence (BI) There are three inter-related components of business intelligence capacity:
technology business processes people
Participant Guide U n i t 1 : P e r f o r m a n c e M a n a g e m e n t S y s t e m | 16
Technology includes:
an information management system (in the case of the LBS Program it is EOIS-CaMS);
clear business rules and regular reports that support analysis of actual data against performance standards and planned targets; and
the ability to examine data for further analysis.
Business processes include, but are not limited to:
performance-based business planning and submission processes linked to performance against standards and continuous improvement;
performance-based management decision models; and
policies and procedures related to the collection and analysis of data.
People includes the capacity of the human resources within the SDSs to:
know what data to collect and why it is collected;
collect the data with integrity;
locate data reports;
analyze data; and
make evidence-based decisions to continuously improve LBS.
Participant Guide U n i t 1 : P e r f o r m a n c e M a n a g e m e n t S y s t e m | 17
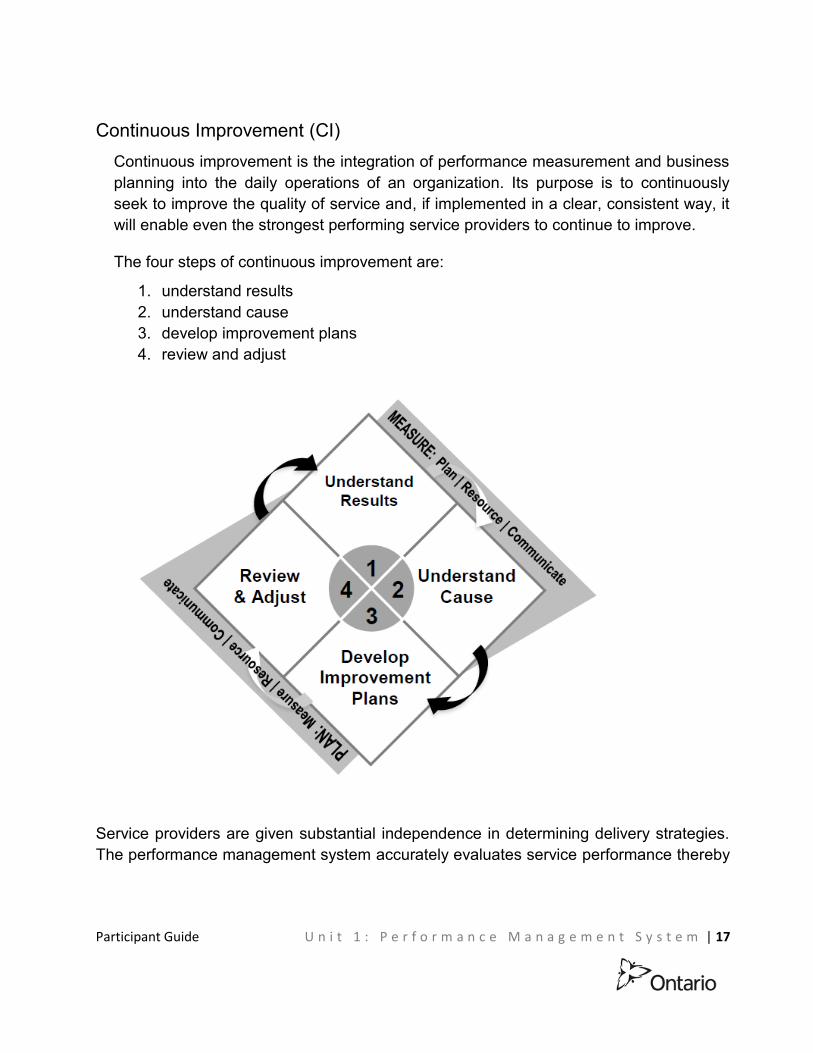
Continuous Improvement (CI) Continuous improvement is the integration of performance measurement and business planning into the daily operations of an organization. Its purpose is to continuously seek to improve the quality of service and, if implemented in a clear, consistent way, it will enable even the strongest performing service providers to continue to improve.
The four steps of continuous improvement are:
1. understand results 2. understand cause 3. develop improvement plans 4. review and adjust
Service providers are given substantial independence in determining delivery strategies. The performance management system accurately evaluates service performance thereby
Participant Guide U n i t 1 : P e r f o r m a n c e M a n a g e m e n t S y s t e m | 18
providing service providers with continuous improvement opportunities to enhance service to leaners.
Supporting the principles of the performance management system and ensuring accurate and timely data input into EOIS-CaMS goes a long way to ensuring service providers have the information needed to operate a successful organization.
Service provider operations are supported by complete and accurate data and knowing how to use data for continuous improvement. Review report data often, and adjust operations as necessary.
Service providers must understand the results achieved and the causes of the achieved results then develop procedures and strategies for improvement. The business planning process is one example of the importance of data integrity. Developing a business plan is an opportunity for service providers to reassess goals, set new targets and to determine strategies.
Performance measurement and planning are an important part of an organization’s infrastructure. Approached correctly, it supports the achievement of purposeful results.
The importance of ensuring accurate and timely data input into EOIS-CaMS will become more evident as you read ‘Unit 4: Report Analysis’.
Useful Links The links can be found on the following EOPG web page:
LBS Performance Management System
Participant Guide U n i t 1 : P e r f o r m a n c e M a n a g e m e n t S y s t e m | 19
Exercises 1 to 3 1. Who is responsible for ‘below the waterline’ management of SDSs?
Service provider
Provincial MTCU management
Regional MTCU management
2. What is the purpose of managing business systems ‘below the waterline’? (Select all that apply)
Results will be achieved for customers ‘above the waterline’
Service provider organizations will operate with increased efficiency which increases service provider capacity
Practitioners will be in good control of their work environment
3. Which of the following are true regarding ‘data integrity’ (Select all that apply):
Ensures accurate evidence for the continuous improvement process
Ensures accurate evidence for informed decision-making
Supports MTCU policy decisions and development
Increases transparency within the operation
Participant Guide U n i t 1 : P e r f o r m a n c e M a n a g e m e n t S y s t e m | 20
Objectives Review
Recognize that the customer is at the centre of the LBS System: As a funder, MTCU is a customer; however, service delivery revolves around the clients and learners accessing services.
Understand the concept of ‘above and below the waterline’:
Similar to an iceberg, what the customer sees is “above the waterline”—these are the products and services service providers deliver to respond to customer needs. What is “above the waterline” is captured in the performance measures within the performance management framework.
“Below the waterline” is the solid business foundation of the service provider to deliver services.
Understand the components of the Performance Management System:
The three components are: the Performance Management Framework, Business Intelligence, and Continuous Improvement.
Understand the components of the Performance Management Framework:
The three components are: the Service Quality Standard, Organizational Capacity, and Compliance with the MTCU agreement and LBS Service Provider Guidelines.
Understand what business intelligence entails:
Business intelligence entails: technology, which for the LBS Program is EOIS-CaMS; processes, which includes performance based planning, policies, and
procedures related to data collection and analysis; and, people to collect and analyse the data and make evidence-based decisions.
Know where to find additional resources related to the performance management system: LBS Performance Management System

Participant Guide U n i t 2 : L B S P r o g r a m S e r v i c e s a n d C l i e n t P a t h | 21
Unit 2: LBS Program Services and Client Path Objectives
By the end of this unit you will:
understand the LBS Client Path;
develop a deeper understanding of the components of the PMF: Service Quality Standard, organizational capacity, and compliance;
understand the three dimensions of the Service Quality Standard (Customer Service, Effectiveness, and Efficiency) and their connection to the core measures;
understand the reason for each core measure and potential data integrity issues related to each, and how to increase performance in each core measure;
comprehend the relationship between the PMF, the Service Quality Standard, and report data;
know how the Service Quality Standard value is calculated;
understand the importance of data integrity to the performance management process; and
be able to identify where report data is inputted within the EOIS-CaMS system.
Participant Guide U n i t 2 : L B S P r o g r a m S e r v i c e s a n d C l i e n t P a t h | 22
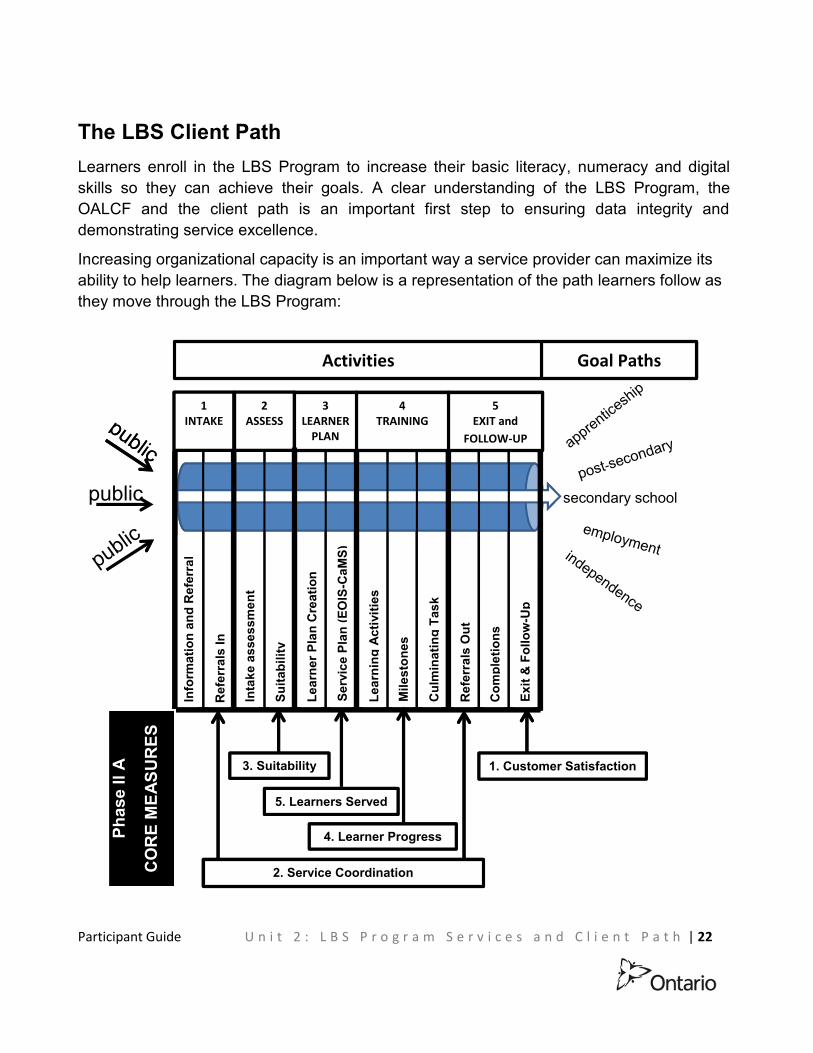
The LBS Client Path Learners enroll in the LBS Program to increase their basic literacy, numeracy and digital skills so they can achieve their goals. A clear understanding of the LBS Program, the OALCF and the client path is an important first step to ensuring data integrity and demonstrating service excellence.
Increasing organizational capacity is an important way a service provider can maximize its ability to help learners. The diagram below is a representation of the path learners follow as they move through the LBS Program:
Activities Goal Paths
1 2 3 4 5 INTAKE ASSESS LEARNER TRAINING EXIT and
PLAN FOLLOW-UP
public secondary school
ral MS)
a
Info
rmat
ion
and
Ref
er nea
tio
OIS
-C
men
t
ties
Cr Up
(E iv
ess
arne
r Pla
n
ice
Plan
ticIn
ass Ay
ls
ning
Ref
erra
Inta
ke
Suita
bilit
Serv r
Le Lea ile
ston
esM C
ulm
inat
ing
Task
-
ut w
OR
efer
rals
Com
plet
ions
Exit
& F
ollo
SE RAPh
ase
ll
U 3. Suitability 1. Customer Satisfaction
SAC
OR
E M
E 5. Learners Served
4. Learner Progress
2. Service Coordination
secondary school credit
Info
rmat
ion
and
Ref
erra
l
Inta
ke a
sses
smen
t
Lear
ner P
lan
Cre
atio
n
Serv
ice
Plan
(EO
IS-C
aMS)
Lear
ning
Act
iviti
es
Mile
ston
es
Cul
min
atin
g Ta
sk
Exit
& F
ollo
w-U
p
Ref
erra
ls In
Suita
bilit
y
Ref
erra
ls O
ut
Com
plet
ions
public
1 INTAKE
5 EXIT and
FOLLOW-UP
4 TRAINING
3 LEARNER
PLAN
2. Service Coordination
5. Learners Served
4. Learner Progress
1. Customer Satisfaction 3. Suitability
Phas
e ll
A
CO
RE
MEA
SUR
ES
2 ASSESS
Goal Paths Activities
Participant Guide U n i t 2 : L B S P r o g r a m S e r v i c e s a n d C l i e n t P a t h | 23
Thinking of the client path as a pipeline can help us to understand how learners flow through the system. Service providers can use reports to address issues with learners’ abilities to flow through the pipeline by evaluating service delivery, highlighting strengths and successes, identifying issues, and developing improvement strategies. This process will in turn increase organizational capacity and improve services.
Report analysis can help with managing the flow of learners through the SDS.
Service quality can also be managed by viewing the client path as ‘learners flowing through the LBS Program’ per the graph above. For example, a high number of learners completing the program and attaining their goal will show in the performance management system reports. Conversely, a low number of learners attaining their goals and a high number of learners exiting the program prior to completion could indicate an opportunity to improve service quality.
How learners as a group are moving along the client path is captured in the reports.
The Components of the Performance Management Framework The PMF includes three components which are used to measure the quality and sustainability of the LBS Program. These are:
o Service Quality Standard o Organizational Capacity o Compliance with MTCU agreement and LBS Service Provider Guidelines
1. Service Quality Standard (SQS) Service provider success is measured by the following three dimensions of service quality:
1. Effectiveness: measured by whom LBS serves and the impact of the service received
Participant Guide U n i t 2 : L B S P r o g r a m S e r v i c e s a n d C l i e n t P a t h | 24
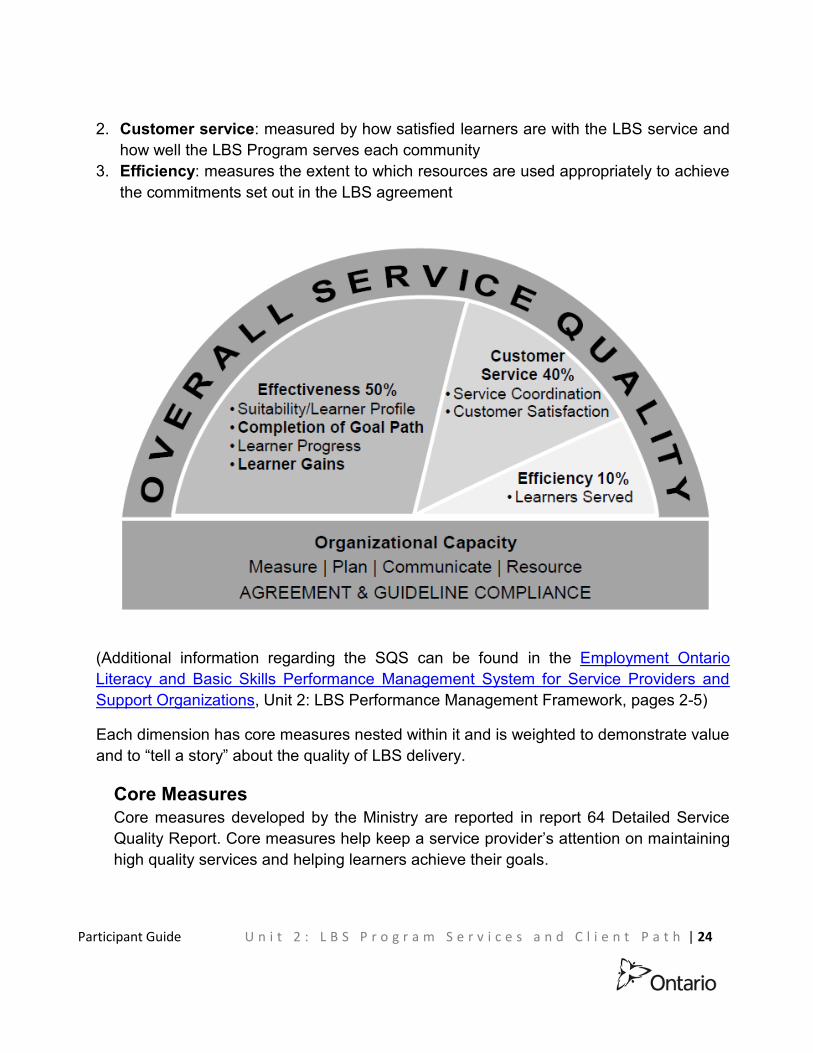
2. Customer service: measured by how satisfied learners are with the LBS service and how well the LBS Program serves each community
3. Efficiency: measures the extent to which resources are used appropriately to achieve the commitments set out in the LBS agreement
(Additional information regarding the SQS can be found in the Employment Ontario Literacy and Basic Skills Performance Management System for Service Providers and Support Organizations, Unit 2: LBS Performance Management Framework, pages 2-5)
Each dimension has core measures nested within it and is weighted to demonstrate value and to “tell a story” about the quality of LBS delivery.
Core Measures Core measures developed by the Ministry are reported in report 64 Detailed Service Quality Report. Core measures help keep a service provider’s attention on maintaining high quality services and helping learners achieve their goals.
Participant Guide U n i t 2 : L B S P r o g r a m S e r v i c e s a n d C l i e n t P a t h | 25
The main theme of the training is to help service providers support learners as they move through the above client path in ways that:
increase the number of learners who achieve their goals; increase service quality; meet contracted performance commitments; and accomplish all of the above efficiently.
Data integrity is critical to managing an individual client path and to managing the LBS Program as a whole.
PMF Phase II-A Core Measures
1. Customer Satisfaction The learners are the customers. The LBS Program exists primarily for the benefit of the learners: to help them develop their literacy, numeracy and digital skills, and to help them reach their goals. Customer satisfaction is based on feedback from learners and indicates how satisfied the learners are with the service received. This includes both learner gains and how they were treated while in the program. This information is collected through the LBS Exit and Follow-Up form, where learners are asked to rate on a scale of one to five, how likely they are to recommend the LBS Program to someone looking for similar services.
2. Service Coordination LBS organizations are part of a broader network of service providers delivering employment, training and other supportive services. Within the PMF, service coordination captures referral activity between the LBS service provider and other service providers and organizations in the community. This measure helps evaluate the extent to which service providers coordinate and integrate delivery. Integrated delivery provides learners with supported access to other services that help them achieve their goals. This core measure helps service providers evaluate the effectiveness of their outreach strategies and activities and determine how well they are promoting the LBS Program within the community. The LBS Program is part of an integrated system, within

Participant Guide U n i t 2 : L B S P r o g r a m S e r v i c e s a n d C l i e n t P a t h | 26
Employment Ontario and related programs and services provided by other ministries and other levels of government.
3. Suitability The LBS Program exists to help individuals who face literacy, numeracy or digital barriers that hold them back from achieving their goals. This measure ensures that service providers are working with clients who are most in need of LBS services. Suitability/learner profile in the LBS-PMF is measured with multiple suitability indicators such as, education level, time out of training, age, etc.
4. Learner Progress Learner progress is a measure of the successful completions of the required milestones on a learner’s goal path. The completion of milestones demonstrates that learners are making progress towards their goals.
5. Learners Served Learners served measures the number of learners with either an active or a closed learner plan served within the reporting period. Learners served is a measure of capacity to help learners; however, it is not a measure of quality of service.
PMF Phase II-B Core Measures
The LBS Program is evolving. The phasing in of core measures is part of this evolution. Phase II-A will apply to the 2014-15 and 2015-16 fiscal years. Afterwards, two additional core measures will form part of the SQS value: Completions (of Goal Path) and (Learner) Gains which are both discussed below. The information currently being inputted into EOIS-CaMS in these fields will be used to inform the development of the baselines for these measures.
Completions (of Goal Path) Completions (of goal path) are a measure of who successfully completes all elements of the learner plan (learning activities, milestones, and culminating task). Once this measure has been added to the PMF, it will indicate how many learners have met the learning goals and are transition-ready.
Participant Guide U n i t 2 : L B S P r o g r a m S e r v i c e s a n d C l i e n t P a t h | 27
(Learner) Gains Learner gains measures the degree to which learners show an improvement from entrance to exit. Learner gains answers the question “Do learners increase their skills as a result of participating in the LBS Program?” This provides evidence of the gains that learners make as a result of the training and support they receive from service providers.
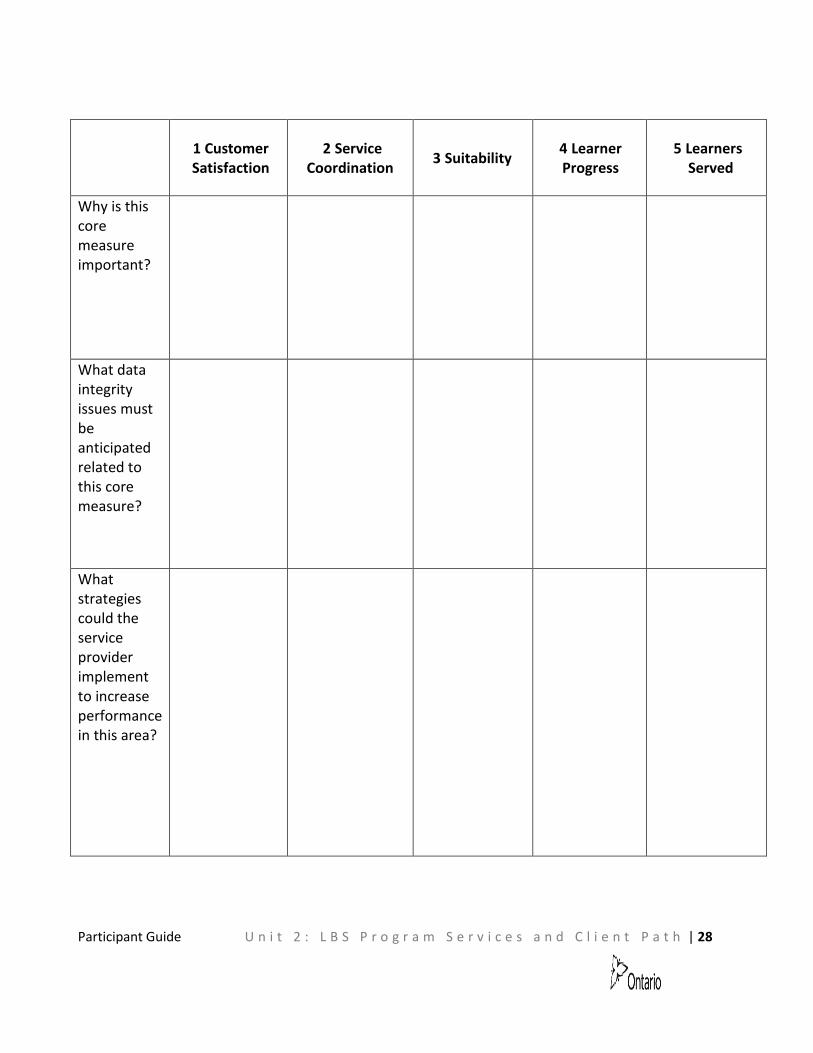
Exercise 1
Complete the table below using information within this participant guide as well as your own experience.
Participant Guide U n i t 2 : L B S P r o g r a m S e r v i c e s a n d C l i e n t P a t h | 28
No data.
1 Customer Satisfaction
2 Service Coordination
3 Suitability 4 Learner Progress
5 Learners Served
Why is this core measure important?
What data integrity issues must be anticipated related to this core measure?
What strategies could the service provider implement to increase performance in this area?
Participant Guide U n i t 2 : L B S P r o g r a m S e r v i c e s a n d C l i e n t P a t h | 29
Customer Service (40%)
Effectiveness (50%)
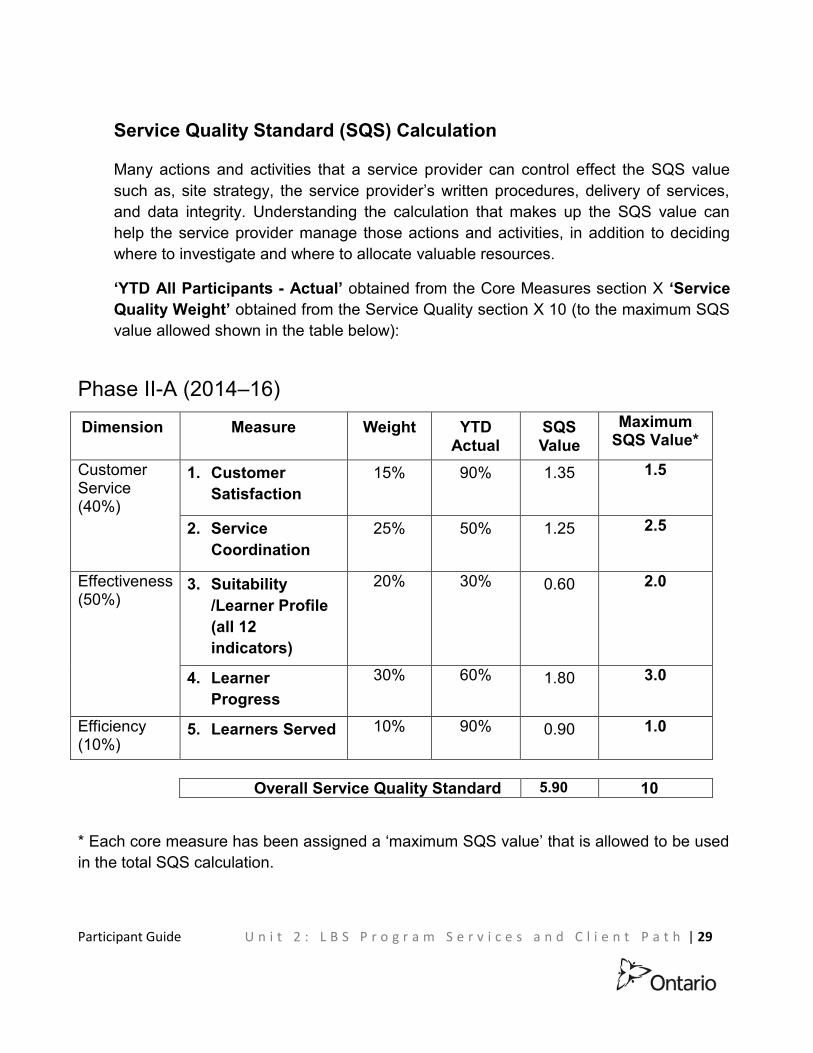
Service Quality Standard (SQS) Calculation
Many actions and activities that a service provider can control effect the SQS value such as, site strategy, the service provider’s written procedures, delivery of services, and data integrity. Understanding the calculation that makes up the SQS value can help the service provider manage those actions and activities, in addition to deciding where to investigate and where to allocate valuable resources.
‘YTD All Participants - Actual’ obtained from the Core Measures section X ‘Service Quality Weight’ obtained from the Service Quality section X 10 (to the maximum SQS value allowed shown in the table below):
Phase II-A (2014–16)
Dimension Measure Weight YTD Actual
SQS Value
Maximum SQS Value*
Customer Service (40%)
1. Customer Satisfaction
15% 90% 1.35 1.5
2. Service Coordination
25% 50% 1.25 2.5
Effectiveness (50%)
3. Suitability /Learner Profile (all 12 indicators)
20% 30% 0.60 2.0
4. Learner Progress
30% 60% 1.80 3.0
Efficiency (10%)
5. Learners Served 10% 90% 0.90 1.0
Overall Service Quality Standard 5.90 10
* Each core measure has been assigned a ‘maximum SQS value’ that is allowed to be used in the total SQS calculation.
Participant Guide U n i t 2 : L B S P r o g r a m S e r v i c e s a n d C l i e n t P a t h | 30
Below is an example of the SQS value calculation for Customer Satisfaction using Mock-Up A - Report 64 DSQR from Exercise 2 further below:
100% X 15% X 10 = 1.50
The sum of all the ‘Actual’ column values in the SERVICE QUALITY section is the SDS’s overall Service Quality Standard (SQS) value.
If the service provider’s SQS value is below the value committed to on Schedule E of the LBS agreement then investigative action should be taken.
Even when the total SQS value is at or above the value the service provider committed to in Schedule E, if individual SQS values are trending lower it would be wise for the service provider to investigate the cause of the trend.
Complete, accurate and timely input into EOIS-CaMS will help ensure data integrity so report data, including the SQS value is meaningful to users. Meaningful reports improve decision-making and support continuous improvement.
The report 64 Detailed Service Quality Report user guide and the Data Dictionary can help make the connection between the SQS value and the source data. Your SDS’s standard operating procedures should guide you to the SDS activities that result in the creation of the source data. Therefore there is a trail from the SQS value all the way back to the activities of the SDS. This trail is important in determining cause and effect; what is causing the effect on the reports.
Participant Guide U n i t 2 : L B S P r o g r a m S e r v i c e s a n d C l i e n t P a t h | 31
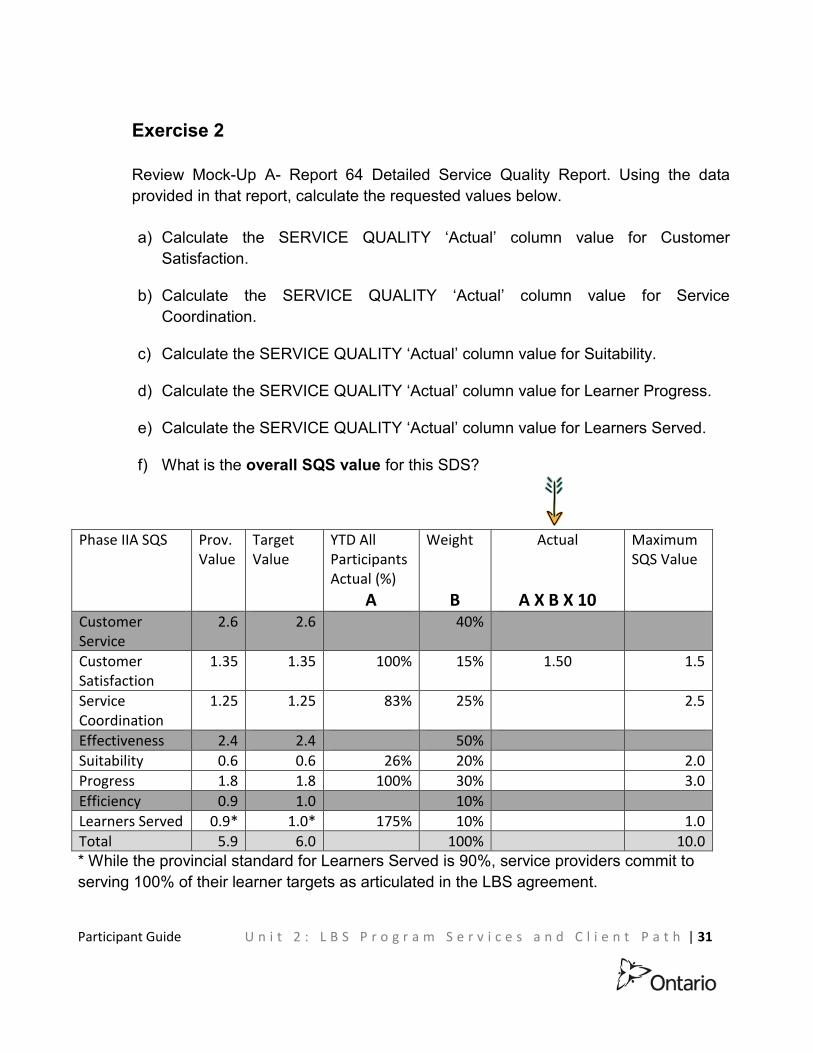
Exercise 2
Review Mock-Up A- Report 64 Detailed Service Quality Report. Using the data provided in that report, calculate the requested values below.
a) Calculate the SERVICE QUALITY ‘Actual’ column value for Customer Satisfaction.
b) Calculate the SERVICE QUALITY ‘Actual’ column value for Service Coordination.
c) Calculate the SERVICE QUALITY ‘Actual’ column value for Suitability.
d) Calculate the SERVICE QUALITY ‘Actual’ column value for Learner Progress.
e) Calculate the SERVICE QUALITY ‘Actual’ column value for Learners Served.
f) What is the overall SQS value for this SDS?
Phase IIA SQS Prov. Value
Target Value
YTD All Participants Actual (%)
A
Weight
B
Actual
A X B X 10
Maximum SQS Value
Customer Service
2.6 2.6 40%
Customer Satisfaction
1.35 1.35 100% 15% 1.50 1.5
Service Coordination
1.25 1.25 83% 25% 2.5
Effectiveness 2.4 2.4 50%
Suitability 0.6 0.6 26% 20% 2.0
Progress 1.8 1.8 100% 30% 3.0
Efficiency 0.9 1.0 10%
Learners Served 0.9* 1.0* 175% 10% 1.0
Total 5.9 6.0 100% 10.0 * While the provincial standard for Learners Served is 90%, service providers commit to serving 100% of their learner targets as articulated in the LBS agreement.
Participant Guide U n i t 2 : L B S P r o g r a m S e r v i c e s a n d C l i e n t P a t h | 32
YTD all Participants
YTD all Participants
YTD all Participants
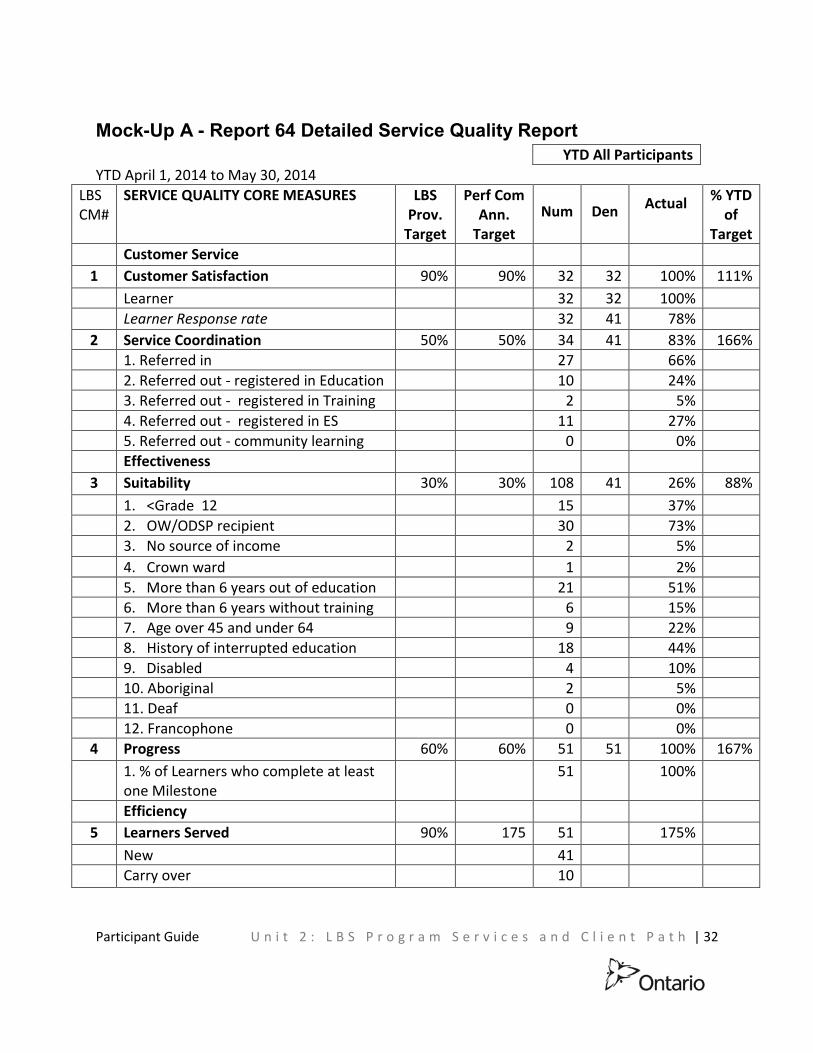
Mock-Up A - Report 64 Detailed Service Quality Report
YTD April 1, 2014 to May 30, 2014
LBS CM#
SERVICE QUALITY CORE MEASURES LBS Prov.
Target
Perf Com Ann.
Target
YTD All Participants
% YTD of
Target
Num Den Actual
Customer Service
1 Customer Satisfaction 90% 90% 32 32 100% 111%
Learner 32 32 100%
Learner Response rate 32 41 78%
2 Service Coordination 50% 50% 34 41 83% 166%
1. Referred in 27 66%
2. Referred out - registered in Education 10 24%
3. Referred out - registered in Training 2 5%
4. Referred out - registered in ES 11 27%
5. Referred out - community learning 0 0%
Effectiveness
3 Suitability 30% 30% 108 41 26% 88%
1. <Grade 12 15 37%
2. OW/ODSP recipient 30 73%
3. No source of income 2 5%
4. Crown ward 1 2%
5. More than 6 years out of education 21 51%
6. More than 6 years without training 6 15%
7. Age over 45 and under 64 9 22%
8. History of interrupted education 18 44%
9. Disabled 4 10%
10. Aboriginal 2 5%
11. Deaf 0 0%
12. Francophone 0 0%
4 Progress 60% 60% 51 51 100% 167%
1. % of Learners who complete at least one Milestone
51 100%
Efficiency
5 Learners Served 90% 175 51 175%
New 41
Carry over 10
Participant Guide U n i t 2 : L B S P r o g r a m S e r v i c e s a n d C l i e n t P a t h | 33
2. Organizational Capacity All successful, sustainable organizations, regardless of sector, have a solid organizational capacity to provide and sustain effective, efficient and customer oriented services.
Organizational capacity is demonstrated by an organization’s ability to effectively measure, plan, communicate, and resource. Organizational capacity is an inherent dimension of the LBS-PMS and it contributes indirectly to the measureable Service Quality Standard.
3. Compliance to the LBS agreement and LBS Service Provider Guidelines All service providers have an agreement with MTCU and are expected to achieve their annual performance commitments within budget and meet all reporting requirements.
Group Mind Map Exercise After reviewing Exercise 2 results develop an SQS value ’mind map’ with the group. A mind map is a central idea written in the middle of a page with related ideas branching out.
In this case, the related ideas affect the SQS value. They are not merely related to it.
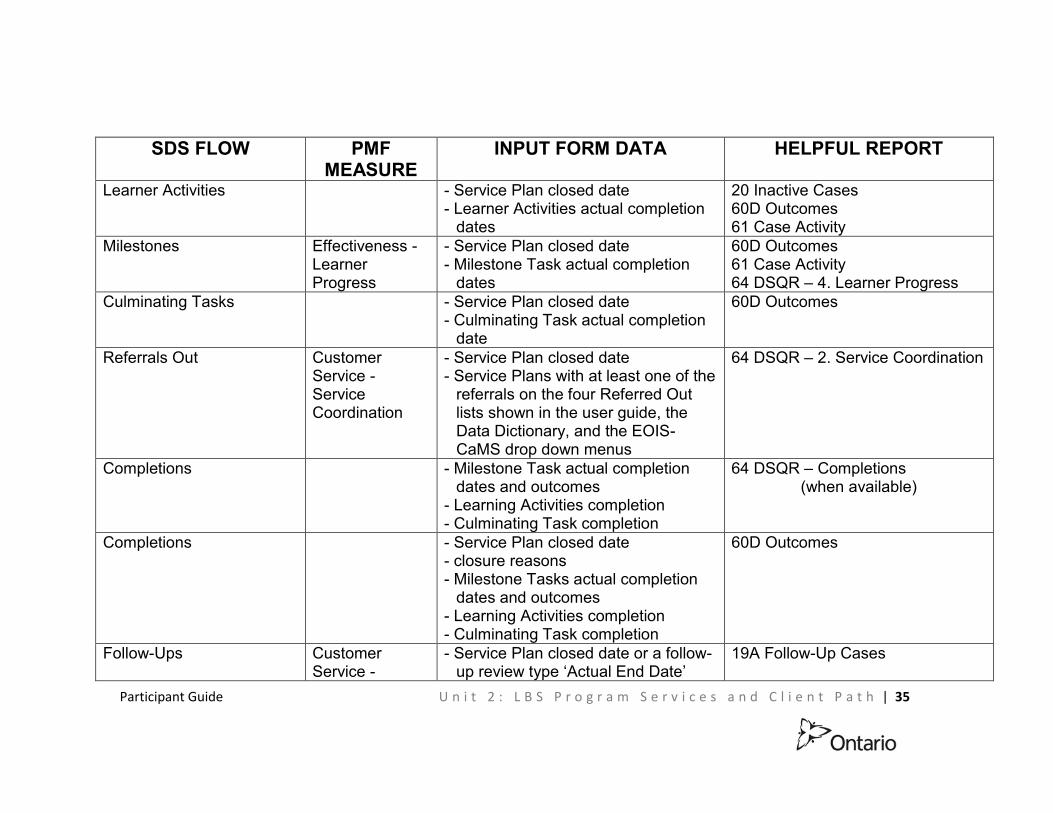
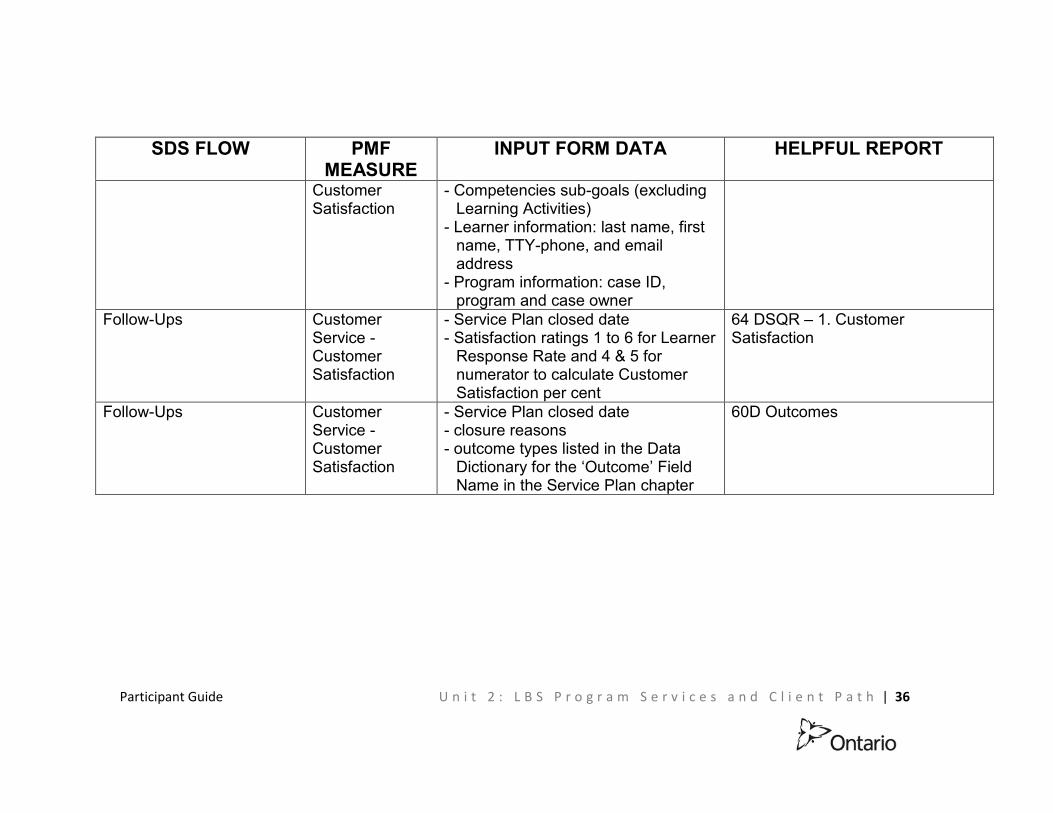
Connecting Input to Reports The table below makes general connections between the PMF, the SQS, and key data that should be collected in EOIS-CaMS at each step along the client path and where that data is output on certain key reports.
The PMF Measure column contains some blank cells because not all steps along the client path have a report 64 core measure.

Participant Guide U n i t 2 : L B S P r o g r a m S e r v i c e s a n d C l i e n t P a t h | 34
SDS FLOW PMF MEASURE
INPUT FORM DATA HELPFUL REPORT
Information and Referral - start date - type of activity: ‘information session’
or ‘outreach’ - number of individuals served - number of individuals referred to
other literacy providers - number of individuals referred to
other programs/services - number of individuals on the wait list
60A All Data – Information and Referral
Referrals In Customer Service - Service Coordination
- Service Plan closed date - Service Plans with at least one of the
referrals on the Referred In list shown in the user guide, the Data Dictionary, and the EOIS-CaMS drop down menus
64 DSQR – 2. Service Coordination
Intake and Assessment - various assessment tools available 61 Case Activity Suitability Effectiveness -
Suitability - Service Plan closed date - Competencies - Suitability category list shown in the
user guide, the Data Dictionary, and the EOIS-CaMS drop down menus
64 DSQR – 3. Suitability
Learner Plan - OALCF Learner Plan - Enhanced Learner Plan
Not applicable
Service Plan Efficiency - Learners Served
- Service Plan start date 64 DSQR – 5. Learners Served
Participant Guide U n i t 2 : L B S P r o g r a m S e r v i c e s a n d C l i e n t P a t h | 35
SDS FLOW PMF MEASURE
INPUT FORM DATA HELPFUL REPORT
Learner Activities - Service Plan closed date - Learner Activities actual completion
dates
20 Inactive Cases 60D Outcomes 61 Case Activity
Milestones Effectiveness - Learner Progress
- Service Plan closed date - Milestone Task actual completion
dates
60D Outcomes 61 Case Activity 64 DSQR – 4. Learner Progress
Culminating Tasks - Service Plan closed date - Culminating Task actual completion
date
60D Outcomes
Referrals Out Customer Service - Service Coordination
- Service Plan closed date - Service Plans with at least one of the
referrals on the four Referred Out lists shown in the user guide, the Data Dictionary, and the EOIS-CaMS drop down menus
64 DSQR – 2. Service Coordination
Completions - Milestone Task actual completion dates and outcomes
- Learning Activities completion - Culminating Task completion
64 DSQR – Completions (when available)
Completions - Service Plan closed date - closure reasons - Milestone Tasks actual completion
dates and outcomes - Learning Activities completion - Culminating Task completion
60D Outcomes
Follow-Ups Customer Service -
- Service Plan closed date or a follow-up review type ‘Actual End Date’
19A Follow-Up Cases
Participant Guide U n i t 2 : L B S P r o g r a m S e r v i c e s a n d C l i e n t P a t h | 36
SDS FLOW PMF MEASURE
INPUT FORM DATA HELPFUL REPORT
Customer Satisfaction
- Competencies sub-goals (excluding Learning Activities)
- Learner information: last name, first name, TTY-phone, and email address
- Program information: case ID, program and case owner
Follow-Ups Customer Service - Customer Satisfaction
- Service Plan closed date - Satisfaction ratings 1 to 6 for Learner
Response Rate and 4 & 5 for numerator to calculate Customer Satisfaction per cent
64 DSQR – 1. Customer Satisfaction
Follow-Ups Customer Service - Customer Satisfaction
- Service Plan closed date - closure reasons - outcome types listed in the Data
Dictionary for the ‘Outcome’ Field Name in the Service Plan chapter
60D Outcomes
Participant Guide U n i t 2 : L B S P r o g r a m S e r v i c e s a n d C l i e n t P a t h | 37
Useful Links The links can be found on the following EOPG web page:
Performance Management Framework (PMF) Participant Guide
Objectives Review
Understand the LBS Client Path:
Participants were introduced to a diagram showing visually how learners progress through the LBS Program. It was indicated there will be more discussion on this diagram later.
Develop a deeper understanding of the components of the PMF: Service Quality Standard, organizational capacity, and compliance:
The core measures and Service Quality Standard were discussed in detail as they are at the heart of the LBS Performance Management System. Organizational capacity is demonstrated by an organizational ability to measure, plan, communicate, and resource.
All service providers have an agreement with MTCU and are expected to achieve their annual performance commitments within budget and meet all reporting requirements.
Understand the three dimensions of the Service Quality Standard (Customer Service, Effectiveness, and Efficiency) and their connection to the core measures:
A graphic was presented connecting each of the five core measures to one of the three dimensions of the Service Quality Standard. Then there was a brief discussion on each of the three dimensions.
Understand the reason for each core measure and potential data integrity issues related to each, and how to increase performance in each core measure:
Participant Guide U n i t 2 : L B S P r o g r a m S e r v i c e s a n d C l i e n t P a t h | 38
After a discussion on core measures a table was presented to the group and the group provided answers to each of these three points. The group answers were then discussed.
Comprehend the relationship between the PMF, the Service Quality Standard, and report data:
A table was presented in the ‘Connecting Input to Reports’ section that draws a connection between the source data input in EOIS-CaMS and the reports. The table included a column connecting the report data to the core measures of the PMF.
Know how the Service Quality Standard value is calculated:
Unit 2 shows how to calculate the SQS value.
Understand the importance of data integrity to the performance management process:
Data integrity, especially timely data input, is necessary to know where an SDS stands with respect to its commitments to the Ministry. Data integrity is also necessary to help SDSs make evidence-based continuous improvement decisions.
Be able to identify where report data is inputted within the EOIS-CaMS system: Reference was made to the report 64Detailed Service Quality Report user guide and the Data Dictionary which can help make the connection between the SQS value and the source data.
Participant Guide U n i t 3 : D a t a I n t e g r i t y | 39
Unit 3: Data Integrity
Objectives:
By the end of this unit you will understand:
the definition of ‘data integrity’;
who the ‘business owners of the data’ are and their responsibilities;
the importance of collecting data in a timely manner;
management support of staff in data collection and data integrity; and
the value of ‘orderliness’.
Participant Guide U n i t 3 : D a t a I n t e g r i t y | 40
What is ‘Data Integrity’? ‘Data integrity’ is defined as “completeness, consistency, timeliness, and accuracy” of data collected and entered into EOIS-CaMS, other systems, and paper files. Data must be reliable, accurate, complete, and relevant in order to make evidence-based decisions.
Who are the Business Owners of the LBS Program Report Data? As the “business owners of data” service providers are responsible for the verification and integrity of data at an SDS level. Although managers may not require data for all their day-to-day tasks, understanding data and how it is used increases the service providers’ ability to link information, performance, and strategy more effectively.
The value of the information contained in operational and performance reports is only as good as the data input into EOIS-CaMS.
Understanding data and how it is used increases the service providers’ ability to link activities, information, performance, and strategy more effectively. ‘Cause and effect’ connections become better understood.
What are the Roles of Service Provider Staff and Management in Data Integrity?
It is important for service provider management to understand the value of data integrity and the importance of collecting data and inputting it into EOIS-CaMS in a timely manner. Accurate reports and all the benefits that are attached to them such as support for evidence-based decision-making require timely data collection, whether for strategic planning or investigation and continuous improvement.
It is equally important for service provider staff to understand this for only with their help and their diligence as front line workers can data integrity occur. Staff are often the first to collect data and input data into EOIS-CaMS. Staff are also often encouraged to engage in continuous improvement and investigation.
Therefore, management needs to support staff to ensure staff understand the value of data integrity and report analysis.

Participant Guide U n i t 3 : D a t a I n t e g r i t y | 41
How does MTCU use LBS Report Data?
MTCU uses the data input into EOIS-CaMS to:
1. define the service and set baseline standards for service delivery and quality;
2. monitor compliance to Agreements to ensure transparency and accountability;
3. demonstrate the value and successes of the LBS Program based on evidence; and
4. inform policy decisions to support the continuous improvement of the LBS Program.
How does a Service Provider use LBS Report Data? Service providers use the data input into EOIS-CaMS to:
1. monitor compliance to the Agreement the service provider has with MTCU;
2. deliver services in accordance with MTCU agreement, program guidelines, performance commitments and reporting requirements and the community service plan;
3. monitor the value of services delivered by the service provider;
4. train new staff;
5. conduct analysis to support continuous improvement, enhance the quality of delivery of the LBS Program, and identify best practices;
6. conduct analysis to improve the capacity for delivery of the LBS Program; and
7. inform the development of annual business plan, including identifying areas of strength and areas for development in the coming fiscal year.
Data Collection Collecting and reporting individual data is done by the service provider using EOIS-CaMS. Part of an MTCU consultant’s monitoring responsibilities is to validate that reported data from an SDS is valid and accurate. The analysis of the collected data is
Participant Guide U n i t 3 : D a t a I n t e g r i t y | 42
What quality assurance checks or systems does your SDS have in place to ensure the data is collected on time and accurately?
What quality assurance checks or systems does your SDS have in place to ensure the data is entered into EOIS-CaMS on time and accurately?
No data.
No data.
No data.
No data.
No data.
No data.
No data.
No data.
No data.
No data.
done by both the service provider and MTCU staff and provides valuable information for the monitoring, planning and improvement process.
Service providers should have quality assurance systems in place “below the waterline” to ensure the data is entered and is accurate. Data entered into EOIS-CaMS must be supported by documentation, including rationale, in physical learner files.
Participant Guide U n i t 3 : D a t a I n t e g r i t y | 43
What Effect does Orderliness in an Organization’s Operations have on its Ability to Deliver Services? Data integrity helps organizations to become more orderly and this orderliness has benefits beyond accurate records. Orderliness helps makes things clear for all members of an organization. Consistent and clear processes help staff understand what is happening within an organization. With this clarity, time and resources can be used more efficiently and service providers are better able to focus on enhancing services.
By measuring, you can focus your energy more effectively on enhancing services to learners.
If you don’t measure results you can’t tell success from failure. If you can’t recognize success, you can’t reward it. If you aren’t rewarding success, you are probably rewarding failure. If you can’t see success you can’t learn from it. If you can’t identify challenges you can’t address them.
Useful Links The links can be found on the following EOPG web pages:
LBS Participant Registration under the Forms section.
LBS Program Exit and Follow-Up under the Forms section.
OALCF Learner Plan Template 2012-13 (Fillable Word Version) [Contains drop menus to simplify usage and reduce errors]
OALCF Learner Plan Template Instructions
Exercise 1 1. Review report 64 data provided in Appendix 1. What data integrity issues could
account for the unusual numbers [the four bolded Num (numerator) and Den (denominator) numbers]?
Participant Guide U n i t 3 : D a t a I n t e g r i t y | 44
Objectives Review The definition of ‘data integrity’:
A definition of ‘data integrity’ was provided which is also included in the Glossary:
‘Data integrity’ is defined as “completeness, consistency, timeliness, and accuracy” of data collected and entered into EOIS-CaMS, other systems, and paper files. Data must be reliable, accurate, complete, and relevant in order to make evidence-based decisions.
Who the ‘business owners of the data’ are and their responsibilities:
Service providers are the “business owners of data” and they are responsible for verifying and ensuring the integrity of data at the SDS level.
The importance of collecting data in a timely manner:
Accurate reports and all the benefits that are attached to them such as support for evidence-based decision-making require timely data collection, whether for strategic planning or investigation and continuous improvement.
Management support of staff in data collection and data integrity:
Support staff are front line workers who are often the first to come in contact with data and they input data into EOIS-CaMS. Therefore they have a significant role in data collection and data integrity, and a growing involvement in continuous improvement and investigation. Management support of staff in these areas will improve staff effectiveness.
The value of ‘orderliness’:
Orderliness increases certainty as to what one is doing. Orderliness pushes out confusion, and wasted time and energy go with it. Orderliness expands an organization’s capacity to deliver services.

Participant Guide U n i t 4 : R e p o r t A n a l y s i s | 45
Unit 4: Report Analysis
Objectives
By the end of this unit you will:
understand the different types of reports available and how each can help identify opportunities for continuous improvement;
be able to analyse LBS data at the SDS, regional and provincial levels;
understand how making evidence-based decisions and tracking results helps to drive continuous improvement and enhance services for learners;
be able to support staff to analyse data and make evidence-based decisions to continuously improve the LBS Program; and
know where to find additional resources.
0
20
40
60
80
100
120
1 (%167) 2 (%142) 3 (%111) 4 (%100)Lear
ne
rs S
erv
ed
(A
nn
ual
Tar
get
12
0)
Quarters (SQS Efficiency)
NewLearnersCarry OverLearners
120
Participant Guide U n i t 4 : R e p o r t A n a l y s i s | 46
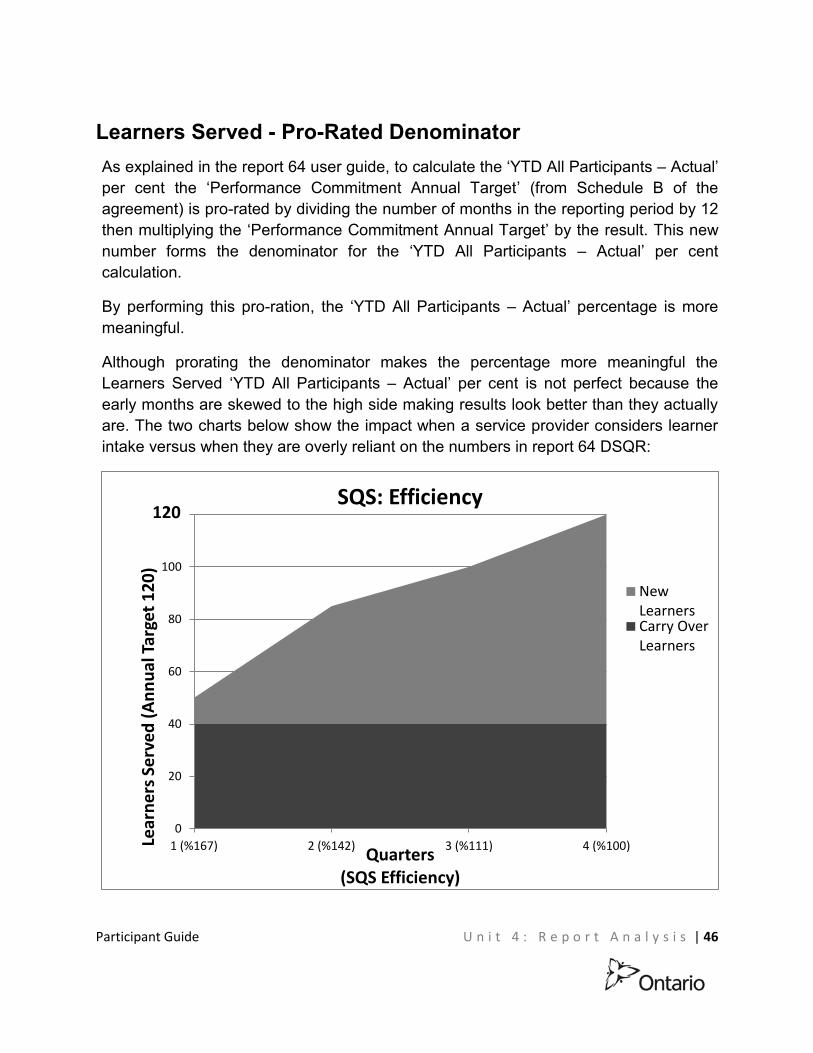
Learners Served - Pro-Rated Denominator As explained in the report 64 user guide, to calculate the ‘YTD All Participants – Actual’ per cent the ‘Performance Commitment Annual Target’ (from Schedule B of the agreement) is pro-rated by dividing the number of months in the reporting period by 12 then multiplying the ‘Performance Commitment Annual Target’ by the result. This new number forms the denominator for the ‘YTD All Participants – Actual’ per cent calculation.
By performing this pro-ration, the ‘YTD All Participants – Actual’ percentage is more meaningful.
Although prorating the denominator makes the percentage more meaningful the Learners Served ‘YTD All Participants – Actual’ per cent is not perfect because the early months are skewed to the high side making results look better than they actually are. The two charts below show the impact when a service provider considers learner intake versus when they are overly reliant on the numbers in report 64 DSQR:
SQS: Efficiency

Participant Guide U n i t 4 : R e p o r t A n a l y s i s | 47
0
20
40
60
80
100
120
1 (%167) 2 (%92) 3 (%72) 4 (%67)
Lear
ne
rs S
erv
ed
(A
nn
ual
Tar
get
12
0)
Quarters (SQS Efficiency)
NewLearnersCarry OverLearners
120
In the chart above the service provider adds new learners in a quantity that matches the target number of learners at year end. The service provider is aware that the percentages are skewed in the early months and that this can mislead service providers into thinking that they are further ahead than they might be. Therefore, this service provider actively sought new learners from the start of the fiscal year.
SQS: Efficiency
In the chart above the service provider did not actively seek new learners but rather felt comfortable with the 167% skewed result at the end of the first quarter. This misinterpretation of the early skewed result caught up to this service provider who was unable to catch up and meet target by year-end.
The importance of understanding how reports are calculated so appropriate action can be taken, if necessary, is highlighted by comparing these two charts.

Participant Guide U n i t 4 : R e p o r t A n a l y s i s | 48
Continuous Improvement Process The purpose of the continuous improvement process is to assist service providers to identify strengths and identify challenges to inform decision making and the development of improvement strategies. Below you will see outlined the process that service providers may follow to identify successes and continuous improvement opportunities when reviewing reports:
1. Analyze a report to identify anything odd, undesirable, or excellent. Look for values below the annual target or above it but trending lower. Look for very high values which are indicators of strong success in an area which you want to continue.
Note: Reviewing the report user guides and the LBS Data Dictionary, in that order, can help service providers to better understand the data in the reports. These resources are available on the Employment Ontario Partners’ Gateway. Sample extracts are also available in Appendix 2 and Appendix 3 of this guide.
2. To understand the cause of the report results (cause – effect) it may be necessary to investigate the source of the data. How to investigate is left to each service provider. The cause could be data integrity related or performance related.
3. Devise an improvement plan to address any identified issues then implement it.
4. Review the outcome of the improvement plan and revise the plan if necessary.
Reports Available The following reports are helpful in identifying opportunities for continuous improvement. Sample pages for some reports are provided in the Appendices:
19A Follow-Up Cases (Client Level) Appendix 4
20 Inactive Cases (Client Level) Appendix 5
Participant Guide U n i t 4 : R e p o r t A n a l y s i s | 49
60A All Data – Information and Referral Appendix 6
60B Learner/Profile is an eight-page report providing a variety of learner profile data in summary form in both absolute numbers and percentages.
60D Outcomes Appendix 7
61 Case Activity (Client Level) (samples provided in slide deck)
64 Detailed Service Quality Report (DSQR) (only pages 1 and 2 and with a different format for convenience)
Appendix 8
The table in the section titled ‘Connecting Input to Reports’ presented in Unit 2 aligns the reports to steps in the client path, with the exception of report 61 which is discussed further on. The section titled ‘What the Report Data could be Telling You’ further below explains how specific reports can help with continuous improvement.
But first, let’s re-visit the typical LBS Program client path flowing through an SDS introduced in Unit 2.
The LBS Client Path (expanded) Intake Clients enter the SDS (left side of diagram below) after hearing about SDS services. They might enter through an Information and Referral activity, referral from another community organization, or by word-of-mouth.
Assess An assessment is performed and suitability indicators are documented.
Learner Plan A learner plan is developed with the learner then input into EOIS-CaMS becoming a service plan (see the yellow triangle ‘alert’ below).
Training Learning activities are administered then assessed by way of milestone tasks and culminating tasks.
Follow-Up
Participant Guide U n i t 4 : R e p o r t A n a l y s i s | 50
The learner could be referred out at any point along the pathway; often upon completion. The learner completes the program then follow-up activities are performed (right side of diagram below). These activities could include a survey, a conversation, an email, etc.
Service providers can choose to use their own forms or the Enhanced Learner Plan (ELP) template which can be downloaded from within EOIS-CaMS. The ELP is a non-mandatory tool which is created using data from the learner’s service plan. Users can edit information and then upload the ELP to EOIS-CaMS. When uploaded, the ELP makes all the appropriate changes to the learner’s service plan.
Anywhere along this client path there could be opportunities for improvement. The reports listed under Reports Available above can help identify those areas and that is the subject of the next section.

Participant Guide U n i t 4 : R e p o r t A n a l y s i s | 51
Diagram of the LBS Client Path:
Lear
ner
Pla
nC
reat
ion
2 ASSESS
Goal Paths Activities
4. Learner Progress
1. Customer Satisfaction3. Suitability
1 INTAKE
5 EXIT and
FOLLOW-UP
Ref
erra
lsIn
Sui
tabi
lity
Ref
erra
lsO
ut
Com
plet
ions
public
4 TRAINING
3 LEARNER
PLAN
2. Service Coordination
5. Learners Served
Pha
se ll
A
CO
RE
ME
AS
UR
ES
Ser
vice
Pla
n(E
OIS
-CaM
S)
Lear
ning
Act
iviti
es
Mile
ston
es
Cul
min
atin
g Ta
sk
Exi
t & F
ollo
w-U
p
Inta
ke a
sses
smen
t
Info
rmat
ion
and
Ref
erra
l
secondary school secondary school credit
Info
rmat
ion
and
Ref
erra
l
Inta
ke a
sses
smen
t
Lear
ner
Pla
n C
reat
ion
Ser
vice
Pla
n (E
OIS
-CaM
S)
Lear
ning
Act
iviti
es
Mile
ston
es
Cul
min
atin
g Ta
sk
Exi
t & F
ollo
w-U
p
Ref
erra
ls In
Sui
tabi
lity
Ref
erra
ls O
ut
Com
plet
ions
public
1 INTAKE
5 EXIT and
FOLLOW-UP
4 TRAINING
3 LEARNER
PLAN
2. Service Coordination
5. Learners Served
4. Learner Progress
1. Customer Satisfaction 3. Suitability
Pha
se ll
A
CO
RE
ME
AS
UR
ES
2 ASSESS
Goal Paths Activities
Participant Guide U n i t 4 : R e p o r t A n a l y s i s | 52
What the Report Data could be Telling You The sections below are based on the diagram above. The sections below match steps in the client path to specific reports. The purpose of these sections is to inform participants of what the data could be telling them. The lists are not complete as situations vary; however, there should be enough content to prompt participants to think of what else the reports could be telling them.
Understanding the reports then performing investigation is vital to evidence-based decision-making.
Information and Referral Report 60A – All Data – Information and Referral
What can the data tell you:
a) The report data could show that information and referral activity is low which could account for available capacity to help learners, if there is available capacity. Available capacity could be filled by performing more information and referral activity such as holding more information sessions, conducting more outreach, and getting in contact with old and new sources of potential referrals.
b) Looking at historical 60A reports and Learners Served on historical 64 reports it is possible to see which information and referral activities drive in new learners.
c) The ‘Number of Individuals on the Wait List’ data could reveal opportunities to work together with other service providers to coordinate referrals. This shows the importance of keeping in contact with other service providers.
Participant Guide U n i t 4 : R e p o r t A n a l y s i s | 53
Referrals In Report 64 DSQR – 2. Service Coordination
What can the data tell you:
a) The report indicates whether the SDS is meeting its Service Coordination commitment to MTCU in Schedule E of the LBS agreement.
b) Provides an indication as to the degree to which the service provider’s services are integrated within the community. It can indicate how aware community members are of the service provider’s services.
Intake and Assessment Report 61 Case Activity
What can the data tell you:
Specific data on individual learners. For example, the data can be useful when investigating learners who exited prior to completion. Perhaps learners are being accepted into the program when they should be referred out. Re-training of staff on performing assessments could be an opportunity for continuous improvement.
Suitability Report 64 DSQR – 3. Suitability
What can the data tell you:
a) The report data indicates whether the SDS is meeting its Suitability commitment to MTCU as identified in Schedule E of the LBS agreement.
b) The report data tells the service provider the degree to which the service provider is serving learners who are most in need of LBS services. It takes into account the fact that learners can be facing multiple barriers.
If all learners faced all of the issues identified through all 10 Suitability indicators (OW/ODSP, no source of income, and crown ward counting as
Participant Guide U n i t 4 : R e p o r t A n a l y s i s | 54
one) then the ‘YTD All Participants – Actual’ value would read 100%. Knowing this helps service providers understand the ‘YTD All Participants – Actual’ value.
c) Service providers can see from the report which specific barriers learners may have and compare that to the demographics of the area they serve as identified through the Literacy Service Planning table. Do the two align, or are some learner categories being under served? If underserved, there is a continuous improvement opportunity: devise a plan to increase service to the underserved demographic.
Service Plan Report 64 DSQR – 5. Learners Served
What can the data tell you: a) Report 64 DSQR – 5. Learners Served indicates whether the SDS is
meeting its Learners Served commitment to MTCU in Schedule E of the LBS agreement.
b) Can indicate the visibility of the service provider in the broader community. Can indicate the degree to which the service provider has made itself well known to other community resources, other programs and services, and to the general public.
Learner Activities Report 20 Inactive Cases Report 60D Outcomes
What can the data tell you: a) Report 20 Inactive Cases reveals service plans that have not been updated
for at least 60 days. Since keeping learners moving through the program is critical, inactive cases should be reviewed to determine if there is any way to keep the learners moving along their goal path. Is it a matter of the learners requiring training supports, a reminder phone call, or do the learners feel that the learning activities are not relevant to their goals?
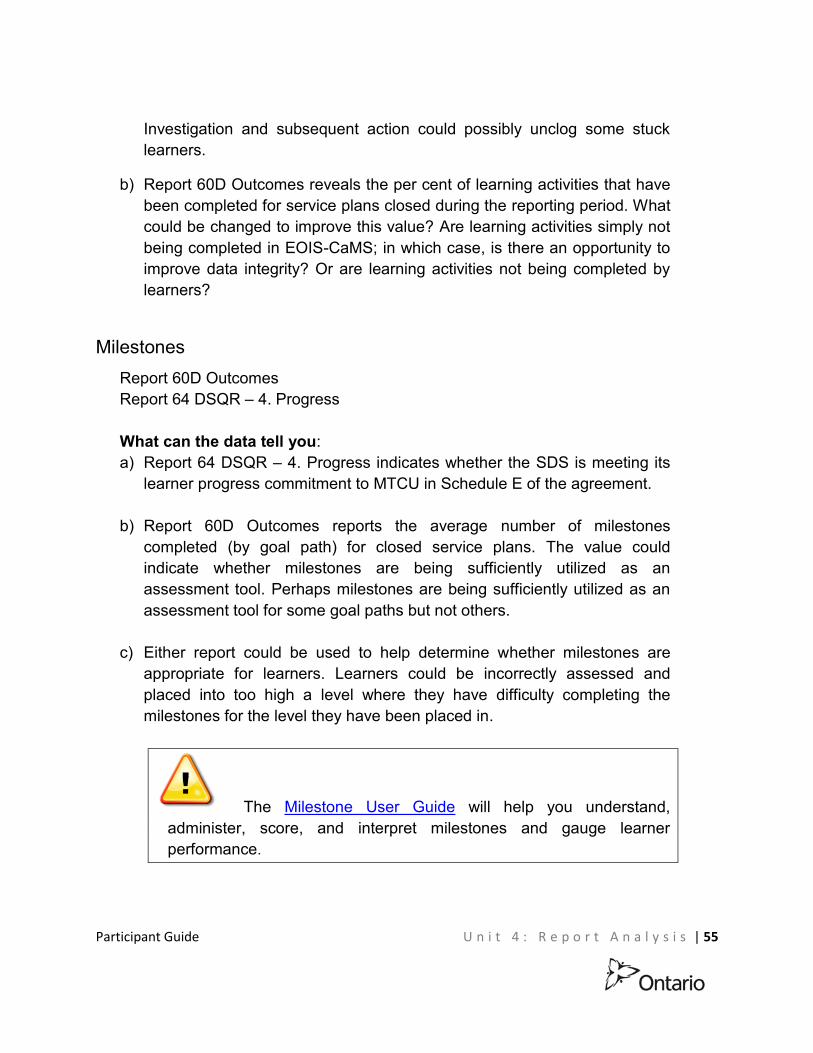
Participant Guide U n i t 4 : R e p o r t A n a l y s i s | 55
Investigation and subsequent action could possibly unclog some stuck learners.
b) Report 60D Outcomes reveals the per cent of learning activities that have been completed for service plans closed during the reporting period. What could be changed to improve this value? Are learning activities simply not being completed in EOIS-CaMS; in which case, is there an opportunity to improve data integrity? Or are learning activities not being completed by learners?
Milestones Report 60D Outcomes Report 64 DSQR – 4. Progress
What can the data tell you: a) Report 64 DSQR – 4. Progress indicates whether the SDS is meeting its
learner progress commitment to MTCU in Schedule E of the agreement.
b) Report 60D Outcomes reports the average number of milestones completed (by goal path) for closed service plans. The value could indicate whether milestones are being sufficiently utilized as an assessment tool. Perhaps milestones are being sufficiently utilized as an assessment tool for some goal paths but not others.
c) Either report could be used to help determine whether milestones are appropriate for learners. Learners could be incorrectly assessed and placed into too high a level where they have difficulty completing the milestones for the level they have been placed in.
The Milestone User Guide will help you understand, administer, score, and interpret milestones and gauge learner performance.
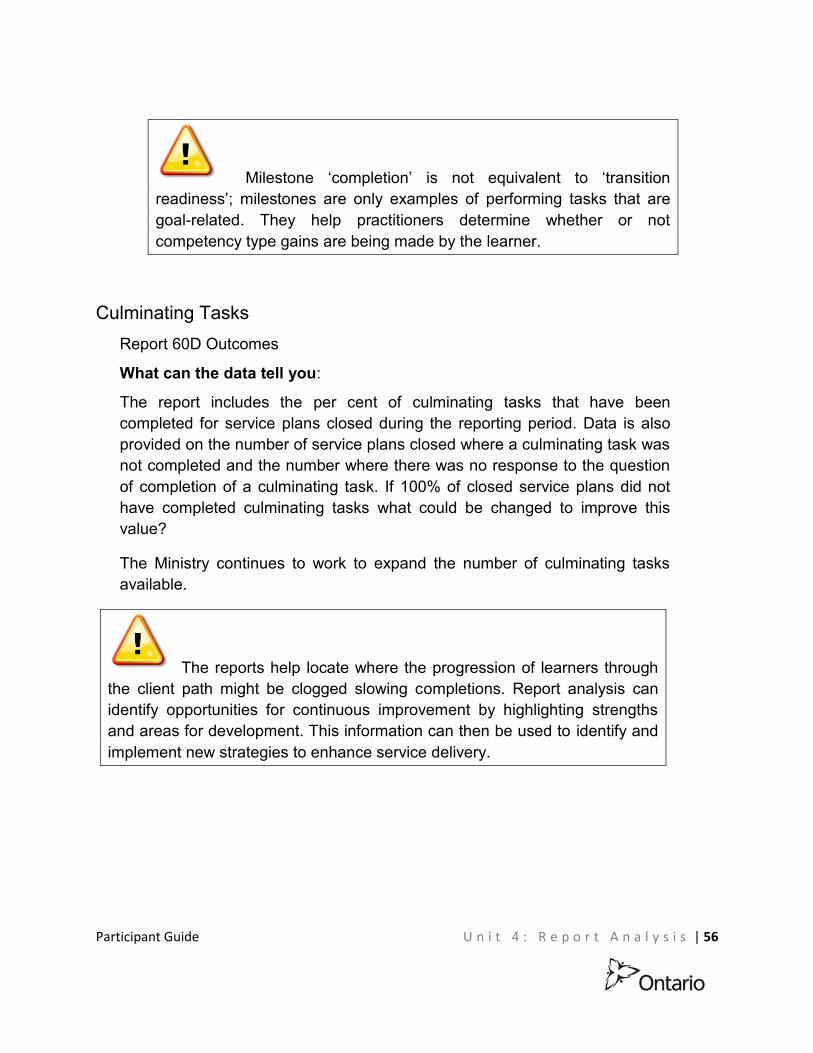
Participant Guide U n i t 4 : R e p o r t A n a l y s i s | 56
Milestone ‘completion’ is not equivalent to ‘transition readiness’; milestones are only examples of performing tasks that are goal-related. They help practitioners determine whether or not competency type gains are being made by the learner.
Culminating Tasks Report 60D Outcomes
What can the data tell you:
The report includes the per cent of culminating tasks that have been completed for service plans closed during the reporting period. Data is also provided on the number of service plans closed where a culminating task was not completed and the number where there was no response to the question of completion of a culminating task. If 100% of closed service plans did not have completed culminating tasks what could be changed to improve this value?
The Ministry continues to work to expand the number of culminating tasks available.
The reports help locate where the progression of learners through the client path might be clogged slowing completions. Report analysis can identify opportunities for continuous improvement by highlighting strengths and areas for development. This information can then be used to identify and implement new strategies to enhance service delivery.

Participant Guide U n i t 4 : R e p o r t A n a l y s i s | 57
Referrals Out Report 64 DSQR – 2. Service Coordination
What can the data tell you:
a) Report 64 DSQR – 2. Service Coordination indicates whether the SDS is meeting its Service Coordination commitment to MTCU in Schedule E of the LBS agreement.
b) The degree to which learners are moving through the program to their goals of employment, apprenticeship, secondary school credit, post-secondary education, or independence.
c) The degree to which service providers are helping learners remove barriers by referring learners to other supports they may require.
Completions Report 64 DSQR – Completions (not yet part of the SQS value) Report 60D Outcomes
What can the data tell you:
a) The rate at which learners are completing and exiting the LBS Program.
b) If report 64 DSQR – Completions shows completions are low the service provider can often get some understanding as to why this is the case by reviewing report 60D Outcomes. It could be that learners are having difficulty progressing through any of the three elements which are all necessary for a service plan to count on report 64 under ‘Completion’:
1. completion of all milestones (a minimum of one) 2. completion of the culminating task 3. completion of all learning activities
c) Report 60D Outcomes provides data on the completion of milestones, learning activities, and culminating tasks. It also provides data on closed service plans where all three indicators were completed.
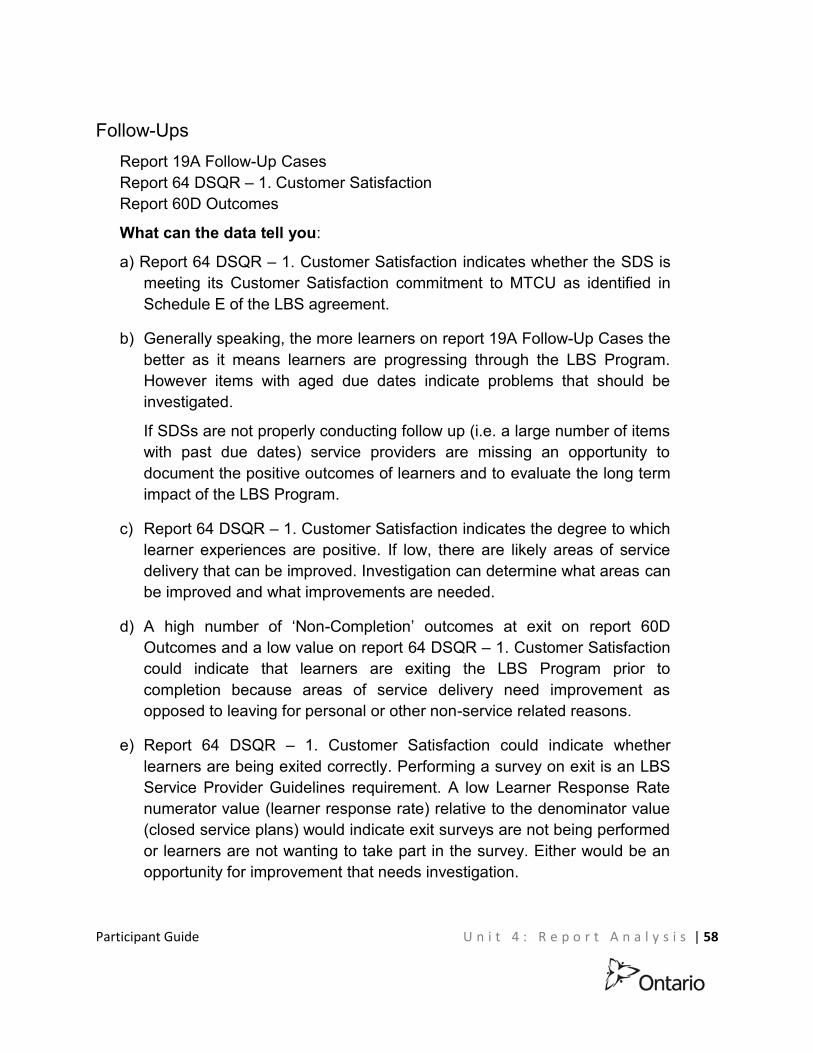
Participant Guide U n i t 4 : R e p o r t A n a l y s i s | 58
Follow-Ups Report 19A Follow-Up Cases Report 64 DSQR – 1. Customer Satisfaction Report 60D Outcomes
What can the data tell you:
a) Report 64 DSQR – 1. Customer Satisfaction indicates whether the SDS is meeting its Customer Satisfaction commitment to MTCU as identified in Schedule E of the LBS agreement.
b) Generally speaking, the more learners on report 19A Follow-Up Cases the better as it means learners are progressing through the LBS Program. However items with aged due dates indicate problems that should be investigated.
If SDSs are not properly conducting follow up (i.e. a large number of items with past due dates) service providers are missing an opportunity to document the positive outcomes of learners and to evaluate the long term impact of the LBS Program.
c) Report 64 DSQR – 1. Customer Satisfaction indicates the degree to which learner experiences are positive. If low, there are likely areas of service delivery that can be improved. Investigation can determine what areas can be improved and what improvements are needed.
d) A high number of ‘Non-Completion’ outcomes at exit on report 60D Outcomes and a low value on report 64 DSQR – 1. Customer Satisfaction could indicate that learners are exiting the LBS Program prior to completion because areas of service delivery need improvement as opposed to leaving for personal or other non-service related reasons.
e) Report 64 DSQR – 1. Customer Satisfaction could indicate whether learners are being exited correctly. Performing a survey on exit is an LBS Service Provider Guidelines requirement. A low Learner Response Rate numerator value (learner response rate) relative to the denominator value (closed service plans) would indicate exit surveys are not being performed or learners are not wanting to take part in the survey. Either would be an opportunity for improvement that needs investigation.

Participant Guide U n i t 4 : R e p o r t A n a l y s i s | 59
Exercise 1 Using the examples in the participant guide or your own ideas come up with an example of what a report could be telling you for each step in the client path.

Participant Guide U n i t 4 : R e p o r t A n a l y s i s | 60
Report 61 Case Activity (Client Level) This is a unique report as it captures all or almost all the service plan related raw data included in other reports. Each service plan is like a database record. The report can be exported to Microsoft Excel where it can be manipulated in many ways such as by being sorted by various columns, counts and averages can be applied, the Excel FIND feature can be used, and so on.
In addition to service plans closed during the reporting period, the data in report 61 includes active service plans which make this a valuable report as information on current service plans can be obtained from the report.
Working with this report is a good way to understand the average profile of current learners. It can tell you how many competencies each learner has, how many were completed during the year, how many milestones each learner has, how many were completed during the year, training support expenditures by learner, and so much more.
This report can be useful during investigation or to determine the demographics of learners both past and present.
Report 61 includes EOIS-CaMS statuses of Closed, Open, Approved, and Active service plans whereas report 64 Detailed Service Quality Report is based mostly on Closed service plans.
Participant Guide U n i t 4 : R e p o r t A n a l y s i s | 61
Data Combinations The section ‘What the Report Data could be Telling You’ above touched on using more than one report data indicator to search for continuous improvement opportunities. Summarized below are just a few potentially useful ways data can be reviewed in combination:
o Report 20 Inactive Cases (service plan not updated for 60 days) and report 61 Case Activity can be used to find where learners are having difficulty progressing. Report 20 will identify the inactive cases and report 61 can be used to understand the individual learner profiles and see where they were last active. Perhaps the milestones and learning activities are too challenging for some learners. Developing learning activities in smaller steps might be required or perhaps it is as simple as learning activities not being entered into EOIS-CaMS.
o Report 64 Detailed Service Quality Report core measure sub-category ‘Learners Served – New’ shows the visibility of the SDS in the broader community. Word-of-mouth can affect this data. Therefore, if core measure Customer Satisfaction is low and ‘Learners Served – New’ is low then low Customer Satisfaction could be affecting ‘Learners Served – New’. The situation would need to be investigated then improved.
o If report 64 Detailed Service Quality Report core measure ‘Progress’ indicates many milestones are being completed by learners and ‘Outcomes at Exit - Completions’ on report 60D Outcomes is high but goal path Outcomes at 12 Months on the same report is low it could indicate an opportunity for continuous improvement. Maybe training is not bringing learners up to a sufficient level and learners complete the program, reach their goal, but cannot hang on.
Staff There is a need for management to transfer report analysis skills to staff. As mentioned in Unit 3, the section titled ‘Management Support of Staff’, staff are on the front lines and very much effect the data input into EOIS-CaMS. They are involved in the activities that generate the data input into EOIS-CaMS, data they often input. It is important for staff to know how their actions effect report data.
Participant Guide U n i t 4 : R e p o r t A n a l y s i s | 62
Not only is it important for SDS staff to understand the value of data integrity, it is important for staff to be able to analyse report data and act on it. This includes skills related to investigation and identifying areas for continuous improvement. To create a strong LBS Program they must become part of the evidence-based decision-making continuous improvement process. Report data is a valuable tool in this process.
Learners win when staff routinely makes use of report data.
The Big Picture Much of what has been discussed earlier in this guide is part of continuous improvement. This section discusses the later part of the greater continuous improvement process. At this point we are more interested in reviewing the big picture and less interested in details.
Quarterly Status and Adjustment Reports (QSAR) Thorough monthly analysis of the reports as covered earlier in this guide, especially report 64 Detailed Service Quality Report and subsequent investigations conducted as needed, provide the grounding that forms the foundation of your QSAR. If data integrity is high and the analysis and investigations are performed diligently each month then all the information to complete your QSAR should be readily available.
LBS Business Plan EOIS-CaMS data reports can provide raw data such as ‘outcomes at exit’ (obtained from report 60D Outcomes) that can help determine future commitment target values. In addition to providing raw data, the work performed during the previous year goes a long way to formulating a meaningful Business Plan, providing much of the plan’s supporting evidence.
The more thorough a service provider is at analyzing reports regularly and investigating underlying causes of favourable or unfavourable results the better informed it will be of the factors affecting its success. With this better understanding of cause and effect, the better equipped a service provider will be to develop sound strategy moving forward.
Participant Guide U n i t 4 : R e p o r t A n a l y s i s | 63
Accurate and timely data input throughout the year is required for the data and analysis used in developing the Business Plan to be meaningful.
Roll-Up Reports Some reports such as 60A All Data – Information and Referrals can be rolled up to the regional and provincial levels. These roll-up reports allow service providers to compare their SDSs to the regional and provincial averages.
Provincial and regional roll-up reports are available under the Rollup Reports section of the EOIS Service Provider Reporting Website (requires authenticated ‘ONe-key’).
Useful Links The links can be found on the following EOPG web pages:
Business Planning
QSAR Template under the Quarterly Status and Adjustment Report (QSAR) section
The following two documents contain definitions, data sources, and calculations which are critical to understanding the meanings of the values in various reports. They also assist in creating a trail between the report data and the source data:
EOIS-CaMS Detailed Reporting User Guides
EOIS-CaMS Literacy and Basic Skills Data Dictionary
Participant Guide U n i t 4 : R e p o r t A n a l y s i s | 64
Exercises 2 to 6 2. Using the report 64 data provided in Appendix 9 calculate the requested values
that would show on report 64 Detailed Service Quality Report (For calculations please see tjejaAppendix 10):
Requested Values:
a) Calculate the ‘YTD All Participants Actual’ value for 1. Customer Satisfaction.
b) Calculate the ‘YTD All Participants Actual’ value for 2. Service Coordination.
c) Calculate the ‘YTD All Participants Actual’ value for 3. Suitability. d) Calculate the ‘YTD All Participants Actual’ value for 4. Progress. e) Calculate the ‘YTD All Participants Actual’ value for 5. Learners
Served.
3. Using the report 64 data provided in Appendix 11 calculate the requested values that would show on report 64 Detailed Service Quality Report (For calculations please see Appendix 12):
a) Calculate the ‘% YTD of Target’ for 1. Customer Satisfaction. b) Calculate the ‘% YTD of Target’ for 2. Service Coordination. c) Calculate the ‘% YTD of Target’ for 3. Suitability. d) Calculate the ‘% YTD of Target’ for 4. Progress.
4. Please see Appendix 8i (report 64). What is the main issue the SDS is having?
5. Please see Appendix 13 (report 64).What is the main issue the SDS is having?
6. Please see Appendix 14 (report 64).What is the main issue the SDS is having?
Participant Guide U n i t 4 : R e p o r t A n a l y s i s | 65
Objectives Review
Understand the different types of reports available and how each can help identify opportunities for continuous improvement:
The ‘Reports Available’ section lists reports that help service providers perform continuous improvement. The ‘What the Report Data could be Telling You’ section looks at each step in the client path and indicates which of those reports could help identify strengths and opportunities for continuous improvement along each step of the client path.
Be able to analyse LBS data at the SDS, regional and provincial levels:
A diagram was presented that showed the general flow of clients and learners through the client path. The diagram was discussed in detail covering such specifics as monitoring the flow of learners to ensure they move through to their goals, and locating points along the way where efficiencies could be created.
The ‘Exercises’ section added to the above by helping participants understand the calculations contained in report 64 Detailed Service Quality Report.
The unique nature of report 61 Case Activity is a powerful investigative tool.
Understand how making evidence-based decisions and tracking results helps to drive continuous improvement:
Through examples and exercises participants discovered that accurate reports provide evidence needed to make sound continuous improvement decisions.
Be able to support staff to analyse data and make evidence-based decisions to continuously improve the LBS Program:
By utilizing this guide and Unit 4 in particular, the reports, and both the report user guides and the Data Dictionary participants have the tools needed to analyse data to inform evidence-based decisions and continuously improve the LBS Program.
Know where to find additional resources:
Links to report user guides, Data Dictionary, and other resources was provided.
Participant Guide S u m m a r y | 66
Summary
Since it was initially created, the LBS Program has continued to evolve. Today’s training session is another step in that journey.
We began by discussing MTCU service provider expectations: achieve contracted commitments, integrate continuous improvement, and collect quality SDS level data.
Data integrity, especially timely and accurate data input, was stressed throughout the training for without clean data evidence-based decision-making cannot occur.
Even with report data of high integrity, report analysis can falter if service providers do not understand how the data is calculated. Report calculations are contained in the appendices to support service providers. Participants performed the same calculations as EOIS-CaMS does, this gives the participants a sound footing for understanding the make-up of specific report data and results.
A diagram was presented showing how learners flow through the LBS Program. Understanding this diagram is a significant step in knowing where to look for successes and continuous improvement opportunities. As well, tools that aid investigation were noted that help service providers to make the connection between report data and SDS activities, including the report user guides and the data dictionary.
Examples were given of what could be revealed by report data, and participants added their own observations. This is merely a small sample of the possible situations that can happen at an SDS and be uncovered by the reports.
Today’s training concentrated on report analysis, with the intention that with this skill SDSs go beyond analysis to investigation and continuous improvement.
Participant Guide S u m m a r y | 67
Resources The EOPG website contains numerous resources to assist service providers in improving SDS data and assist with data integrity or investigation. Below are EOPG website pages where useful resource links are located.
Employment Ontario Information Systems - CaMS
EOIS-CaMS Detailed Reporting User Guides
EOIS-CaMS Literacy and Basic Skills Data Dictionary
EOPG Acronyms
LBS Participant Registration under the Forms section
LBS Performance Management System
LBS Program Exit and Follow-Up under the Forms section
LBS updates
Literacy and Basic Skills Program
OALCF Learner Plan Template 2012-13 (Fillable Word Version) [Contains drop menus to simplify usage and reduce errors]
OALCF Learner Plan Template Instructions
OALCF Overview
Online Referral Guide
Performance Management Framework (PMF) Participant Guide
QSAR Template under the Quarterly Status and Adjustment Report (QSAR) section
Participant Guide S u m m a r y | 68
1. Explain one new way you will perform report analysis when you return to your SDS.
No data.
No data.
No data.
No data.
No data.
No data.
No data.
No data.
No data.
No data.
No data.
No data.
No data.
No data.
No data.
No data.
Exercise 1
Participant Guide G l o s s a r y | 69
Glossary
These terms are provided here to support this training. More definitions related to the LBS Program can be found in the following resources:
the LBS Guidelines; the EOIS-CaMS LBS Data Dictionary; the EOIS-CaMS Service Provider User Guide Glossary; and the OALCF Glossary.
Basic Skills – The additional skills a learner needs to use their literacy skills, such as digital technology, interpersonal skills, problem solving, and critical thinking.
Clients – Adults who access Information and Referral or assessment services, but who will not be receiving LBS training services at the SDS.
Competencies – Competencies are broad, generic categories of learners’ abilities that capture and organize the learning in a program. There are six competencies: find and use information, communicate ideas and information, understand and use numbers, use digital technology, manage learning, and engage with others.
Culminating Task – It serves as a key indicator of a learner’s readiness to transition to the selected goal. A culminating task is more complex than a milestone task, but is similarly aligned with the curriculum framework, which is part of the Ontario Adult Literacy Curriculum Framework (OALCF).
Curriculum Framework – Sets out the content of learning within a system, using an established set of organizing principles. Within the OALCF, the curriculum framework refers specifically to the six competencies that organize learning content and describe learning proficiency, using three levels of performance.
Data Integrity – ‘Data integrity’ is defined as “completeness, consistency, timeliness, and accuracy” of data collected and entered into EOIS-CaMS, other systems, and paper files. Data must be reliable, accurate, complete, and relevant in order to make evidence-based decisions.
Participant Guide G l o s s a r y | 70
Employment Ontario Information System-Case Management System (EOIS-CaMS) – A web-based, real-time software solution that supports the administration and management of clients participating in EO programs and services. Authorized Ministry and service provider staff access the system, in which specific information is accessible across the province.
e-Channel – A web-based way to deliver LBS training that improves access for Ontarians who choose or are in need of independent distance learning. e-Channel provides better access for persons with disabilities and those who live in rural and remote communities.
Goal – The goal is what the learner wants to achieve once leaving the LBS Program. It is the next step to which the learner transitions after completing the LBS Program.
Goal Path (Pathway) – The goal path refers to the preparation required to exit LBS and transition to the goal and is delivered by an LBS Service Provider. The LBS Program has five goal paths: employment, apprenticeship, secondary school credit, post-secondary and independence.
Learner – An adult who receives LBS training services to achieve a milestone or learning activity and has a learner plan.
Learning Activities – Learning activities help learners to develop the skills required to master a competency and gain the specific knowledge required for their goal. Learning activities are highly individualized, and enable service providers to customize the learner plan.
Learner Plan – Describes the learning or program elements that prepare learners for their goal beyond the LBS Program. It includes the learner’s goal, background information, assessment results, milestone tasks, culminating task, learning activities, program duration, additional supports required, and referral results.
Levels – The Curriculum Framework uses three levels to describe a learner’s developing proficiency to perform tasks. These levels are informed by the same factors that drive complexity at Essential Skills Levels 1, 2 and 3.
Literacy – The ability of individuals to apply communication, numeracy and digital skills to find, use, and create and think critically about information and ideas. Literacy involves a continuum of learning that enables individuals to achieve their goals, solve problems,

Participant Guide G l o s s a r y | 71
make decisions, participate fully in our increasingly diverse and technological society, and contribute to the innovation economy.
Milestone (also Milestone Task) – Standardized indicators of learner progress towards goal completion. Organized by goal path, they are linked to the indicators in the competencies and task groups at three levels of performance found in the Curriculum Framework.
Ontario Adult Literacy Curriculum Framework (OALCF) – Refers to all the features of delivering a competency-based program, including competencies, assessment, learner transitions to employment, apprenticeship, post-secondary education, secondary school credit, independence, and learning materials.
Outcome – The final status of cases and items in EOIS-CaMS.
Outreach – Reaching out into the community. For example: attending job fairs, volunteer fairs, community events, etc.
Performance Management Framework (PMF) – A clear, strategic system that defines what is important and what is expected, and uses three dimensions of success (Service Quality Standard, Organizational Capacity, Compliance to MTCU Agreement and LBS Service Provider Guidelines).
Plan Items – Specific services, benefits, and learning activities that the learner will undertake in order to meet the sub-goal. For each Plan Item it is possible to record start and end dates and outcomes. This allows the service provider to track the learner’s progress and the overall effectiveness of the learner plan.
Referral (formal) – Referred out to an organization on the drop down menu in EOIS-CaMS and evidenced by a form, letter, email, or hand written note on file.
Referral (informal) – The term ‘referral’ carries its common meaning. It is included here to clarify ‘informal’ referral from ‘formal ’referral’. Informal referrals are recorded in the Information and Referral section of EOIS-CaMS.
Service Delivery Site – Service Delivery Sites (SDS) are the physical location where LBS service delivery organizations carry out activities related to the delivery of the LBS Program.
Participant Guide G l o s s a r y | 72
Service Plan – A plan developed in collaboration with the learner which reflects the choices and preferences of the learner and service provider for service arrangements being developed. A service plan is broken down into goals, sub-goals, and plan activities. The LBS Service Plan Terminology and Client Pathway Desk Aid can support a better understanding of these terms in relation to the OALCF.
Service Provider – It is a third-party organization under contract with MTCU that delivers the LBS Program. A service provider might operate more than one SDS under the program.
Sub-Goals – A part of the Service Plan that specifies how goals are to be reached. The LBS Service Plan Terminology and Client Pathway Desk Aid can support a better understanding of this term and how it relates to the OALCF.
Support Organizations – The LBS Program has 28 literacy support organizations that assist the front-line LBS service providers. These support organizations include: four learner stream organizations (anglophone, francophone, deaf, aboriginal); two provincial (aboriginal and francophone) organizations providing support services that are primarily the publishing of culture and language-specific resources; four service-provider sector organizations (college, school board, two community based); 16 regional networks to support planning, activities under the Service Delivery Network Development Fund (SDNDF), and delivery network capacity; two provincial organizations that provide technology-specific support for programs in all streams, including e-Channel.
Task (as opposed to milestone task, and culminating task) – A purposeful activity that bundles skills, knowledge, and behaviors in unique and authentic ways tasks require learners to perform action or activity, resulting in something concrete or tangible, such as a completed application form, a shopping list, or a research report. In their successful demonstration, tasks show practitioners and learners how learning can be transferred to activities in work, family, and community context.
Task Groups – Task groups organize the content within each competency. They link the broad competencies to program development and make it easier to determine what a learner can and cannot do. When taken together, task groups describe the full range of content within each competency.
Training Supports – Training supports for learners are “flow-through” funds for individuals to remove financial barriers to participation in the LBS Program. Training supports can include money for transportation and arrangements for child care.

Participant Guide G l o s s a r y | 73
Waterline – The demarcation point between ‘above the waterline’ which are the products and services service providers provide and deliver to their primary customers to respond to their needs and expectations, and ‘below the waterline’ which is the business foundation or organizational capacity of the service provider. The term is derived from the analogy of an iceberg floating in the water 90% submerged.
Participant Guide A p p e n d i c e s | 74
Appendices

Participant Guide A p p e n d i c e s | 75
YTD all Participants
YTD all Participants
YTD all Participants
Appendix 1 - Mock-Up 1 - Report 64 Detailed Service Quality Report
YTD April 1, 2014 to December 31, 2014
LBS CM#
SERVICE QUALITY CORE MEASURES LBS Prov.
Target
Perf Com Ann.
Target
YTD All Participants
% YTD of
Target
Num Den Actual
Customer Service
1 Customer Satisfaction 90% 90% 2 11 18% 20%
Learner 2 11 18%
Learner Response rate 11 45 24%
2 Service Coordination 50% 50% 0 45 0% 0%
1. Referred in 0%
2. Referred out - registered in Education 0%
3. Referred out - registered in Training 0%
4. Referred out - registered in ES 0%
5. Referred out - community learning 0%
Effectiveness
3 Suitability 30% 30% 57 45 13% 42%
1. <Grade 12 45 100%
2. OW/ODSP recipient 0%
3. No source of income 0%
4. Crown ward 0%
5. More than 6 years out of education 0%
6. More than 6 years without training 0%
7. Age over 45 and under 64 0%
8. History of interrupted education 0%
9. Disabled 1 2%
10. Aboriginal 4 9%
11. Deaf 0%
12. Francophone 7 16%
4 Progress 60% 60% 64 64 100% 167%
1. % of Learners who complete at least one Milestone
64 100%
Efficiency
5 Learners Served 90% 75 62 110%
New 10
Carry over 52
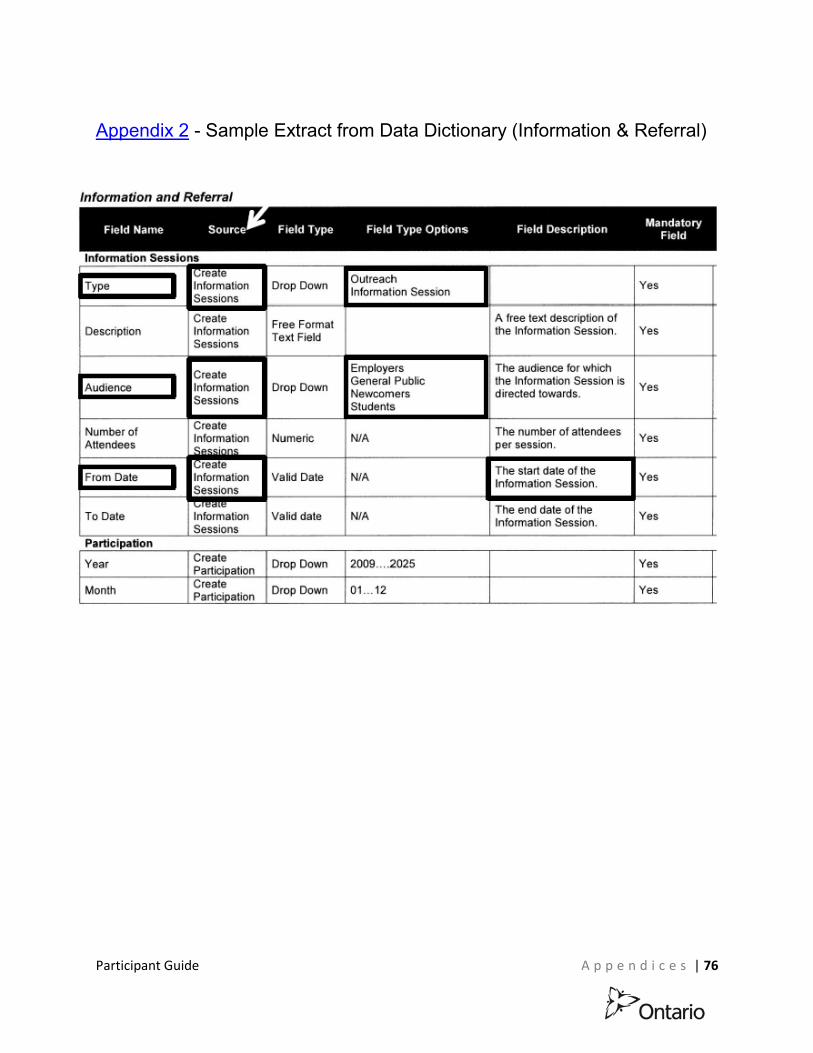
Participant Guide A p p e n d i c e s | 76
Appendix 2 - Sample Extract from Data Dictionary (Information & Referral)
Information and Referral
Field Name Source Field Type Field Type Options Field Description Ma~~~~ory
lnfonnation Sessions
Type • ... rea1e Information Sessions
Drop Down Outreach Information Session
Yes
Description Create Information Sessions
Free Format Text Field
A free text description oi the Information Session Yes
Audience Create nformation Sessions
Drop Down
Employers General Public Newcomers Students
The audience for which the Information Session is directed towards. Yes
Number of Attendees
Create nformation Numeric N/A The number of attendees
per session. Yes
From Date ...,reate Information Sessions
Valid Date N/A The start date of the Information Session. Yes
To Date I-n ·fo--·-rmation Sessions
Valid date N/A The end date of the Information Session. Yes
Participation
Year Create Particioation Drop Down 2009 ... . 2025 Yes
Month Create Particioation Drop Down 01 ... 12 Ye::;
I
I
I
. .
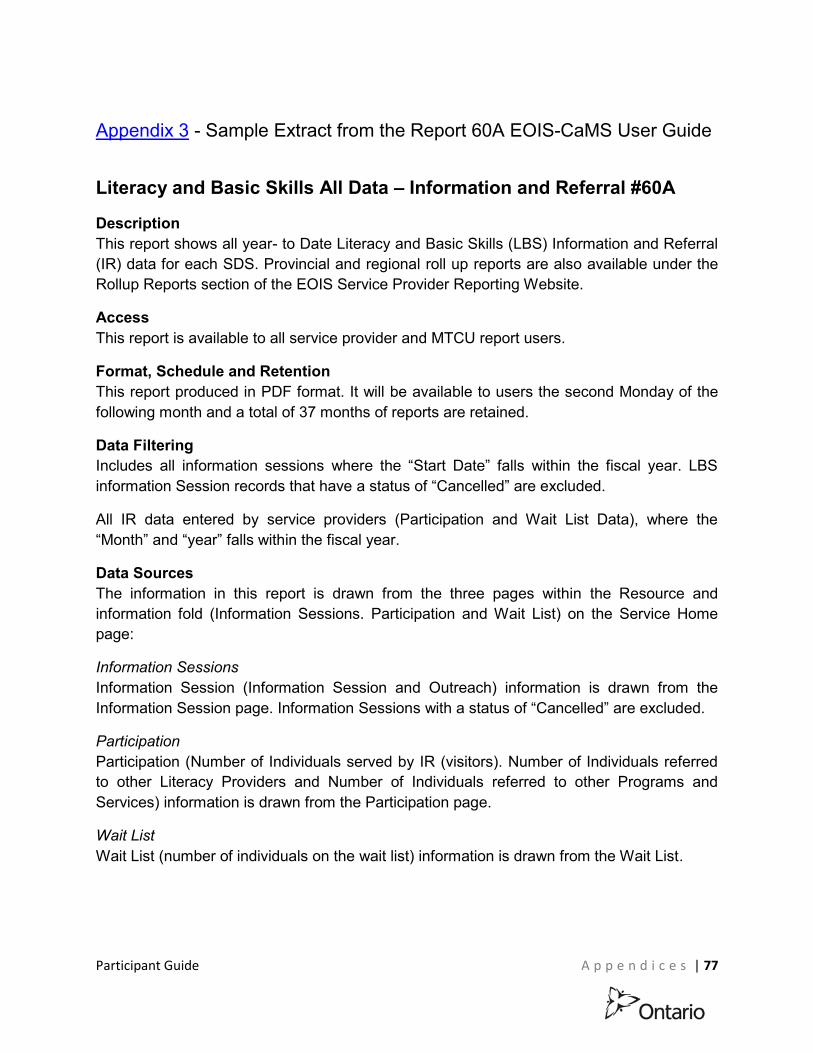
Participant Guide A p p e n d i c e s | 77
Appendix 3 - Sample Extract from the Report 60A EOIS-CaMS User Guide
Literacy and Basic Skills All Data – Information and Referral #60A
Description This report shows all year- to Date Literacy and Basic Skills (LBS) Information and Referral (IR) data for each SDS. Provincial and regional roll up reports are also available under the Rollup Reports section of the EOIS Service Provider Reporting Website.
Access This report is available to all service provider and MTCU report users.
Format, Schedule and Retention This report produced in PDF format. It will be available to users the second Monday of the following month and a total of 37 months of reports are retained.
Data Filtering Includes all information sessions where the “Start Date” falls within the fiscal year. LBS information Session records that have a status of “Cancelled” are excluded.
All IR data entered by service providers (Participation and Wait List Data), where the “Month” and “year” falls within the fiscal year.
Data Sources The information in this report is drawn from the three pages within the Resource and information fold (Information Sessions. Participation and Wait List) on the Service Home page:
Information Sessions Information Session (Information Session and Outreach) information is drawn from the Information Session page. Information Sessions with a status of “Cancelled” are excluded.
Participation Participation (Number of Individuals served by IR (visitors). Number of Individuals referred to other Literacy Providers and Number of Individuals referred to other Programs and Services) information is drawn from the Participation page.
Wait List Wait List (number of individuals on the wait list) information is drawn from the Wait List.

Participant Guide A p p e n d i c e s | 78
Appendix 4 - Sample Report 19A Follow-Up Cases (Client Level)
Generated on: 15.Jun-2014
Medium Sensitivity
Service Provider Followup Cases (Service Plans) - #19A OOOOA Test YTD From 01-Apr-2014 to15.Jun-2014
Run time parameters: SDS: OOOOA Report run frequency: Weekly This report's data is current to date: 14.Jun-2014 12:04:46 AM Information presented in th is report is for Ministry/ Service Providers use on ly and is not intended for distribution - Medium Sensitivity Case ID Participant
First Name Participant Last Name
Participant Phone
Participant Email
Program Close Date Followup Type
Estimated Review Date
Scheduled Review
Reviewer Case Owner
1111111 Roger Test (705) 555-5527 Literacy and Basic Skills 10/04/2013 3 MONTH 10/07/2013 Fake User 1111111 Roger Test (705) 555-5527 Literacy and Basic Skills 10/04/2013 6 MONTH 10/10/2013 Fake User 1111111 Roger Test (705) 555-5527 Literacy and Basic Skills 10/04/2013 12 MONTH 10/04/2014 Fake User Fake User Fake User

Participant Guide A p p e n d i c e s | 79
Appendix 5 - Sample Report 20 Inactive Cases (Client Level)
Service Provider Inactive Cases (Client level) #20
Service Provider : Test Provider
Service Delivery Site Name : OOOOA Test Service Provider
Case ID Program
Service P lan Status Participant Name
Prog ram Start
last planned Activity End
Inactive Days
Case
1234567 Employment Service Active Smith, Bob 18/03/2013 28/03/2013 100 Fake User
1234657 Employment Service Active Paul, David 22/03/2013 24/04/2013 100 Fake User
1845687 Employment Service Active Black, John 08/04/2013 30/04/2013 100 Fake User
1234679 Employment Service Active Purple, Jean 10/04/2013 30/04/2013 100 Fake User
3216546 Employment Service Active Green, Alena 26/04/2013 27/05/2013 86 Fake User
7744889 Employment Service Active Yellow, Helen 26/04/2013 23/05/2013 86 Fake User
9988797 Employment Service Active Pink, Joseph 07/05/2013 19/07/2013 75 Fake User
1567987 Employment Service Active White, Robert 08/05/2013 31/05/2013 74 Fake User
Fake User 8
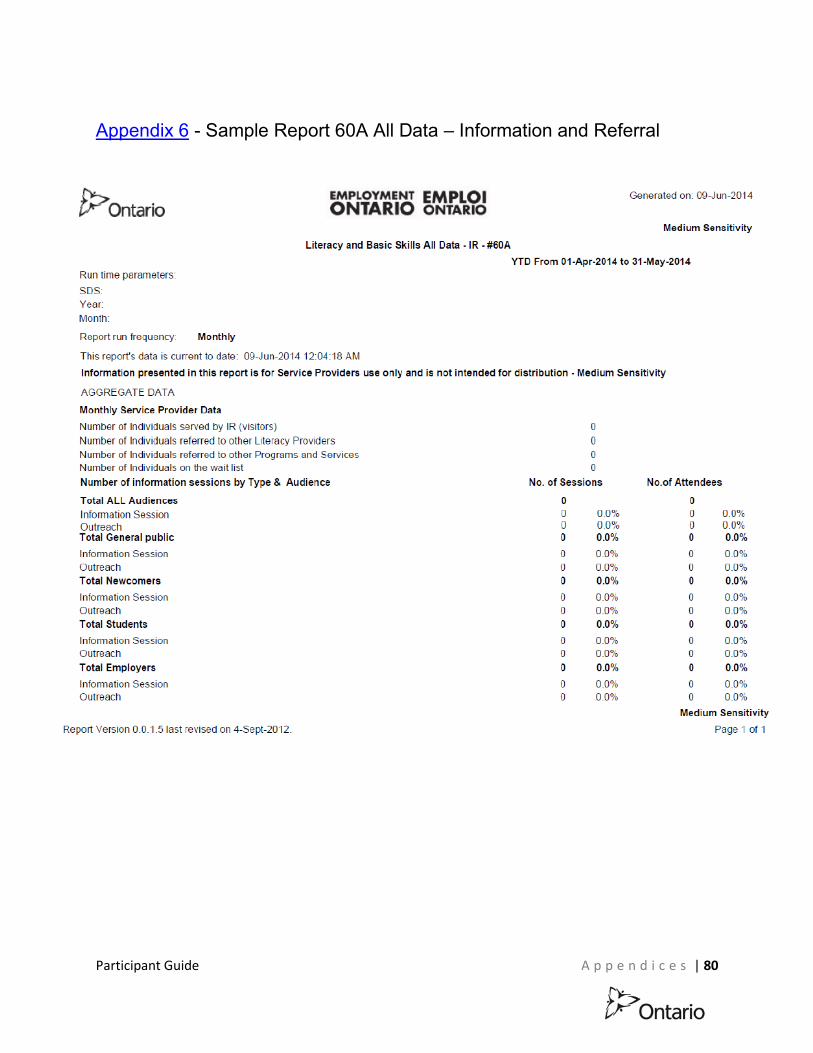
Participant Guide A p p e n d i c e s | 80
Appendix 6 - Sample Report 60A All Data – Information and Referral
Generated on: 09-Jun-2014
Medium Sensitivity
Literacy and Basic Skills All Data • IR • #GOA YTD From 01-Apr-2014 to 31 -May-2014
Run time parameters: sos Year: Montn
Report run frequency: Monthly
This report's data is current to date: 09.Jun-2014 12:04:18 AM
Information presented in t his report is for Service Providers use only and is not intended for distribution • Medium Sensit ivity
AGGREGATE DATA
Monthly Service Provider Data
Number of Individuals serveel by IR (visitors) 0 Number of Individuals referred to other Literacy Providers 0 Number of Individuals referred to other Programs and Services 0 Number of Individuals on the wait list 0 Number of information sessions by Type & Audience No. of Sessions No.of Attendees
Total ALL Audiences 0 0 Information Session 0 0.0% 0 0.0% Outreach 0 0.0% 0 0.0% Total General public 0 0.0% 0 0.0%
Information Session 0 0.0% 0 0.0% Outreach 0 0.0% 0 0.0% Total Newcomers 0 0.0% 0 0.0%
lnfom1ation Session 0 0.0% 0 0.0% Outreach 0 0.0% 0 0.0% Total Students 0 0.0% 0 0.0%
lnfom1ation Session 0 0.0% 0 0.0% Outreach 0 0.0% 0 0.0% Total Employers 0 0.0% 0 0.0%
lnfom1ation Session 0 0.0% 0 0.0% Outreach 0 0.0% 0 0.0%
Repon Version 0.0. 1.5 last revised on 4-Sept-2012.
Medium Sensitivity
Page ·1of 1
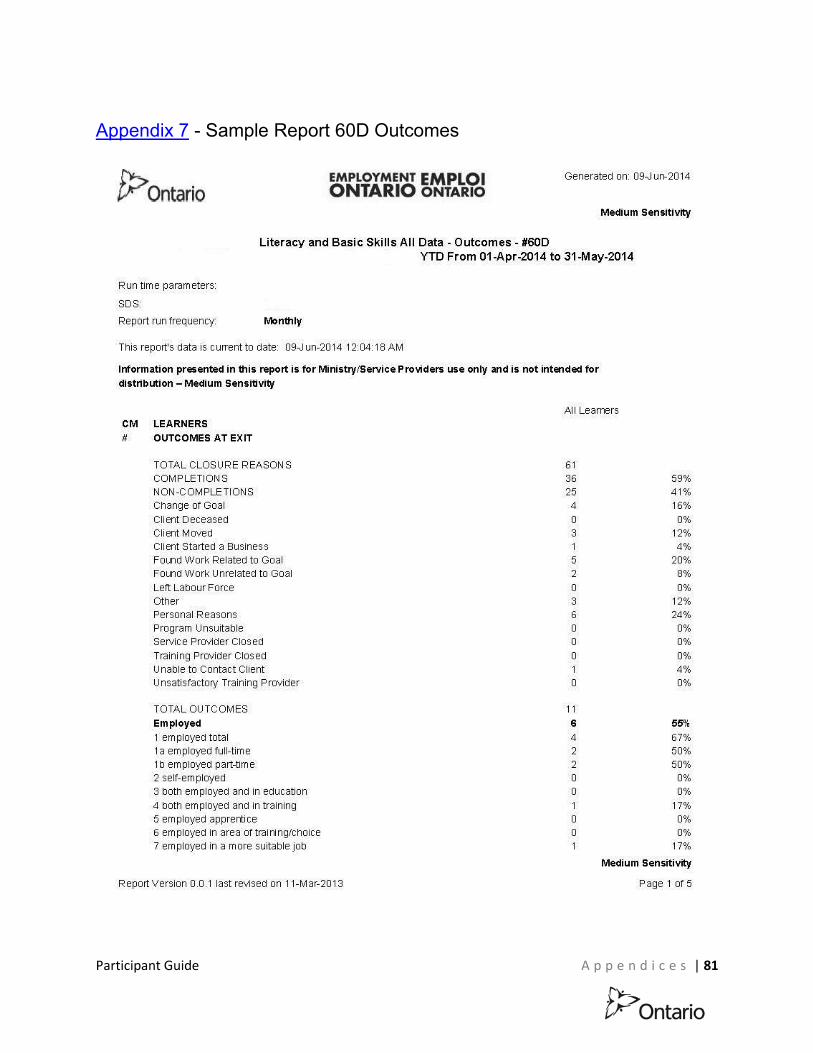
Participant Guide A p p e n d i c e s | 81
Appendix 7 - Sample Report 60D Outcomes
Generated on: 09'1un-2014
Medium Sensitivity
Literacy and Basic Skills All Data - Outcomes - #600 YTD From 01-Apr-2014 to 31-May-2014
Run time parameters:
sos Report run frequency: Monthly
This report's data is currentto date: 09'1un-2014 12:04:18 AM
Informati on presented in this report is for Ministry/Service Providers use only and is not intended for distribution - Medium Sensitivity
CM II
LEARNERS OUTCOMES AT EXIT
All Learners
TOTAL CLOSURE REASONS 61 COMPLETIONS 36 59% NON-COMPLE TIONS 25 41% Change of Goal 4 16% Client Deceased 0 0% Client Moved 3 12% Client Started a Business 1 4% Fom d Work Related to Goal 5 20% FolJld Work Unrelated to Goal 2 8% Left Labour Force 0 0% other 3 12% Personal Rea sons 6 24% Program Unsuitable 0 0% SelVic e Provider Closed 0 0% Training Provider Closed 0 0% Unable to Contact Client 1 4% Unsatisfactory Training Provider 0 0%
TOTAL OUTCOMES 11 Employed 6 55% 1 em ployed total 4 67% 1a employed full-time 2 50% 1 b em ployed part-time 2 50% 2 self-employed 0 0% 3 both em ployed and in education 0 0% 4 both em ployed and in training 1 17% 5 employed apprerti ce 0 0% 6 em ployed in area of training/choice 0 0% 7 em ployed in a more suitable job 1 17%
Report Version 0.0.1 last revised on 11-Mar-2013
Medium Sensitivity
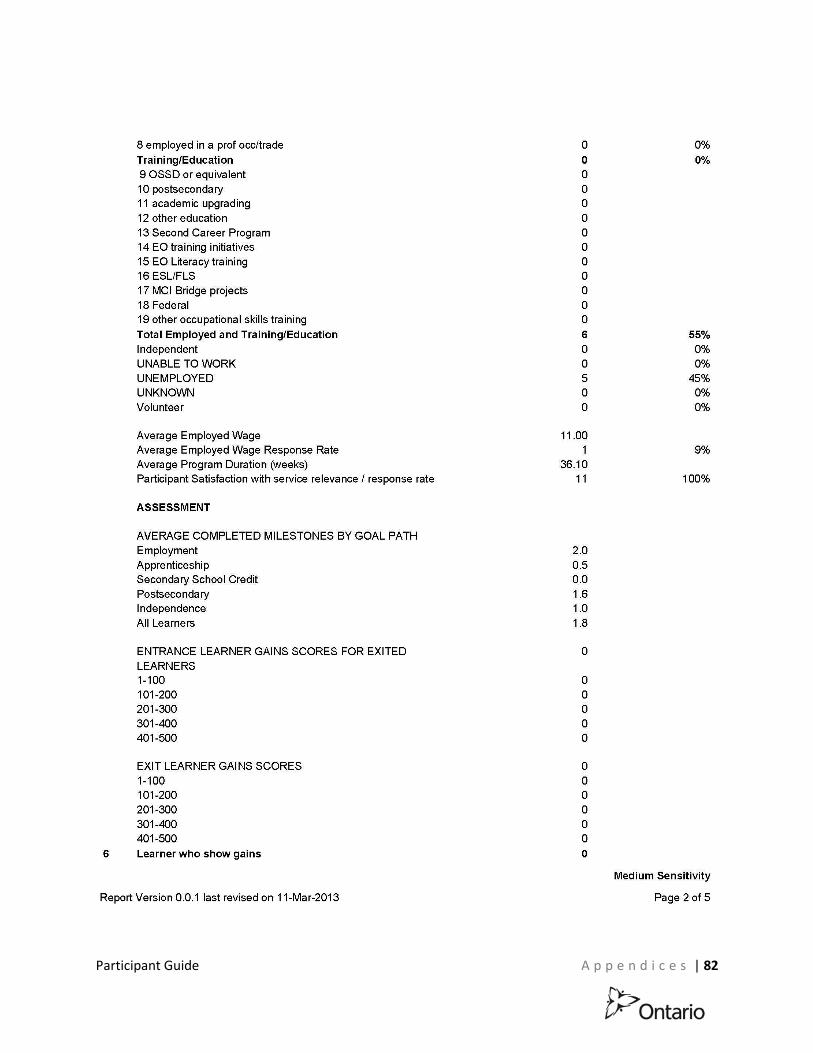
Participant Guide A p p e n d i c e s | 82
8 employed in a prof occ/trade 0 0% Training/Education 0 0% 9 OSSO or equivalent 0 10 postsecondary 0 11 academic upgrading 0 12 other education 0 13 Second Career Program 0 14 EO training initiatives 0 15 EO Literacy training 0 16 ESL/FLS 0 17 MCI Bridge projects 0 18 Federal 0 19 other occupational skills training 0 Total Employed and Training/Education 6 55% Independent 0 0% UNABLE TO WORK 0 0% UNEMPLOYED 5 45% UNKNOWN 0 0% Volunteer 0 0%
Average Employed Wage 11.00 Average Employed Wage Response Rate 1 9% Average Program Duration (weeks) 36.10 Participant Satisfaction with service relevance I response rate 11 100%
ASSESSMENT
AVERAGE COMPLETED MILESTONES BY GOAL PATH Employment 2.0 Apprenticeship 0.5 Secondary School Credit 0.0 Postsecondary 1.6 Independence 1.0 All Learners 1.8
ENTRANCE LEARNER GAINS SCORES FOR EXITED LEARNERS
0
1-100 0 101-200 0 201-300 0 301-400 0 401-500 0
EXIT LEARNER GAINS SCORES 0 1-100 0 101-200 0 201-300 0 301-400 0 401-500 0
6 Learner who show gains 0
Medium Sensitivity
Report Version 0.0.1 last revised on 11-Mar-2013
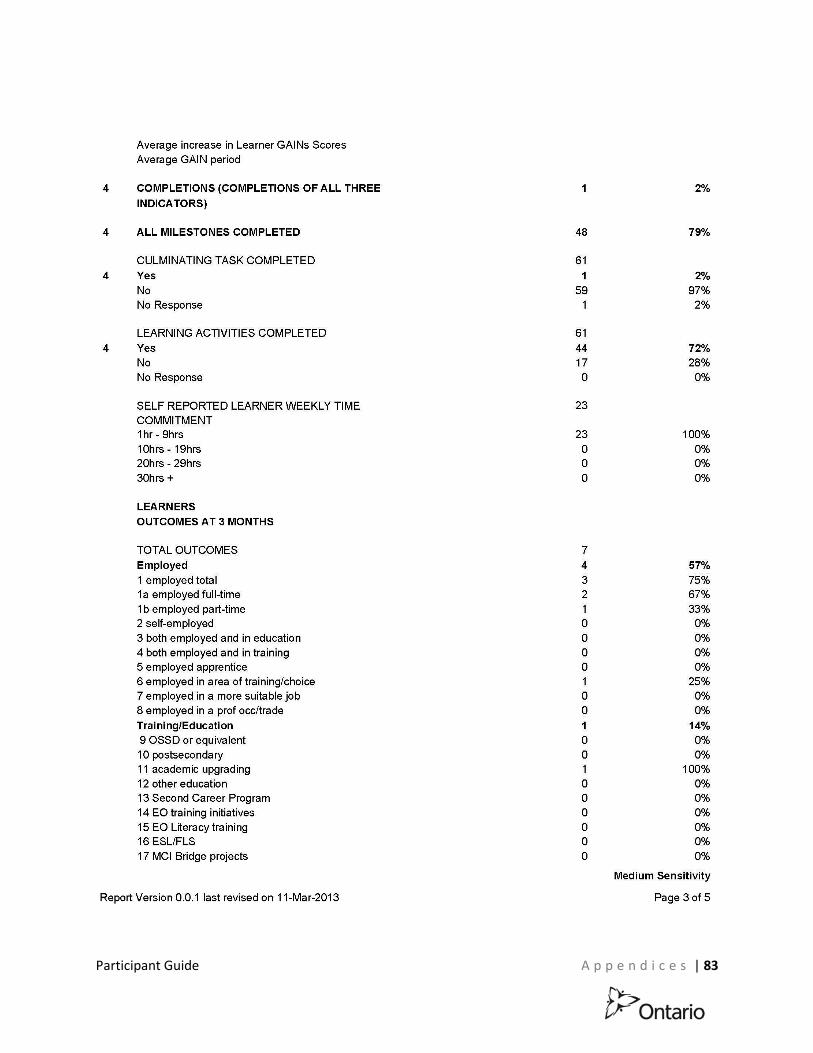
Participant Guide A p p e n d i c e s | 83
Average increase in Learner GAINs Scores Average GAIN period
4 COMPLETIONS (COMPLETIONS OF ALL THREE INDICATORS)
1 2%
4 ALL MILESTONES COMPLETED 48 79%
CULMINATING TASK COMPLETED 61 4 Yes 1 2%
No 59 97% No Response 1 2%
LEARNING ACTIVITIES COMPLETED 61 4 Yes 44 72%
No 17 28% No Response 0 0%
SELF REPORTED LEARNER WEEKLY TIME COMMITMENT
23
1 hr - 9hrs 23 100% 1 Oh rs - 19hrs 0 0% 20hrs - 29hrs 0 0% 30hrs + 0 0%
LEARNERS OUTCOMES AT 3 MONTHS
TOTAL OUTCOMES 7 Employed 4 57% 1 employed total 3 75% 1 a employed full-time 2 67% 1 b employed part-time 1 33% 2 self-employed 0 0% 3 both employed and in education 0 0% 4 both employed and in training 0 0% 5 employed apprentice 0 0% 6 employed in area of training/choice 1 25% 7 employed in a more suitable job 0 0% 8 employed in a prof occ/trade 0 0% Training/Education 1 14% 9 OSSO or equivalent 0 0% 10 postsecondary 0 0% 11 academic upgrading 1 100% 12 other education 0 0% 13 Second Career Program 0 0% 14 EO training initiatives 0 0% 15 EO Literacy training 0 0% 16 ESL/FLS 0 0% 17 MCI Bridge projects 0 0%
Medium Sensitivity
Report Version 0.0.1 last revised on 11-Mar-2013
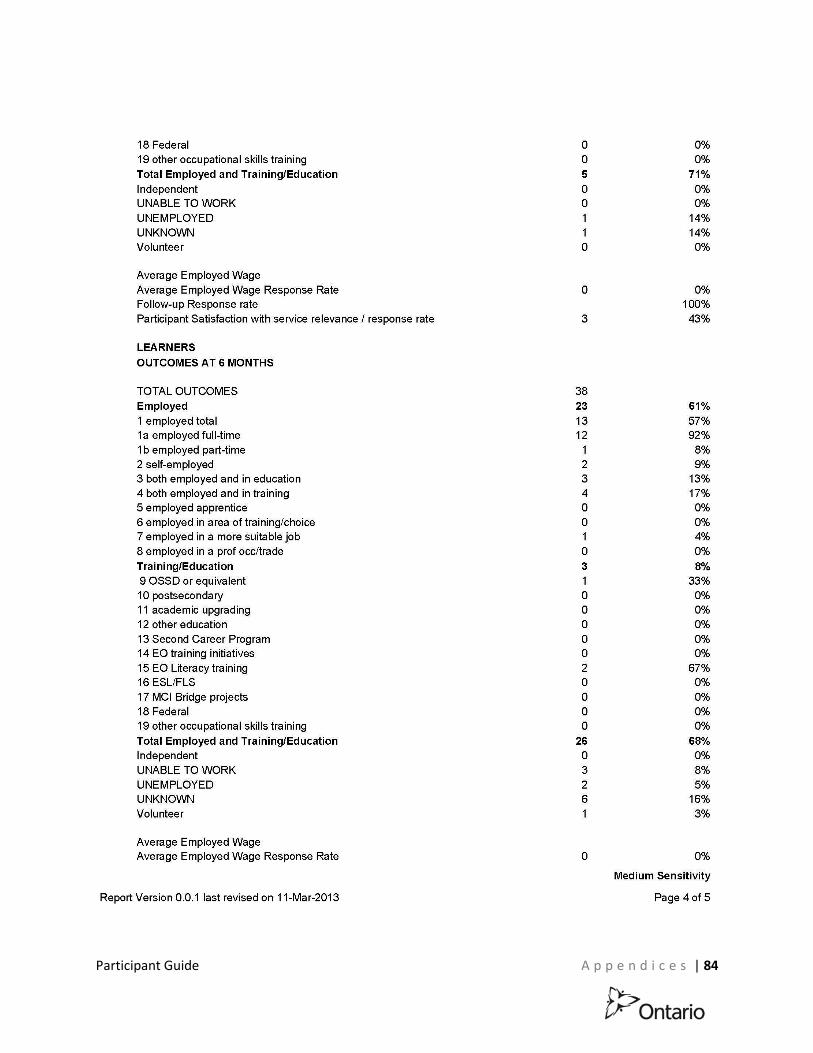
Participant Guide A p p e n d i c e s | 84
18 Federal 0 0% 19 other occupational skills training 0 0% Total Employed and Training/Education 5 71% Independent 0 0% UNABLE TO WORK 0 0% UNEMPLOYED 1 14% UNKNOWN 1 14% Volunteer 0 0%
Average Employed Wage Average Employed Wage Response Rate 0 0% Follow-up Response rate 100% Participant Satisfaction with service relevance I response rate 3 43%
LEARNERS OUTCOMES AT 6 MONTHS
TOTAL OUTCOMES 38 Employed 23 61% 1 employed total 13 57% 1 a employed full-time 12 92% 1 b employed part-time 1 8% 2 self-employed 2 9% 3 both employed and in education 3 13% 4 both employed and in training 4 17% 5 employed apprentice 0 0% 6 employed in area of training/choice 0 0% 7 employed in a more suitable job 1 4% 8 employed in a prof occ/trade 0 0% Training/Education 3 8% 9 OSSO or equivalent 1 33% 10 postsecondary 0 0% 11 academic upgrading 0 0% 12 other education 0 0% 13 Second Career Program 0 0% 14 EO training initiatives 0 0% 15 EO Literacy training 2 67% 16 ESL/FLS 0 0% 17 MCI Bridge projects 0 0% 18 Federal 0 0% 19 other occupational skills training 0 0% Total Employed and Training/Education 26 68% Independent 0 0% UNABLE TO WORK 3 8% UNEMPLOYED 2 5% UNKNOWN 6 16% Volunteer 1 3%
Average Employed Wage Average Employed Wage Response Rate 0 0%
Medium Sensitivity
Report Version 0.0.1 last revised on 11-Mar-2013
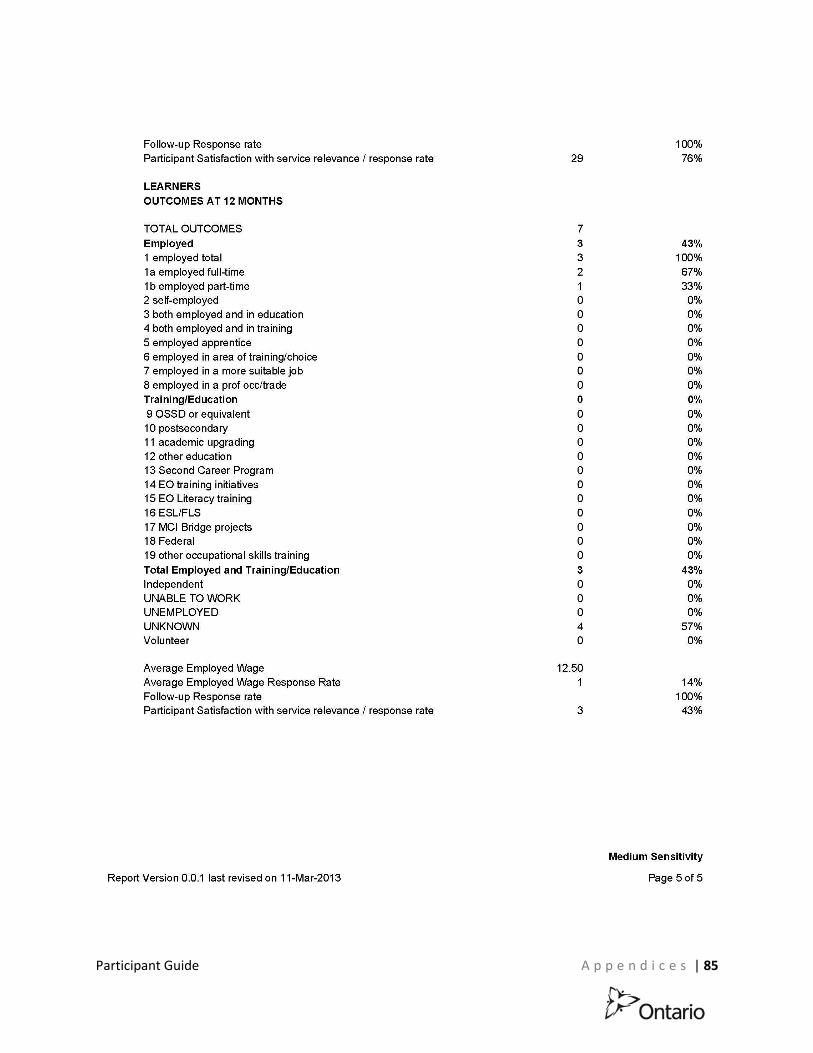
Participant Guide A p p e n d i c e s | 85
Follow-up Response rate 100% Participant Satisfaction with service relevance I response rate 29 76%
LEARNERS OUTCOMES AT 12 MONTHS
TOTAL OUTCOMES 7 Employed 3 43% 1 employed total 3 100% 1 a employed full-time 2 67% 1 b employed part-time 1 33% 2 self-employed 0 0% 3 both employed and in education 0 0% 4 both employed and in training 0 0% 5 employed apprentice 0 0% 6 employed in area of training/choice 0 0% 7 employed in a more suitable job 0 0% 8 employed in a prof occ/trade 0 0% Training/Education 0 0% 9 OSSO or equivalent 0 0% 1 O postsecondary 0 0% 11 academic upgrading 0 0% 12 other education 0 0% 13 Second Career Program 0 0% 14 EO training initiatives 0 0% 15 EO Literacy training 0 0% 16 ESUFLS 0 0% 17 MCI Bridge projects 0 0% 18 Federal 0 0% 19 other occupational skills training 0 0% Total Employed and TraininglEducation 3 43% Independent 0 0% UNABLE TO WORK 0 0% UNEMPLOYED 0 0% UNKNOWN 4 57% Volunteer 0 0%
Average Employed Wage 12.50 Average Employed Wage Response Rate 1 14% Follow-up Response rate 100% Participant Satisfaction with service relevance I response rate 3 43%
Medium Sensitivity
Report Version 0.0.1 last revised on 11-Mar-2013
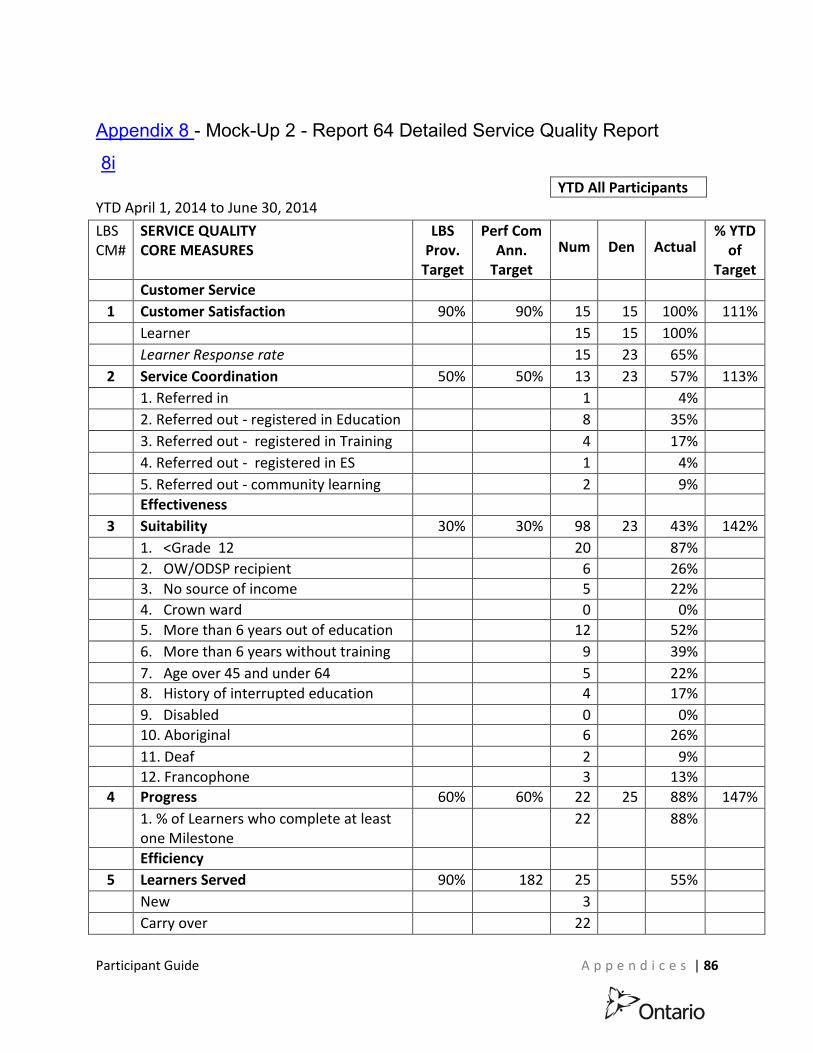
Participant Guide A p p e n d i c e s | 86
YTD All Participants YTD All
Participants YTD All Participants
Appendix 8 - Mock-Up 2 - Report 64 Detailed Service Quality Report
8i
YTD April 1, 2014 to June 30, 2014
LBS CM#
SERVICE QUALITY CORE MEASURES
LBS Prov.
Target
Perf Com Ann.
Target
YTD All Participants
% YTD of
Target
Num Den Actual
Customer Service
1 Customer Satisfaction 90% 90% 15 15 100% 111%
Learner 15 15 100%
Learner Response rate 15 23 65%
2 Service Coordination 50% 50% 13 23 57% 113%
1. Referred in 1 4%
2. Referred out - registered in Education 8 35%
3. Referred out - registered in Training 4 17%
4. Referred out - registered in ES 1 4%
5. Referred out - community learning 2 9%
Effectiveness
3 Suitability 30% 30% 98 23 43% 142%
1. <Grade 12 20 87%
2. OW/ODSP recipient 6 26%
3. No source of income 5 22%
4. Crown ward 0 0%
5. More than 6 years out of education 12 52%
6. More than 6 years without training 9 39%
7. Age over 45 and under 64 5 22%
8. History of interrupted education 4 17%
9. Disabled 0 0%
10. Aboriginal 6 26%
11. Deaf 2 9%
12. Francophone 3 13%
4 Progress 60% 60% 22 25 88% 147%
1. % of Learners who complete at least one Milestone
22 88%
Efficiency
5 Learners Served 90% 182 25 55%
New 3
Carry over 22
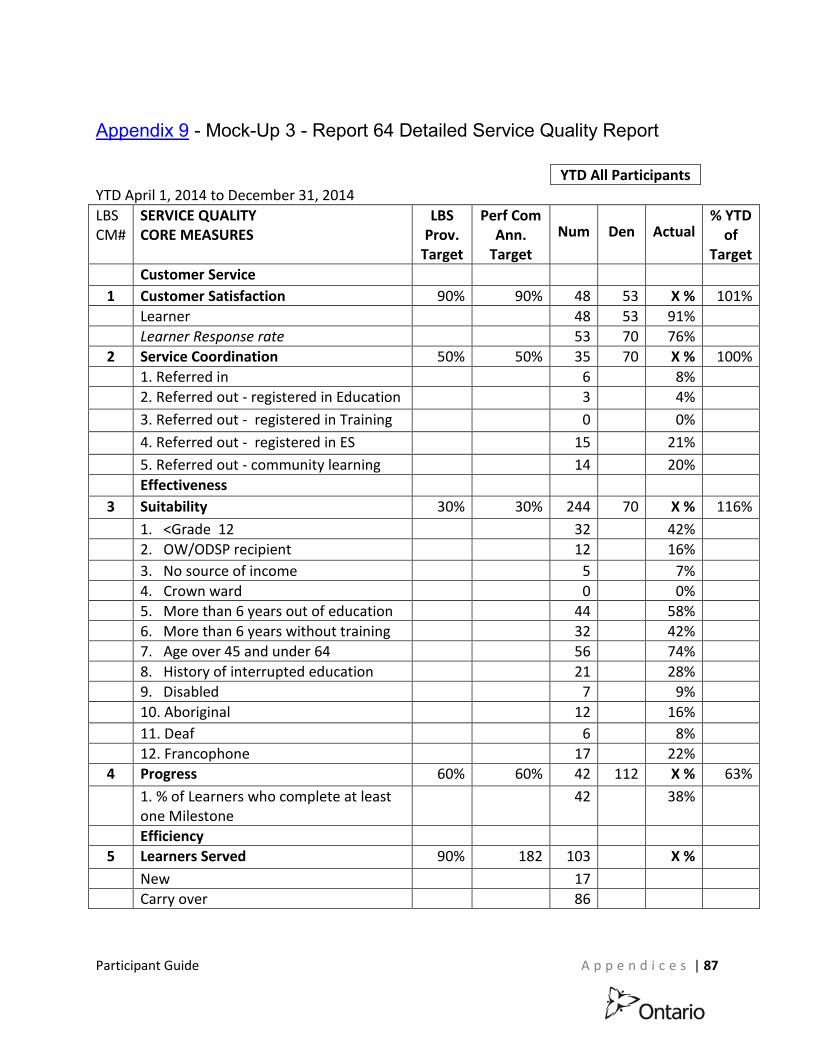
Participant Guide A p p e n d i c e s | 87
YTD All Participants
YTD All Participants
YTD All Participants
Appendix 9 - Mock-Up 3 - Report 64 Detailed Service Quality Report
YTD April 1, 2014 to December 31, 2014
LBS CM#
SERVICE QUALITY CORE MEASURES
LBS Prov.
Target
Perf Com Ann.
Target
YTD All Participants
% YTD of
Target
Num Den Actual
Customer Service
1 Customer Satisfaction 90% 90% 48 53 X % 101%
Learner 48 53 91%
Learner Response rate 53 70 76%
2 Service Coordination 50% 50% 35 70 X % 100%
1. Referred in 6 8%
2. Referred out - registered in Education 3 4%
3. Referred out - registered in Training 0 0%
4. Referred out - registered in ES 15 21%
5. Referred out - community learning 14 20%
Effectiveness
3 Suitability 30% 30% 244 70 X % 116%
1. <Grade 12 32 42%
2. OW/ODSP recipient 12 16%
3. No source of income 5 7%
4. Crown ward 0 0%
5. More than 6 years out of education 44 58%
6. More than 6 years without training 32 42%
7. Age over 45 and under 64 56 74%
8. History of interrupted education 21 28%
9. Disabled 7 9%
10. Aboriginal 12 16%
11. Deaf 6 8%
12. Francophone 17 22%
4 Progress 60% 60% 42 112 X % 63%
1. % of Learners who complete at least one Milestone
42 38%
Efficiency
5 Learners Served 90% 182 103 X %
New 17
Carry over 86

Participant Guide A p p e n d i c e s | 88
Page 1 of 2
Appendix 10 - Report 64 DSQR: ‘YTD All Participants - Actual %’ Calculation
Calculation 1:
The ‘YTD All Participants Actual’ for most core measures is calculated as follows (the exceptions are ‘3. Suitability’ and ‘5. Learners Served’):
YTD All Participants Num / YTD All Participants Den
Example (excluding ‘3. Suitability’ and ‘5. Learners Served’):
YTD All Participants Num = 18 / YTD All Participants Den = 21
18 / 21 = 86%
YTD All Participants Actual = 86%
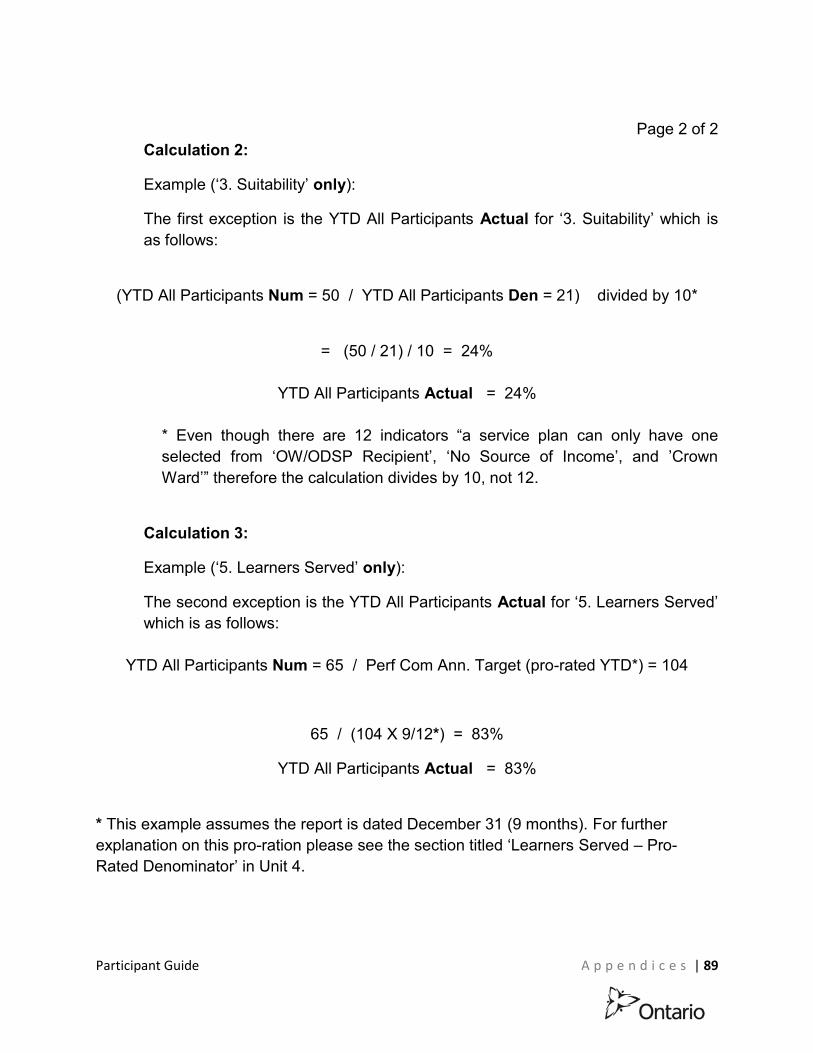
Participant Guide A p p e n d i c e s | 89
Page 2 of 2
* Even though there are 12 indicators “a service plan can only have one selected from ‘OW/ODSP Recipient’, ‘No Source of Income’, and ’Crown Ward’” therefore the calculation divides by 10, not 12.
* This example assumes the report is dated December 31 (9 months). For further explanation on this pro-ration please see the section titled ‘Learners Served – Pro-Rated Denominator’ in Unit 4.
Calculation 2:
Example (‘3. Suitability’ only):
The first exception is the YTD All Participants Actual for ‘3. Suitability’ which is as follows:
(YTD All Participants Num = 50 / YTD All Participants Den = 21) divided by 10*
= (50 / 21) / 10 = 24%
YTD All Participants Actual = 24%
Calculation 3:
Example (‘5. Learners Served’ only):
The second exception is the YTD All Participants Actual for ‘5. Learners Served’ which is as follows:
YTD All Participants Num = 65 / Perf Com Ann. Target (pro-rated YTD*) = 104
65 / (104 X 9/12*) = 83%
YTD All Participants Actual = 83%
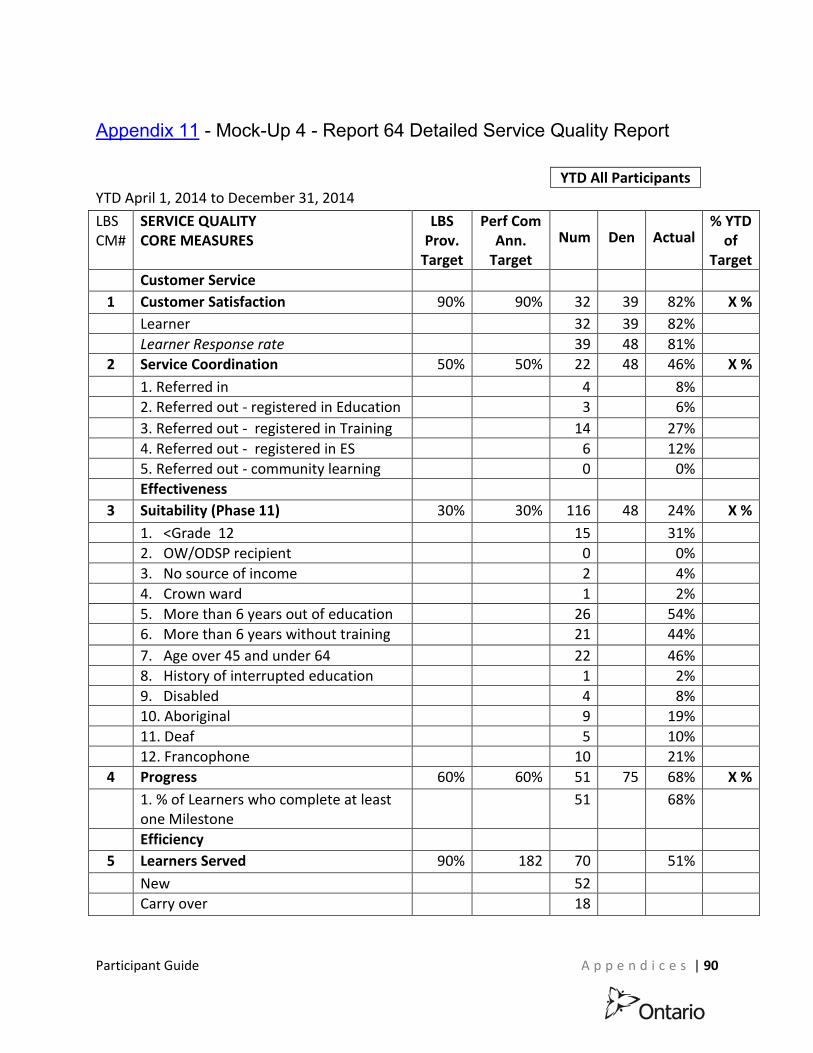
Participant Guide A p p e n d i c e s | 90
YTD All Participants
YTD All Participants
YTD All Participants
Appendix 11 - Mock-Up 4 - Report 64 Detailed Service Quality Report
YTD April 1, 2014 to December 31, 2014
LBS CM#
SERVICE QUALITY CORE MEASURES
LBS Prov.
Target
Perf Com Ann.
Target
YTD All Participants
% YTD of
Target
Num Den Actual
Customer Service
1 Customer Satisfaction 90% 90% 32 39 82% X %
Learner 32 39 82%
Learner Response rate 39 48 81%
2 Service Coordination 50% 50% 22 48 46% X %
1. Referred in 4 8%
2. Referred out - registered in Education 3 6%
3. Referred out - registered in Training 14 27%
4. Referred out - registered in ES 6 12%
5. Referred out - community learning 0 0%
Effectiveness
3 Suitability (Phase 11) 30% 30% 116 48 24% X %
1. <Grade 12 15 31%
2. OW/ODSP recipient 0 0%
3. No source of income 2 4%
4. Crown ward 1 2%
5. More than 6 years out of education 26 54%
6. More than 6 years without training 21 44%
7. Age over 45 and under 64 22 46%
8. History of interrupted education 1 2%
9. Disabled 4 8%
10. Aboriginal 9 19%
11. Deaf 5 10%
12. Francophone 10 21%
4 Progress 60% 60% 51 75 68% X %
1. % of Learners who complete at least one Milestone
51 68%
Efficiency
5 Learners Served 90% 182 70 51%
New 52
Carry over 18
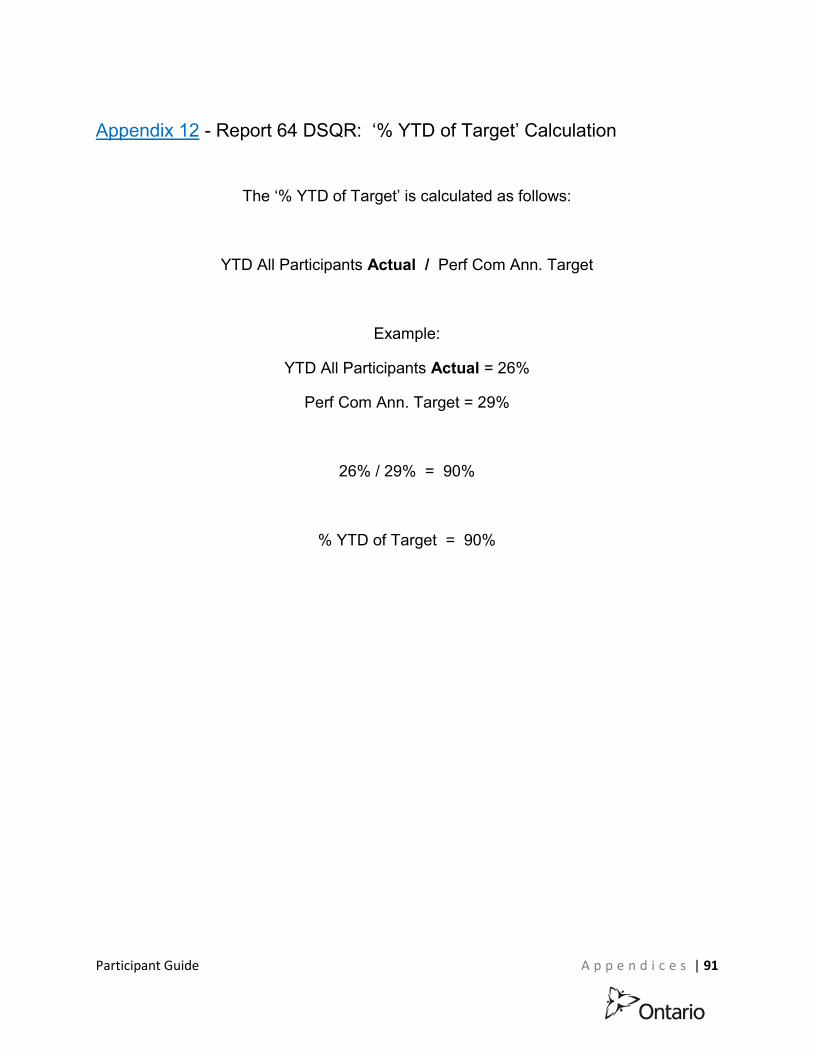
Participant Guide A p p e n d i c e s | 91
Appendix 12 - Report 64 DSQR: ‘% YTD of Target’ Calculation
The ‘% YTD of Target’ is calculated as follows:
YTD All Participants Actual / Perf Com Ann. Target
Example:
YTD All Participants Actual = 26%
Perf Com Ann. Target = 29%
26% / 29% = 90%
% YTD of Target = 90%
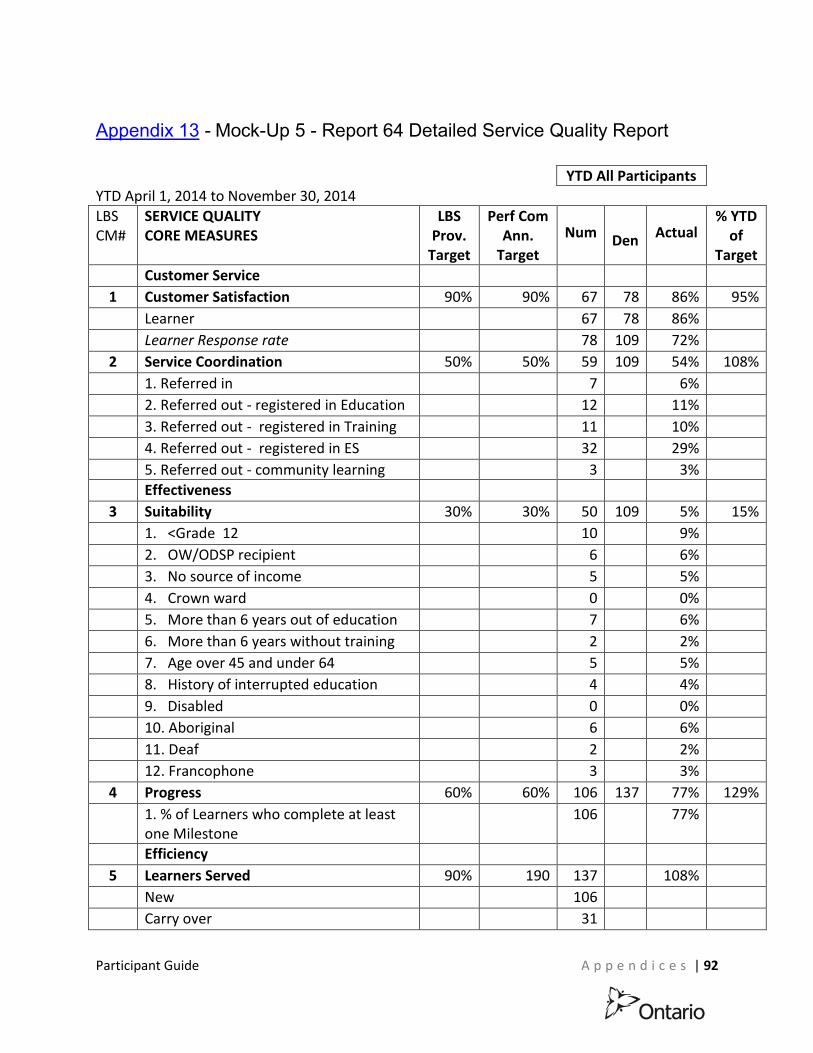
Participant Guide A p p e n d i c e s | 92
YTD All Participants
YTD All Participa
nts YTD All
Participants
Appendix 13 - Mock-Up 5 - Report 64 Detailed Service Quality Report
YTD April 1, 2014 to November 30, 2014
LBS CM#
SERVICE QUALITY CORE MEASURES
LBS Prov.
Target
Perf Com Ann.
Target
YTD All Participants
% YTD of
Target
Num Den
Actual
Customer Service
1 Customer Satisfaction 90% 90% 67 78 86% 95%
Learner 67 78 86%
Learner Response rate 78 109 72%
2 Service Coordination 50% 50% 59 109 54% 108%
1. Referred in 7 6%
2. Referred out - registered in Education 12 11%
3. Referred out - registered in Training 11 10%
4. Referred out - registered in ES 32 29%
5. Referred out - community learning 3 3%
Effectiveness
3 Suitability 30% 30% 50 109 5% 15%
1. <Grade 12 10 9%
2. OW/ODSP recipient 6 6%
3. No source of income 5 5%
4. Crown ward 0 0%
5. More than 6 years out of education 7 6%
6. More than 6 years without training 2 2%
7. Age over 45 and under 64 5 5%
8. History of interrupted education 4 4%
9. Disabled 0 0%
10. Aboriginal 6 6%
11. Deaf 2 2%
12. Francophone 3 3%
4 Progress 60% 60% 106 137 77% 129%
1. % of Learners who complete at least one Milestone
106 77%
Efficiency
5 Learners Served 90% 190 137 108%
New 106
Carry over 31
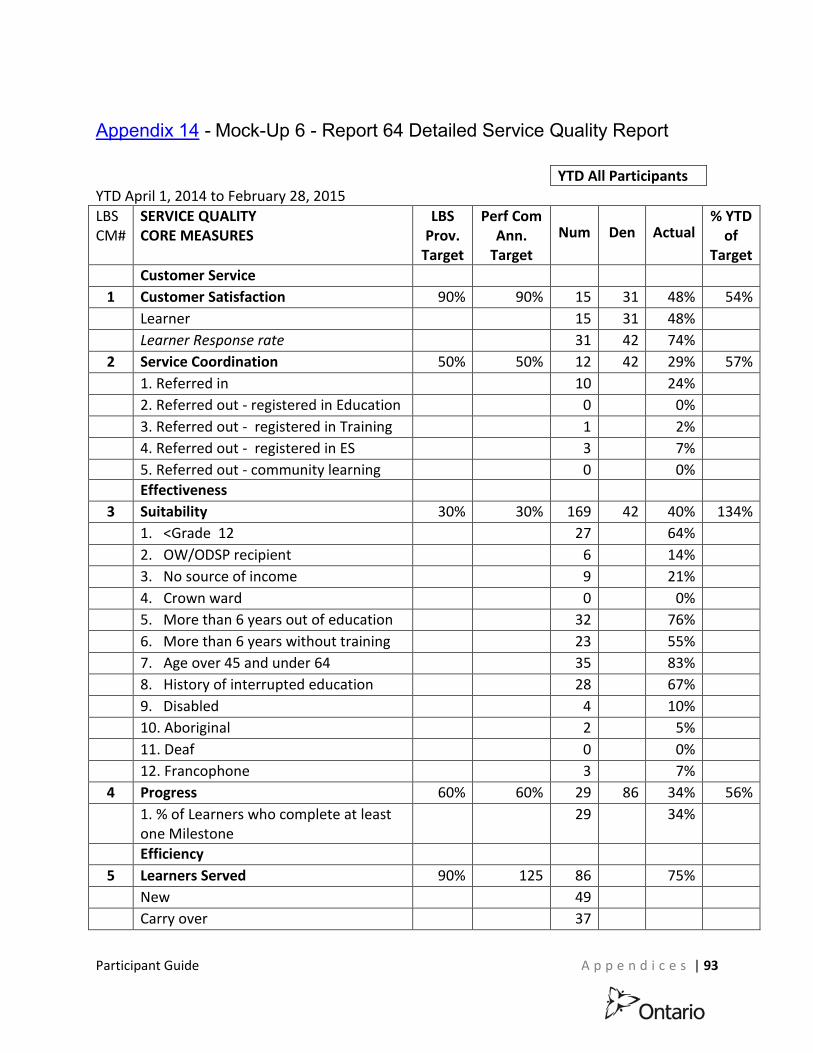
Participant Guide A p p e n d i c e s | 93
YTD All Participants
YTD All Participants
YTD All Participants
Appendix 14 - Mock-Up 6 - Report 64 Detailed Service Quality Report
YTD April 1, 2014 to February 28, 2015
LBS CM#
SERVICE QUALITY CORE MEASURES
LBS Prov.
Target
Perf Com Ann.
Target
YTD All Participants
% YTD of
Target
Num Den Actual
Customer Service
1 Customer Satisfaction 90% 90% 15 31 48% 54%
Learner 15 31 48%
Learner Response rate 31 42 74%
2 Service Coordination 50% 50% 12 42 29% 57%
1. Referred in 10 24%
2. Referred out - registered in Education 0 0%
3. Referred out - registered in Training 1 2%
4. Referred out - registered in ES 3 7%
5. Referred out - community learning 0 0%
Effectiveness
3 Suitability 30% 30% 169 42 40% 134%
1. <Grade 12 27 64%
2. OW/ODSP recipient 6 14%
3. No source of income 9 21%
4. Crown ward 0 0%
5. More than 6 years out of education 32 76%
6. More than 6 years without training 23 55%
7. Age over 45 and under 64 35 83%
8. History of interrupted education 28 67%
9. Disabled 4 10%
10. Aboriginal 2 5%
11. Deaf 0 0%
12. Francophone 3 7%
4 Progress 60% 60% 29 86 34% 56%
1. % of Learners who complete at least one Milestone
29 34%
Efficiency
5 Learners Served 90% 125 86 75%
New 49
Carry over 37

Participant Guide A p p e n d i c e s | 94
***
Notes