Embed Size (px)
Citation preview

Liquidity Changes Associated with Open Market RepurchasesAuthor(s): Ajai K. Singh, Mir A. Zaman and Chandrasekhar KrishnamurtiSource: Financial Management, Vol. 23, No. 1 (Spring, 1994), pp. 47-55Published by: Wiley on behalf of the Financial Management Association InternationalStable URL: http://www.jstor.org/stable/3666055 .
Accessed: 15/06/2014 03:33
Your use of the JSTOR archive indicates your acceptance of the Terms & Conditions of Use, available at .http://www.jstor.org/page/info/about/policies/terms.jsp
.JSTOR is a not-for-profit service that helps scholars, researchers, and students discover, use, and build upon a wide range ofcontent in a trusted digital archive. We use information technology and tools to increase productivity and facilitate new formsof scholarship. For more information about JSTOR, please contact [email protected].
.
Wiley and Financial Management Association International are collaborating with JSTOR to digitize, preserveand extend access to Financial Management.
http://www.jstor.org
This content downloaded from 195.78.108.199 on Sun, 15 Jun 2014 03:33:06 AMAll use subject to JSTOR Terms and Conditions

Liquidity Changes Associated with
Open Market Repurchases Ajai K. Singh, Mir A. Zaman, and Chandrasekhar Krishnamurti
Ajai K. Singh is an Associate Professor at Iowa State University, Ames, IA. Mir A. Zaman is an Assistant Professor at the University of Northern Iowa, Cedar Falls, IA. Chandrasekhar Krishnamurti is at the Indian Institute of Science, Bangalore, India.
M Prior to the tax-law changes of 1986, stock repurchases received favorable tax treatment relative to cash dividends, yet more than 80% of New York Stock Exchange (NYSE)- listed firms did not use repurchases for distributing value to their stockholders (see Barclay and Smith [3]).1 Barclay and Smith [3] provide a possible resolution of the puzzle by examining the effect of open market repurchases on the liquidity of a firm's stock. They find that the bid-ask spread increases when firms announce their intention to reacquire common stock. Barclay and Smith [3] argue that the in- creased bid-ask spread leads to an increased cost of capital.2 This hidden cost associated with open market repurchases may explain the preference for cash dividends.
Barclay and Smith [3] use Vermaelen's [19] sample of open market repurchase programs initiated by NYSE-listed firms. Due to data constraints, Barclay and Smith use annual bid-ask spreads to document the changes in liquidity. The use of annual data imposes certain limitations. With annual data, it is not possible to examine when the percentage spread increases with respect to the announcement date, that is, before or after the event. For instance, if the percentage spread is measured at year-end and the event occurs in between year-ends, then an increase in post-event percentage spread may suggest that the event induces the change in the spread. However, the spread could have increased prior to the event and remained stable thereafter. The availability of daily bid-ask spread data for our sample of National Market System (NMS)-listed stocks facilitates a close examination of liquidity changes surrounding the announcement of open market repurchase programs. We find a significant increase in the percentage spread in the 60-day period immediately preceding the event. Further, this increase in percentage spread is more pronounced in the 30-day period immediately prior to the announcement day. In subsequent periods we find no further change in percentage spread. Our results indicate that percentage spreads increase prior to open-market repurchase announcements. These findings are not consistent
The authors thank former Editor James Ang, three anonymous referees, Rick Carter, Arnie Cowan, Rick Dark, Mike Doran, Gary Koppenhaver, Nandu Nayar, Dennis Officer, Paul Schultz, and Roger Stover for helpful com- ments and suggestions. Clark Balcom, Beth Gayer, and Sheryl Tolsdorf provided excellent research assistance. We are solely to blame for any remaining errors. I Capital gains are tax-deferred. Therefore, even though nominal tax rates may be equal, capital gains are still tax-advantaged, relative to ordinary income. 2 Amihud and Mendelson [1] show that an increase in the bid-ask spread for a firm's stock is accompanied by a reduction in the liquidity of its shares and therefore an increase in the cost of capital.
47
This content downloaded from 195.78.108.199 on Sun, 15 Jun 2014 03:33:06 AMAll use subject to JSTOR Terms and Conditions

48 FINANCIAL MANAGEMENT / SPRING 1994
with the proposition that open market repurchase program announcements cause an increase in percentage spreads.3
We test the robustness of our result by using a control sample of firms that are matched with our sample firms by market value of equity. OLS cross-sectional regressions indicate that the change in common stock price is the most important determinant of the change in percentage bid-ask spread. The change in spread does not differ between the firms announcing a repurchase program and the firms in our control sample. The matched-sample results support our univariate test results: The change in share price explains the change in percentage bid-ask spread.
Recent studies suggest that firms buy back shares when their common stock is substantially undervalued.4 Bartov [4] documents positive unexpected annual earnings in the repurchase announcement year. He finds positive revisions in the annual earnings forecasts by analysts in the period immediately following the repurchase announcement. Consistent with Vermaelen [19], Bartov's results suggest that open market repurchases of common stock are also information signaling mechanisms. We also find that open market repurchase programs are initiated following a period of steep decline in stock prices. The announcements are associated with significantly positive average stock price reactions. It appears that managers initiate repurchase programs to shore up declining investor confidence. This may be a partial explanation of why open market repurchase programs are observed less frequently than cash dividends.
I. Selection and Characteristics of the Sample
This section describes our sample.
A. Sample Selection
We obtained the sample of open market repurchase announcements from the REACQUIRED SHARES section of The Wall Street Journal (WSJ) Index.5 We also searched for repurchase announcements reported in WSJ using DIALOG Information Services. The initial sample was screened to satisfy the following criteria:
1. The sample firms' common stock returns and bid-ask spread should be available on the CRSP/NASDAQ tape from 100 trading days before to 100 trading days following the repurchase announcement in The Wall Street Journal. Since a primary motivation is to map the changes in liquidity
around repurchase announcements, it is important to have daily data on bid-ask spreads. Therefore, we chose the CRSP/NASDAQ database.
2. We restricted our sample to stocks listed on the NMS. Stocks that moved to NMS in the 100-day period preceding the announcement are not included in the final sample. We excluded these firms from the sample because Seguin [16] shows that spreads decline significantly after over-the-counter stocks move to the NMS. Including such stocks could bias the results against finding an increase in bid-ask spreads in the post-announcement period.
3. Repurchase announcements made between April 11, 1987 and April 27, 1988 are not included in the final sample. The market break of October 1987 was an unusual event. To keep our sample comparable to earlier studies, we excluded stock repurchase programs initiated in that period.6 By excluding approximately 100 days on either side of the stock market crash date, we effectively remove any of its effects from our examination.
CRSP started reporting NMS data in November 1982. Since we excluded firms that moved to the NMS in the 100-day pre-announcement period, our sample starts in 1983. The final sample consists of 181 repurchase announcements during the 1983-1990 period. Each of the 181 firms in the control sample is matched with a sample firm on the basis of market value of equity at the year-end preceding the repurchase announcement. For three of the sample firms we could not find a matching control firm within a +/-5% tolerance range. For those three firms, the closest possible match by size was selected as a control unit.
B. Sample Characteristics
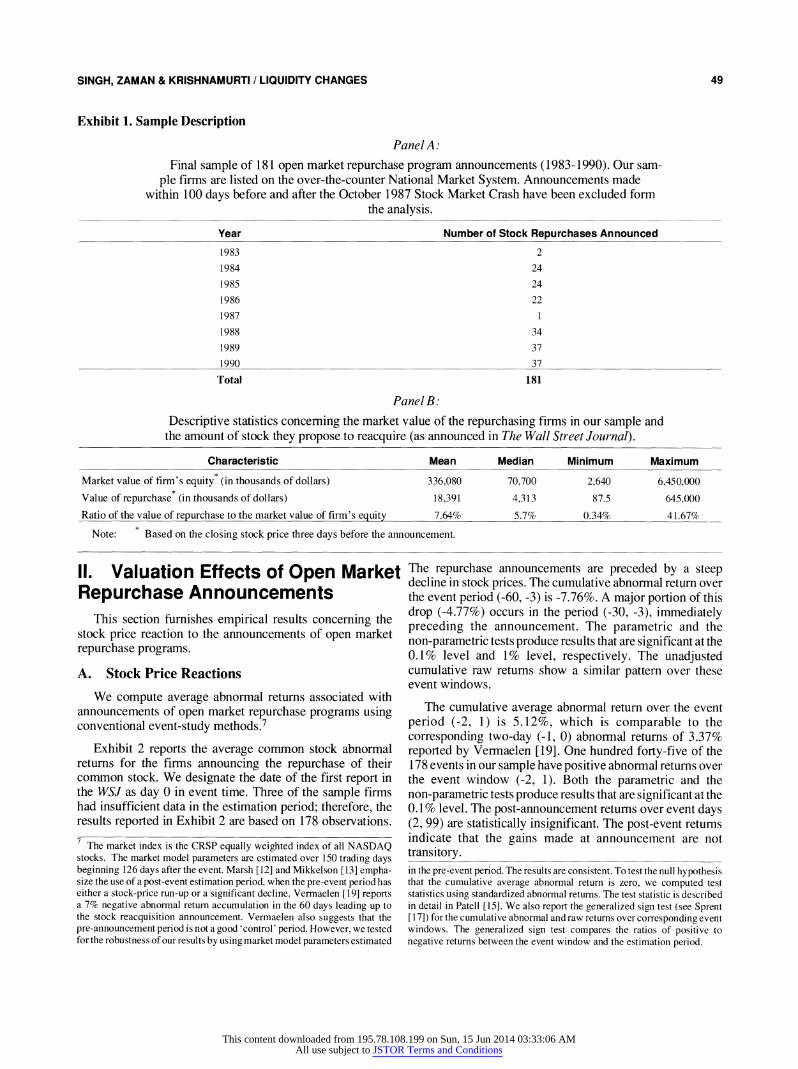
We provide the annual frequency of our sample stock repurchase announcements in Panel A of Exhibit 1. The sample selection criteria eliminate all but two repurchases announced in 1983 and one in 1987.
In Panel B of Exhibit 1, we provide descriptive statistics regarding the market value of shares repurchased and the capitalization of the repurchasing firms. The average market value of equity of the sample firms is $336.08 million (median value is $70.70 million). The value of the repurchase, as announced in the WSJ, ranges between $87,500 and $645 million for our sample. The mean and median values are $18.39 million and $4.31 million, respectively. The ratio of the dollar value of the repurchase to the market value of equity ranges from 0.34% to 41.67%, and the mean and median values are 7.64% and 5.7%, respectively. The target fraction sought to be acquired by repurchasing firms in Vermaelen's [19] sample is 5.01%, which is consistent with our sample.
3 Wiggins [21] examines a sample of NYSE stock repurchase program announcements and documents results consistent with our findings. He also does not find increased spreads or decreased liquidity in the post-an- nouncement period. 4 See Asquith and Mullins [2]; Dann [7]; Netter and Mitchell [14]; Ver- maelen [19]; and Wansley, Lane and Sarkar [20].
5 The Wall Street Journal Index began providing a summary of stock buy-backs in 1978.
6 "In the 10 days after the crash 55 8 companies announced buy-backs worth $44 billion ... well over ... the annual tallies for banner buy-back years 1985 and 1986" (The Wall Street Journal, January 27, 1988, p. 21).
This content downloaded from 195.78.108.199 on Sun, 15 Jun 2014 03:33:06 AMAll use subject to JSTOR Terms and Conditions
SINGH, ZAMAN & KRISHNAMURTI / LIQUIDITY CHANGES 49
Exhibit 1. Sample Description
Panel A:
Final sample of 181 open market repurchase program announcements (1983-1990). Our sam- ple firms are listed on the over-the-counter National Market System. Announcements made
within 100 days before and after the October 1987 Stock Market Crash have been excluded form the analysis.
Year Number of Stock Repurchases Announced
1983 2
1984 24
1985 24
1986 22
1987 1
1988 34
1989 37
1990 37
Total 181
Panel B:
Descriptive statistics concerning the market value of the repurchasing firms in our sample and the amount of stock they propose to reacquire (as announced in The Wall Street Journal).
Characteristic Mean Median Minimum Maximum
Market value of firm's equity* (in thousands of dollars) 336,080 70,700 2,640 6,450,000
Value of repurchase* (in thousands of dollars) 18,391 4,313 87.5 645,000
Ratio of the value of repurchase to the market value of firm's equity 7.64% 5.7% 0.34% 41.67%
Note: Based on the closing stock price three days before the announcement.
II. Valuation Effects of Open Market Repurchase Announcements
This section furnishes empirical results concerning the stock price reaction to the announcements of open market repurchase programs.
A. Stock Price Reactions
We compute average abnormal returns associated with announcements of open market repurchase programs using conventional event-study methods.7
Exhibit 2 reports the average common stock abnormal returns for the firms announcing the repurchase of their common stock. We designate the date of the first report in the WSJ as day 0 in event time. Three of the sample firms had insufficient data in the estimation period; therefore, the results reported in Exhibit 2 are based on 178 observations.
The repurchase announcements are preceded by a steep decline in stock prices. The cumulative abnormal return over the event period (-60, -3) is -7.76%. A major portion of this drop (-4.77%) occurs in the period (-30, -3), immediately preceding the announcement. The parametric and the non-parametric tests produce results that are significant at the 0.1% level and 1% level, respectively. The unadjusted cumulative raw returns show a similar pattern over these event windows.
The cumulative average abnormal return over the event period (-2, 1) is 5.12%, which is comparable to the corresponding two-day (-1, 0) abnormal returns of 3.37% reported by Vermaelen [19]. One hundred forty-five of the 178 events in our sample have positive abnormal returns over the event window (-2, 1). Both the parametric and the non-parametric tests produce results that are significant at the 0.1% level. The post-announcement returns over event days (2, 99) are statistically insignificant. The post-event returns indicate that the gains made at announcement are not transitory. 7 The market index is the CRSP equally weighted index of all NASDAQ
stocks. The market model parameters are estimated over 150 trading days beginning 126 days after the event. Marsh [12] and Mikkelson [13] empha- size the use of a post-event estimation period, when the pre-event period has either a stock-price run-up or a significant decline. Vermaelen [19] reports a 7% negative abnormal return accumulation in the 60 days leading up to the stock reacquisition announcement. Vermaelen also suggests that the pre-announcement period is not a good 'control' period. However, we tested for the robustness of our results by using market model parameters estimated
in the pre-event period. The results are consistent. To test the null hypothesis that the cumulative average abnormal return is zero, we computed test statistics using standardized abnormal returns. The test statistic is described in detail in Patell [15]. We also report the generalized sign test (see Sprent [17]) for the cumulative abnormal and raw returns over corresponding event windows. The generalized sign test compares the ratios of positive to negative returns between the event window and the estimation period.
This content downloaded from 195.78.108.199 on Sun, 15 Jun 2014 03:33:06 AMAll use subject to JSTOR Terms and Conditions

50 FINANCIAL MANAGEMENT / SPRING 1994
Exhibit 2. Cumulative Average Abnormal Returns
Cumulative average abnormal and raw returns around announcements of open market stock repurchase programs for stocks listed on the National Market System (1983-1990). The date the announcement appears in The Wall Street Journal is defined as day 0 in event time. The market model parameters are estimated over 150 trading days beginning 126 days after the repurchase announcement. Of the 181 announcements in the final sample, three firms had insufficient data in the post-event period. The results reported in this table are based on 178 observations.
Cumulative Average Number of Cumulative Number of
Abnormal Positive and Average Raw Positive and Event Period Return (%) Z-Statistic Negative Return (%) t-Statistic Negative
-100 through -3 -10.20 -4.86 60:118 -7.99 -2.92 68:110
-100 through -61 -2.44 -1.78 81:97 -0.50 -0.29 86:92
-60 through -31 -2.99 -2.19 65:113 -2.50 -1.65 78:100
-30 through -3 -4.77 -4.70 64:114 -4.99 -3.41 60:118
-2 through 1 5.12 11.18 145:33 5.11 9.23 149:29
2 through 29 0.04 0.43 95:83 0.85 0.58 98:80
2 and 99 -0.70 0.12 81:97 4.20 1.53 102:76
Notes: = Significant at 10% level. = Significant at 1% level. = Significant at 5% level. = Significant at 0.1% level.
B. False Signaling?
Although information signaling appears to be a plausible explanation for our results, such an explanation must be viewed with caution. The gains at announcement are not transient, and they are not dissipated over the next six months. This result suggests that the market finds the signal credible and does not suspect false signaling. However, open market repurchase programs do not specify a termination date and, in fact, do not have to be completed or even carried out in part. The announcements are very often conditional, stating that shares will be purchased only if the stock price stays low. There is no identifiable direct cost of false signaling associated with a firms' announced intent to reacquire its common stock. The Securities and Exchange Commission (SEC) does not mandate that a firm actually repurchase any shares. It only stipulates that the announcement, when it is made, cannot be false. The SEC has safe-harbor rules regarding manipulative trading, but those deal mainly with the repurchasing practices rather than with the possibility of a false signal (see Netter and Mitchell [14]). Firms often carefully state that the reacquisition will occur only under favorable market conditions. The details of what constitutes "favorable" are never disclosed.8 Therefore, the commitment to execute the repurchase operation could be marginal.9 On the other hand, there could be indirect costs associated with false signaling. Managers may fear inviting the scrutiny of the SEC and/or the possibility of reputation
loss (see Fama [9]) may deter them from signaling falsely. However, a resolution of this question lies outside the scope of this paper.
III. Open Market Repurchase and Liquidity
This section empirically tests three alternative hypotheses concerning the impact of open market repurchase announcements on the liquidity of common stock.
A. Hypotheses In this section, we consider the possible effects of open
market repurchase programs on the liquidity of the stock. Our hypotheses, termed the competing-market-maker hypothesis, the inventory-holding-cost hypothesis and the information-asymmetry hypothesis, are not mutually exclusive. Each may explain some portion of the changes in the liquidity measures.
The Competing-Market-Maker Hypothesis. When management undertakes to reacquire the firm's shares in the open market, they are, in effect, competing with the market makers of the stock. The effect of increased competition on liquidity has been documented in earlier research. Demsetz [8] observes that increased competition is inversely related to the bid-ask spread, a measure of liquidity. Benston and Hagerman [5] and Stoll [18] also note an inverse relationship between the number of dealers and the bid-ask spread. Therefore, managements' open market repurchase activity,
8 It is not possible to determine whether there is false signaling by merely observing the actual number of shares repurchased. Managers may not purchase the announced number of shares in the market if the stock price rises sufficiently following the announcement.
9 In self tender offers managers voluntarily precommit not to tender their shares. Further, in tender offers the premium paid over the current stock
price serves as a quantifiable signal. It is therefore not very surprising that self tender offer repurchase announcements are associated with a much stronger stock price reaction. The average abnormal return associated with self tender offer announcements is approximately 17% (Vermaelen [ 19]).
This content downloaded from 195.78.108.199 on Sun, 15 Jun 2014 03:33:06 AMAll use subject to JSTOR Terms and Conditions

SINGH, ZAMAN & KRISHNAMURTI / LIQUIDITY CHANGES 51
between the number of dealers and the bid-ask spread. Therefore, managements' open market repurchase activity, in the absence of information asymmetry, should result in greater liquidity, or a lower bid-ask spread. Barclay and Smith [3] term the above effect the competing-market-maker hypothesis.
The Inventory-Holding-Cost Hypothesis. As a direct consequence of announcing open market repurchases, we expect increased trading in the secondary market. As corporate managers execute their repurchase programs, the volume of trading in the secondary market increases. Thus, the market maker observes an increased trading volume in stocks of firms that announce a repurchase program. Stoll [18] posits a direct relationship between trading volume and the market-maker's holding period for the stock. The higher the trading volume, the easier it is for the dealer to reverse his position in the stock. Hence, we expect the inventory holding cost component of the bid-ask spread to decline when there is an increase in trading volume. Ceteris paribus, we expect a decline in spreads in the post-announcement period for stocks of firms announcing open market repurchases. We call the above effect the inventory-holding-cost hypothesis.
The Information-Asymmetry Hypothesis. Open market repurchase announcements mark the arrival of increased trading by informed traders in the secondary market for the firm's stock. The post-repurchase announcement period witnesses trading by informed managers who only trade at favorable prices. Glosten and Milgrom [10], in their proposition 5, state that the ask price increases and the bid price decreases when the ratio of informed to uninformed traders increases. Therefore, we expect an increase in the bid-ask spread after the announcement of open market repurchases. In their model, Glosten and Milgrom [10] focus exclusively on the adverse selection component of spread and assume that the other components, namely inventory holding and order processing costs, are negligible. In the context of open market repurchases, we restate Glosten and Milgrom's [10] proposition 5 as follows:
Following the announcement of an open market repur- chase program, the perceived amount of informational trading increases, and therefore, the adverse selection component of spread increases.
Barclay and Smith [3] term this the information-asymmetry hypothesis. Other things being equal, the information-asymmetry hypothesis predicts that the bid-ask spread should increase during the post-announcement period.10
B. Empirical Results
Prior research has concentrated on the wealth effects of stock repurchases. Barclay and Smith [3] examine the liquidity effects of open market repurchase announcements in their paper. They were constrained by data restrictions to the use of annual bid-ask spread data. In this section, we examine the time series of changes in liquidity around repurchase announcements with the benefit of daily spread and volume data for our sample of NMS-listed stocks.
In Exhibit 3, we compare liquidity measures over several intervals surrounding the stock repurchase announcements. We report changes in volume, relative volume (volume divided by shares outstanding), dollar spread, and percentage spread.1' For each firm, we compute the variable means over different event periods. The change is measured as the difference between the later period and the earlier period mean values.12 We test the null hypothesis that the change in the liquidity measure between event periods is zero. To test this hypothesis, we employ the parametric paired difference t-test and the nonparametric Wilcoxon sign rank test.
In Panel A of Exhibit 3, we compare the pre-announcement period (-100, -3) to the post-announcement period (2, 99). The results indicate that percentage spread and volume increase in the post-event period; the change is statistically significant. Relative volume and dollar spread do not change significantly.
The increase in percentage spread in the post-announcement period is similar to the results reported by Barclay and Smith [3]. However, given the length of the pre-announcement interval (-100, -3), it is not possible to discern whether the percentage spread is uniform over this entire period. We, therefore, compare liquidity measures over different sub-periods within the pre-announcement interval.
Exhibit 2 shows that the raw returns over the period (-60, -3) are significantly negative. We know that an increase in the percentage spread could be caused either by an increase in the dollar spread or by a decrease in the average price level. To get a clearer picture of the changes occurring in the pre-announcement period, we compare the liquidity changes over the event-time windows (-100, -61) and (-60, -3). The results reported in Panel B of Exhibit 3 indicate that the changes in relative volume and the dollar spread are insignificant. However, volume and percentage spread increase significantly. Our explanation for the increase in percentage spread between the two periods is the sharp decline in raw returns (the average price level) during the latter period (-60, -3).
We split the pre-event period (-60, -3) into (-60, -31) and 10 It should be noted that an asymmetric-information-based explanation does not necessarily imply that other market participants face the informed traders in all trades at all times. Specifically, the likelihood of trading with an informed trader is greater when stock prices are lower rather than higher. Also, repurchases only involve buying and not selling by informed traders. Hence, the risk of trading against the informed trader is much less.
I The dollar bid-ask spread is defined as (Ask-Bid). Percentage spread is defined as [(Ask-Bid)/I (Ask+Bid)/2 }]. 12 The change in volume is measured as [(post-event average daily vol- ume/pre-event average daily volume)-1].
This content downloaded from 195.78.108.199 on Sun, 15 Jun 2014 03:33:06 AMAll use subject to JSTOR Terms and Conditions

52 FINANCIAL MANAGEMENT / SPRING 1994
Exhibit 3. Liquidity Measures
A comparison of liquidity measures over several intervals surrounding announcements of open market repurchase programs (1983-1990). Our sample firms are listed in the National Market System. We report changes in volume, relative volume, dollar (absolute) spreads, and percentage spread. Relative volume is volume divided by the number of shares outstanding.a The change in each variable is measured as the difference between the later period and the earlier period observations. The announcement day is defined as day 0 in event time. There are 181 observations in the sample. The firms included in the sample have at least 100 days' data before and after the event date.
t-Statistic for the Difference of Means p-Value for the Sign
Change in Variable Mean Test Median Positive:Negative Rank Test
Panel A: Comparison of Event Periods (2, 99) and (-100, -3)
1. Volume 0.145 3.17 0.01 93:88 0.77
2. Relative Volume 0.0002 1.17 0.00005 95:86 0.55
3. Dollar Spread 0.003 0.50 -0.001 88:93 0.77
4. Percentage Spread 0.0028 2.84 0.0008 105:76 0.04
Panel B: Comparison of Event Periods (-60, -3) and (-100, -61)
1. Volume 0.152 3.12 **0.017 94:87 0.66
2. Relative Volume -0.00009 -0.47 0.00004 95:86 0.55
3. Dollar Spread -0.01 -1.48 -0.004 75:106 0.03
4. Percentage Spread 0.0028 3.84 0.0008 108:73 0.01
Panel C: Comparison of Event Periods (-30, -3) and (-60, -31)
1. Volume 0.33 3.03 -0.009 90:91 1.00
2. Relative Volume 0.00015 0.68 -0.00001 90:91 1.00
3. Dollar Spread 0.002 0.26 0.004 98:83 0.30
4. Percentage Spread 0.0017 2.88 0.0015 123:58 0.0001
Panel D: Comparison of Event Periods (2, 29) and (-30, -3)
1. Volume 0.43 4.34 0.17 102:79 0.10
2. Relative Volume 0.0006 2.21 0.0003 101:80 0.14
3. Dollar Spread -0.003 -0.48 -0.004 78:103 0.08
4. Percentage Spread -0.0008 -1.22 -0.0008 74:107 0.02
Panel E: Comparison of Event Periods (2, 59) and (-60, -3)
1. Volume 0.25 4.35 0.08 96:85 0.46
2. Relative Volume 0.00043 1.99 0.0002 96:85 0.46
3. Dollar Spread 0.006 0.99 -0.002 86:95 0.50
4. Percentage Spread 0.0011 1.35 0.00009 92:89 0.88
Notes: = Significant at 10% level. = Significant at 1% level.
= Significant at 5% level. Significant at 0.1% level. a = For each firm we compute the variable means over different event periods. The change is measured as
(later period-earlier period) mean value. We test the null hypothesis that the change in the variable between event periods is zero. To test the hypothesis, we employ the parametric paired difference t-test and the nonparametric Wilcoxon sign rank test.
any further changes in liquidity that may have occurred over the interval (-60, -3). The increase in percentage spread for the event period (-30, -3) as compared to the period (-60, -31) is statistically significant. The 4.99% decline in the average raw returns during the (-30, -3) window appears to be driving the percentage spread higher. The results in Panel C of
Exhibit 3 suggest that the increase in percentage spread is more pronounced during the (-30, -3) interval.
The percentage spread increases significantly in the pre-event period (-60, -3). To examine whether the repurchase announcement induces an increase in the
This content downloaded from 195.78.108.199 on Sun, 15 Jun 2014 03:33:06 AMAll use subject to JSTOR Terms and Conditions

SINGH, ZAMAN & KRISHNAMURTI / LIQUIDITY CHANGES 53
percentage spread, in Panel D of Exhibit 3 we use windows (-30, -3) and (2, 29) to represent the pre- and post-announcement periods, respectively.
Volume and relative volume increase significantly while the dollar spread and percentage spread do not change significantly in the post-event period. These results suggest that percentage spreads increase in the pre-event period and are stable thereafter. An increase in trading volume reduces the market maker's inventory holding cost and should therefore be accompanied by a reduction in dollar and percentage spreads. On the contrary, we find that dollar and percentage spreads do not change significantly.
In Panel E of Exhibit 3, the event time windows (-60, -3) and (2, 59) are used for the pre- and post-announcement periods comparison. Our conclusions from this comparison are essentially the same as those for the results reported in Panel D.
A possible explanation, consistent with our results, is that the increase in the adverse selection component widens the bid-ask spread but the increased volume provides an offsetting influence. The increase in the adverse selection component of spreads could be marginally greater than the reduction in the inventory holding cost component. This would explain why dollar spreads do not change even though volume increases significantly.
IV. Cross-Sectional Analysis We checked the robustness of our univariate results by
conducting cross-sectional regression analysis. The univariate results suggest that the percentage bid-ask spread increases prior to the event and remains relatively stable thereafter. Benston and Hagerman [5], Copeland and Galai [6], and Ho and Stoll [11] have demonstrated that a stock's bid-ask spread is related to its price, volume and volatility. To see whether the univariate results are sustained after controlling for changes in price, volume and volatility, we estimated different forms of the following regression equation:
ASi = oo + cqDUMi + u2Aln (PRICE)i +
rL3ARELVOLi + 04AVARi + ei (1)
where
Si = Log of the relative change in the average percentage spread (i.e., log [average percentage spread after the event/average percentage spread before the event]).
DUMi = 1 for firms that announced a stock repurchase.
= 0 for control sample firms.
Aln(PRICE)i = Log of the relative change in the average
stock price (i.e., log [average common stock price after the event/average common stock price before the event]).
ARELVOLi = Difference in average relative trading volume of the common stock between the post-event and pre-event periods.
AVARi = Difference in variance of stock returns between the post-event and pre-event periods.
i = A random error term with zero mean.
We matched the control sample firms with our sample firms by size in the year prior to the repurchase announcement. We hypothesize that after controlling for changes in price, volume and volatility, the changes in bid-ask spread of our sample firms' stocks do not differ from those of the control sample. We, therefore, expect the coefficient of the dummy variable to be insignificantly different from zero.
The regression results are reported in Exhibit 4. In Panel A, we report the results for relative changes measured over the event periods (-30, -3) and (2, 29). Panel B reports results for the relative changes measured over the event periods (-60, -3) and (2, 59). The results indicate that the change in the common stock price is the most important determinant of the change in percentage bid-ask spread. Regardless of the periods examined, the coefficient of the dummy variable is insignificant after controlling for changes in price, volume and volatility. Consistent with our univariate test results, the cross-sectional analysis indicates that open market common stock repurchase announcements have no effect on the bid-ask spreads.13
V. Conclusion We examine the proposition that open market repurchase
programs cause an increase in the bid-ask spread of the repurchasing firms. Barclay and Smith [3] find support for this proposition using a sample of NYSE-listed stocks. Due to data constraints, they use annual bid-ask spreads to document the changes in liquidity. We examine a sample of stock repurchase programs initiated by firms listed in National Market System (NMS). The availability of daily bid-ask and volume data for our sample firms permits a closer examination of liquidity changes in periods surrounding the announcement of open market repurchase programs. Our results are not consistent with the hypothesis that open market repurchase programs lead to an increase in the bid-ask spread. We find that the percentage spread increases in the period preceding the announcement but not subsequently. It appears that the significant decline in average price during the pre-announcement period is responsible for the increase in percentage spread. U
13 The results are consistent when the change in dollar spread is used as the dependent variable in the cross-sectional analysis. These results are avail- able from the authors upon request.
This content downloaded from 195.78.108.199 on Sun, 15 Jun 2014 03:33:06 AMAll use subject to JSTOR Terms and Conditions

54 FINANCIAL MANAGEMENT / SPRING 1994
Exhibit 4. Regression Results
OLS estimation of the cross-sectional determinants of changes in the percentage bid-ask spread in the period surrounding open market repurchase announcements. The sample firms are listed in the National Market System (181 observations for 1983-1990). For each sample firm there is a control firm matched by size in the year prior to the repurchase announcement. The dependent variable is the log of the relative change in the average percentage spread (i.e., log (average percentage spread after the event/average percentage spread before the event)). The p-value for the significance tests are in parentheses.
Regression Intercept DUM AIln(PRICE) ARELVOL AVAR Adj. R2 F-Value
Panel A: Event Periods (2, 29) and (-30, -3)
1. -0.39 0.012 -0.002 0.28 (0.02) (0.60)
2. -0.01 -0.15 -0.83 0.36 101.15 (0.44) (0.42) (0.0001)
3. -0.016 -0.003 -0.76 -2.88 33.07 0.40 61.44 (0.22) (0.88) (0.0001) (0. 11) (0.0001)
Panel B: Event Periods (2, 59) and (-60, -3).
4. -0.07 0.096 0.03 11.95 (0.0005) (0.0006)
5. -0.02 0.015 -0.84 0.53 209.07 (0.22) (0.44) (0.0001)
6. -0.02 0.024 -0.74 -6.39 39. 16 0.58 125.33 (0.17) (0.21) (0.0001) (0.003) (0.0001)
Notes:
DUM = 1 for firms that announced a stock repurchase. = 0 for control sample firms.
Aln (PRICE) = Log of the relative change in the average stock price (i.e., log [average common stock price after the event/average common stock price before the event]).
ARELVOL = Difference in average relative trading volume of the common stock between the post-and pre-event periods.
AVAR = Difference in variance of stock returns between the post- and pre-event periods.
References 1. Y. Amihud and H. Mendelson, "Asset Pricing and the Bid-Ask
Spread," Journal of Financial Economics (December 1986), pp. 223-249.
2. P. Asquith and D. W. Mullins, Jr., "Signalling with Dividends, Stock Repurchases, and Equity Issues," Financial Management (Autumn 1986), pp. 27-44.
3. M. J. Barclay and C. W. Smith, "Corporate Payout Policy: Cash Dividends Versus Open Market Repurchases," Journal of Financial Economics (October 1988), pp. 61-82.
4. E. Bartov, "Open Market Repurchases as Signals for Earnings and Risk Changes," Journal of Accounting and Economics (Septenber 1991), pp. 275-294.
5. G. J. Benston and R. L. Hagerman, "Determinants of the Bid-Ask Spreads in the Over-the-Counter Market," Journal of Financial Economics (December 1974), pp. 353-364.
6. T. Copeland and D. Galai, "Information Effects on the Bid-Ask Spread," Journal of Finance (December 1983), pp. 1457-1469.
7. L. Dann, "Common Stock Repurchases: An Analysis of Returns to Bondholders and Stockholders, Journal of Financial Economics (June 1981), pp. 113-138.
8. H. Demsetz, "The Cost of Transacting," Quarterly Journal of Economics (February 1968), pp. 33-53.
9. E. F. Fama, "Agency Problems and the Theory of the Firm," Journal of Political Economy (April 1980), pp. 288-298, 306-307.
10. L. R. Glosten and P. R. Milgrom, "Bid, Ask and Transaction Prices in a Specialist Market with Heterogeneously Informed Traders," Journal of Financial Economics (March 1985), pp. 71-100.
11. T. Ho and H. R. Stoll, "Optimal Dealer Pricing Under Transactions and Return Uncertainty," Journal of Financial Economics (March 1981), pp. 47-73.
12. P. Marsh "Equity Rights Issues and the Efficiency of the UK Stock Market," Journal of Finance (September 1979), pp. 839-862.
13. W. H. Mikkelson, "Convertible Calls and Security Returns," Journal of Financial Economics (September 1981), pp. 237-264.
14. J. M. Netter and M. L. Mitchell, "Stock-Repurchase Announcements and Insider Transactions After the October 1987 Stock Market Crash," Financial Management (Autumn 1989), pp. 84-96.
15. J. M. Patell, "Corporate Forecasts of Earnings Per Share and Stock Price Behavior: Empirical Tests," Journal of Accounting Research (Autumn 1976), pp. 246-276.
This content downloaded from 195.78.108.199 on Sun, 15 Jun 2014 03:33:06 AMAll use subject to JSTOR Terms and Conditions

SINGH, ZAMAN & KRISHNAMURTI / LIQUIDITY CHANGES 55
16. P. J. Seguin, "The Benefits of Transactions Reporting: Evidence from the National Market System," Working Paper, University of Michigan, 1991.
17. P. Sprent, Applied Nonparametric Statistical Methods, London, Chapman and Hall, 1989.
18. H. R. Stoll, "The Pricing of Security Dealer Services: An Empirical Study of NASDAQ Stocks," Journal of Finance (September 1978), pp. 1153-1172.
19. T. Vermaelen, "Common Stock Repurchases and Market Signaling," Journal of Financial Economics (June 1981), pp. 139-183.
20. J. W. Wansley, W. R. Lane, and S. Sarkar, "Managements' View on Share Repurchase and Tender Offer Premiums," Financial Management (Autumn 1989), pp. 97-110.
21. J. B. Wiggins, "Open Market Stock Repurchase Programs and Liquidity, Working Paper, Michigan State University, 1992.
This content downloaded from 195.78.108.199 on Sun, 15 Jun 2014 03:33:06 AMAll use subject to JSTOR Terms and Conditions