Embed Size (px)
Citation preview
LINEAR AND NONLINEAR EVOLUTION OFISOLATED DISTURBANCES IN A GROWING
THERMAL BOUNDARY LAYER IN POROUS MEDIA
A. Selim, D.A.S. Rees
Department of Mechanical Engineering, University of Bath, Bath BA2 7AY, UK.
Abstract. We consider the onset and development of convection in a saturated porous half-space whichis initially cold, but where the lower boundary has its temperature raised suddenly to a new uniform level.The resulting thermal boundary layer diffuses upwards and eventually becomes thermoconvectively unstable.Previous works by the present authors have considered in turn linearised theory, the nonlinear developmentof cells, and the destabilisation of such cells due to subharmonic disturbances. In all three papers it wasassumed that the convection pattern is horizontally periodic. In the present paper we relax this restriction byconsidering how an isolated disturbance develops in time, and this is compared with the horizontally periodicflows. New cells are generated outboard of existing ones so that the convecting region spreads horizontally withtime. The effective wavelengths are also found to increase with time, newer cells having larger wavelengthsthan older ones. We also consider the nonlinear development of these disturbances.
Keywords: Porous media, free convection, unsteady boundary layer, isolated disturbance, linear instability,nonlinear convection.
PACS: 44.25.+f, 44.30.+v, 47.11.Bc, 47.15.Cb, 47.20.Bp, 47.56.+r
INTRODUCTION
The effect of suddenly changing the temperatureof a horizontal boundary of a porous half-space hasstudied by many researchers. The detailed historyof this topic and the methods used to determinethe stability characteristics of the resulting thermalboundary layer is too long to be repeated here, buta recent summary may be found in [4].
Within the context of linear stability theory, dis-turbances are usually Fourier-decomposed into theirseparate wavenumbers. The resulting set of equa-tions for each monochromatic mode is a parabolicpartial differential system which may be solved nu-merically. Many authors have approximated thissystem by reducing it ordinary differential eigen-value form where the eigenvalue is the critical time.The computed critical times then depend stronglyon how the time-deriviative is approximated — seeTable 1 in [4]. Other methods, such as energy sta-bility analyses and local Rayleigh number analysesalso provide their own set of onset data; see [4].
This lack of mathematical consistency that mo-tivated Selim and Rees [1] to solve the full parabolicsystem numerically. Although they showed that dis-turbances which are introduced very early tend to-
wards a unique evolving profile, it was found thatthe magnitude of the evolving disturbance dependson how that magnitude is measured. Thus an en-ergy functional, the surface rate of heat transfer, andthe maximum temperature all give different neutralcurves. Of these, the energy functional yields thelargest region of instability and the earliest onsettime. These differences are due to the fact that thedisturbance profile varies as it evolves.
In this paper we consider how an isolated distur-bance evolves in time, both within the linear regimeand when it is nonlinear. The full disturbance equa-tions are solved numerically, and our results inter-preted in the light of the monochomatic behaviourdescribed in [1].
NOMENCLATURE
A = amplitude of disturbanceg = gravityk = disturbance wavenumberK = permeabilityL = length scaleN = nonlinear termsp = pressureQ = surface rate of heat transfer
u, v = horizontal and vertical velocitiest = timeTw = dimensional wall temperatureT∞ = dimensional ambient temperaturex, y = horizontal and vertical coordinates
Greek symbols
α = thermal diffusivityβ = expansion coefficientη = similarity variableθ,Θ = temperatureµ = dynamic viscosityρ = densityτ = scaled timeψ,Ψ = streamfunction
Subscripts and superscripts′ = derivative with respect to ητ = derivative with respect to τ
GOVERNING EQUATIONS
We are considering the instability of an initiallyquiescent semi-infinite region of saturated porousmedium at the uniform temperature, T∞, the lowerboundary of which has its temperature raised sud-denly to the new value, Tw. The porous medium ishomogeneous and isotropic, and the flow is governedby Darcy’s law modified by the presence of buoyancyand subject to the Boussinesq approximation. Thegoverning nondimensional equations are,
∂u
∂x+∂v
∂y= 0, (1a)
u = −∂p
∂x, v = −
∂p
∂y+ θ, (1b, c)
∂θ
∂t+ u
∂θ
∂x+ v
∂θ
∂y=∂2θ
∂x2+∂2θ
∂y2. (1d)
The appropriate boundary conditions are that,
y = 0 :y → ∞ :
v = 0, θ = 1v, θ → 0,
(1e)
while θ = 0 everywhere for t < 0.The pressure may be eliminated by introducing
the streamfunction, ψ, according to,
u = −∂ψ
∂yand v =
∂ψ
∂x, (2)
and therefore Eq. (1a), is automatically satisfied.The full nonlinear equations now take the form,
∂2ψ
∂x2+∂2ψ
∂y2=∂θ
∂x, (3a)
∂θ
∂t+∂ψ
∂x
∂θ
∂y−∂ψ
∂y
∂θ
∂x=∂2θ
∂x2+∂2θ
∂y2. (3b)
The streamfunction is taken to be zero on y = 0 andas y → ∞. We note that there is no Darcy-Rayleighnumber in the above; this is a natural consequenceof using
L =µα
ρgβK(Tw − T∞)(5)
as a length scale. The basic quiescent state is
ψ = 0, θ = erfc η =2√π
∫
∞
η
e−ξ2
dξ, (6)
(see [1]) where the similarity variable, η, is given by
η =y
2√t. (7)
If we replace θ by θ+erfc (η), and then introduce (7)and τ =
√t as alternative vertical and time coordi-
nates, then we obtain the full pertubation equations,
4τ2∂2ψ
∂x2+∂2ψ
∂η2= 4τ2
∂θ
∂x, (8a)
2τ∂θ
∂τ+N(ψ, θ) = 4τ2
∂2θ
∂x2+∂2θ
∂η2+2η
∂θ
∂η+
4τe−η2
√π
∂ψ
∂x,
(8b)where the nonlinear terms are given by,
N(ψ, θ) = 2τ(∂ψ
∂x
∂θ
∂η−∂ψ
∂η
∂θ
∂x
)
. (8c)
LINEAR THEORY:MONOCHROMATIC MODES
The analysis of Selim and Rees [1] neglects thenonlinear term in (8) and Fourier-decomposes thedisturbances according to
ψ = Ψ(η, τ) cos kx, θ = Θ(η, τ) sin kx, (9a, b)
where k is the wavenumber. The reduced variables,Ψ and Θ, satisfy,
Ψ′′ − 4τ2k2Ψ = 4τ2kΘ, (10a)
2τΘτ = Θ′′+2ηΘ′−4τ2k2Θ−4√πτke−η2
Ψ. (10b)
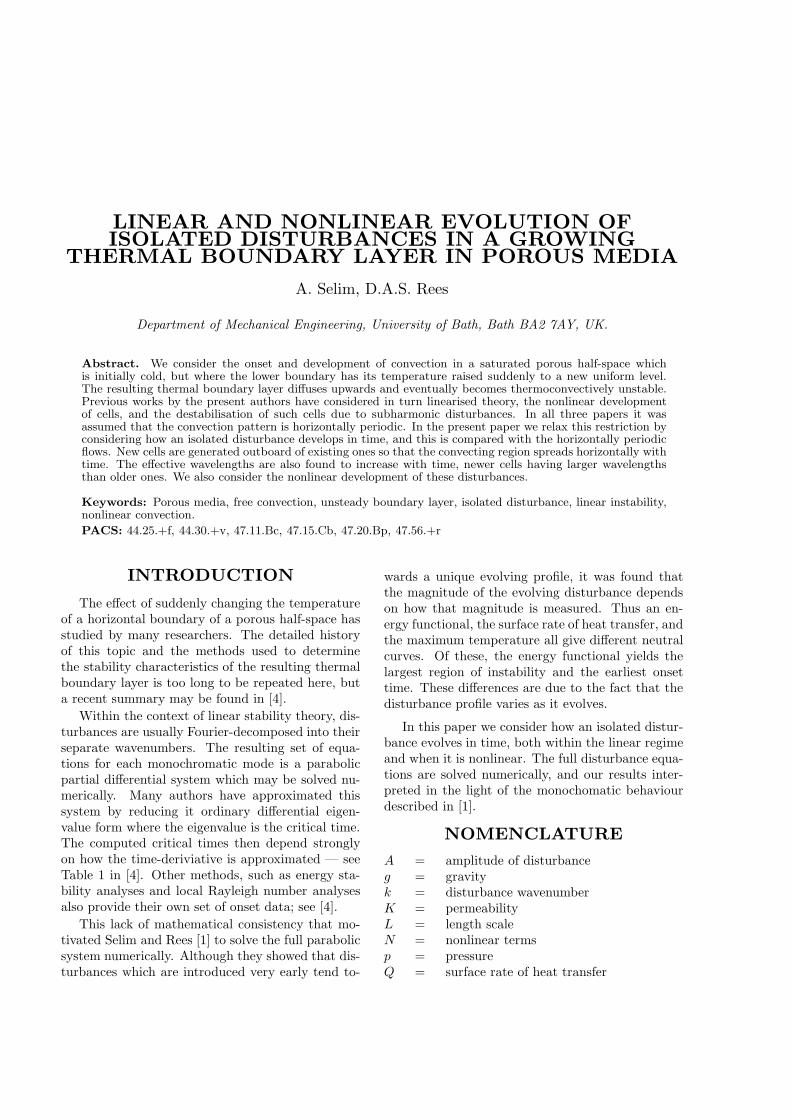
Artifical disturbances were placed within the bound-ary layer and their evolution with time was noted. Ifwe use the surface rate of heat transfer as the mon-itoring function, then the time at which it ceases todecay and begins to grow is deemed to be the criticaltime. It was in this manner that the neutral curvewhich is shown in Fig. 1 was constructed.
0 . 0 0 0 . 0 2 0 . 0 4 0 . 0 6 0 . 0 8 0 . 1 0 0 . 1 20
2 0
4 0
6 0
8 0
τ
k
FIGURE 1. Showing the neutral curve (continuous)
and the line of fastest disturbance growth (dashed)
Figure 1 also shows the locus of points at which thegrowth rate of the surface rate of heat transfer hasbeen maximised over all wavenumbers. Thus, astime progresses, and as the basic thermal bound-ary layer increases in thickness, the most danger-ous disturbance corresponds to decreasing values ofthe wavenumber. This corresponds to increasinglylarge wavelengths, which is intuitive, given that theboundary layer thickness is increasing.
LINEAR THEORY:LOCALISED DISTURBANCES
Localised disturbances was modelled by solvingEqs. (8a) and (8b) without the nonlinear terms. Sec-ond order accurate central differences in space andthe backward Euler method in time were used. Thisimplicit scheme relied on the FAS multigrid methodwith line relaxation in both directions. An adaptivetimestepping strategy was used in order to increaseefficiecy. This scheme was first used in Rees andBassom [5] where more detail may be found, andhas been used successfully in [6-8].
The initial disturbance was θ = Ae−x2/100ηe−η,where the value of A is irrelevant for linear theory.The computational domain was 0 ≤ x ≤ 2000 and0 ≤ η ≤ 8, the latter being well in excess of what wasneeded to contain the evolving disturbances. Theuniform grid used 640 × 48 points. The boundaryat x = 0 was an axis of symmetry where ψ = 0 and∂θ/∂x = 0. The value, x = 2000, was just enoughto contain the spreading disturbance up to τ = 100,and just over 3500 timesteps were used.
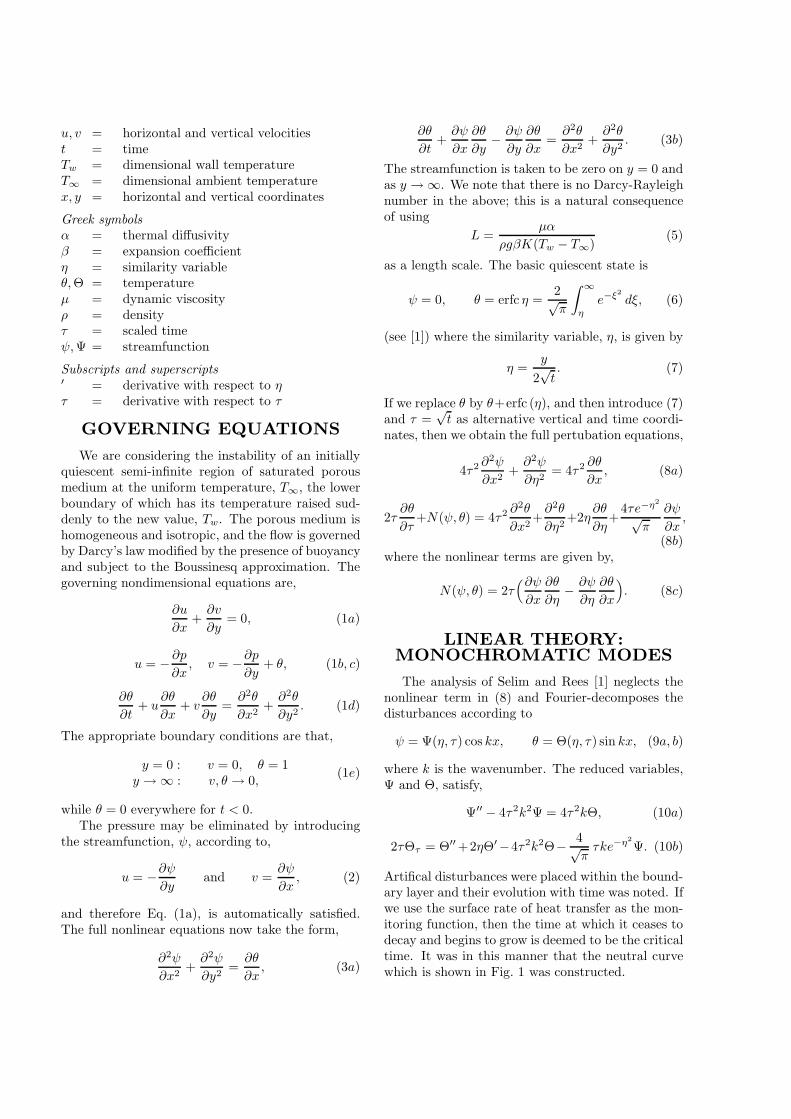
Figure 2 shows disturbance isotherms at differ-ent stages of the evolution. As time progresses thedisturbance also propagates outwards into undis-turbed regions by the successive generation of new
cells. Such front propagation is well-known in othercontexts, such as the Benard problem (see Getling[9], for example, and the comprehensive review byvan Saarloos [10]), but has not been studied in thecontext of convective instablities in porous media.The main distinguishing features of the cellular pat-terns shown in Fig. 2 are that new cells are widerthat their predecessors and that all cells tend towiden slowly as time progresses. These features arealso shown in Fig. 3, which depicts the boundariesbetween the ‘thermal’ cells, i.e. those locations atwhich the surface rate of heat transfer, Q, is zero.Thus the addition of new cells may be seen clearly.
τ = 20
τ = 35
τ = 50
τ = 65
τ = 90
x = 2000x = 0
FIGURE 2. Disturbance isotherms at the given times.
The upper boundary corresponds to η = 8.
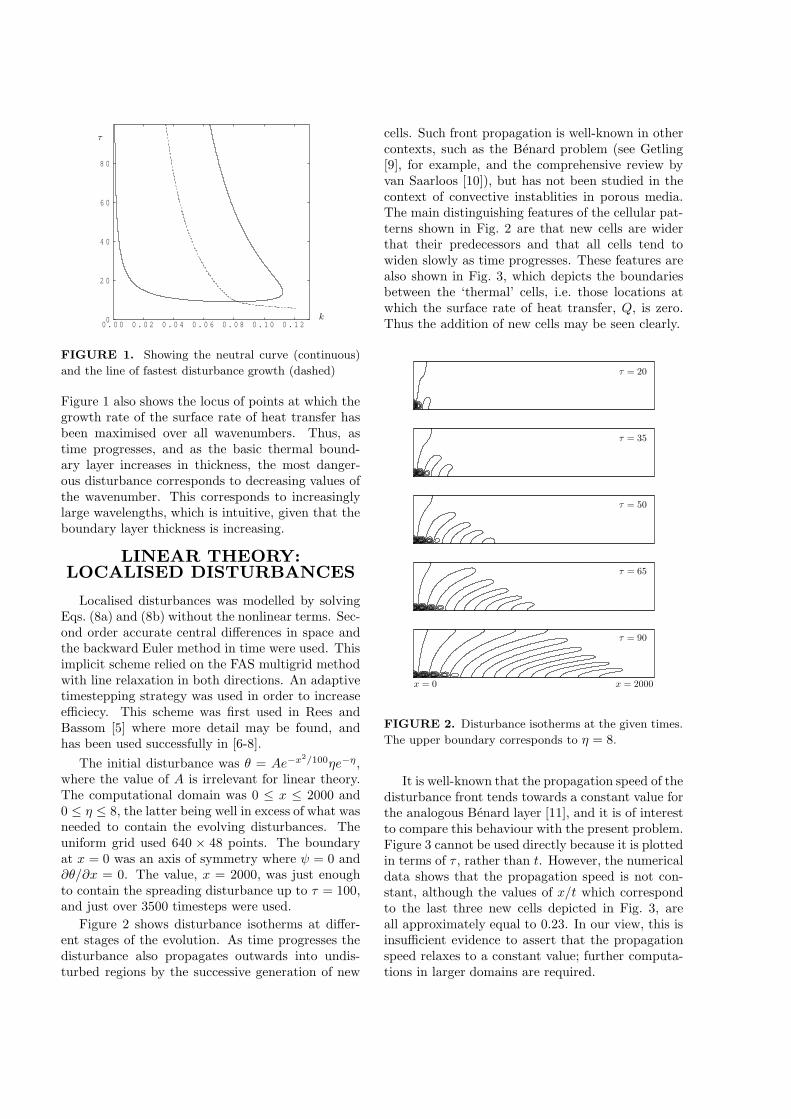
It is well-known that the propagation speed of thedisturbance front tends towards a constant value forthe analogous Benard layer [11], and it is of interestto compare this behaviour with the present problem.Figure 3 cannot be used directly because it is plottedin terms of τ , rather than t. However, the numericaldata shows that the propagation speed is not con-stant, although the values of x/t which correspondto the last three new cells depicted in Fig. 3, areall approximately equal to 0.23. In our view, this isinsufficient evidence to assert that the propagationspeed relaxes to a constant value; further computa-tions in larger domains are required.
0 2 0 4 0 6 0 8 0 1 0 00
2 0
4 0
6 0
8 0
1 0 0
1 2 0
1 4 0
1 6 0
x/10
τ
FIGURE 3. Showing the contours of zero rate of heat
transfer of the disturbance (Q = 0) at the surface.
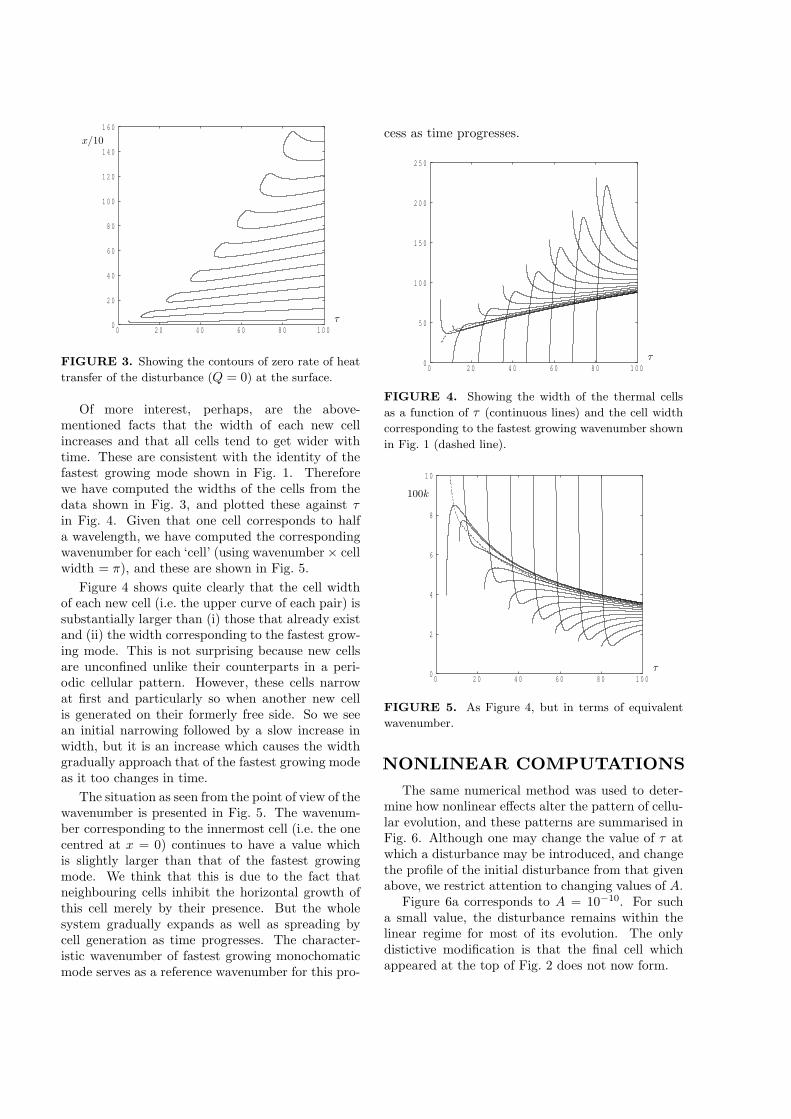
Of more interest, perhaps, are the above-mentioned facts that the width of each new cellincreases and that all cells tend to get wider withtime. These are consistent with the identity of thefastest growing mode shown in Fig. 1. Thereforewe have computed the widths of the cells from thedata shown in Fig. 3, and plotted these against τin Fig. 4. Given that one cell corresponds to halfa wavelength, we have computed the correspondingwavenumber for each ‘cell’ (using wavenumber × cellwidth = π), and these are shown in Fig. 5.
Figure 4 shows quite clearly that the cell widthof each new cell (i.e. the upper curve of each pair) issubstantially larger than (i) those that already existand (ii) the width corresponding to the fastest grow-ing mode. This is not surprising because new cellsare unconfined unlike their counterparts in a peri-odic cellular pattern. However, these cells narrowat first and particularly so when another new cellis generated on their formerly free side. So we seean initial narrowing followed by a slow increase inwidth, but it is an increase which causes the widthgradually approach that of the fastest growing modeas it too changes in time.
The situation as seen from the point of view of thewavenumber is presented in Fig. 5. The wavenum-ber corresponding to the innermost cell (i.e. the onecentred at x = 0) continues to have a value whichis slightly larger than that of the fastest growingmode. We think that this is due to the fact thatneighbouring cells inhibit the horizontal growth ofthis cell merely by their presence. But the wholesystem gradually expands as well as spreading bycell generation as time progresses. The character-istic wavenumber of fastest growing monochomaticmode serves as a reference wavenumber for this pro-
cess as time progresses.
0 2 0 4 0 6 0 8 0 1 0 00
5 0
1 0 0
1 5 0
2 0 0
2 5 0
τ
FIGURE 4. Showing the width of the thermal cells
as a function of τ (continuous lines) and the cell width
corresponding to the fastest growing wavenumber shown
in Fig. 1 (dashed line).
0 2 0 4 0 6 0 8 0 1 0 00
2
4
6
8
1 0
100k
τ
FIGURE 5. As Figure 4, but in terms of equivalent
wavenumber.
NONLINEAR COMPUTATIONS
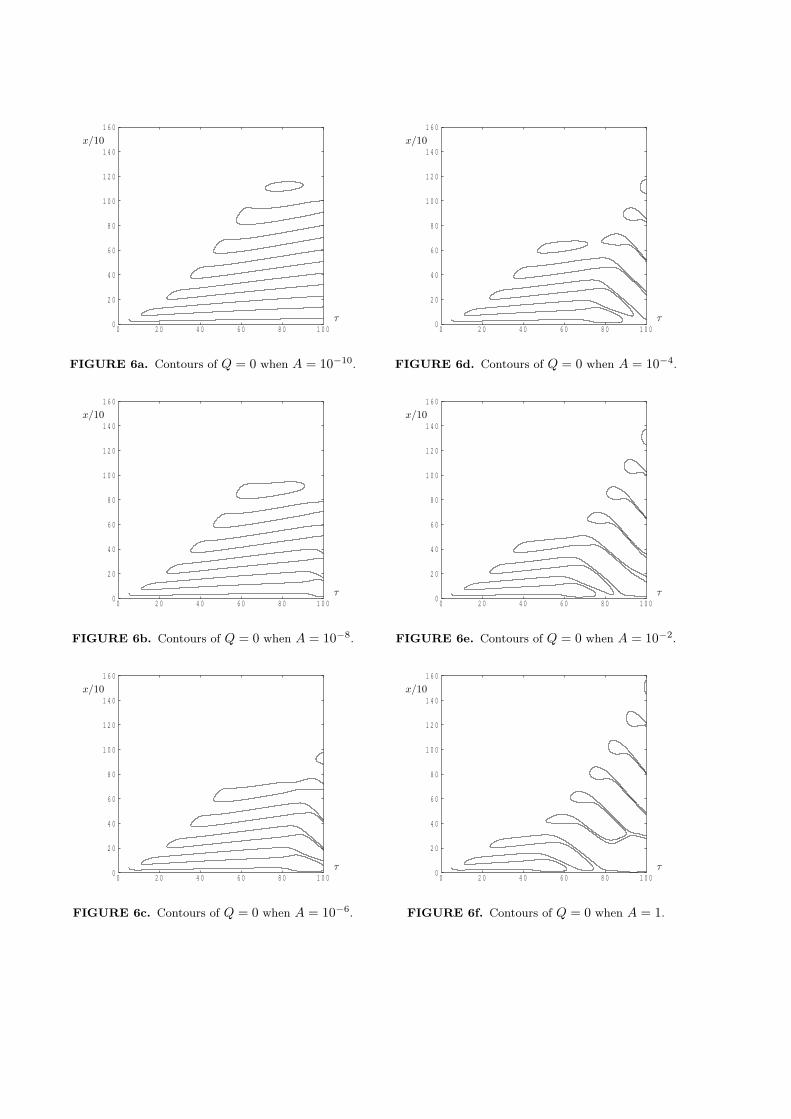
The same numerical method was used to deter-mine how nonlinear effects alter the pattern of cellu-lar evolution, and these patterns are summarised inFig. 6. Although one may change the value of τ atwhich a disturbance may be introduced, and changethe profile of the initial disturbance from that givenabove, we restrict attention to changing values of A.
Figure 6a corresponds to A = 10−10. For sucha small value, the disturbance remains within thelinear regime for most of its evolution. The onlydistictive modification is that the final cell whichappeared at the top of Fig. 2 does not now form.
0 2 0 4 0 6 0 8 0 1 0 00
2 0
4 0
6 0
8 0
1 0 0
1 2 0
1 4 0
1 6 0
x/10
τ
FIGURE 6a. Contours of Q = 0 when A = 10−10.
0 2 0 4 0 6 0 8 0 1 0 00
2 0
4 0
6 0
8 0
1 0 0
1 2 0
1 4 0
1 6 0
x/10
τ
FIGURE 6b. Contours of Q = 0 when A = 10−8.
0 2 0 4 0 6 0 8 0 1 0 00
2 0
4 0
6 0
8 0
1 0 0
1 2 0
1 4 0
1 6 0
x/10
τ
FIGURE 6c. Contours of Q = 0 when A = 10−6.
0 2 0 4 0 6 0 8 0 1 0 00
2 0
4 0
6 0
8 0
1 0 0
1 2 0
1 4 0
1 6 0
x/10
τ
FIGURE 6d. Contours of Q = 0 when A = 10−4.
0 2 0 4 0 6 0 8 0 1 0 00
2 0
4 0
6 0
8 0
1 0 0
1 2 0
1 4 0
1 6 0
x/10
τ
FIGURE 6e. Contours of Q = 0 when A = 10−2.
0 2 0 4 0 6 0 8 0 1 0 00
2 0
4 0
6 0
8 0
1 0 0
1 2 0
1 4 0
1 6 0
x/10
τ
FIGURE 6f. Contours of Q = 0 when A = 1.
But as A increases further, nonlinear effects be-come more noticeable. In Fig. 6c and onwards, thereis a distinctive drawing together of pairs of Q = 0contours at larger values of τ , and this phenomenonoccurs earlier as A increases. This drawing togethercorresponds to having a relatively hot cell abovethe surface which is being squeezed upwards by twoneighbouring cold cells. The pattern of streamlinestakes a distinctive triangular shape similar to thoseseen in [3], and it heralds subharmonic instabilities.
A related feature of nonlinearity is that the hotcells rise further from the surface than for linear dis-turbances, and form embryonic plumes. The upwardflow within these plumes must entrain fluid equallyfrom both sides in order to at least maintain theirstrength, but this isn’t always possible. Therefore aplume will migrate towards its nearer neighbour inan attempt to equalise the rate of entrainment; thisprovides a mechanism for the plumes to merge andto reduce the wavenumber. Such an event may beseen in the bottom right corners of Figs. 6d and 6e,which is where the cell spacing is narrowest. Thereis also an internal plume-merging event in Fig. 6f atτ = 90 and x ≃ 340.
This behaviour also arises in the detailed simula-tions of Riaz et al. [12], who considered an identicalconfiguration to the present one, but where the ini-tial disturbances were random. In a different con-text, Brambles and Rees [13] found that the centre-line of a plume formed by a line source of heat nearto a vertical wall traces out a curved path towardsthe wall. In addition, plumes caused by two parallelline sources merge into one. The numerical studyof Banu et al. [14] of two dimensional convection in-side a cavity with uniform heat generation describesplume merging events. When the cavity is shallowand the Darcy-Rayleigh number is relatively large,there exists a thin, but thermoconvectively unstablelayer near the upper surface. Instabilities manifestthemselves as travelling waves from the centre to thesidewall, and such waves often merge together.
Finally, Fig. 6 shows that the nonlinearity actu-ally serves to delay cell formation and hence the rateof spread of the convection pattern is inhibited.
CONCLUSIONS
In this paper we have made the first steps in un-derstanding how an isolated disturbance propagateswithin an unsteady diffusive boundary layer. In thelinear regime the pattern spreads horizontally be-cause new cells are formed on the edge of the pat-tern, and cells widen with time. These phenomenahave been explained within the context of the linear
stability of monochromatic modes. When A is large,we have found typically nonlinear behaviour: stronginflow and outflow effects, and cell-merging events.
ACKNOWLEDGEMENTS
A.S. would like to thank the University of Bath fora Departmental Studentship and an Overseas Re-search Award to support this research.
REFERENCES
1. A. Selim, D.A.S. Rees (2007) The instability of adeveloping thermal front in a porous medium. ILinear theory. J. Porous Media. 10: 1–15.
2. A. Selim, D.A.S. Rees (2007) The instability of adeveloping thermal front in a porous medium. IINonlinear evolution. J. Porous Media. 10: 17–33.
3. A. Selim, D.A.S. Rees (2010) The instability of adeveloping thermal front in a porous medium. IIISubharmonic instabilities. To appear in J. PorousMedia.
4. D.A.S. Rees, A. Selim, J.P. Ennis-King (2008) Theinstability of unsteady boundary layers in porousmedia. Emerging Topics in Heat and Mass Transferin Porous Media ed. P.Vadasz. (Springer), pp. 85–110.
5. D.A.S. Rees, A.P. Bassom (1993) The nonlinearnonparallel wave instability of free convection in-duced by a horizontal heated surface in fluid-saturated porous media. J. Fluid Mech.. 253: 267–296.
6. D.A.S. Rees (1993) A numerical investigation of thenonlinear wave stability of vertical thermal bound-ary layer flow in a porous medium. J. Appl. Math.Phys. (Z.A.M.P.). 44: 306–313.
7. D.A.S. Rees (2003) Vertical free convectiveboundary-layer flow in a porous medium using athermal nonequilibrium model: elliptical effects. J.Appl. Math. Phys. (Z.A.M.P.). 54: 437–448.
8. D.A.S. Rees, D.A. Nield, A.V. Kuznetsov (2008)Vertical free convective boundary-layer flow in abidisperse porous medium. Trans.A.S.M.E. J. HeatTransfer. 130: 092601,1–9.
9. A.V. Getling (1992) Convective-front propagationand wavenumber selection. Physica D. 55: 121–134.
10. W. van Sarloos (2003) Front propagation into un-stable states. Physics reports – Review section ofPhysics Letters. 386: 29–222.
11. J. Kockelkoren, C. Storm, W. van Saarloos (2003)Evidence for slow velocity relaxation in front prop-agation in Rayleigh-Benard convection. Physica D– Nonlinear Phenomena. 174: 168–175.
12. A. Riaz, M. Hesse, H.A. Tchelepi, F.M. Orr (2006)Onset of convection in a gravitationally unstablediffusive boundary layer in porous media. J. FluidMech.. 548: 87–111.
13. O.J. Brambles, D.A.S. Rees (2007) Curved free con-vection plume paths in porous media. Idojaras. Q.J. Hung. Met. Service. 111: 109–121.
14. N. Banu, D.A.S. Rees, I.Pop (1998) Steady andunsteady convection in rectangular porous cavitieswith internal heat generation. Proc. 11th Int. HeatTransfer Conf. (Kyongju, Korea) 4: 375–380.
![SCISCITATOR 2015 · [1]. Riverine communities experience two main types of disturbances: natural disturbances and anthropogenic disturbances. Natural disturbances in riverine ecosystems](https://img.dokumen.tips/doc/110x75/5f27dd3959f0c41da22eeec5/sciscitator-1-riverine-communities-experience-two-main-types-of-disturbances.jpg)


![Improved Sliding Mode Nonlinear Extended State …...nonlinear systems in the presence of mismatched disturbances and uncertainties. People in [23] presented an adaptive fuzzy observer](https://img.dokumen.tips/doc/110x75/5f5d5027bd05ee195d603c85/improved-sliding-mode-nonlinear-extended-state-nonlinear-systems-in-the-presence.jpg)


