Embed Size (px)
Citation preview
Lightweight 3D Modeling of Urban Buildings From Range Data
Weihong LiDepartment of Computer Science
Graduate Center, City University of New YorkNew York, [email protected]
George WolbergDepartment of Computer Science
City College of New YorkNew York, USA
Siavash ZokaiBrainstorm Technology LLC
New York, [email protected]
Abstract—Laser range scanners are widely used to acquireaccurate scene measurements. The massive point clouds theygenerate, however, present challenges to efficient modeling andvisualization. State-of-the-art techniques for generating 3D mod-els from voluminous range data is well-known to demand largecomputational and storage requirements. In this paper, attentionis directed to the modeling of urban buildings directly fromrange data. We present an efficient modeling algorithm thatexploits a priori knowledge that buildings can be modeled fromcross-sectional contours using extrusion and tapering operations.Inspired by this simple workflow, we identify key cross-sectionalslices among the point cloud. These slices capture changes acrossthe building facade along the principal axes. Standard imageprocessing algorithms are used to remove noise, fill missing data,and vectorize the projected points into planar contours. Applyingextrusion and tapering operations to these contours permits usto achieve dramatic geometry compression, making the resultingmodels suitable for web-based applications such as GoogleEarth or Microsoft Virtual Earth. This work has applicationsin architecture, urban design, virtual city touring, and onlinegaming. We present experimental results on synthetic and realurban building datasets to validate the proposed algorithm.
Keywords - 3D Modeling, point cloud, laser scanning,range data, segmentation, Google SketchUp, vectorization
I. INTRODUCTION
The 3D modeling of urban buildings is an area of activeresearch with increasing attention drawn from the computergraphics and computer vision communities. Current state-of-the-art algorithms include procedural modeling, 3D laser scan-ning, and image-based approaches. In addition, conventionalmodeling tools are commonly used for this purpose. The mostaccurate input source for modeling existing buildings, though,remains laser range scanners. They provide high geometricdetail by collecting range data from hundreds of meters awaywith an accuracy on the order of a few millimeters. Thisfidelity is appropriate for construction, architecture, culturalheritage, and forensics applications. Unfortunately, laser rangescanning can produce an overwhelming amount of data, whichposes great challenges to visualization software that requirelightweight 3D models for interactive use. Polygonal datagenerated from range scans are therefore too dense for use inweb-based applications such as Google Earth and MicrosoftVirtual Earth. These applications work best with lightweightmodels consisting of only hundreds of polygons.
The goal of this work is to automatically produce high-quality lightweight models of urban buildings from large-scale 3D range data. The proposed solution is inspired by the
simple paradigm embedded in procedural modeling as well asinteractive tools such as Google SketchUp. A key idea is thata simple set of extrusion and tapering operations applied to 2Dcontours can grow a wide array of complex 3D urban models.We propose a reverse engineering approach to infer key cross-sectional planar contours along with a set of extrusion andtapering operations to derive lightweight models that conformto the 3D range data.
The proposed algorithm can generate models across a widespectrum of resolutions. A particularly useful feature of thealgorithm is that it outperforms existing approximation tech-niques by preserving the sharpness of the raw data, even at lowresolution. The contribution of this work is that it combines thebenefits of a priori knowledge of urban buildings and fast 2Dimage processing techniques to perform 3D modeling of urbanbuildings directly from point cloud data (PCD). This offers thebenefit of a cost-effective geometry compression approach forvoluminous range data within the domain of urban structures.It can be applied to boost web-based 3D applications, virtualcity touring, and online gaming.
II. RELATED WORK
In an attempt to steer clear of tedious and expensive hand-made models, procedural modeling of buildings in [1] hasbeen proposed. By using an effective description language,buildings and streets of a virtual city can be generated auto-matically. The strength of this approach is that the descriptionlanguage can generate a huge number of buildings and streetsquickly and beautifully. This is particularly useful for gamingand other computer graphics applications. However, since theparameters used to generate the buildings are randomly gen-erated, the city generated with these buildings and streets is avirtual one. This approach is not useful for attempting to modelan existing building. To do so, one has to manually specify theparameters of the building, which is very cumbersome. Ourgoal is to automatically infer the contours and parameters ofan existing building directly from dense range data.
Reconstruction of 3D models from range data has beenaddressed in [2] with applications in numerous research areas,including computer-aided design (CAD), computer vision,architectural modeling, and medical image processing. Theauthors in [3] use a histogram of height data to detectfloors and ceilings for creating accurate floor plan models ofbuilding interiors. In [4], the authors proposed a 3D buildingreconstruction from a 2D floorplan image. With the help of a
2011 International Conference on 3D Imaging, Modeling, Processing, Visualization and Transmission
978-0-7695-4369-7/11 $26.00 © 2011 IEEE
DOI 10.1109/3DIMPVT.2011.23
124
Data acquisition
Slabpartitioning
Slab projection
Input scene Point cloud Volumetric slabs 2D Slice Keyslice detection /Boundary vectorization
Taperdetection
Extruded keyslicesTapered faces
ExtrusionRendering
Output model Keyslices
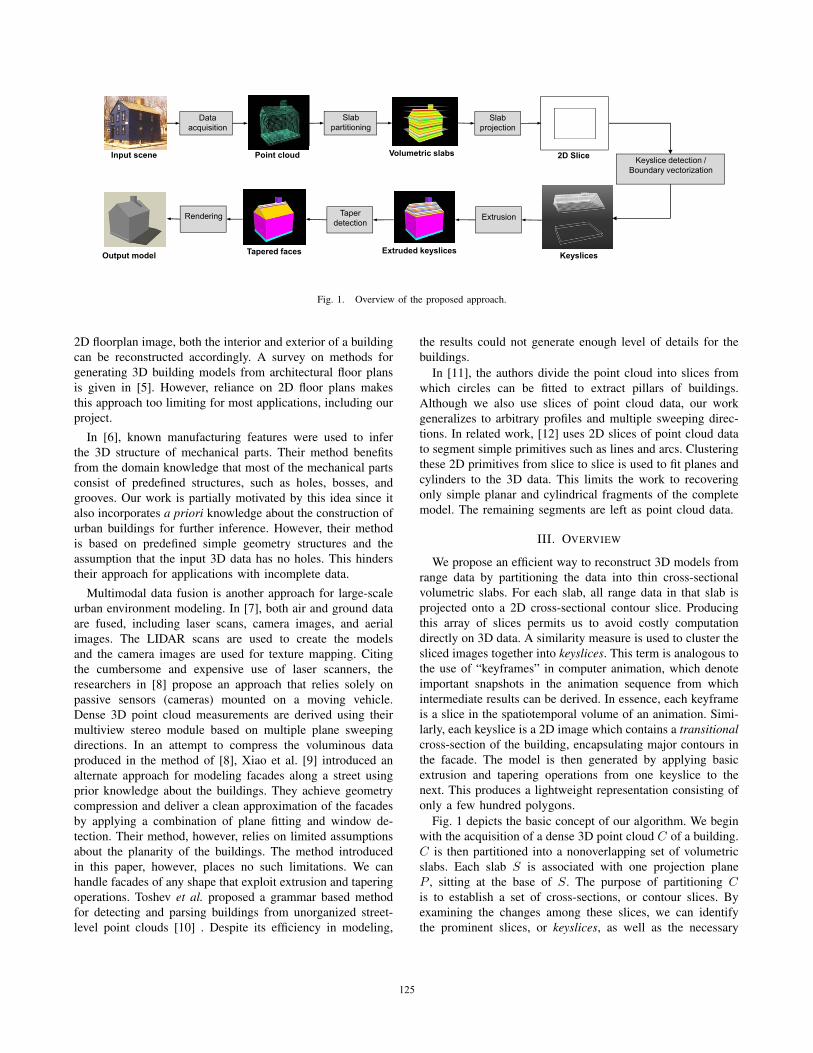
Fig. 1. Overview of the proposed approach.
2D floorplan image, both the interior and exterior of a buildingcan be reconstructed accordingly. A survey on methods forgenerating 3D building models from architectural floor plansis given in [5]. However, reliance on 2D floor plans makesthis approach too limiting for most applications, including ourproject.
In [6], known manufacturing features were used to inferthe 3D structure of mechanical parts. Their method benefitsfrom the domain knowledge that most of the mechanical partsconsist of predefined structures, such as holes, bosses, andgrooves. Our work is partially motivated by this idea since italso incorporates a priori knowledge about the construction ofurban buildings for further inference. However, their methodis based on predefined simple geometry structures and theassumption that the input 3D data has no holes. This hinderstheir approach for applications with incomplete data.
Multimodal data fusion is another approach for large-scaleurban environment modeling. In [7], both air and ground dataare fused, including laser scans, camera images, and aerialimages. The LIDAR scans are used to create the modelsand the camera images are used for texture mapping. Citingthe cumbersome and expensive use of laser scanners, theresearchers in [8] propose an approach that relies solely onpassive sensors (cameras) mounted on a moving vehicle.Dense 3D point cloud measurements are derived using theirmultiview stereo module based on multiple plane sweepingdirections. In an attempt to compress the voluminous dataproduced in the method of [8], Xiao et al. [9] introduced analternate approach for modeling facades along a street usingprior knowledge about the buildings. They achieve geometrycompression and deliver a clean approximation of the facadesby applying a combination of plane fitting and window de-tection. Their method, however, relies on limited assumptionsabout the planarity of the buildings. The method introducedin this paper, however, places no such limitations. We canhandle facades of any shape that exploit extrusion and taperingoperations. Toshev et al. proposed a grammar based methodfor detecting and parsing buildings from unorganized street-level point clouds [10] . Despite its efficiency in modeling,
the results could not generate enough level of details for thebuildings.
In [11], the authors divide the point cloud into slices fromwhich circles can be fitted to extract pillars of buildings.Although we also use slices of point cloud data, our workgeneralizes to arbitrary profiles and multiple sweeping direc-tions. In related work, [12] uses 2D slices of point cloud datato segment simple primitives such as lines and arcs. Clusteringthese 2D primitives from slice to slice is used to fit planes andcylinders to the 3D data. This limits the work to recoveringonly simple planar and cylindrical fragments of the completemodel. The remaining segments are left as point cloud data.
III. OVERVIEW
We propose an efficient way to reconstruct 3D models fromrange data by partitioning the data into thin cross-sectionalvolumetric slabs. For each slab, all range data in that slab isprojected onto a 2D cross-sectional contour slice. Producingthis array of slices permits us to avoid costly computationdirectly on 3D data. A similarity measure is used to cluster thesliced images together into keyslices. This term is analogous tothe use of “keyframes” in computer animation, which denoteimportant snapshots in the animation sequence from whichintermediate results can be derived. In essence, each keyframeis a slice in the spatiotemporal volume of an animation. Simi-larly, each keyslice is a 2D image which contains a transitionalcross-section of the building, encapsulating major contours inthe facade. The model is then generated by applying basicextrusion and tapering operations from one keyslice to thenext. This produces a lightweight representation consisting ofonly a few hundred polygons.
Fig. 1 depicts the basic concept of our algorithm. We beginwith the acquisition of a dense 3D point cloud C of a building.C is then partitioned into a nonoverlapping set of volumetricslabs. Each slab S is associated with one projection planeP , sitting at the base of S. The purpose of partitioning Cis to establish a set of cross-sections, or contour slices. Byexamining the changes among these slices, we can identifythe prominent slices, or keyslices, as well as the necessary
125

Major Plane Detection
3D DataGeneration & Acquisition
Pre-processing
Dataset Segmentation
2D Slice Extraction & Enhancement
Post-processing
Model Visualization
Model Generation
Lightweight 3D ReconstructionKeysliceDetection
Tapering Detection
Boundary Vectorization
More Segments?
N
Y
Window Detection
Window Installation
Fig. 2. The flow diagram of the system.
extrusion and tapering operations that must apply to themto generate the model. By casting this 3D modeling taskinto a series of 2D operations, we reduce the dimension ofthe problem to achieve a significant savings in computationalcomplexity.
The modular flow diagram for our system is shown in Fig. 2.The whole system consists of three stages of computation. Inthe first pre-processing stage, 2D slices are extracted fromthe heavy 3D range data and are enhanced by noise removaland the filling of missing data. The segmentation module isthen carried out to divide the complicated 3D dataset intosimpler segments. The second stage is iteratively applied toeach segment, including window detection, keyslice detection,boundary vectorization, and tapering detection. The final stagereconstructs each segment and assembles them into a wholemodel.
IV. PREPROCESSING THE RANGE DATA
The input to our system is range data assembled as a3D point cloud. We have registered the voluminous 3D dataacquired from multiple scans of buildings using the algorithmin [13]. That same algorithm is also responsible for extractingthe major axes of the building in order to align it to theaxes of the world coordinate system. This is necessary toproperly infer the keyslices. Fig. 3(b) displays a properlyaligned, registered 3D point cloud.
(a) (b)
Fig. 3. (a) Input scene. (b) 3D point cloud of scene assembled by registering14 scans, each having one million points.
In addition to real data, we also generated some syntheticdatasets for experiments. These synthetic datasets were sam-pled from 3D building models containing 3D faces and theirnormals, which were downloaded from Google 3D warehouse.The first two rows of Fig. 9 show two such models and their3D point clouds in (a) and (b), respectively.
A. Major Plane Detection
The input to our system consists of unorganized 3D pointclouds. We solve for the major planes, whose normals are thesweeping directions from which to extract 2D slices. Theseslices are the starting point for segmentation and windowdetection. We used moving least squares (MLS) for derivinga smooth plane from a set of neighboring data points in spacefor normal computation. After the normal is computed foreach 3D point, the Hough transform was used to identifythe major plane normals based on voting [14]. These normalswill determine the orientation of the cross-sections that sweepthrough the PCD.
B. Extraction of 2D Slices
We consider the PCD as a large array of 3D points to besliced into equispaced parallel volumetric slabs. All 3D pointswithin each slab are projected onto a projection plane, or slice,at the base of the slab. Fig. 4(a) shows the 3D point cloud inFig. 3(b) partitioned into 50 slabs. The projected 3D points ineach slab form cross-sectional contour slices. Fig. 5 depictsfour such slices, associated with the four displayed projectionplanes of Fig. 4(a).
Fig. 4. (a) The 3D point cloud of Fig. 3(b) partitioned into uniform volumetricslabs. The 3D points in each slab are projected onto a projection plane to formcross-sectional slices. Four such planes are shown; (b) Segmentation result ofFig. 3(b).
(a) (b)
(c) (d)
Fig. 5. The set of slices corresponding to the four projection planes inFig. 4(a).
126
Without loss of generality, the y−axis is used to representthe bottom-up direction. Over each slab in height range[Hlo, Hhi), we project the 3D data P (x, y, z), for Hlo ≤ y <Hhi, onto a 2D image slice. The projection is normalized inthe range [0,W ], where W is the image width:
[x2D, y2D ]T = ω · [x3Di −XMIN , z3Di − ZMIN ]T (1)
Note that ω = W/(XMAX − XMIN ), and that the [XMIN ,XMAX ] and [ZMIN , ZMAX ] pairs define the 3D boundingbox, which can be obtained through user input and can be usedto clip away noise data. Fig. 5(a)-(d) show some examples ofthe 2D slices, where noise and incomplete data are observed.We repeatedly sweep through the volume to extract parallelvolumetric slabs along the directions of the major planenormals computed in Sec. IV-A. Fig. 8, for example, depictsslices extracted from the side view.
C. Filling Missing Data
Extracted slices often have missing data due to occlusion orother visibility issues. Fortunately, most urban buildings havesymmetry that we can exploit to fill these gaps. Symmetrycomputation on 3D data is expensive [15], so we conductthis computation on the 2D image slices. Since the 3D datahas been already rectified during the registration process andprojected onto 2D slices [13], symmetry computation now onlyneeds 2D translation. Let P (x, y) be a point on the originalimage I and P ′(x′, y′) be the reflected point of P with respectto a symmetry line L. The symmetry computation equation forL is as follows:
L = argminx,y
∑dx,y(P
′, I) (2)
where dx,y(P′, I) is the distance between the self-reflected
point P ′ and its nearest data point in image I . The reflectedpoint P ′ of the original point P is computed with respect to aline along either the x− or y− axis. Therefore, the symmetryline L is obtained as the line with minimum summation errorover the reflected data points. Fig. 6(a) and Fig. 6(b) depictthe original input with missing data, and the output after gapfilling using symmetry computation, respectively.
(a) (b)
Fig. 6. Symmetry-based gap filling. (a) Original 2D slice image and (b)output image after gap filling.
D. Dataset Segmentation
Modeling the PCD of a building as a whole structuresimultaneously is complicated due to the natural complexity ofbuildings. To simplify this problem, we utilize the divide andconquer strategy to segment the whole PCD into simpler parts.Each of these parts can be easily represented by extrusion/taper
operations. 3D PCD segmentation is generally performedusing region based methods, although their computational costmay be high. We propose an efficient segmentation approachbased on the observation that different parts of a buildingare usually separated by walls, ledges, and other architecturalelements. These “separators” provide segmentation clues.
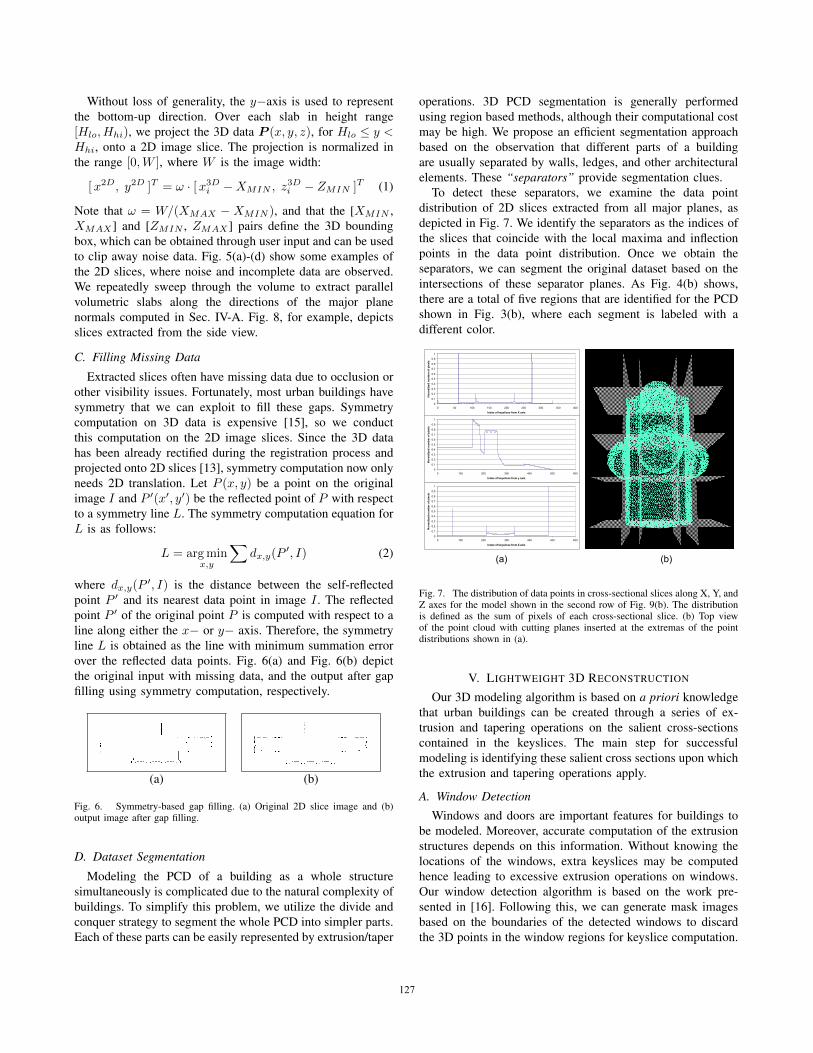
To detect these separators, we examine the data pointdistribution of 2D slices extracted from all major planes, asdepicted in Fig. 7. We identify the separators as the indices ofthe slices that coincide with the local maxima and inflectionpoints in the data point distribution. Once we obtain theseparators, we can segment the original dataset based on theintersections of these separator planes. As Fig. 4(b) shows,there are a total of five regions that are identified for the PCDshown in Fig. 3(b), where each segment is labeled with adifferent color.
0
0.1
0.2
0.3
0.4
0.5
0.6
0.7
0.8
0.9
1
0 50 100 150 200 250 300 350 400
Index of keyslices from X axis
Nor
mal
ized
num
ber o
f pix
els
0
0.1
0.2
0.3
0.4
0.5
0.6
0.7
0.8
0.9
1
0 100 200 300 400 500 600
Index of keyslices from y axis
Nor
mal
ized
num
ber o
f pix
els
0
0.1
0.2
0.3
0.4
0.5
0.6
0.7
0.8
0.9
1
0 100 200 300 400 500 600
Index of keyslices from Z axis
Nor
mal
ized
num
ber o
f pix
els
(a) (b)
Fig. 7. The distribution of data points in cross-sectional slices along X, Y, andZ axes for the model shown in the second row of Fig. 9(b). The distributionis defined as the sum of pixels of each cross-sectional slice. (b) Top viewof the point cloud with cutting planes inserted at the extremas of the pointdistributions shown in (a).
V. LIGHTWEIGHT 3D RECONSTRUCTION
Our 3D modeling algorithm is based on a priori knowledgethat urban buildings can be created through a series of ex-trusion and tapering operations on the salient cross-sectionscontained in the keyslices. The main step for successfulmodeling is identifying these salient cross sections upon whichthe extrusion and tapering operations apply.
A. Window Detection
Windows and doors are important features for buildings tobe modeled. Moreover, accurate computation of the extrusionstructures depends on this information. Without knowing thelocations of the windows, extra keyslices may be computedhence leading to excessive extrusion operations on windows.Our window detection algorithm is based on the work pre-sented in [16]. Following this, we can generate mask imagesbased on the boundaries of the detected windows to discardthe 3D points in the window regions for keyslice computation.
127

During the window and door detection step, we retain theboundary, position, and depth of the windows. After the facadeis extruded from one keyslice to the next (see Sec. V-B), weproject the boundary of the window/door onto the extrudedfacade. This projected boundary is pushed into the facade inthe opposite direction of the face normal up to the recovereddepth of the window. This action significantly reduces thenumber of polygons from the model.
B. Keyslice Detection
The 2D image slices of an extruded region are similar toeach other. Thus, to detect the keyslices that delimit extrudedregions one only needs to compute the similarity betweenadjacent slices. We adopted a light-weighted global and effi-cient key image detection approach based on distance functionsimilar to Hausdorff distance as the similarity measure. LetPr(xr, yr) and Pi(xi, yi) be a data point in a referenceimage and a new observed image I , respectively. The distancefunction of image I to reference image Ir is defined as:
dH(I, Ir) =N∑i=0
dmin(Pi, Ir) (3)
where dmin(Pi, Ir) is the minimum distance from Pi in imageI to the reference image Ir. Alternatively, we can also definethe distance, dH(Ir, I), from Ir to a new observed imageI , using Eq. (3). These two distances are usually not equalto each other. As a rule of thumb, one can choose dHD =MAX{dH(I, Ir), dH(Ir, I)} as the distance. To compute thekeyslices, a threshold τd is used for the distance dHD. IfdHD < τd, the two images I and Ir are considered similarto each other. Otherwise, a keyslice image is found and Ir isupdated with I , the new keyslice image.
The accuracy of the keyslices detected by using the distancefunction is closely tied to threshold τd. Small τd leads tomore accurate models and will require more time and spaceto compute and store the result. When the threshold τd is rela-tively large, potential keyslices which contain salient structuremay be missed. Therefore, there is a trade-off between modelaccuracy and time-space efficiency. To address this problem,the curvature information is computed as a complementarycriteria for keyslice detection.
This idea is based on the observation that the keyslicesare generally located at large curvature changes along 2Dslices extracted in the orthogonal direction (e.g., side view), asshown in Fig. 8. Therefore, instead of computing the differencebetween two images directly, we compute the curvature oforthogonal 2D slices, map the positions of curvature extremaback to cross-sections in the original set of volumetric slabs,and mark these cross-sections as keyslices.
To compute the curvature, we first apply the slice extractionalgorithm described in Sec. IV-B to obtain a series of 2D cross-sectional images in the orthogonal direction. We then apply theball-pivoting algorithm described in Sec. V-C to vectorize theboundary for each sliced image. We locate those curvaturesthat appear in most of the sliced images as the places where
curvature for slice i curvature for slice j
(a) (b)average curvature
(c)
Fig. 8. Curvature-based key slice detection. (a,b) Two 2D sliced imagesfrom the orthogonal direction (side view). A plot of the curvature of eachslice is displayed alongside. (c) A plot of the average curvatures detectedover all of the sliced images along the orthogonal direction. Thresholdingthe curvature yields the location of keyslices, displayed alongside the plot.Red lines along the average curvature plot indicate local maxima. Blue andgreen lines, respectively, indicate zero-crossings in the average curvature. Thisdelineates the keyslice positions.
keyslices are found, as shown in Fig. 8(c). The combinationof similarity measure and curvature inference ensures that thesalient structures of a building will be preserved.
C. Boundary Vectorization
After the keyslices are detected, K keyslices will be identi-fied from a total of A image slices. Depending on the thresholdτd, K is usually about one to two orders of magnitude smallerthan A, e.g., K/A is 0.06 when τd = 4.0 for the example inFig. 3(b). To generate the 3D model, these keyslice imagesneed to be vectorized to represent the contours of the buildingfacade. The Douglas-Peucker algorithm attempts to connectall of the existing points to form a polygon [17]. Althoughthe implementation of this approach is very efficient with theimprovement described in [18], this method cannot handlethe case where spurious interior points are present, whichcontributes to outlier data. To tackle this issue, we adaptedthe ball-pivoting algorithm (BPA) [19] from its original useon 3D PCD to use on 2D keyslice images where it producesvectorized boundaries. The key parameter for the BPA algo-rithm to work successfully is to find the right size of the ballfor pivoting. We implemented a coarse-to-fine adaptive BPAalgorithm to solve this problem.
D. Extrusion and Taper Detection
After the keyslices are detected and vectorized, the contoursof the set of K keyslices are used to represent the buildingbased on the extrusion operation. That is, the space betweeneach adjacent pair of keyslices is filled by extruding onekeyslice to the next. By modeling a building using extrusionoperations on the keyslices, we significantly reduce the numberof polygons for urban buildings.
In addition to the extrusion operation, we can furtherimprove the model and reduce the model size based on the
128
observation that part of the keyslice images may belong to thesame tapering structure. The difficulty in inferring taperingstructures is tied to the complexity of a building structureitself. Fortunately, the dataset segmentation module introducedin Sec. IV-D has segmented the complicated structures intosimpler parts. Although the majority of building taperingstructures are linear tapering, such as tapering to point (TTP),a cone shape geometry, and tapering to line (TTL), a wedgeshape, it could also be a complicated non-linear tapering, suchas a dome shape. Furthermore, a structure may look like atapering structure, but it is actually not a real one. For example,a series of small extruded structures form a tapering-like shape.
We introduced a two-step workflow to accomplish the abovegoal. The first step is to locate the potential tapering keyslicesand infer the structure by making an assumption that theunderlying tapering structure is either a TTP or a TTL. Averification step is conducted to check the correctness of theinferred shape by measuring the error between the modeland the corresponding 3D PCD. If the error is small, theinferred shape is confirmed and the underlying keyslices arenot rendered. Otherwise, we can choose to model this specialstructure by fitting a triangular mesh to the underlying 3Dpoint cloud to produce a polygonal model. This algorithmcannot model a sphere or a dome because such structure cannotbe linearly interpolated as a taper operation.
VI. EXPERIMENTAL RESULTS
To generate the final 3D model, the control points of the 2Dcontours can be transformed back into 3D world coordinatesystem using the reverse matrix T in equation Eq. (1). For eachsegment, we first exam whether it can be modeled by simplekeyslices along any major plane. If so, the push-pull operationis applied to the keyslice contours to generate the extrudedmodel. If a tapering structure is detected, we construct thefaces based on the control points of the 2D base geometrypolygon and their corresponding converged points to createthe tapering model.
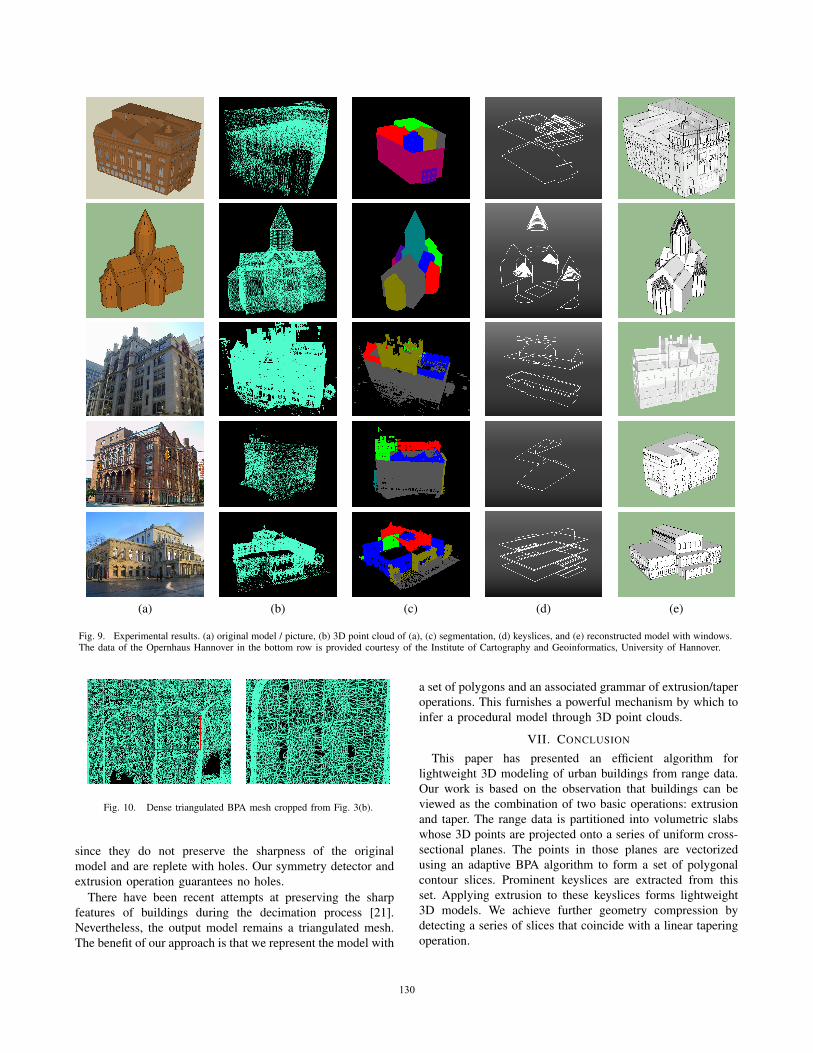
Fig. 9 shows the experimental results for both synthetic (thefirst two rows) and real datasets (the last three rows). Eachrow shows a reconstruction of a building. The snapshot ofthe original model or the image of the real building is shownin (a), followed by the snapshot of 3D PCD in (b). Columns(c)-(e) depict the segmentation result, the vectorized keyslices,and the snapshot of the reconstructed model, respectively.
To measure the error of a reconstructed 3D model, we firsttransform it to the 3D coordinate system. The error E ismeasured as the distance between the 3D points in the cloudto their closest planes in the reconstructed model M :
E =1
|X|∑x∈X
d(x,M) (4)
where X is the set of 3D points, and distance d(x,M) =minp∈M‖x − p‖ is the minimum Euclidean distance from a3D point x to its closest face p of M .
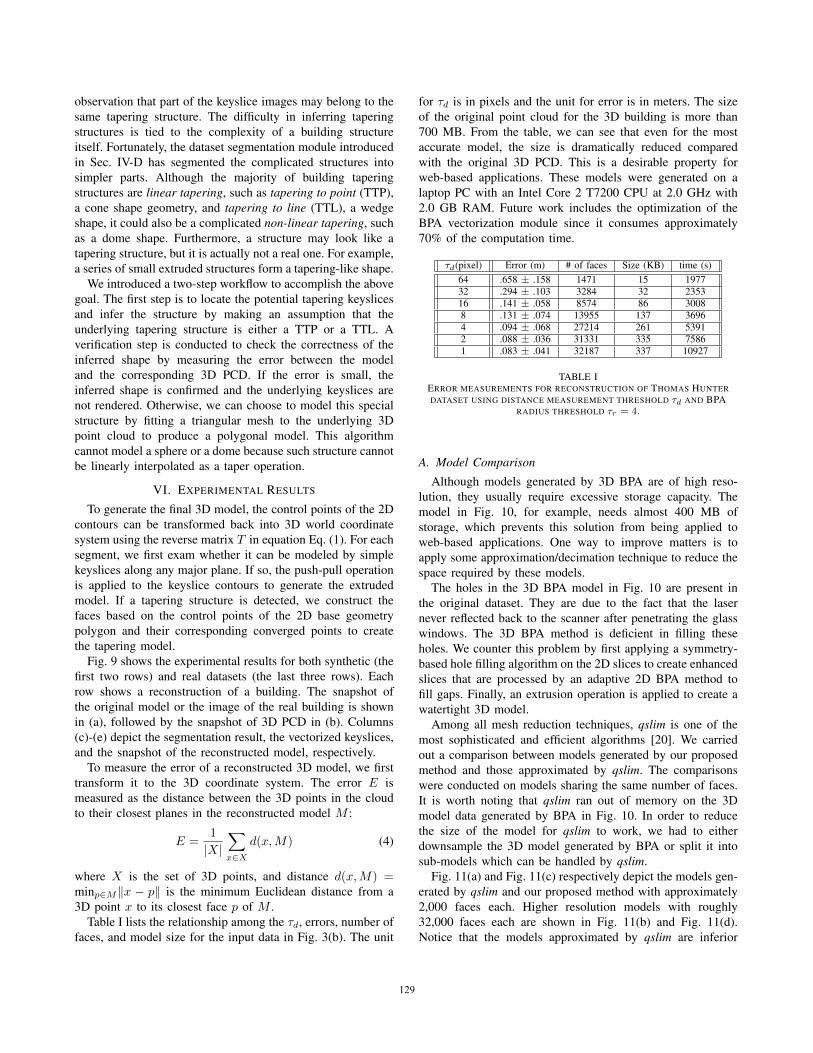
Table I lists the relationship among the τd, errors, number offaces, and model size for the input data in Fig. 3(b). The unit
for τd is in pixels and the unit for error is in meters. The sizeof the original point cloud for the 3D building is more than700 MB. From the table, we can see that even for the mostaccurate model, the size is dramatically reduced comparedwith the original 3D PCD. This is a desirable property forweb-based applications. These models were generated on alaptop PC with an Intel Core 2 T7200 CPU at 2.0 GHz with2.0 GB RAM. Future work includes the optimization of theBPA vectorization module since it consumes approximately70% of the computation time.
τd(pixel) Error (m) # of faces Size (KB) time (s)64 .658 ± .158 1471 15 197732 .294 ± .103 3284 32 235316 .141 ± .058 8574 86 30088 .131 ± .074 13955 137 36964 .094 ± .068 27214 261 53912 .088 ± .036 31331 335 75861 .083 ± .041 32187 337 10927
TABLE IERROR MEASUREMENTS FOR RECONSTRUCTION OF THOMAS HUNTERDATASET USING DISTANCE MEASUREMENT THRESHOLD τd AND BPA
RADIUS THRESHOLD τr = 4.
A. Model Comparison
Although models generated by 3D BPA are of high reso-lution, they usually require excessive storage capacity. Themodel in Fig. 10, for example, needs almost 400 MB ofstorage, which prevents this solution from being applied toweb-based applications. One way to improve matters is toapply some approximation/decimation technique to reduce thespace required by these models.
The holes in the 3D BPA model in Fig. 10 are present inthe original dataset. They are due to the fact that the lasernever reflected back to the scanner after penetrating the glasswindows. The 3D BPA method is deficient in filling theseholes. We counter this problem by first applying a symmetry-based hole filling algorithm on the 2D slices to create enhancedslices that are processed by an adaptive 2D BPA method tofill gaps. Finally, an extrusion operation is applied to create awatertight 3D model.
Among all mesh reduction techniques, qslim is one of themost sophisticated and efficient algorithms [20]. We carriedout a comparison between models generated by our proposedmethod and those approximated by qslim. The comparisonswere conducted on models sharing the same number of faces.It is worth noting that qslim ran out of memory on the 3Dmodel data generated by BPA in Fig. 10. In order to reducethe size of the model for qslim to work, we had to eitherdownsample the 3D model generated by BPA or split it intosub-models which can be handled by qslim.
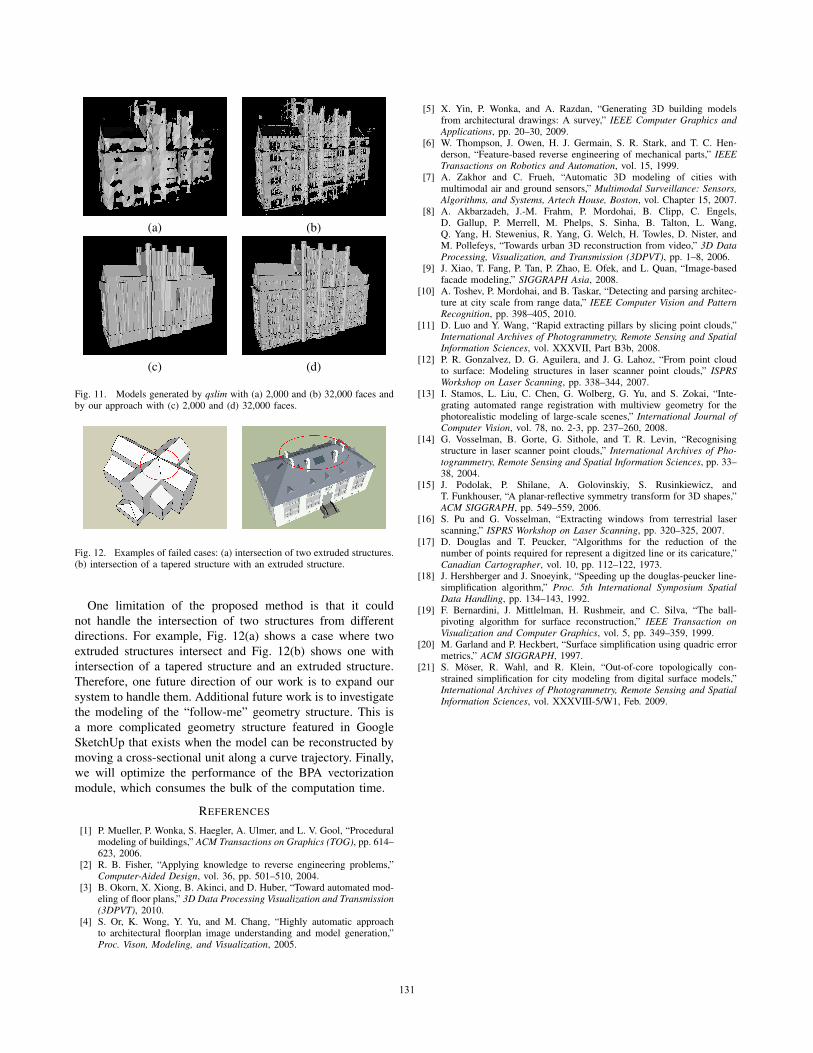
Fig. 11(a) and Fig. 11(c) respectively depict the models gen-erated by qslim and our proposed method with approximately2,000 faces each. Higher resolution models with roughly32,000 faces each are shown in Fig. 11(b) and Fig. 11(d).Notice that the models approximated by qslim are inferior
129
(a) (b) (c) (d) (e)
Fig. 9. Experimental results. (a) original model / picture, (b) 3D point cloud of (a), (c) segmentation, (d) keyslices, and (e) reconstructed model with windows.The data of the Opernhaus Hannover in the bottom row is provided courtesy of the Institute of Cartography and Geoinformatics, University of Hannover.
Fig. 10. Dense triangulated BPA mesh cropped from Fig. 3(b).
since they do not preserve the sharpness of the originalmodel and are replete with holes. Our symmetry detector andextrusion operation guarantees no holes.
There have been recent attempts at preserving the sharpfeatures of buildings during the decimation process [21].Nevertheless, the output model remains a triangulated mesh.The benefit of our approach is that we represent the model with
a set of polygons and an associated grammar of extrusion/taperoperations. This furnishes a powerful mechanism by which toinfer a procedural model through 3D point clouds.
VII. CONCLUSION
This paper has presented an efficient algorithm forlightweight 3D modeling of urban buildings from range data.Our work is based on the observation that buildings can beviewed as the combination of two basic operations: extrusionand taper. The range data is partitioned into volumetric slabswhose 3D points are projected onto a series of uniform cross-sectional planes. The points in those planes are vectorizedusing an adaptive BPA algorithm to form a set of polygonalcontour slices. Prominent keyslices are extracted from thisset. Applying extrusion to these keyslices forms lightweight3D models. We achieve further geometry compression bydetecting a series of slices that coincide with a linear taperingoperation.
130
(a) (b)
(c) (d)
Fig. 11. Models generated by qslim with (a) 2,000 and (b) 32,000 faces andby our approach with (c) 2,000 and (d) 32,000 faces.
Fig. 12. Examples of failed cases: (a) intersection of two extruded structures.(b) intersection of a tapered structure with an extruded structure.
One limitation of the proposed method is that it couldnot handle the intersection of two structures from differentdirections. For example, Fig. 12(a) shows a case where twoextruded structures intersect and Fig. 12(b) shows one withintersection of a tapered structure and an extruded structure.Therefore, one future direction of our work is to expand oursystem to handle them. Additional future work is to investigatethe modeling of the “follow-me” geometry structure. This isa more complicated geometry structure featured in GoogleSketchUp that exists when the model can be reconstructed bymoving a cross-sectional unit along a curve trajectory. Finally,we will optimize the performance of the BPA vectorizationmodule, which consumes the bulk of the computation time.
REFERENCES
[1] P. Mueller, P. Wonka, S. Haegler, A. Ulmer, and L. V. Gool, “Proceduralmodeling of buildings,” ACM Transactions on Graphics (TOG), pp. 614–623, 2006.
[2] R. B. Fisher, “Applying knowledge to reverse engineering problems,”Computer-Aided Design, vol. 36, pp. 501–510, 2004.
[3] B. Okorn, X. Xiong, B. Akinci, and D. Huber, “Toward automated mod-eling of floor plans,” 3D Data Processing Visualization and Transmission(3DPVT), 2010.
[4] S. Or, K. Wong, Y. Yu, and M. Chang, “Highly automatic approachto architectural floorplan image understanding and model generation,”Proc. Vison, Modeling, and Visualization, 2005.
[5] X. Yin, P. Wonka, and A. Razdan, “Generating 3D building modelsfrom architectural drawings: A survey,” IEEE Computer Graphics andApplications, pp. 20–30, 2009.
[6] W. Thompson, J. Owen, H. J. Germain, S. R. Stark, and T. C. Hen-derson, “Feature-based reverse engineering of mechanical parts,” IEEETransactions on Robotics and Automation, vol. 15, 1999.
[7] A. Zakhor and C. Frueh, “Automatic 3D modeling of cities withmultimodal air and ground sensors,” Multimodal Surveillance: Sensors,Algorithms, and Systems, Artech House, Boston, vol. Chapter 15, 2007.
[8] A. Akbarzadeh, J.-M. Frahm, P. Mordohai, B. Clipp, C. Engels,D. Gallup, P. Merrell, M. Phelps, S. Sinha, B. Talton, L. Wang,Q. Yang, H. Stewenius, R. Yang, G. Welch, H. Towles, D. Nister, andM. Pollefeys, “Towards urban 3D reconstruction from video,” 3D DataProcessing, Visualization, and Transmission (3DPVT), pp. 1–8, 2006.
[9] J. Xiao, T. Fang, P. Tan, P. Zhao, E. Ofek, and L. Quan, “Image-basedfacade modeling,” SIGGRAPH Asia, 2008.
[10] A. Toshev, P. Mordohai, and B. Taskar, “Detecting and parsing architec-ture at city scale from range data,” IEEE Computer Vision and PatternRecognition, pp. 398–405, 2010.
[11] D. Luo and Y. Wang, “Rapid extracting pillars by slicing point clouds,”International Archives of Photogrammetry, Remote Sensing and SpatialInformation Sciences, vol. XXXVII, Part B3b, 2008.
[12] P. R. Gonzalvez, D. G. Aguilera, and J. G. Lahoz, “From point cloudto surface: Modeling structures in laser scanner point clouds,” ISPRSWorkshop on Laser Scanning, pp. 338–344, 2007.
[13] I. Stamos, L. Liu, C. Chen, G. Wolberg, G. Yu, and S. Zokai, “Inte-grating automated range registration with multiview geometry for thephotorealistic modeling of large-scale scenes,” International Journal ofComputer Vision, vol. 78, no. 2-3, pp. 237–260, 2008.
[14] G. Vosselman, B. Gorte, G. Sithole, and T. R. Levin, “Recognisingstructure in laser scanner point clouds,” International Archives of Pho-togrammetry, Remote Sensing and Spatial Information Sciences, pp. 33–38, 2004.
[15] J. Podolak, P. Shilane, A. Golovinskiy, S. Rusinkiewicz, andT. Funkhouser, “A planar-reflective symmetry transform for 3D shapes,”ACM SIGGRAPH, pp. 549–559, 2006.
[16] S. Pu and G. Vosselman, “Extracting windows from terrestrial laserscanning,” ISPRS Workshop on Laser Scanning, pp. 320–325, 2007.
[17] D. Douglas and T. Peucker, “Algorithms for the reduction of thenumber of points required for represent a digitzed line or its caricature,”Canadian Cartographer, vol. 10, pp. 112–122, 1973.
[18] J. Hershberger and J. Snoeyink, “Speeding up the douglas-peucker line-simplification algorithm,” Proc. 5th International Symposium SpatialData Handling, pp. 134–143, 1992.
[19] F. Bernardini, J. Mittlelman, H. Rushmeir, and C. Silva, “The ball-pivoting algorithm for surface reconstruction,” IEEE Transaction onVisualization and Computer Graphics, vol. 5, pp. 349–359, 1999.
[20] M. Garland and P. Heckbert, “Surface simplification using quadric errormetrics,” ACM SIGGRAPH, 1997.
[21] S. Moser, R. Wahl, and R. Klein, “Out-of-core topologically con-strained simplification for city modeling from digital surface models,”International Archives of Photogrammetry, Remote Sensing and SpatialInformation Sciences, vol. XXXVIII-5/W1, Feb. 2009.
131