Embed Size (px)
Citation preview
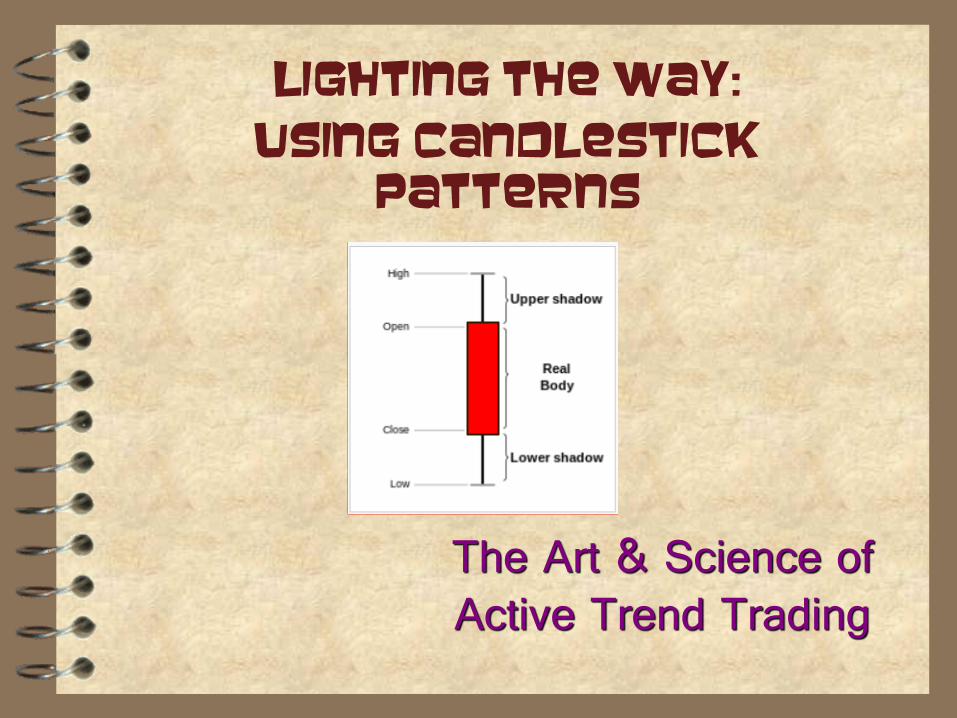
Lighting the Way:
Using Candlestick Patterns
The Art & Science of Active Trend Trading

Disclaimer
• U.S. Government Required Disclaimer – Commodity Futures Trading Commission Futures
and Options trading has large potential rewards, but also large potential risk. You must be aware
of the risks and be willing to accept them in order to invest in the futures and options markets.
Don’t trade with money you can’t afford to lose. This is neither a solicitation nor an offer to
Buy/Sell futures or options. No representation is being made that any account will or is likely to
achieve profits or losses similar to those discussed in this training. The past performance of any
trading system or methodology is not necessarily indicative of future results.
• CFTC RULE 4.41 – HYPOTHETICAL OR SIMULATED PERFORMANCE RESULTS HAVE CERTAIN
LIMITATIONS. UNLIKE AN ACTUAL PERFORMANCE RECORD, SIMULATED RESULTS DO NOT
REPRESENT ACTUAL TRADING. ALSO, SINCE THE TRADES HAVE NOT BEEN EXECUTED, THE
RESULTS MAY HAVE UNDER-OR-OVER COMPENSATED FOR THE IMPACT, IF ANY, OF CERTAIN
MARKET FACTORS, SUCH AS LACK OF LIQUIDITY. SIMULATED TRADING PROGRAMS IN
GENERAL ARE ALSO SUBJECT TO THE FACT THAT THEY ARE DESIGNED WITH THE BENEFIT OF
HINDSIGHT. NO REPRESENTATION IS BEING MADE THAT ANY ACCOUNT WILL OR IS LIKELY
TO ACHIEVE PROFIT OR LOSSES SIMILAR TO THOSE SHOWN.
• All Materials presented are for training purposes only . Traders should paper trade any new method prior to risk of
personal capital.
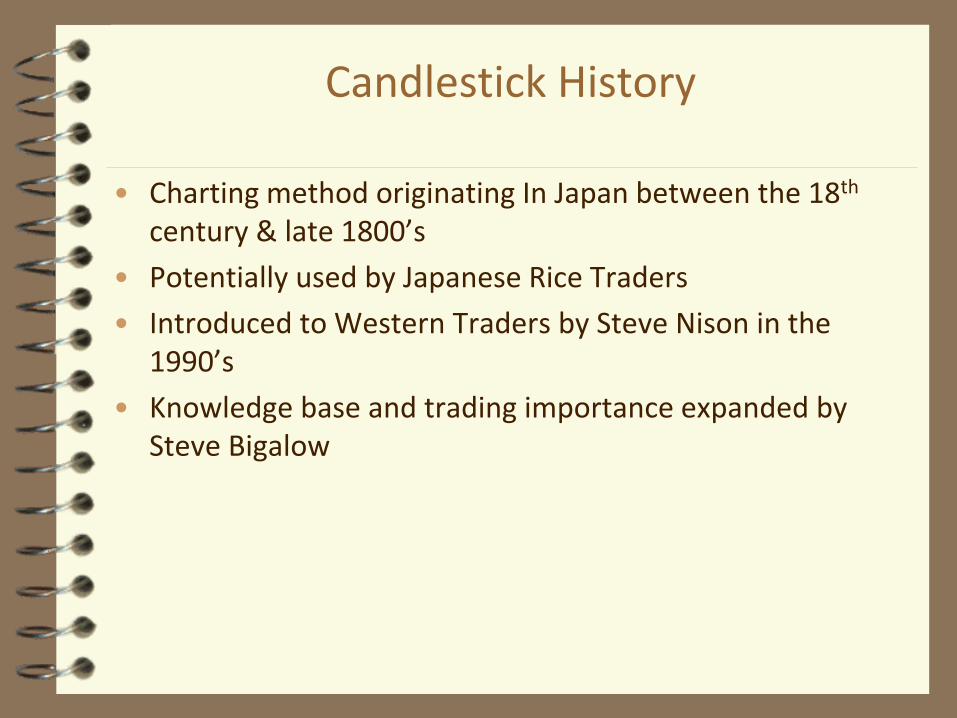
Candlestick History
• Charting method originating In Japan between the 18th century & late 1800’s
• Potentially used by Japanese Rice Traders
• Introduced to Western Traders by Steve Nison in the 1990’s
• Knowledge base and trading importance expanded by Steve Bigalow
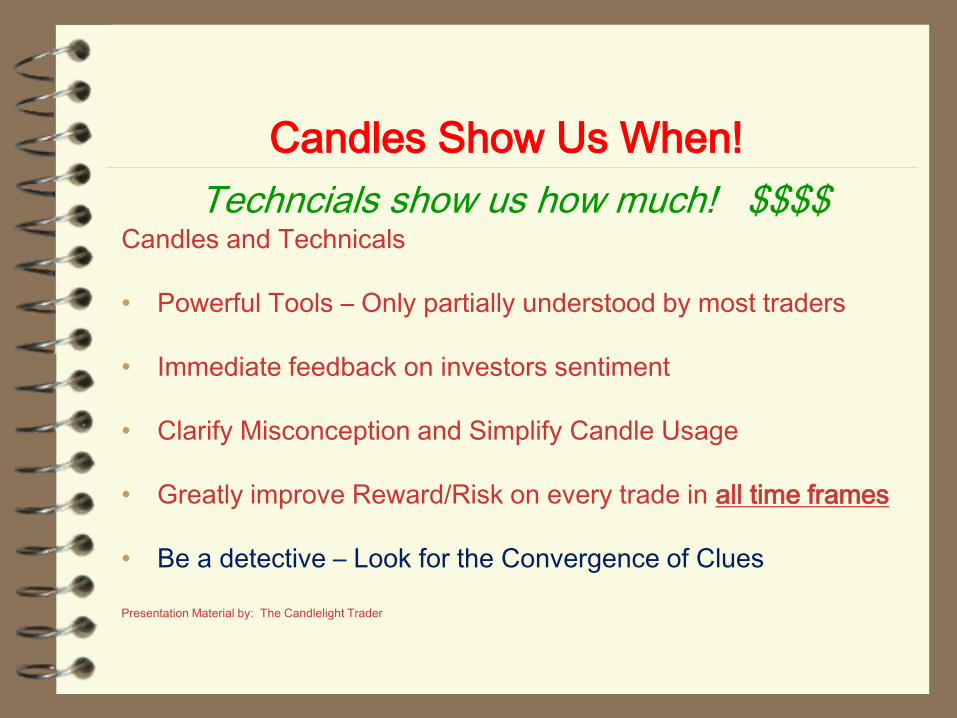
Candles and Technicals
• Powerful Tools – Only partially understood by most traders
• Immediate feedback on investors sentiment
• Clarify Misconception and Simplify Candle Usage
• Greatly improve Reward/Risk on every trade in all time frames
• Be a detective – Look for the Convergence of Clues
Presentation Material by: The Candlelight Trader
Candles Show Us When!
Techncials show us how much! $$$$

Patterns and Trade Set Ups
Part 1
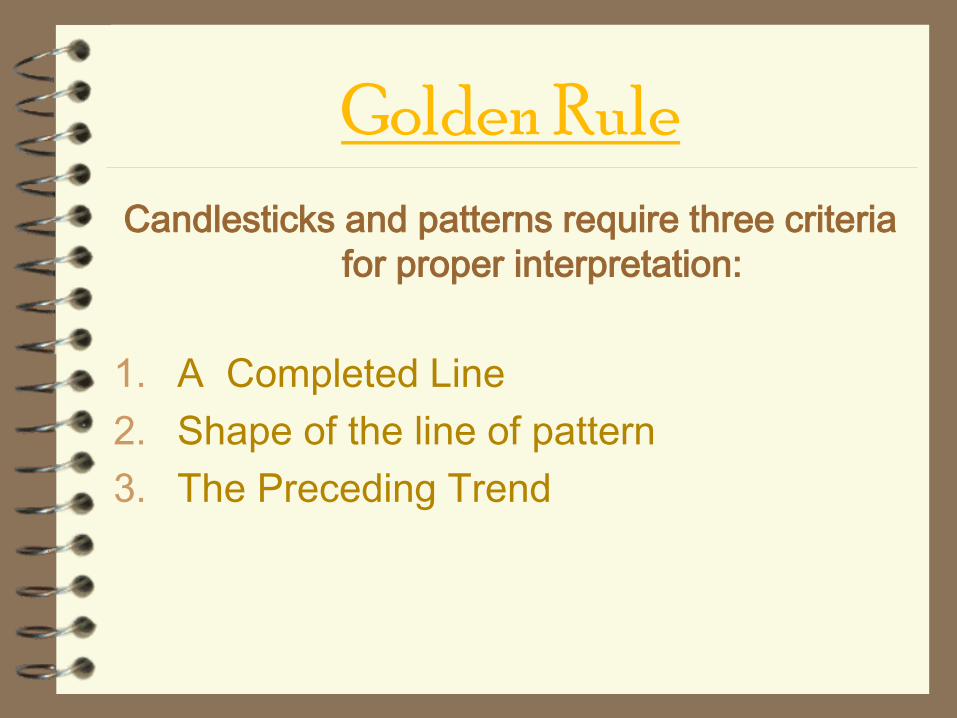
Golden Rule
Candlesticks and patterns require three criteria
for proper interpretation:
1. A Completed Line
2. Shape of the line of pattern
3. The Preceding Trend
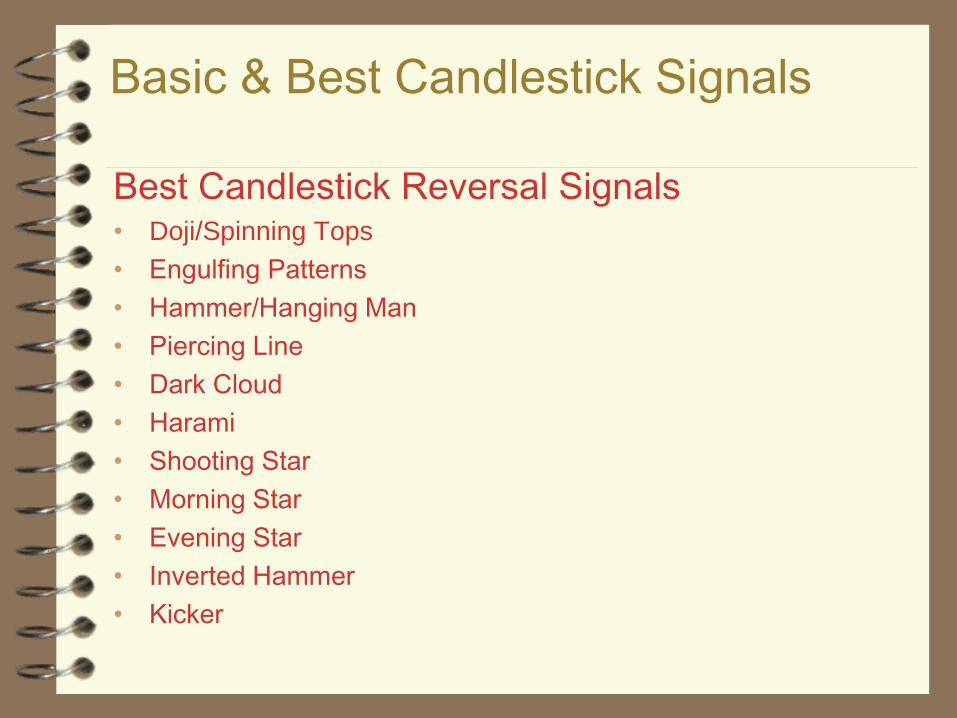
Basic & Best Candlestick Signals
Best Candlestick Reversal Signals • Doji/Spinning Tops
• Engulfing Patterns
• Hammer/Hanging Man
• Piercing Line
• Dark Cloud
• Harami
• Shooting Star
• Morning Star
• Evening Star
• Inverted Hammer
• Kicker

Supporting Clues
Non Candlestick Supporting Clues
• Moving averages (8 EMA, 20 SMA, 50
SMA)
• Trends
• Support/Resistance
• Stochastics (12/3)
• Voided Patterns
• Daily & Weekly Charts
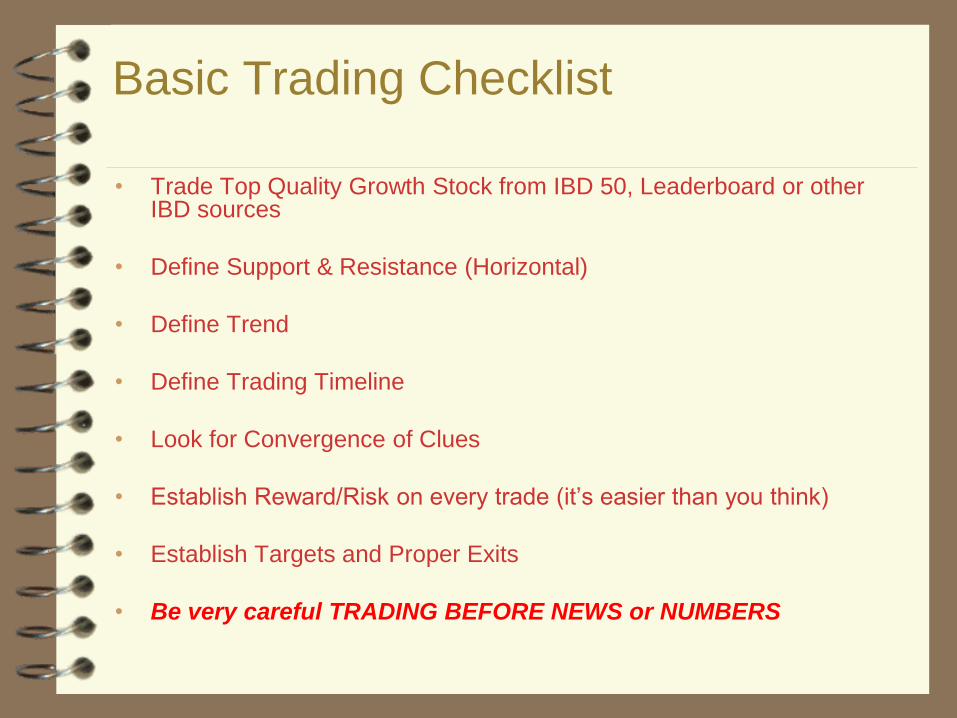
Basic Trading Checklist
• Trade Top Quality Growth Stock from IBD 50, Leaderboard or other IBD sources
• Define Support & Resistance (Horizontal)
• Define Trend
• Define Trading Timeline
• Look for Convergence of Clues
• Establish Reward/Risk on every trade (it’s easier than you think)
• Establish Targets and Proper Exits
• Be very careful TRADING BEFORE NEWS or NUMBERS
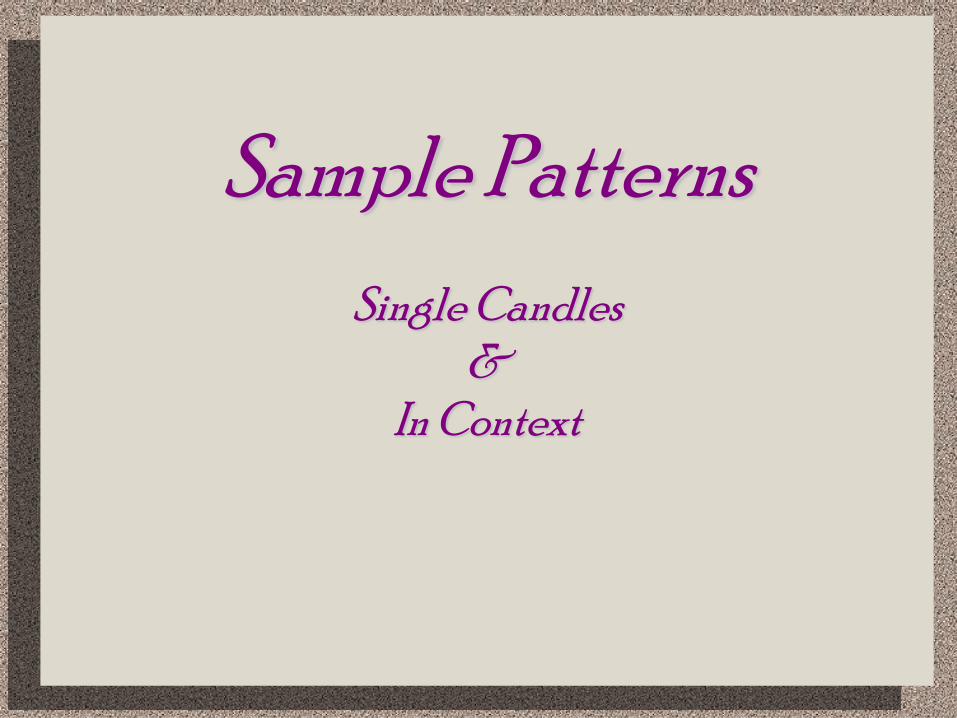
Sample Patterns
Single Candles
&
In Context
- Single Candlesticks tell us immediately, who won the battle
that day (Buyers or Sellers) - This translates to being able to visually determine investor sentiment - What does this do for you and your planning your trades? - In combination with trend, other candles, moving averages, i.e.; other clues they are predictive of potential trend reversals or pauses in existing trend
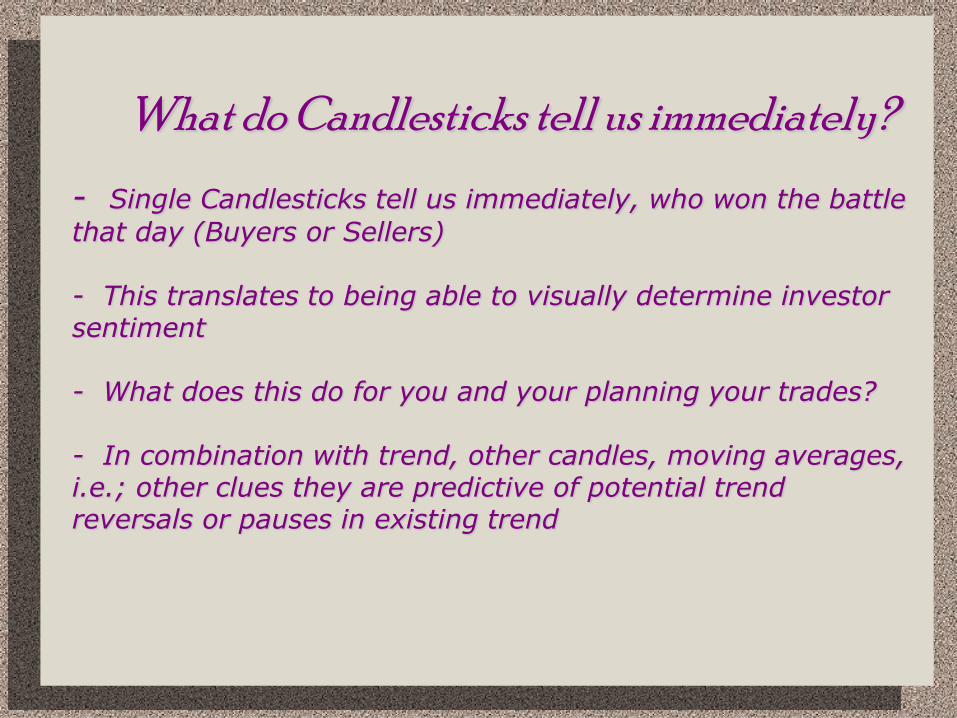
What do Candlesticks tell us immediately?

- Every Single Candlestick tell us immediately, who won the
battle that hour, day, week or month
What do Candlesticks tell us immediately?
Open
Open Close
Close
Buyers Sellers
Low
High
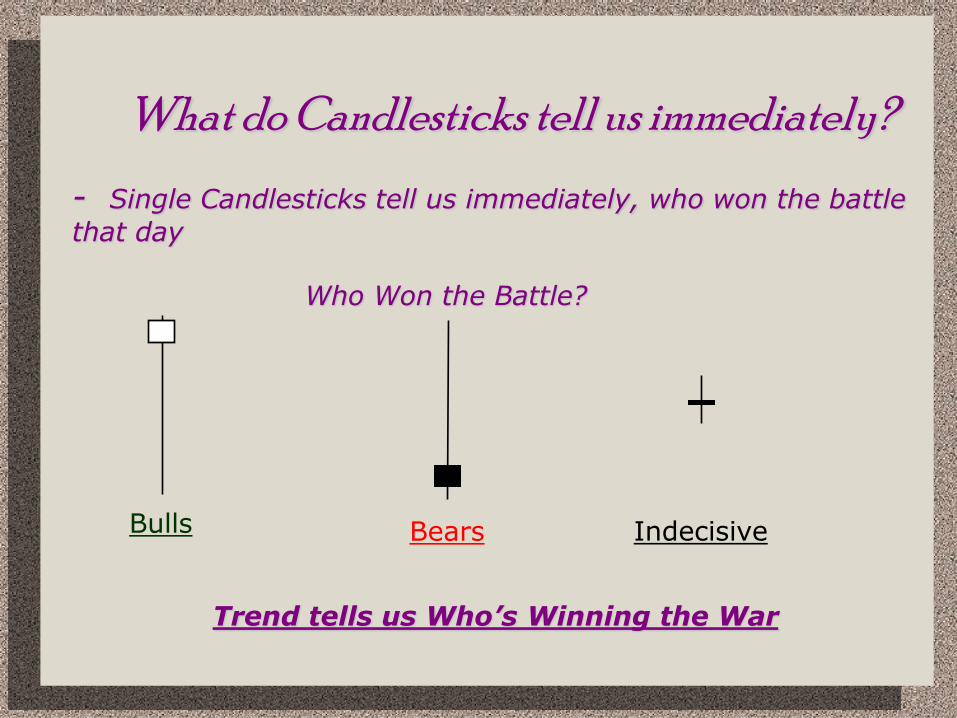
- Single Candlesticks tell us immediately, who won the battle
that day Who Won the Battle?
What do Candlesticks tell us immediately?
Bulls Bears Indecisive
Trend tells us Who’s Winning the War
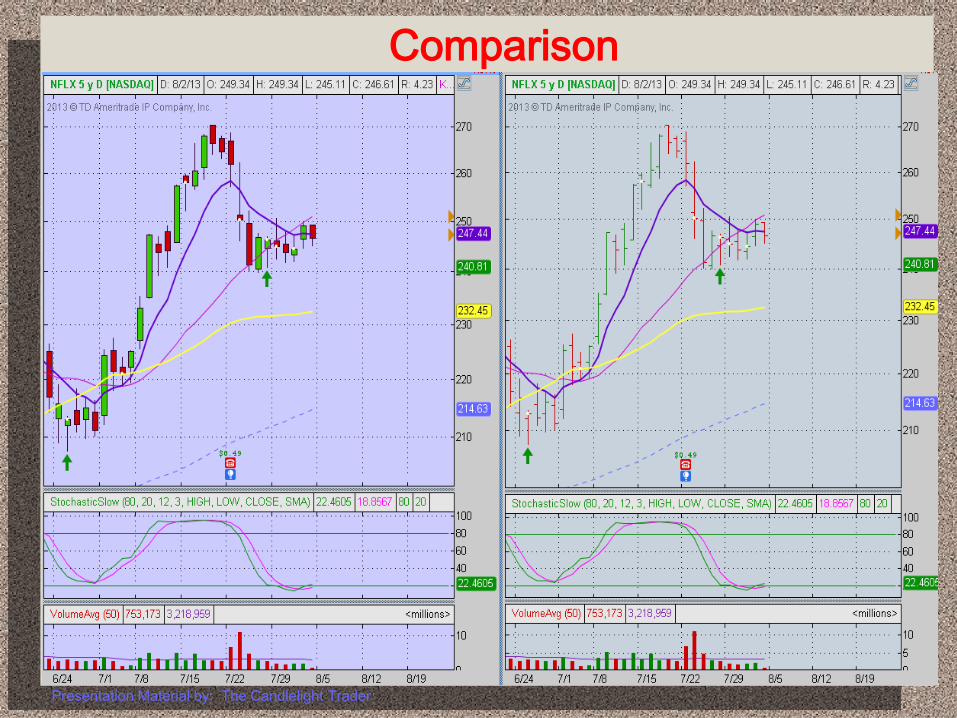
Comparison
Presentation Material by: The Candlelight Trader

Doji/Spinning Tops - Doji’s show indecision between buyers & sellers
- Clue: When present at past support or moving averages
potential trend reversal or break out
- Price Action will tend to move in the direction of the open after a Doji/Spinning Top
Indecision: More than one shows greater Indecision
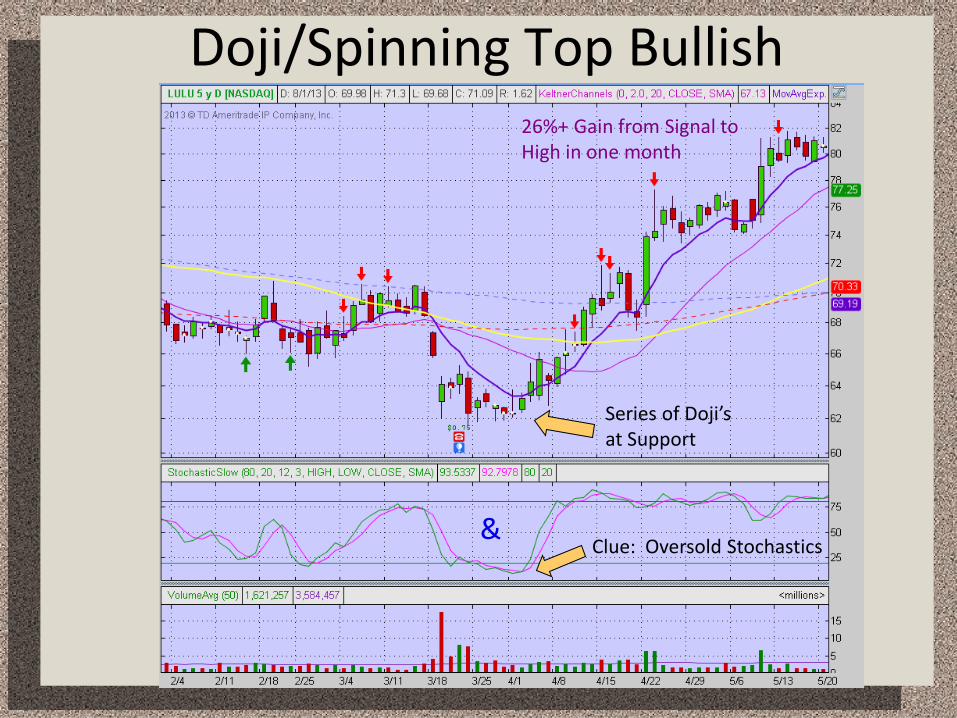
Doji/Spinning Top Bullish
Series of Doji’s at Support
Clue: Oversold Stochastics
26%+ Gain from Signal to High in one month
&
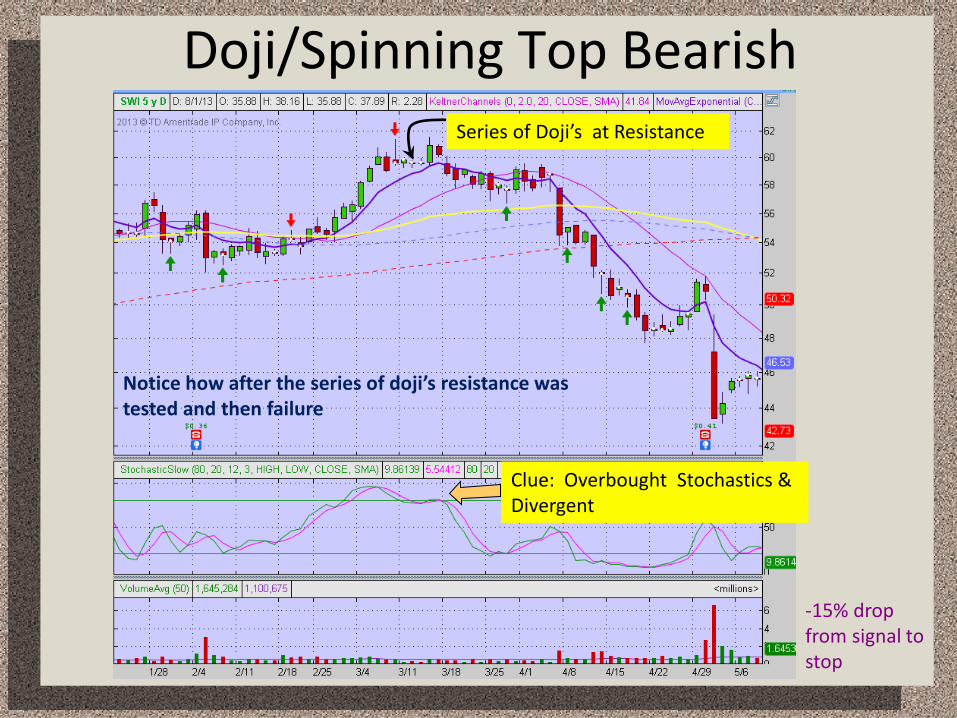
Doji/Spinning Top Bearish
Series of Doji’s at Resistance
Clue: Overbought Stochastics & Divergent
Notice how after the series of doji’s resistance was tested and then failure
-15% drop from signal to stop

Bullish Engulfing
Only occurs after a downtrend. Completely
engulfs the previous days body.
Expected move back to swing high, trend lines
or moving averages
Support
Swing High
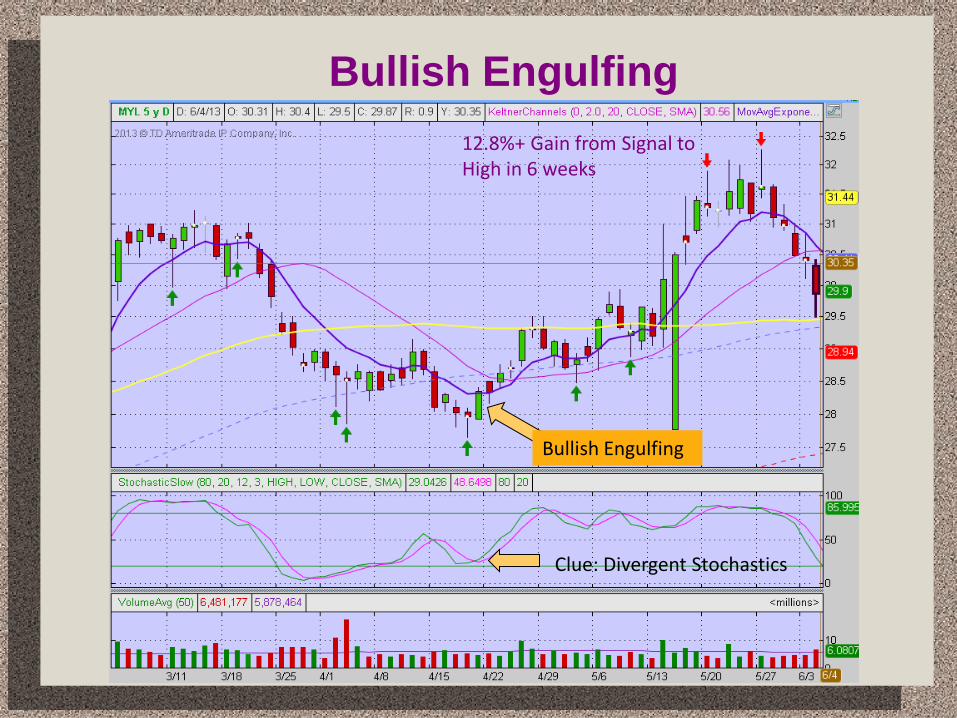
Bullish Engulfing
Bullish Engulfing
Clue: Divergent Stochastics
12.8%+ Gain from Signal to High in 6 weeks
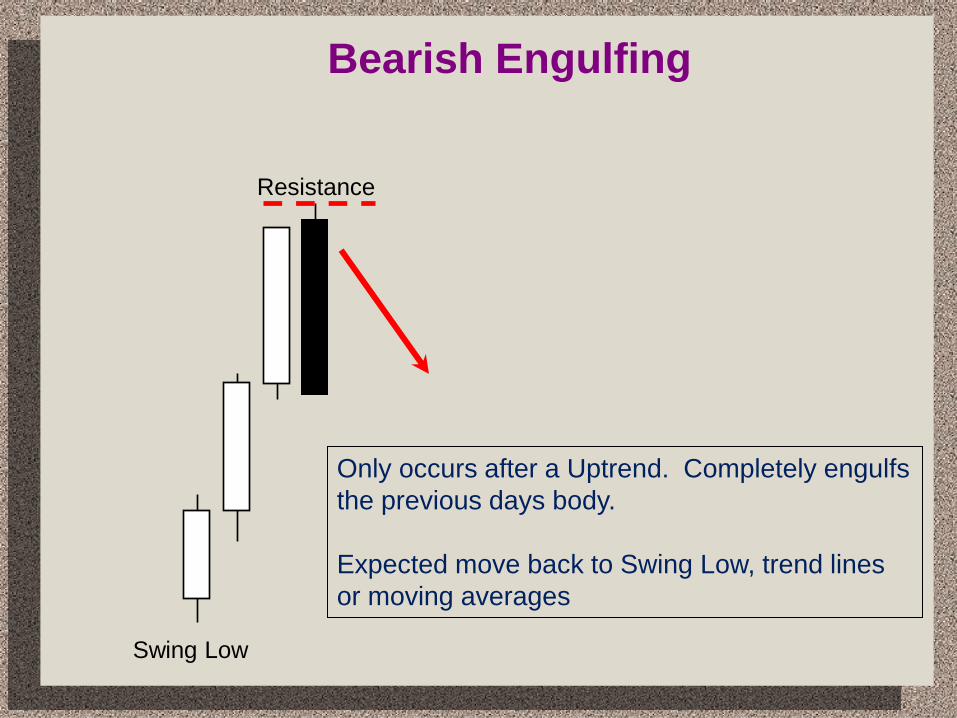
Bearish Engulfing
Resistance
Only occurs after a Uptrend. Completely engulfs
the previous days body.
Expected move back to Swing Low, trend lines
or moving averages
Swing Low
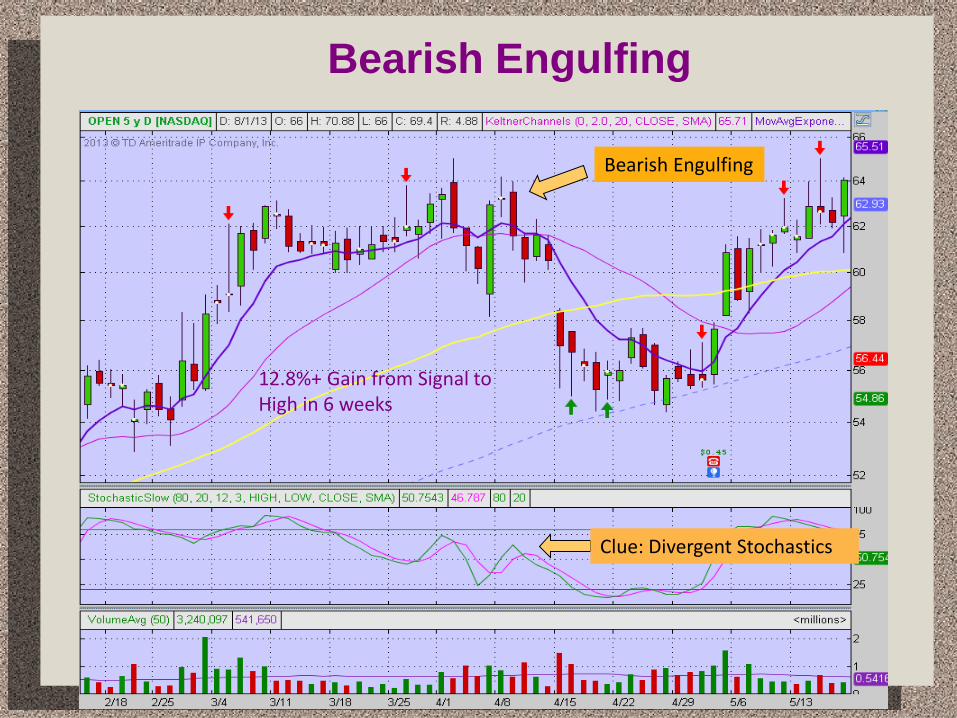
Bearish Engulfing
Bearish Engulfing
Clue: Divergent Stochastics
12.8%+ Gain from Signal to High in 6 weeks

Hammer
Hammer Support
Only occurs after a downtrend.
Shadow must be 2X the Body
Expected move back to swing high,
trend lines or moving averages
Swing High

Hammer
21%+ Gain from Signal to High in 6 weeks
Hammer
Clue: Oversold Stochastics
Clue: What’s the other clue?

Hanging Man
Only occurs after a
Uptrend. Shadow must
be 2X the Body
Expected move back to
swing high, trend lines or
moving averages
Resistance
Swing Low
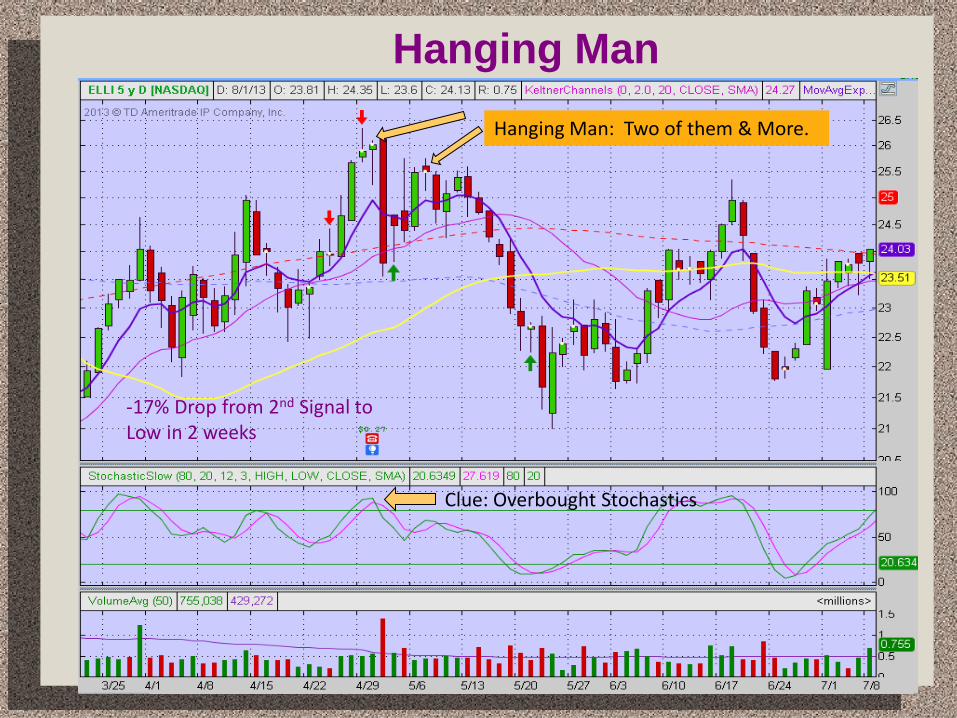
Hanging Man
-17% Drop from 2nd Signal to Low in 2 weeks
Hanging Man: Two of them & More.
Clue: Overbought Stochastics
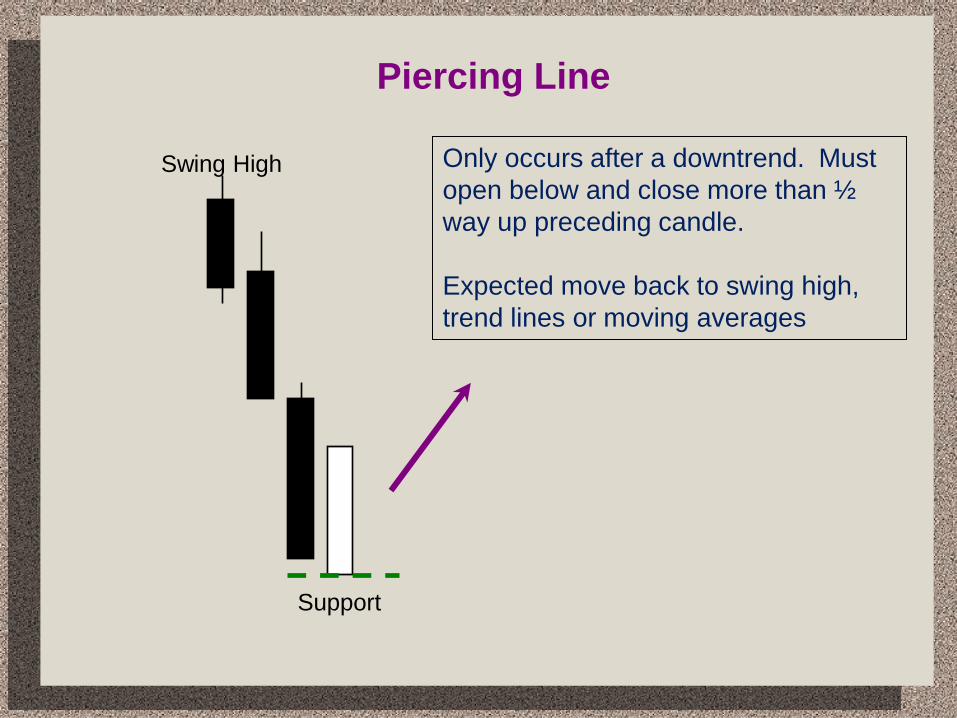
Piercing Line
Support
Only occurs after a downtrend. Must
open below and close more than ½
way up preceding candle.
Expected move back to swing high,
trend lines or moving averages
Swing High
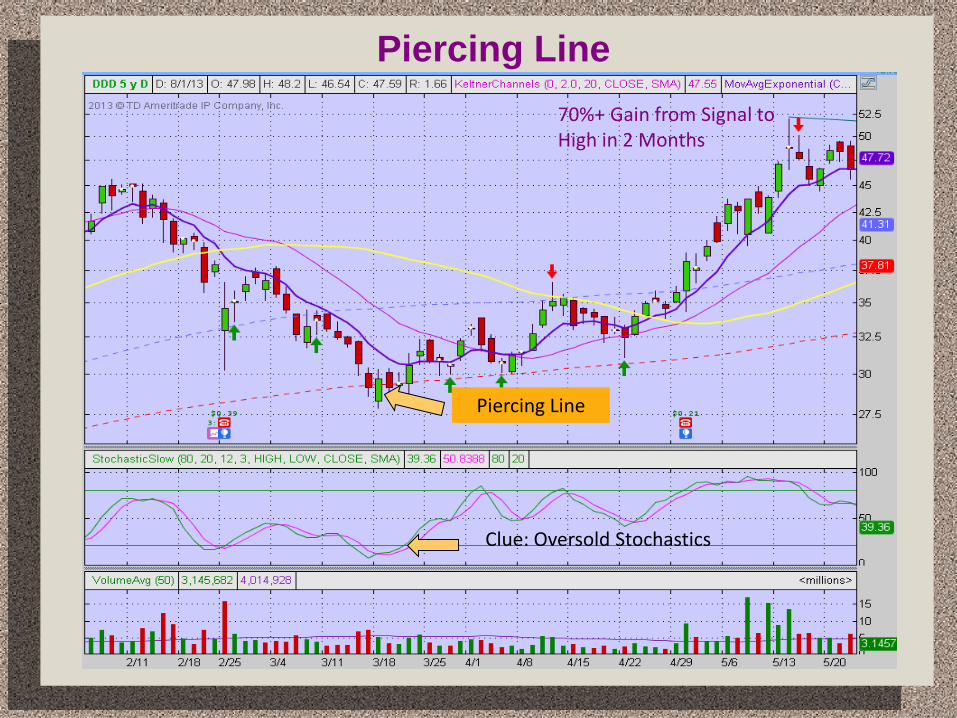
Piercing Line
70%+ Gain from Signal to High in 2 Months
Piercing Line
Clue: Oversold Stochastics

Dark Cloud
Resistance Only occurs after a uptrend. Must
open above and close more than ½
way down preceding candle.
Expected move back to swing high,
trend lines or moving averages
Swing Low
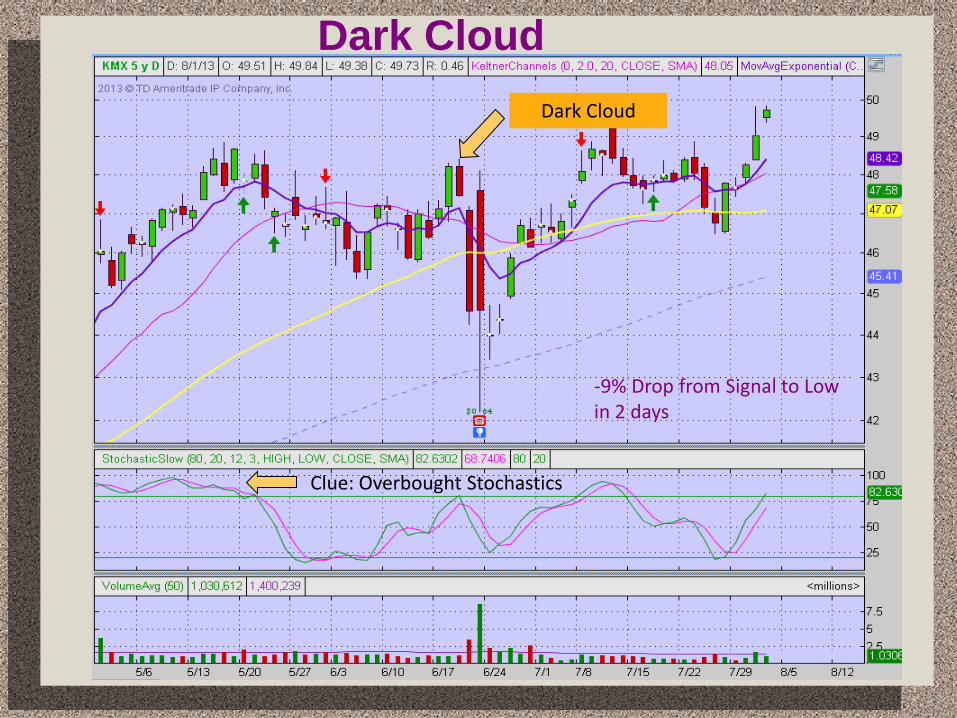
Dark Cloud
-9% Drop from Signal to Low in 2 days
Dark Cloud
Clue: Overbought Stochastics
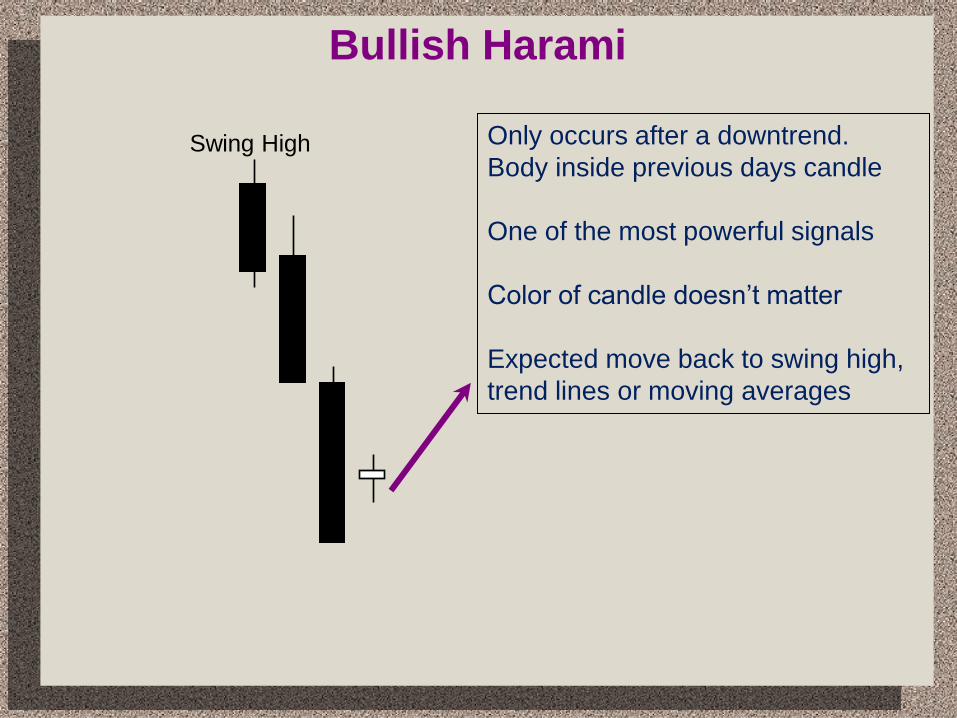
Bullish Harami
Only occurs after a downtrend.
Body inside previous days candle
One of the most powerful signals
Color of candle doesn’t matter
Expected move back to swing high,
trend lines or moving averages
Swing High
Bullish Harami
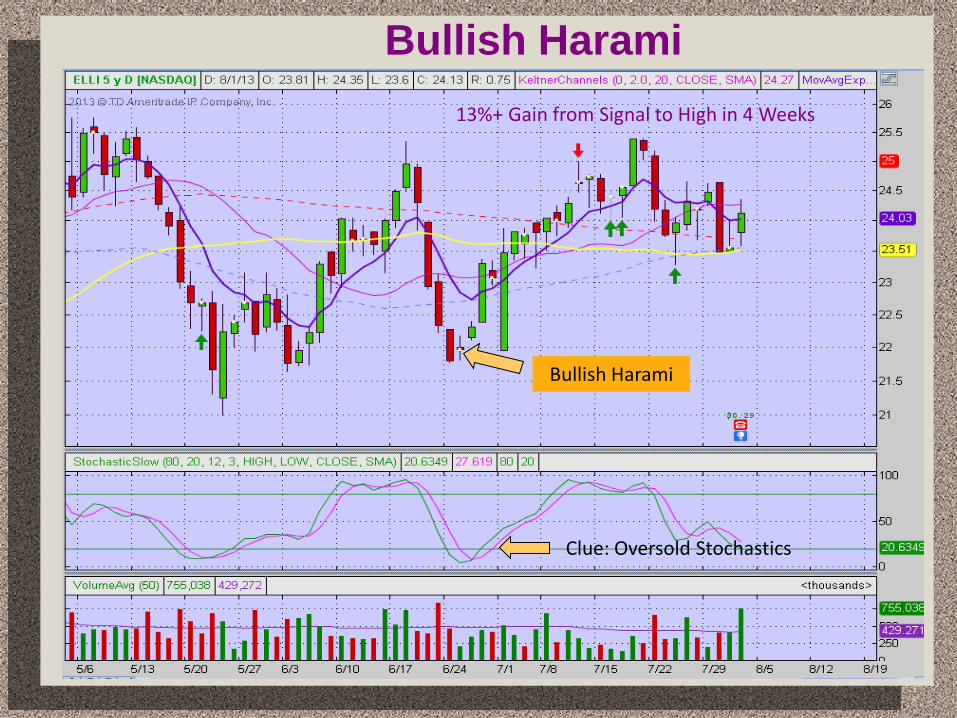
13%+ Gain from Signal to High in 4 Weeks
Bullish Harami
Clue: Oversold Stochastics

Bearish Harami
Swing Low
Only occurs after a Uptrend. Body
inside previous days candle
One of the most powerful signals
Color of candle doesn’t matter
Expected move back to swing high,
trend lines or moving averages

Bearish Harami
-20% Drop from Signal to Low in 5 Weeks
Bearish Harami
Clue: Divergent Stochastics
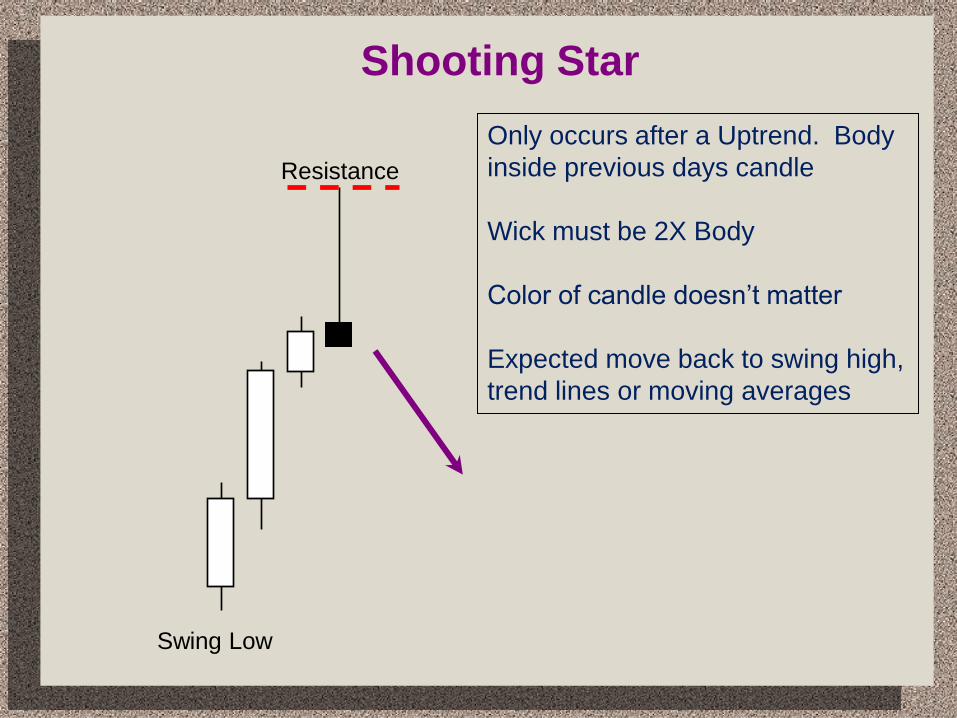
Shooting Star
Resistance Only occurs after a Uptrend. Body
inside previous days candle
Wick must be 2X Body
Color of candle doesn’t matter
Expected move back to swing high,
trend lines or moving averages
Swing Low
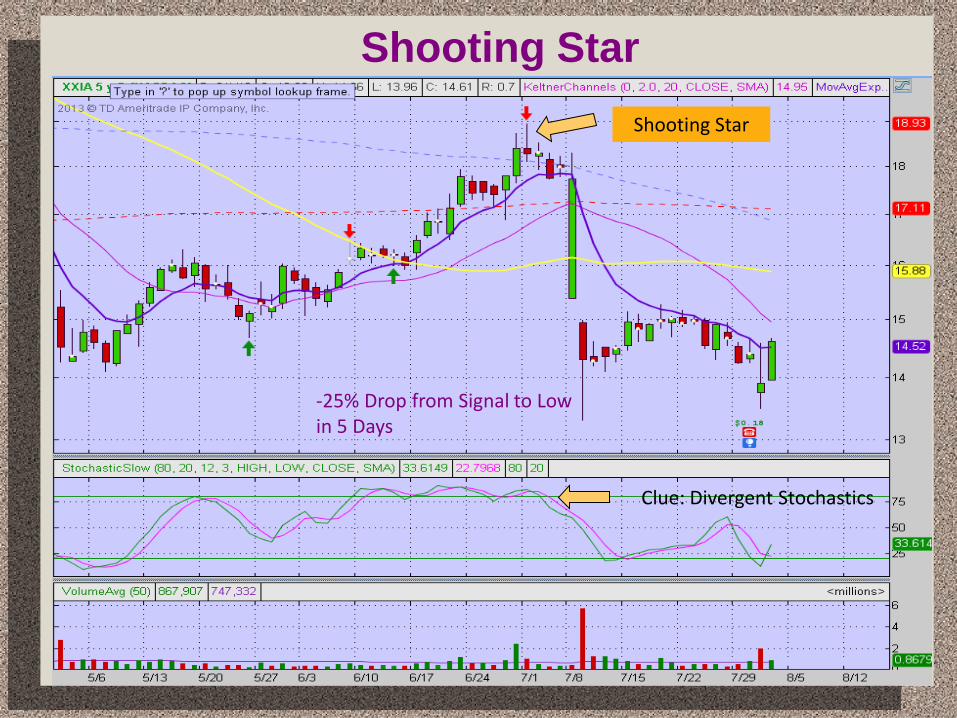
Shooting Star
-25% Drop from Signal to Low in 5 Days
Shooting Star
Clue: Divergent Stochastics
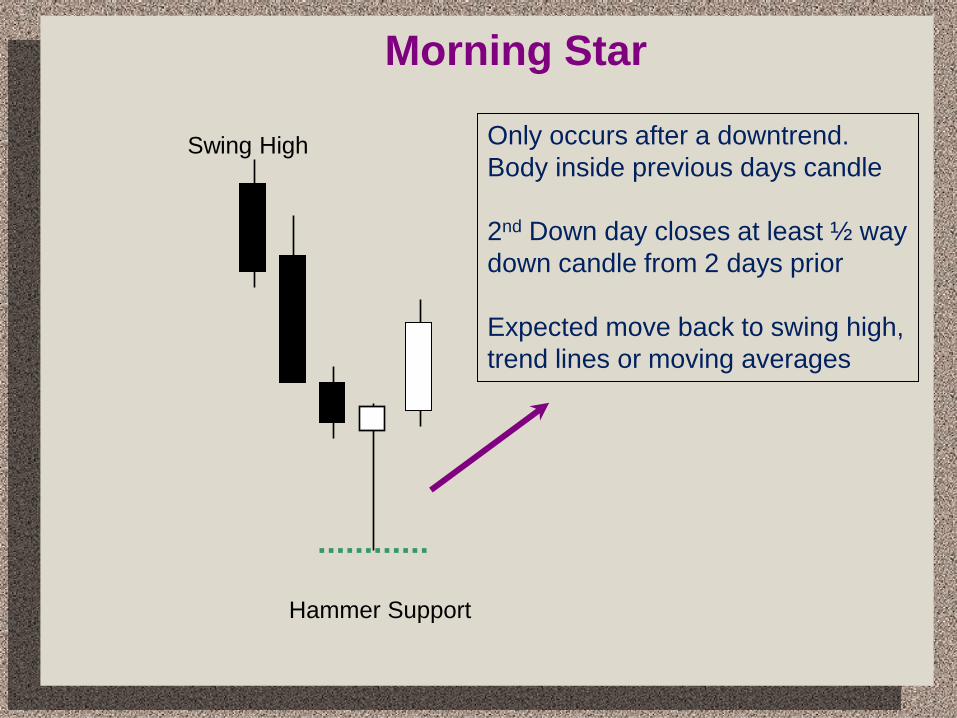
Morning Star
Hammer Support
Swing High Only occurs after a downtrend.
Body inside previous days candle
2nd Down day closes at least ½ way
down candle from 2 days prior
Expected move back to swing high,
trend lines or moving averages
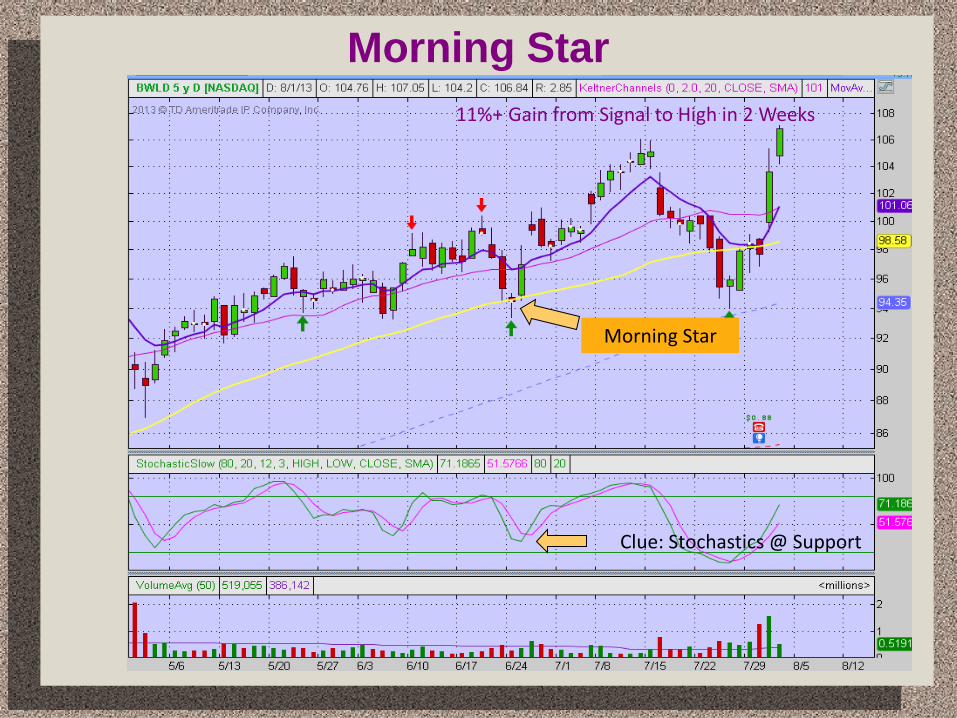
Morning Star
11%+ Gain from Signal to High in 2 Weeks
Morning Star
Clue: Stochastics @ Support

Evening Star
Resistance Only occurs after a Uptrend. Body
inside previous days candle
2nd Down day closes at least ½ way
down candle from 2 days prior
Expected move back to swing high,
trend lines or moving averages
Swing Low
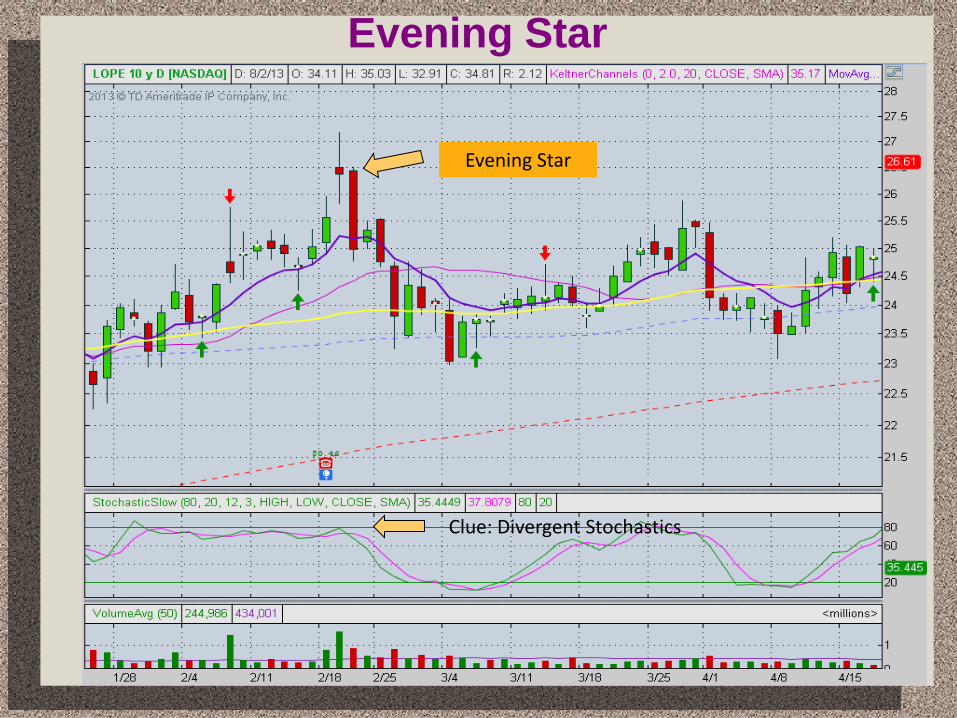
Evening Star
Evening Star
Clue: Divergent Stochastics
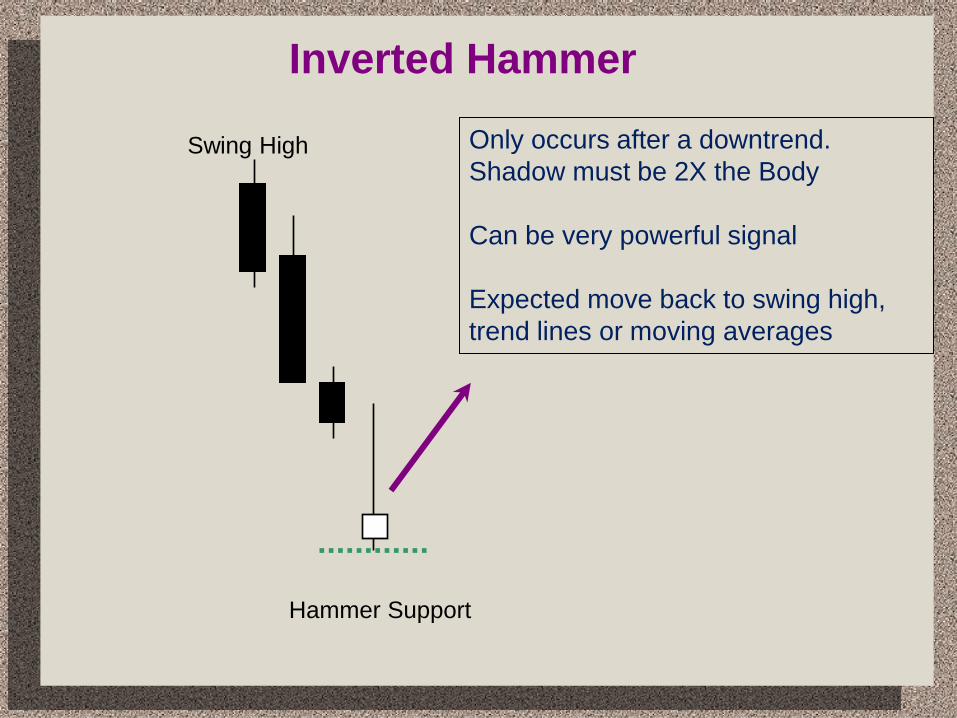
Inverted Hammer
Hammer Support
Only occurs after a downtrend.
Shadow must be 2X the Body
Can be very powerful signal
Expected move back to swing high,
trend lines or moving averages
Swing High
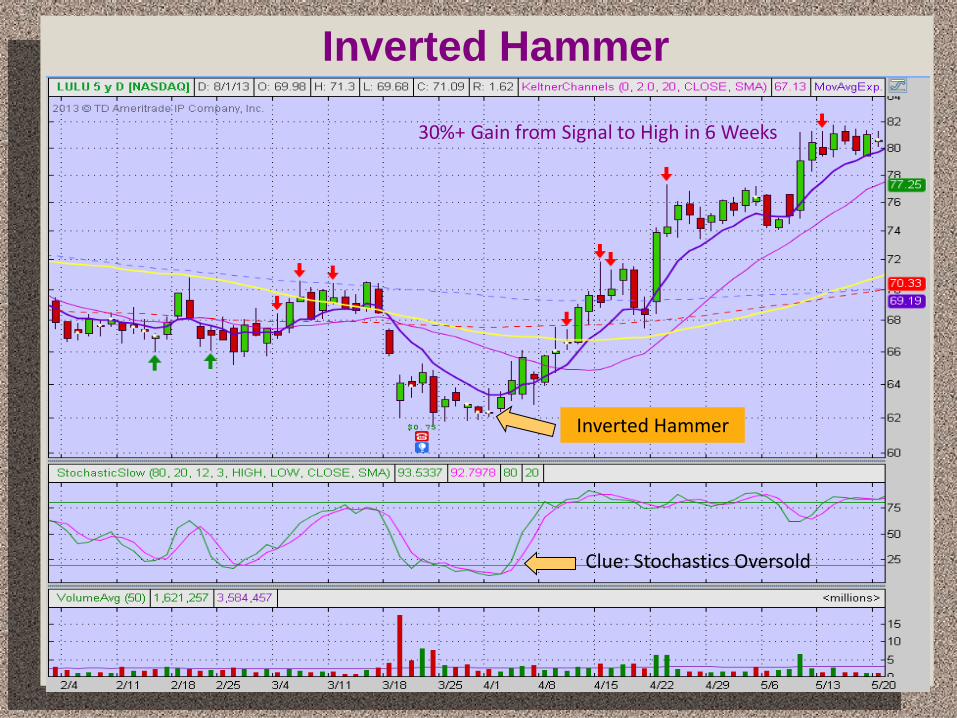
Inverted Hammer
30%+ Gain from Signal to High in 6 Weeks
Inverted Hammer
Clue: Stochastics Oversold
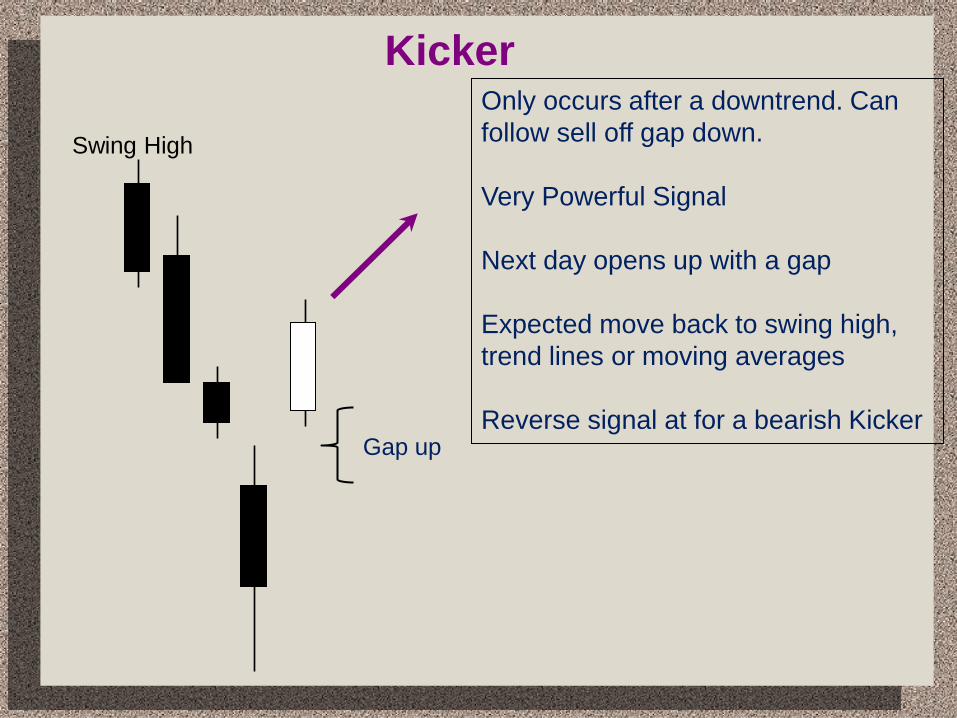
Kicker
Swing High
Only occurs after a downtrend. Can
follow sell off gap down.
Very Powerful Signal
Next day opens up with a gap
Expected move back to swing high,
trend lines or moving averages
Reverse signal at for a bearish Kicker Gap up

Kicker—Bullish
13%+ Gain from Signal to High in 4 Weeks
Bullish Kicker
Clue: Stochastics Oversold
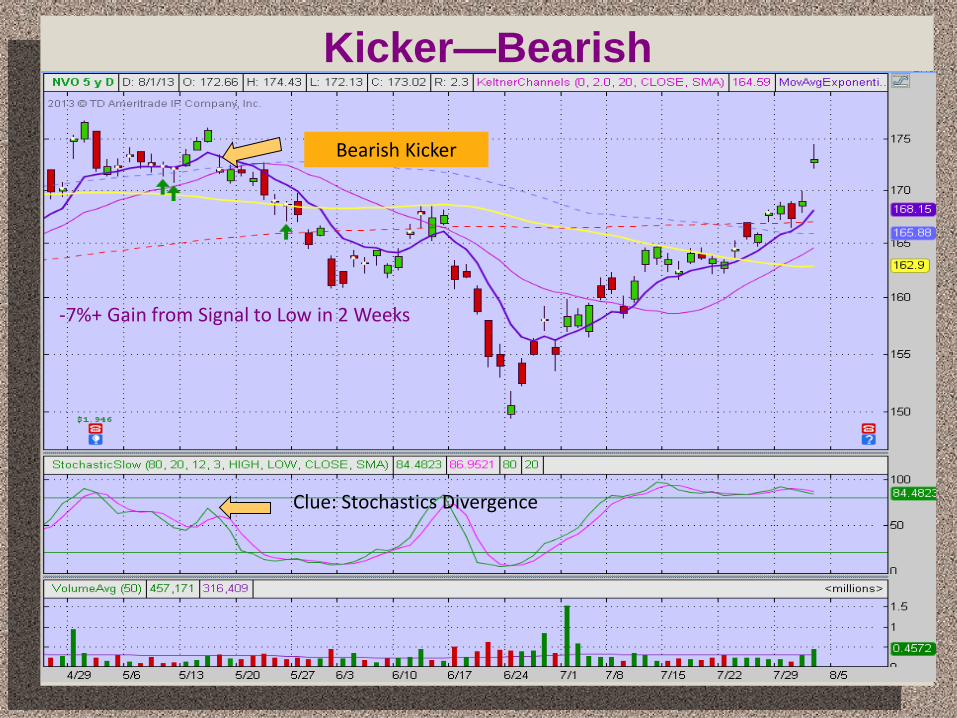
Kicker—Bearish
-7%+ Gain from Signal to Low in 2 Weeks
Bearish Kicker
Clue: Stochastics Divergence
Test Yourself
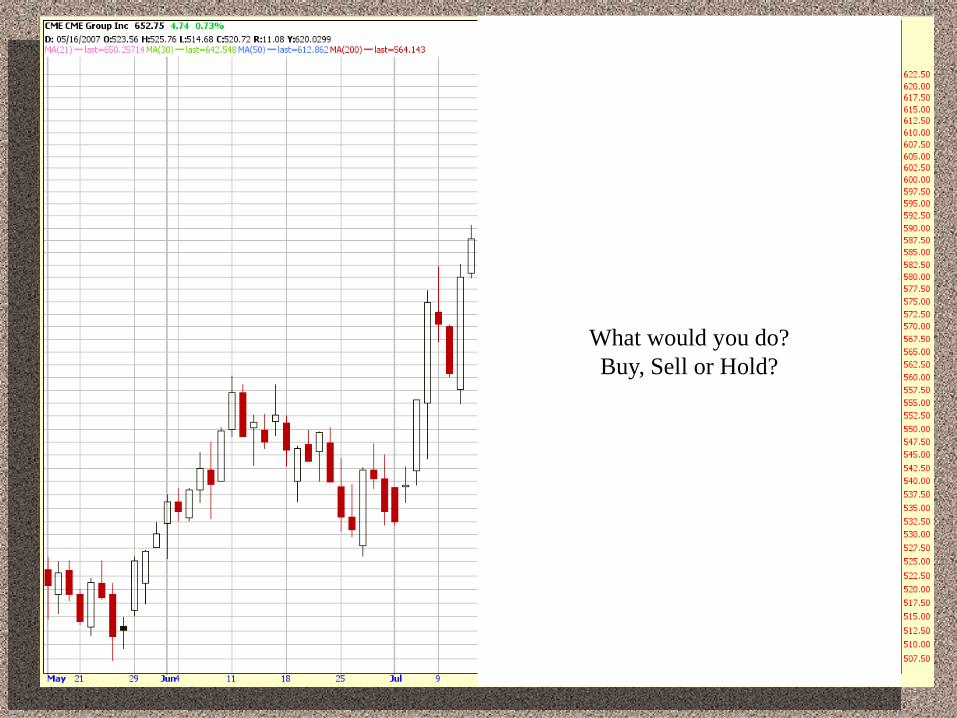
What would you do?
Buy, Sell or Hold?

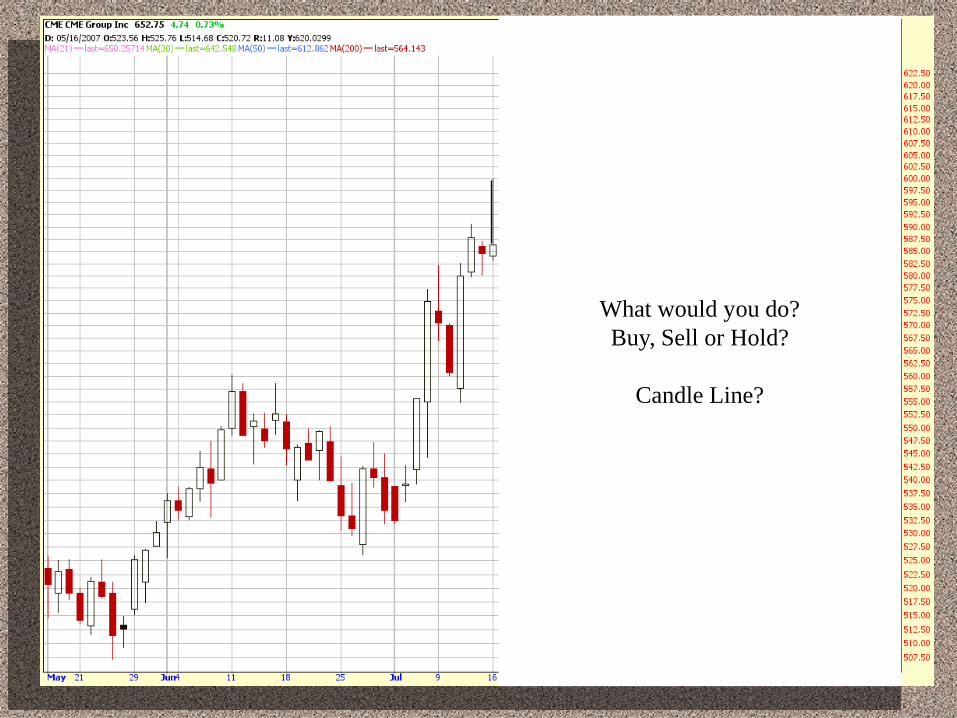
What would you do?
Buy, Sell or Hold?
What would you do?
Buy, Sell or Hold?
Candle Line?
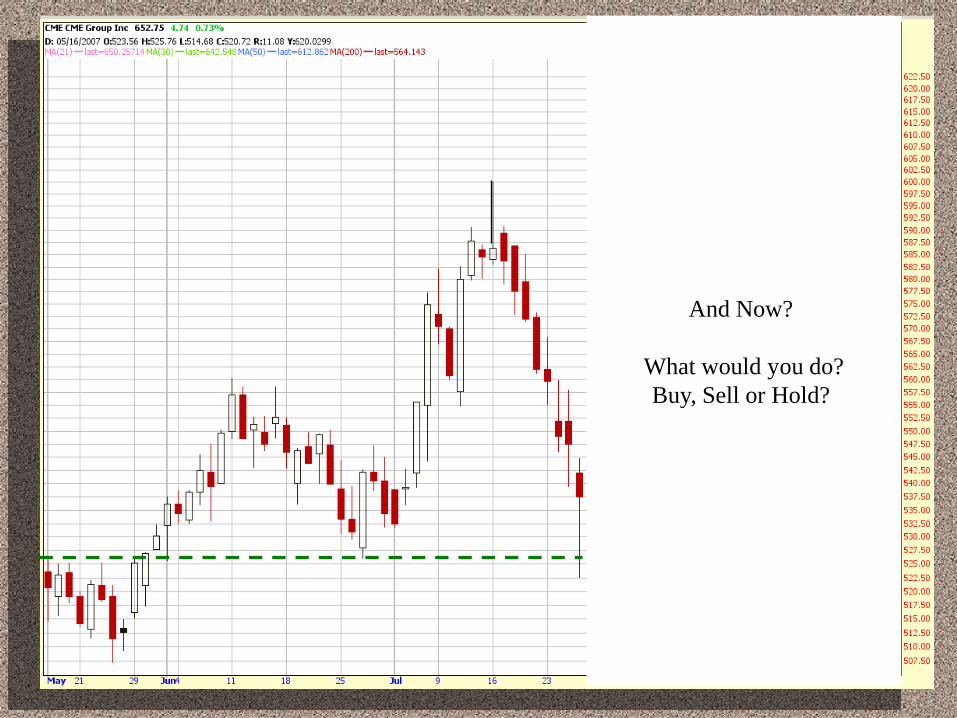
And Now?
What would you do?
Buy, Sell or Hold?
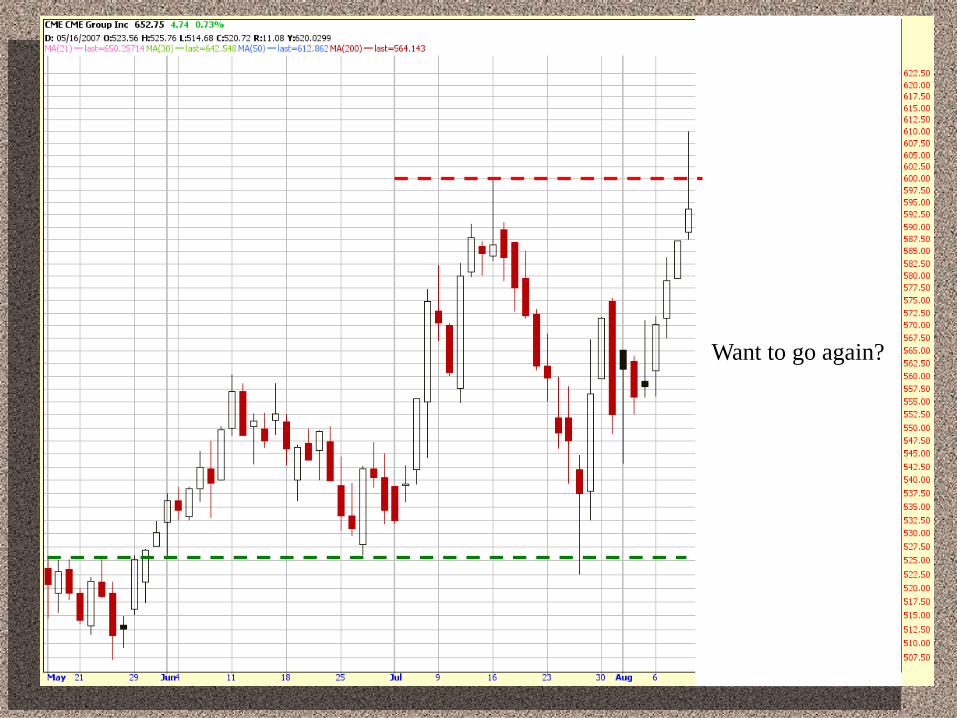
Want to go again?
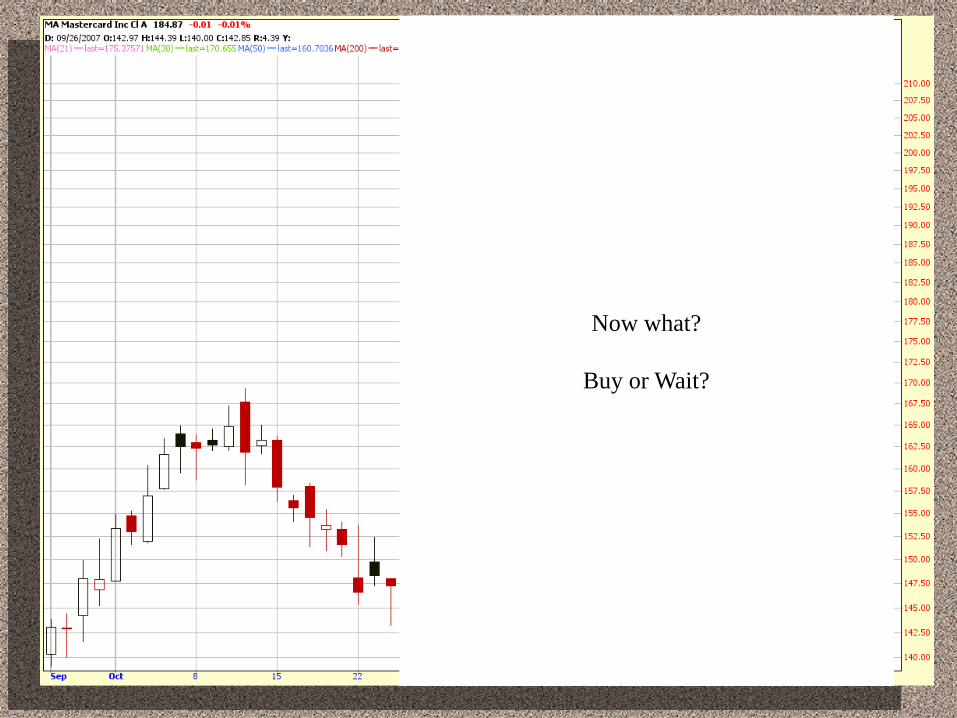
Now what?
Buy or Wait?

Confirmation?
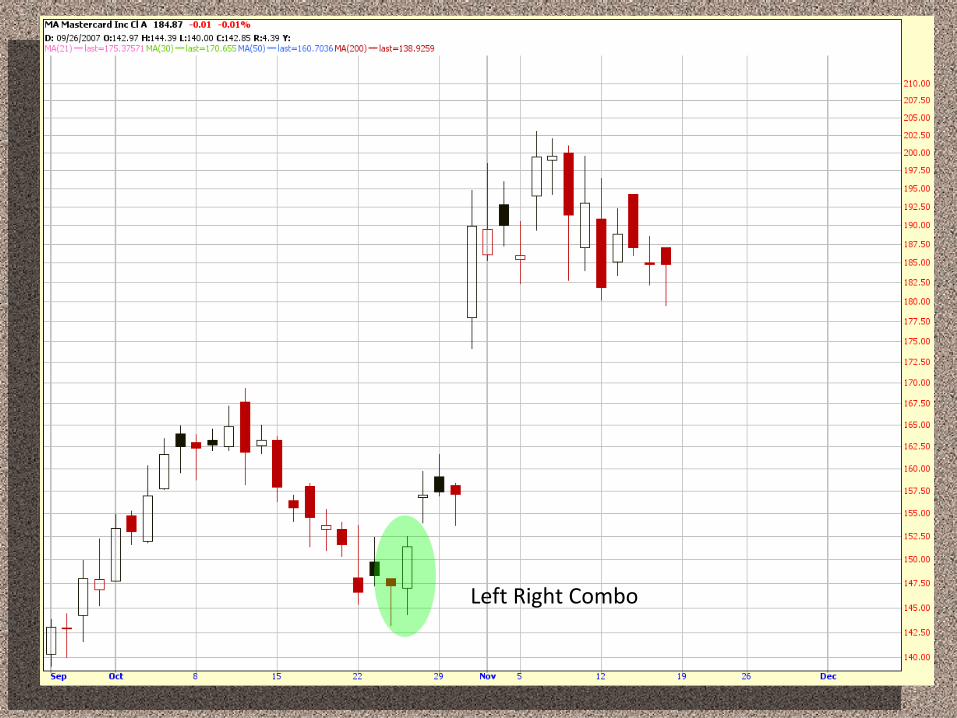
Left Right Combo
Take a Break Part 2 begins
in 10 Minutes
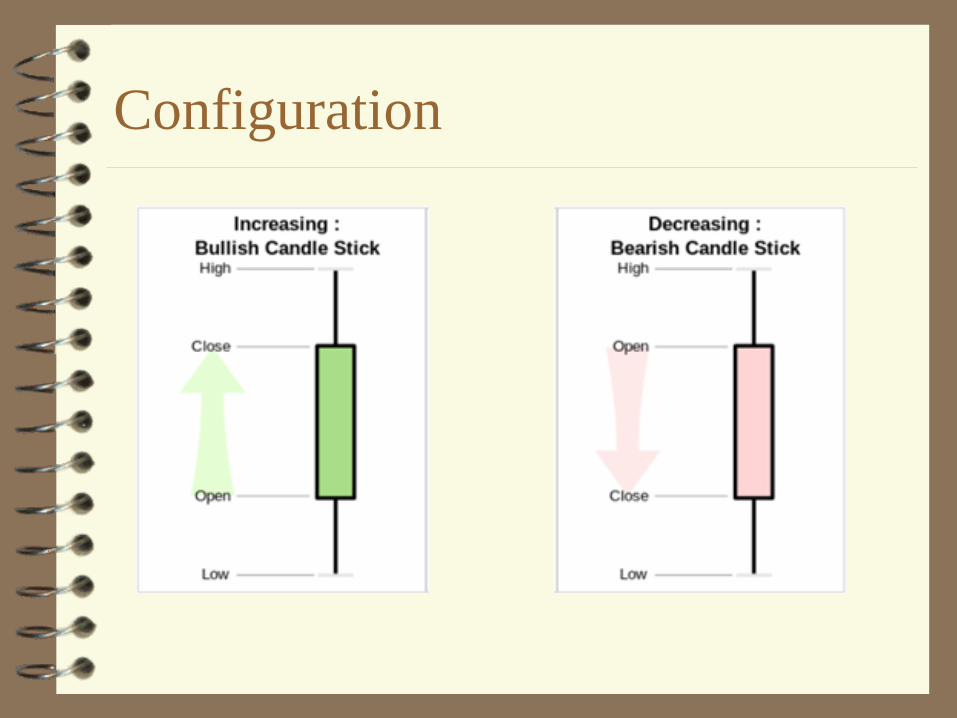
Configuration


![Trading Candlestick Patterns Ron William[1]](https://img.dokumen.tips/doc/110x75/5466acc9b4af9ff9748b492f/trading-candlestick-patterns-ron-william1.jpg)


![Candlestick Patterns Explained [Plus Video Tutorial]](https://img.dokumen.tips/doc/110x75/618fd7fcc8201772cf198502/candlestick-patterns-explained-plus-video-tutorial.jpg)