Embed Size (px)
Citation preview

Light-induced flocculation of gold nanoparticles
Ana Vesperinas, a Julian Eastoe,*a Sally Jackson and Paul Wyatt,a a School of Chemistry, University of Bristol, Bristol, BS8 1TS, UK.Fax:+44 1179250612;Tel:+44 117 9289180; E-mail: [email protected] Background to C6PAS photochemistry Under UV irradiation akyl-phenylazosulfonates switch from a hydrophilic (surfactant-
based) to a hydrophobic system (photoproducts). As shown in Figure S1,
photoirradiation of sodium 4-hexylphenylazosulfonate (C6PAS) yields to the
formation of two different photolysis products 4-hexylphenol and hexylbenzene.1,2 .
N
NSO3
R
R
R
NN
Na+SO3
Na+
N
NSO3
R
Na+
N+
N
R
Na+
SO3
OH
R
Na+
HSO3 Na+
HSO3
∆, hv
.
+ . + 2
k1k-1
∆, hvk2'k-2 k-2'k2
∆, hv
+ +
k3k3'
-N2 -N2
(non-aqueous environment)
(aqueousenvironment)
Figure S1. Mechanism of photolysis of C6PAS (R=hexyl)
Supplementary Material (ESI) for Chemical CommunicationsThis journal is (c) The Royal Society of Chemistry 2007

In sufficiently concentrated solution both mechanisms compete and the ratio of
photoproducts depends of the solvent environment and concentration1,2. At high
concentrations the cationic diazonium salt, precipitates after complexation with the
remaining anionic azosulfonate.
Sample appearance and UV-Vis spectra Gold nanoparticles were obtained by chemical reduction of Au (III) salt with sodium
borohydride, both dissolved in the aqueous core of reversed micelles.3 The molar
concentration ratio of [NaBH4]/[KAuCl4]=3.4 was kept constant for all preparations.
An initial solution of Au nanoparticles in reversed micelles of H2O/C12E6 in isooctane
was studied. The reduction of gold was followed by UV-Vis spectroscopy: the initial
AuIII microemulsion displayed a maximum peak at λmax 330nm, after the reduction
reaction this peak disappeared and a new band characteristic of nanoparticle Au0
appeared at λmax 525 nm. For this control system, which contained no C6PAS, no
change in appearance or UV-Vis spectra was noticeable after UV irradiation for 150
minutes.
0
0.5
1
1.5
2
2.5
250 350 450 550 650 750 850
Wavelength (nm)
Abs
orba
nce
(a)
(b)
(c)
AuIII λmax~330nm
Au0 λmax~525nm
λ / nm
0
0.5
1
1.5
2
2.5
250 350 450 550 650 750 850
Wavelength (nm)
Abs
orba
nce
(a)
(b)
(c)
AuIII λmax~330nm
Au0 λmax~525nm
0
0.5
1
1.5
2
2.5
250 350 450 550 650 750 850
Wavelength (nm)
Abs
orba
nce
(a)
(b)
(c)
AuIII λmax~330nm
Au0 λmax~525nm
λ / nm
Abs
orba
nce
Wavelength (nm)
Au0 λmax~525nm
0.0
0.5
1.0
1.5
2.0
2.5
250 350 450 550 650 750 8500
0.5
1
1.5
2
2.5
250 350 450 550 650 750 850
Wavelength (nm)
Abs
orba
nce
(a)
(b)
(c)
AuIII λmax~330nm
Au0 λmax~525nm
λ / nm
0
0.5
1
1.5
2
2.5
250 350 450 550 650 750 850
Wavelength (nm)
Abs
orba
nce
(a)
(b)
(c)
AuIII λmax~330nm
Au0 λmax~525nm
0
0.5
1
1.5
2
2.5
250 350 450 550 650 750 850
Wavelength (nm)
Abs
orba
nce
(a)
(b)
(c)
AuIII λmax~330nm
Au0 λmax~525nm
λ / nm
Abs
orba
nce
Wavelength (nm)
Au0 λmax~525nm
0
0.5
1
1.5
2
2.5
250 350 450 550 650 750 850
Wavelength (nm)
Abs
orba
nce
(a)
(b)
(c)
AuIII λmax~330nm
Au0 λmax~525nm
λ / nm
0
0.5
1
1.5
2
2.5
250 350 450 550 650 750 850
Wavelength (nm)
Abs
orba
nce
(a)
(b)
(c)
AuIII λmax~330nm
Au0 λmax~525nm
0
0.5
1
1.5
2
2.5
250 350 450 550 650 750 850
Wavelength (nm)
Abs
orba
nce
(a)
(b)
(c)
AuIII λmax~330nm
Au0 λmax~525nm
λ / nm
Abs
orba
nce
Wavelength (nm)
Au0 λmax~525nm
0.0
0.5
1.0
1.5
2.0
2.5
250 350 450 550 650 750 850
Figure S2. Absorption spectra of [Au]=0.02 M in the inverse micelle system H2O/C12E6/isooctane, w
=2 (a) Au before reduction (b) Au after addition of insufficient 0.32M NaBH4 (c) Au after addition of
0.64 M NaBH4, sufficient to generate Au0.
Supplementary Material (ESI) for Chemical CommunicationsThis journal is (c) The Royal Society of Chemistry 2007

Different Au nanoparticles in H2O/C12E6/C6PAS/isooctane microemulsions were
studied. The samples were prepared using the method outlined in the main paper.
The compositions are summarized in Table S1
Table S1. Sample compositions.
Sample w [surfactants]/M XC6PAS (%) [Au]/M Au1 2 0.155 5 0.020 Au2 2 0.070 10 0.020 Au3 2 0.060 12 0.020 Au4 9 0.350 10 0.085 Au5 8 0.300 10 0.080
The photosurfactant C6PAS shows an intense UV absortion2 at λmax 308nm, and a
secondary peak at λmax 420 nm. Photolysis of C6PAS was studied by following the
disappearance of the strong UV absorption peak, suggesting that the photoreaction
is completed. Previous 1H NMR studies have established the nature of the
photoproducts after irradiation.4
A solution of C12E6 (2 wt%) in isooctane was used as a background spectral
reference. The presence of Au caused a blue-shift of the C6PAS absorbance, from
λmax 308 nm to λmax 270 nm (Figure S3), hence a C6PAS-containing microemulsion
could not be used as the blank.
0
0.5
1
1.5
2
2.5
3
3.5
250 300 350 400 450 500 550 600
λ / nm
Abs
orba
nce
a
b
0
0.5
1
1.5
2
2.5
3
3.5
250 300 350 400 450 500 550 600
λ / nm
Abs
orba
nce
a
b
Wavelength (nm)
Abs
orba
nce
0.0
0.5
1.0
1.5
2.0
2.5
3.0
3.5
(a)(b)
0
0.5
1
1.5
2
2.5
3
3.5
250 300 350 400 450 500 550 600
λ / nm
Abs
orba
nce
a
b
0
0.5
1
1.5
2
2.5
3
3.5
250 300 350 400 450 500 550 600
λ / nm
Abs
orba
nce
a
b
Wavelength (nm)
Abs
orba
nce
0.0
0.5
1.0
1.5
2.0
2.5
3.0
3.5
(a)(b)
Wavelength (nm)
Abs
orba
nce
0.0
0.5
1.0
1.5
2.0
2.5
3.0
3.5
(a)(b)
Figure S3. UV-visible spectra of (a) H2O/C6PAS/C12E6/isooctane with w = 2, [surfactants] = 0.155M
and XC6PAS(%) = 2 and (b) Au/H2O/C6PAS/C12E6/isooctane.
Supplementary Material (ESI) for Chemical CommunicationsThis journal is (c) The Royal Society of Chemistry 2007
Irradiation of sample Au1, with the lowest C6PAS level (Table S1), showed no visible
effect on the stability of the Au nanoparticles. This initial observation is supported by
UV-Vis spectroscopy (Figure S4), which shows that the C6PAS has been destroyed
but the Au nanoparticles are still present in the solution. It also showed that a small
amount of unreduced gold is present corresponding to the absorbance at λmax
330nm. At XC6PAS(%)=5 the concentration of C6PAS is not high enough to affect the
nanoparticle stability, but this sample was used as a standard to check the effect of
UV on a photostable gold colloid dispersion. Photolysis of C6PAS at this 5% level is
insufficient to induce flocculation of the colloidal Au, and there is enough residual
C12E6 to maintain particle stability after UV irradiation. To achieve effective UV-
induced flocculation it was necessary to increase the C6PAS: C12E6 ratio and the
overall surfactant concentration (see Table S1).
0
0.5
1
1.5
2
2.5
3
250 350 450 550 650 750 850
Wavelength (nm)
Abso
rban
ce
Au0 λmax ~ 525nmAuIII λmax ~ 330nm
C6PAS λmax~ 270nm
0
0.1
0.2
0.3
0.4
0.5
0.6
400 450 500 550 600 650 700 750 800 850
Wavelength (nm)
Abso
rban
ce
λ / nm
0
0.5
1
1.5
2
2.5
3
250 350 450 550 650 750 850
Wavelength (nm)
Abso
rban
ce
Au0 λmax ~ 525nmAuIII λmax ~ 330nm
C6PAS λmax~ 270nm
0
0.1
0.2
0.3
0.4
0.5
0.6
400 450 500 550 600 650 700 750 800 850
Wavelength (nm)
Abso
rban
ce
0
0.5
1
1.5
2
2.5
3
250 350 450 550 650 750 850
Wavelength (nm)
Abso
rban
ce
Au0 λmax ~ 525nmAuIII λmax ~ 330nm
C6PAS λmax~ 270nm
0
0.1
0.2
0.3
0.4
0.5
0.6
400 450 500 550 600 650 700 750 800 850
Wavelength (nm)
Abso
rban
ce
λ / nmWavelength (nm)
Abs
orba
nce
0.0
0.5
1.0
1.5
2.0
2.5
3.0
250 350 450 550 650 750 8500
0.5
1
1.5
2
2.5
3
250 350 450 550 650 750 850
Wavelength (nm)
Abso
rban
ce
Au0 λmax ~ 525nmAuIII λmax ~ 330nm
C6PAS λmax~ 270nm
0
0.1
0.2
0.3
0.4
0.5
0.6
400 450 500 550 600 650 700 750 800 850
Wavelength (nm)
Abso
rban
ce
λ / nm
0
0.5
1
1.5
2
2.5
3
250 350 450 550 650 750 850
Wavelength (nm)
Abso
rban
ce
Au0 λmax ~ 525nmAuIII λmax ~ 330nm
C6PAS λmax~ 270nm
0
0.1
0.2
0.3
0.4
0.5
0.6
400 450 500 550 600 650 700 750 800 850
Wavelength (nm)
Abso
rban
ce
0
0.5
1
1.5
2
2.5
3
250 350 450 550 650 750 850
Wavelength (nm)
Abso
rban
ce
Au0 λmax ~ 525nmAuIII λmax ~ 330nm
C6PAS λmax~ 270nm
0
0.1
0.2
0.3
0.4
0.5
0.6
400 450 500 550 600 650 700 750 800 850
Wavelength (nm)
Abso
rban
ce
λ / nmWavelength (nm)
Abs
orba
nce
0.0
0.5
1.0
1.5
2.0
2.5
3.0
250 350 450 550 650 750 850
Figure S4. UV-Vis spectrum of Au1 before and after irradiation.
hυ
(a) (b)(b) (a)
hυhυ
(a) (b)(b) (a)Au2 Au3 Au3Au2
hυ
(a) (b)(b) (a)
hυhυ
(a) (b)(b) (a)Au2 Au3 Au3Au2
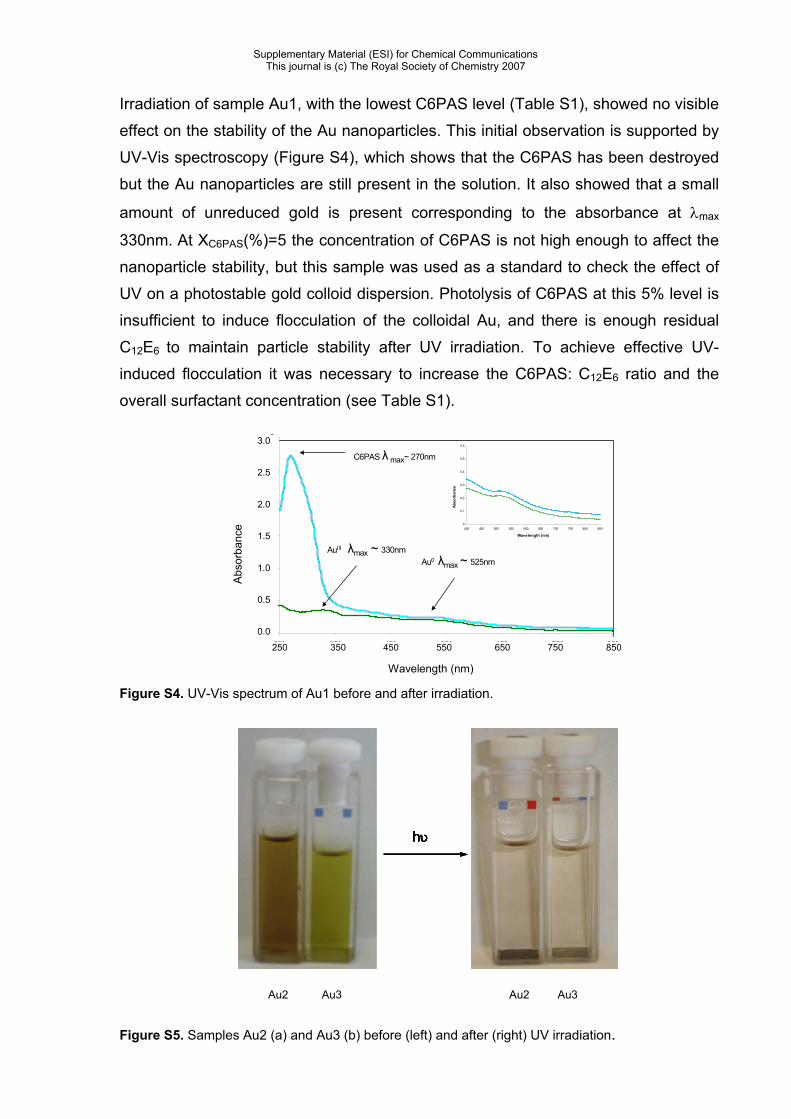
Figure S5. Samples Au2 (a) and Au3 (b) before (left) and after (right) UV irradiation.
Supplementary Material (ESI) for Chemical CommunicationsThis journal is (c) The Royal Society of Chemistry 2007

hυhυ
Figure S6. Sample Au4 before (left) and after (right) UV irradiation.
As seen in Figures S5, S6 and in main paper, samples Au2-Au5 resulted in
destabilization of the Au nanoparticles after 130 min of UV exposure. UV-Vis spectra
were consistent with full photolysis of C6PAS owing to disappearance of the λmax
420 nm peak. No absorption at λmax 525 nm from Au particles was observed in the
postirradiated clear supernatant solution of these solutions. The wavelength range
in Figure S7 is optimized for each system to minimize very strong absorbance in
some cases.
00.20.40.60.8
11.21.41.61.8
2
350 400 450 500 550 600 650 700 750 800 λ / nm
Abso
rban
ce
.
C6PASλmax ~ 400-450nm
Au0λmax~ 525nm
a
b
c
00.20.40.60.8
11.21.41.61.8
2
350 400 450 500 550 600 650 700 750 800 λ / nm
Abso
rban
ce
.
C6PASλmax ~ 400-450nm
Au0λmax~ 525nm
a
b
c
Wavelength (nm)
Abs
orba
nce
(b)
(a)
(c)0.0
1.0
2.0
450
0.5
1.5
350 550 650 750
00.20.40.60.8
11.21.41.61.8
2
350 400 450 500 550 600 650 700 750 800 λ / nm
Abso
rban
ce
.
C6PASλmax ~ 400-450nm
Au0λmax~ 525nm
a
b
c
00.20.40.60.8
11.21.41.61.8
2
350 400 450 500 550 600 650 700 750 800 λ / nm
Abso
rban
ce
.
C6PASλmax ~ 400-450nm
Au0λmax~ 525nm
a
b
c
00.20.40.60.8
11.21.41.61.8
2
350 400 450 500 550 600 650 700 750 800 λ / nm
Abso
rban
ce
.
C6PASλmax ~ 400-450nm
Au0λmax~ 525nm
a
b
c
00.20.40.60.8
11.21.41.61.8
2
350 400 450 500 550 600 650 700 750 800 λ / nm
Abso
rban
ce
.
C6PASλmax ~ 400-450nm
Au0λmax~ 525nm
a
b
c
Wavelength (nm)
Abs
orba
nce
(b)
(a)
(c)0.0
1.0
2.0
450
0.5
1.5
350 550 650 750
Figure S7. UV-Vis spectra of (a) background microemulsion equivalent to sample Au3 with no
C6PAS added, (b) sample Au3 before and (c) the supernatant of sample Au3 after UV irradiation.
Supplementary Material (ESI) for Chemical CommunicationsThis journal is (c) The Royal Society of Chemistry 2007

Samples Au4 and Au5 are darker in appearance before exposure to UV (Figure S6
and Figure 1 main paper) but UV-Vis spectra have similar behavior (Figure S7 and
Figure 2 main paper). After irradiation no absorption for the Au nanoparticles or
C6PAS was observed from the transparent supernatant liquid phases.
X Data
300 400 500 600 700 8000.0
0.5
1.0
1.5
2.0
Wavelength (nm)
Abso
rban
ce
(a)
(b)
(c)
X Data
300 400 500 600 700 8000.0
0.5
1.0
1.5
2.0
Wavelength (nm)
Abso
rban
ce
(a)
(b)
(c)
Figure S7. UV-Vis spectra of sample Au4 (a) before and (b) after UV irradiation, (c) background
microemulsion of C6PAS equivalent to Au4 before irradiation, but without gold.
Microscopy TEM images of sample Au4 showed different shape and size of gold nanoparticles
before irradiation (Figure S8), compared to sample Au5 described in the main paper.
Gold particles before irradiation seem more rounded and smaller (8-29 nm). The
post irradiated samples were separated, and the lower gold flocculated phases were
imaged with TEM. Post-irradiated dense Au precipitates showed evidence for strong
particle clustering, however the individual nanoparticles appeared to change
size/shape compared to the pre-irradiated state.
Supplementary Material (ESI) for Chemical CommunicationsThis journal is (c) The Royal Society of Chemistry 2007

(a)
(b) Figure S8. TEM images for sample Au4 before (a) and after UV irradiation (b).
Supplementary Material (ESI) for Chemical CommunicationsThis journal is (c) The Royal Society of Chemistry 2007

As shown in Figure S9 composition of the particles before and after irradiation was
confirmed by energy dispersive X-ray analysis (EDXA, Oxford Instruments ISIS 300
X-ray microanalysis system and silicon detector). The composition spectra are
almost identical, showing no significant changes in chemical composition as a
function of irradiation.
Figure S9. EDXA spectra of sample Au5 before and after irradiation.
Supplementary Material (ESI) for Chemical CommunicationsThis journal is (c) The Royal Society of Chemistry 2007

A proposed mechanism for recovery of Au nanoparticles is shown schematically in
Figure S10. Initially the system comprises stabilized gold nanoparticles, sterically
stabilized in reverse micelles. Upon irradiation with UV light the C6PAS undergoes
photolysis causing destruction of a portion of the steric stabilizing layer. The unstable
particles can flocculate, then precipitate, or also regain stability by adsorption of
residual inert C12E6 surfactant.
hvhv
Figure S10. Schematic representation of the destabilization of Au nanoparticles in reverse micelles of
C12E6 and C6PAS.
References (1) Nuyken, O.; Voit, B. Macromol. Chem Phys. 1997, 198, 2337. (2) Mezger, T.; Nuyken, O.; Meindl, K.; Wokaun, A. Progr. in Org. Coatings 1996, 29, 147. (3) Herrera, A. P.; Resto, O.; Briano, J. G.; Rinaldi, C. Nanotechnology 2005 16, 618 (4) Eastoe, J.; Sanchez Dominguez, M.; Cumber, H.; Wyatt, P.; Heenan, R. K. Langmuir
2004, 20, 1120
Supplementary Material (ESI) for Chemical CommunicationsThis journal is (c) The Royal Society of Chemistry 2007