Embed Size (px)
Citation preview

University of South Bohemia
Faculty of Science
Light harvesting complexes and chromatic adaptation of
Eustigmatophyte alga Trachydiscus minutus
Master thesis
Bc. Marek Pazderník
Instructor: RNDr. Radek Litvín, Ph.D.
České Budějovice 2015

Pazderník, M., 2015: Light harvesting complexes and chromatic adaptation of
Eustigmatophyte alga Trachydiscus minutus. Mgr. Thesis, in English. – 53 p., Faculty of
Science, University of South Bohemia, České Budějovice, Czech Republic.
Annotation:
The chromatic adaptation of Trachydiscus minutus was investigated by separation of light
harvesting complexes (antennae and photosystems) on a sucrose gradient using variety of
detergents and their concentrations, further complex purification and characterization was
done using biochemical separation and spectroscopic techniques.
Prohlašuji, že svoji diplomovou práci jsem vypracoval samostatně pouze s použitím
pramenů a literatury uvedených v seznamu citované literatury.
Prohlašuji, že v souladu s § 47b zákona č. 111/1998 Sb. v platném znění souhlasím se
zveřejněním své diplomové práce, a to v nezkrácené podobě elektronickou cestou ve
veřejně přístupné části databáze STAG provozované Jihočeskou univerzitou v Českých
Budějovicích na jejích internetových stránkách, a to se zachováním mého autorského
práva k odevzdanému textu této kvalifikační práce. Souhlasím dále s tím, aby toutéž
elektronickou cestou byly v souladu s uvedeným ustanovením zákona č. 111/1998 Sb.
zveřejněny posudky školitele a oponentů práce i záznam o průběhu a výsledku
obhajoby kvalifikační práce. Rovněž souhlasím s porovnáním textu mé kvalifikační
práce s databází kvalifikačních prací Theses.cz provozovanou Národním registrem
vysokoškolských kvalifikačních prací a systémem na odhalování plagiátů.
České Budějovice, 21. 03. 2015
Podpis:

Contents:
1. Introduction .......................................................................................... 1
1.1 Principles of photosynthesis in eukaryotes ........................................... 1
1.1.1 Function and structure of photosynthetic pigments ....................................... 1
1.1.2 Light-dependent phase of photosynthesis ...................................................... 3
1.1.3 Light-independent phase of photosynthesis ................................................... 7
1.2 Photosynthetic antennae systems .......................................................... 9
1.2.1 Antenna systems in higher plants .................................................................. 9
1.2.2 Antenna systems of Heterokontophytes ...................................................... 11
1.3 Eustigmatophyceae and chromatic adaptation .................................. 12
1.4 Trachydiscus minutus ............................................................................ 13
2. Materials and methods ....................................................................... 14
2.1 Principles of used methods ................................................................... 17
3. Results .................................................................................................. 19
3.1 Sucrose gradient optimization ............................................................. 20
3.1.1 n-dodecyl β-D-maltoside ............................................................................. 22
3.1.2 Digitonin ...................................................................................................... 25
3.1.3 n-dodecyl α-D-maltoside ............................................................................. 26
3.2 Investigation of the chromatic adaptation in T. minutus ................... 29
3.2.1 Clean native electrophoresis ........................................................................ 30
3.2.2 Analysis of the chromatic adaptation using fluorescence data .................... 34
3.2.2 Ion exchange chromatography ..................................................................... 36
4. Discussion ............................................................................................. 40
4.1 Sucrose gradient optimization ............................................................. 40
4.2 Chromatic adaptation of T. minutus ................................................... 42
4.2.1 Light harvesting complexes found using clean native electrophoresis .................. 43

4.2.2 Mechanism of the chromatic adaptation proposed by fluorescence analysis ......... 45
4.2.3 Antenna protein composition investigated by ionex chromatography ........ 45
4.3 Mechanism of the red shift and purpose of the red antenna complexes ... 46
5. Conclusions ......................................................................................... 49
6. References ........................................................................................... 50
Goals of the thesis:
1. Optimization of the method used for isolation of light harvesting complexes
from T. minutus.
- Finding a detergent type and concentration suitable for sucrose gradient separation.
2. Investigation of the light harvesting complex composition of T. minutus grown
under red light conditions.
- Elucidation of the molecular mechanism responsible for the shift in the absorption
and fluorescence emission

List of used abbreviations:
ADP – Adenosine diphosphate
ATP – Adenosine triphosphate
ATPase – ATP synthase
Chl - Chlorophyll
CN – Clean native electrophoresis
FCP – Fucoxanthin-Chlorophyll protein
HL – High light
HOMO – Highest occupied molecular orbital
LHC – Light harvesting complex
LL – Low light
LUMO – Lowest unoccupied molecular orbital
NADPH – Nicotinamide adenine dinucleotide phosphate
Pi – Phosphate
PSI – Photosystem I
PSII – Photosystem II
RC – Reaction center
RL – Red light
SDS-PAGE – Sodium dodecyl sulfate polyacrylamide gel electrophoresis
VCP – Violaxanthin-Chl protein
α-DM – n-dodecyl α-D-maltoside
β-DM – n-dodecyl β-D-maltoside

1
1. Introduction
1.1 Principles of photosynthesis in eukaryotes
1.1.1 Function and structure of photosynthetic pigments
Photosynthesis is a process of transforming energy carried by photons into energy stored in
chemical bonds. This process will be briefly described in following chapters. Initial step in
photosynthesis is a photon absorption by a pigment. Pigments are molecules which absorb
certain range of visible light, giving a color to the material which contains them. The energy
of absorbed photon is transformed into energy of an electronic excited state. This energy of
excited electron is then further used as described in section 1.1.2. Eukaryotic photosynthetic
organisms use two types of pigments for light absorption: chlorophylls and carotenoids.
Chlorophylls serve as the major light absorbing molecules across all photosynthetic life. All
chlorophylls have a system of conjugated double bonds (figure 1). These delocalized π-
electrons are responsible for absorption of visible light. They form the highest occupied
molecular orbitals (HOMOs) of the molecule, from which the electrons are excited to
nonbonding and antibonding molecular orbitals (LUMOs) while absorbing photons. With the
increasing number of conjugated double bonds the energy gap between HOMOs and LUMOs
gets smaller, resulting in possible absorption of less energetic light.
Fig. 1. Structure of chlorophyll a.
Chlorophylls absorb visible light mainly in two wavelength ranges (figure 2), the lower
energy absorption bands (600-700 nm) correspond to electron excitation to S1 region (in the

2
case of chlorophylls called Q states) and higher energy absorption bands (400-500 nm)
corresponds to transitions to S2 region (called B states or Soret states) (Blankenship 2014).
Fig. 2. Absorption spectrum and simplified energy level diagram of chlorophyll a
(Blankenship 2014).
Carotenoid pigments along with chlorophylls form the available pool of pigments in
eukaryotic photosynthesis. Also, carotenoids are present in all known photosynthetic
organisms (Polivka and Frank 2010). Hundreds of variants of carotenoids are used by various
photosynthetic life forms, but they all share delocalized π-electron system, which enables
them to absorb light in the visible spectrum, similarly to chlorophylls. They are divided into
two groups: carotenes and xantophylls. They both share the basic carotenoid skeleton made
by the mevalonate pathway, however xantophylls contain oxygen atoms, carotenes do not
(figure 3). Several functions are assigned to carotenoids in photosynthesis. They serve as
accessory collectors of energy from light, mainly in the region where chlorophylls do not
absorb (500-600 nm). Carotenoids also contribute to the protection of the photosynthetic
apparatus from energy overload. Excess of excitation energy on chlorophylls can lead to
formation of so called reactive oxygen species, which are highly reactive and can cause
damaging changes to other molecules. Rate of the formation of reactive oxygen species is
slowed down by transferring the energy excess from chlorophylls onto carotenoids.
(Blankenship 2014).

3
Fig. 3. Structures of β-carotene (up) and violaxanthin (down), as representatives of
carotenoids and xantophylls in the studied alga T. minutus.
The energy of an excited pigment can transfer itself onto another pigment molecule (as
mentioned above) before it is dissipated as heat or fluorescence, only if the “acceptor”
pigment is in correct distance and orientation from the “donor”. This energy transfer is used in
photosynthesis to a great extent. To keep the pigments in the desired conformation, they are
held together by proteins. The energy transfer between pigments is today explained by three
theories. Förster theory of energy transfer (Förster 1965), exciton coupling (van Armerongen
et al. 2000) and electronic quantum coherence effects (Scholes 2010).
1.1.2 Light-dependent phase of photosynthesis
The synthesis of saccharides from CO2 and H20 in photosynthetic eukaryotes is often divided
into two phases. The so called light-dependent phase is the creation of NADPH (from
NADP+ and electrons plus proton originating from water) and ATP (from ADP and Pi) using
the energy of photons as the initial energy source. It is called light dependent phase because it
directly requires photons, in eukaryotes it takes place in and around the most inner chloroplast
membrane (called thylakoid membrane). Chloroplast is a specialized photosynthetic organelle
in eukaryotes. The thylakoid membrane encloses space which is called thylakoid lumen. The
space in between thylakoid membrane and inner chloroplast membrane is called stroma. The
light-dependent phase will now be described in the direction of electron flow from water to
NADPH. (Schematic representation of this light dependent phase is depicted in figure 5).

4
So called reaction centers play a central role in the energy transformation during light
dependent-phase. Photosynthetic reaction centers are made of proteins, pigments and other
co-factors. Each reaction center monomer contains two central chlorophyll molecules (called
the “special pair”), which are in tightly held conformation and distance from other pigments.
When the special pair gets excited, either by light absorption or transfer of excitation energy
from other pigments (as explained in section 1.1.1), so called charge separation takes place
(figure 4). Compared to the energy transfer between pigments, charge separation is a process,
where the excited electron leaves the excited molecule, leaving it with positive charge, and
migrates onto suitable electron acceptor. Therefore these reaction centers transform the
energy of electronic excited state into a redox potential. Requirement for this energy
transformation is that the molecule which provides the electron (electron donor) has lower
redox potential than the electron acceptor.
Fig. 4. Charge separation diagram, of excited molecule A (el. donor) and molecule B (el.
acceptor).
Eukaryotic organisms have two types of reaction centers. RCI in photosystem I and RCII in
photosystem II, they are membrane bound complexes in thylakoid membranes. Also, all
photosynthetic eukaryotes share the organization of electron flow from water to ferredoxin,
eventually to NADP+. The organization of electron/proton flow during light dependent phase,
and chemical balance for creation of one oxygen molecule is depicted on figure 5.

5
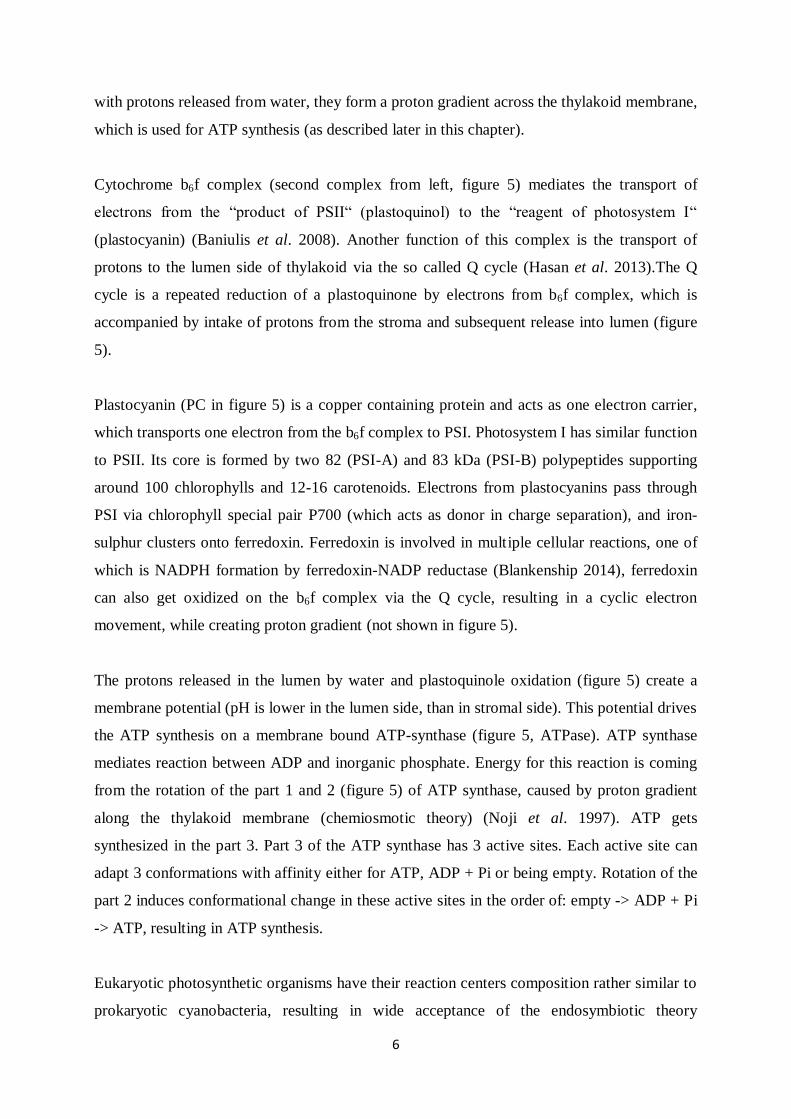
Fig. 5. Electron and proton flow through thylakoid membrane during light dependent phase in
eukaryotic chloroplasts.
Photosystem II is the initial complex, where water gets oxidized to molecular oxygen, on so
called oxygen evolving complex, which is attached to the core of PSII (Umena et al. 2011).
Protons are released inside the lumen and electrons pass through the PSII to reduce a
plastoquinone to plastoquinole (figure 6). This chemistry is driven by charge separation on
chlorophyll special pair P680 with resulting redox potential of +1.2 V. PSII forms a dimeric
supercomplex in the thylakoid membrane with so far over 20 identified polypeptide
components, variety of pigments and cofactors. The final composition of PSII is species
dependent. However the dimeric core which is made of four polypeptides (39 kDa PSII-A/D,
56 kDa PSII-B and 51 kDa PSII-C) and the oxygen evolving complex are preserved (Vinyard
et al. 2013).
Fig. 6. Two electron reduction of plastoquinone (PQ) to plastoquinol (PQH2).
Plastoquinone is a two electron carrier. It is a rather hydrophobic molecule which allows it to
freely diffuse through the thylakoid membrane. When it gets reduced it takes the two protons
from the stroma. On the other hand after oxidation on the b6f complex it releases those two
protons to the lumen side of thylakoid membrane (figure 5 shows 8 protons released into
lumen, because for every one oxygen molecule formed 4 plastoquinols get oxidized. Along
6
with protons released from water, they form a proton gradient across the thylakoid membrane,
which is used for ATP synthesis (as described later in this chapter).
Cytochrome b6f complex (second complex from left, figure 5) mediates the transport of
electrons from the “product of PSII“ (plastoquinol) to the “reagent of photosystem I“
(plastocyanin) (Baniulis et al. 2008). Another function of this complex is the transport of
protons to the lumen side of thylakoid via the so called Q cycle (Hasan et al. 2013).The Q
cycle is a repeated reduction of a plastoquinone by electrons from b6f complex, which is
accompanied by intake of protons from the stroma and subsequent release into lumen (figure
5).
Plastocyanin (PC in figure 5) is a copper containing protein and acts as one electron carrier,
which transports one electron from the b6f complex to PSI. Photosystem I has similar function
to PSII. Its core is formed by two 82 (PSI-A) and 83 kDa (PSI-B) polypeptides supporting
around 100 chlorophylls and 12-16 carotenoids. Electrons from plastocyanins pass through
PSI via chlorophyll special pair P700 (which acts as donor in charge separation), and iron-
sulphur clusters onto ferredoxin. Ferredoxin is involved in multiple cellular reactions, one of
which is NADPH formation by ferredoxin-NADP reductase (Blankenship 2014), ferredoxin
can also get oxidized on the b6f complex via the Q cycle, resulting in a cyclic electron
movement, while creating proton gradient (not shown in figure 5).
The protons released in the lumen by water and plastoquinole oxidation (figure 5) create a
membrane potential (pH is lower in the lumen side, than in stromal side). This potential drives
the ATP synthesis on a membrane bound ATP-synthase (figure 5, ATPase). ATP synthase
mediates reaction between ADP and inorganic phosphate. Energy for this reaction is coming
from the rotation of the part 1 and 2 (figure 5) of ATP synthase, caused by proton gradient
along the thylakoid membrane (chemiosmotic theory) (Noji et al. 1997). ATP gets
synthesized in the part 3. Part 3 of the ATP synthase has 3 active sites. Each active site can
adapt 3 conformations with affinity either for ATP, ADP + Pi or being empty. Rotation of the
part 2 induces conformational change in these active sites in the order of: empty -> ADP + Pi
-> ATP, resulting in ATP synthesis.
Eukaryotic photosynthetic organisms have their reaction centers composition rather similar to
prokaryotic cyanobacteria, resulting in wide acceptance of the endosymbiotic theory

7
(Margulis 1993) as the origin of chloroplast in eukaryotes. Glaukophytes, a group of
eukaryotic algae, have peptidoglycan layer between inner and outer chloroplast membrane,
which further suggests the bacterial origin of chloroplast. All photosynthetic eukaryotes are
oxygenic, meaning water is used as electron source for the light dependent phase. Prokaryotes
can also utilize other electron sources, for example H2S and H2 (Blankenship 2012).
1.1.3 Light-independent phase of photosynthesis
NADPH and ATP produced in the light dependent phase (section 1.1.2) are used for CO2
assimilation and reduction in the Calvin cycle (also called light-independent phase of
photosynthesis). Despite its name it takes place only when light is available, because it needs
steady supply of NADPH and ATP, which would quickly get depleted during the absence of
light. It takes place in the stroma (between thylakoid and inner chloroplast membranes). The
synthesis of 1 molecule of glucose via the Calvin cycle is depicted in figure 7. In total 18 ATP
and 12 NADPH are used to make one hexose-phosphate from CO2. Carbohydrates created by
the Calvin cycle are further used to fuel anabolic reactions and ATP driven processes within
the photosynthetic organism.

8
Fig. 7. Synthesis of glucose-6-phosphate from 6 CO2 via the Calvin cycle (1)
.

9
1.2 Photosynthetic antennae systems
To regulate the energy available for reaction centers, photosynthetic organisms contain so
called antennae systems. The main role of these antenna complexes is to provide more energy
for photosynthetic reaction centers. For an effective energy transfer from antenna to RC,
antennae need to be in direct contact with a reaction center or with another antenna, which
mediates the connection to the RC. Antenna systems consist of very ordered structure of
proteins and pigments. The pigments are held together in precise distance and orientation,
which is required for an effective energy transfer between them, as previously described in
section 1.1.1.
Antennas are divided according to their position within the chloroplast and relation towards
reaction center. Inner antennas are constantly fixed near the reaction center. On the other side
outer antennas are not permanently attached to the RC, which allows them to mediate the
adaptation to environmental changes, by attaching only during certain cellular conditions.
Outer antennas can be integral (inside the membrane) and peripheral (outside the membrane)
(Blakenship 2014).
1.2.1 Antenna systems in higher plants
The most studied eukaryotic antenna system is light harvesting system II. LHCII monomer
(polypeptide sizes around 22-23 kDa, genes encoding these antennas are called Lhcb) is
composed of three transmembrane α-helices and one amphiphatic helix, which are in complex
with two carotenoid and twelve chlorophyll molecules (Kühlbrandt et al. 1994). LHCII
monomers can form trimeric structures which connect to PSII core on three possible sites with
different affinity (figure 8). Three peripheral monomeric antennas (Lhcb4-6) mediate the
connection between LHC II trimers and PSII core. The core of PSII contains two so called
inner antenna systems, created by two proteins PSII-C and PSII-B (called CP 43 and CP 47).
LHC II can also connect to PSI (Wientjes et al. 2013, Allen 1992). LHCII was also reported
to form multimeric complexes inside the thylakoid membrane. Dekker et al. (1999) reported a
complex of seven LHCII trimers.

10
Fig. 8. Organization of PS II with peripheral antennas. The notation S/M/L
(strongly/moderately/loosely) describe the relative cohesion of the LHCII-trimer towards the
complex. (figure adapted from Ballottari et al. 2012)
Photosystem I is in higher plants surrounded from one side by peripheral integral antennas
called LHCI. Four distinct genes Lhca1-4 from the LHC gene-superfamily, with protein
masses of around 25 kDa, encode these complexes in green plants (fig. 9). (Dekker and
Boekema 2005) The reason why the antennas are tightly bound only on one side may be the
ability of PSI to form trimers in photosynthetic cyanobacteria, from which eukaryotic
photosynthetic apparatus evolved. Photosystem I in the potential PSI trimer would then be
accessible for integral antennas only from the side, which is occupied on figure 9.
Fig. 9. Structural model of PSI backbone surrounded by four LHCI complexes denoted as
Lhca1-4. Figure adapted from (Dekker and Boekema 2005).
11
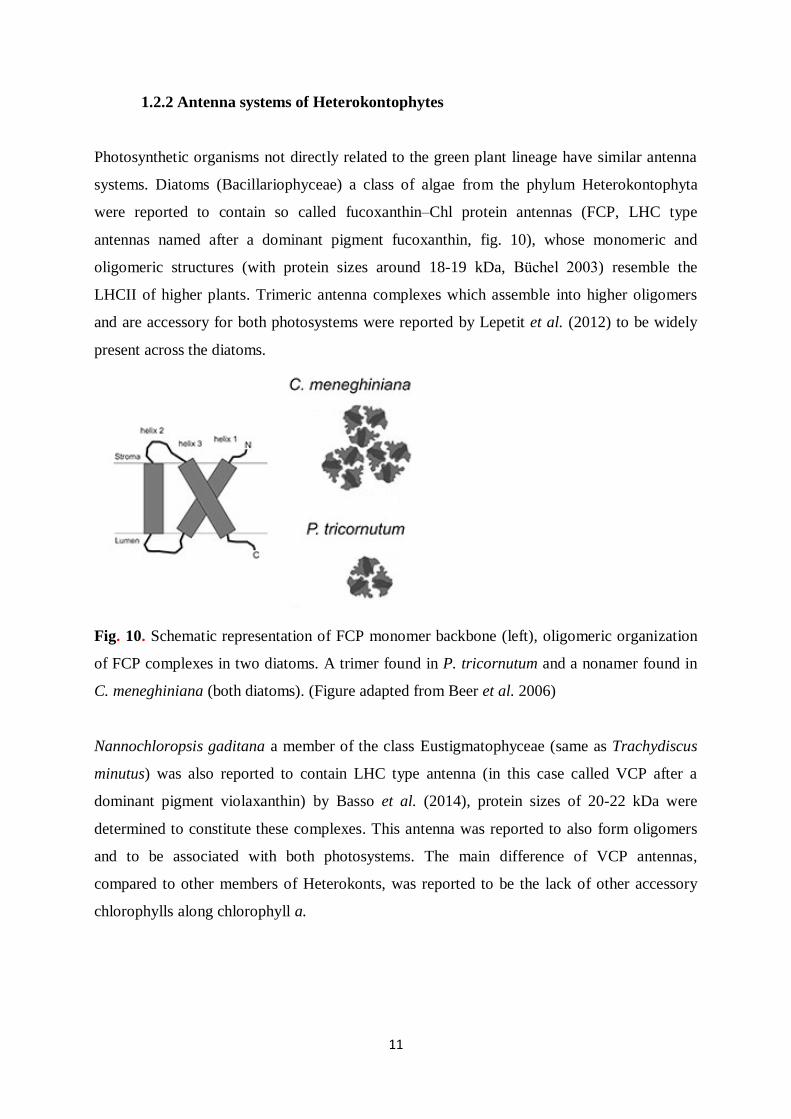
1.2.2 Antenna systems of Heterokontophytes
Photosynthetic organisms not directly related to the green plant lineage have similar antenna
systems. Diatoms (Bacillariophyceae) a class of algae from the phylum Heterokontophyta
were reported to contain so called fucoxanthin–Chl protein antennas (FCP, LHC type
antennas named after a dominant pigment fucoxanthin, fig. 10), whose monomeric and
oligomeric structures (with protein sizes around 18-19 kDa, Büchel 2003) resemble the
LHCII of higher plants. Trimeric antenna complexes which assemble into higher oligomers
and are accessory for both photosystems were reported by Lepetit et al. (2012) to be widely
present across the diatoms.
Fig. 10. Schematic representation of FCP monomer backbone (left), oligomeric organization
of FCP complexes in two diatoms. A trimer found in P. tricornutum and a nonamer found in
C. meneghiniana (both diatoms). (Figure adapted from Beer et al. 2006)
Nannochloropsis gaditana a member of the class Eustigmatophyceae (same as Trachydiscus
minutus) was also reported to contain LHC type antenna (in this case called VCP after a
dominant pigment violaxanthin) by Basso et al. (2014), protein sizes of 20-22 kDa were
determined to constitute these complexes. This antenna was reported to also form oligomers
and to be associated with both photosystems. The main difference of VCP antennas,
compared to other members of Heterokonts, was reported to be the lack of other accessory
chlorophylls along chlorophyll a.

12
1.3 Eustigmatophyceae and chromatic adaptation
Algae form a large group of eukaryotic photosynthetic organisms (Graham et al. 2008). The
most studied group are the green algae (chlorophytes, kingdom Archaeplastida), because of
their similarity with higher plants. Multiple algal groups belong to a group (kingdom) of
protists called Chromalveolata. Their chloroplasts originated in a secondary endosymbiotic
event when red algal (Archaeplastida) cell was engulfed by a heterotrophic cell. One of the
most important photosynthetic groups of Chromalveolata is phylum Heterokontophyta. The
most well-known group of Heterokontophyta are diatoms (class Bacillariophyceae), algae
with siliceous cell wall. The Eustigmatophyceae is a class of yellow-green algae also
belonging to Heterokonts. The most studied genus of this class is Nannochloropsis, because
of its potential for light driven biofuel synthesis (Zhang et al. 2014, Pedro et al. 2014). The
most recent overview of the class members was reported by Fawley at al. 2014, with
presentation of new species. According to the nuclear 18S rDNA sequence, the class consists
of two clades Eustigmatales and Goniochloridales, with T. minutus assigned to the second
one.
Chromatic adaptation is a change in the absorption spectrum of an organism induced by
different spectral composition and intensity of incident solar energy. Previously the response
to different irradiation levels in eukaryotic marine chlorophyte alga (Dunaliella tertiolecta)
was studied by Sukenik et al. (1988). The reported response was a change in the PSI and PSII
abundance, the amount of LHCs attached to the reaction centers, as well as the relative
expression of LHCI and LHCII apoproteins. Changes in apoprotein expression can eventually
lead to different pigment composition. Recently an antenna complex with 710 nm room
temperature fluorescence emission was reported to be responsible for a red light absorption in
Chromera velia (belongs to a Chromalveolate phylum Chromerida) (Kotabová et al. 2014,
Bína et al. 2014).

13
1.4 Trachydiscus minutus
T. minutus is an eukaryotic photosynthetic unicellular organism belonging to the class of
Eustigmatophyceae, under the phylum Heterokontophyta and kingdom Chromalveolata.
Closest phylogenetic relative using the 18S rRNA gene sequence is Goniochloris sculpta
(Přibyl et al. 2012). The class contains mostly freshwater species with the only so far known
marine genus Nannochloropsis.
The studied organism T. minutus showed presence of two types of photosynthetic pigments:
chlorophylls and carotenoids. The main photosynthetic pigment of T. minutus was determined
to be chlorophyll a (71 %), no other chlorophyll was reported. The remaining 29 % are
formed by carotenoids: violaxanthin 56.6 % of total carotenoids, vaucheriaxanthin 25.9 %, β-
carotene, zeaxanthin and neoxanthin 9.7 %, 3.2 % and 4.7 % resp. (Přibyl et al. 2012).
T. minutus is a candidate for polyunsaturated fatty acids and eicosapentaenoic acid industrial
production as reported by Řezanka et al. 2010 and Cepák et al. 2014. T. minutus was the first
yellow-green alga reported for production of polyunsaturated triacylglycerols, their
production dependence on nitrogen and phosphorus starvation was investigated (Řezanka et
al. 2011). The effects of different temperatures and light intensities on growth and
composition of T. minutus were investigated (Gigova et al. 2012), the optimal temperature for
growth was found to be 25 °C.

14
2. Materials and methods
Cell growth: Cells were grown on WC medium (Guillard and Lorenzen 1972) under three
different light conditions. High light conditions: 200 μmol photons.m-2
.s-1
with spectrum
(fig. 11, green), 22 °C, 15 h light/ 9 h dark, light source: HQI-E 250 W/D Pro Daylight. Low
light conditions: 15 μmol photons.m-2
.s-1
with spectrum (fig. 11, green), 22 °C, 15 h light/ 9 h
dark, light source: HQI-E 250 W/D Pro Daylight. Red light conditions: 15 μmol photons.m-
2.s
-1 with spectrum (fig. 11, red), 22 °C, 15 h light/ 9 h dark, light source: tungsten light bulb.
Light intensities were measured with Hansatech Quantitherm Light meter (Hansatech
Instruments, United Kingdom).
The culture used for growth was 931 Trachydiscus minutus (Bourrelly) Ettl obtained as a kind
gift of Martin Trtílek. The culture was stirred and filtered air (0.22 μm) was constantly
provided during the growth. Cells were collected during late exponential growth phase by
centrifugation (4500 g, 5 min) and frozen at -80 °C until further use.
Fig. 11. Spectra of incident light during cell growth. Earth surface radiation (blue), high/low
light conditions (green), red light conditions (red). Measured with Ocean Optics USB4000
spectrometer. Spectra are normalized to equal areas.
300 400 500 600 700 800 900 1000 1100
Rel
ativ
e in
ten
sity
Wavelength (nm)

15
Isolation of thylakoid membranes: The isolation was performed in a dark room with a dim
green light, at 0-4 °C (on ice) with cooled apparatus. Thawed sample was washed with buffer
(50 mM MES, 6.5 pH, 2mM KCl), centrifuged (1000 g, 5 min), resuspended in the same
buffer and protease inhibitor (cOmplete EDTA-free, Roche Diagnostics) was added. Further,
cells were disrupted at 16 000 PSI using EmulsiFlex-C5 (Avestin Inc., Canada) and
centrifuged (1000 g, 5 min). Supernatant was collected and centrifuged (60 000 g, 40 min).
The pelet from the last centrifugation was resuspended in buffer (50 mM MES, 6.5 pH, 2mM
KCl). Chlorophyll concentration was determined according to Lichtenthaler (Lichtenthaler
1987).
Thylakoid solubilization and sucrose gradient: Thylakoid membranes, corresponding to
250 μg of chlorophyll in 500 μL solution, were solubilized with detergent (tab. I) for 30 min
while stirring on ice. The sample was centrifuged (30 000 g, 30 min) and supernatant (400
μL) was loaded on a 0-1 M continuous sucrose gradient, prepared by freeze-thaw method,
containing 50 mM MES (6.5 pH), 0.55 M sucrose, 2 mM KCl and 0.02 % corresponding
detergent (tab I.), followed by ultracentrifugation (150 000 g, 16 h, 4 °C) using a SW-40
swing-out rotor (Beckman Coulter).
Table I
Detergents and concentrations used for thylakoid solubilization.
Mw (g/mol) Concentrations used (m/V)
n-Dodecyl β-D-maltoside 510.62 0.5 %, 1 %, 2 %, 4 %
n-Dodecyl α-D-maltoside 510.62 1 %, 2.5 % 3 %
Digitonin 1229.31 1 %, 2.5 % 5 %
Gradient zone collection, fluorescence measurement and sample concentration: Visible
zones were collected using syringe. Fluorescence emission 77K (620-780 nm) was measured
using a Spex Fluorolog-2 spectrofluorometer (Jobin Yvon, Edison, NJ, USA) (excitation
wavelength: 435 nm). Further, each zone was concentrated and washed with isolation buffer
(50 mM MES, 6.5 pH, 2 mM KCl) containing 0.02 % detergent to get rid of excess sucrose,
using Amicon Centrifugal filters 30k (10 000 g). Concentrated samples were kept on ice in
dark and analyzed by further methods.

16
SDS-PAGE, ion exchange chromatography, UV-VIS absorption: SDS-PAGE from
selected gradient zones was performed on a 14 % isocratic acrylamide gel SERVAGelTM
in
denaturing conditions according to Laemmli (1970). 25 mM Tris, 192 mM glycine and 1 %
SDS was used as running buffer. The gels were stained by coomassie blue and/or using silver
staining. Anionic exchange chromatography was performed using DEAE Sepharose CL-6B as
stationary phase at the pH of 6.5. Isolation buffer with 0.02 % detergent and linearly
increasing concentration of NaCl (0.005 – 0.5 mol/L) was used as mobile/elution phase at a
flow of 1 mL/min. Absorbance was measured using SHIMADZU UV-2600 absorption
spectrophotometer.
Clean native electrophoresis and 2D SDS-PAGE: The elucidation of protein-complex
content of the sucrose gradient zones, from cells grown on red light, was done using clean
native electrophoresis, according to Komenda et al. (2012), on 4-14 % linear gradient
acrylamide gel, followed by second SDS-PAGE dimension using 12-20 % linear gradient gel
containing 7 M urea. Acrylamide/bisacrylamide ratio in both gels was 38. The gel was stained
using coomassie blue.
Thylakoid isolation from Pisum sativum:. The plant was grown in a greenhouse. Leaves
were harvested in early summer (June), homogenized in 50 mM tricine, 0,4 M sorbitol, 5 mM
MgCl2, 10 mM KCl, 1 mM MnCl2 and 1 % (m/V) BSA. The mixture was centrifuged (1500
g, 2 min), supernatant was again centrifuged at 5000 g (10 min). The pellet was resuspended
and used for detergent solubilization with same conditions as noted above for T. minutus.
Fluorescence spectra normalization and fitting method
Fluorescence spectra were normalized to equal heights. Fitting in figure 33 was done in
following way. Each fraction spectrum was multiplied by a constant. The constants were
varied until the area of their sum was the closest to the area of the zone spectrum.

17
2.1 Principles of used methods
Separation methods
Non-equilibrium ultracentrifugation on a sucrose gradient
Non-equilibrium centrifugation on a gradient is used to separate analytes according to their
size. All molecules/complexes loaded on top of the gradient are forced by the centrifugal
force to move along the gradient, with larger complexes moving faster, because they
experience larger g force, given that all separated complexes have similar density. The
centrifugation has to be stopped before the complex of interest reaches the bottom of the
gradient, which would prevent its separation.
SDS-PAGE / clean native electrophoresis
Electrophoresis on a gel is used for protein separation. They are separated by difference in
their movement speed through the gel. The speed is determined by the size/surface charge
ratio of the polypeptide/complex. Larger and less charged complexes move slower. All
separated complexes need to have same overall charge polarity (introduced by use of
detergent) to move in the same direction. The native electrophoresis is used for protein
separation in their native state. Either colored or colorless detergent is used, determined by the
need for later spectroscopic analysis of the separated complexes. In SDS-PAGE a sodium
dodecyl sulfate (SDS) is used for charge introduction along with a reducing agent and heat for
denaturation, resulting in division of fully denatured polypeptides.
Ion exchange chromatography
Ion exchange is used to separate molecules/complexes according to their surface charge
properties. A column which contains counterions to our molecules of interest, at a given pH
or salinity, has to be used. Analytes bind to the stationary phase and are eluted by a gradient
of either salt or pH. Weakly surface charged molecules elute first.

18
Spectroscopic methods
Fluorescence emission
Fluorescence is a deexcitation of a molecules valence electron by a photon release. It can be
used to get information about the electronic properties of a molecule. An excited electron
usually loses some energy due to thermal exchange, moving itself to a more stable (less
energetic) excited state, resulting in the red shift of emission spectra compared to absorption.
Each chromophore has characteristic maximum of emission wavelength, which corresponds
to the energy difference between the most probable excited state and the ground state. At 77
Kelvin, less energetic states get much more probable, resulting in a shift of maximum towards
longer wavelength and narrowing of the spectrum.
UV/VIS absorption
Absorption spectroscopy, in the ultraviolet and visible regions, is used to get information
about the electronic properties of a chromophore in range of 200-800 nm. Nonbonding and π
electrons absorb in this region. Dependence of absorbance on the incident photon wavelength
is measured. Each chromophore absorbs energy equal to the difference between HOMOs and
the accessible LUMOs. The probability of absorption and the corresponding peak size is
determined by the size of the dipole created on the molecule by electron excitation.

19
3. Results
The reason for our interest in light harvesting complexes of Trachydiscus minutus was the
measured difference in absorption and fluorescence of cells cultivated under high light and
red light conditions as shown in figures 12 and 13.
The absorbance of cells grown under red light (fig. 12, red line) is compared first, it shows
around 50% increase between 700 and 710 nm compared to blue light variant (fig.12, blue
line), yet almost exact match in higher energies below 679 nm. Secondly the fluorescence
spectrum of red light grown cells (fig. 13, red line) is shifted towards lower energy for ~9 nm
and has decreased intensity in the left side of the peak compared to blue light variant (fig. 13,
blue line).
Fig. 12. Comparison of absorption spectra of T. minutus grown under high light (blue line)
and red light (red line) conditions.
Fig. 13. Comparison of 298 K fluorescence spectra of T. minutus cells grown under HL (blue)
and RL (red) conditions.
700
710
679
0,05
0,1
0,15
0,2
0,25
0,3
0,35
0,4
550 600 650 700 750
Ab
sorb
ance
Wavelength (nm)
699 708
600 650 700 750 800
Flu
ore
sce
nce
(arb
.u.)
Wavelength (nm)
20
Aim of this work was first to find a suitable detergent and its concentration which would
allow separation of light absorbing complexes from T. minutus using sucrose gradient. This
method was then used to help explain the different behavior shown on figures 12 and 13. The
sucrose gradient along with spectroscopic methods for characterization of native pigment
protein complexes from Eustigmatophyceae were used previously (Arsalane et al. 1992,
Basso et al. 2014).
3.1 Sucrose gradient optimization
Before the investigation of the chromatic adaptation, suitable conditions for thylakoid
isolation and solubilization were explored. The detergent effectivity was tested on HL grown
samples, because they usually contain the biggest amount of fatty acids (which interfere with
the thylakoid purification). Three detergents (n-dodecyl β-D-maltoside, n-dodecyl α-D-
maltoside, digitonin) at various concentrations (tab. I) were used to solubilize isolated
thylakoids from T. minutus. Sucrose gradient of the solubilized thylakoids, SDS-PAGE and
fluorescence 77K of the gradient zones were used to get a basic insight in the effectivity of
complex solubilization and separation. The overview of these gradients is depicted in figures
14 and 15. The sucrose gradient method for light harvesting protein complex separation was
employed on solubilized thylakoids of pea (fig. 14) to get a visual comparison with higher
plant.
Further analysis of the collected zones as depicted in figures 14 and 15 was done by SDS-
PAGE and fluorescence. Interpretation of these results (which are described in the following
three sections 3.1.1, 3.1.2 and 3.1.3), was based on the data reported in section 3.2.1 (figures
29, 30 and 31).

21
Fig. 14. Comparison of sucrose gradients of solubilized thylakoids of T. minutus and P.
sativum by n-dodecyl β-D-maltoside, zones for SDS-PAGE and fluorescence measurement
were collected as displayed.
Fig. 15. Comparison of sucrose gradients of solubilized thylakoids by n-dodecyl α-D-
maltoside and digitonin, zones for SDS-PAGE and fluorescence measurement were collected
as displayed.

22
3.1.1 n-dodecyl β-D-maltoside
First investigated detergent for solubilization of light absorbing complexes from thylakoid
membranes was β-D-maltoside at concentrations 0.5, 1, 2, and 4%. Solubilized complexes
were then separated on sucrose gradients as shown in figure 14. The composition of collected
zones was further investigated using 14% isocratic SDS-PAGE and fluorescence at 77K. The
analyzed β-D-maltoside gradients are shown along with their respective SDS-PAGE gels in
figures 16 and 17.
Fig. 16. SDS-PAGE of harvested zones from sucrose gradients made using 0.5 % (right) and
4 % (left) β-D-maltoside. (Note the zones on the two gels are in opposite order.)
Fig. 17. SDS-PAGE of harvested zones from the sucrose gradient (using 1 % β-DM).

23
Both photosystem core polypeptides as well as LHC proteins were found using SDS-PAGE in
the collected gradient zones as noted in figures 16 and 17. RuBisCO has copurified in last
harvested zone as shown in the 0.5 % gradient (fig. 16). Further, the fluorescence emission of
marked zones, from 1 % β-DM sample, was measured and compared (figure 18).
Fig. 18. 77 K fluorescence spectra of marked zones from 1 % β-D-maltoside sucrose gradient.
Four distinct fluorescence maxima were found using β-dodecyl maltoside as detergent (fig.
18). Emission maximum at 724 nm corresponds to PSI as found later (F10 in figure 29),
fluorescence with maxima at 711 and 695 nm correspond to LHC oligomers/subunits (F4 and
F2 in figure 29). The peaks around 682 nm represent fluorescence of free pigment released
from denatured complexes.
To further investigate the effect of different detergent concentrations, fluorescence of the two
most chlorophyll dense zones (zone 2 and 4) found in the sucrose gradients are compared for
the three selected detergent concentrations (figure 19). All three samples show maxima in the
same positions in the second zone. Zone 4 from 1 % β-DM gradient is slightly shifted towards
longer wavelength (~2 nm).
682
695 711 724
650 670 690 710 730 750 770
Flu
ore
sce
nce
(arb
.u.)
Wavelength (nm)
1
2
3
4
5
6
24
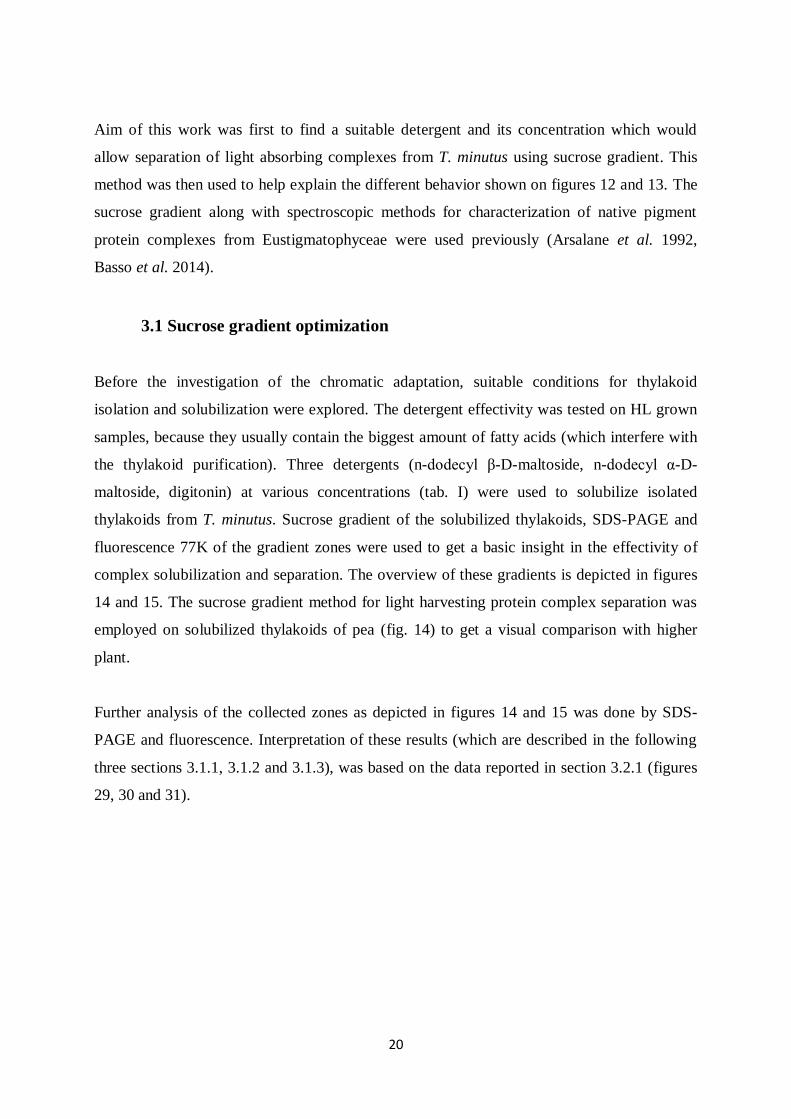
Fig. 19. Comparison of fluorescence spectra of zones 2 (left) and 4 (right) at 77 K from
selected β-D-maltoside gradients.
Fluorescence spectra were measured also at room temperature (295 K). Comparisons of zone
2 and 4 fluorescence at 77 K and 295 K from 4 % β-DM gradient are shown in figure 20.
Spectra measured at 77 K (dark green and dark purple, fig. 20) have maxima at lower energy
(shifted by around 9 nm) compared to room temperature fluorescence (light green and light
purple, fig. 20). Also note that the spectra are narrower at lower temperature.
Fig. 20. Comparison of room temperature (295 K) and 77 K fluorescence spectra of zones 2
(left) and 4 (right) from 4 % β-DM sucrose gradient.
695
660 680 700 720
Flu
ore
sce
nce
(arb
. u.)
Wavelength (nm)
z 2 0,5% β-DM
1% β-DM
4% β-DM
686 695
640 690 740
Flu
ore
scen
ce (a
rb. u
.)
Wavelength (nm)
z2 (295K)
z2 (77K)
701 710
640 690 740
Wavelength (nm)
z4 (295K)
z4 (77K)
694
710
670 690 710 730 750
Wavelength (nm)
z 4 0,5% β-DM
1% β-DM
4% β-DM

25
3.1.2 Digitonin
Digitonin was selected as the next detergent for the light absorbing complexes investigation.
Concentrations of 1, 2.5 and 5 % were employed for thylakoid solubilization. Resulting
gradients are depicted in figure 15. Further, 1 and 5 % digitonin gradients were selected for
SDS-PAGE (fig. 21) and fluorescence (figures 22 and 23) measurements. All the expected
light harvesting complexes (PSI core, PSII core and LHC proteins) were found in the 5 %
digitonin gradient. The acrylamide gel from 1 % digitonin gradient showed insufficient
complex solubilization. Only LHCs and traces of PSII were observed.
Fig. 21. SDS-PAGE of harvested zones from gradients made using 1 and 5 % digitonin as
thylakoid solubilization agent. (Note the zones on the two gels are in opposite order.)
Further, the fluorescence spectra from 1 and 5 % digitonin gradients are shown in figures 22
and 23. Three distinct maxima were found when analyzing the 1 % digitonin gradient by 77 K
fluorescence. The fluorescence maximum at 684 nm corresponds to free pigments, 695 and
711-712 nm maxima are LHC subunits and oligomers (F2 and F4, figure 29). In the 5 %
digitonin gradient the PSI fluorescence (720-725 nm) becomes visible in the bottom zone of
the gradient (fig. 23, line 8).

26
Fig. 22. Fluorescence spectra at 77 K of sucrose gradient zones (1 % digitonin).
Fig. 23. Fluorescence spectra at 77 K of sucrose gradient zones (5 % digitonin).
3.1.3 n-dodecyl α-D-maltoside
The third and last detergent tried for the optimization of thylakoid solubilization was n-
dodecyl α-D-maltoside at 1 and 2.5 % concentration. SDS-PAGE of gradient zones is shown
on figure 24. The same polypeptides were found using the electrophoresis on α-D-maltoside
gradient zones as in the previous cases, but in the 2.5 % α-D-maltoside concentration the
complexes are much more localized to certain height in the sucrose gradient as is apparent
from the SDS-PAGE (fig. 24).
684 695 711
650 670 690 710 730 750
Flu
ore
sce
nce
(arb
. u.)
Wavelength (nm)
1 2
3 4
5 6
7
682 695 711 718
650 670 690 710 730 750
Flu
ore
scen
ce (a
rb. u
.)
Wavelength (nm)
1 2
3 4
5 6
7 8

27
Fig. 24. Sucrose gradients and SDS-PAGE of the harvested zones, as marked. α-D-maltoside
at 1 % concentration (left) and 2.5 % concentration (right) was used for thylakoid
solubilization. (Note the zones on the two gels are in opposite order.)
Same as in previous cases the fluorescence of the gradient zones was measured and is shown
in figures 25 (1 %) and 26 (2.5 %). There were four fluorescence maxima identified in the 1
% α-DM gradient (fig. 25). Fluorescence maximum at 680 nm belongs to free pigment. The
maxima at 695 and 711 nm belong to LHC oligomers/subunits (F2 and F4 in figure 29),
exactly same as in previous cases. The maximum at 722-724 belongs to PSI (F10 in figure
29).
Fig. 25. Fluorescence spectra at 77 K of sucrose gradient zones (1 % α-D-maltoside).
680
695 711 722
650 670 690 710 730 750
Flu
ore
sce
nce
(arb
. u.)
Wavelength (nm)
1 2
3 4
5 6
7

28
In the 2.5 % α-D-maltoside gradient (fig. 26) a new fluorescence maximum was found, in the
zones 4 and 5 (at 690 nm, belonging to PSII, F5 and F7 in figure 29), which was not found in
previous cases. The other three maxima (695, 711 and 725 nm) correspond with results from
1 % α-DM (fig. 25).
Fig. 26. Fluorescence spectra at 77 K of sucrose gradient zones (2.5 % α-D-maltoside).
For further investigation of the chromatic adaptation α-D-maltoside was chosen at 3 %
concentration, based on the results from 2.5 % gradient (fig. 26). α-D-maltoside provided
better focus of the isolated complexes into narrow gradient zones compared to other
detergents/concentrations, also PSII was localized almost exclusively into one zone, having
maximum fluorescence at 690 nm, which was not found previously. Also no LHC proteins
were found in the bottom half of the gradient in the 2.5 % α-DM.
695 711 690 725
660 680 700 720 740 760
Flu
ore
sce
nce
(arb
. u.)
Wavelength (nm)
1
2
3
4
5
6

29
3.2 Investigation of the chromatic adaptation in T. minutus
After obtaining substantial amount of data about HL grown samples during the detergent
optimization, isolated thylakoid membranes from RL and LL samples were solubilized by
3 % n-dodecyl α-D-maltoside and separated on sucrose gradients. They are depicted in figure
27 along with the lower part of their SDS-PAGE (14 % isocratic gel) of zones 2, 3a, 3b and 4
from each gradient (figure 27).
Fig. 27. SDS-PAGE comparison of antennae sized polypeptides from cells grown under the
same light intensity (15 μmol photons.m-2
.s-1
) with different spectra (fig. 1). The increased
presence of polypeptide LHC-R in the RL variant is depicted. (Note the zones on the two gels
are in opposite order.)
Increased presence of one LHC-sized polypeptide was found inside the gradient of RL variant
(compared to HL and LL variants). This polypeptide was named as LHC-R. It is important to
consider at this point that zone 3b and zone 4 (figure 27) were the only zones which showed
different fluorescence when comparing the RL and LL sample. Therefore further investigation
was focused on them. The comparison of fluorescence spectra of zones 3b and 4 from RL and
LL is shown in figure 28. No differences in fluorescence maxima were measured in zones 2
(694 nm maximum) and 3a (710 nm maximum) and anywhere below the zone 4 of the two

30
gradients. On the other hand zone 4 had two maxima from which one (691 nm) is exactly in
the same position in LL as in RL, and the second one is strongly shifted to lower energy in the
RL sample.
Fig. 28. Comparison of 77 K fluorescence of the zones 3b (left) and 4 (right) from sucrose
gradients made using LL and RL cells from figure 27. Zone 4 from all three variants HL, LL
and RL is compared in figure 32.
Two separation methods were further used to get more information about the fluorescence
difference found between zones 3b and 4 in RL and LL samples and about the role of LHC-R
in it. One was clean native electrophoresis of the gradient zones followed by 2D SDS-PAGE
(section 3.2.1). The second one was ion exchange chromatography of zones 3 and 4 (section
3.2.1).
3.2.1 Clean native electrophoresis
To elucidate the origin of a fluorescence maximum at ~718 nm present around the middle of
the RL sucrose gradient (zone 4 RL, figures 27, 28), which was not found in HL and LL
samples, clean native electrophoresis of the RL gradient zones and solubilized thylakoid
membranes was performed (fig. 29). The detergent used for RL grown T. minutus thylakoid
solubilization was n-dodecyl α-D-maltoside at 3% (m/V) concentration. 0-1 M continuous
sucrose gradient was employed for the separation, followed by fluorescence measurement
(77K) of complexes found in the clean native gel (fig. 30).
711
691
715
660 680 700 720 740 760
Flu
ore
sce
nce
(arb
. u.)
Wavelength (nm)
Low light,z 3bRed light,z 3b
691 711 718
660 680 700 720 740 760Wavelength (nm)
Low light,z4Red light,z4

31
Fig. 29. Clean native electrophoresis of harvested zones from the sucrose gradient and
solubilized thylakoids (both RL grown, 3% α-D-maltoside). 5 μg of chlorophyll was used for
each line. Labels F1-F11 designate fractions further studied by fluorescence emission and/or
2D SDS-PAGE. Numbers in the parentheses denote a fluorescence maximum of the fraction
at 77K. Fractions F3 and F5 had two maxima. Zone 1 was omitted from the electrophoresis
due to almost exclusive presence of free pigment.
At least 10 distinct complexes were found in the resulting CN gel, with the widest variety
found in zones 3 and 4, where the fluorescence difference between HL, LL and RL variants
was found previously. To identify the nature of these complexes, second dimension SDS-
PAGE on 12-20% linear gradient acrylamide gel was done (fig. 31), along with fluorescence
measurement of each complex (fig. 30). Lines of CN gel served as the first dimension for 2D-
SDS-PAGE.

32
Using the information from 2D SDS-PAGE (figure 31), PSI and PSII cores were identified in
zones z5 and z4 as fractions F10 and F7 respectively. Fraction F5 was judged to be PSII core
lacking subunit PSII-C. All other fractions (F2, F3, F4, F6, F8 and F9) in figure 29 were
judged to be antenna complexes, based on their protein sizes.
Fluorescence of each complex marked in the CN was measured at 77K (figure 30). Following
the results from 2D SDS-PAGE, each complex was assigned its characteristic 77K
fluorescence maximum. Using the data from this section, the fluorescence spectra and SDS-
PAGE gels from section 3.1 were retrospectively identified.
Fig. 30. Fluorescence spectra at 77K of complexes from native electrophoresis (fig. 29),
fractions F5 and F11 were omitted from this figure for better clarity. Three maxima belonging
to LHC antenna complexes were identified 696, 711 and 720 nm. PSI emits at 727 nm, PSII at
690 nm and free pigment at 677 nm.
The CN in figure 29 was used for 2D SDS-PAGE analysis as shown in figure 31. By analogy
with other reports of Heterokont algae, (Grouneva et al. 2011, thylakoid membrane
complexes analysis of two diatoms by 2D SDS-PAGE), the photosystems were identified.
F1 (677)
F2 (697) F3 (696) F4 (711)
F7 (PSII 690)
F6 (718) F8 (720) F9 (720)
F10 (PSI 727)
655 675 695 715 735 755 775
Flu
ore
scen
ce (a
rb. u
.)
Wavelength (nm)
F1 freepigment
F2 LHC
F3 LHC
F4 LHC
F6 LHC
F7 PS II
F8 LHC
F9 LHC
F10 PS I

33
Green-yellow complexes which were composed of proteins with sized from 20-30 kDa (F2,
F3, F4, F6, F8 and F9) were all judged to be various antenna oligomeric stages or antenna
monomers.
Fig. 31. Two-dimensional SDS-PAGE (12-20% acrylamide) resolution of the light harvesting
complexes from T. minutus. Lanes of native gel (see fig. 29) were cut out and transferred
horizontally on a SDS gel as shown. It was possible to distinguish based on polypeptide sizes
which complex is PSI (F10), PSII (F7 and F5) and antenna systems (F2, F3, F4, F6, F8, F9).
Further, the fluorescence emission difference between HL, LL and RL variants found in
previous sections was analyzed using gathered fluorescence data.

34
3.2.2 Analysis of the chromatic adaptation using fluorescence data
To determine how much the red antenna complexes (F6, F8 and F9, fig. 29) contribute
towards the detected difference in figure 28, fluorescence spectra of zone z4 from HL, LL and
RL version (fig. 32) were fitted with fluorescence spectra of complexes found and measured
in the CN (figure 29), the fitting is shown in figure 33 for each variant. For the purpose of this
fitting, the red oligomers F6, F8 and F9 (from figure 30) were all represented by the spectrum
of F8 (because of their similar fluorescence), and they were called “red antenna”. The F4
antenna (figure 30) is here called “blue antenna”. Fraction F7 is called PSII core and fraction
F5 is called partial PSII core, for reasons mentioned in previous section.
Fig. 32. Comparison of 77 K fluorescence spectra of zones 4 using HL, LL and RL cell
variant. Spectra are the same as in figure 26 (zone 4, purple) and in figure 28.
When comparing the HL, LL and RL variants (figure 33, HL-top, LL-middle, RL-bottom),
two trends were noticed. Firstly the fluorescence contribution of PSII compared to antennas is
the highest in the HL and lowest in the RL variant. On the other hand the presence of
antennas shows opposite trend. Further, there is more contribution of blue antenna in the LL
version compared to HL version. Also, the right part of the RL zone spectrum consists mainly
of the red antenna, which contribution was not present in HL and LL variants.
691 710 718
665 675 685 695 705 715 725 735 745 755
Flu
ore
scen
ce (a
rb. u
.)
Wavelength
zone 4 HL
zone 4 LL
zone 4 RL

35
Fig. 33. Analysis and comparison of the probable composition of zone 4 among the three cell
variants (HL, LL and RL). Fluorescence 77 K spectra of zone 4 from figure 32 were used as
base for the fittings. Spectra of the fitted complexes are taken from CN fluorescence (figure
30). Blue antenna is fraction F4, red antenna represents fractions F6, F8 and F9, PSII core is
fraction F7 and partial PSII core is fraction F5 in figure 29.
691 710
665 675 685 695 705 715 725 735 745 755
Flu
ore
scen
ce (a
rb. u
.)
Wavelength
zone 4 HL
sum
blue antenna
partial PSII core
PSII core
red antenna
710 691
665 675 685 695 705 715 725 735 745 755
Flu
ore
scen
ce (a
rb. u
.)
Wavelength
zone 4 LL
sum
blue antenna
partial PSII core
PSII core
red antenna
690
718
665 675 685 695 705 715 725 735 745 755
Flu
ore
sce
nce
(arb
. u.)
Wavelength
zone 4 RL
sum
blue antenna
partial PSII core
PSII core
red antenna

36
From these fittings it was deduced, that the difference in RL maximum in figure 32 is caused
by presence of the red antenna fluorescence, as shown in figure 33 (bottom). Therefore the
cause of chromatic adaptation in T. minutus was judged to be this antenna in its various
oligomeric stages (F9, F8 and F6, figure 29). To elucidate the possible role of LHC-R protein
(identified in figure 27) in the red F9, F8 and F6 antenna complexes, ion exchange
chromatography was employed on these gradient zones (section 3.2.3).
Zone 4 from the sucrose gradients, which was analyzed above did not contain any PSI. PSI
was found lower in the gradient, due to its bigger size. Fractions F10 and F11 (fig. 29) had
very similar fluorescence (figure 34) but F11 is larger according to the CN. The 2D SDS-
PAGE (fig. 31) identified F10 as PSI, judging from the similar fluorescence spectra and larger
size of F11, F11 was probably PSI with more connected antennas.
Fig. 34. Fluorescence emission spectra at 77 K of components (F10 and F11, fig. 29.).
3.2.3 Ion exchange chromatography
Fluorescence comparison of gradient zones obtained from RL and LL grown samples showed
difference only in zones 3b and 4 (figure 28). An increased presence of one polypeptide, in
RL sample, here called LHC-R, was found in those two zones using SDS-PAGE (figure 27).
Results from the section 3.2.2 suggest that the presence of large antenna systems is
responsible for the fluorescence difference. To investigate the role of LHC-R in these large
antennas, ion exchange chromatography was used on zones 3 and 4 of RL sample, where both
the red shifted complexes (F6, F8 and F9) and more blue antenna F4 were previously found
(figure 29).
726
680 700 720 740 760 780
Flu
ore
scen
ce (a
rb. u
.)
Wavelength (nm)
F10 (PS I)
F11 (PS I with moreantenna proteinsthen F10)

37
Zone 3
Two elutes with the highest chlorophyll density from the anionic chromatography of zone 3
using RL sample (fig. 29) were selected (denoted as i1 and i2). Their analysis by absorbance,
77 K fluorescence spectra and SDS-PAGE is shown in figure 35. Judging from the
polypeptide sizes, both fractions are composed of LHC antennas. The fluorescence maximum
was found to be at 711 nm, which corresponds with fraction F4 (fig. 29). The relative
presence of polypeptide LHC-R compared to the other two LHC polypeptides is low.
Fig. 35. Room temperature absorbance (left), polypeptide composition (middle) and
fluorescence spectrum at 77 K (right) of the selected elutes from ionex chromatography of
sucrose gradient zone 3 from RL sample (fig. 29).
Zone 4
Three elutes with the highest chlorophyll density from the anionic chromatography of sucrose
gradient zone 4 using RL sample (fig. 29) were selected for analysis (denoted as m1, m2 and
m3). Their absorbance and 77 K fluorescence spectra were measured and with electrophoretic
analysis are shown in figures 36 and 37.
694
674
0
0,1
0,2
0,3
0,4
0,5
0,6
600 650 700 750
Ab
sorb
ance
Wavelength (nm)
i1
i2
711
660 680 700 720 740 760
Flu
ore
scen
ce (a
rb. u
.)
Wavelength (nm)
i1
i2

38
Fig. 36. Absorbance and SDS-PAGE of anionic chromatography fractions m1-m3 from the
zone z4 of RL gradient (figure 29).
Fig. 37. Fluorescence spectra at 77 K of anionic chromatography fractions m1-m3 from the
zone z4 of sucrose RL gradient (figure 29), (for protein composition see fig. 36). The 689 nm
maximum corresponds to the core of PSII. The peak at 719 nm corresponds to the LHC
oligomers (F6, F8 and F9, figure 29).
Judging from the polypeptide sizes, all three fractions m1, m2 and m3 contain PSII and
antennas (fig. 36). As the relative presence of antenna towards PSII increased, an absorption
peak at 702 nm and emission peak at 719 nm (fig 37) was detected, the fluorescence
671
702
0
0,05
0,1
0,15
0,2
0,25
0,3
0,35
0,4
0,45
550 600 650 700 750
Ab
sorb
ance
Wavelength (nm)
m1
m2
m3
689
719
650 670 690 710 730 750
Flu
ore
sce
nce
(arb
. u.)
Wavelenght (nm)
m1
m2
m3

39
maximum at 719 nm corresponds to fractions F6, F8 and F9; 689 nm corresponds to F7 (fig.
29). The ratio of LHC-R towards the other two LHC polypeptides is much higher when
compared with fractions i1 and i2 of zone 3 (fig. 35), suggesting its involvement in the 702
nm light absorption and 719 nm emission.
The maximum of fluorescence emission in figure 35 (711 nm) exactly matches the
fluorescence of fraction F4 (figure 29) and also matches the fluorescence maxima of LHC
oligomeric zones from HL samples (figures 18, 22 and 26, 711 nm maxima) and LL sample
(figure 28, blue line).
On the other hand, fluorescence maximum in Figure 36 (719 nm, fraction m3) matches the
fluorescence of fractions F6, F8 and F9 (figure 29) and also matches the maximum of the
LHC oligomeric zone 4 from RL sample (figure 28, red line).
Comparing the protein composition of fraction i1, i2, m2 and m3 (figures 35 and 36), the
amount LHC-R gets significantly larger in the m2 and m3 fractions relative to the other two
LHC sized peptides than in figure 35. These results show that LHC-R must be involved in the
spectroscopic difference between the F4 antenna complex and the larger ones (F6, F8 and F9,
figure 29).

40
4. Discussion
The protein and pigment composition of algae antenna systems shows great variability.
Understanding this antennae diversity provides information on the connection between their
structure, function and adaptation to different environmental factors. In the case of
Trachydiscus and other algae with a potential for industrial application, detailed knowledge of
structure and function of their antenna systems will allow better optimization of their biomass
production via genetic engineering.
4.1 Sucrose gradient optimization
Three non-ionic detergents were investigated for the thylakoid membrane solubilization at
various concentrations (tab. I), n-dodecyl α-D-maltoside, n-dodecyl β-D-maltoside and
digitonin. The effectivity of retaining the protein-pigment complex nativity and their
separation on sucrose gradient was compared using fluorescence emission spectra and SDS-
PAGE (figures 16-26).
Similar patterns were observed when using the variety of detergents and their concentrations
(figures 16-26). In the upper part of the gradient, fluorescence maximum of 680-684 nm was
observed belonging to free chlorophyll and partly denatured proteins, corresponding to
fraction F1 in CN (fig. 29). The first darker green zone in the gradients always showed
emission at 695 nm, belonging to a LHC subunit (possibly a monomer, F2, fig 29). The
second dark green zone (poorly resolved in the case of digitonin) had fluorescence maximum
at 711-712 nm, which was later found to be an LHC oligomer (F4, fig 29). This result
suggests that it is possible to perform the thylakoid membrane solubilization using any of
these detergents, when the proper concentration is found.
When using β and α-D-maltoside, a fluorescence maximum of 724 nm was found to dominate
in the lower half of the sucrose gradients, belonging to PSI (F10, fig 29). The chosen
digitonin concentrations for this work were apparently not sufficient to properly solubilize the
thylakoid membranes (no ~724 nm maximum belonging to PSI was observed). Given the
molar weight of digitonin being twice as much as D-maltosides (tab. I), the digitonin (m/V)

41
loads would probably need to be at least twice as large to get comparable results with D-
maltosides.
The concentration of β-D-maltoside above 1 % led to bigger dissolution of gradient zone 4, as
is apparent from bigger chlorophyll concentration in the upper zones of 2 and 4 % β-DM
gradients compared to 0.5 and 1 % (figure 14). This result supports the idea that the zone 4 in
figure 14 is in fact made from antenna oligomers, which can dissociate into smaller units upon
detergent treatment.
The main difference when using α-D-maltoside compared to the other two detergents was an
additional fluorescence maximum at 690 nm (figure 26, lines 4 and 5). It was not observed for
the other two detergents in any part of their gradients. Further investigation showed that this
maximum belongs to the core of PSII (F7, figures 29, 31). It was possible to make the PSII
directly visible on the sucrose gradient by twice freeze thawing the solubilized thylakoid
membranes, which resulted in complete breakdown of the larger LHC oligomers. Such
sample in the middle part of the gradient lacks LHC oligomers as shown in figure 38. This
result suggests that PSII core is much more stable towards repeated freezing and detergent
solubilization than the present antenna complexes in T minutus.
Fig. 38. Comparison of sucrose gradients of freshly
solubilized thylakoids (right) and twice freeze-thawed
solubilized thylakoids (left), 2,5 % α-DM was used as
detergent in both cases. Only the core of PSII remains
visible in the middle part of the gradient.
α-D-maltoside was judged to be the better detergent for the analysis than β-DM, because of
the presence of PSII core in one zone (zone 4, figure 24, right SDS-PAGE), and containment
of the LHC polypeptides to the upper half of the gradient (zones 1-3, figure 24). Similar result
was reported by Pagliano et al. (2011), when comparing α and β-D-maltoside solubilization

42
effectivity of large thylakoid complexes, α-D-maltoside was found to retain higher amount of
larger complexes compared to its β isoform.
Digitonin gradients (fig. 15) had different profiles than the maltoside gradients, probably
because the molecular weight of digitonin is higher (tab. I), thus digitonin forms larger
complexes, which are found lower in the sucrose gradients. Also, the various complexes were
not as concentrated into distinct bands as in the case of maltosides, Therefore digitonin was
not used further.
The sucrose gradient method was also applied on thylakoids isolated from pea (figure 14, left
gradient), to get a comparison with higher plants, which were well studied in the past.
Similarly looking gradient was also reported by Opačić et al. (2014) using Arabidopsis
thaliana, showing that the sucrose gradient method is well reproducible for various
photosynthetic organisms.
Comparison of fluorescence spectra at 295 K and 77 K (figure 20) suggests that low
temperature spectra are more effective for identifying various complexes (as used in figure
33) because of their narrower character. Therefore it is also easier to identify whether the
signal is coming from one or more complexes, this is especially visible in comparison of zone
2 in figure 20.
4.2 Chromatic adaptation of T. minutus
The investigation started by comparing the protein composition and fluorescence properties of
RL, LL (figures 27 and 28) and HL sample (figures 24 (2.5 %) and 25). Difference in protein
composition was detected in the upper half of the gradient. One protein, here called LHC-R
(fig. 27) was significantly more expressed in the RL variant than in LL and HL. LHC-R was
detected in the zones 2, 3 and 4. The fluorescence comparison of these three zones showed
red shift only in lower part of zone 3 and mainly in the zone 4 as shown on figure 28. This
result suggests that the red shift is caused by complex with size similar to PSII, which was
also found in the zone 4 of the sucrose gradient. Therefore further focus was primarily to
explore the composition of these two zones to a greater detail.

43
The pigment composition of the RL grown cells was analyzed to be: chlorophyll a 54.5 %,
violaxanthin 25.9 %, β-carotene 14.1 % and vaucheriaxanthin 5.5 % (R. Litvín, unpublished
results). These are the same pigments as reported previously (Přibyl et al. 2012) for T.
minutus. The chromatic adaptation was therefore not caused by synthesis of a pigment with
different chemical structure.
4.2.1 Light harvesting complexes found using clean native electrophoresis
To get more detailed information about the composition of the gradient zones from RL
sample, which showed new fluorescence maximum at 718 nm (figure 28), which was not
detected previously in the high light and low light samples, complexes from the harvested
zones were separated using CN (figure 29). Fluorescence 77K emission was measured of the
present complexes (figure 30) and to differentiate photosystems from antenna complexes a 2D
SDS-PAGE was performed (figure 31).
Even more importantly from the results (figure 29-31) it was possible to assign characteristic
fluorescence maximum to each of these complexes, which allowed their identification and
relation in all the other fluorescence measurements throughout the thesis. Note that the
fluorescence maximum measured from the CN gel is usually 1 or 2 nm shifted to the red
compared to fluorescence measured from buffer solutions, which is most likely caused by the
different chemical environment of gel and buffer.
Fractions F4, F6, F8 and F9 (figure 29) were judged to be antenna oligomers based on their
protein sizes determined by SDS-PAGE (fig. 31). In the CN (fig. 29) these complexes
migrated to a position similar to PSII. Since they are all made of proteins with sizes around
20-30 kDa, they had to be oligomers. The ability of Heterokont algae antennas to form
oligomers was reported multiple times already, as mentioned in the introduction (Lepetit et al.
2012, Basso et al. 2014). These four antenna oligomers (F4, F6, F8 and F9, figure 29) were
divided into two groups for further analysis according to their 77 K fluorescence maxima.
Three of them show similar fluorescence maximum at ~719 nm (F6, F8 and F9, figure 29)
and were called red antenna, and one (F4, fig. 29) has its maximum at 711 nm and was called
blue antenna.

44
The group of three complexes F6, F8 and F9 representing “red antennas“ (they probably
differ just in the number of subunits, based on the results in section 3.2.3) seem to be
responsible for the chromatic adaptation, because they are not dominantly present in HL and
LL form (figure 33), and their fluorescence maximum exactly matches the RL sample from
figure 28. The fluorescence maximum of the LHC oligomer F4 (fig. 29) at 711 nm is in exact
match with fluorescence of LHC zones measured throughout the HL investigation in the
section 3.1, and also with the maximum of LL sample on figure 28. This result suggests that
complex F4 is the dominant antenna in HL and LL version of the cells.
The complexes F2 and F3 (figure 29) are most likely subunits (monomers or trimers) of the
oligomeric antennas mentioned above. F3 showed a local fluorescence maximum at ~715 nm
(figure 30), which suggests that it may be a subunit of the F9, F8 and F7 oligomers, with a
residual red fluorescence.
Photosystem I was found in the lower half of RL gradient with various amounts of antenna
connected (F10, F11, figure 29). This result suggests variable binding strength of PSI
antennas towards the core, also that the antennas bind PSI core more tightly than PSII core.
PSII was not observed with any peripheral antennas, which is the same result as reported by
Basso et al. (2014) on Nannochloropsis gaditana (also an Eustigmatophyte alga).
Photosystem II was found near the middle of the gradient in two main forms, one was
probably a monomeric core (F7, fig. 29). The second one was PSII core missing protein PSII-
C (F5, figure 31). This result suggests that the PSII-C protein is the weakest bound protein in
PSII core, and is the first one to disconnect when detergent solubilization is employed.
When comparing the result for solubilized thylakoids in the CN (figure 29, left side) with the
analyzed zones (zones 2-6, right side), it is apparent that no complex was lost during the
ultracentrifugation, subsequent zone harvesting and preparation of the zones for the CN. This
result suggests that the sucrose gradient method is very effective and correct for separation of
protein mixtures with different size. Further, the solubilized thylakoids line, shows much
better real proportion between the complexes, as they are inside the thylakoids. This suggests
that the antenna fractions F4 and F6 are especially abundant in the RL sample compared to
other complexes, especially photosystems. Which implies that during low light conditions the
main light absorbing component of thylakoid membranes are antennas.
45
4.2.2 Mechanism of the chromatic adaptation proposed by fluorescence analysis
After the identification of various complexes present in the sucrose gradient using CN,
fluorescence and 2D SDS-PAGE (figures 29, 30 and 31). It was possible to determine the
composition of the sucrose gradient zones to a greater detail, as shown in figure 33. It is
important to notice that this fitting of different components can be done in multiple ways, all
of which would give rather similar sum. However, from the shape of the spectra and their
maxima it was possible to determine whether the main contribution is made by a photosystem
II or various antennas.
Comparing the fluorescence spectra of HL, LL and RL gradient zones, using α-DM as
detergent (figures 26 and 27), the major difference in fluorescence emission was localized to
zone 4 and lower part of zone 3. As found in the CN (figure 29) and subsequent analysis
(figure 33), the fluorescence shift in zones 3b and 4 was caused by an antenna complex which
is dominantly present only in RL version. Analysis in figure 33 also suggests that LL version
contains bigger contribution from the blue antenna than HL version, which again supports the
theory that the primary antenna function is to provide more energy for reaction centers.
These variable amounts and different kinds of antennas present in HL, LL and RL variants (as
shown in figure 33) suggest that T. minutus also has a mechanism of regulation of the
abundance and character of antennas which get incorporated into its thylakoids, depending on
the growth conditions. Same as previously reported for many eukaryotic photosynthetic
organisms, for example in chlorophyte alga by Sukenik et al. (1988).
4.2.3 Antenna protein composition investigated by ionex chromatography
Second method used to further characterize the zones 3 and 4 (figure 27) of RL sample was
separation using anionic chromatography with subsequent absorption and fluorescence
measurements and SDS-PAGE analysis of elutes with high chlorophyll concentration. The
results of this investigation are depicted on figures 35, 36 and 37.
When fractions i1 and i2 from zone 3 (where the relative amount of LHC-R is low) were
compared with fractions m2 and m3 from zone 4 (where the relative amount of LHC-R was
higher compared to zone 3), a difference in absorbance was detected. When LHC-R gets

46
dominant, the red peak on absorption spectrum (fig. 35, 36) shifts from ~694 nm to ~702 nm,
which exactly corresponds with the difference in absorbance between RL and HL cells in
figure 12, where largely increased absorbance was detected between 700-705 nm. This result
suggests that the increased presence of protein LHC-R in antennas was responsible for the
chromatic adaptation.
Similarly the fluorescence emission changes (with the increased presence of LHC-R) from
711 nm (fig. 35), which exactly matches the fluorescence of antenna zones detected in HL and
LL samples in section 3, to 719 nm, which again matches the maximum fluorescence of zone
4 of RL sample (figure 28). Therefore, from fluorescence spectra it can be also concluded that
antenna complexes containing LHC-R protein are directly responsible for the spectroscopic
difference depicted in figures 12 and 13.
Based on the chromatography results along with the fluorescence analysis from section 3.2.2,
it was concluded that T. minutus can build two different types of antennae systems (in figure
33 called red/blue antenna), which differ in the spectral composition of light absorption and
fluorescence and also in protein composition. The difference in their 77 K fluorescence
maximum is around 10 nm, which could explain the difference depicted in figure 13 (spectra
in figure 13 were measured on whole cells).
The elution gradient for anionic exchange chromatography probably could have been chosen
less steep, which would possibly result in better separation of the present complexes.
However it was possible to determine the role of LHC-R in the chromatic adaptation. Based
on the results in section 3.2.3 a theory is proposed, that the red and blue antennas are each
made of two apoproteins. They both share one protein (the smallest one in figures 35 and 36).
The red shift from blue to red antenna is then caused by switching the other apoprotein (the
larger one) for LHC-R. However this could not have been definitely proven. This should be
the subject of future investigation.
4.3 Mechanism of the red shift and purpose of the red antenna complexes
Since the pigment analysis did not show any other chlorophyll than chlorophyll a (as
mentioned earlier in section 4.2), it is reasonable to assume that the increased red light
absorption (in RL variant) is absorbed by chlorophyll a. Figure 39 shows, that the position of

47
maximum in the fluorescence emission spectrum corresponds (with the exception of PSII
core) to position of the light harvesting complex in the sucrose gradient. With increasing size
of each complex the fluorescence of chlorophyll a is shifted more towards red, suggesting a
connection between the energy of transition and the complex size.
This analysis supports the theory of exciton coupling (van Amerongen et al., 2000), where
multiple chlorophyll molecules, when close enough and in a favorable orientation to each
other, form a intermolecular delocalized HOMO which is, compared to monomers, higher in
energy, allowing less energetic transitions, which results in greater absorption of less
energetic red light. Therefore it is highly probable that the identified LHC-R protein, by its
incorporation into LHC antennas, is bringing multiple chlorophyll molecules in orientations
where they can interact with each other more effectively.
Fig. 39. Comparison of 77 K fluorescence emission maxima with complexes positions in the
sucrose gradient, spectra are taken from figure 30 (fraction F4 is here called LHC 711, F6 is
LHC 718 and F9 is LHC 720).

48
The ability of increased light absorption around 700-710 nm (fig. 12) can be an evolutionary
advantage for T. minutus. As shown in figure 40, around one meter under the water surface
containing cyanobacteria, which are omnipresent in our climate, the leftover light is stronger
above 700 nm than in between 600-700 nm. Being able to utilize this light effectively enables
T. minutus to harvest more light than other algae.
Fig. 40. Model of incident light filtered by cyanobacteria. The peak of available energy above
700 nm is apparent on the green spectrum. Solar spectrum: Sunlight ASTM G173-03
Reference Spectra Derived from SMARTS v. 2.9.2. Water absorption: Buiteveld et al. (1994).
Cyanobacteria: Synechococcus PCC 7002 cells measured locally.
0
200
400
600
800
350 400 450 500 550 600 650 700 750 800
rela
tive
inte
nsi
ty n
(ph
oto
ns)
Wavelength (nm)
incident light at sea level
solar spectrum after passagethrough 1 m of water
solar spectrum after passagethrough 1m of water and a layer ofcyanobacteria with OD=1 atphycobilisome maximum (~640 nm)
49
5 Conclusions
- It was determined that n-dodecyl α-D-maltoside provided better separation of T.
minutus thylakoid membrane components when used as solubilization detergent
compared to β-D-maltoside.
- Two major types of light harvesting antennas were found in thylakoids of T. minutus.
They differ in their light absorption spectra and also in protein composition. Relative
quantity of these antennas inside thylakoids changes with variable growth conditions
of the cells.
- The chromatic adaptation in T. minutus is achieved by increased expression of LHC
sized polypeptide (here called LHC-R), which causes creation of large antenna
oligomer, which shows fluorescence (77 K) maxima around 720 nm and increased
absorption around 702 nm.
- A theory is proposed, that the two identified antenna groups are both made of two
apoproteins, while sharing one of them. The nature of the second apoprotein, which in
the red antenna is LHC-R, enables the present pigments to utilize less energetic light.
Acknowledgments
This work was supported by GAČR grant 14-01377P. My thanks to Radek Litvín for the
thesis supervision and guidance, David Bína for theoretical background and ionex
chromatography introduction, Martina Bečková and Zdeno Gardian for clean native
electrophoresis presentation, Ivana Hunalová for help with fluorescence measurements,
František Matoušek for the thylakoid isolation introduction and Josef Tichý for countless
advice during the whole work.

50
6 References
(1) http://www.chem.qmul.ac.uk/iubmb/enzyme/reaction/polysacc/Calvin2.html
Allen JF (1992) Protein-phosphorylation in regulation of photosynthesis. Biochim. Biophys.
Acta, 1098: 275-335.
Arsalane W, Roussea B and Thomas JC (1992) Isolation and characterizazion of native
pigment protein complexes from 2 eustigmatophyceae. J. Phycol., 28: 32-36.
Ballottari M, Girardon J, Dall'Osto L and Bassi R (2012) Evolution and functional properties
of Photosystem II light harvesting complexes in eukaryotes. Biochimica et Biophysica
Acta, 1817: 143-157.
Baniulis D, Yamashita E, Zhang H, et al. (2008) Structure–function of the cytochrome b6 f
complex. Photochemistry and Photobiology, 84: 1349–1358.
Basso S, Simionato D, Gerotto C, Segalla A, Giacometti GM and Morosinotto T (2014)
Characterization of the photosynthetic apparatus of the Eustigmatophycean
Nannochloropsis gaditana: Evidence of convergent evolution in the supramolecular
organization of photosystem I. Biochimica et Biophysica Acta, 1837: 306-314.
Beer A, Gundermann K, Beckmann J and Büchel C (2006) Subunit composition and
pigmentation of fucoxanthin-chlorophyll proteins in diatoms: Evidence for a subunit
involved in diadinoxanthin and diatoxanthin binding. Biochemistry, 45: 13046 -13053.
Bína D, Gardian Z, Herbstová M, Kotabová E, Koník P, Litvín R, Prášil O, Tichý J and
Vácha F (2014) Novel type of red-shifted chlorophyll a antenna complex from
Chromera velia: II. Biochemistry and spectroscopy. Biochimica et Biophysica Acta,
1873: 802-810.
Blankenship RE (2014) Molecular mechanisms of photosynthesis, 2nd
edition. Wiley
Blackwell, New Jersey.
Buiteveld H, Hakvoort JMH and Donze M (1994) The optical properties of pure water. SPIE
Proceedings on Ocean Optics XII, edited by J. S. Jaffe. 2258: 174-183.
C. Büchel (2003) Fucoxanthin-chlorophyll proteins in diatoms: 18 and 19 kDa subunits
assemble into different oligomeric states. Biochemistry, 42: 13027–13034.
Calvin M (1989) 40 years of photosynthesis and relatedactivities. Photosynth. Res., 21: 3–16.
Cepák V, Přibyl P, Kohoutková J (2014) Optimization of cultivation conditions for fatty acid
composition and EPA production in the eustigmatophycean microalga Trachydiscus
minutus. J. Appl. Phycol., 26: 181-190.

51
Dekker JP, Boekema EJ (2005) Supramolecular organization of thylakoid membrane proteins
in green plants. Biochimica et Biophysica Acta, 1706: 12-39.
Dekker JP, van Roon H and Boekema EJ (1999) Heptameric association of light- harvesting
complex II trimers in partially solubilized photosystem II membranes. FEBS Lett., 449:
211-214.
Fawley KP, Eliáš M and Fawley MW (2014) The diversity and phylogeny of the
commercially important algal class Eustigmatophyceae, including the new clade
Goniochloridales. J. Appl. Phycol., 26: 1773-1782.
Förster T (1965) Delocalized excitation and excitation transfer. In: Modern Quantum
Chemistry Istanbul Lectures, Vol. 3 O. Sinanoglu (ed.) New York: Academic Press, pp.
93–137.
Gigova L, Ivanova N, Gacheva G, Andreeva R and Furnadzhieva S (2012) Response of
Trachydiscus minutus (xanthophyceae) to temperature and light. J. Phycol., 48: 85-93.
Graham JE, Wilcox LW and Graham LE (2008) Algae, 2nd Edn. San Francisco: Benjamin
Cummings.
Grouneva I, Rokka A, Eva-Mari A (2011) The Thylakoid Membrane Proteome of Two
Marine Diatoms Outlines Both Diatom-Specific and Species-Specific Features of the
Photosynthetic Machinery. J. Proteome Res. 10: 5338–5353.
Guillard RRL, Lorenzen CJ (1972) Yellow-green algae with chlorophyllide C. Journal of
Phycology, 8: 10-14.
Hasan SS, Yamashita E, Baniulis D and Cramer WA (2013) Quinone-dependent proton
transfer pathways in the photosynthetic cytochrome b6f complex. Proc. Natl. Acad. Sci.
USA, 110: 4297–4302.
Komenda J, Knoppová J, Kopečná J, Sobotka R, Halada P, Yu J, Nickelsen J, Boehm M and
Nixon PJ (2012) The Psb27 assembly factor binds to the CO43 complex of photosystem
II in the cyanobacterium Synechocystis sp. PCC 6803. Plant Physiology, 158: 476-486.
Kotabová E, Jarešová J, Kaňa R, Sobotka R, Bína D and Prášil O (2014) Novel type of red-
shifted chlorophyll a antenna complex from Chromera velia. I. Physiological relevance
and functional connection to photosystems. Biochimica et Biophysica Acta, 1873: 734-
743.
Kügler M, Jänsch L, Kruft V, Schmitz UK and Braun HP (1997) Analysis of the chloroplast
protein complexes by blue-native polyacrylamide gel electrophoresis (BN-PAGE).
Photosynthesis Research, 53: 35-44.
52
Kühlbrandt W, Wang DN and Fujiyoshi Y (1994) Atomic model of plant light-harvesting
complex by electron crystallography. Nature, 367: 614-621.
Laemmli UK (1970) Cleavage of Structural Proteins during the Assembly of the Head of
Bacteriophage T4. Nature, 277: 680-685.
Lepetit B, Goss R, Jakob T and Wilhelm C (2012) Molecular dynamics of the diatom
thylakoid membrane under different light conditions. Photosynth. Res., 111: 245-257.
Lichtenthaler HK (1987) Chlorophylls and carotenoids - Pigments of photosynthetic
biomembranes. Methods in Enzymology, 148: 350-382.
Margulis L (1993) Symbiosis in Cell Evolution: MicrobialCommunities in the Archean and
Proterozoic Eons. San Francisco:W. H. Freeman.
Noji H, Yasuda R, Yoshida M and Kinoshita K (1997) Direct observation of the rotation of
the F1-ATPase. Nature, 386: 299–302.
Opačić M, Durand G, Bosco M, Polidori A nad Popot JL (2014) Amphipols and
Photosynthetic Light-Harvesting Pigment-Protein Complexes. J. Membrane Biol., 247:
1037-1041.
Pagliano C, Barera S, Fabiana C, Saracco G and Barber J (2011) Comparison of the α and β
isomeric forms of the detergent n-dodecyl-D-maltoside for solubilizing photosynthetic
complexes from pea thylakoid membranes. Biochimica et Biophysica Acta, 1817: 1506-
1515.
Pedro AS, González-López CV, Acién FG and Molina-Grima E (2014) Outdoor pilot-scale
production of Nannochloropsis gaditana: Influence of culture parameters and lipid
production rates in tubular photobioreactors. Bioresource Technology, 169: 667-676.
Polivka T and Frank HA (2010) Molecular factors controlling photosynthetic light harvesting
by carotenoids. Acc. Chem. Res., 43: 1125–1134.
Přibyl P, Eliáš M, Cepák V, Lukavský J and Kaštánek P (2012) Zoosporogenesis,
morphology, ultrastructure, pigment composition, and phylogenetic position of
Trachidiscus minutus (Eustigmatophyceae, Heterokontophyta). J. Phycol., 48: 231-242.
Řezanka T, Lukavský J, Nedbalová L and Sigler K (2011) Effect of nitrogen and phosphorus
starvation on the polyunsaturated triacylglycerol composition, including positional
isomer distribution, in the alga Trachydiscus minutus. Phytochemistry, 72: 2342-2351.
Řezanka T, Petránková M, Cepák V, Přibyl P, Sigler K and Cajthaml T (2010) Trachydiscus
minutus, a New Biotechnological Source of Eicosapentaenoic acid. Folia Microbiol.,
55: 265-269.

53
Schmid VHR, Cammarata KV, Bruns BU and Schmidt GW (1997) In vitro reconstitution of
the photosystem I light-harvesting complex LHCI-730: Heterodimerization is required
for antenna pigment organization. Proc. Natl. Acad. Sci. USA, 94: 7667-7672.
Scholes GD (2010) Quantum-coherent electronic energy transfer: Did nature think of it first?
J. Phys. Chem. Lett., 1: 2–8.
Sukenik A, Bennett J, Falkowski P (1998) Changes in the abundance of individual
apoproteins of light-harvesting chlorophyll complexes of Photosystem I and II with
growth irradiance in the marine chlorophyte Dunaliella tertiolecta. Biochimica et
Biophysica Acta, 932: 206-215.
Umena Y, Kawakami K, Shen J and Kamiya N (2011) Crystal structure of oxygen-evolving
photosystem II at a resolution of 1.9 Å. Nature, 473: 55-60.
van Amerongen H, van Grondelle R and Valkunas L (2000) Photosynthetic Excitons.
London: World Scientific.
Vinyard DJ, Ananyev GM and Dismukes GC (2013) Photosystem II: The Reaction Center of
Oxygenic Photosynthesis. Annual Review of Biochemistry, 82: 577–606.
Wientjes E, Oostergetel GT, Jansson S, Boekema EJ and Croce R (2009) The Role of Lhca
Complexes in the Supramolecular Organization of Higher Plant Photosystem I. J. Biol.
Chem., 284: 7803-7810.
Wientjes E, van Amerongen H and Croce R (2013) LHCII is an antenna of both photosystems
after long-term acclimation. Biochimica et Biophysica Acta, 1827: 420-426.
Zhang D, Xue S, Sun Z, Liang K, Wang L, Zhang Q and Cong W (2014) Investigation of
continuous-batch mode of two-stage culture of Nannochloropsis sp. for lipid
production. Bioprocess Biosyst. Eng., 37: 2073-2082.