Embed Size (px)
Citation preview
Lifting the Fog from FOG Receiving
WEFTEC New Orleans, Louisiana
Rashi Gupta, P.E. Carollo Engineers
September 27, 2016
File
nam
e.pp
t/2
Acknowledgements
• Co-Authors:− Daniel Meacham (Carollo, CA)
− Phil Parkins (Carollo, AZ)
− Travis A. Peacock (Albuquerque Bernalillo County Water Utility Authority, NM)
− Anthony L. Montoya (Albuquerque Bernalillo County Water Utility Authority, NM)
• Review:− Gary Deis (Carollo, CA)
File
nam
e.pp
t/3
Understanding the whole picture is necessary for informed decision-making• Water Authority knew that when it’s digested, FOG
has many benefits
• Site visits and a detailed survey of existing facilities helped answer these questions
• Reduces clogs in collection system• Decreases energy demand for treatment• Produces energy
… but, what issues do we have to consider?… have facilities seen the expected benefits? … and how do we make it successful?
File
nam
e.pp
t/4
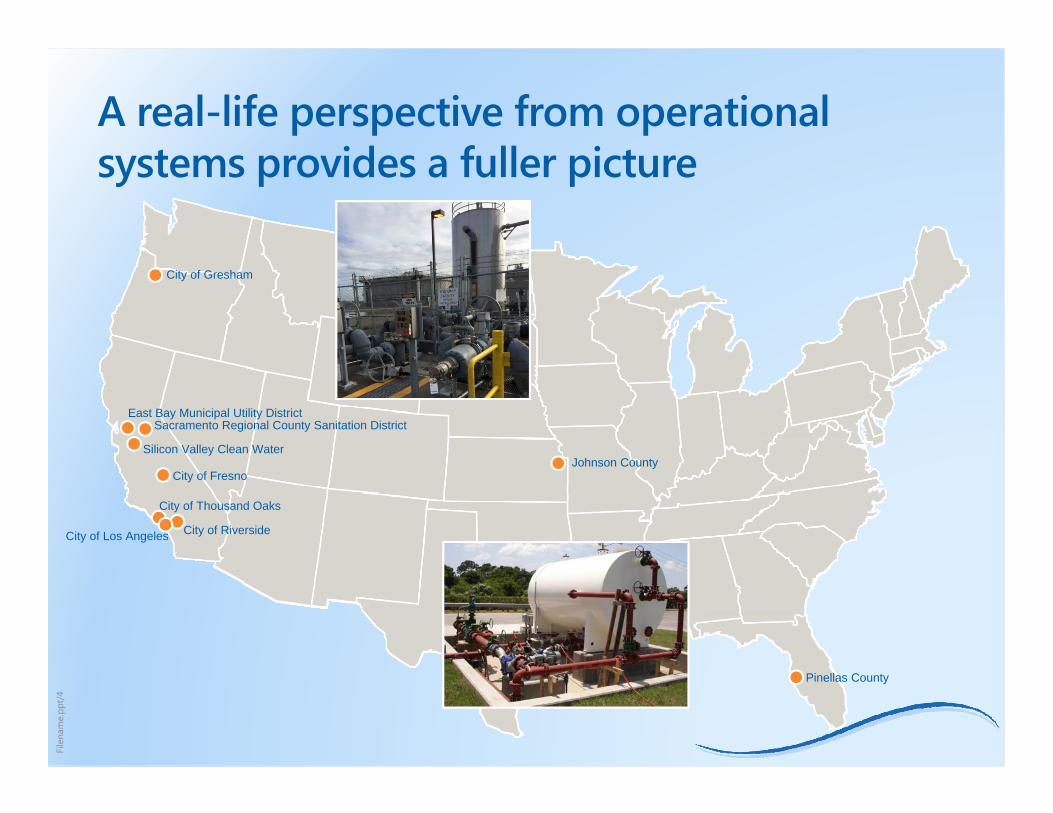
A real-life perspective from operational systems provides a fuller picture
East Bay Municipal Utility District
City of Gresham
City of Los Angeles
Pinellas County
Johnson County
City of Riverside
City of Fresno
City of Thousand Oaks
Silicon Valley Clean Water
Sacramento Regional County Sanitation District
File
nam
e.pp
t/5
Facility investigations were comprehensive
• Facility background and drivers
• FOG characteristics and quality control
• FOG receiving station equipment, materials, and cost
• O&M issues and requirements
• Impacts on digester gas production and revenue from tipping fees
File
nam
e.pp
t/6
Facility Facts
• Plant Average Dry Weather Flow (ADWF) Capacity: 12.5 – 450 mgd
• FOG Receiving Station Capacity: 12,000 – 175,000 gpd
• FOG Receiving Station Storage Capacity: 5,000 –60,000 gallons
• Years of FOG Receiving Station Operation: 3 – 11 years
File
nam
e.pp
t/7
Specific drivers initiated FOG projects
• Reduced utility costs through increased digester gas production
• Reduced clogging and impacts on collection system
• Improved sustainability and reduced greenhouse gas emissions
• Revenue generation
File
nam
e.pp
t/8
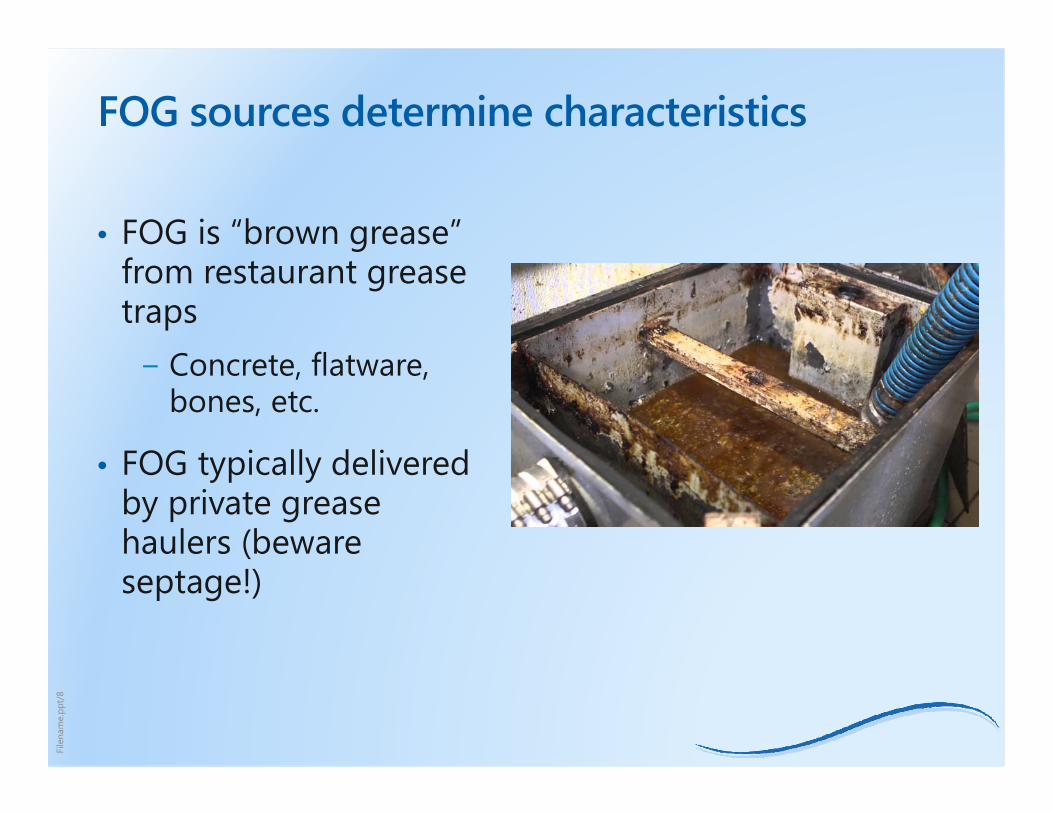
FOG sources determine characteristics
• FOG is “brown grease” from restaurant grease traps− Concrete, flatware,
bones, etc.
• FOG typically delivered by private grease haulers (beware septage!)
File
nam
e.pp
t/9
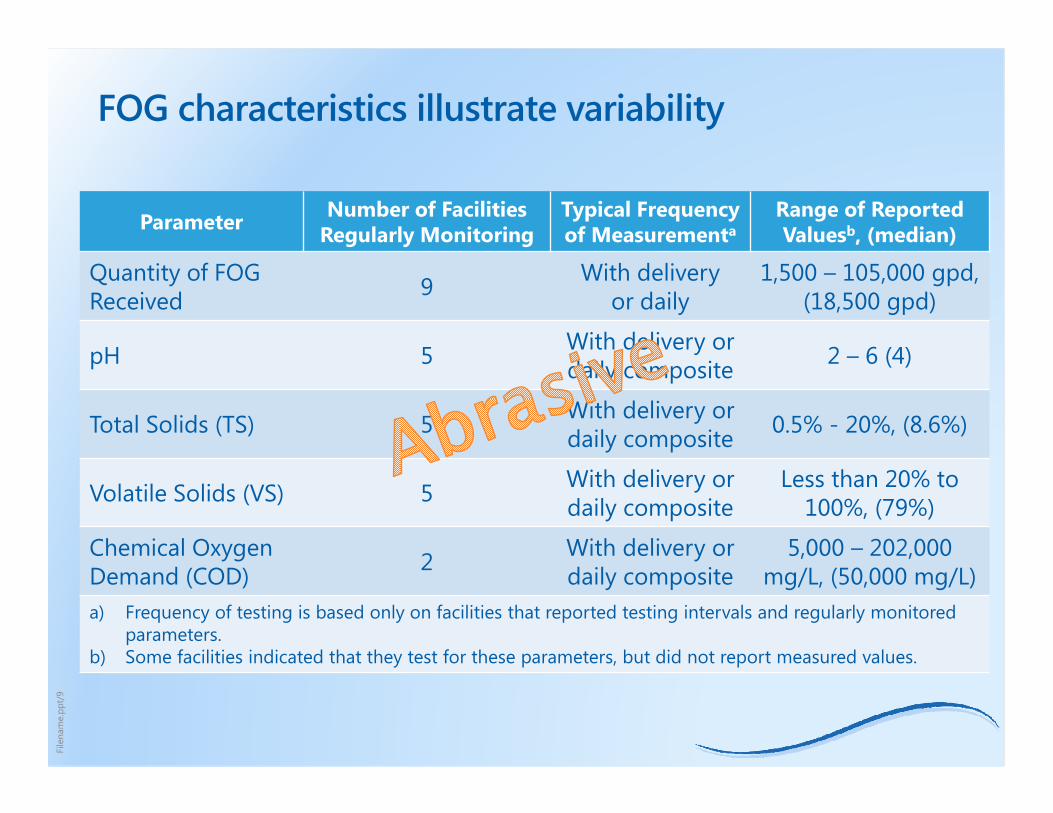
FOG characteristics illustrate variability
Parameter Number of Facilities Regularly Monitoring
Typical Frequency of Measurementa
Range of Reported Valuesb, (median)
Quantity of FOG Received 9 With delivery
or daily1,500 – 105,000 gpd,
(18,500 gpd)
pH 5 With delivery or daily composite 2 – 6 (4)
Total Solids (TS) 5 With delivery or daily composite 0.5% - 20%, (8.6%)
Volatile Solids (VS) 5 With delivery or daily composite
Less than 20% to 100%, (79%)
Chemical Oxygen Demand (COD) 2 With delivery or
daily composite5,000 – 202,000
mg/L, (50,000 mg/L)a) Frequency of testing is based only on facilities that reported testing intervals and regularly monitored
parameters.b) Some facilities indicated that they test for these parameters, but did not report measured values.
File
nam
e.pp
t/10
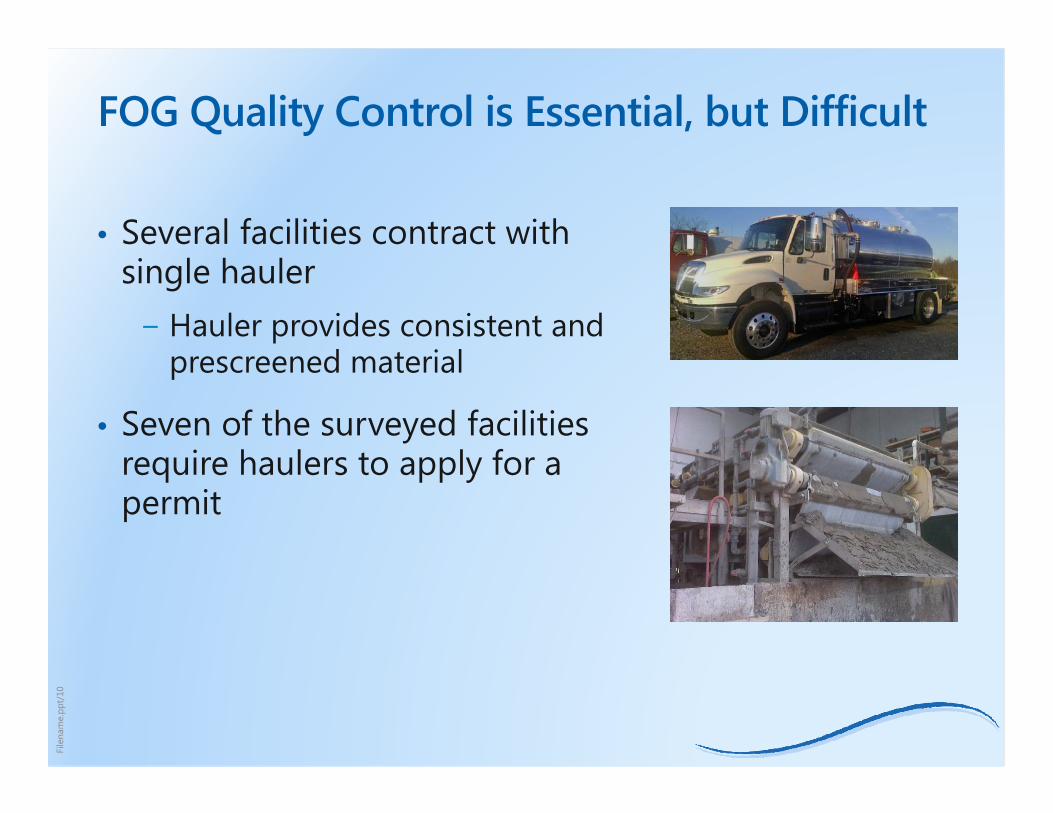
FOG Quality Control is Essential, but Difficult
• Several facilities contract with single hauler− Hauler provides consistent and
prescreened material
• Seven of the surveyed facilities require haulers to apply for a permit
File
nam
e.pp
t/11
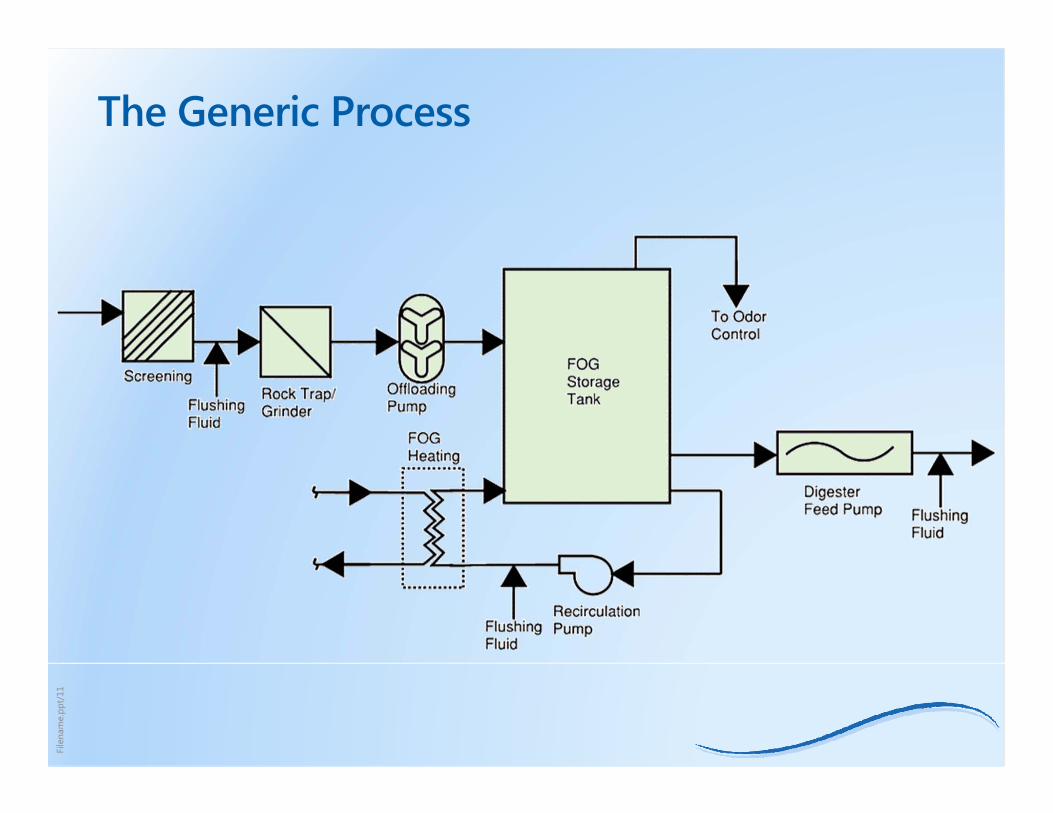
The Generic Process
File
nam
e.pp
t/12
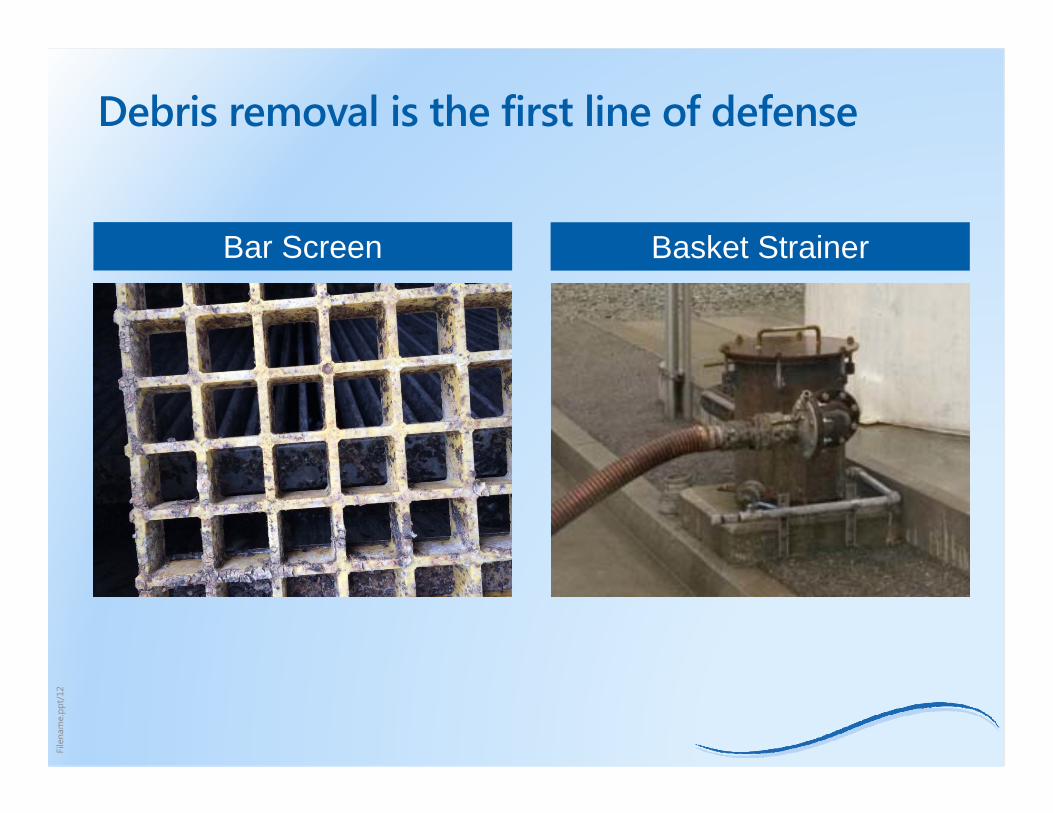
Debris removal is the first line of defense
Bar Screen Basket Strainer
File
nam
e.pp
t/13
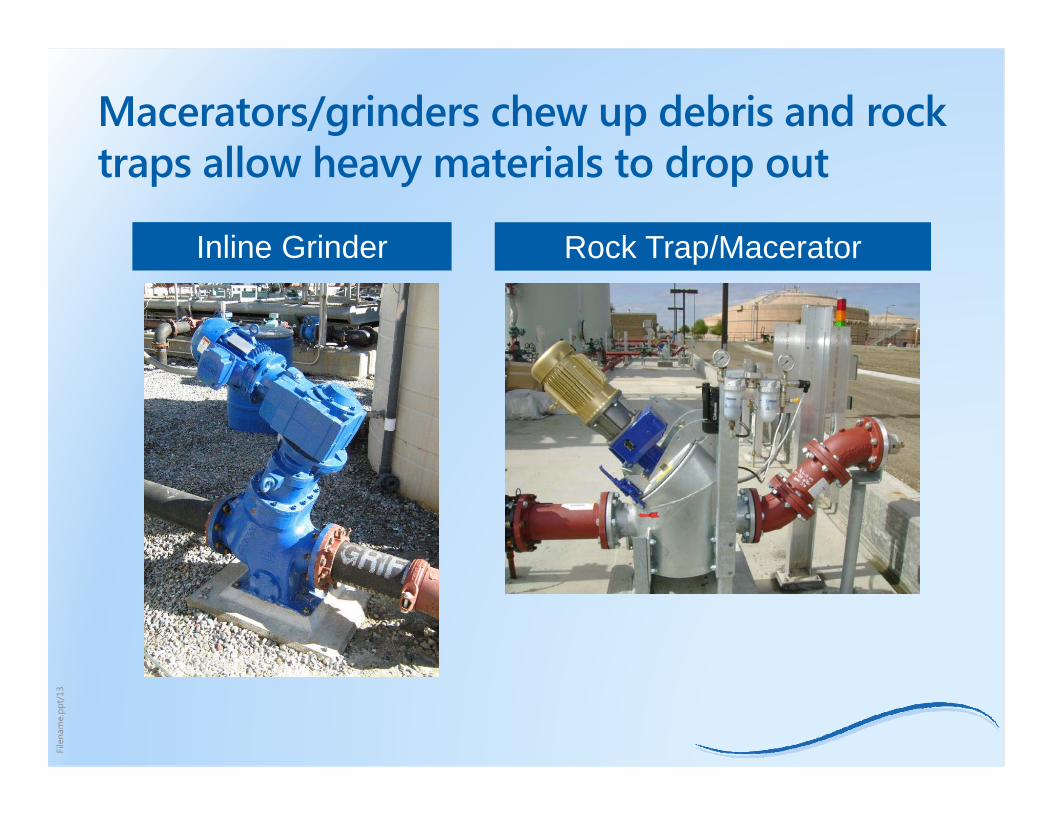
Macerators/grinders chew up debris and rock traps allow heavy materials to drop out
Inline Grinder Rock Trap/Macerator
File
nam
e.pp
t/14
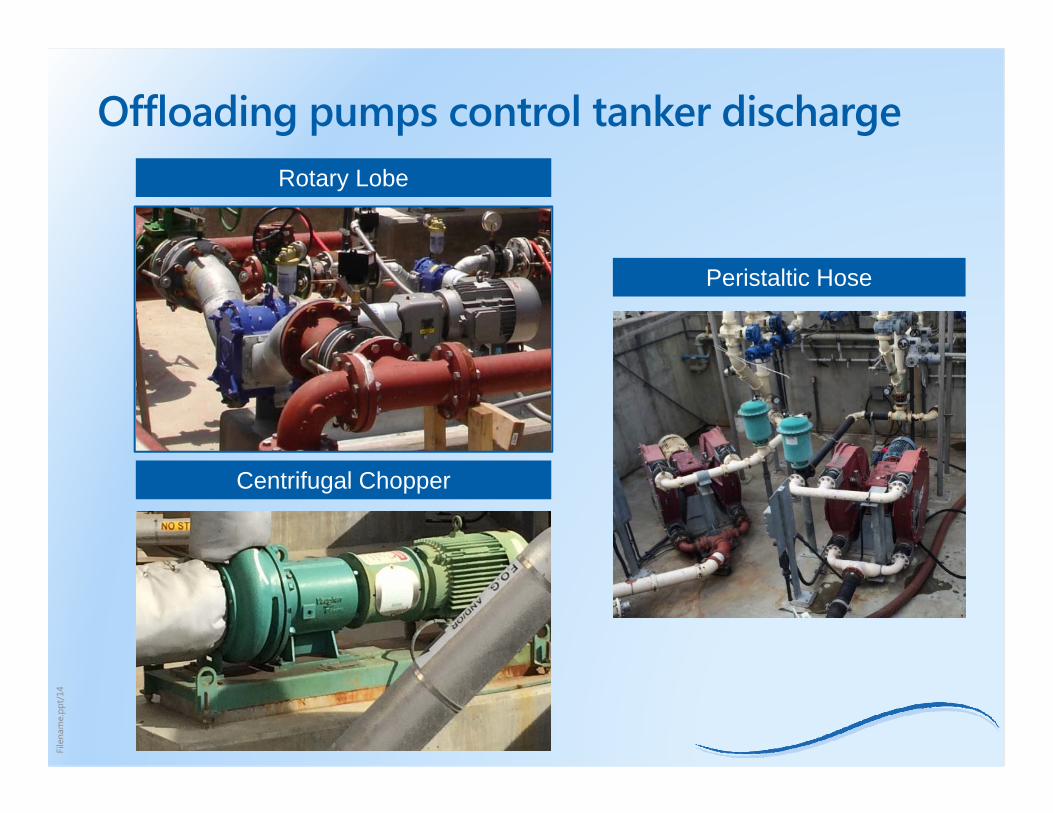
Offloading pumps control tanker discharge
Peristaltic Hose
Rotary Lobe
Centrifugal Chopper
File
nam
e.pp
t/15
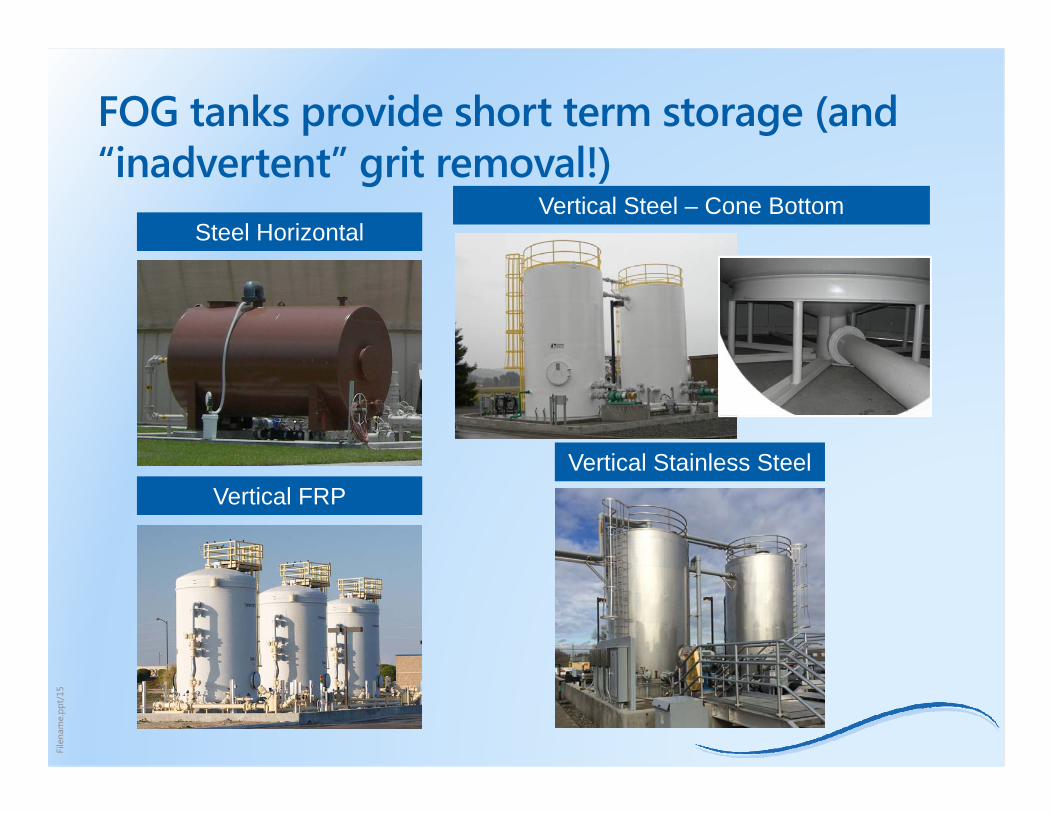
FOG tanks provide short term storage (and “inadvertent” grit removal!)
Steel Horizontal
Vertical FRP
Vertical Steel – Cone Bottom
Vertical Stainless Steel
File
nam
e.pp
t/16
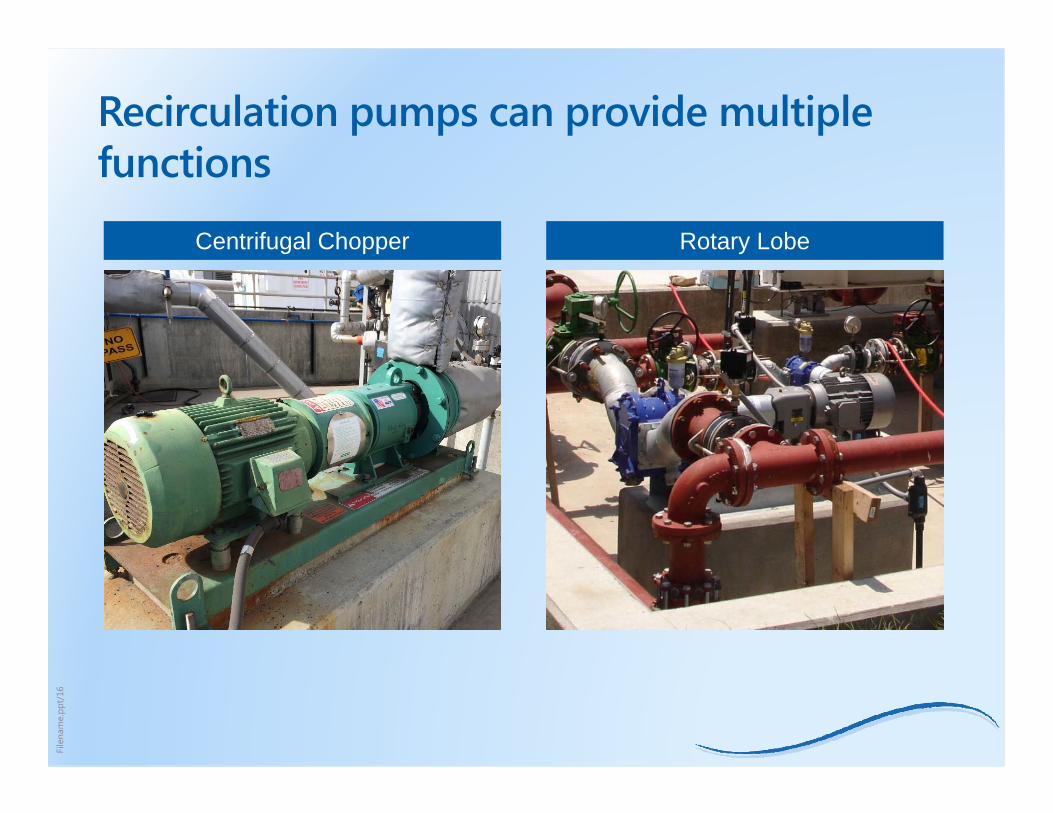
Recirculation pumps can provide multiple functions
Centrifugal Chopper Rotary Lobe
File
nam
e.pp
t/17
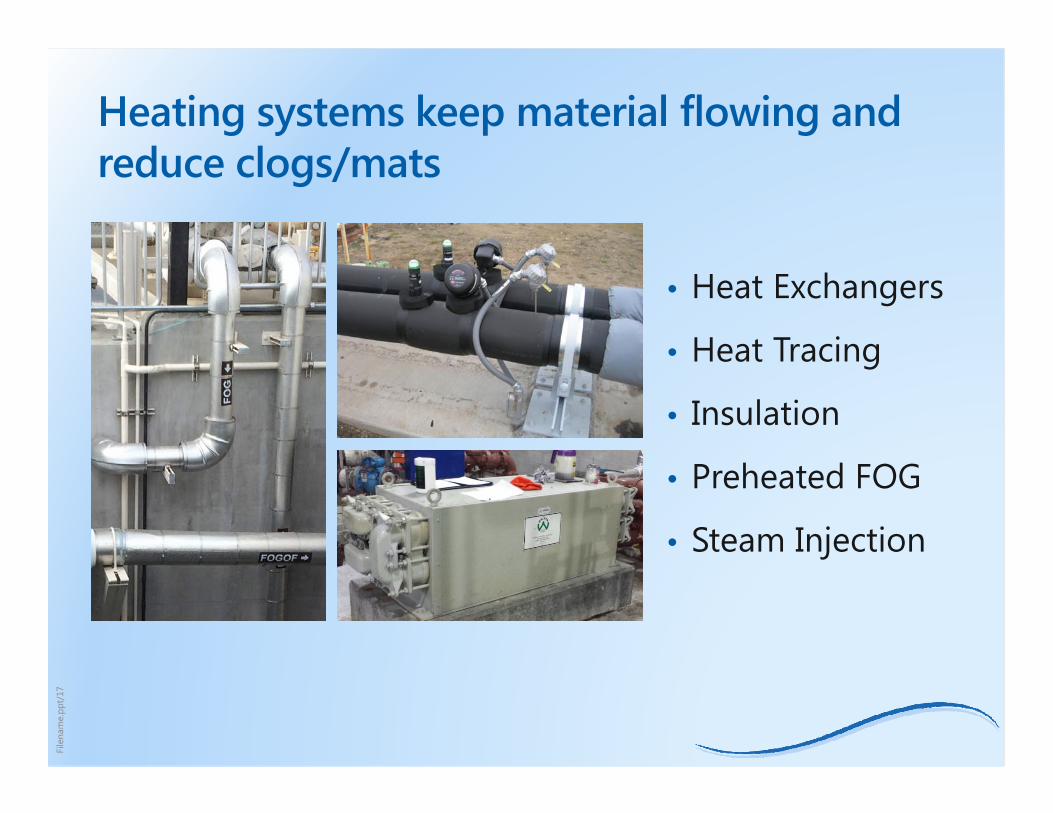
Heating systems keep material flowing and reduce clogs/mats
• Heat Exchangers
• Heat Tracing
• Insulation
• Preheated FOG
• Steam Injection
File
nam
e.pp
t/18
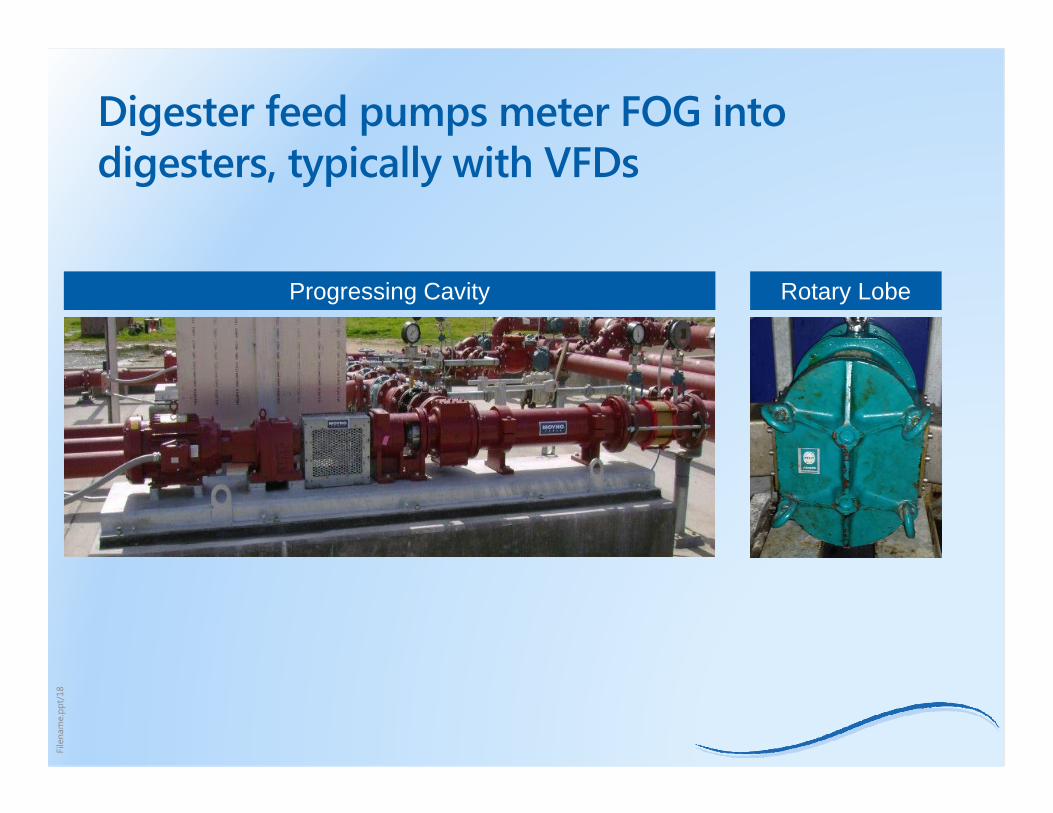
Digester feed pumps meter FOG into digesters, typically with VFDs
Progressing Cavity Rotary Lobe
File
nam
e.pp
t/19
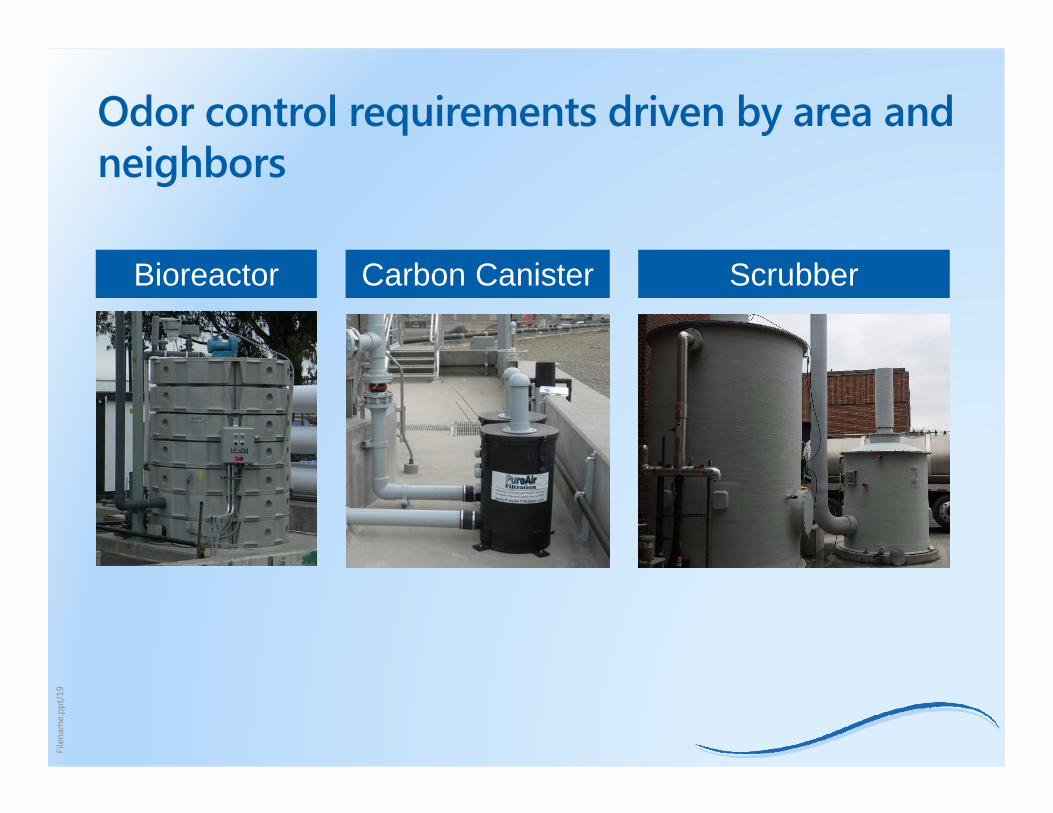
Odor control requirements driven by area and neighbors
Bioreactor Carbon Canister Scrubber
File
nam
e.pp
t/20
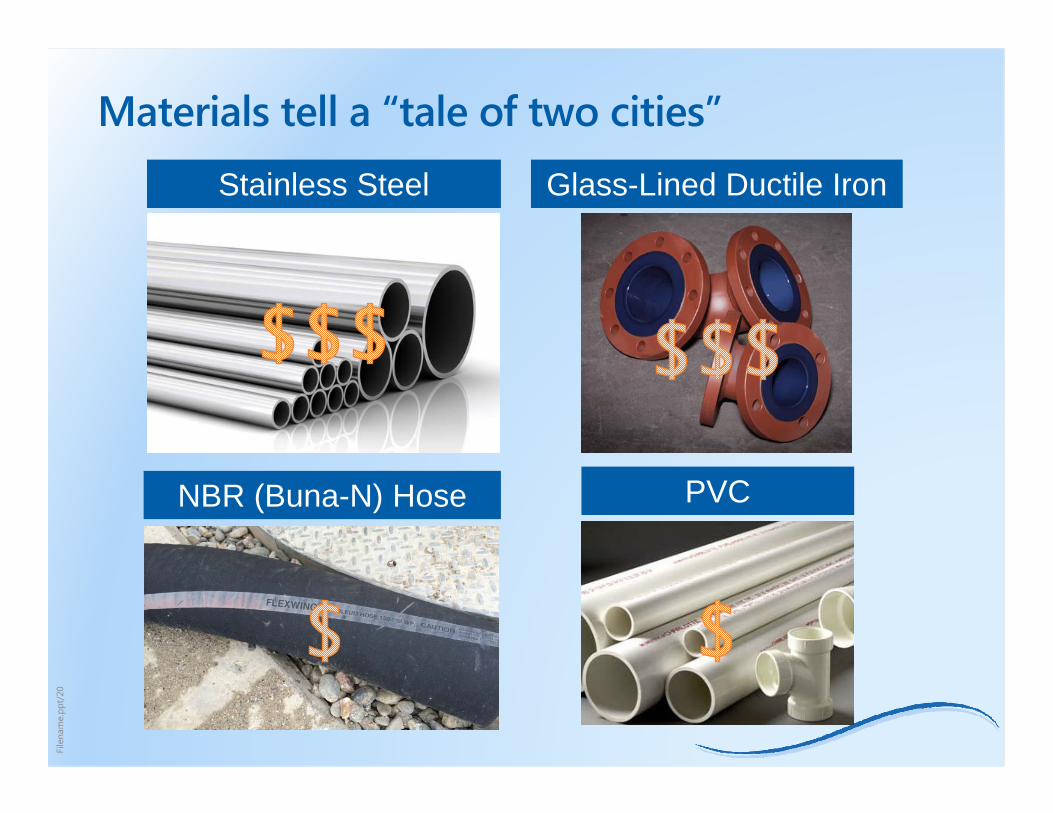
Materials tell a “tale of two cities”
Stainless Steel Glass-Lined Ductile Iron
NBR (Buna-N) Hose PVC
File
nam
e.pp
t/21
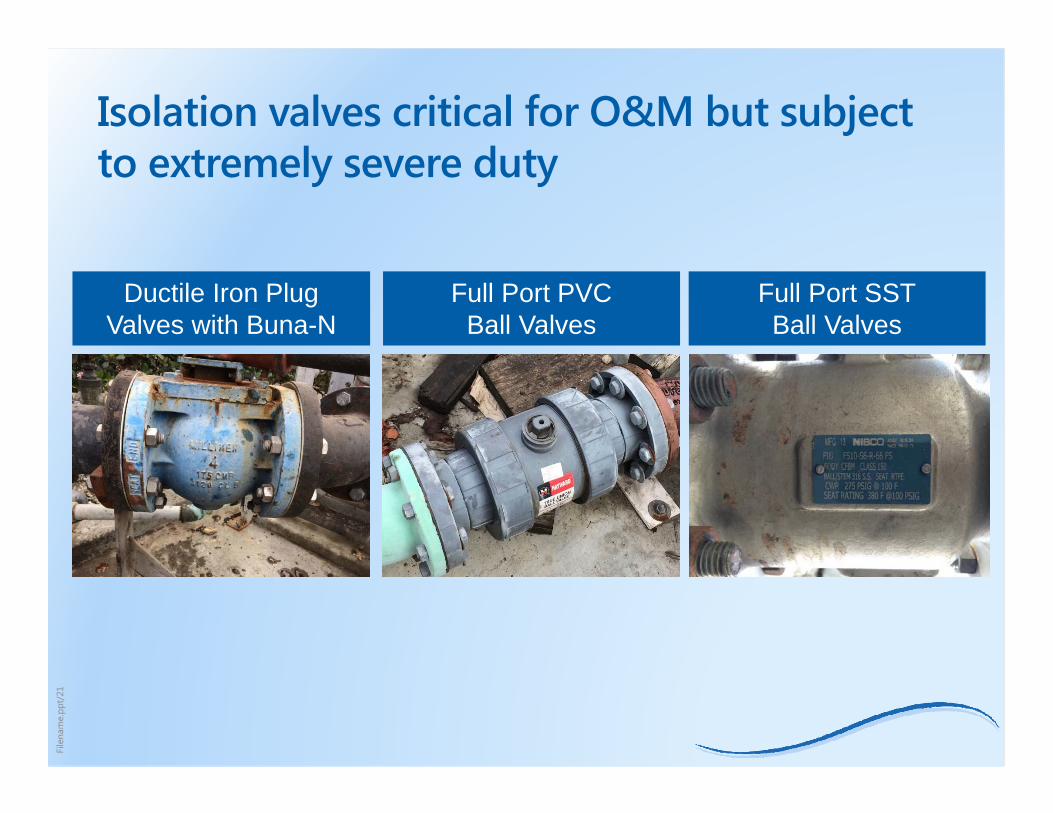
Isolation valves critical for O&M but subject to extremely severe duty
Ductile Iron Plug Valves with Buna-N
Full Port PVCBall Valves
Full Port SSTBall Valves
File
nam
e.pp
t/22
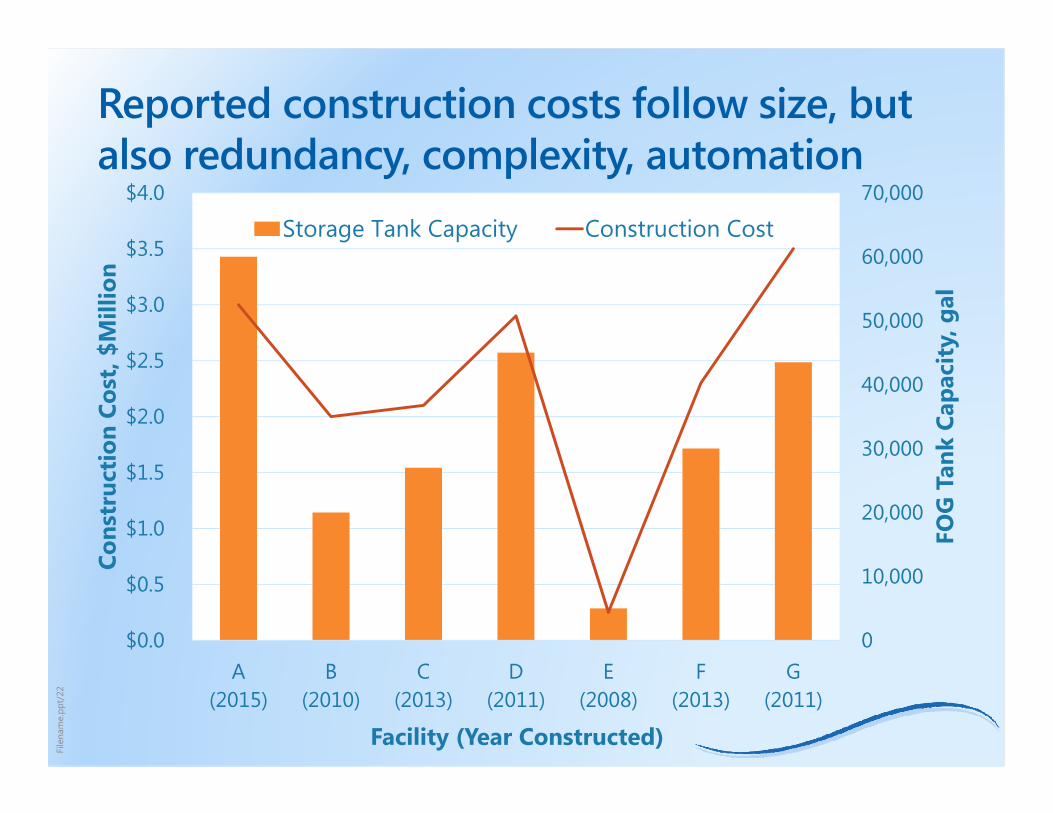
Reported construction costs follow size, but also redundancy, complexity, automation
0
10,000
20,000
30,000
40,000
50,000
60,000
70,000
$0.0
$0.5
$1.0
$1.5
$2.0
$2.5
$3.0
$3.5
$4.0
A(2015)
B(2010)
C(2013)
D(2011)
E(2008)
F(2013)
G(2011)
FOG
Tan
k Ca
paci
ty, g
al
Cons
truc
tion
Cos
t, $M
illio
n
Facility (Year Constructed)
Storage Tank Capacity Construction Cost
File
nam
e.pp
t/23
System changes frequent post-startup
• Reasons for equipment changes:− Increase service life
− Reduce maintenance needs
− Combat abrasive and corrosive nature of FOG
• Add screening/straining
• Add heating
• Replace steel components with stainless steel
• Try various elastomers for pumps and valves
File
nam
e.pp
t/24
O&M issues are real and significant
• Facilities agreed that FOG is a difficult material to handle
Abrasive Acidic Variable Odorous Labor intensive
• In most cases, labor required was higher than anticipated
File
nam
e.pp
t/25
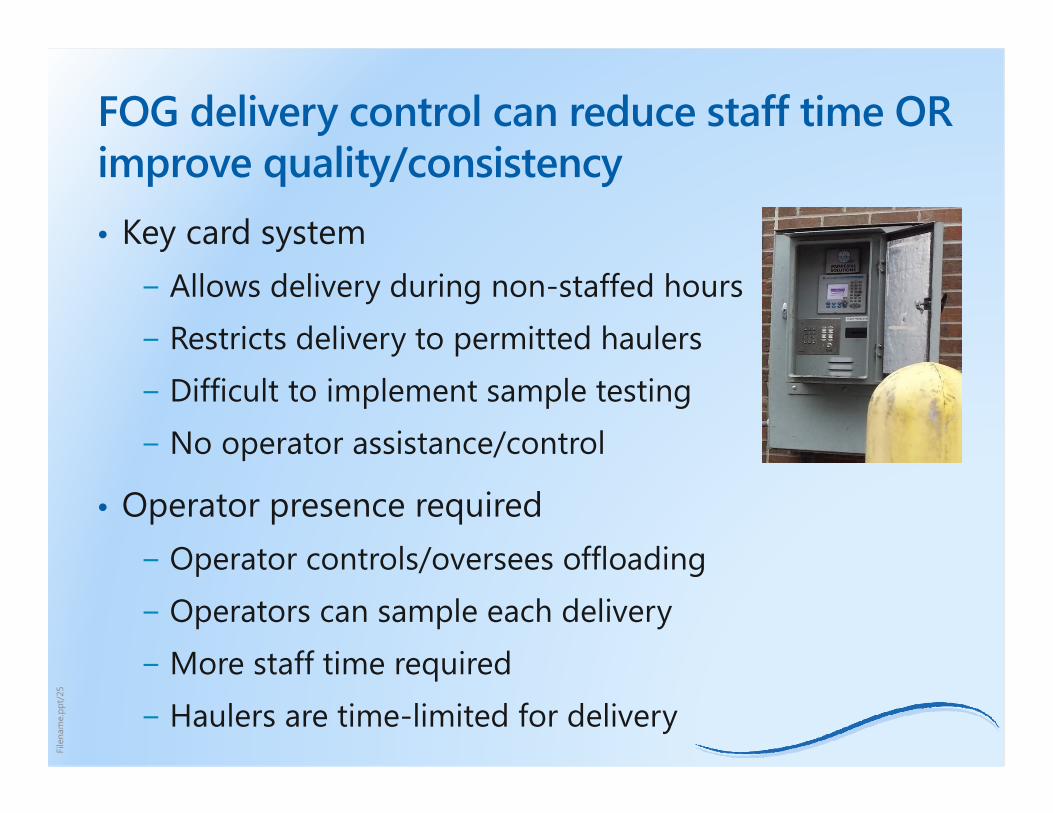
FOG delivery control can reduce staff time OR improve quality/consistency• Key card system− Allows delivery during non-staffed hours
− Restricts delivery to permitted haulers
− Difficult to implement sample testing
− No operator assistance/control
• Operator presence required− Operator controls/oversees offloading
− Operators can sample each delivery
− More staff time required
− Haulers are time-limited for delivery
File
nam
e.pp
t/26
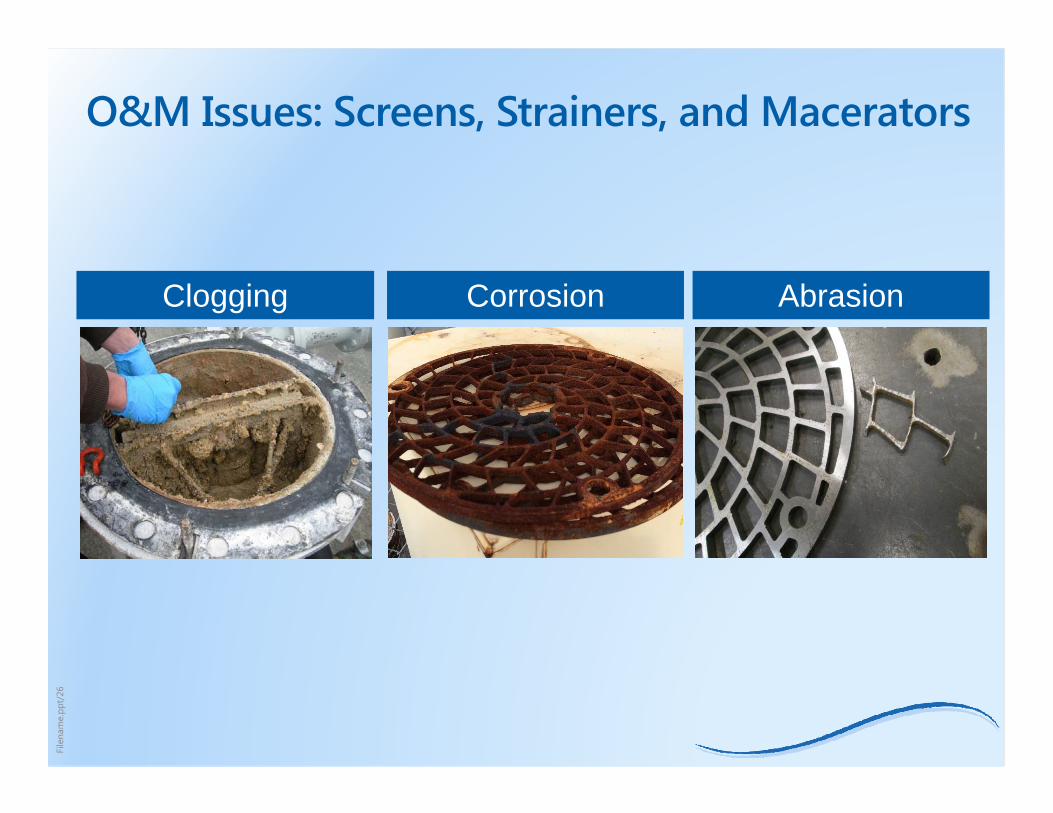
O&M Issues: Screens, Strainers, and Macerators
Clogging Corrosion Abrasion
File
nam
e.pp
t/27
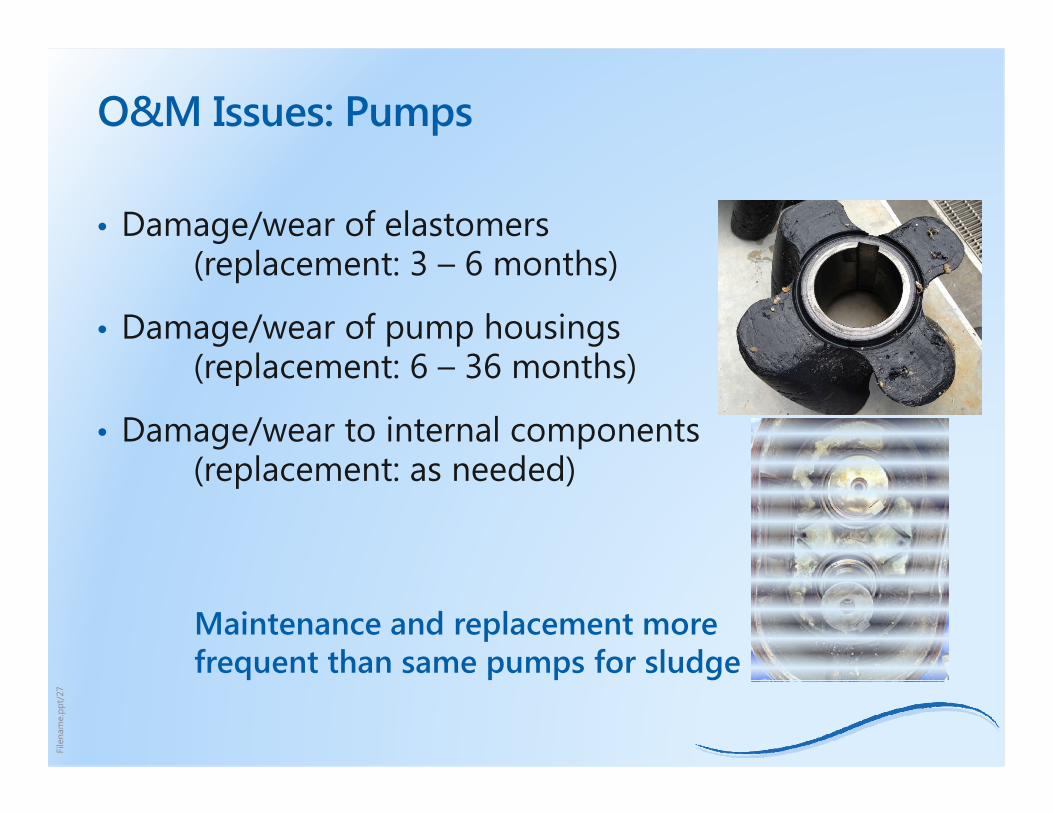
O&M Issues: Pumps
• Damage/wear of elastomers (replacement: 3 – 6 months)
• Damage/wear of pump housings (replacement: 6 – 36 months)
• Damage/wear to internal components(replacement: as needed)
Maintenance and replacement more frequent than same pumps for sludge
File
nam
e.pp
t/28
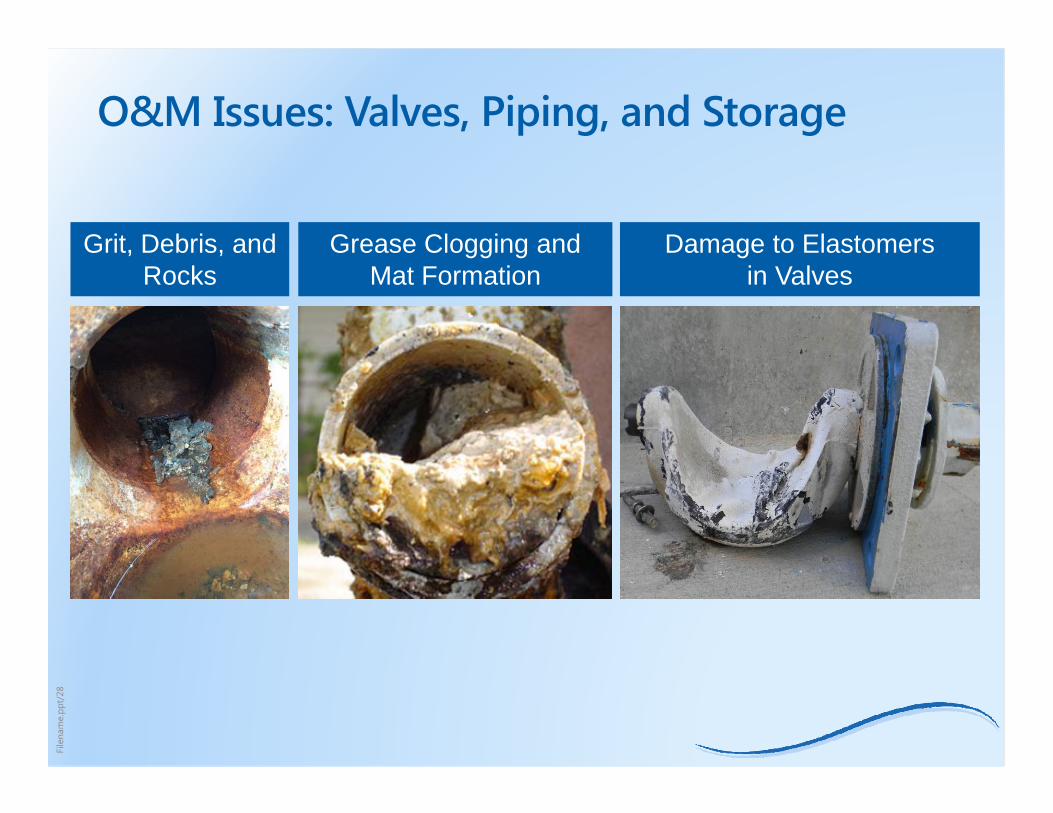
O&M Issues: Valves, Piping, and Storage
Grit, Debris, andRocks
Grease Clogging and Mat Formation
Damage to Elastomers in Valves
File
nam
e.pp
t/29
Staff time required for more than just O&M
• In addition to O&M of FOG system, staff required for:− Permitting haulers and monitoring for compliance
− Inspecting FOG loads, sample collection and analysis
− Monitoring digester performance and troubleshooting
− Determination and collection of tipping fees
− Management of contracts, if any, with FOG haulers
File
nam
e.pp
t/30
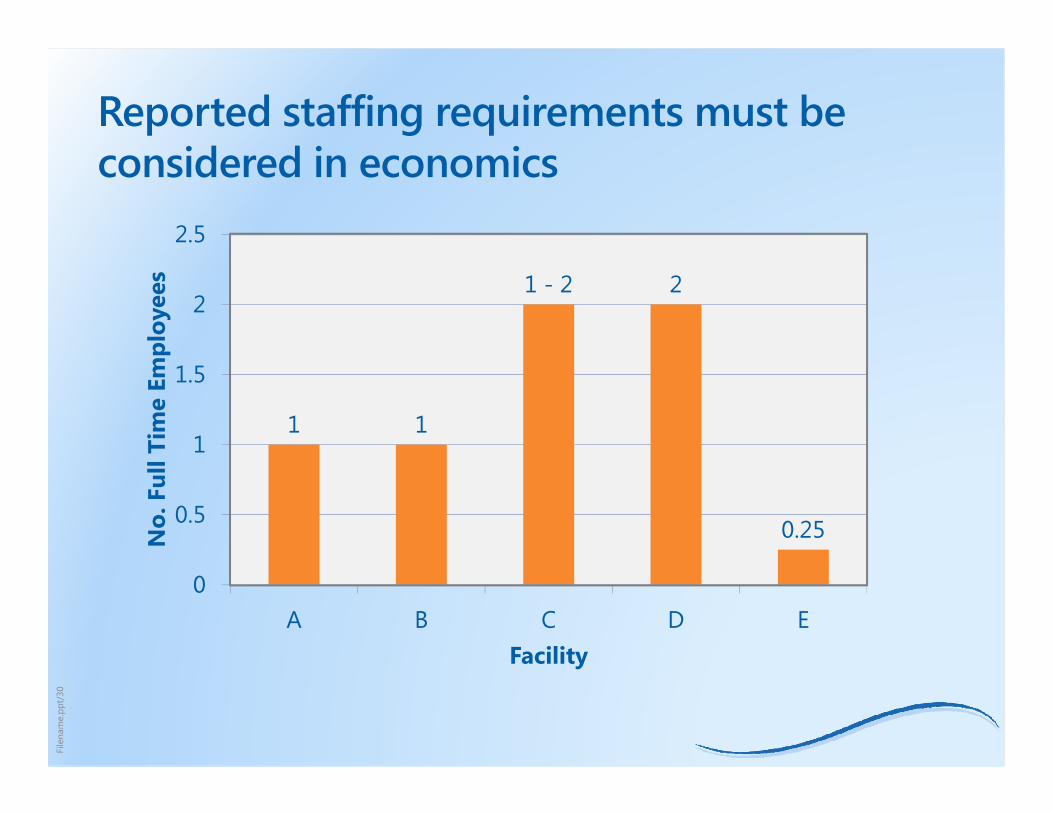
Reported staffing requirements must be considered in economics
1 1
1 - 2 2
0.25
0
0.5
1
1.5
2
2.5
A B C D E
No.
Ful
l Tim
e Em
ploy
ees
Facility
File
nam
e.pp
t/31
Digester stability paramount, but no standard feed control (yet)• Multiple methods used:− Empty FOG tank over setpoint time
− FOG tank level control
− FOG slowly fed in increasing amounts for acclimation
− Maintain total or volatile solids loading to digester
− Specific FOG:sludge feed ratio by volume
− Specific volume per day
− Vary to optimize gas production
File
nam
e.pp
t/32
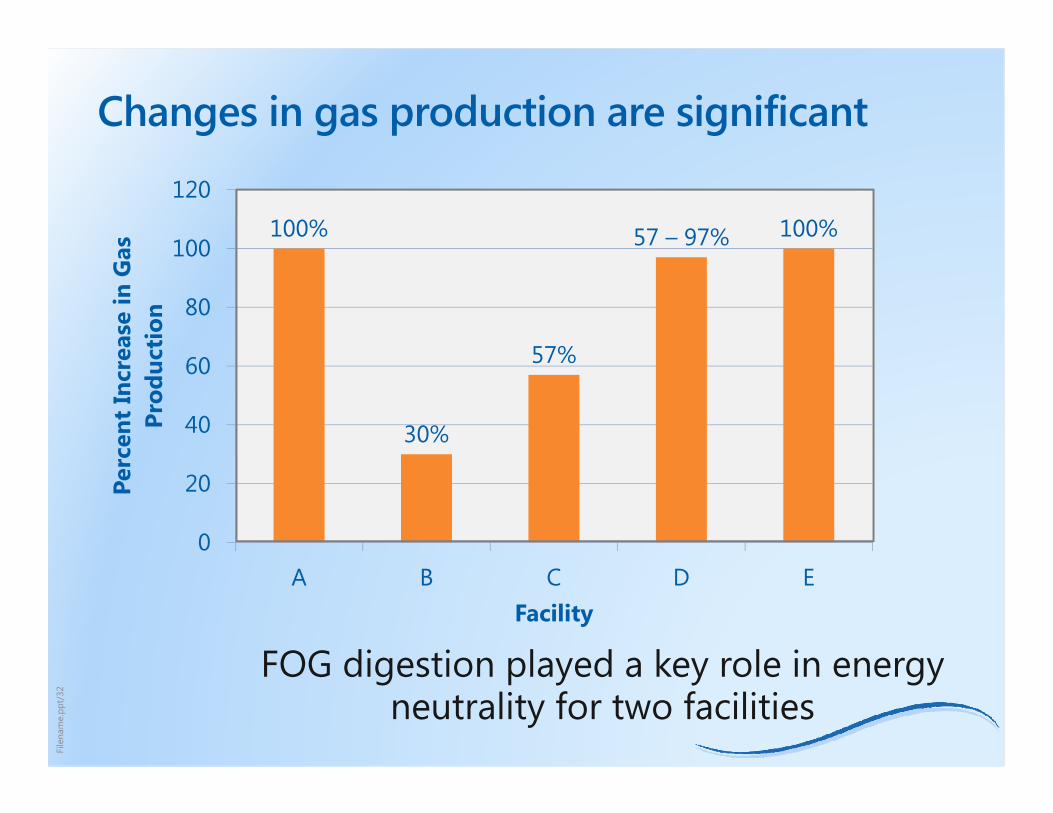
Changes in gas production are significant
FOG digestion played a key role in energy neutrality for two facilities
100%
30%
57%
57 – 97% 100%
0
20
40
60
80
100
120
A B C D E
Perc
ent
Incr
ease
in G
as
Prod
ucti
on
Facility
File
nam
e.pp
t/33
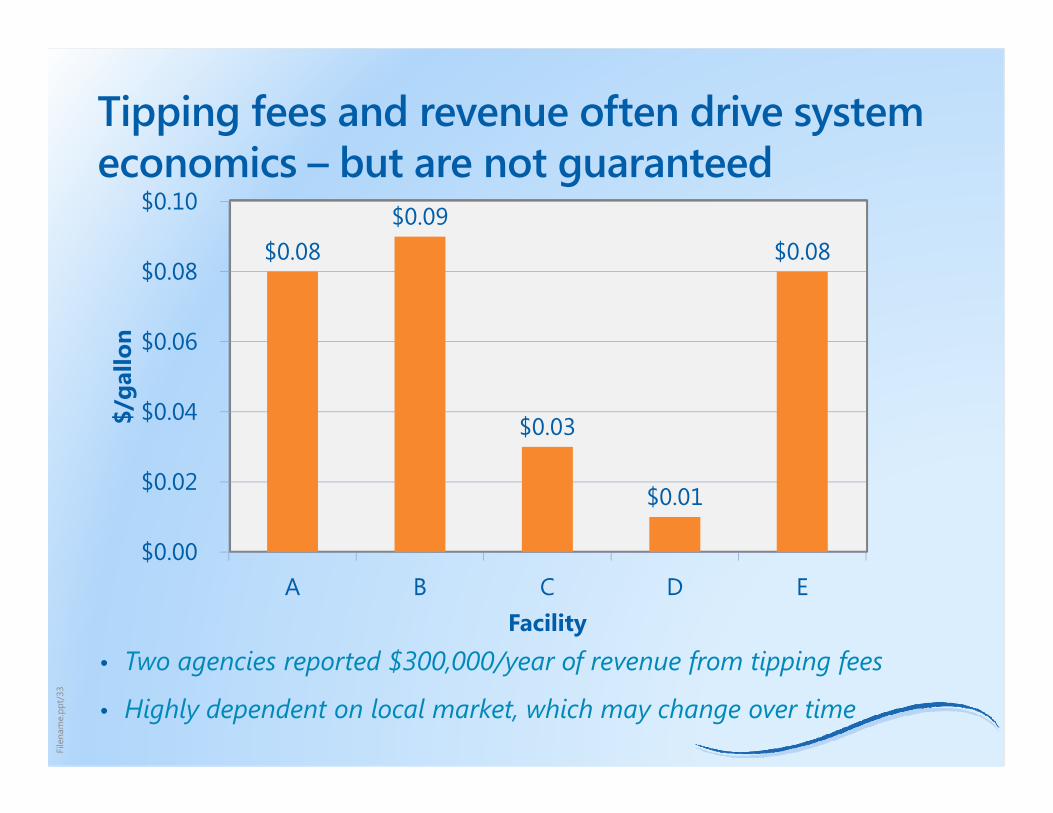
Tipping fees and revenue often drive system economics – but are not guaranteed
• Two agencies reported $300,000/year of revenue from tipping fees
• Highly dependent on local market, which may change over time
$0.08 $0.09
$0.03
$0.01
$0.08
$0.00
$0.02
$0.04
$0.06
$0.08
$0.10
A B C D E
$/ga
llon
Facility
File
nam
e.pp
t/34
The Big Picture
• Before embarking, consider:− Drivers and operational goals
− Quantity and quality of material available
− FOG market in area/realistic tipping fees
• Economics specific to each case
• No silver bullet for materials/equipment, but design based on lessons learned and a strong O&M program can make FOG receiving successful.
• Gain consensus from all stakeholders.− FOG receiving is O&M intensive, but offers multiple benefits,
including a path towards energy independence.

File
nam
e.pp
t/35
We would like to thank all facilities that participated in the survey and shared
their experiences.
AND THANK YOU FOR LISTENING!
Questions?


![Vehicular Fog Computing: A Viewpoint of Vehicles as the ...cwc.ucsd.edu/sites/cwc.ucsd.edu/files/Vehicular Fog... · fog computing paradigm [10]–[14]. Specifically, in the fog](https://img.dokumen.tips/doc/110x75/5ece3cb4a160d21f083aea78/vehicular-fog-computing-a-viewpoint-of-vehicles-as-the-cwcucsdedusitescwcucsdedufilesvehicular.jpg)