Embed Size (px)
DESCRIPTION
Life Cycle Assessment of Waste Conversion Technologies. April 15, 2004. Outline. Background and goals Overall approach CT material and energy balance models CT life cycle inventory models Scenario analysis Key findings. Background. - PowerPoint PPT Presentation
Citation preview
Life Cycle Assessment of Waste Conversion Technologies
April 15, 2004

Outline
• Background and goals
• Overall approach
• CT material and energy balance models
• CT life cycle inventory models
• Scenario analysis
• Key findings

Background
• AB 2770 included the requirement that the CIWMB’s report on CTs “describe and evaluate the life cycle environmental and public health impacts of CTs and compare them with impacts from existing solid waste management.”

Goals
• What are the life cycle environmental impacts of CTs and how do these compare to existing MSW management practices? – Landfill
– Waste-to-energy
– Compost

Overall Approach
• Define CTs:– Acid hydrolysis
– Gasification
– Catalytic Cracking
• Develop material and energy balance for CTs• Develop life cycle inventories for CTs• Utilize CT inventories and RTI’s solid waste
model to analyze future scenarios
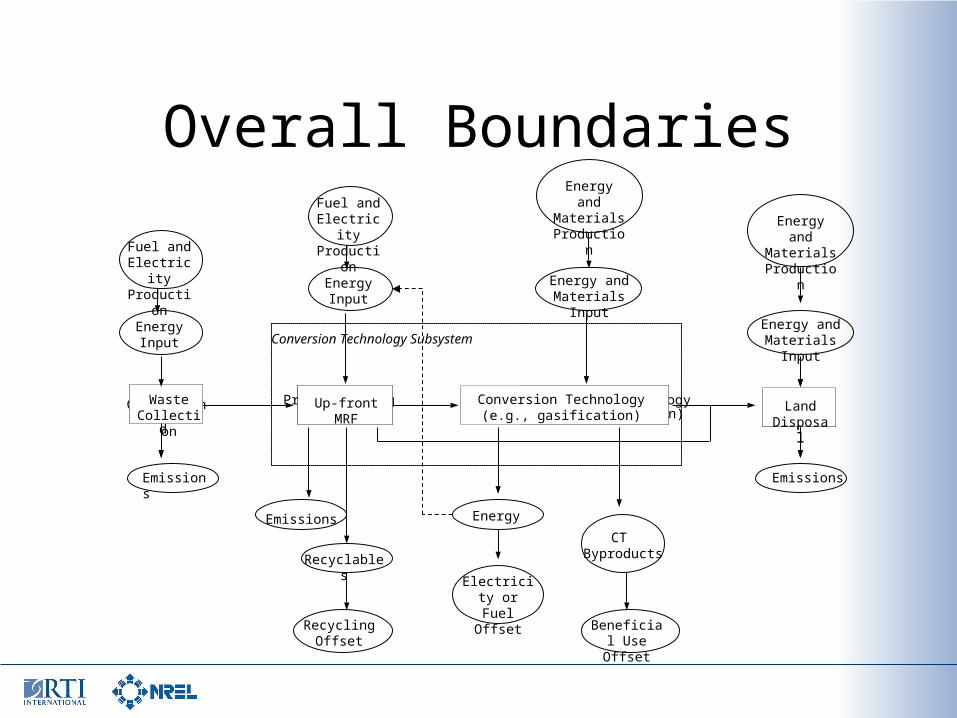
Overall Boundaries
Pre-processing (if needed)
Conversion technology(e.g., gasification)
Land Disposal
Waste Generated
Energy
Conversion Technology Subsystem
Collection Up-front MRF
Land Disposal
EmissionsEmissions
Emissions
Conversion Technology(e.g., gasification)
Recyclables
Electricity or Fuel Offset
Recycling Offset
Waste Collection
Energy and Materials Input
CT Byproducts
Beneficial Use Offset
Energy and Materials
Production
Energy and Materials Input
Energy and Materials
ProductionFuel and Electricity Production
Energy Input
Fuel and Electricity Production
Energy Input

Material and Energy Balance Models
• Developed using ASPEN Plus
• Used publicly available information– Patent applications
– Responses to UC questionnaire
• Communicated with CT vendors
• Employed conservative assumptions

Acid Hydrolysis
Sulfuric acid
Sorted MSW
Lime Water
Water Gypsum
VOC Emissions
Water CO2, VOC
Emissions Nutrients (CSL) Cooling Tower
Losses Ammonia
Biogas Air Emissions Steam for
Electricity for Internal Use Internal Use
WWT Air
Air Ash Electricity WWT Chemicals Treated water VOC Emissions Air Catalysts Emissions Spent to Grid
to POTW (Criteria, toxics Catalyst Denaturant and metals)
Ethanol Product
Air Pollution Control
Feed Handling
Mixer Hydrolysis Reactor Filter Press Washer
Separator Acid/Sugar Separation Evaporation Neutrali-
zation Filtering
Fermentation Distillation
Ethanol Storage
Boiler Steam Turbine
Wastewater Treatment
Reverse Osmosis
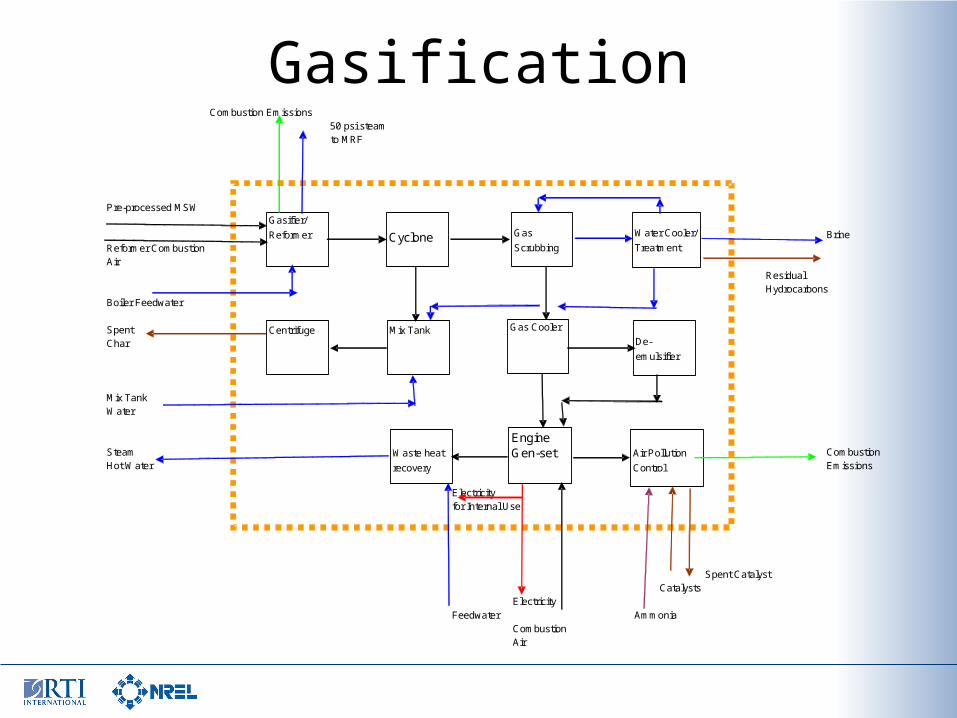
GasificationCombustion Emissions
50 psi steamto MRF
Pre-processed MSW
BrineReformer CombustionAir
ResidualHydrocarbons
Boiler Feedwater
SpentChar
Mix TankWater
Steam CombustionHot Water Emissions
Electricity for Internal Use
Spent CatalystCatalysts
Electricity Feedwater Ammonia
CombustionAir
Air Pollution
Control
Gasifier/
Reformer Cyclone Gas
Scrubbing
Waste heat
recovery
Engine Gen-set
Gas CoolerMix TankCentrifugeDe-
emulsifier
Water Cooler/
Treatment

Catalytic CrackingVOC
Emissions
Water Wastewater Catalyst
Baled Plastic Spent Catalyst &
Contaminants
Combustion
Emissions
VOC
Emissions
Electricity
for Internal
Use
VOC
Emissions
Electricity
Catalysts Spent Catalyst
Diesel Product
Ammonia Combustion
Air
Feed
Shredding
Feed
Cleaning
Melting Cracker
Distillation
Diesel
Storage
Air Pollution
Control GasTurbine
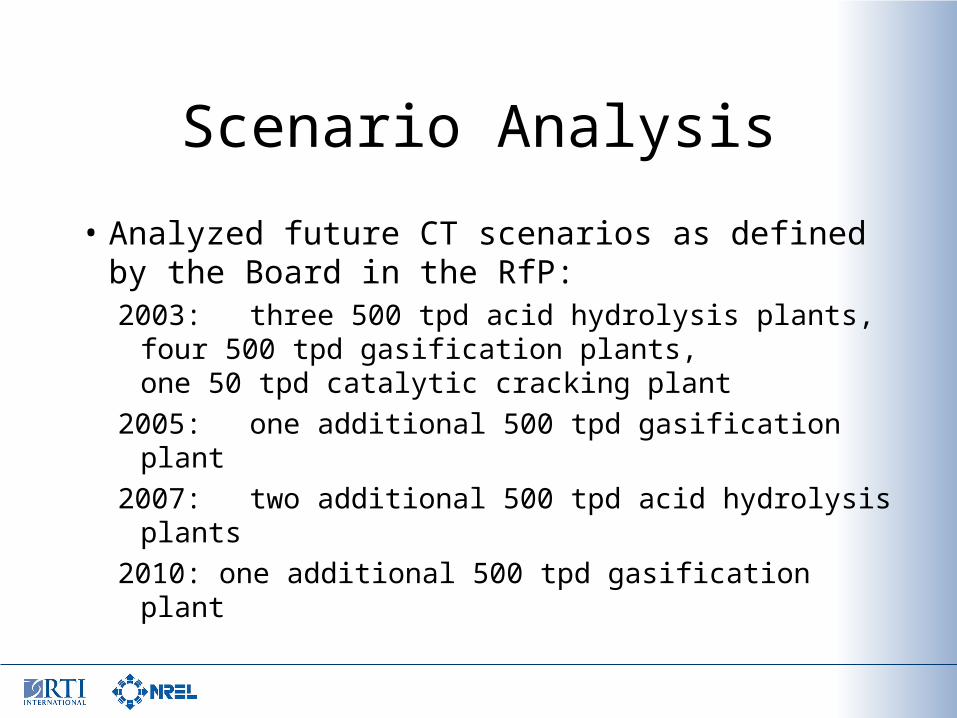
Scenario Analysis
• Analyzed future CT scenarios as defined by the Board in the RfP:2003: three 500 tpd acid hydrolysis plants,
four 500 tpd gasification plants, one 50 tpd catalytic cracking plant
2005: one additional 500 tpd gasification plant
2007: two additional 500 tpd acid hydrolysis plants
2010: one additional 500 tpd gasification plant
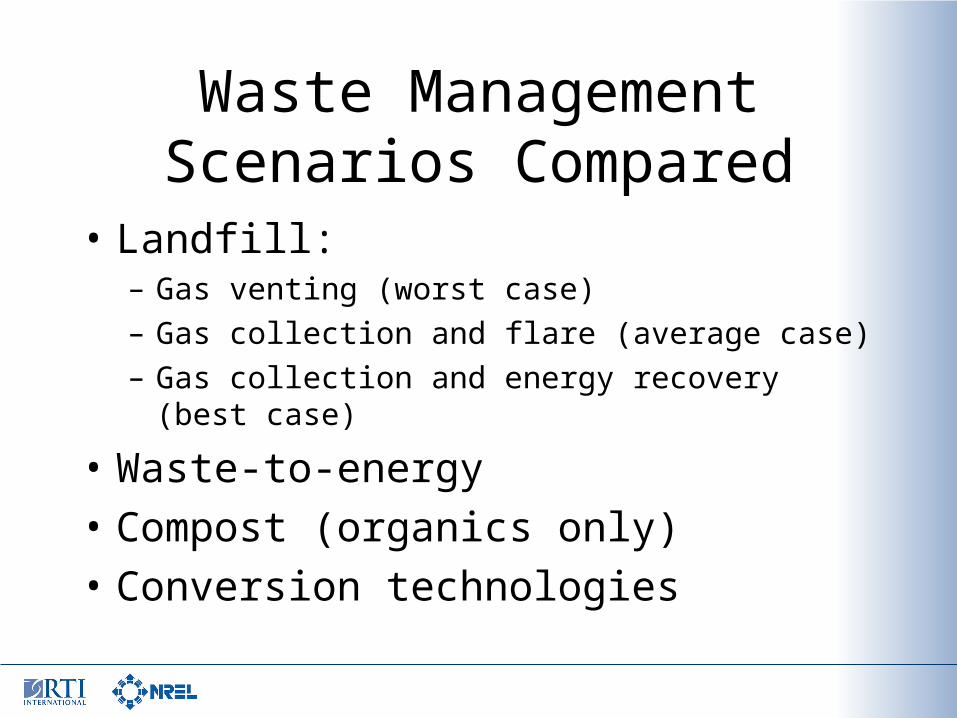
Waste Management Scenarios Compared
• Landfill:– Gas venting (worst case)
– Gas collection and flare (average case)
– Gas collection and energy recovery (best case)
• Waste-to-energy
• Compost (organics only)
• Conversion technologies

Mixed WasteCollection
Mixed Waste Transfer Station Landfill
50% direct hauled
50%
Landfill Scenario
ElectricityProduction
with landfill gas-to-energy

Mixed WasteCollection
Waste-to-Energy Ash Landfill50% Mixed Waste Transfer Station
50% direct hauled
ElectricityProduction
Steel Recycling
WTE Scenario
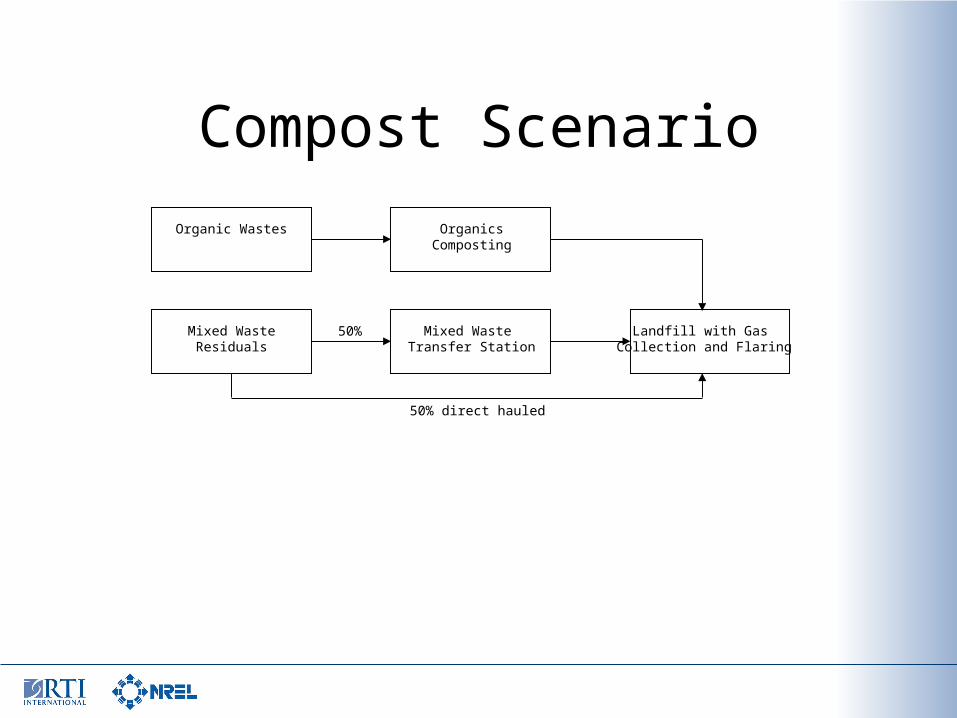
Mixed WasteResiduals
Mixed Waste Transfer Station
Landfill with Gas Collection and Flaring
50% direct hauled
50%
Organic Wastes OrganicsComposting
Compost Scenario
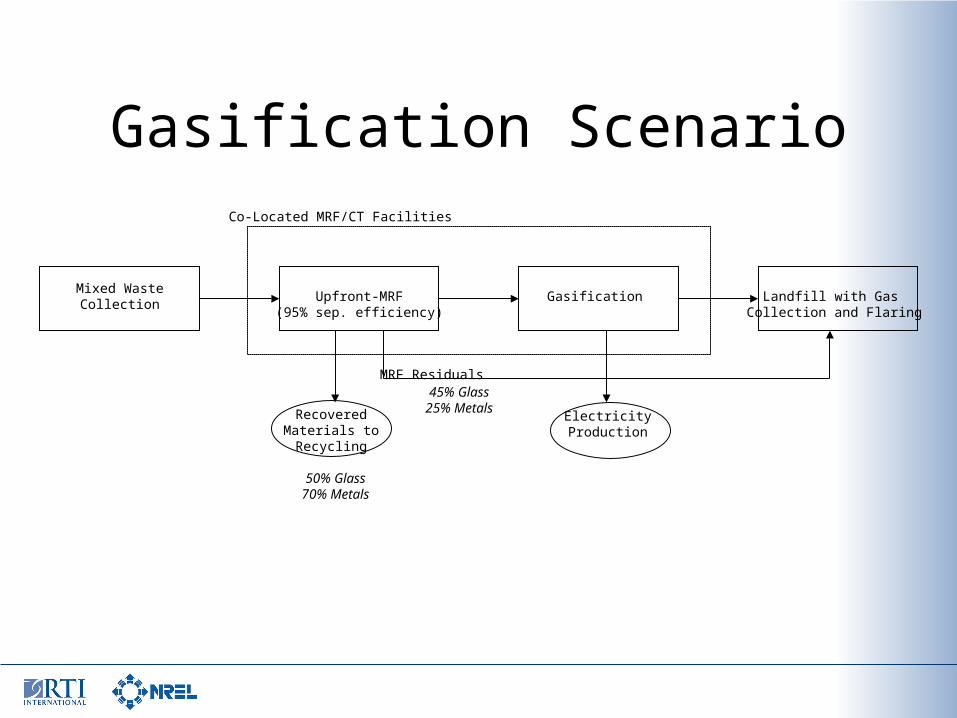
Mixed WasteCollection
Upfront-MRF(95% sep. efficiency)
Gasification
RecoveredMaterials toRecycling
ElectricityProduction
Co-Located MRF/CT Facilities
50% Glass70% Metals
45% Glass25% Metals
Landfill with Gas Collection and Flaring
MRF Residuals
Gasification Scenario

Mixed WasteCollection
Up-Front MRF(95% sep. efficiency)
Acid Hydrolysis Landfill with Gas Collection and Flaring
RecoveredMaterials toRecycling
EthanolProduction
Co-Located MRF/CT Facilities
50% Glass50% Plastic70% Metals
45% Glass45% Plastic25% Metals
MRF Residuals
GypsumByproduct
Acid Hydrolysis Scenario
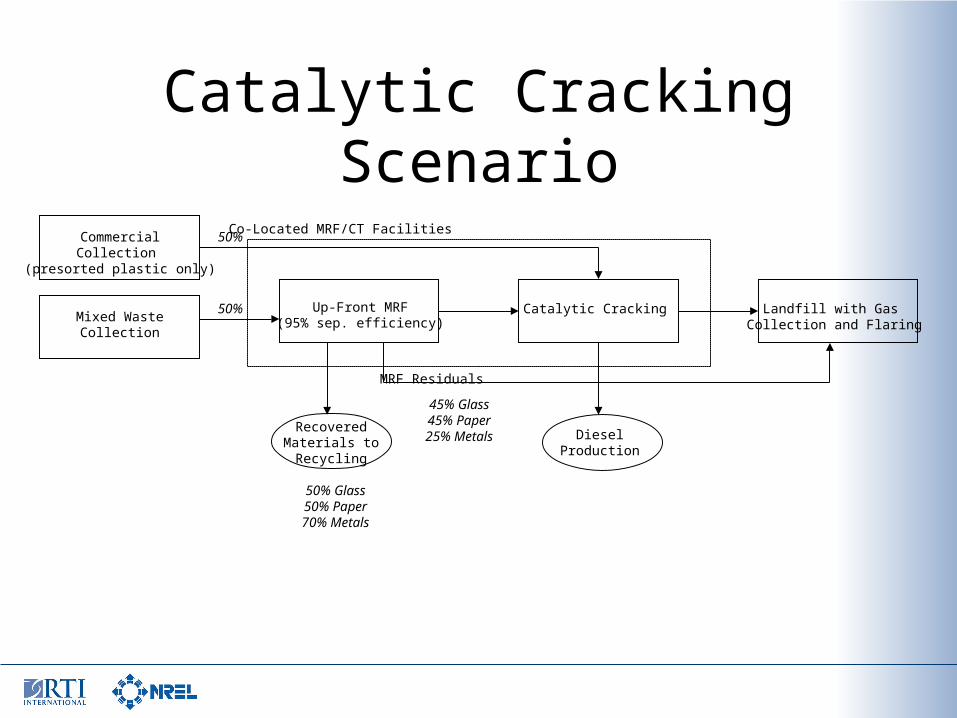
Mixed WasteCollection
Up-Front MRF(95% sep. efficiency)
Catalytic Cracking Landfill with Gas Collection and Flaring
RecoveredMaterials toRecycling
DieselProduction
Co-Located MRF/CT Facilities
50% Glass50% Paper70% Metals
45% Glass45% Paper25% Metals
CommercialCollection
(presorted plastic only)
MRF Residuals
50%
50%
Catalytic Cracking Scenario
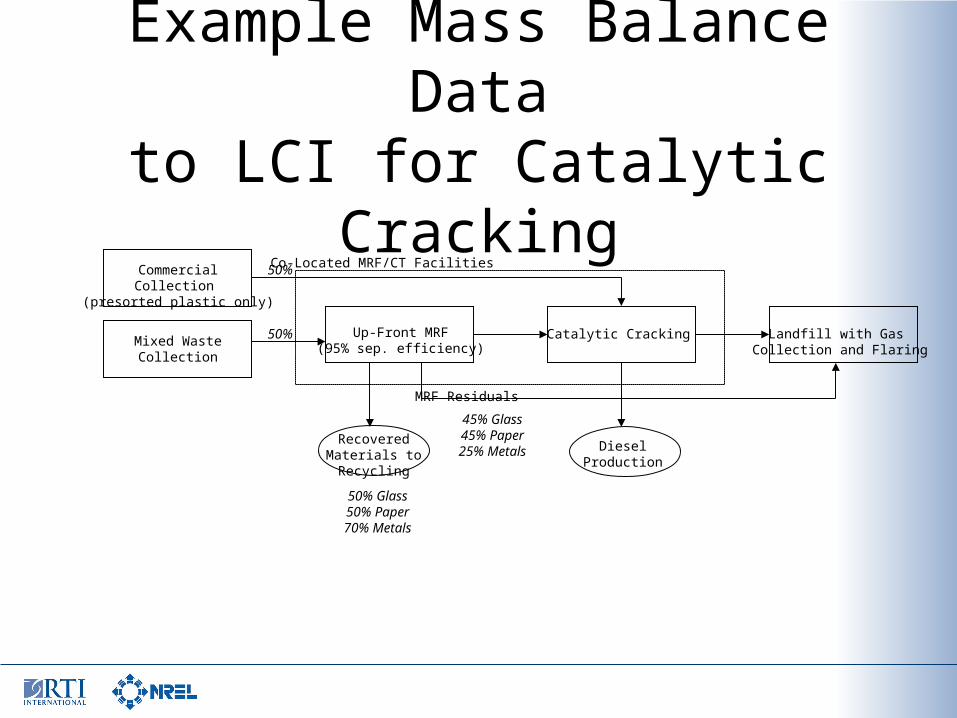
Example Mass Balance Datato LCI for Catalytic Cracking
Mixed WasteCollection
Up-Front MRF(95% sep. efficiency)
Catalytic Cracking Landfill with Gas Collection and Flaring
RecoveredMaterials toRecycling
DieselProduction
Co-Located MRF/CT Facilities
50% Glass50% Paper70% Metals
45% Glass45% Paper25% Metals
CommercialCollection
(presorted plastic only)
MRF Residuals
50%
50%
Materials and Energy Inputs

Baled Plastic Water
Cracking Catalyst
Turbine Combustion
Air
Heater Combustio
n Air AmmoniaSCR
CatalystBoiler Water
IN/OUT IN IN IN IN IN IN IN IN
BFD Stream No. 1 2 3 4a 4b 5 6 7ASPEN Stream 1001 1002 2007 3203 4001 NA NA NA
Component (lb/hr) (lb/hr) (lb/hr) (lb/hr) (lb/hr) (lb/hr) (ft3/hr) (lb/hr)Total Flow 4,386 625 2 41,649 458 2 1 61
Components BUTANE 0.00 0.00 0.00 0.00 0.00 CO2 0.00 0.00 0.00 21.04 0.00 CO 0.00 0.00 0.00 0.00 0.00 O2 0.00 0.00 0.00 9613.56 106.77 N2 0.00 0.00 0.00 31749.80 351.64 H2 0.00 0.00 0.00 0.00 0.00 AR 0.00 0.00 0.00 0.00 0.00 NO2 0.00 0.00 0.00 0.00 0.00 SO2 0.00 0.00 0.00 0.00 0.00 VOC 0.00 0.00 0.00 0.00 0.00 H2O 219.30 625.05 0.00 264.96 0.00 GASOLINE 0.00 0.00 0.00 0.00 0.00 60.64 DIESEL 0.00 0.00 0.00 0.00 0.00 PE 3793.28 0.00 0.00 0.00 0.00 PP 121.06 0.00 0.00 0.00 0.00 PS 121.06 0.00 0.00 0.00 0.00 PE-L 0.00 0.00 0.00 0.00 0.00 PP-L 0.00 0.00 0.00 0.00 0.00 PS-L 0.00 0.00 0.00 0.00 0.00 0.63 FE-SI 0.00 0.00 1.67 0.00 0.00 1.52 S 0.00 0.00 0.00 0.00 0.00 ASH 131.59 0.00 0.00 0.00 0.00 AL 0.00E+00 0.00E+00 0.00E+00 0.00E+00 0.00E+00 AS 0.00E+00 0.00E+00 0.00E+00 0.00E+00 0.00E+00 B 0.00E+00 0.00E+00 0.00E+00 0.00E+00 0.00E+00 BA 0.00E+00 0.00E+00 0.00E+00 0.00E+00 0.00E+00 BE 0.00E+00 0.00E+00 0.00E+00 0.00E+00 0.00E+00 CD 0.00E+00 0.00E+00 0.00E+00 0.00E+00 0.00E+00 CR 0.00E+00 0.00E+00 0.00E+00 0.00E+00 0.00E+00 CU 0.00E+00 0.00E+00 0.00E+00 0.00E+00 0.00E+00 FE 0.00E+00 0.00E+00 0.00E+00 0.00E+00 0.00E+00 HG 0.00E+00 0.00E+00 0.00E+00 0.00E+00 0.00E+00 MN 0.00E+00 0.00E+00 0.00E+00 0.00E+00 0.00E+00 NI 0.00E+00 0.00E+00 0.00E+00 0.00E+00 0.00E+00 PB 0.00E+00 0.00E+00 0.00E+00 0.00E+00 0.00E+00 SB 0.00E+00 0.00E+00 0.00E+00 0.00E+00 0.00E+00 SE 0.00E+00 0.00E+00 0.00E+00 0.00E+00 0.00E+00 SN 0.00E+00 0.00E+00 0.00E+00 0.00E+00 0.00E+00 ZN 0.00E+00 0.00E+00 0.00E+00 0.00E+00 0.00E+00

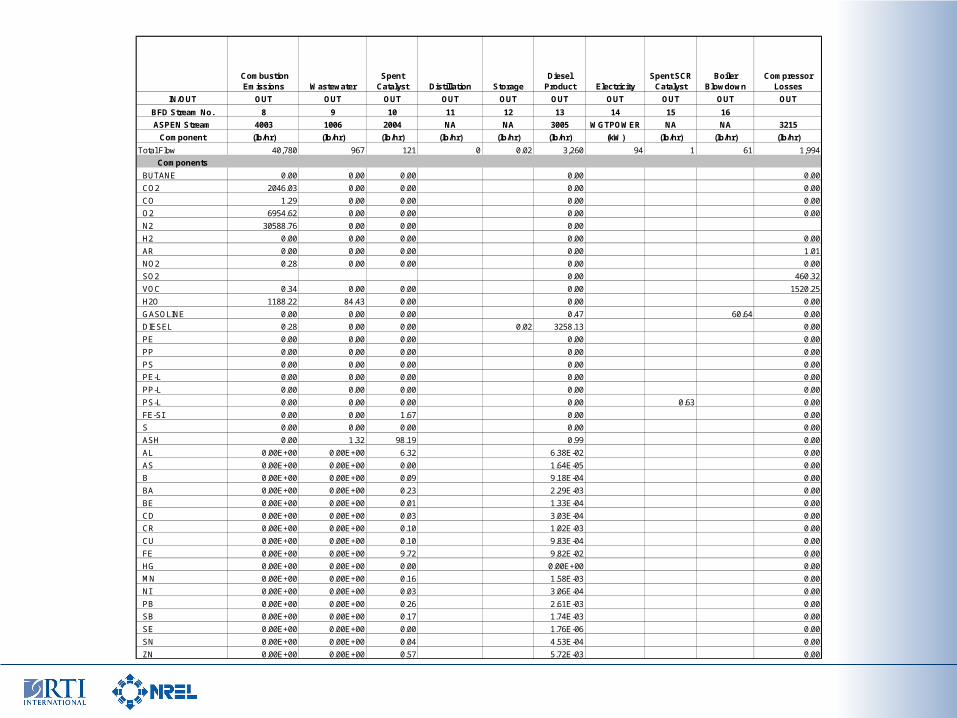
Materials and Energy Outputs
Combustion Emissions Wastewater
Spent Catalyst Distillation Storage
Diesel Product Electricity
Spent SCR Catalyst
Boiler Blowdown
Compressor Losses
IN/OUT OUT OUT OUT OUT OUT OUT OUT OUT OUT OUT
BFD Stream No. 8 9 10 11 12 13 14 15 16
ASPEN Stream 4003 1006 2004 NA NA 3005 WGTPOWER NA NA 3215
Component (lb/hr) (lb/hr) (lb/hr) (lb/hr) (lb/hr) (lb/hr) (kW) (lb/hr) (lb/hr) (lb/hr)
Total Flow 40,780 967 121 0 0.02 3,260 94 1 61 1,994
Components
BUTANE 0.00 0.00 0.00 0.00 0.00
CO2 2046.03 0.00 0.00 0.00 0.00
CO 1.29 0.00 0.00 0.00 0.00
O2 6954.62 0.00 0.00 0.00 0.00
N2 30588.76 0.00 0.00 0.00
H2 0.00 0.00 0.00 0.00 0.00
AR 0.00 0.00 0.00 0.00 1.01
NO2 0.28 0.00 0.00 0.00 0.00
SO2 0.00 460.32
VOC 0.34 0.00 0.00 0.00 1520.25
H2O 1188.22 84.43 0.00 0.00 0.00
GASOLINE 0.00 0.00 0.00 0.47 60.64 0.00
DIESEL 0.28 0.00 0.00 0.02 3258.13 0.00
PE 0.00 0.00 0.00 0.00 0.00
PP 0.00 0.00 0.00 0.00 0.00
PS 0.00 0.00 0.00 0.00 0.00
PE-L 0.00 0.00 0.00 0.00 0.00
PP-L 0.00 0.00 0.00 0.00 0.00
PS-L 0.00 0.00 0.00 0.00 0.63 0.00
FE-SI 0.00 0.00 1.67 0.00 0.00
S 0.00 0.00 0.00 0.00 0.00
ASH 0.00 1.32 98.19 0.99 0.00
AL 0.00E+00 0.00E+00 6.32 6.38E-02 0.00
AS 0.00E+00 0.00E+00 0.00 1.64E-05 0.00
B 0.00E+00 0.00E+00 0.09 9.18E-04 0.00
BA 0.00E+00 0.00E+00 0.23 2.29E-03 0.00
BE 0.00E+00 0.00E+00 0.01 1.33E-04 0.00
CD 0.00E+00 0.00E+00 0.03 3.03E-04 0.00
CR 0.00E+00 0.00E+00 0.10 1.02E-03 0.00
CU 0.00E+00 0.00E+00 0.10 9.83E-04 0.00
FE 0.00E+00 0.00E+00 9.72 9.82E-02 0.00
HG 0.00E+00 0.00E+00 0.00 0.00E+00 0.00
MN 0.00E+00 0.00E+00 0.16 1.58E-03 0.00
NI 0.00E+00 0.00E+00 0.03 3.06E-04 0.00
PB 0.00E+00 0.00E+00 0.26 2.61E-03 0.00
SB 0.00E+00 0.00E+00 0.17 1.74E-03 0.00
SE 0.00E+00 0.00E+00 0.00 1.76E-06 0.00
SN 0.00E+00 0.00E+00 0.04 4.53E-04 0.00
ZN 0.00E+00 0.00E+00 0.57 5.72E-03 0.00

Life Cycle Inventory For Catalytic Cracking Process
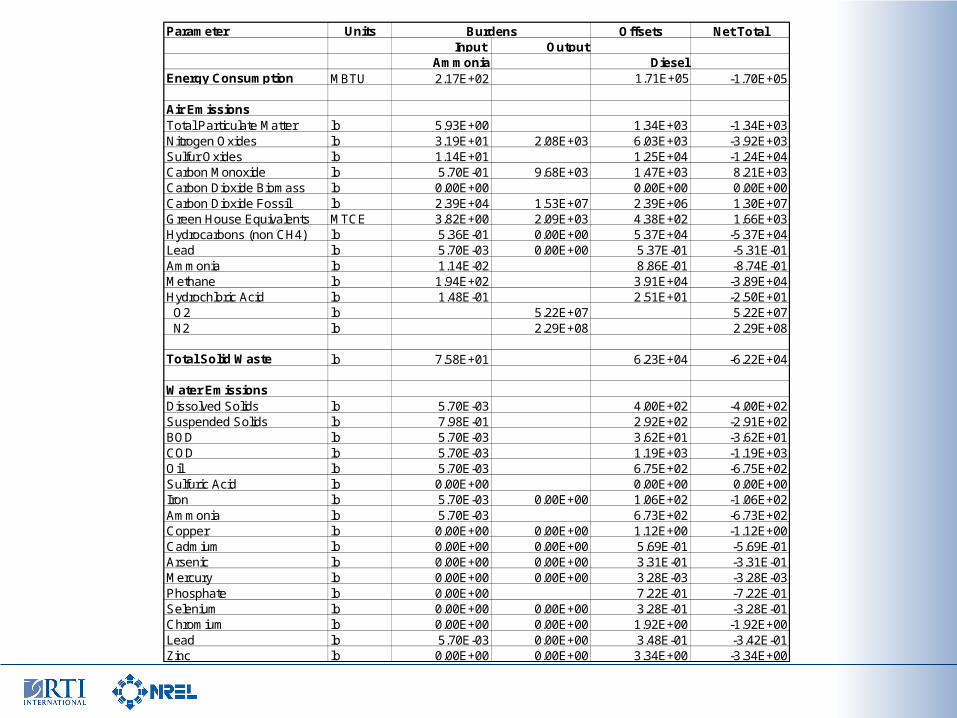
Parameter Units Offsets Net TotalInput Output
Ammonia DieselEnergy Consumption MBTU 2.17E+02 1.71E+05 -1.70E+05
Air EmissionsTotal Particulate Matter lb 5.93E+00 1.34E+03 -1.34E+03Nitrogen Oxides lb 3.19E+01 2.08E+03 6.03E+03 -3.92E+03Sulfur Oxides lb 1.14E+01 1.25E+04 -1.24E+04Carbon Monoxide lb 5.70E-01 9.68E+03 1.47E+03 8.21E+03Carbon Dioxide Biomass lb 0.00E+00 0.00E+00 0.00E+00Carbon Dioxide Fossil lb 2.39E+04 1.53E+07 2.39E+06 1.30E+07Green House Equivalents MTCE 3.82E+00 2.09E+03 4.38E+02 1.66E+03Hydrocarbons (non CH4) lb 5.36E-01 0.00E+00 5.37E+04 -5.37E+04Lead lb 5.70E-03 0.00E+00 5.37E-01 -5.31E-01Ammonia lb 1.14E-02 8.86E-01 -8.74E-01Methane lb 1.94E+02 3.91E+04 -3.89E+04Hydrochloric Acid lb 1.48E-01 2.51E+01 -2.50E+01 O2 lb 5.22E+07 5.22E+07 N2 lb 2.29E+08 2.29E+08
Total Solid Waste lb 7.58E+01 6.23E+04 -6.22E+04
Water EmissionsDissolved Solids lb 5.70E-03 4.00E+02 -4.00E+02Suspended Solids lb 7.98E-01 2.92E+02 -2.91E+02BOD lb 5.70E-03 3.62E+01 -3.62E+01COD lb 5.70E-03 1.19E+03 -1.19E+03Oil lb 5.70E-03 6.75E+02 -6.75E+02Sulfuric Acid lb 0.00E+00 0.00E+00 0.00E+00Iron lb 5.70E-03 0.00E+00 1.06E+02 -1.06E+02Ammonia lb 5.70E-03 6.73E+02 -6.73E+02Copper lb 0.00E+00 0.00E+00 1.12E+00 -1.12E+00Cadmium lb 0.00E+00 0.00E+00 5.69E-01 -5.69E-01Arsenic lb 0.00E+00 0.00E+00 3.31E-01 -3.31E-01Mercury lb 0.00E+00 0.00E+00 3.28E-03 -3.28E-03Phosphate lb 0.00E+00 7.22E-01 -7.22E-01Selenium lb 0.00E+00 0.00E+00 3.28E-01 -3.28E-01Chromium lb 0.00E+00 0.00E+00 1.92E+00 -1.92E+00Lead lb 5.70E-03 0.00E+00 3.48E-01 -3.42E-01Zinc lb 0.00E+00 0.00E+00 3.34E+00 -3.34E+00
Burdens

Life Cycle Inventory For Entire Catalytic Cracking Waste
Management System
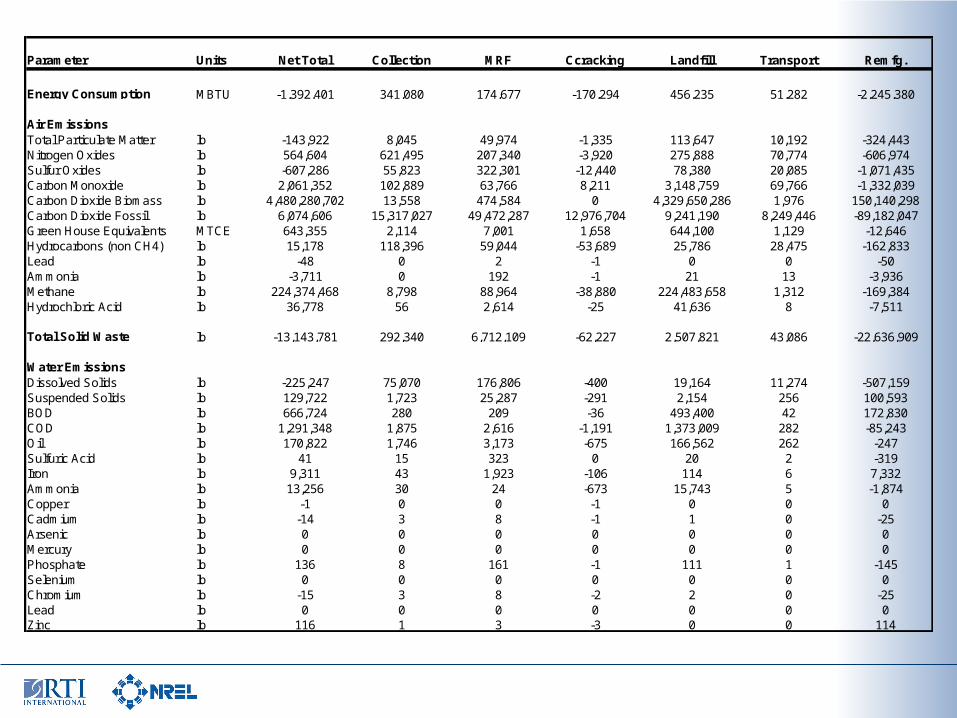
Parameter Units Net Total Collection MRF Ccracking Landfill Transport Remfg.
Energy Consumption MBTU -1,392,401 341,080 174,677 -170,294 456,235 51,282 -2,245,380
Air EmissionsTotal Particulate Matter lb -143,922 8,045 49,974 -1,335 113,647 10,192 -324,443Nitrogen Oxides lb 564,604 621,495 207,340 -3,920 275,888 70,774 -606,974Sulfur Oxides lb -607,286 55,823 322,301 -12,440 78,380 20,085 -1,071,435Carbon Monoxide lb 2,061,352 102,889 63,766 8,211 3,148,759 69,766 -1,332,039Carbon Dioxide Biomass lb 4,480,280,702 13,558 474,584 0 4,329,650,286 1,976 150,140,298Carbon Dioxide Fossil lb 6,074,606 15,317,027 49,472,287 12,976,704 9,241,190 8,249,446 -89,182,047Green House Equivalents MTCE 643,355 2,114 7,001 1,658 644,100 1,129 -12,646Hydrocarbons (non CH4) lb 15,178 118,396 59,044 -53,689 25,786 28,475 -162,833Lead lb -48 0 2 -1 0 0 -50Ammonia lb -3,711 0 192 -1 21 13 -3,936Methane lb 224,374,468 8,798 88,964 -38,880 224,483,658 1,312 -169,384Hydrochloric Acid lb 36,778 56 2,614 -25 41,636 8 -7,511
Total Solid Waste lb -13,143,781 292,340 6,712,109 -62,227 2,507,821 43,086 -22,636,909
Water EmissionsDissolved Solids lb -225,247 75,070 176,806 -400 19,164 11,274 -507,159Suspended Solids lb 129,722 1,723 25,287 -291 2,154 256 100,593BOD lb 666,724 280 209 -36 493,400 42 172,830COD lb 1,291,348 1,875 2,616 -1,191 1,373,009 282 -85,243Oil lb 170,822 1,746 3,173 -675 166,562 262 -247Sulfuric Acid lb 41 15 323 0 20 2 -319Iron lb 9,311 43 1,923 -106 114 6 7,332Ammonia lb 13,256 30 24 -673 15,743 5 -1,874Copper lb -1 0 0 -1 0 0 0Cadmium lb -14 3 8 -1 1 0 -25Arsenic lb 0 0 0 0 0 0 0Mercury lb 0 0 0 0 0 0 0Phosphate lb 136 8 161 -1 111 1 -145Selenium lb 0 0 0 0 0 0 0Chromium lb -15 3 8 -2 2 0 -25Lead lb 0 0 0 0 0 0 0Zinc lb 116 1 3 -3 0 0 114
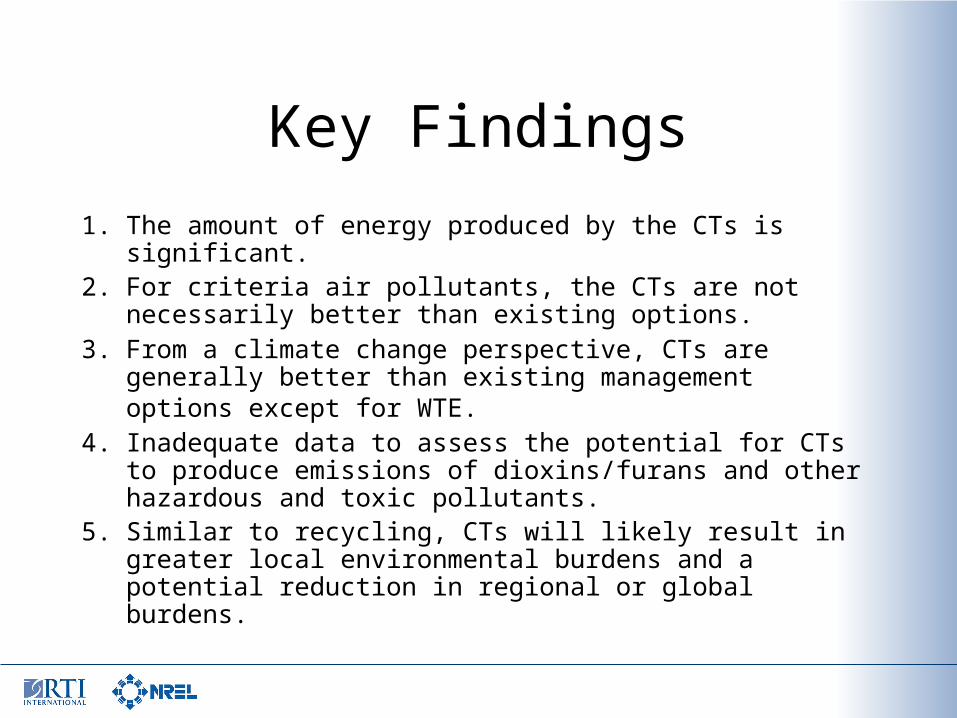
Key Findings
1. The amount of energy produced by the CTs is significant. 2. For criteria air pollutants, the CTs are not necessarily
better than existing options. 3. From a climate change perspective, CTs are generally
better than existing management options except for WTE. 4. Inadequate data to assess the potential for CTs to produce
emissions of dioxins/furans and other hazardous and toxic pollutants.
5. Similar to recycling, CTs will likely result in greater local environmental burdens and a potential reduction in regional or global burdens.

Key Findings (cont.)
6. It is important for CT facilities to achieve high levels of conversion efficiencies and materials recycling.
7. CTs can decrease the amount of waste disposed of in landfills.
8. CTs can increase materials recovery and recycling with large associated benefits.
9. CTs are not equal in terms of life cycle environmental performance.
10. No CT facilities exist in the U.S. for MSW and therefore there is a high level of uncertainty regarding their environmental performance.
Limitations
• CT facilities don’t exist in the U.S.:– Limited data
– Uncertain feedstock composition
– Uncertain pollution control requirements
• An LCA is not a risk assessment: – Pollutants are totaled across time and locations
– Concentrations of pollutants at a given time and location are not captured by a life cycle study

Sensitivity
• Feedstock composition
• Conversion efficiency
• Level of additional recycling achieved versus pass through of inert materials to landfill
• Pollution control devices and required inputs