Embed Size (px)
Citation preview
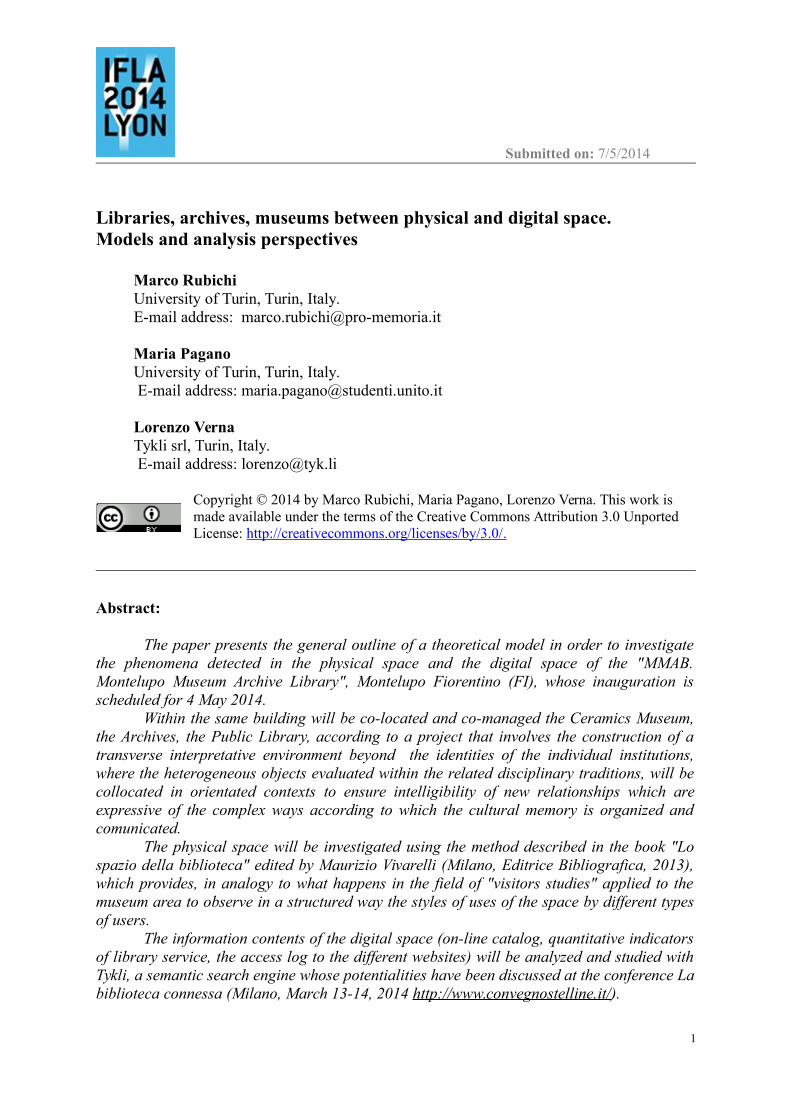
Submitted on: 7/5/2014
Libraries, archives, museums between physical and digital space. Models and analysis perspectives
Marco Rubichi University of Turin, Turin, Italy.E-mail address: [email protected]
Maria PaganoUniversity of Turin, Turin, Italy. E-mail address: [email protected]
Lorenzo VernaTykli srl, Turin, Italy. E-mail address: [email protected]
Copyright © 2014 by Marco Rubichi, Maria Pagano, Lorenzo Verna. This work is made available under the terms of the Creative Commons Attribution 3.0 Unported License: http://creativecommons.org/licenses/by/3.0/ .
Abstract:
The paper presents the general outline of a theoretical model in order to investigatethe phenomena detected in the physical space and the digital space of the "MMAB.Montelupo Museum Archive Library", Montelupo Fiorentino (FI), whose inauguration isscheduled for 4 May 2014.
Within the same building will be co-located and co-managed the Ceramics Museum,the Archives, the Public Library, according to a project that involves the construction of atransverse interpretative environment beyond the identities of the individual institutions,where the heterogeneous objects evaluated within the related disciplinary traditions, will becollocated in orientated contexts to ensure intelligibility of new relationships which areexpressive of the complex ways according to which the cultural memory is organized andcomunicated.
The physical space will be investigated using the method described in the book "Lospazio della biblioteca" edited by Maurizio Vivarelli (Milano, Editrice Bibliografica, 2013),which provides, in analogy to what happens in the field of "visitors studies" applied to themuseum area to observe in a structured way the styles of uses of the space by different typesof users.
The information contents of the digital space (on-line catalog, quantitative indicatorsof library service, the access log to the different websites) will be analyzed and studied withTykli, a semantic search engine whose potentialities have been discussed at the conference Labiblioteca connessa (Milano, March 13-14, 2014 http://www.convegnostelline.it/).
1
The goal, using the principles of Network Analysis is to identify and discuss therelationships between data in the different ecosystems of information, qualifying theinformation thus obtained both as tools to support common programming tasks, and tointerpret, in an experimental field of considerable interest, the complex metamorphosis thatare investing the identities, historically determined of the Memory Institutions as a whole.
Keywords: Physical Space, Data Analysis, Montelupo Fiorentino, Network Science
1. Libraries, museums and archives in search of a common spaceLibraries, archives and museums are often natural partners for collaboration and
cooperation, because they serve the same community, in similar ways. Their support andenhance lifelong learning opportunities, preserve community heritage, and protect andprovide access to information have been thoroughly discussed in an interesting reportpromoted by IFLA in 2008.1
Still today are few the examples of full integration in the libraries, archives andmuseums field (LAM). Although the direction seems to be the right one and beyond the largenarrative flowing around the subject of full integration, it still presents a set of problems todiscuss and overcome. As he said recently David Ferriero (former director of the New YorkPublic Library): “one of the core challenges facing today’s librarians, archivists, and museumcurators is the need for them to work across disciplines to deliver the integrated, seamlesslevel of service that tech-savvy users are increasingly coming to expect.”2Despite similarvocations as cultural heritage institutions, libraries, archives and museums naturally retaintheir distinct identity and their specific distinguishing features.
In their contribution From coexistence to convergence: studying partnerships andcollaboration among libraries, archives and museums, the authors observe that “Yet whilesome cultural heritage organizations have departmental libraries, archives, and museumswithin one repository […] not all such institutions have common professional practices andaccess systems. The advent of digital environments and the ideal of increased publicaccessibility are but two factors that have led to calls for greater collaboration amonglibraries, archives, and museums”3. Collaboration and convergence of libraries, archives andmuseums, and of the affiliated disciplines (library and information science, archival andmuseum studies), have been discussed intermittently in the literature showing scarce researchabout collaborative projects.
What kind of effort are these institutions making in terms of collaboration andcoexistence about integrated projects on the Web? Usually general public sees littlesignificant difference between libraries, archives and museums and the new users of theresources of these institutions want to have the ability to discover, download, use, andrepurpose those resources in the same way they do other digital resources on the Web.4 For
1 Alexandra Yarrow, Barbara Clubb, Jennifer-Lynn Draper, Public Libraries, Archives and Museums: Trends inCollaboration and Cooperation, The Hague, IFLA Headquarters, 2008 (IFLA Professional Reports, 108). 2 Chuck Laddy in Harvard Gazette, April 10, 2012 http://news.harvard.edu/gazette/story/2012/04/linking-libraries-museums-archives/3 Wendy Duff, Jennifer Carter, Joan M. Cherry, Heather MacNeil, Lynne C. Howarth, From coexistence toconvergence: studying partnerships and collaboration among libraries, archives and museums , InformationResearch, 18, 3, 2013, http://InformationR.net/ir/18-3/paper585.html.4 Lisa M. Given, Lianne McTavish, What's old is new again: the reconvergence of libraries, archives, andmuseums in the digital age. “Library Quarterly”, 80, 2010, 1, p. 7-32.
2
these reasons, here briefly recalled, collaboration among institutions aimed at increasingonline access to cultural heritage resources is essential.
According to the existing literature there are several case studies of convergencethrough the development and implementation of integrated online access systems anddigital-imaging programmes within these institutions. In the general context of this paper, oneof the main problems is therefore to analyze a small sample of digital environments, to assessin which ways the convergence of archives is specifically designed and communicatedthrough the Web, trying to highlight in particular the ways in which people interact with theinformation content of the specific website.5 The aim of the analysis of the following shortlist of websites is to establish how archives, libraries and museums have introducedconverging elements in the structure of the website.
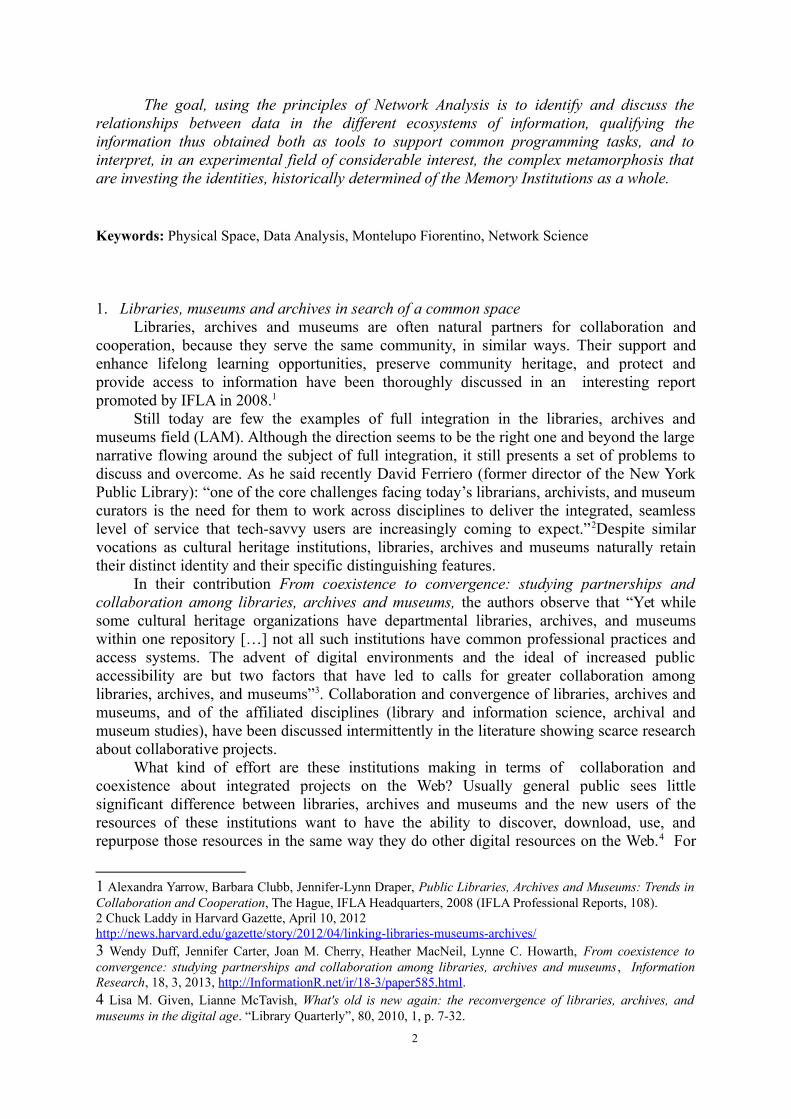
1) The New Schoolhttp://library.newschool.edu/
Site type: Libraries and archives.Country: USA.
Site descriptionThe collection of New School Libraries & Archives is comprised of:
− Fogelman (humanities and social sciences);− University Center (art and design);− Archives & Special Collections (New School history);− Kellen Design Archives (archival design materials and Parsons history); − Scherman (music) collections;− Electronic resources (e-books, scholarly journals etc.).
AudienceCurrently-enrolled students, faculty, and staff. The site was built to support The New
School’s interdisciplinary approach to education and offer an excellent starting place forresearch.
5 Interestingly, in this perspective, is to take into account the content of Karen Smith-Yoshimura, Cindy Shein,Social Metadata for Libraries, Archives, and Museums. Part 1: Site review; Parte 2: Survey analysis,http://www.oclc.org/ research/publications/library/2011/2011-02.pdf.
3
Web 2.0 features explicitly offeredAccording to the About page, features of the site include: RSS feed; user interface
themes; and collaborative filtering.
Potentially useful to libraries, archives, museumsThe site is visually attractive and virtually/electronically brings together related
materials that are physically dispersed throughout a variety of organizations. The advancedsearch provides the user with the ability to narrow the search by several criteria, includingaudience, resource type, format, and language. The search functionality also includeskeyword searching and Google Scholar tools.
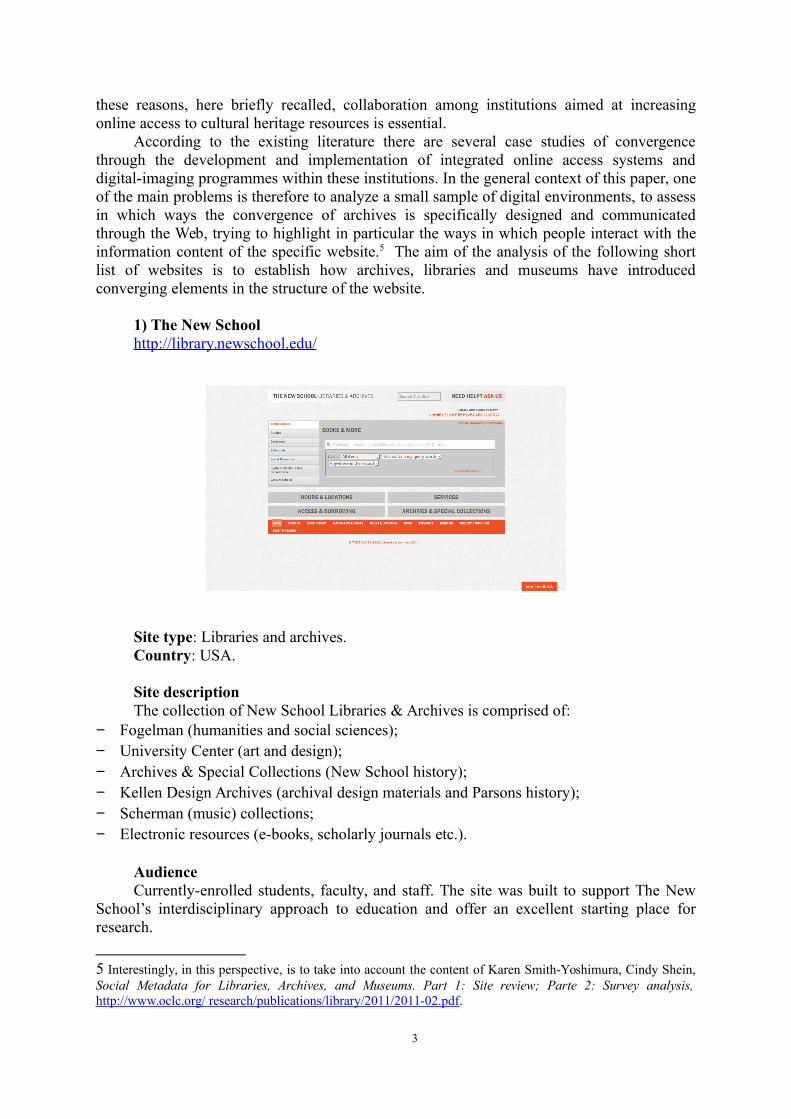
2) The Puke Arikiwww.pukeariki.com/
Site typeArchives, Library, Museum, Touristic Information.
CountryNew Zealand.
Site descriptionPuke Ariki is an innovative museum, library and information centre that combines
learning, knowledge, resources and heritage objects for a visitor experience that is like noother. Puke Ariki incorporates the New Plymouth i-SITE Visitor Information Centre, avaluable source of information about New Plymouth District, Taranaki and New Zealand.
AudienceGeneral public.
LibraryThe catalogue contains all items held at Puke Ariki and District Libraries. Users can
also access a wide variety of electronic resources such as online journals, research papers anddatabases using the keyword function on the catalogue search engine.
4
Heritage CollectionPuke Ariki's Heritage Collection contains objects, papers, photographs and maps - all of
which provide a link to Taranaki's past.
Web 2.0 features explicitly offered: “The portal is an interactive and educationalspace where students, faculty and researchers can access, document, engage with and learnabout the cultural heritage, histories and present-day experiences of Taranaki people. The siteintegrates Web 2.0 technologies such as custom tagging, geo-tagging, direct feedback loops,and user-generated comments to enrich user experience and drive a collaborative frameworkfor knowledge sharing.
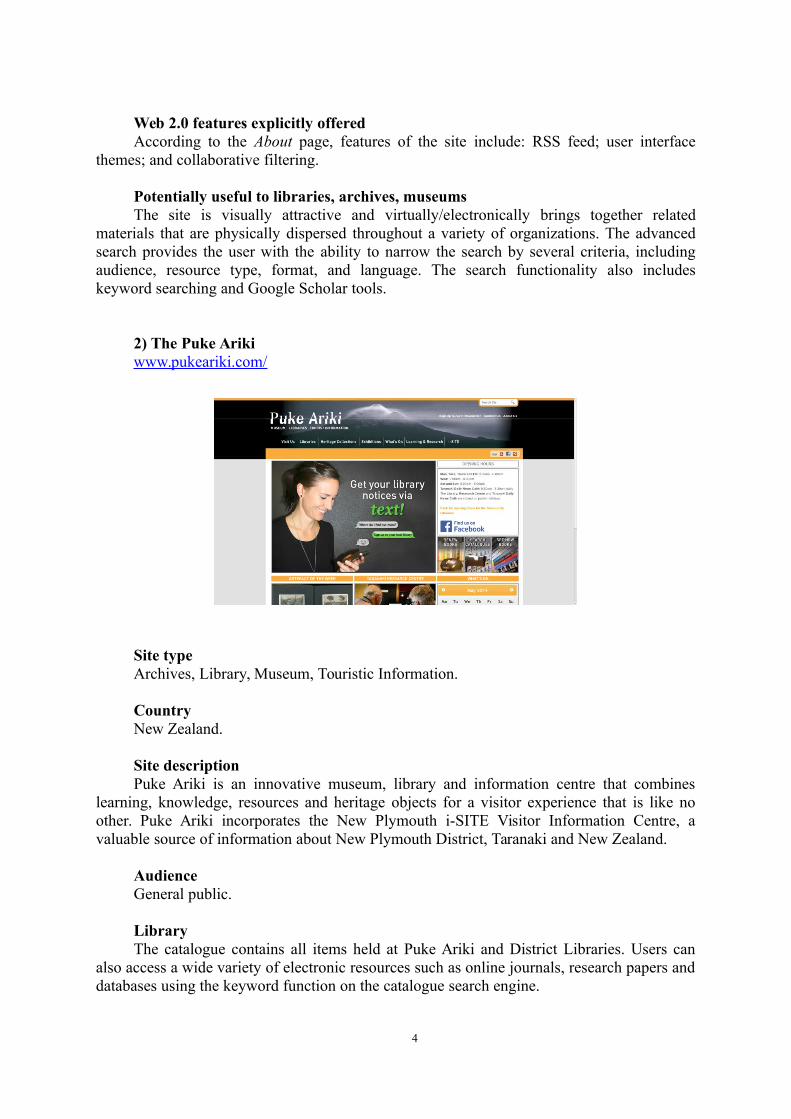
3) Trovehttp://trove.nla.gov.au/
Site Type: Archives, Community, Library.
CountryAustralia.
Site descriptionTrove is a recently launched discovery tool focused on Australia and Australians with
over 90 million items. It supplements what search engines provide, offering a single point ofaccess to: books, journals, magazines and articles; pictures and photos (Picture Australia, seeseparate review); Australian newspapers; diaries, letters, archives; maps; music, sound, andvideo; archived websites; information about people and organizations; lists of related externalwebsites. Users can send persistent links for any of Trove’s items to Twitter, Digg andFacebook.
AudienceGeneral public.
Potentially useful to libraries, archives, museums
5
The single search access across such abroad range of resources, presented in the eightgroupings or zones with facets and option to restrict results to only those freely availableonline, is impressive. Related items include external websites, as well as resources withinTrove.
2. The design of MMABOn May 4, 2014 in Montelupo Fiorentino, a small town near Florence, was inaugurated
the MMAB. Montelupo Museo Archivio Biblioteca. In a single space, which previously hadbeen intended only for the Museum of Ceramics, were located the library and the archive.The project, which is still being completed, originated from a study commissioned by theCity Council and prepared by a working group composed by Maurizio Vivarelli (Universityof Turin), Enrica Pagella and Carlotta Margarone (Museo civico d’Arte Antica, Turin), andClaudio Rosati (former director of museum services in Tuscany), with whom has beendefined a conceptual and organizational common model, shared, in accordance with thegeneral lines of analysis that involved the local context and the critical points highlighted inthe previous models.
The Ceramics Museum (http://www.museomontelupo.it/mu/1/home/index.php) wasopened in 2008 in a building dating back to the early twentieth century, formerly seat of aschool. The area dedicated to the permanent exhibition is spread over an area of about 1000square meters divided into 12 rooms on three floors, with the addition of two front sidecorridors on the first and second floor. The services of the library(http://www.comune.montelupo-fiorentino.fi.it/) are inserted in the current profile of theactivities of the Cultural Center Nautilus. The project involved the creation of a commonreception area, designed as a place of easy transition between the exterior and the interior.
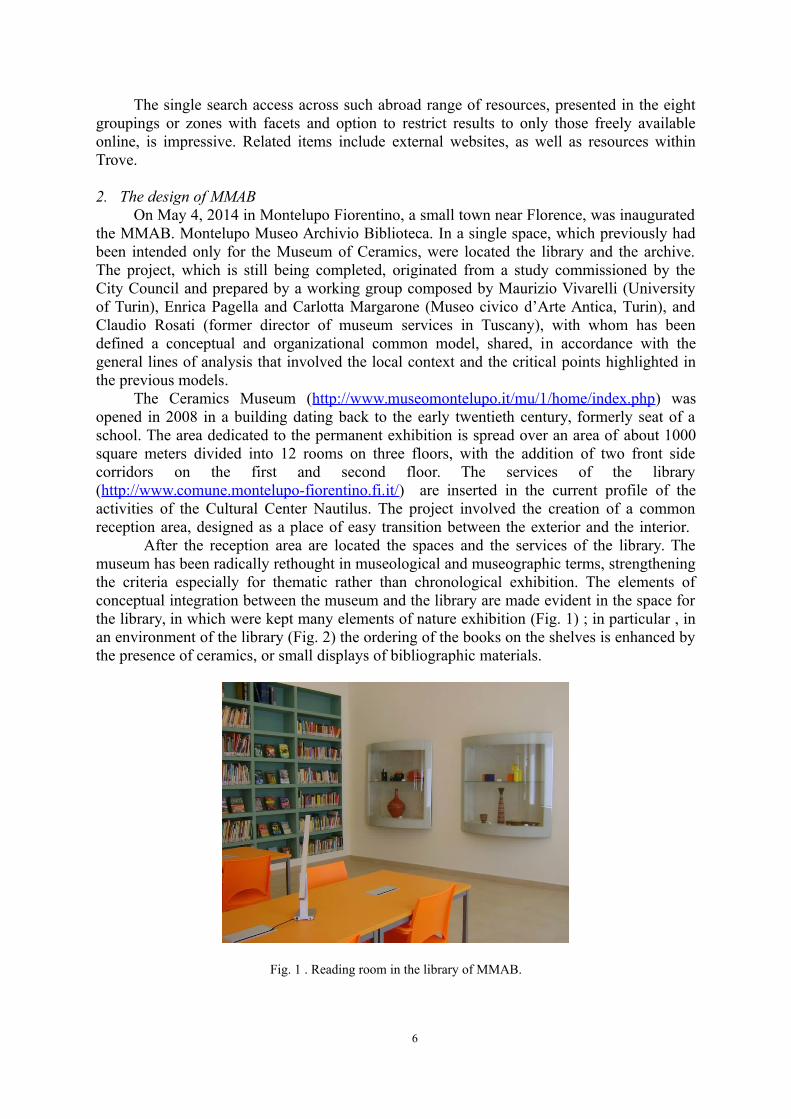
After the reception area are located the spaces and the services of the library. Themuseum has been radically rethought in museological and museographic terms, strengtheningthe criteria especially for thematic rather than chronological exhibition. The elements ofconceptual integration between the museum and the library are made evident in the space forthe library, in which were kept many elements of nature exhibition (Fig. 1) ; in particular , inan environment of the library (Fig. 2) the ordering of the books on the shelves is enhanced bythe presence of ceramics, or small displays of bibliographic materials.
Fig. 1 . Reading room in the library of MMAB.
6
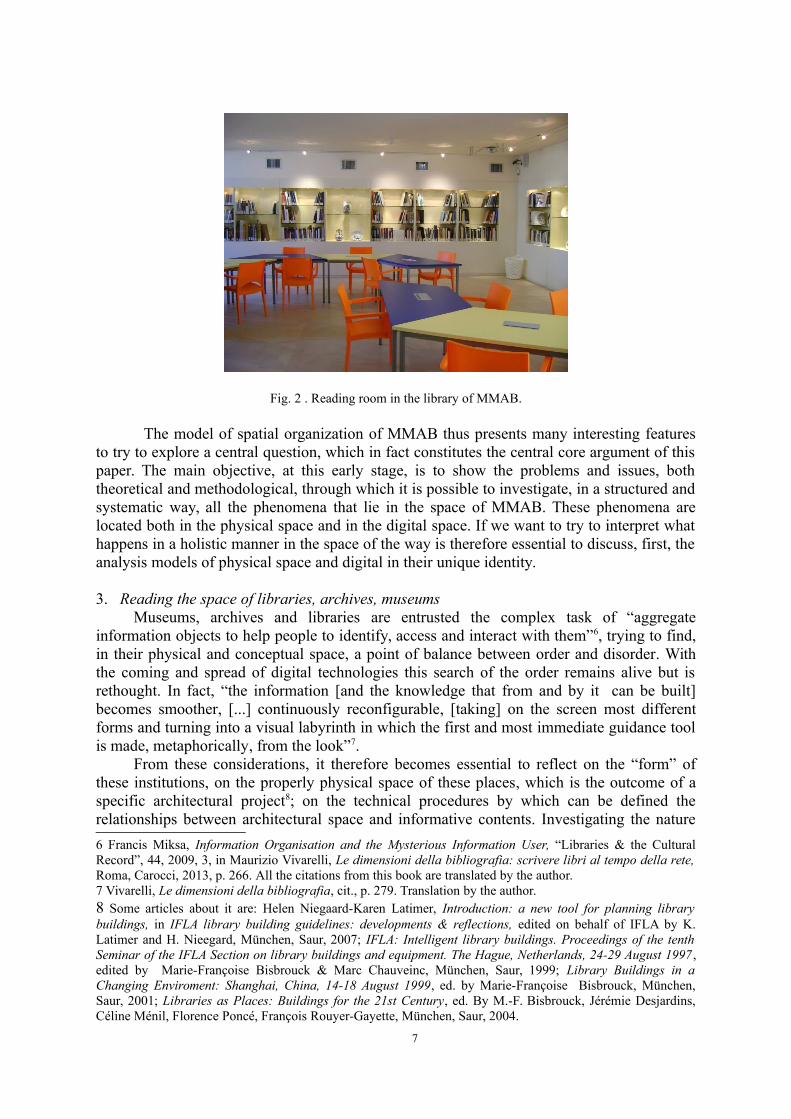
Fig. 2 . Reading room in the library of MMAB.
The model of spatial organization of MMAB thus presents many interesting featuresto try to explore a central question, which in fact constitutes the central core argument of thispaper. The main objective, at this early stage, is to show the problems and issues, boththeoretical and methodological, through which it is possible to investigate, in a structured andsystematic way, all the phenomena that lie in the space of MMAB. These phenomena arelocated both in the physical space and in the digital space. If we want to try to interpret whathappens in a holistic manner in the space of the way is therefore essential to discuss, first, theanalysis models of physical space and digital in their unique identity.
3. Reading the space of libraries, archives, museumsMuseums, archives and libraries are entrusted the complex task of “aggregate
information objects to help people to identify, access and interact with them”6, trying to find,in their physical and conceptual space, a point of balance between order and disorder. Withthe coming and spread of digital technologies this search of the order remains alive but isrethought. In fact, “the information [and the knowledge that from and by it can be built]becomes smoother, [...] continuously reconfigurable, [taking] on the screen most differentforms and turning into a visual labyrinth in which the first and most immediate guidance toolis made, metaphorically, from the look”7.
From these considerations, it therefore becomes essential to reflect on the “form” ofthese institutions, on the properly physical space of these places, which is the outcome of aspecific architectural project8; on the technical procedures by which can be defined therelationships between architectural space and informative contents. Investigating the nature
6 Francis Miksa, Information Organisation and the Mysterious Information User, “Libraries & the CulturalRecord”, 44, 2009, 3, in Maurizio Vivarelli, Le dimensioni della bibliografia: scrivere libri al tempo della rete,Roma, Carocci, 2013, p. 266. All the citations from this book are translated by the author.7 Vivarelli, Le dimensioni della bibliografia, cit., p. 279. Translation by the author.8 Some articles about it are: Helen Niegaard-Karen Latimer, Introduction: a new tool for planning librarybuildings, in IFLA library building guidelines: developments & reflections, edited on behalf of IFLA by K.Latimer and H. Nieegard, München, Saur, 2007; IFLA: Intelligent library buildings. Proceedings of the tenthSeminar of the IFLA Section on library buildings and equipment. The Hague, Netherlands, 24-29 August 1997 ,edited by Marie-Françoise Bisbrouck & Marc Chauveinc, München, Saur, 1999; Library Buildings in aChanging Enviroment: Shanghai, China, 14-18 August 1999, ed. by Marie-Françoise Bisbrouck, München,Saur, 2001; Libraries as Places: Buildings for the 21st Century, ed. By M.-F. Bisbrouck, Jérémie Desjardins,Céline Ménil, Florence Poncé, François Rouyer-Gayette, München, Saur, 2004.
7
of the connections between these three types of spaces allows to have an overview on thechanges that contemporary society imposes on the conceptual and physical structure oflibraries, archives and museums. For this purpose, these places may be conceived like texts,“the elements of which [...], give rise to a texture of different types of signs whose conditionsof signification must be guaranteed by a code, and secondly to try to understand how may beimplemented and configure the use, that is, the reading of this text”9. People using thesespaces, therefore, can be thought of as readers of a text.
The need to understand the rules that drive the users/readers to use/read the space of theinstitution has led to embrace a qualitative methodology, that allows to study the user both inrelation to its subjective characteristics both in relation to the social context10.
4. An olistic method of investigationStarting from these theoretical premises has been identified a method which
incorporates all the different perspectives used for the analysis and evaluation of the space;the method, which due to its fundamental characteristics we could therefore define “holistic”,is divided into the following phases:
− collection of the different types of sources related to the identification of the specificspace (history of the institution, project documents, performance evaluations, qualitativesurveys etc.);
− development of a questionnaire addressed to users, staff, policy makers, whose purpose isto collect information on the perception and evaluation of architectural space, in all itsimplications, and of the digital space;
− creation of an evaluation grid, that may be modified during the research, based on theresult of the above observations and on the results of the interviews, in order to identifywhich are the most frequent types of behaviors adopted by users, in the different contexts.Without any intervention by the operator, will be observed the most frequently routesmade by the users of the buildings. Some representative users will be selected for atargeted interviews or focus groups about their own perceptions of the architectural,digital and bibliographic spaces of the building, on the relational possibilities offered bythe structure, on the quality of services provided and on the staff;
− evaluation of all the data, creating graphs and tables with the different types of activitiescarried out by the users; processing of a report to show the perceptions of the space basedupon the analysis of the interviews11; creation of visual maps that show the most recurrentroutes made by visitors during their stay in the structure.12
5. Complexity of the concept of ‘data’In the last decades we have witnessed to an exponential growth of data. There are huge
quantities of information about every subject and this undoubtedly creates uncertainty,confusion, and we run the risk of get lost in it. In order to avoid this inconvenience we need
9 Vivarelli, Un’idea di biblioteca. Lo spazio bibliografico della biblioteca pubblica, Manziana, Vecchiarelli,2010, p. 206-207. Translation by10 These arguments are discuted in Lo spazio della biblioteca. Culture e pratiche del progetto tra architettura ebiblioteconomia, [edited by] Maurizio Vivarelli, Milano, Editrice Bibliografica, 2013, p. 414-443.11 This line of work will take particular attention of what are the techniques and methods of application of thecurrent and the so-called Post Occupancy Evaluation: http://www.usablebuildings.co.uk/Pages/Unprotected/Newcastle2005POE.pdf; http://www.aude.ac.uk/info-centre/goodpractice/AUDE_POE_guide.12 For the development and processing of this type of analysis we turned to the experience at the Danish libraryof Hjørring by Valinka Suenson and Henrik Harder, The microsphere, the user and the architecture,http://vbn.aau.dk/files/43872052/27058.pdf .
8
to dig up in these mines of numbers and symbols to extract information from a data set andtransform it into an understandable structure for further use. We need to give them a meaning.
This process could be called generically ‘data analysis’, but lately we could refer to itas ‘data mining’. There are no big differences between these two terms. The aim is the same:inspecting, cleaning, transforming, and modeling data with the goal of discovering usefulinformation, suggesting conclusions, and supporting decision making. Specifically, datamining is an interdisciplinary subfield of computer science involving methods at theintersection of artificial intelligence, machine learning, statistics, and database systems13. Thecentral core subject of data analysis, however, is definitely statistics. There are two kinds ofstatistics. Descriptive statistics is the first and basic level of analysis, but it is very important.
It provides a representation of the phenomena that must be studied, and allows you tostart thinking about what is the nature of the data, and about what laws regulate them.Causality is, instead, the first thinking of statistical inference. If you know what are theinfluences in your data is, you will know what is your next move, or you will answer to yourprevious question: why did it happen? The relation between data is not the only result thatyou can obtain with statistical inference. You can also achieve, for example, a set division ofyour dataset in groups of subjects which are similar among them and different from others.
This method is called ‘cluster analysis’. If the variables in the dataset are related witha response variable14, then it is called classification analysis. Another reach, directconsequence of causality, is prediction or, even better, forecast. To reach these goals anystatistical inference requires some assumptions. A statistical model is a set of assumptionsconcerning the generation of the observed data and similar data. Descriptions of statisticalmodels usually emphasize the role of population quantities of interest, about which we wishto draw inference15. Descriptive statistics are typically used as a preliminary step before moreformal inferences are drawn16. Every model starts with a particular question in mind: this isthe first rule, and if you have to design a survey to obtain data, you have to know exactlywhat are you looking for. But this paradigm changes in our era. Data, more than ever, isalready available and sometimes they drive to new questions. This is the new challenge thatdata and big data offer to us.
Lately, the scientific community is focusing on complex systems, a very generic fieldfull of massive bulk of data. We are surrounded by these systems that are hopelesslycomplicated, from the society, whose seamless functioning requires cooperation betweenbillions of individuals, to communications infrastructures that integrate billions of cellphoneswith computers and satellites. Our ability to reason and comprehend the world around us isguaranteed by the coherent activity of billions of neurons in our brain. Our very existence isrooted in seamless interactions between thousands of genes and metabolites within our cells.Given the important role they play in our life, in science and economy, the understanding,mathematical description, prediction, and eventually the control of such complex systems isone of the major intellectual and scientific challenges of the 21st century 17. Since all complexsystems have many interconnected components, the heart of this discipline is networkscience18.
13Christopher Clifton, Data mining, in Encyclopaedia Britannica, http://www.britannica.com/ EBchecked/topic/1056150/data-mining/281958/Additional-Reading Mining". 14 In an experiment, is the event studied and expected to change when the independent variable is changed.15David Roxbee Cox, Principles of statistical inference, Cambridge, Cambridge University Press, 2006.16 Michael J. Evans, Jeffrey S. Rosenthal, Probability and statistics: the science of uncertainty, Freeman andCompany, 2004.17Albert-László Barabási, Linked : the new science of networks, Cambridge (Mass.), Perseus, 2002. See alsoNetwork Science, http://barabasilab.neu.edu/networksciencebook. 18Ivi.
9
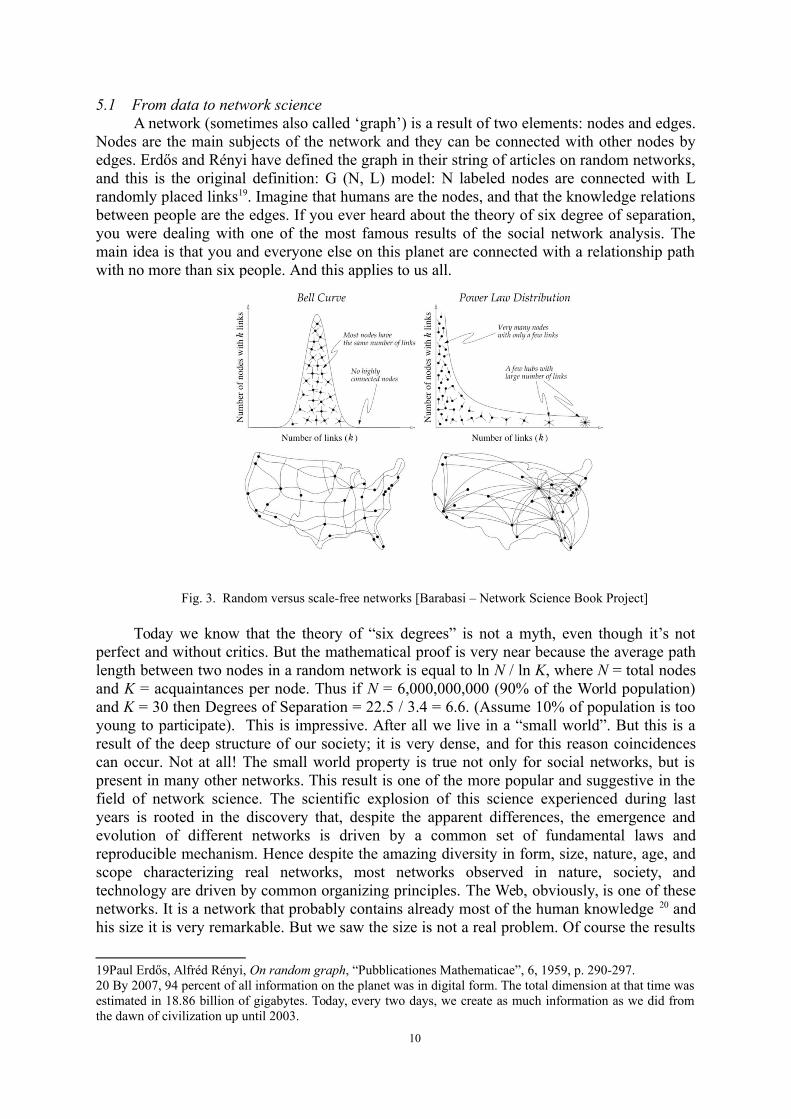
5.1 From data to network scienceA network (sometimes also called ‘graph’) is a result of two elements: nodes and edges.
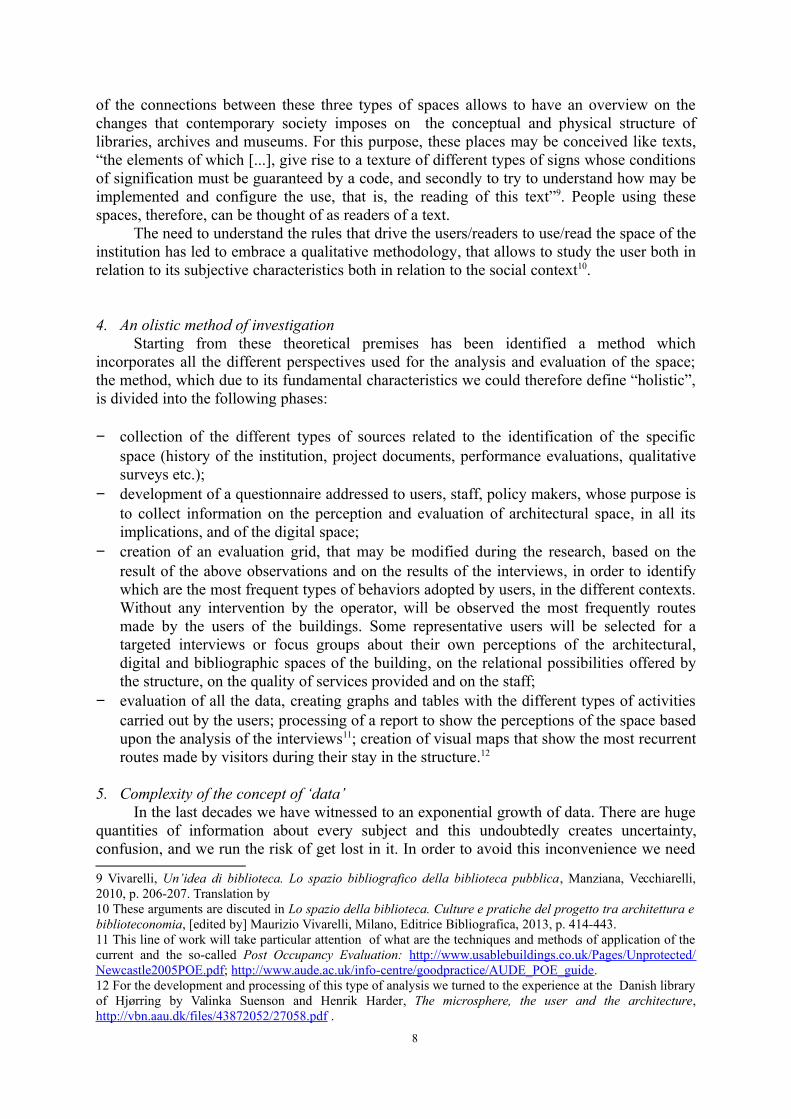
Nodes are the main subjects of the network and they can be connected with other nodes byedges. Erdős and Rényi have defined the graph in their string of articles on random networks,and this is the original definition: G (N, L) model: N labeled nodes are connected with Lrandomly placed links19. Imagine that humans are the nodes, and that the knowledge relationsbetween people are the edges. If you ever heard about the theory of six degree of separation,you were dealing with one of the most famous results of the social network analysis. Themain idea is that you and everyone else on this planet are connected with a relationship pathwith no more than six people. And this applies to us all.
Fig. 3. Random versus scale-free networks [Barabasi – Network Science Book Project]
Today we know that the theory of “six degrees” is not a myth, even though it’s notperfect and without critics. But the mathematical proof is very near because the average pathlength between two nodes in a random network is equal to ln N / ln K, where N = total nodesand K = acquaintances per node. Thus if N = 6,000,000,000 (90% of the World population)and K = 30 then Degrees of Separation = 22.5 / 3.4 = 6.6. (Assume 10% of population is tooyoung to participate). This is impressive. After all we live in a “small world”. But this is aresult of the deep structure of our society; it is very dense, and for this reason coincidencescan occur. Not at all! The small world property is true not only for social networks, but ispresent in many other networks. This result is one of the more popular and suggestive in thefield of network science. The scientific explosion of this science experienced during lastyears is rooted in the discovery that, despite the apparent differences, the emergence andevolution of different networks is driven by a common set of fundamental laws andreproducible mechanism. Hence despite the amazing diversity in form, size, nature, age, andscope characterizing real networks, most networks observed in nature, society, andtechnology are driven by common organizing principles. The Web, obviously, is one of thesenetworks. It is a network that probably contains already most of the human knowledge 20 andhis size it is very remarkable. But we saw the size is not a real problem. Of course the results
19Paul Erdős, Alfréd Rényi, On random graph, “Pubblicationes Mathematicae”, 6, 1959, p. 290-297.20 By 2007, 94 percent of all information on the planet was in digital form. The total dimension at that time wasestimated in 18.86 billion of gigabytes. Today, every two days, we create as much information as we did fromthe dawn of civilization up until 2003.
10
about degrees of separation it depends on the network. A famous study showed that thenetwork of Web obtained 19 as a result of the average path length, that is one of the largestresults comparing with other famous networks (Internet, language network, brain network,metabolic and protein networks, citation networks, etc.)21. What is really powerful is thecapability to connect in a very few steps different sources and this ensure the connectionbetween different types of databases and different kind of users. Then every user, consciouslyor not, can contribute to the heritage of knowledge. In our case the Web is not only a set ofwebsites connected to each other, but every kind of document found in a webpage, whethertext, video, music or, even more, a theoretical concept inside a document, can be a nodeitself.
Then there is the problem of usability and accessibility. We need a better and morestructured schema instead of simple link between website pages. We need to put meaning inevery connection. When we talk about ‘linked data’ we refer to a set of W3C standard forpublication, sharing a correlation of structured data. Resource Description Framework (RDF)is a standard model for data interchange on the Web. It extends the data linking structure ofthe Web to use URIs to name the relationship between things as well as the two ends of thelink (this is usually referred to as a “triple”). Using this simple model, it allows structured andsemi-structured data to be mixed, exposed, and shared across different applications22. We canaccess RDF documents with SPARQL, a query language to obtain information aboutdocuments across different data sources. We give life to ‘web of data’, a network where datais semantically interconnected.
To understand how all of this information is connected and intertwined, there aremathematical measures in networks which tell us everything about the role of the nodes in thegraph structure. One of these is centrality: some nodes play a more important role for thenetwork configuration, than others. There are different kinds of centrality, the most importantis degree centrality, actually the number of links of a node. It means that we could considerthe node with higher degree centrality the most central node of the network and so on. Thereare still other measures like betweenness centrality that evaluate how much a node is able tojoin different groups, these kind of nodes are in strategic positions and connect differentcomponent of the network. Another important aspect of network science is visualization.
Looking at the network, or part of it, can be more explanatory than a thousand words;drawing a graph is not an ordinary activity. You have to choose layout carefully, in relation ofwhat are you trying to say, if so. Colors, sizes and positions of the nodes can completelychange the meaning of the network from human eyes, even in the network is exactly thesame. In addition one could present interactive vision of the graph, for example begin from adifferent starting point, then, once chosen, highlight a network pattern instead of others. Realmaps of knowledge can be created.
6. Data as traces
The basic concepts of data mining and network science introduced in the previousparagraphs provide useful methods and tools to approach the analysis of the huge amount ofdigital information typical of archives, libraries and museums. They produce and store manydifferent kinds of data and here we try to summarize them in some macro classes:
− the informative content of the records in the catalog;
21Albert-László Barabási, Albert Réka, Emergence of scaling in random networks, “Science”, 286, 1999, p.509-512.22 See http://www.w3.org/RDF/.
11
− the informative content of the digital objects connected to the records, such as text, audio,video files;
− information about the audience and visitors behavior in the physical spaces, in all itscomponents;
− logs of the users searches trough the Web portals and the online catalog;− users behaviors and conversations collected via the social networks.
All of those datasets can be analyzed to outline the profile of the “Institution” whichproduces and store them, and their social impact. In our model we approach the analysisconsidering:
− each dataset as single and isolated;− every datasets as an heterogeneous unicum;− expanding every dataset using data enrichment techniques.
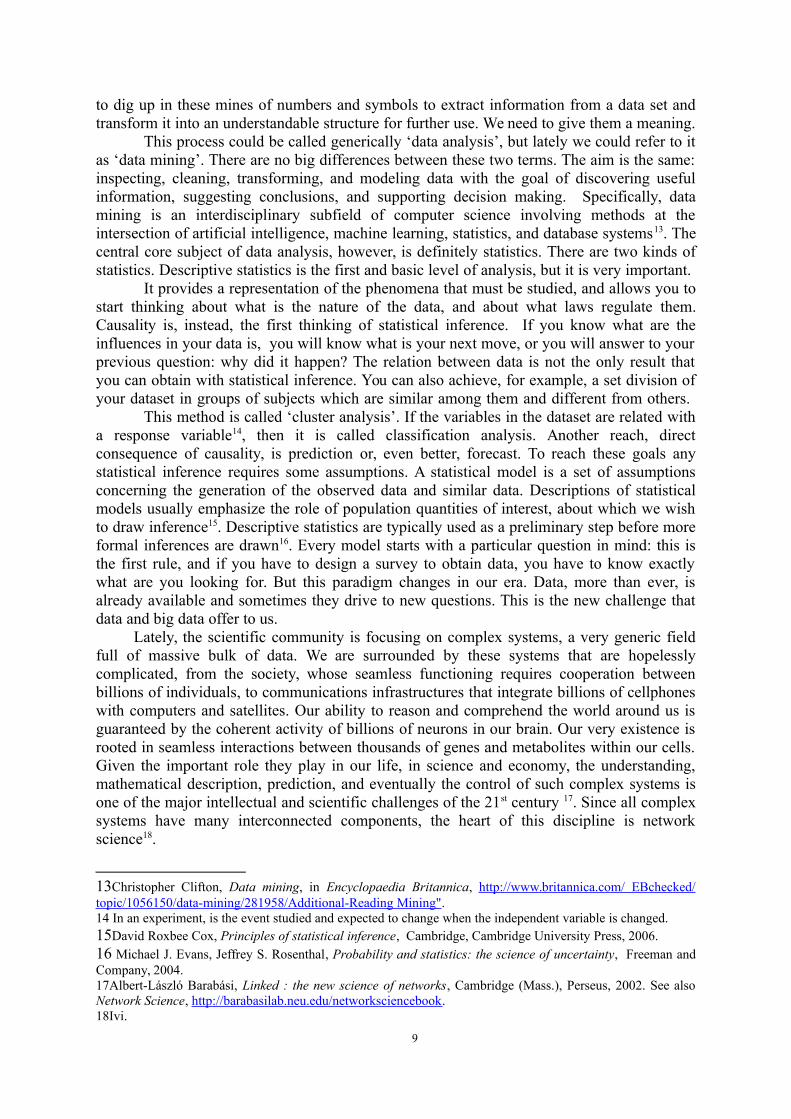
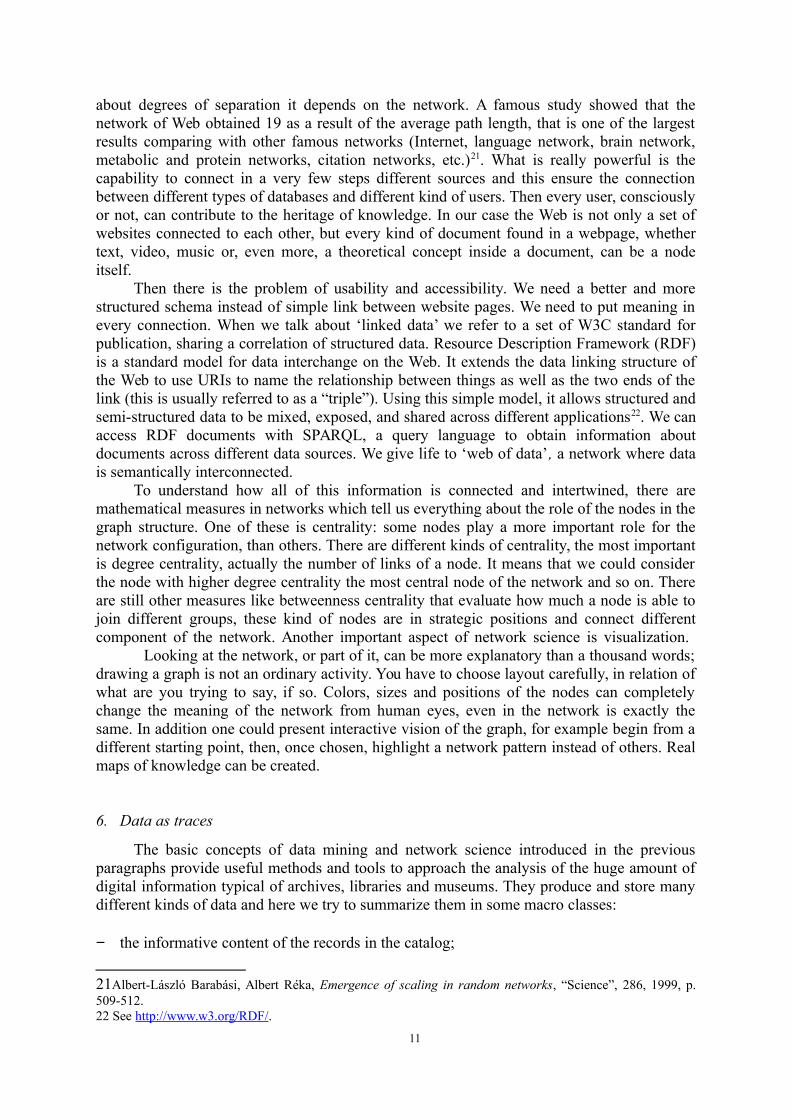
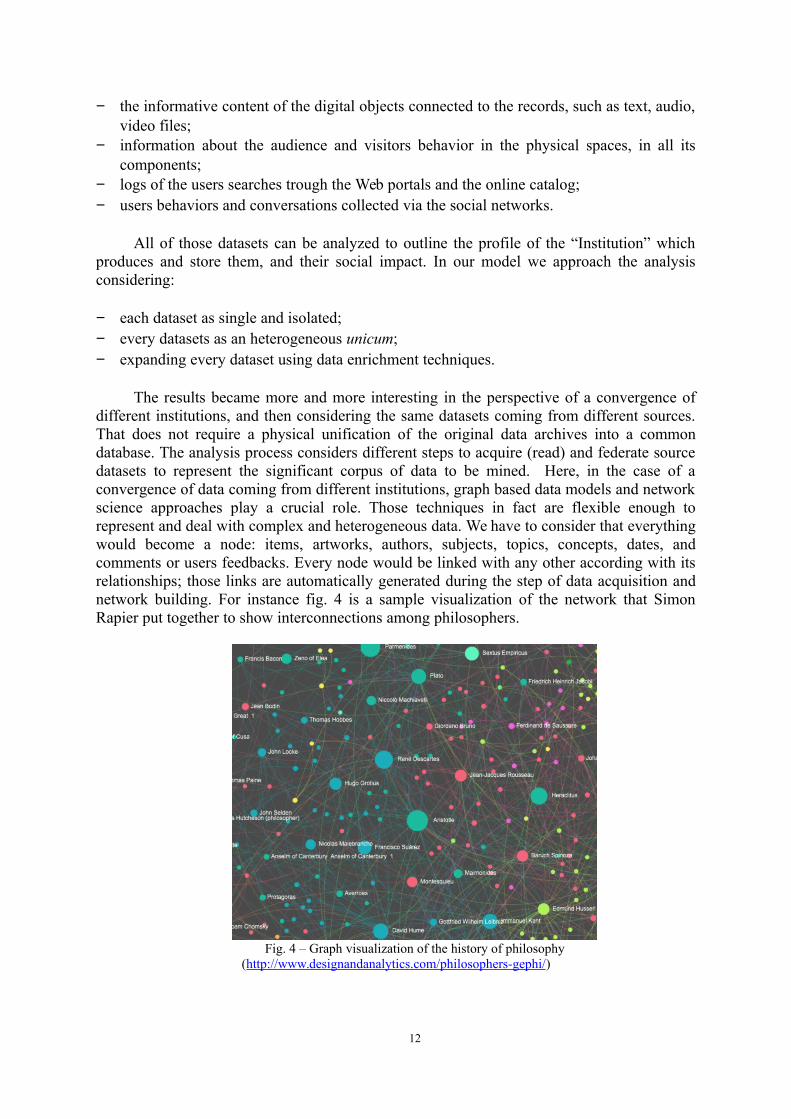
The results became more and more interesting in the perspective of a convergence ofdifferent institutions, and then considering the same datasets coming from different sources.That does not require a physical unification of the original data archives into a commondatabase. The analysis process considers different steps to acquire (read) and federate sourcedatasets to represent the significant corpus of data to be mined. Here, in the case of aconvergence of data coming from different institutions, graph based data models and networkscience approaches play a crucial role. Those techniques in fact are flexible enough torepresent and deal with complex and heterogeneous data. We have to consider that everythingwould become a node: items, artworks, authors, subjects, topics, concepts, dates, andcomments or users feedbacks. Every node would be linked with any other according with itsrelationships; those links are automatically generated during the step of data acquisition andnetwork building. For instance fig. 4 is a sample visualization of the network that SimonRapier put together to show interconnections among philosophers.
Fig. 4 – Graph visualization of the history of philosophy(http://www.designandanalytics.com/philosophers-gephi/)
12
There are almost no limits in size and variety of data that would be included. Theresulting network is a valid and powerful representation of the identity of the Institutions andwe have the chance to investigate such representation. The development and adoption ofspecific network analysis algorithms leads to a model that enable to:
− highlight hidden relationships and patterns;− identify objects, actors, concepts and activities which are central in the dynamic behavior
of the resulting networks;− discover unexpected paths which relate and keep close different artworks coming from
distinct catalogs.
According to this point of view the data is able to express itself not in an aggregateform but in its complexity and entirety. From these theoretical and methodological premisescan be clearly identified some specific fields of application, and the study of a new dataanalysis model able to reflect the variety of digital asset typical of memory institutions, leadsto concrete opportunities to:− understand the relationships derived from the convergence of knowledge coming from
different sources and different history;− keep informed decisions to get value from more effective uses of spaces and contents;− make more usable and accessible the entire heritage / asset; − let people freely follow the discovery paths best match their interests.
7. ConclusionsThe analysis of the physical and digital space of MMAB presents to our notice many
points of interest, which in this paper have been briefly presented in their most significanttheoretical and methodological implications. From the month of September will start theempirical phase of data collection, according to the general rules that have been discussedhere. The complexity of the phenomena that occur in the physical and digital space oflibraries, archives and museums make it essential to define a frame of interpretation wide,systematic and integrated, thanks to which we believe it will become possible to betterunderstand two sets of twisted facts. The first area is the analysis of what occurs in thephysical space, and that, therefore, concern the interactions between the “signs” in the spaceand their perception and interpretation by the people. The second area is the set of digitaltracks , which are regarded as “signs” written on the Web. The principles of network science,discussed above, can be a tool of fundamental importance to understand what these "signs"mean, both as traces of the uses that people make of the space, and as elements that connectthe digital space of MMAB , to the wider space of the Web, in large extent unknown. Ourgoal, from the case study, is to build a model of interpretation applicable to the analysis ofany type of space, to emphasize the elements of integration which, of that space, define thespecific and peculiar identity.
13