Embed Size (px)
Citation preview
THE PORT AUTHORITY OF NEW YORK & NEW JERSEY
AIRTRAIN LGA
LGA GROUND ACCESS MODE CHOICE MODEL AND AIRTRAIN RIDERSHIP FORECAST 2025–2045
OCTOBER 2018

AIRTRAIN LGA
LGA GROUND ACCESS MODE CHOICE MODEL AND AIRTRAIN RIDERSHIP FORECAST
2025–2045
PORT AUTHORITY OF NEW YORK & NEW JERSEY

LGA Airport Access Improvement Project i
TABLE OF CONTENTS
EXECUTIVE SUMMARY .................................................................................................... 1
INTRODUCTION ............................................................................................ 3
PASSENGER PREFERENCE SURVEY ........................................................... 7
MODEL DATABASE CONSTRUCTION AND INPUTS ....................................... 9
3.1 ORIGIN, DESTINATION, AND DEMOGRAPHIC DATA ........................................... 9
3.2 SURVEY WEIGHTING AND CONTROL DATA SOURCES .....................................12
3.3 LGA PASSENGER FORECAST AND GROWTH FACTORS 2017–2025–2045 .........13
MODEL ANALYSIS FOR AIRTRAIN LGA ........................................................16
4.1 GEOGRAPHIC MARKETS OF AIR PASSENGERS AND EMPLOYEES ...................16
4.2 LGA PASSENGER TYPES...................................................................................17
4.3 AUTO AND TRANSIT TRAVEL TIMES FOR KEY O&D PAIRS ................................19
OVERVIEW OF THE RIDERSHIP MODELING METHODOLOGY .....................24
5.1 PROTOTYPES AND SOURCES FOR THE CURRENT MODEL ..............................24
5.2 COMPLETE SYSTEM WITH EQUILIBRATION ......................................................25
5.3 RIDERSHIP FORECASTING PROCESS ...............................................................26
5.4 COMPARISON TO THE PREVAILING PRACTICES IN AIRPORT GROUND ACCESS MODELING ..........................................................................................27
5.5 MODELED GROUND ACCESS MODES AND MODE COMBINATIONS ..................28
OVERVIEW OF THE STATISTICAL STRUCTURE OF THE MODEL .................30
6.1 GROUND ACCESS MODE CHOICE FRAMEWORK ..............................................30
6.2 MAIN VARIABLES AND FACTORS ACCOUNTED IN THE MODEL ........................30
6.3 VALUE OF TIME (VOT) .......................................................................................32
LEVEL-OF-SERVICE (LOS) DATA AND ASSUMPTIONS .................................35
7.1 BASELINE ALTERNATIVE ...................................................................................35
7.2 BUILD ALTERNATIVE .........................................................................................36
AIRTRAIN LGA RIDERSHIP FORECAST ........................................................38
8.1 AIRTRAIN LGA RIDERSHIP SUMMARY BY MODE COMBINATION .......................38
8.2 COMPARISON OF LGA GROUND ACCESS MODE SHARES FOR BASE AND BUILD SCENARIOS ....................................................................................40
8.3 AIRTRAIN LGA PAID RIDERSHIP MARKET SHARE BY GEOGRAPHY ..................43
8.4 MODE SWITCHES FROM THE EXISTING MODES TO AIRTRAIN LGA ..................47
8.5 RIDERSHIP SENSITIVITY TEST RESULTS ..........................................................48
REFERENCES .............................................................................................53
LIST OF CONTRIBUTORS...........................................................................55
ii LGA Airport Access Improvement Project
APPENDICES
APPENDIX A. LAGUARDIA AIRPORT (LGA) SURVEYS USED IN THE MODELING PROCESS
APPENDIX B. LGA PASSENGER AND EMPLOYEE SURVEY RESULTS
APPENDIX C. ANALYSIS OF CONGESTION GROWTH AND HIGHWAY TIME RELIABILITY FOR TRIPS TO AND FROM LGA
APPENDIX D. SURVEY OF VOT AND MODE CONVENIENCE FACTORS IN APPLIED MODELS FOR AIRPORT GROUND ACCESS MODE CHOICE
APPENDIX E. COMPARATIVE ANALYSIS OF RAIL MODE SHARE FOR DIFFERENT AIRPORTS
APPENDIX F. DETAILS OF SWITCHING LOGIT MODEL FORMULATION
APPENDIX G. TRAVEL TIMES USED FOR RIDERSHIP MODEL INPUTS
TABLES
TABLE 1-1 GROUND ACCESS MODE CHOICE AT LGA ..................................................... 4
TABLE 1-2 CUMULATIVE TRAFFIC GROWTH RATES FOR STUDY AREA .......................... 6
TABLE 2-1 PARTICIPATION OF AIR PASSENGERS IN THE SURVEY FOR AIRTRAIN LGA ................................................................................................................. 7
TABLE 3-1 AIR PASSENGERS BY MODE (UN-WEIGHTED) FROM 2017 SURVEY ..............11
TABLE 3-2 SUMMARY OF EMPLOYEE OBSERVATIONS BY MODE (UN-WEIGHTED) FROM 2017 SURVEY .......................................................................................................11
TABLE 3-3 AIR PASSENGERS BY MODE (UN-WEIGHTED) FROM CSS 2014-2016 ............12
TABLE 3-4 TARGET CONTROLS FOR SURVEY EXPANSION ............................................13
TABLE 3-5 LGA LONG-RANGE FORECAST 2017–2045 .....................................................14
TABLE 3-6 INPUT DATA FOR THE CALCULATION OF DAILY EMPLOYEE TRIPS TO AND FROM LGA ..............................................................................................................15
TABLE 4-1 DISTRIBUTION OF LGA AIR PASSENGERS BY TYPE ......................................19
TABLE 4-2 COMPARISONS OF AUTO AND TRANSIT TRAVEL TIMES WITH AIRTRAIN TO LGA (PM PEAK) FOR SELECTED IMPORTANT LOCATIONS, 2025 AND 2045 ....................20
TABLE 4-3 COMPARISONS OF AUTO AND TRANSIT TRAVEL TIMES WITH AIRTRAIN FROM LGA (AM PEAK) FOR SELECTED IMPORTANT LOCATIONS, 2025 AND 2045 .........21
TABLE 5-1 DEFINITION OF DETAILED GROUND ACCESS MODES FOR LGA ...................28
TABLE 6-1 MODEL UTILITY COEFFICIENTS.....................................................................31
TABLE 6-2 EXAMPLES OF ESTIMATED OR ASSUMED VOT IN APPLIED AIRPORT GROUND ACCESS MODE CHOICE MODELS ...................................................................33
TABLE 8-1 DAILY AIRTRAIN RIDERSHIP SUMMARY FOR 2025 ........................................38
LGA Airport Access Improvement Project iii
TABLE 8-2 ANNUAL AIRTRAIN RIDERSHIP SUMMARY FOR 2025 IN THOUSANDS ...........39
TABLE 8-3 DAILY AIRTRAIN RIDERSHIP SUMMARY FOR 2045 ........................................39
TABLE 8-4 ANNUAL AIRTRAIN RIDERSHIP SUMMARY FOR 2045 IN THOUSANDS ...........40
TABLE 8-5 LGA GROUND ACCESS MODE SHARES FOR AIR PASSENGERS FOR BASELINE AND BUILD SCENARIOS IN 2025 ....................................................................41
TABLE 8-6 LGA GROUND ACCESS MODE SHARES FOR AIR PASSENGERS FOR BASELINE AND BUILD SCENARIOS IN 2045 ....................................................................41
TABLE 8-7 LGA GROUND ACCESS MODE SHARES FOR EMPLOYEES BASELINE AND BUILD SCENARIOS IN 2025 .............................................................................................42
TABLE 8-8 LGA GROUND ACCESS MODE SHARES FOR EMPLOYEES FOR BASELINE AND BUILD SCENARIOS IN 2045 .....................................................................................43
TABLE 8-9 AIRTRAIN MARKET SHARE BY GEOGRAPHY IN 2025 (DAILY TRIPS) .............44
TABLE 8-10 AIRTRAIN MARKET SHARE BY GEOGRAPHY IN 2025 (ANNUAL TRIPS, MILLIONS) .......................................................................................................................45
TABLE 8-11 AIRTRAIN MARKET SHARE BY GEOGRAPHY IN 2045 (DAILY TRIPS) ............46
TABLE 8-12 AIRTRAIN MARKET SHARE BY GEOGRAPHY IN 2045 (ANNUAL TRIPS) ........47
TABLE 8-13 AIRTRAIN AIR PASSENGER MODE SWITCHES, 2025 DAILY TRIPS ..............49
TABLE 8-14 MODE SWITCHED FROM THE EXISTING MODES TO AIRTRAIN FOR AIR PASSENGERS IN 2045 (DAILY TRIPS) .............................................................................50
TABLE 8-15 MODE SWITCHED FROM THE EXISTING MODES TO AIRTRAIN FOR EMPLOYEES IN 2025 (DAILY TRIPS) ...............................................................................51
TABLE 8-16 MODE SWITCHED FROM THE EXISTING MODES TO AIRTRAIN FOR EMPLOYEES IN 2045 (DAILY TRIPS) ...............................................................................52
iv LGA Airport Access Improvement Project
FIGURES
FIGURE 1-1 PROJECT VICINITY .......................................................................................... 3
FIGURE 1-2 PUBLIC TRANSIT OPTIONS TO LAGUARDIA AIRPORT ......................................... 3
FIGURE 2-1 RANKING OF LIRR+AIRTRAIN OPTION BY LGA AIR PASSENGERS ........................ 8
FIGURE 2-2 RANKING OF SUBWAY+AIRTRAIN OPTION BY LGA AIR PASSENGERS .................. 8
FIGURE 4-1 LAGUARDIA AIRPORT PASSENGER SHARE BY TRIP ORIGIN/DESTINATION ......... 16
FIGURE 4-2 LAGUARDIA AIRPORT EMPLOYEE SHARE BY TRIP ORIGIN/DESTINATION ........... 16
FIGURE 4-3 LAGUARDIA AIRPORT GEOGRAPHIC MARKETS .................................................. 16
FIGURE 4-4 O&D SHARE OF BUSINESS AIR PASSENGERS FOR NY MAJOR AIRPORTS ............. 18
FIGURE 4-5 O&D SHARE OF AIR PASSENGERS TO MANHATTAN 14TH-96TH STREET FOR NY MAJOR AIRPORTS ................................................................................................. 18
FIGURE 4-6 COMPARISON OF OVERALL GENERALIZED COST BY AUTO AND TRANSIT WITH AIRTRAIN TO LGA, 2025 .......................................................................................... 23
FIGURE 5-1 ACCUMULATED EXPERIENCE OF AIRPORT MODELING TOOLS DEVELOPED FOR PANYNJ ..................................................................................................................... 24
FIGURE 5-2 COMPLETE SYSTEM WITH EQUILIBRATION ...................................................... 25
FIGURE 5-3 MAIN MODELING STEPS .................................................................................. 26
LGA Airport Access Improvement Project 1
EXECUTIVE SUMMARY
This report documents the methodology and results of the ridership forecasting process for the LaGuardia Airport (LGA) Access Improvement Project. Ridership forecasts were prepared for a new AirTrain system that would efficiently connect LGA with the regional transit system, specifically the Metropolitan Transportation Authority (MTA) Long Island Rail Road (LIRR) Port Washington Branch and the New York City Transit (NYCT) 7 Line subway at Willets Point (WP), where a station complex and parking facility for airport employees would be built.
In August 2017, a premier market research firm (Kantar TNS) conducted an on-airport survey of arriving and departing passengers at LGA on behalf of the Port Authority of New York and New Jersey (PANYNJ). Of the total respondents, 1,515 passengers answered questions regarding the use of a new AirTrain system, referred to as AirTrain LGA. The Passenger Preference Survey found that 38 percent of air passengers with an origin or destination in the LIRR service territory responded that they “would definitely switch” or were “likely to use” AirTrain LGA even at the highest fare level. For those in the service territory of the subway, 44 percent responded that they “would definitely switch” or were “likely to use” AirTrain LGA at the highest fare level. The responses received in the Passenger Preference Survey would equate to approximately 10 million AirTrain passengers in 2025 and 12 million passengers in 2045.
In addition to the survey, a LGA ground access mode choice model was developed to generate the AirTrain LGA ridership forecast for planning purposes, and to support the environmental review process. The model was developed using information from the Best Practice Model (BPM), which is the regional travel model of the New York Metropolitan Transportation Council (NYMTC) used by their Interagency Consultation Group (comprised of U.S. Environmental Protection Agency (USEPA), Federal Highway Administration (FHWA), U.S. Department of Transportation (USDOT), Federal Transit Administration (FTA), and New York State Department of Transportation (NYSDOT) representatives) for air quality conformity determinations and other transportation planning purposes in the region. The LGA ground access mode choice model covers the same geographic region as the BPM, adopts travel time inputs1 and traffic growth factors from BPM, and uses the same conventional mode choice modeling technique. During this analysis, MTA was consulted to refine the modeling assumptions for the public transportation system that is coded in the LGA ground access mode choice model. The LGA ground access mode choice model provides forecasts for different airport-related travel markets by trip purpose (business and personal trips) and residential status (New York region residents and visitors).
The LGA ground access mode choice model predicts about 6.6 million annual trips will be made on AirTrain LGA in the year 2025 (comprised of about 18,000 daily trips). In the year 2045, the model predicts that total annual trips on AirTrain LGA will be about 8.4 million (comprised of about 23,000 daily trips). The model estimates that AirTrain LGA would capture about 17 percent of the total air passenger market in 2025 and 18 percent in 2045. The modeled results can be considered conservative in light of the responses received for the Passenger Preference Survey questions obtained in 2017.
1 BPM travel times for trips to and from LGA were updated using highway travel times from the 2017 NYC Taxi and Limousine Commission GPS datasets.

2 LGA Airport Access Improvement Project
The results of the LGA ground access model and the Passenger Preference Survey indicate a projected range of approximately 6.6 to 10 million riders in 2025 (and approximately 8.4 to 12 million in 2045).
LGA Airport Access Improvement Project 3
INTRODUCTION
This report documents the methodology and results of the ridership forecasting process for the LaGuardia Airport (LGA) Airport Access Improvement Project. Ridership forecasts have been prepared for a new AirTrain system that would efficiently connect LGA with the regional transit system, specifically the Metropolitan Transportation Authority (MTA) Long Island Rail Road (LIRR) Port Washington Branch and the New York City Transit (NYCT) 7 Line subway at Willets Point (WP), where a station complex and parking facility for airport employees would be built.
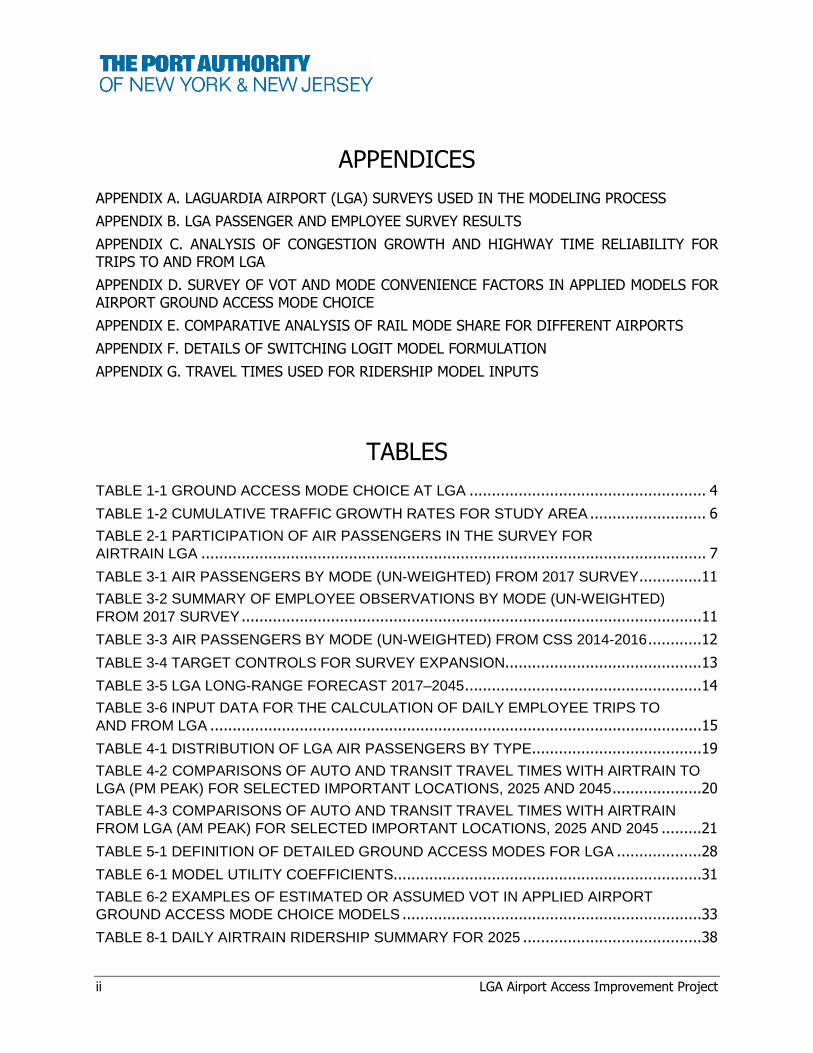
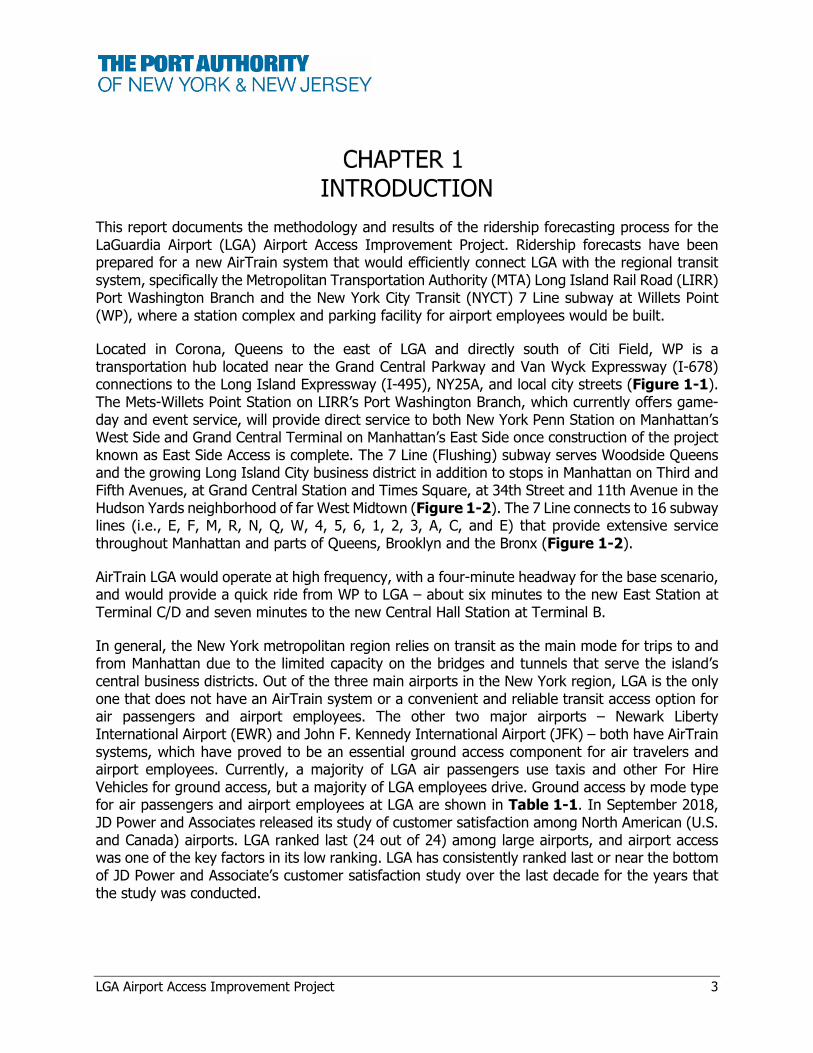
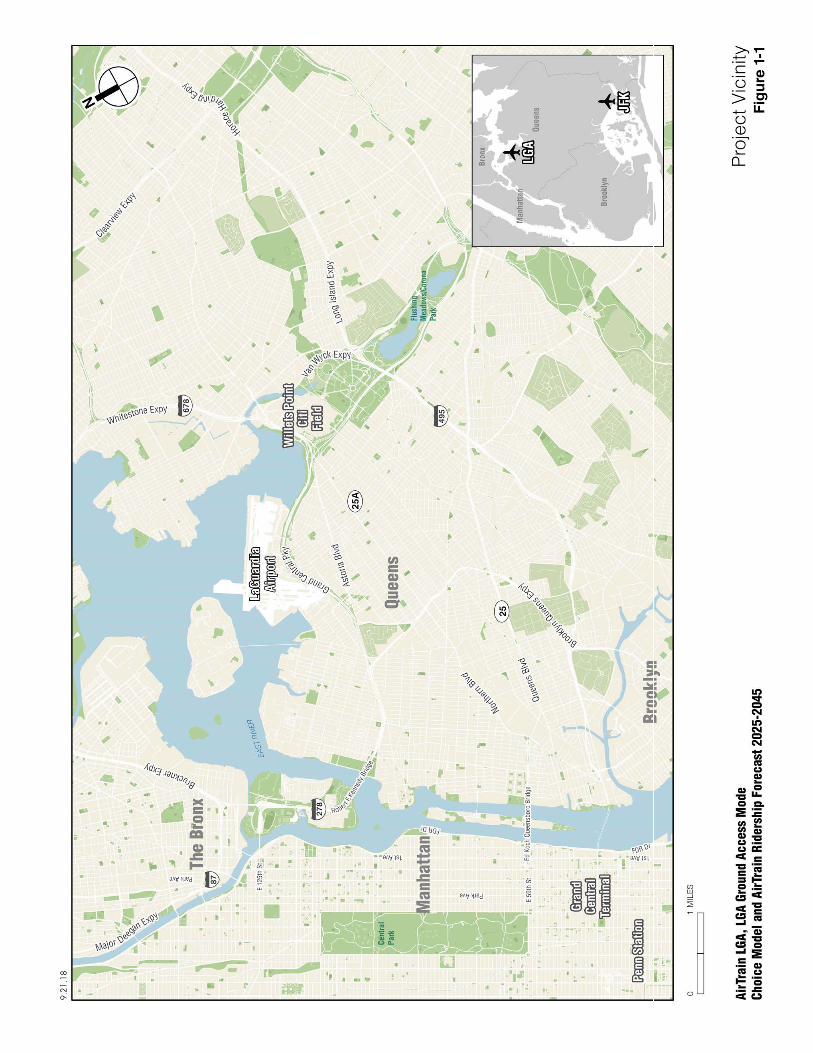
Located in Corona, Queens to the east of LGA and directly south of Citi Field, WP is a transportation hub located near the Grand Central Parkway and Van Wyck Expressway (I-678) connections to the Long Island Expressway (I-495), NY25A, and local city streets (Figure 1-1). The Mets-Willets Point Station on LIRR’s Port Washington Branch, which currently offers game-day and event service, will provide direct service to both New York Penn Station on Manhattan’s West Side and Grand Central Terminal on Manhattan’s East Side once construction of the project known as East Side Access is complete. The 7 Line (Flushing) subway serves Woodside Queens and the growing Long Island City business district in addition to stops in Manhattan on Third and Fifth Avenues, at Grand Central Station and Times Square, at 34th Street and 11th Avenue in the Hudson Yards neighborhood of far West Midtown (Figure 1-2). The 7 Line connects to 16 subway lines (i.e., E, F, M, R, N, Q, W, 4, 5, 6, 1, 2, 3, A, C, and E) that provide extensive service throughout Manhattan and parts of Queens, Brooklyn and the Bronx (Figure 1-2).
AirTrain LGA would operate at high frequency, with a four-minute headway for the base scenario, and would provide a quick ride from WP to LGA – about six minutes to the new East Station at Terminal C/D and seven minutes to the new Central Hall Station at Terminal B.
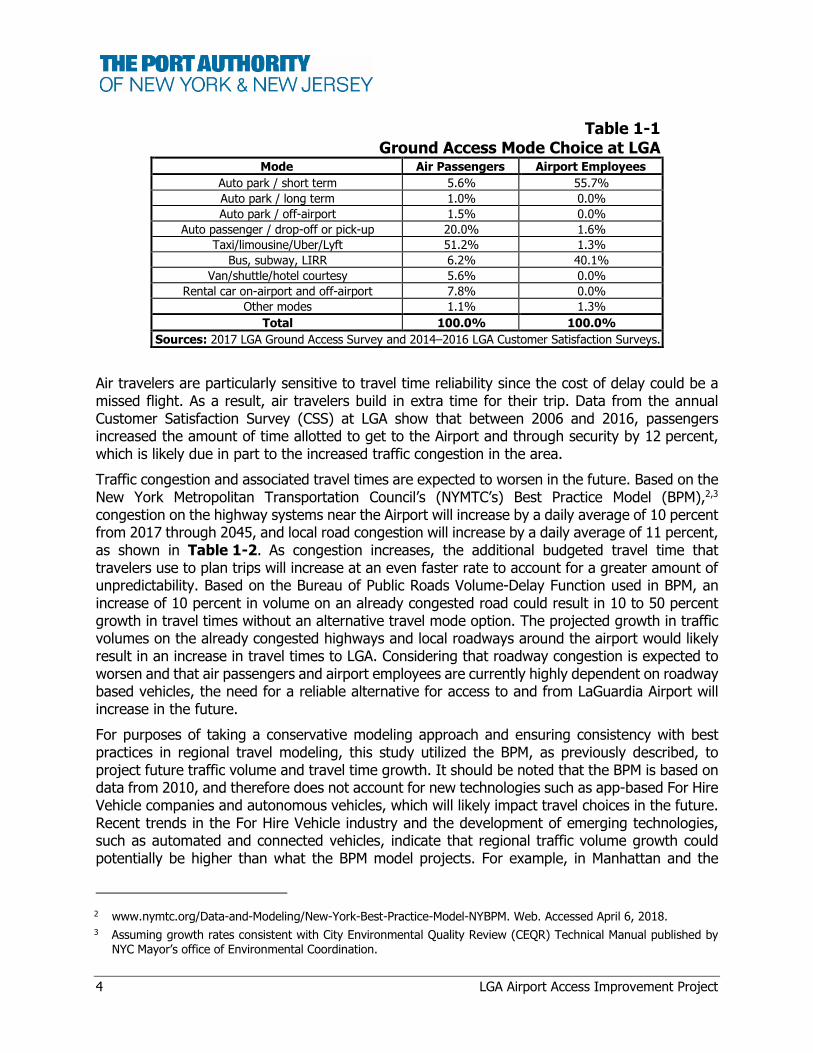
In general, the New York metropolitan region relies on transit as the main mode for trips to and from Manhattan due to the limited capacity on the bridges and tunnels that serve the island’s central business districts. Out of the three main airports in the New York region, LGA is the only one that does not have an AirTrain system or a convenient and reliable transit access option for air passengers and airport employees. The other two major airports – Newark Liberty International Airport (EWR) and John F. Kennedy International Airport (JFK) – both have AirTrain systems, which have proved to be an essential ground access component for air travelers and airport employees. Currently, a majority of LGA air passengers use taxis and other For Hire Vehicles for ground access, but a majority of LGA employees drive. Ground access by mode type for air passengers and airport employees at LGA are shown in Table 1-1. In September 2018, JD Power and Associates released its study of customer satisfaction among North American (U.S. and Canada) airports. LGA ranked last (24 out of 24) among large airports, and airport access was one of the key factors in its low ranking. LGA has consistently ranked last or near the bottom of JD Power and Associate’s customer satisfaction study over the last decade for the years that the study was conducted.

Fig
ure
1-2
AirT
rain
LGA
, LGA
Gro
und
Acce
ss M
ode
Ch
oice
Mod
el a
nd A
irTra
in R
ider
ship
For
ecas
t 202
5-20
45
9.21
.18
Publ
ic T
rans
it O
ptio
ns to
LaG
uard
ia A
irpor
t
Source: Metropolitan Transportation Authority http://web.mta.info/nyct/service/pdf/laguardia-November-2017.jpg Not
e: T
he lo
catio
ns o
f the
term
inal
s re
pres
ent t
he r
oute
that
bus
es ta
ke o
n-A
irpo
rt, w
hich
is to
st
op a
t Ter
min
al B
, Ter
min
al D
, and
Ter
min
al C
, res
pect
ivel
y. T
his
rout
ing
follo
ws
the
desi
gnof
the
Air
port
’s r
oadw
ay n
etw
ork
as s
how
n.
4 LGA Airport Access Improvement Project
Table 1-1Ground Access Mode Choice at LGA
Mode Air Passengers Airport Employees
Auto park / short term 5.6% 55.7%
Auto park / long term 1.0% 0.0%
Auto park / off-airport 1.5% 0.0%
Auto passenger / drop-off or pick-up 20.0% 1.6%
Taxi/limousine/Uber/Lyft 51.2% 1.3%
Bus, subway, LIRR 6.2% 40.1%
Van/shuttle/hotel courtesy 5.6% 0.0%
Rental car on-airport and off-airport 7.8% 0.0%
Other modes 1.1% 1.3%
Total 100.0% 100.0%
Sources: 2017 LGA Ground Access Survey and 2014–2016 LGA Customer Satisfaction Surveys.
Air travelers are particularly sensitive to travel time reliability since the cost of delay could be a missed flight. As a result, air travelers build in extra time for their trip. Data from the annual Customer Satisfaction Survey (CSS) at LGA show that between 2006 and 2016, passengers increased the amount of time allotted to get to the Airport and through security by 12 percent, which is likely due in part to the increased traffic congestion in the area.
Traffic congestion and associated travel times are expected to worsen in the future. Based on the New York Metropolitan Transportation Council’s (NYMTC’s) Best Practice Model (BPM),2,3
congestion on the highway systems near the Airport will increase by a daily average of 10 percent from 2017 through 2045, and local road congestion will increase by a daily average of 11 percent, as shown in Table 1-2. As congestion increases, the additional budgeted travel time that travelers use to plan trips will increase at an even faster rate to account for a greater amount of unpredictability. Based on the Bureau of Public Roads Volume-Delay Function used in BPM, an increase of 10 percent in volume on an already congested road could result in 10 to 50 percent growth in travel times without an alternative travel mode option. The projected growth in traffic volumes on the already congested highways and local roadways around the airport would likely result in an increase in travel times to LGA. Considering that roadway congestion is expected to worsen and that air passengers and airport employees are currently highly dependent on roadway based vehicles, the need for a reliable alternative for access to and from LaGuardia Airport will increase in the future.
For purposes of taking a conservative modeling approach and ensuring consistency with best practices in regional travel modeling, this study utilized the BPM, as previously described, to project future traffic volume and travel time growth. It should be noted that the BPM is based on data from 2010, and therefore does not account for new technologies such as app-based For Hire Vehicle companies and autonomous vehicles, which will likely impact travel choices in the future. Recent trends in the For Hire Vehicle industry and the development of emerging technologies, such as automated and connected vehicles, indicate that regional traffic volume growth could potentially be higher than what the BPM model projects. For example, in Manhattan and the
2 www.nymtc.org/Data-and-Modeling/New-York-Best-Practice-Model-NYBPM. Web. Accessed April 6, 2018. 3 Assuming growth rates consistent with City Environmental Quality Review (CEQR) Technical Manual published by
NYC Mayor’s office of Environmental Coordination.
LGA Airport Access Improvement Project 5
Brooklyn and Queens neighborhoods experiencing high population growth, traffic volumes have increased by 7 percent from 2013 to 2016 due in large part to the dramatic increase in the For Hire Vehicle market.4 This rapid growth has continued through 2017 and into the first third of 2018 and is well in excess of the less than one percent average annual growth assumed in the BPM model (as shown in Table 1-2).5
Furthermore, average traffic speeds in Midtown Manhattan, where over 26.3 percent of LGA passengers originate or terminate, decreased over a five-year period from 6.5 miles per hour (mph) in 2012 to 4.7 mph in 2017, which is a 28 percent decrease.6 Travel times have increased for the complete trip between Midtown Manhattan and LGA as follows:
For trips from Times Square to LGA from 2014–2017:7
The annual average travel time increased from 31 to 35 minutes.
The annual average daily maximum travel time (the longest single trip on any given day) increased from 47 to 54 minutes.
The number of extreme travel days (with at least one trip taking 70 minutes or more) increased from 4 to 17, more than four-fold.
For trips from LGA to Times Square from 2014–2017:
The annual average travel time increased from 36 to 43 minutes.
The annual average daily maximum travel time increased from 54 to 65 minutes.
The number of extreme travel days increased from 21 to 114, more than five-fold.
Such trends point toward significantly higher rates of traffic growth than the less than one percent average annual growth that the BPM model predicts. With autonomous vehicles, which are expected to be widely adopted by the 2040s, the greatest increase is expected to be in autonomous vehicle-taxis and autonomous For Hire Vehicles. Traffic volumes, as described above, have already increased significantly in just a few years with the growth of For Hire Vehicles; the emergence of autonomous For Hire Vehicles will likely continue that trend. Most studies on the future impacts of autonomous vehicles show a projected increase in Vehicle Miles Traveled (VMT).8
Traffic experts believe that highways will move more vehicles per hour but not necessarily more people since some of the vehicles will have no passengers on their way to a pick up or wait area. However, on city streets, such as Midtown Manhattan, capacity may very well decrease as autonomous vehicles mix with large numbers of pedestrians and bicycle riders. This could be aggravated by the increased vehicular capacity of highways as they discharge more traffic, more
4 Schaller Consulting. Unsustainable? The Growth of App-Based Ride Services and Traffic, Travel and the Future of New York City. February 27, 2017.
5 NYC Taxi and Limousine Commission. 2017 and 2018. 6 The New York Times. De Blasio’s Five-Point Plan Aims to Reduce Traffic Congestion. Quote in article from NYC
Department of Transportation Commissioner, Polly Trottenberg. October 22, 2017. Accessed April 5, 2018. 7 NYC Taxi and Limousine Commission. Taxi GPS Datasets. 2017. Data cleaned to remove any days during which on-
airport traffic conditions led to delays on the off-airport roadway network. 8 Public Square: A CNU Journal. Autonomous Vehicles: Hype and Potential. Peter Calthorpe and Jerry Walters.
September 6, 2016. Accessed May 14, 2018.
6 LGA Airport Access Improvement Project
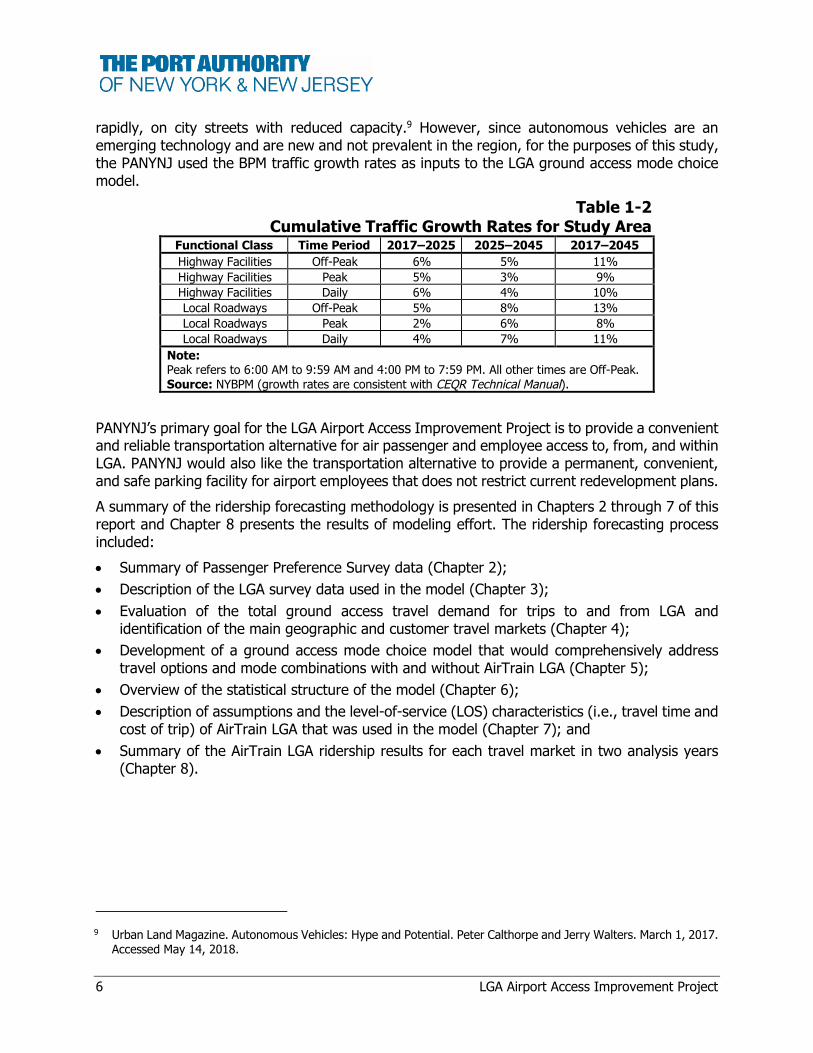
rapidly, on city streets with reduced capacity.9 However, since autonomous vehicles are an emerging technology and are new and not prevalent in the region, for the purposes of this study, the PANYNJ used the BPM traffic growth rates as inputs to the LGA ground access mode choice model.
Table 1-2Cumulative Traffic Growth Rates for Study Area
Functional Class Time Period 2017–2025 2025–2045 2017–2045
Highway Facilities Off-Peak 6% 5% 11%
Highway Facilities Peak 5% 3% 9%
Highway Facilities Daily 6% 4% 10%
Local Roadways Off-Peak 5% 8% 13%
Local Roadways Peak 2% 6% 8%
Local Roadways Daily 4% 7% 11%
Note:Peak refers to 6:00 AM to 9:59 AM and 4:00 PM to 7:59 PM. All other times are Off-Peak. Source: NYBPM (growth rates are consistent with CEQR Technical Manual).
PANYNJ’s primary goal for the LGA Airport Access Improvement Project is to provide a convenient and reliable transportation alternative for air passenger and employee access to, from, and within LGA. PANYNJ would also like the transportation alternative to provide a permanent, convenient, and safe parking facility for airport employees that does not restrict current redevelopment plans.
A summary of the ridership forecasting methodology is presented in Chapters 2 through 7 of this report and Chapter 8 presents the results of modeling effort. The ridership forecasting process included:
Summary of Passenger Preference Survey data (Chapter 2);
Description of the LGA survey data used in the model (Chapter 3);
Evaluation of the total ground access travel demand for trips to and from LGA and identification of the main geographic and customer travel markets (Chapter 4);
Development of a ground access mode choice model that would comprehensively address travel options and mode combinations with and without AirTrain LGA (Chapter 5);
Overview of the statistical structure of the model (Chapter 6);
Description of assumptions and the level-of-service (LOS) characteristics (i.e., travel time and cost of trip) of AirTrain LGA that was used in the model (Chapter 7); and
Summary of the AirTrain LGA ridership results for each travel market in two analysis years (Chapter 8).
9 Urban Land Magazine. Autonomous Vehicles: Hype and Potential. Peter Calthorpe and Jerry Walters. March 1, 2017. Accessed May 14, 2018.
LGA Airport Access Improvement Project 7
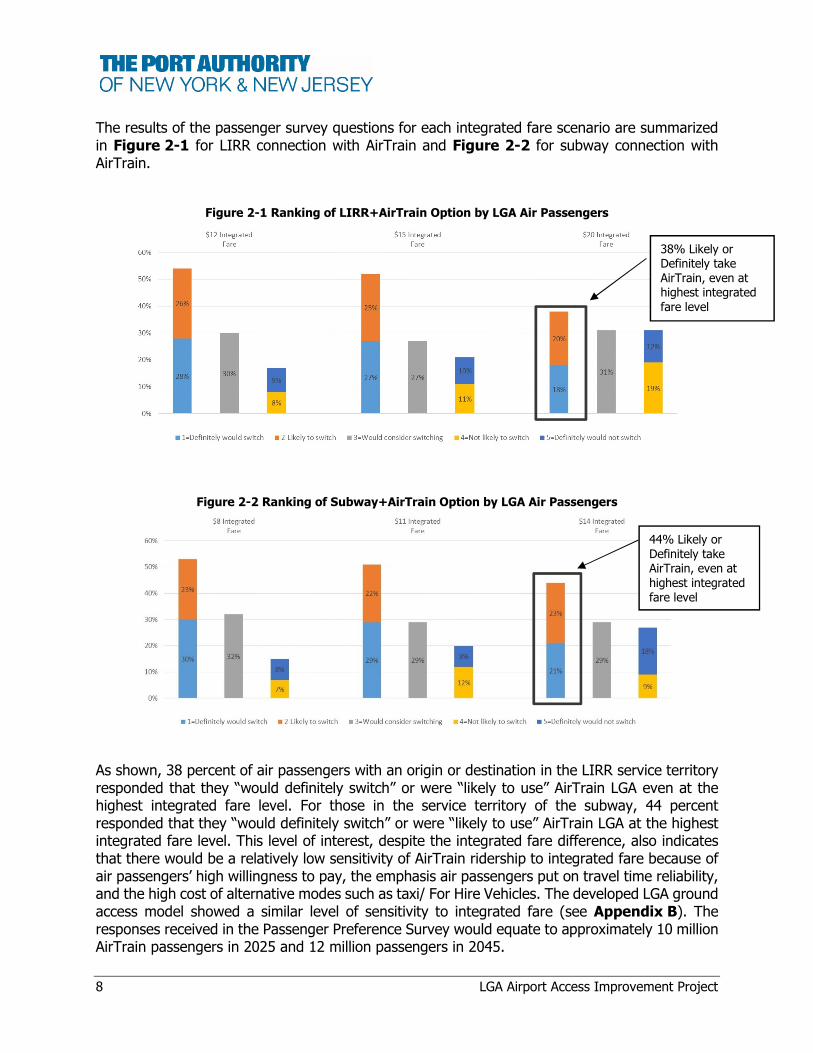
PASSENGER PREFERENCE SURVEY
This chapter highlights the results of a Passenger Preference Survey that was administered to gauge the likely future use of AirTrain LGA by air passengers. A premier market research firm (Kantar TNS) conducted an on-airport survey of arriving and departing passengers at LGA on behalf of PANYNJ in August 2017. The in-person interviews included future travel choices if AirTrain LGA service was provided between WP (with connection to the subway and LIRR) and LGA terminals. Airport passenger responses were recorded on tablet devices by trained surveyors and data results were prepared by Kantar TNS. The Passenger Preference Survey was administered with the LGA Ground Access Survey, which included questions about the current trip to and from LGA, as further described in Chapter 3 and Appendix A. The Passenger Preference Survey was administered only to those air passengers whose origin or destination was reported to be in the service territory of LIRR or the subway. An LGA Airport Employee Survey was also administered, which included questions about employees’ typical commute and likely future use of AirTrain LGA. All 2017 survey questionnaires are presented in Appendix A. The results of the 2017 surveys are described in Appendix B and summarized below.
The Passenger Preference Survey questions asked respondents to rank the likelihood of using a new AirTrain ground access option that was connected to the LIRR and the 7 Line subway assuming low, medium, and high integrated fare scenarios. Both departing and arriving passengers expressed a high level of interest in using the future system in combination with both LIRR and subway service (Table 2-1).
Table 2-1Participation of Air Passengers in the Survey for AirTrain LGA
Number of Survey Respondent by Category Departing PassengersArriving
Passengers Total
Total number of survey respondents 1,891 482 2,373
Participants in the Passenger Preference Survey 1,038 477 1,515
Total participants in LIRR+AirTrain evaluation 636 477 1,113
Total participants in Subway+AirTrain evaluation 885 474 1,359
The respondents were presented a new option with AirTrain at three different levels of integrated fares (AirTrain fare plus connecting mode, LIRR or subway) in one direction. LIRR connection with AirTrain was presented with a $15 integrated fare as the base, $12 as the low-fare scenario, and $20 as the high-fare scenario. Subway connection with AirTrain was presented as an $11 integrated fare as the base, $8 as the low-fare scenario, and $14 as the high-fare scenario. The respondents were asked to rate their likelihood to switch to the new relevant option:
1 = definitely would use,
2 = likely to use,
3 = would consider,
4 = not likely to use, and
5 = definitely would not use.
8 LGA Airport Access Improvement Project
The results of the passenger survey questions for each integrated fare scenario are summarized in Figure 2-1 for LIRR connection with AirTrain and Figure 2-2 for subway connection with AirTrain.
Figure 2-1 Ranking of LIRR+AirTrain Option by LGA Air Passengers
Figure 2-2 Ranking of Subway+AirTrain Option by LGA Air Passengers
As shown, 38 percent of air passengers with an origin or destination in the LIRR service territory responded that they “would definitely switch” or were “likely to use” AirTrain LGA even at the highest integrated fare level. For those in the service territory of the subway, 44 percent responded that they “would definitely switch” or were “likely to use” AirTrain LGA at the highest integrated fare level. This level of interest, despite the integrated fare difference, also indicates that there would be a relatively low sensitivity of AirTrain ridership to integrated fare because of air passengers’ high willingness to pay, the emphasis air passengers put on travel time reliability, and the high cost of alternative modes such as taxi/ For Hire Vehicles. The developed LGA ground access model showed a similar level of sensitivity to integrated fare (see Appendix B). The responses received in the Passenger Preference Survey would equate to approximately 10 million AirTrain passengers in 2025 and 12 million passengers in 2045.
44% Likely or Definitely take AirTrain, even at highest integrated fare level
38% Likely or Definitely take AirTrain, even at highest integrated fare level
LGA Airport Access Improvement Project 9
MODEL DATABASE CONSTRUCTION AND INPUTS
The primary sources for the modeling effort were the LGA Ground Access Survey conducted in 2017 and the CSS (2014–2016). Secondary data sources (e.g., total number of passengers, number of employees, bus ridership information, ground transportation reservations, taxi dispatched) were used to expand the survey data. The Passenger Preference Survey results, which are summarized in Chapter 2 and presented in Appendix B, were not used directly as inputs to the LGA Ground Access Mode Choice Model but were used to understand the potential demand for AirTrain LGA service and model elasticity with respect to fare.
3.1 ORIGIN, DESTINATION, AND DEMOGRAPHIC DATA
3.1.1 LGA GROUND ACCESS SURVEY RESULTS
The LGA Ground Access Survey conducted at LGA for both air passengers and employees in August 2017, included questions about the trip to or from LGA for air passengers and usual work trip information for employees (see Appendix A). The survey collected trip information from the following:
1,891 departing passengers interviewed at the gate with the survey programmed on a tablet,
482 arrival passengers interviewed at baggage claim areas, taxi lines, and bus stops with the paper survey, and
824 employees interviewed at ID badging office, Hangar 7, and Delta terminal with the survey programmed on tablets.
The data was compiled and processed. Trip origin and destinations outside LGA were initially geocoded to the zip code level. To further augment the data, each air passenger record was duplicated assuming symmetry of mode used to arrive at the airport and depart from the airport and the direction of the observed trip was reversed to create the reverse trip. For example, each departing passenger provided an observed trip to LGA and therefore, a corresponding trip from LGA was created to complete a “round trip” for the model. Similarly, this was also done for the arriving passengers surveyed. This approach balanced the total daily trips to and from the airport. Likewise, every employee record generated two commute trips. For use in the model, the individual survey records were weighted to account for people traveling to and from LGA together sharing the same access mode and a number of other parameters (see Appendix A).
This survey resulted in 2,207 records in the model database. Taking into account the average travel party size of 1.7, this survey represented more than 3,700 passengers, which is more than five percent of the 68,900 total daily passengers arriving or departing LGA on a daily basis. As indicated in Appendix A, the model was built on a combined database that also included the
10 LGA Airport Access Improvement Project
Customer Satisfaction Surveys (CSS) for three years 2014, 2015, 2016. The combined dataset represents more than 15,000 passengers or more than 20 percent of the daily total.10
The departing passenger questionnaire included the following:
34 total questions (with subparts)
Mode of transportation to LGA (today) – How do people travel to and from the airport?
Flight details – Where are departing passengers flying to?
Personal information (residence, gender, age, income)
Preference for theoretical rail service to LGA with an AirTrain option
Airport access trip attributes and convenience factors
The arriving passenger questionnaire included the following:
29 total questions (with subparts)
Mode of transportation to LGA (today)
Flight details
Personal information (residence, gender, age, income)
Preference for theoretical rail service to LGA with an AirTrain option
The employee survey, which was administered at ID badging office, Hangar 7 and the Delta Terminal, included the following:
29 total questions (with subparts)
Employment information
Commute details
Personal information (residence, gender, age, income)
Preference for theoretical rail service to LGA with an AirTrain option
Airport access trip attributes and convenience factors
The main purpose of the LGA Ground Access Survey was to obtain detailed and unbiased information about the current trip to/from the airport for air passengers and airport employees. The survey questionnaire was built upon the questionnaire used in the CSS, with additional questions that are important for mode choice modeling. The survey included consideration of more than 20 access mode combinations pertinent to LGA. The survey questionnaire was based on review of other airport surveys and surveys used to develop forecasting models, and represents best practices in the profession.
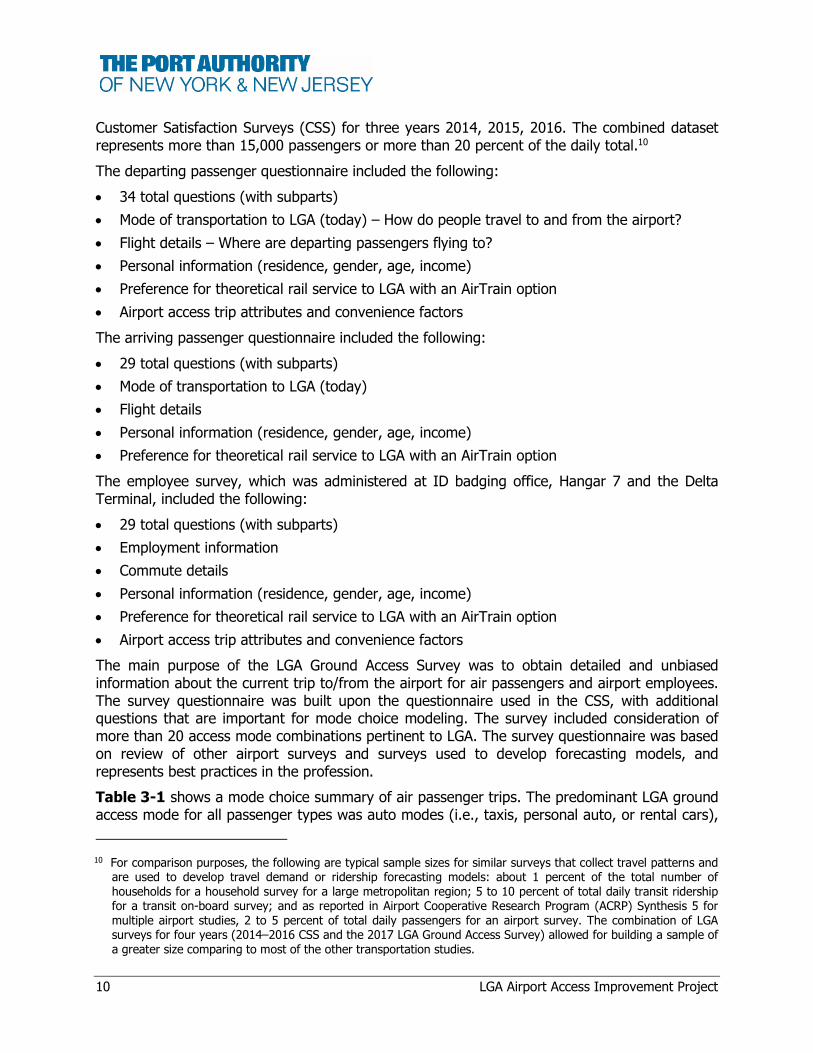
Table 3-1 shows a mode choice summary of air passenger trips. The predominant LGA ground access mode for all passenger types was auto modes (i.e., taxis, personal auto, or rental cars),
10 For comparison purposes, the following are typical sample sizes for similar surveys that collect travel patterns and are used to develop travel demand or ridership forecasting models: about 1 percent of the total number of households for a household survey for a large metropolitan region; 5 to 10 percent of total daily transit ridership for a transit on-board survey; and as reported in Airport Cooperative Research Program (ACRP) Synthesis 5 for multiple airport studies, 2 to 5 percent of total daily passengers for an airport survey. The combination of LGA surveys for four years (2014–2016 CSS and the 2017 LGA Ground Access Survey) allowed for building a sample of a greater size comparing to most of the other transportation studies.

LGA Airport Access Improvement Project 11
which accounted for almost 85 percent of the trips by all air passengers. The remaining 15 percent of the trips were split between shared ride/hotel courtesy services and transit.
Table 3-1Air Passengers by Mode (Un-Weighted) from 2017 Survey
Mode
Air Passengers
Resident Visitor
Total Total % Business Non-Business Business Non-Business
Auto Drop-off 37 344 56 377 814 21.2%
Auto Short-Term Park 15 78 4 27 124 3.2%
Auto Long-Term Park 0 12 0 0 12 0.3%
Off-Airport Park 8 29 0 0 37 1.0%
Rental Car – At Airport 0 0 19 58 78 2.0%
Rental Car – Off Airport 0 0 20 123 143 3.7%
Taxis/FHWs 118 467 331 1,129 2,045 53.4%
Hotel Courtesy Vehicle 0 8 16 37 61 1.6%
Shared Ride Van/Shuttle 1 13 11 88 113 2.9%
NYC Airporter 7 41 12 76 136 3.5%
Bus 5 40 8 65 117 3.0%
Subway + Bus 5 31 8 81 124 3.2%
Rail + Bus/Taxi 0 4 5 20 29 0.7%
Total 196 1,065 490 2,081 3,832 100.0%
Source: 2017 LGA Ground Access Survey.
For employees, nearly 66 percent of the trips were by auto modes, 33 percent by transit and 1 percent by non-motorized modes (Table 3-2).
Table 3-2Summary of Employee Observations by Mode (Un-Weighted) from
2017 Survey
Modes
Employees
Total %
Auto – Park at Employee/P10 Lot 466 51.3%
Auto – Park Elsewhere 121 13.3%
Taxi 9 1.0%
NYC Airporter 3 0.3%
Bus 154 17.0%
Subway + Bus 137 15.0%
Rail + Bus/Taxi 10 1.0%
Non-motorized 9 1.0%
Total 908 100%
Source: 2017 LGA Ground Access Survey.
3.1.2 CUSTOMER SATISFACTION SURVEY (CSS) 2014–2016
Since the 2017 LGA Ground Access Survey had a limited number of records, the data for air passengers was enriched with information from the CSS. Similar data cleaning and processing steps were applied to the CSS as for the 2017 LGA Ground Access Survey. The CSS does not include an employee survey. However, this survey provided many additional records for air passengers. Specifically, the additional origins and destinations of trips reported in the CSS
12 LGA Airport Access Improvement Project
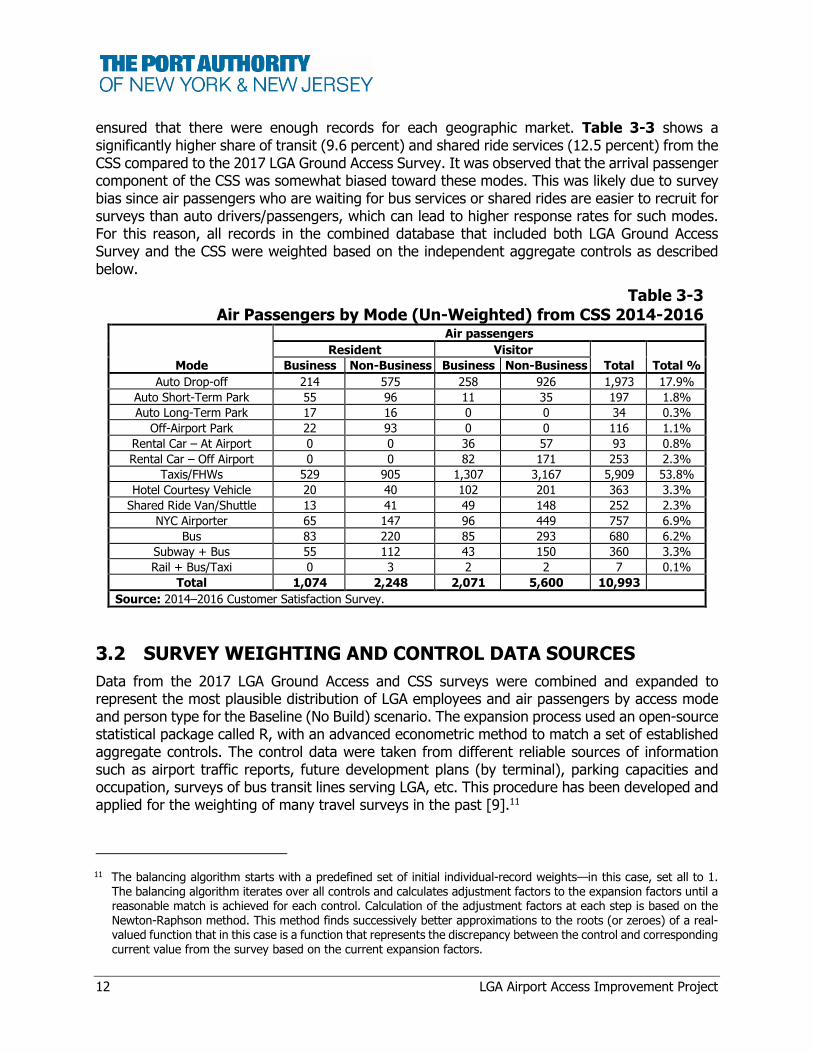
ensured that there were enough records for each geographic market. Table 3-3 shows a significantly higher share of transit (9.6 percent) and shared ride services (12.5 percent) from the CSS compared to the 2017 LGA Ground Access Survey. It was observed that the arrival passenger component of the CSS was somewhat biased toward these modes. This was likely due to survey bias since air passengers who are waiting for bus services or shared rides are easier to recruit for surveys than auto drivers/passengers, which can lead to higher response rates for such modes. For this reason, all records in the combined database that included both LGA Ground Access Survey and the CSS were weighted based on the independent aggregate controls as described below.
Table 3-3Air Passengers by Mode (Un-Weighted) from CSS 2014-2016
Mode
Air passengers
Resident Visitor
Total Total %Business Non-Business Business Non-Business
Auto Drop-off 214 575 258 926 1,973 17.9%
Auto Short-Term Park 55 96 11 35 197 1.8%
Auto Long-Term Park 17 16 0 0 34 0.3%
Off-Airport Park 22 93 0 0 116 1.1%
Rental Car – At Airport 0 0 36 57 93 0.8%
Rental Car – Off Airport 0 0 82 171 253 2.3%
Taxis/FHWs 529 905 1,307 3,167 5,909 53.8%
Hotel Courtesy Vehicle 20 40 102 201 363 3.3%
Shared Ride Van/Shuttle 13 41 49 148 252 2.3%
NYC Airporter 65 147 96 449 757 6.9%
Bus 83 220 85 293 680 6.2%
Subway + Bus 55 112 43 150 360 3.3%
Rail + Bus/Taxi 0 3 2 2 7 0.1%
Total 1,074 2,248 2,071 5,600 10,993
Source: 2014–2016 Customer Satisfaction Survey.
3.2 SURVEY WEIGHTING AND CONTROL DATA SOURCES
Data from the 2017 LGA Ground Access and CSS surveys were combined and expanded to represent the most plausible distribution of LGA employees and air passengers by access mode and person type for the Baseline (No Build) scenario. The expansion process used an open-source statistical package called R, with an advanced econometric method to match a set of established aggregate controls. The control data were taken from different reliable sources of information such as airport traffic reports, future development plans (by terminal), parking capacities and occupation, surveys of bus transit lines serving LGA, etc. This procedure has been developed and applied for the weighting of many travel surveys in the past [9].11
11 The balancing algorithm starts with a predefined set of initial individual-record weights—in this case, set all to 1. The balancing algorithm iterates over all controls and calculates adjustment factors to the expansion factors until a reasonable match is achieved for each control. Calculation of the adjustment factors at each step is based on the Newton-Raphson method. This method finds successively better approximations to the roots (or zeroes) of a real-valued function that in this case is a function that represents the discrepancy between the control and corresponding current value from the survey based on the current expansion factors.
LGA Airport Access Improvement Project 13
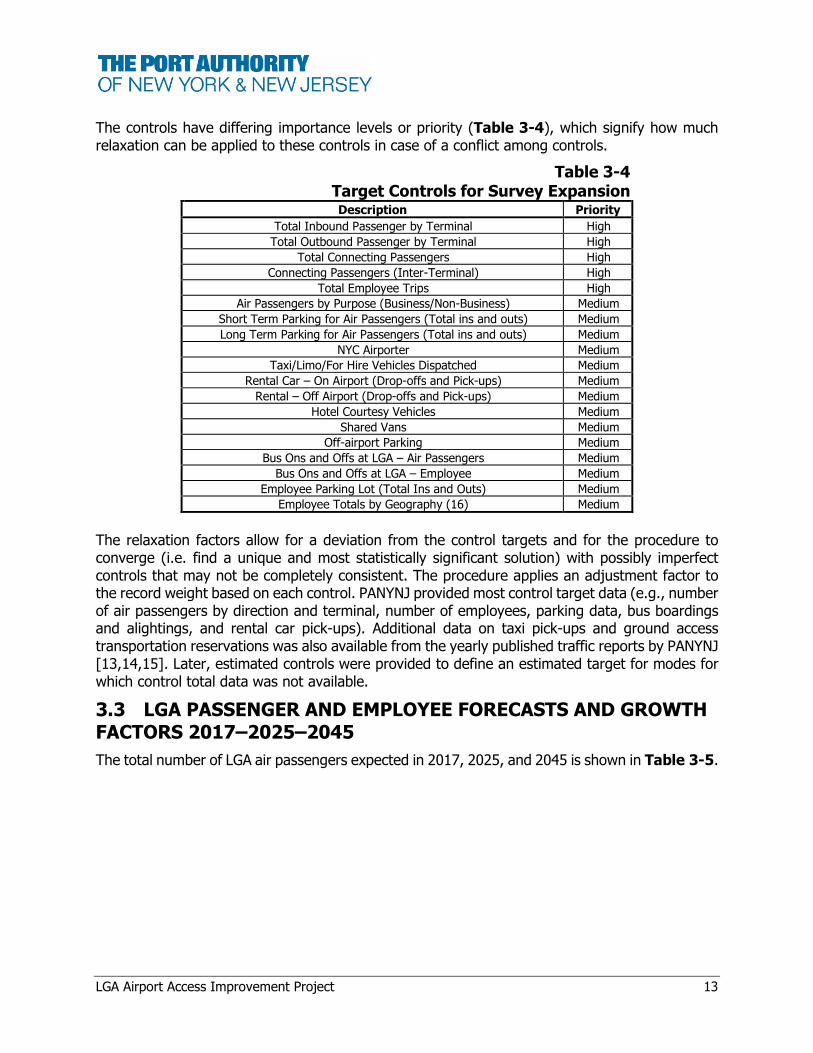
The controls have differing importance levels or priority (Table 3-4), which signify how much relaxation can be applied to these controls in case of a conflict among controls.
Table 3-4Target Controls for Survey ExpansionDescription Priority
Total Inbound Passenger by Terminal High
Total Outbound Passenger by Terminal High
Total Connecting Passengers High
Connecting Passengers (Inter-Terminal) High
Total Employee Trips High
Air Passengers by Purpose (Business/Non-Business) Medium
Short Term Parking for Air Passengers (Total ins and outs) Medium
Long Term Parking for Air Passengers (Total ins and outs) Medium
NYC Airporter Medium
Taxi/Limo/For Hire Vehicles Dispatched Medium
Rental Car – On Airport (Drop-offs and Pick-ups) Medium
Rental – Off Airport (Drop-offs and Pick-ups) Medium
Hotel Courtesy Vehicles Medium
Shared Vans Medium
Off-airport Parking Medium
Bus Ons and Offs at LGA – Air Passengers Medium
Bus Ons and Offs at LGA – Employee Medium
Employee Parking Lot (Total Ins and Outs) Medium
Employee Totals by Geography (16) Medium
The relaxation factors allow for a deviation from the control targets and for the procedure to converge (i.e. find a unique and most statistically significant solution) with possibly imperfect controls that may not be completely consistent. The procedure applies an adjustment factor to the record weight based on each control. PANYNJ provided most control target data (e.g., number of air passengers by direction and terminal, number of employees, parking data, bus boardings and alightings, and rental car pick-ups). Additional data on taxi pick-ups and ground access transportation reservations was also available from the yearly published traffic reports by PANYNJ [13,14,15]. Later, estimated controls were provided to define an estimated target for modes for which control total data was not available.
3.3 LGA PASSENGER AND EMPLOYEE FORECASTS AND GROWTH FACTORS 2017–2025–2045
The total number of LGA air passengers expected in 2017, 2025, and 2045 is shown in Table 3-5.

14 LGA Airport Access Improvement Project
Table 3-5LGA Long-Range Forecast 2017–2045
LAGUARDIA AIRPORT PASSENGERS (000'S)Base Case
YEAR DOMESTIC INTERNAT'L TOTAL
2017 27,461 2,107 29,568
2018 27,681 2,276 29,957
2019 27,957 2,367 30,323
2020 28,400 2,572 30,972
2021 28,664 2,809 31,473
2022 28,939 3,034 31,973
2023 29,215 3,211 32,426
2024 29,494 3,385 32,879
2025 29,714 3,521 33,234
2026 29,935 3,610 33,545
2027 30,214 3,713 33,927
2028 30,456 3,795 34,251
2029 30,712 3,870 34,581
2030 31,003 3,946 34,949
2031 31,329 4,022 35,351
2032 31,623 4,099 35,722
2033 31,931 4,176 36,107
2034 32,255 4,253 36,508
2035 32,581 4,329 36,910
2036 32,942 4,406 37,348
2037 33,302 4,484 37,786
2038 33,659 4,562 38,220
2039 34,015 4,633 38,648
2040 34,127 4,686 38,813
2041 34,351 4,792 39,144
2042 34,577 4,901 39,478
2043 34,804 5,013 39,817
2044 35,033 5,127 40,160
2045 35,263 5,244 40,507
The total number of employees expected in 2017, 2025, and 2045 was derived from the growth rates of LGA passenger forecasts for the period between 2016 and 2045. As a first step, the number of employees for 2016 was obtained from PANYNJ’s Air Traffic Report (12,341 employees). It was then scaled to 12,278 for 2017 based on the expected change in enplanements between those two years.12 Due to productivity increases, technological advances, and other factors, it was assumed that employment growth at the airport would be only about 70 percent of air passenger growth. Since the growth in air passengers is expected to be 12.4 percent between 2017 and 2025, the growth in the number of employees is expected to be 8.6 percent. This 8.6 percent growth rate was applied to the 2017 employee number (12,278 employees), resulting in 13,343 employees in 2025. The same method results in 15,457 employees for 2045 where the air passenger growth between 2017 and 2045 is assumed to be 37.0 percent and the corresponding employee growth is estimated at 25.9 percent.
12 A forecast was used for 2017 employees and employee trips since actual numbers for 2017 were not available at the time the projections were generated (October 2017).
LGA Airport Access Improvement Project 15
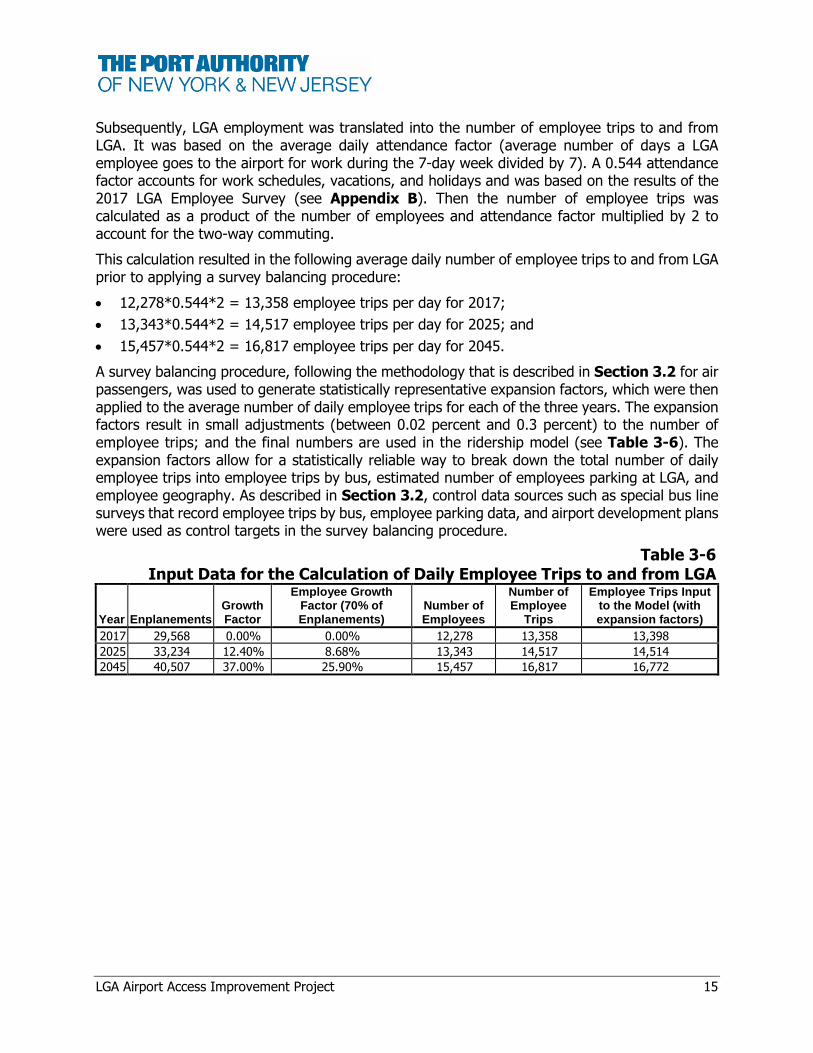
Subsequently, LGA employment was translated into the number of employee trips to and from LGA. It was based on the average daily attendance factor (average number of days a LGA employee goes to the airport for work during the 7-day week divided by 7). A 0.544 attendance factor accounts for work schedules, vacations, and holidays and was based on the results of the 2017 LGA Employee Survey (see Appendix B). Then the number of employee trips was calculated as a product of the number of employees and attendance factor multiplied by 2 to account for the two-way commuting.
This calculation resulted in the following average daily number of employee trips to and from LGA prior to applying a survey balancing procedure:
12,278*0.544*2 = 13,358 employee trips per day for 2017;
13,343*0.544*2 = 14,517 employee trips per day for 2025; and
15,457*0.544*2 = 16,817 employee trips per day for 2045.
A survey balancing procedure, following the methodology that is described in Section 3.2 for air passengers, was used to generate statistically representative expansion factors, which were then applied to the average number of daily employee trips for each of the three years. The expansion factors result in small adjustments (between 0.02 percent and 0.3 percent) to the number of employee trips; and the final numbers are used in the ridership model (see Table 3-6). The expansion factors allow for a statistically reliable way to break down the total number of daily employee trips into employee trips by bus, estimated number of employees parking at LGA, and employee geography. As described in Section 3.2, control data sources such as special bus line surveys that record employee trips by bus, employee parking data, and airport development plans were used as control targets in the survey balancing procedure.
Table 3-6Input Data for the Calculation of Daily Employee Trips to and from LGA
Year EnplanementsGrowth Factor
Employee Growth Factor (70% of Enplanements)
Number of Employees
Number of Employee
Trips
Employee Trips Input to the Model (with expansion factors)
2017 29,568 0.00% 0.00% 12,278 13,358 13,398
2025 33,234 12.40% 8.68% 13,343 14,517 14,514
2045 40,507 37.00% 25.90% 15,457 16,817 16,772

16 LGA Airport Access Improvement Project
MODEL ANALYSIS FOR AIRTRAIN LGA
4.1 GEOGRAPHIC MARKETS OF AIR PASSENGERS AND EMPLOYEES
At the outset of the ridership forecasting process, geographic markets were identified to create a template for use in the LGA ground access mode choice model and to provide a framework for understanding the model’s results. As further described in subsequent sections of this report, development of the LGA model was informed by NYMTC’s BPM (see Chapter 5), the 2017 LGA Ground Access Survey, the CSS (2014–2016), and supplemental data (see Chapter 3). The geographic markets were defined using data from the surveys and BPM (e.g., travel time for highway and transit trips to LGA) and identifying where air traveler and airport employee trips originate in relation to the modes of travel that are available in those locations.
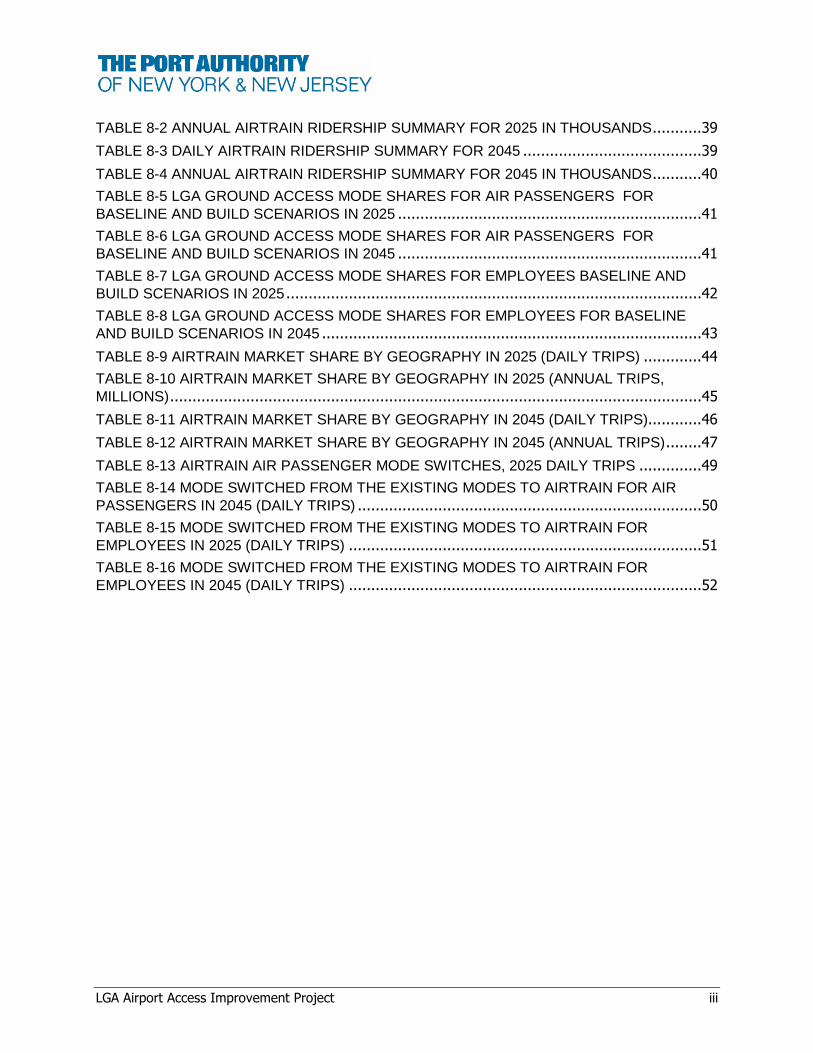
The New York metropolitan region has three major airports—JFK, LGA, and EWR—and another six local airports with partially overlapping catchment areas. LGA is characterized by its unique proximity to Midtown Manhattan and by its location between the high-density urbanized areas of Queens, Brooklyn, and the Bronx. Figure 4-1 presents the existing spatial distribution of LGA air passengers based on survey data. Overall LGA attracts air passengers from across the New York metropolitan region, however, the major markets in Manhattan, Queens, Brooklyn, the Bronx, and Upstate New York rely greatly on LGA as the closest and most accessible major airport. LGA employees are less geographically dispersed compared to air passengers (Figure 4-2). The main concentration of employees is in Queens, Brooklyn, and the Bronx, and a substantial share is from Long Island.
Portions of Midtown Manhattan within walking distance of 0.5 miles to the LIRR or the 7 Line subway stations represent the largest potential AirTrain LGA market—with 18 percent of LGA Origin and Destination (O&D) air passengers. Employees from Queens and Brooklyn are most likely to use the AirTrain LGA since they can choose between a subway connection or driving and parking at WP. Additionally, employees from Long Island could use the AirTrain LGA by connecting with the LIRR or driving and parking at WP. For employees from the Bronx, there is no convenient transit access to WP, and driving to LGA is an easier option.
Willets Point (WP) represents a hub of the major highways, including the Grand Central Parkway, Van Wyck Expressway, and Long Island Expressway, which makes LGA accessible to air passengers and employees from Long Island. The major highways as well as transit access lines to WP define the major potential spatial markets and directions from where the air passengers and employees could travel to and from LGA. Given these factors and based on the locations of existing LGA users known from the recent LGA surveys, the geographic markets shown in Figure 4-3 and described below were identified:

New Jersey
New York
LongIsland7.2%
NJ & PA3.7%
The Bronx5.6%
ManhattanNorth4.8%
Queens Northwest1.3%
Queens WWalking Access
2.0%
QueensW Other
0.7%
BrooklynEast1.9%Brooklyn
West8.5%
Queens EOther6.1%
StatenIsland1.0%
Manhattan –Upper East/West
8.6%
MidtownWalking Access18.0%
MidtownOther8.3%
ManhattanLower8.9% Queens E Walking
Access1.5%
LGA
GrandCentralTerminal
Penn Station
9.21
.18
LaGuardia Airport Passenger Shareby Trip Origin/Destination
Figure 4-1AirTrain LGA, LGA Ground Access ModeChoice Model and AirTrain Ridership Forecast 2025-2045
0 4 MILESPassenger Share, by Percentage
< 1.5%
1.5% - 4%
4% - 8%
8% - 12%
18%
Por
t A
utho
rity
LG
A G
roun
d A
cces
s S
urve
y 20
17, w
eigh
ted
usin
g C
usto
mer
Sat
isfa
ctio
n S
urve
y da
ta f
rom
201
4-20
16.

New Jersey
New York
LongIsland14.3%
NJ & PA3.6%
The Bronx11.6%
ManhattanNorth4.4%
Queens Northwest8.2%
QueensW Walking Access
8.3%
QueensW Other
2.2%
BrooklynEast6.5%Brooklyn
West6.5%
Queens EOther18.8%
StatenIsland0.9%
Manhattan –Upper East/West
0.4%
MidtownWalking Access0.3%
Midtown Other0.1%
ManhattanLower0.9% Queens E Walking
Access9.7%
LGA
GrandCentralTerminal
Penn Station Willets Point
LaGuardia Airport Employee Share by Trip Origin/Destination
Figure 4-2AirTrain LGA, LGA Ground Access ModeChoice Model and AirTrain Ridership Forecast 2025-2045
0 4 MILES
Por
t A
utho
rity
LG
A G
roun
d A
cces
s S
urve
y 20
17, w
eigh
ted
usin
g C
usto
mer
Sat
isfa
ctio
n S
urve
y da
ta f
rom
201
4-20
16.
9.21
.18
Employee Share, by Percentage
< 1.5%
1.5% - 4%
4% - 8%
8% - 12%
12% - 19%

LaG
uard
ia A
irp
ort
Geog
rap
hic
Mark
ets
Fig
ure
4-3
Air
Trai
n LG
A,
LGA
Gro
und
Acc
ess
Mod
eC
hoic
e M
odel
and
Air
Trai
n R
ider
ship
For
ecas
t 20
25-2
045
New
Jer
sey
New
Yor
k
The
Bro
nxM
anha
ttan
Nor
th
Que
ens
Nor
thw
est
Que
ens
Wes
t W
alki
ng A
cces
s
Que
ens
Wes
tO
ther
Bro
okly
n Ea
st
Bro
okly
n W
est
Que
ens
East
Oth
er
Sta
ten
Isla
nd
Man
hatt
an –
Upp
er E
ast/
Wes
t
Mid
tow
n W
alki
ngA
cces
sMid
tow
n O
ther
Man
hatt
anLo
wer
Que
ens
East
Wal
king
Acc
ess
LGA
New
Je
rsey
Ne
w Y
ork
Ups
tate
NY
& C
T
Long
Isla
ndN
J &
PA
04
MIL
ES
Man
hatta
n Lo
wer
Mid
tow
n W
alki
ng A
cces
s
Mid
tow
n O
ther
Man
hatta
n –
Upp
er E
ast/W
est
Man
hatta
n N
orth
Que
ens
Nor
thw
est
Que
ens
Wes
t Wal
king
Acc
ess
Que
ens
Wes
t Oth
er
Que
ens
East
Wal
king
Acc
ess
Que
ens
East
Oth
er
Broo
klyn
Eas
t
Broo
klyn
Wes
t
The
Bron
x
Stat
en Is
land
Long
Isla
nd
Ups
tate
NY
& C
T
NJ
& P
A
Data source: Port Authority LGA Ground Access Survey 2017, weighted using Customer Satisfaction Survey data from 2014-2016.
9.21
.18
LGA Airport Access Improvement Project 17
Manhattan—a key market for LGA air passengers—is subdivided into the following five areas, which directly relate to probable LGA air passengers using AirTrain LGA with a combination of either the LIRR or the 7 Line subway:
1.1 = Lower Manhattan
1.21 = Midtown Manhattan with walking access to either Grand Central Terminal or Penn Station or to one of the 7 Line subway stations
1.22 = Other Midtown Manhattan
1.3 = Manhattan Upper East Side and Upper West Side
1.4 = Manhattan North
Queens—a key market for LGA employees—is subdivided into the following five areas by potential propensity to use transit access to AirTrain LGA:
2 = Queens North-West
2.1 = Queens West with a walking access to the 7 Line subway or LIRR, which generates the primary market for employees who could use AirTrain LGA
2.2 = Queens West other
2.3 = Queens East with a walking access to the subway
2.4 = Queens East other
The geographic system becomes less specific for secondary markets and areas farther away from LGA.
4.2 LGA PASSENGER TYPES
Another important dimension to consider for the AirTrain LGA market is the air passenger trip purpose (i.e., business versus personal trips) and residential status (i.e., New York region residents versus visitors). Both trip type and resident type affect preferences in terms of ground access choices and many existing airport ground access choice models were developed to address this segmentation [6,7] (Appendix E).
LGA is the preferred airport for many business travelers due to its unique proximity to Midtown Manhattan. Based on data collected from surveys, Figure 4-4 shows a much higher share of business air passengers for LGA (close to 35 percent on average over the last four years) compared to the other major New York airports. Because most business passengers stay in Midtown Manhattan, carry minimal luggage, and are characterized by a high willingness to pay for reliable and convenient transportation, they are an important potential market for AirTrain LGA.

18 LGA Airport Access Improvement Project
Figure 4-4 O&D Share of Business Air Passengers for NY Major Airports13
Supporting data on the share of air passengers staying in Midtown Manhattan is shown in Figure 4-5. This tabulation includes all types of air passengers, and, given the high share of business travelers described above, LGA is the most Manhattan-oriented airport amongst the three major New York airports.
Figure 4-5 O&D Share of Air Passengers to Manhattan 14th-96th Street for NY Major Airports14
Business air passengers in general have a higher Value of Time (VOT), belong to smaller travel parties, and have less luggage compared to non-business air passengers. Relatively higher VOTs for business air passengers compared to non-business passengers were adopted in most airport ground access models [6,7,8,10,11]. Visitors more frequently use rental cars, taxis or For Hire Vehicles, while residents more often use auto drop-offs/pick-ups and/or long-term parking (see Appendix D).
13 Data collected from a LGA Survey conducted in 2016, a LGA Ground Access and AirTrain Attitudinal Survey conducted in 2017, and a PANYNJ Customer Satisfaction Surveys for LGA conducted in 2014–2016.
14 Data collected from a LGA Survey conducted in 2016, a LGA Ground Access and AirTrain Attitudinal Survey conducted in 2017, and a PANYNJ Customer Satisfaction Surveys for LGA conducted in 2014–2016.
0.0%
5.0%
10.0%
15.0%
20.0%
25.0%
30.0%
35.0%
40.0%
45.0%
JFK LGA EWR
2014 2015 2016 Average 2014-2016
0.0%
5.0%
10.0%
15.0%
20.0%
25.0%
30.0%
35.0%
40.0%
45.0%
50.0%
JFK LGA EWR
2014 2015 2016 Average 2014-2016

LGA Airport Access Improvement Project 19
Table 4-1 summarizes the corresponding joint distribution of LGA air passengers by trip purpose and place of residence.
Table 4-1Distribution of LGA Air Passengers by Type
Air passenger type
2014–2016 Unweighted Customer
Satisfaction Survey 2017 Unweighted
Ground Access Survey
Consolidated weighted model
database
“Any Business” Visitors 18.8% 12.8% 19.8%
“Any Business” Residents 9.8% 5.1% 9.2%
“Personal Only” Visitors 51.0% 54.3% 47.1%
“Personal Only” Residents 20.5% 27.8% 23.9%
In general, LGA is characterized by a relatively high share of business travelers and visitors. The main ground access mode for LGA air passengers today is taxi/For Hire Vehicles. The major advantage of rail/transit travel over auto modes is that it provides shorter and more reliable travel times due to surface street congestion in Manhattan, around LGA, and on the route between.
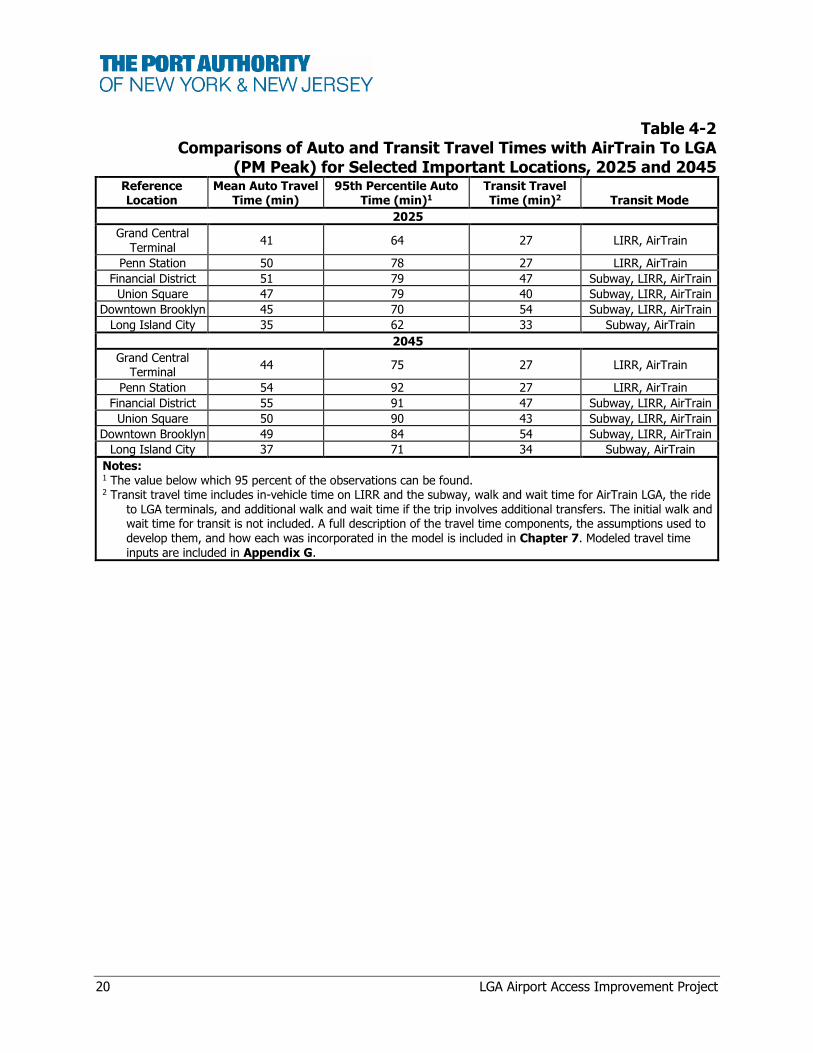
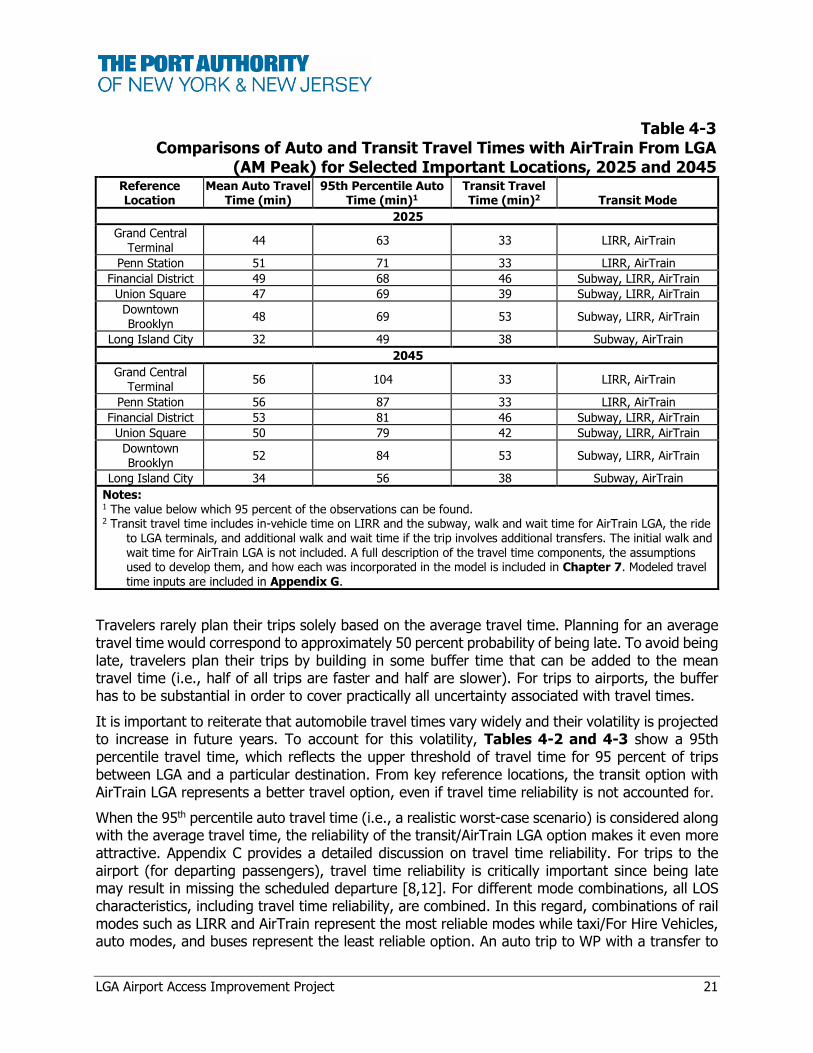
4.3 AUTO AND TRANSIT TRAVEL TIMES FOR KEY O&D PAIRS
Travel times to and from LGA by different access modes is one of the key explanatory variables in ground access mode choice. The AirTrain LGA ridership forecast is largely a function of travel time savings (as well as travel time reliability improvements) that this new mode brings compared to the existing access modes. A substantial effort was made to analyze the average travel times and travel time reliability for the key origins and destinations to and from LGA in order to prepare the most objective input to the LGA ground access mode choice model.
Tables 4-2 and 4-3 present the year 2025 and 2045 average automobile and transit times (with AirTrain LGA) for typical locations to and from LGA that are used in the LGA ground access mode choice model. As indicated in Appendix C and elsewhere in this report, highway and transit travel times for the existing modes of transportation to and from LGA is based on the information contained in BPM, with the highway travel times adjusted to reflect recent taxi GPS data. The assumptions used to develop transit travel times with AirTrain LGA are presented in Chapter 7. The transit option with the shortest total travel time (either LIRR with AirTrain LGA or subway with AirTrain LGA) from each selected location was chosen for this table. Transit travel time includes in-vehicle time on AirTrain LGA, LIRR, and the subway; walk and wait access at Willets Point; and walk and wait time at other transfer points, where applicable. Mean auto travel times shown in Tables 4-2 and 4-3 do not include explicit wait time. The model implicitly accounts for auto wait times through the mode coefficients described in Table 5-1 (Chapter 5).
20 LGA Airport Access Improvement Project
Table 4-2 Comparisons of Auto and Transit Travel Times with AirTrain To LGA
(PM Peak) for Selected Important Locations, 2025 and 2045Reference Location
Mean Auto Travel Time (min)
95th Percentile Auto Time (min)1
Transit Travel Time (min)2 Transit Mode
2025
Grand Central Terminal
41 64 27 LIRR, AirTrain
Penn Station 50 78 27 LIRR, AirTrain
Financial District 51 79 47 Subway, LIRR, AirTrain
Union Square 47 79 40 Subway, LIRR, AirTrain
Downtown Brooklyn 45 70 54 Subway, LIRR, AirTrain
Long Island City 35 62 33 Subway, AirTrain
2045
Grand Central Terminal
44 75 27 LIRR, AirTrain
Penn Station 54 92 27 LIRR, AirTrain
Financial District 55 91 47 Subway, LIRR, AirTrain
Union Square 50 90 43 Subway, LIRR, AirTrain
Downtown Brooklyn 49 84 54 Subway, LIRR, AirTrain
Long Island City 37 71 34 Subway, AirTrain
Notes: 1 The value below which 95 percent of the observations can be found. 2 Transit travel time includes in-vehicle time on LIRR and the subway, walk and wait time for AirTrain LGA, the ride
to LGA terminals, and additional walk and wait time if the trip involves additional transfers. The initial walk and wait time for transit is not included. A full description of the travel time components, the assumptions used to develop them, and how each was incorporated in the model is included in Chapter 7. Modeled travel time inputs are included in Appendix G.
LGA Airport Access Improvement Project 21
Table 4-3Comparisons of Auto and Transit Travel Times with AirTrain From LGA
(AM Peak) for Selected Important Locations, 2025 and 2045Reference Location
Mean Auto Travel Time (min)
95th Percentile Auto Time (min)1
Transit Travel Time (min)2 Transit Mode
2025
Grand Central Terminal
44 63 33 LIRR, AirTrain
Penn Station 51 71 33 LIRR, AirTrain
Financial District 49 68 46 Subway, LIRR, AirTrain
Union Square 47 69 39 Subway, LIRR, AirTrain
Downtown Brooklyn
48 69 53 Subway, LIRR, AirTrain
Long Island City 32 49 38 Subway, AirTrain
2045
Grand Central Terminal
56 104 33 LIRR, AirTrain
Penn Station 56 87 33 LIRR, AirTrain
Financial District 53 81 46 Subway, LIRR, AirTrain
Union Square 50 79 42 Subway, LIRR, AirTrain
Downtown Brooklyn
52 84 53 Subway, LIRR, AirTrain
Long Island City 34 56 38 Subway, AirTrain
Notes: 1 The value below which 95 percent of the observations can be found. 2 Transit travel time includes in-vehicle time on LIRR and the subway, walk and wait time for AirTrain LGA, the ride
to LGA terminals, and additional walk and wait time if the trip involves additional transfers. The initial walk and wait time for AirTrain LGA is not included. A full description of the travel time components, the assumptions used to develop them, and how each was incorporated in the model is included in Chapter 7. Modeled travel time inputs are included in Appendix G.
Travelers rarely plan their trips solely based on the average travel time. Planning for an average travel time would correspond to approximately 50 percent probability of being late. To avoid being late, travelers plan their trips by building in some buffer time that can be added to the mean travel time (i.e., half of all trips are faster and half are slower). For trips to airports, the buffer has to be substantial in order to cover practically all uncertainty associated with travel times.
It is important to reiterate that automobile travel times vary widely and their volatility is projected to increase in future years. To account for this volatility, Tables 4-2 and 4-3 show a 95th percentile travel time, which reflects the upper threshold of travel time for 95 percent of trips between LGA and a particular destination. From key reference locations, the transit option with AirTrain LGA represents a better travel option, even if travel time reliability is not accounted for.
When the 95th percentile auto travel time (i.e., a realistic worst-case scenario) is considered along with the average travel time, the reliability of the transit/AirTrain LGA option makes it even more attractive. Appendix C provides a detailed discussion on travel time reliability. For trips to the airport (for departing passengers), travel time reliability is critically important since being late may result in missing the scheduled departure [8,12]. For different mode combinations, all LOS characteristics, including travel time reliability, are combined. In this regard, combinations of rail modes such as LIRR and AirTrain represent the most reliable modes while taxi/For Hire Vehicles, auto modes, and buses represent the least reliable option. An auto trip to WP with a transfer to
22 LGA Airport Access Improvement Project
AirTrain LGA represents an intermediate case where the auto portion of the trip would still have a certain unreliability component while the AirTrain LGA portion would not have it.
In addition to travel time, transit options (LIRR and subway) combined with AirTrain LGA can be compared against auto modes and transit options that do not utilize AirTrain LGA. This is done by using the generalized cost of each mode, which considers travel cost weighted by VOT in addition to a reliability component that is represented by a difference between the 95th percentile of travel time and the mean travel time. In this case, 95th percentile plays the role of the “worst” possible case that the travelers would take into account to avoid lateness and possibly missing the flight. In the generalized cost calculation, transit travel time components (walks, waits, and transfers) are weighted using coefficients from the model, which are described in the next chapters.
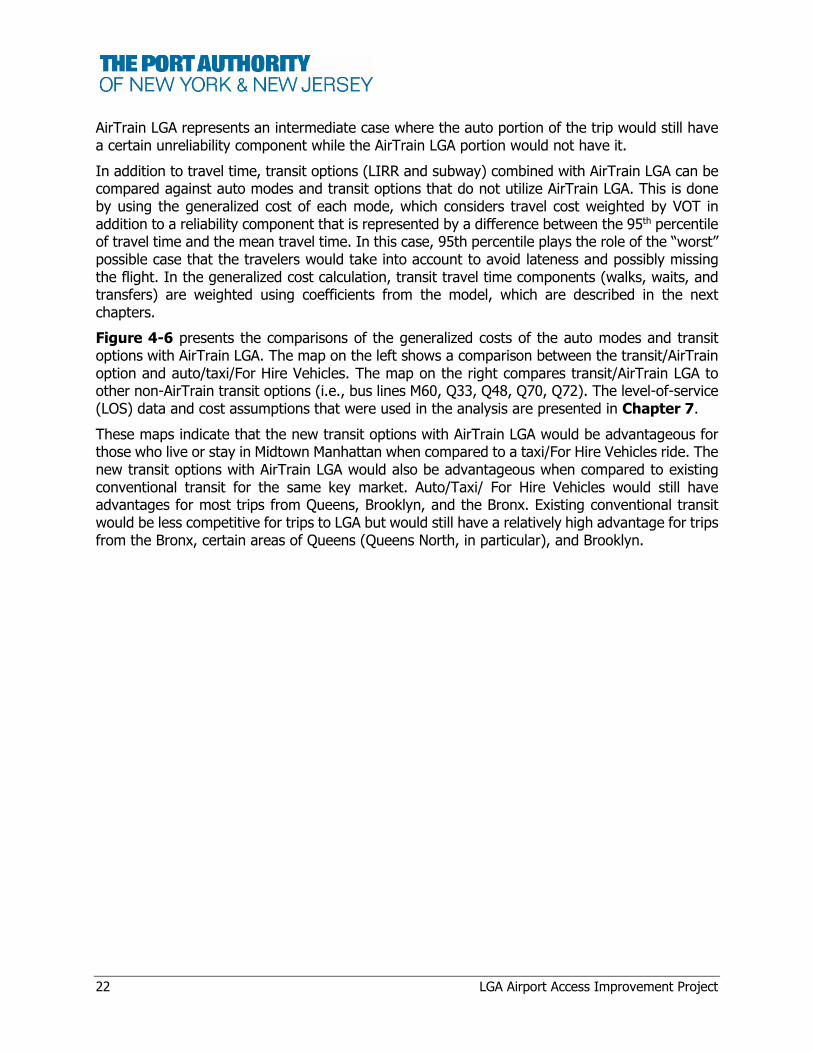
Figure 4-6 presents the comparisons of the generalized costs of the auto modes and transit options with AirTrain LGA. The map on the left shows a comparison between the transit/AirTrain option and auto/taxi/For Hire Vehicles. The map on the right compares transit/AirTrain LGA to other non-AirTrain transit options (i.e., bus lines M60, Q33, Q48, Q70, Q72). The level-of-service (LOS) data and cost assumptions that were used in the analysis are presented in Chapter 7.
These maps indicate that the new transit options with AirTrain LGA would be advantageous for those who live or stay in Midtown Manhattan when compared to a taxi/For Hire Vehicles ride. The new transit options with AirTrain LGA would also be advantageous when compared to existing conventional transit for the same key market. Auto/Taxi/ For Hire Vehicles would still have advantages for most trips from Queens, Brooklyn, and the Bronx. Existing conventional transit would be less competitive for trips to LGA but would still have a relatively high advantage for trips from the Bronx, certain areas of Queens (Queens North, in particular), and Brooklyn.
LGA Airport Access Improvement Project 23
Figure 4-6 Comparison of Overall Generalized Cost by Auto and Transit with AirTrain to LGA, 2025
LIRR/Subway+AirTrain vs. taxi/For Hire Vehicles/auto
LIRR/Subway+AirTrain vs. other non-AirTrain transit

24 LGA Airport Access Improvement Project
OVERVIEW OF THE RIDERSHIP MODELING METHODOLOGY
5.1 PROTOTYPES AND SOURCES FOR THE CURRENT MODEL
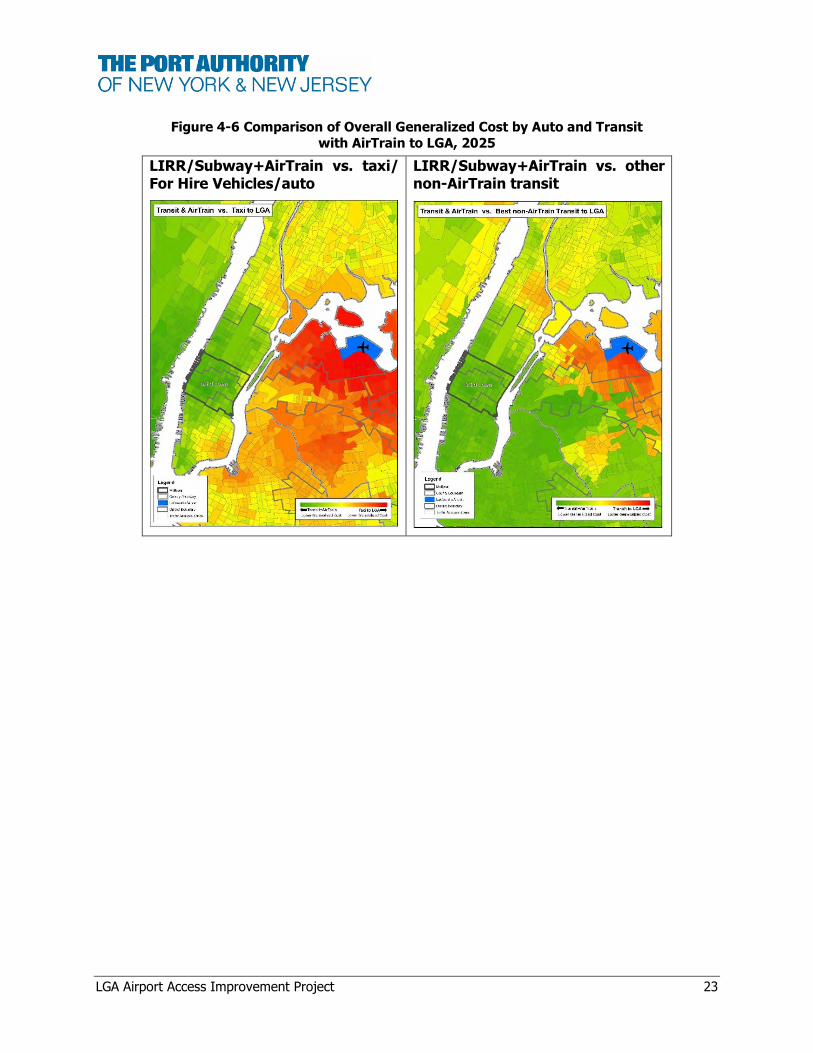
The model developed for the AirTrain LGA project refined a similar ground access mode choice model developed and applied to JFK in 2016. The JFK model was based on the previously developed model for a joint choice of airport and ground access in the New York region (Figure 5-1). All three models were based on the sample enumeration principle with individual microsimulation [1,2,4,5]. In a sample enumeration structure, the forecasting model was applied to each individual record in the model database that corresponds to an actual observed trip in one of the LGA surveys. In this structure, each individual chose to stay on the actually reported mode or switch to one of the new options with AirTrain LGA.
Figure 5-1 Accumulated Experience of Airport Modeling Tools Developed for PANYNJ
The first development and application of the PANYNJ airport and ground access model included a comprehensive analysis of the factors that influence ground access mode preference such as time and cost elasticities and derived Value of Time (VOT) for different groups of air passengers and employees [1,2]. The corresponding behavioral parameters and model coefficients were the basis for the LGA model implementation. Subsequent development and application of the JFK ground access model focused on understanding the specifics of AirTrain LGA and associated behavioral parameters of this mode versus other ground-access modes [4,5]. Since AirTrain JFK ridership data was available for 2003–2016, the JFK study quantified the relative magnitude of the AirTrain mode choice constants versus other modes as well as the AirTrain’s added value as the access/egress mode in different mode combinations. This information was an important input
PANYNJ airport & ground access, 2008
• Innovative sample enumeration approach
• Switching model pivoting off observed choices (2005 survey)
• Addressing specific mode preferences of airport passengers (8 modes)
• Integration with regional travel model
JFK ground access 2016
• Focus on single airport and accounting of development plans by terminal
• More detailed consideration of access modes and routes for JFK (20 options)
• Include both air passengers and employees
• New JFK survey, 2016
LGA ground access, 2017
• Detailed consideration of access modes and routes for LGA
• New LGA survey, 2017
• AirTrain ridership forecast for wide range of scenarios
• Analysis of traffic impacts
LGA Airport Access Improvement Project 25
in developing the LGA ground access mode choice model. The core ground access choice model was applied in a sample enumeration fashion that was based on an extensive survey of actual air passengers and employees as described in the subsequent chapters.
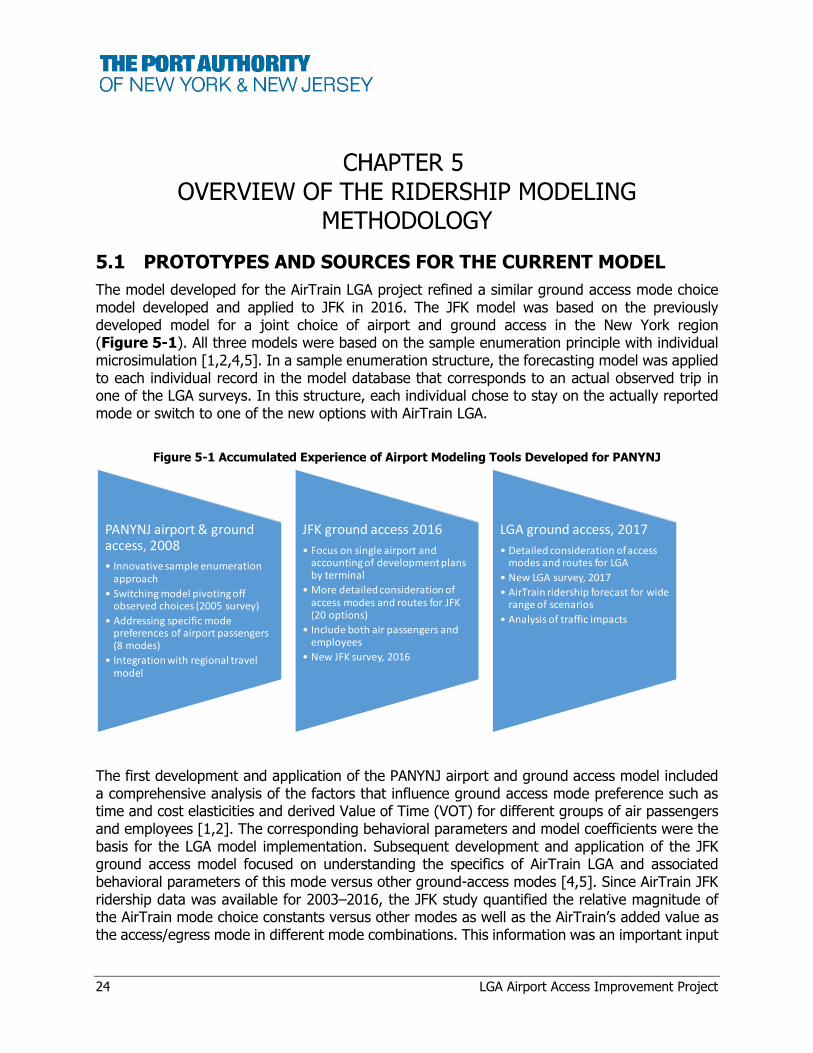
5.2 COMPLETE SYSTEM WITH EQUILIBRATION
The entire approach can be presented in a general way as a multi-level model system (Figure 5-2).
Figure 5-2 Complete System with Equilibration
The LGA ground access model took the relevant level of service (LOS) variables (travel time and cost for trips to and from LGA) from the regional Best Practice Model (BPM). These LOS variables were then considered fixed for all Baseline and Build alternatives, and only the LGA mode switching model was rerun for each new alternative. This simplified assumption was justified for AirTrain ridership forecasting because the differences between Baseline and Build alternatives were not significant at the regional scale and did not affect the overall congestion pattern. This was also beneficial in terms of runtime since the LGA model itself took only several minutes to run while the BPM took more than 24 hours of runtime to reach equilibrium.
For the traffic analysis, it was necessary that the LGA ground access mode choice model provide feedback regarding incremental traffic and/or transit impacts. These impacts were reflected in the forecasts through specific additions or subtractions from the trip tables generated by the BPM. This more complex model system was used to evaluate traffic impacts of the Build versus Baseline alternatives for the traffic analysis. On the highway side, this system produced detailed vehicle miles traveled (VMT) summaries for the Baseline and Build scenarios by geography as the basis to calculate emissions reduction. On the transit side, this system produced changes in additional volumes of boarding and alighting passengers at each station between the baseline and build scenarios. These regional effects were essential to evaluate the traffic impacts of AirTrain LGA, especially on the transit side. While most of the VMT reductions were logically predicted in the areas adjacent to the airport, most of the existing transit stations that would experience additional passenger volume would be in Midtown Manhattan.
AirTrain operation sub-model
2=LGA ground access sub-model
1=Regional travel model
Detailed facility & station-to-station passenger demand
Airport development
plans
Regional LOS, airport access
Detailed capacity & operation analysis
Detailed demand for traffic simulation
Detailed traffic impacts
Detailed demand for facility-to&from-external zones
Transit impacts
Traffic impacts
26 LGA Airport Access Improvement Project
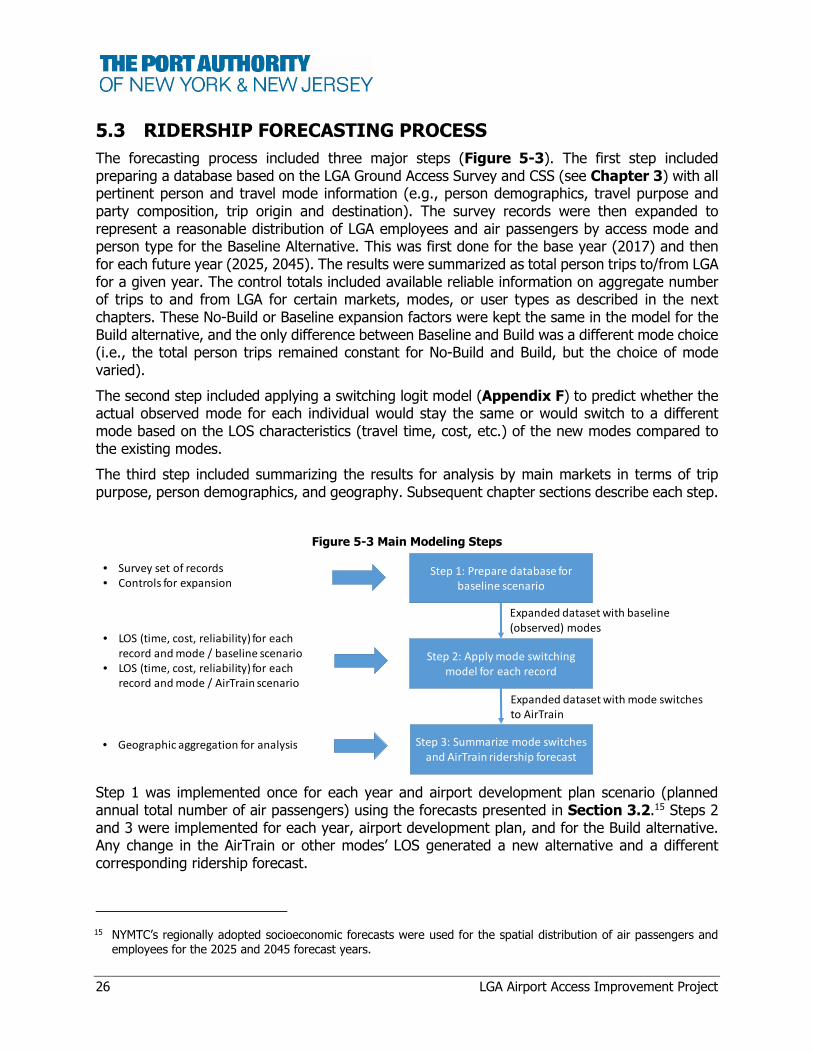
5.3 RIDERSHIP FORECASTING PROCESS
The forecasting process included three major steps (Figure 5-3). The first step included preparing a database based on the LGA Ground Access Survey and CSS (see Chapter 3) with all pertinent person and travel mode information (e.g., person demographics, travel purpose and party composition, trip origin and destination). The survey records were then expanded to represent a reasonable distribution of LGA employees and air passengers by access mode and person type for the Baseline Alternative. This was first done for the base year (2017) and then for each future year (2025, 2045). The results were summarized as total person trips to/from LGA for a given year. The control totals included available reliable information on aggregate number of trips to and from LGA for certain markets, modes, or user types as described in the next chapters. These No-Build or Baseline expansion factors were kept the same in the model for the Build alternative, and the only difference between Baseline and Build was a different mode choice (i.e., the total person trips remained constant for No-Build and Build, but the choice of mode varied).
The second step included applying a switching logit model (Appendix F) to predict whether the actual observed mode for each individual would stay the same or would switch to a different mode based on the LOS characteristics (travel time, cost, etc.) of the new modes compared to the existing modes.
The third step included summarizing the results for analysis by main markets in terms of trip purpose, person demographics, and geography. Subsequent chapter sections describe each step.
Figure 5-3 Main Modeling Steps
Step 1 was implemented once for each year and airport development plan scenario (planned annual total number of air passengers) using the forecasts presented in Section 3.2.15 Steps 2 and 3 were implemented for each year, airport development plan, and for the Build alternative. Any change in the AirTrain or other modes’ LOS generated a new alternative and a different corresponding ridership forecast.
15 NYMTC’s regionally adopted socioeconomic forecasts were used for the spatial distribution of air passengers and employees for the 2025 and 2045 forecast years.
Step 1: Prepare database for baseline scenario
Step 2: Apply mode switching model for each record
Step 3: Summarize mode switches and AirTrain ridership forecast
• Survey set of records• Controls for expansion
• LOS (time, cost, reliability) for each record and mode / baseline scenario
• LOS (time, cost, reliability) for each record and mode / AirTrain scenario
• Geographic aggregation for analysis
Expanded dataset with baseline (observed) modes
Expanded dataset with mode switches to AirTrain
LGA Airport Access Improvement Project 27
5.4 COMPARISON TO THE PREVAILING PRACTICES IN AIRPORT GROUND ACCESS MODELING
This model system is conceptually similar to many travel models used in airport ground access studies [6,7] with several key differences. Many airport ground access models in practice represent a single-level structure. In some instances, airports are treated as special generators in the regional model, although many models treat trips to the airport as standard non-work purpose trips. Non-work purpose trips are instances where people do not exhibit a higher willingness to pay and therefore are not accurate representations of all airport access trips. They are characterized by a disproportionate use of taxi and For Hire Vehicle modes, different time-of-day patterns, and higher vehicle occupancy rates.
With regard to airports, a regional model does not represent a comprehensive tool that can address all airport-associated issues with the necessary level of detail. Even if a regional travel model includes the airport as a special generator with the corresponding specific trip distribution and mode choice sub-models separated from the core regional model, this does not resolve all related modeling issues encountered at a project level of detail. The reasons why micro-modeling is needed to supplement a regional model include the following:
Spatial resolution of travel demand generation requires breaking up the airport—often represented by a single Traffic Analysis Zone (TAZ) in the regional network—into multiple TAZs representing different facilities (e.g., terminals, parking lots, rail stations, bus stops, taxi stands, pick-up and drop-off areas, freight terminals, airport hotels).
Distinguishing between air passenger types (e.g., business vs. non-business, residents vs. visitors, domestic vs. international) and between different employee types (e.g., airline crew, airport management, other airport employees) would require too many additional trip purposes and/or user classes in the regional model.
Network details within the airport, such as terminal-to-terminal or facility-to-facility road, transit, and pedestrian links with associated time and cost details for different user classes (air passengers and employees by type). Special generators normally share the networks and associated LOS characteristics with the core travel model.
Thus, having the airport as a special generator in the regional model is essential to properly represent the regional highway network congestion and transit ridership, but it is not enough to address travel demand forecasting requirements at the project level. In this regard, a micro-model is developed in order to provide:
Unlimited segmentation with respect to air passengers and employees. The micro-model can be integrated with a detailed intra-airport network (as was implemented in the JFK ground access model [4,5]) that represents all important trip generators, facilities, and access options between them, such as on-airport rail, driving, walking, or using special modes such as shuttle buses.
The micro-model can be structurally and algorithmically different from the regional model, and can be built with specific data available for the airport, such as a comprehensive survey of airport passengers and employees for LGA.
The micro-model can be pivoted off detailed airport development plans, such as expected growth of employees and air passengers by terminal; these important details would be lost in a macro-model.
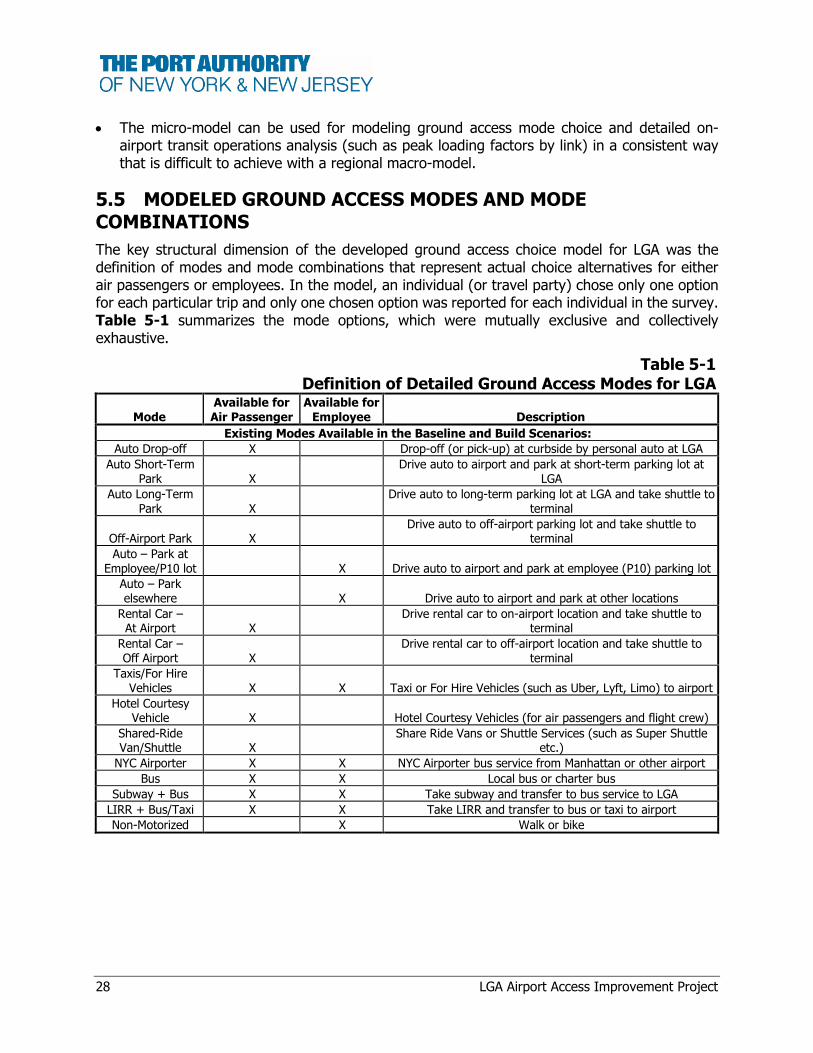
28 LGA Airport Access Improvement Project
The micro-model can be used for modeling ground access mode choice and detailed on-airport transit operations analysis (such as peak loading factors by link) in a consistent way that is difficult to achieve with a regional macro-model.
5.5 MODELED GROUND ACCESS MODES AND MODE COMBINATIONS
The key structural dimension of the developed ground access choice model for LGA was the definition of modes and mode combinations that represent actual choice alternatives for either air passengers or employees. In the model, an individual (or travel party) chose only one option for each particular trip and only one chosen option was reported for each individual in the survey. Table 5-1 summarizes the mode options, which were mutually exclusive and collectively exhaustive.
Table 5-1Definition of Detailed Ground Access Modes for LGA
Mode Available for Air Passenger
Available for Employee Description
Existing Modes Available in the Baseline and Build Scenarios:
Auto Drop-off X Drop-off (or pick-up) at curbside by personal auto at LGA
Auto Short-Term Park X
Drive auto to airport and park at short-term parking lot at LGA
Auto Long-Term Park X
Drive auto to long-term parking lot at LGA and take shuttle to terminal
Off-Airport Park X Drive auto to off-airport parking lot and take shuttle to
terminal
Auto – Park at Employee/P10 lot X Drive auto to airport and park at employee (P10) parking lot
Auto – Park elsewhere X Drive auto to airport and park at other locations
Rental Car – At Airport X
Drive rental car to on-airport location and take shuttle to terminal
Rental Car – Off Airport X
Drive rental car to off-airport location and take shuttle to terminal
Taxis/For Hire Vehicles X X Taxi or For Hire Vehicles (such as Uber, Lyft, Limo) to airport
Hotel Courtesy Vehicle X Hotel Courtesy Vehicles (for air passengers and flight crew)
Shared-Ride Van/Shuttle X
Share Ride Vans or Shuttle Services (such as Super Shuttle etc.)
NYC Airporter X X NYC Airporter bus service from Manhattan or other airport
Bus X X Local bus or charter bus
Subway + Bus X X Take subway and transfer to bus service to LGA
LIRR + Bus/Taxi X X Take LIRR and transfer to bus or taxi to airport
Non-Motorized X Walk or bike

LGA Airport Access Improvement Project 29
Table 5-1 (cont’d)Definition of Detailed Ground Access Modes for LGA
Mode Available for Air Passenger
Available for Employee Description
New mode combinations with AirTrain available in the Build scenario:
Auto Drop-off at WP/ AirTrain LGA X
Drop-off (or Pick-up) at Willet's Point AirTrain Station by personal auto
Auto – Empl Parking at WP/ AirTrain LGA X
Drive auto to employee parking lot at Willet's Point and transfer AirTrain LGA to go to terminal
Taxi/Limo/ For Hire Vehicles at
WP/ AirTrain LGA X X Taxi or For Hire Vehicles to Willet's Point and transfer to
AirTrain LGA to go to terminal
Subway to AirTrain LGA X X
Take Subway to Willet's Point and transfer to AirTrain LGA to go to terminal
LIRR to AirTrain LGA X X
Take LIRR to Willet's Point and transfer to AirTrain LGA to go to terminal
The model had 21 distinct mode combinations. Of them, 16 combinations corresponded to the actual observed access modes of transportation that were available in the Baseline and Build scenarios (unless some of them were specifically removed from a certain Build scenario such as a full closing of one of the parking facilities at LGA and moving it to WP). Another five combinations involved AirTrain LGA, which applied to Build scenarios only.
Several specific mode options were available only to air passengers and were not available to (or not observed for) employees. They included auto drop-offs and parking at dedicated facilities for air passengers, rental cars, hotel courtesy vehicles, and shared-ride vans. Several other mode options were available only to employees and were not available to (or not observed) for air passengers. They included auto parking at dedicated facilities for employees (which require a special permit) or parking off airport as well as walking or biking to the airport.
In some case, unavailable modes were associated with direct prohibitions, like parking permits for employees only. In other cases, modes were not feasible given the cost, such as short-term or long-term parking for employees at the parking facilities for air passengers).
This detailed structure of mode choice options was necessary to address the wide spectrum of planning questions associated with the AirTrain LGA project. In particular, the five new options provided by AirTrain LGA correspond to different facilities at the WP complex, and it is important to know the ridership breakdown by these locations.
30 LGA Airport Access Improvement Project
OVERVIEW OF THE STATISTICAL STRUCTURE OF THE MODEL
6.1 GROUND ACCESS MODE CHOICE FRAMEWORK
The basis of the LGA ground access mode choice model is a conventional logit mode choice model, which represents each decision-maker (i.e., observed air passenger or airport employee in the database) as having a full set of options to access the airport, including modes and mode combinations that require: 1) an AirTrain fare, 2) those that include a free AirTrain ride, and 3) those that do not include AirTrain at all. The model works by computing a “utility” for each mode choice (i.e., automobile, commuter rail, subway, bus, AirTrain). The “utility” represents the total economic “cost” of travel for each mode in terms of time, cost and other impediments or inducements to travel. The “utility” of each mode alternative is weighted by the individual preferences of the particular user type (employee, business traveler, non-business traveler, etc.), ultimate origin/destination outside the airport, and airport terminal choice.
The unique feature of the LGA ground access mode choice model is an embedded “switching” model, which is applied to each individual record that corresponds to an actual observed trip in one of the LGA surveys. The switching model predicts whether the actual observed mode for each individual would stay the same or would switch to a different mode based on the LOS of the new modes versus the LOS of the existing modes.
Essentially, this model pivots off a Baseline scenario by looking at the possible differences between the Build and the Baseline alternatives.
A general formulation of the switching model can be written in the following form:
Equation 1
Ij
jiPjPiP~
Where:
Ii = set of available alternatives,
iP~
= choice probability in the base scenario,
iP = choice probability in the build scenario.
jiP reflects the probability of switching from alternative i to alternative j .
Appendix F provides the details of the switching logit model.
6.2 MAIN VARIABLES AND FACTORS ACCOUNTED IN THE MODEL
Table 6-1 summarizes the main variables and corresponding coefficients of the model. As was pertinent to many airport ground access models developed elsewhere, the LGA model required

LGA Airport Access Improvement Project 31
segmentation by air passenger types and employees due to the substantial differences in the observed mode preferences [6,7,10,11].
Table 6-1Model Utility Coefficients
Parameter Air Passenger
Business Air Passenger Non-Business Employee
Value of Time (VOT) per single-party traveler ($/hr) 75 50 16
Auto Congested Travel Time and Terminal Time (min) -0.050 -0.050 -0.050
Transit In-Vehicle Time (min) -0.050 -0.050 -0.050
Transit Wait and Walk Time (mins) -0.100 -0.100 -0.100
Auto Operating Costs, Tolls, Parking Costs, Taxi Fare, Transit Fare ($)
-0.040 -0.060 -0.188
AirTrain In-Vehicle Time (min) -0.050 -0.050 -0.050
AirTrain Fare ($) -0.040 -0.060 -0.188
AirTrain Transfer Walk Time (min) -0.100 -0.100 -0.100
Auto Drop-off/ Taxi at Willets Point (WP) :
Transfer Penalty Constant -0.25 -0.25
Trip Distance -0.0200 -0.0200
Penalty for longer auto times to WP compared to LGA -5.0000 -5.0000
Mode-Specific Constants – General:
Taxi/Limo/For Hire Vehicles at WP/ AirTrain LGA 2.3150 1.7340
Auto -Empl Parking at WP/ AirTrain LGA 1.6503
Subway to AirTrain LGA 0.3910 0.5840 4.6640
LIRR to AirTrain LGA 0.3910 0.5840 5.1030
Subway to AirTrain LGA 1.3530 0.8060 -2.2700
LIRR to AirTrain LGA 1.3530 0.8060 -2.2700
Mode-Specific Constants – Residents:
Auto Drop-off 0.6960 0.9702
Auto Short-Term Park 0.5024 0.4496
Auto Long-Term Park 0.5771 1.0770
Off-Airport Park 0.3049 0.5863
Taxis/ For Hire Vehicles 3.7052 3.5197 3.4399
Hotel Courtesy Vehicle -0.5089 -0.2278
Shared Ride Van/Shuttle -5.3088 -4.9016
NYC Airporter 3.5976 3.9853 6.8707
Bus 2.4631 2.3748 4.8589
Subway + Bus 1.6741 1.7954 5.5733
LIRR + Bus/Taxi 1.2460 1.8418 6.8708
Auto – Park at Employee/P10 lot 2.0701
Auto – Park elsewhere -0.6185
Non-Motorized -14.0000
Auto -Empl Parking at WP/ AirTrain LGA 2.0701
Auto Drop-off at WP/ AirTrain LGA 0.6960 0.9702
Taxi/Limo/For Hire Vehicles at WP/ AirTrain LGA 1.3902 1.7857 3.4399
Subway to AirTrain LGA 0.8962 1.2114 0.9093
LIRR to AirTrain LGA 0.8962 1.2114 1.7678
Mode-Specific Constants – Visitors:
Auto Drop-off 0.1927 0.2141
Auto Short-Term Park -1.8647 -1.5011
Rental Car – At Airport -0.9374 -1.9693
Rental Car – Off Airport 0.0259 -0.5065
Taxis/For Hire Vehicles 3.3931 2.9411

32 LGA Airport Access Improvement Project
Table 6-1 (cont’d)Model Utility Coefficients
Parameter Air Passenger
Business Air Passenger Non-Business Employee
Hotel Courtesy Vehicle 0.2489 -0.1702
Shared Ride Van/Shuttle -4.4644 -4.6469
NYC Airporter 2.4084 2.8803
Bus 1.0574 1.0276
Subway + Bus 0.2443 0.4843
LIRR + Bus/Taxi 1.2904 1.0310
Auto Drop-off at WP/ AirTrain LGA 0.1927 0.2141
Taxi/Limo/For Hire Vehicles at WP/ AirTrain LGA 1.0781 1.2071
Subway to AirTrain LGA -0.1467 -0.0997
LIRR to AirTrain LGA -0.1467 -0.0997
The model coefficients were originally substantiated by a complete disaggregate statistical analysis in the framework of joint choice of airport and ground access mode choice in the New York region as part of the previous study for PANYNJ [1,2]. These coefficients and specifically AirTrain mode-specific constants compared to other modes (can be interpreted as relative mode “convenience factors” in addition to the directly measured time and cost) were recalibrated based on the 2016 JFK ground access survey as part of the JFK AirTrain study. These adjustments are important since they reflect the observed mode share of the existing JFK AirTrain. Finally, additional adjustments to the mode-specific constants were made based on the 2017 LGA Ground Access Survey. The latest adjustments affected only the existing ground access mode combinations for LGA as well as an adjustment to the segmented VOT versus the VOT used for the JFK AirTrain study because of the observed differences between average income of LGA air passengers compared to the JFK air passengers. The VOT adjustments are implemented through the inversely proportional adjustment of the cost coefficient in the utility function. VOT for air passenger parties of 2 or more people traveling together are additionally adjusted based on the concept of “cost sharing” as a prevailing practice in most travel demand models. Thus, VOT for a travel party grows with party size (N) but not linearly. The growth formula N0.7 is applied for VOT of joint travel as suggested in the recent Federal Highway Administration studies [16]. The next section provides additional details on VOT setting in the model.
6.3 VALUE OF TIME (VOT)
Value of Time (VOT) is an important parameter of a mode choice model that expresses how the travelers trade off travel time and cost for each mode. All else being equal, higher VOT means that the travelers value travel time savings more and would be willing to pay for more expensive but faster, more convenient, and more reliable modes. Conversely, lower VOT means that travelers would prefer cheaper modes even if they are inferior in terms of travel time or other service characteristics. There are multiple published reports on VOT for air passengers and employees including Special ACRP Synthesis Reports 4, 5, 22, and 118 [6,7,8]. In these reports, a wide range of applied VOTs in different models can be found (Table 6-2) from the ACRP 5 Synthesis. Only a few of the applied models were rigorously estimated based on an extensive survey of air passengers. In many applied models, VOTs were assumed based on the prevailing practices at the time; subsequently, the entire model was validated and adjusted to match the available aggregate data without a specific statistical proof of the adopted VOT. However, several general patterns were quite common across different models. Specifically, it was agreed that all
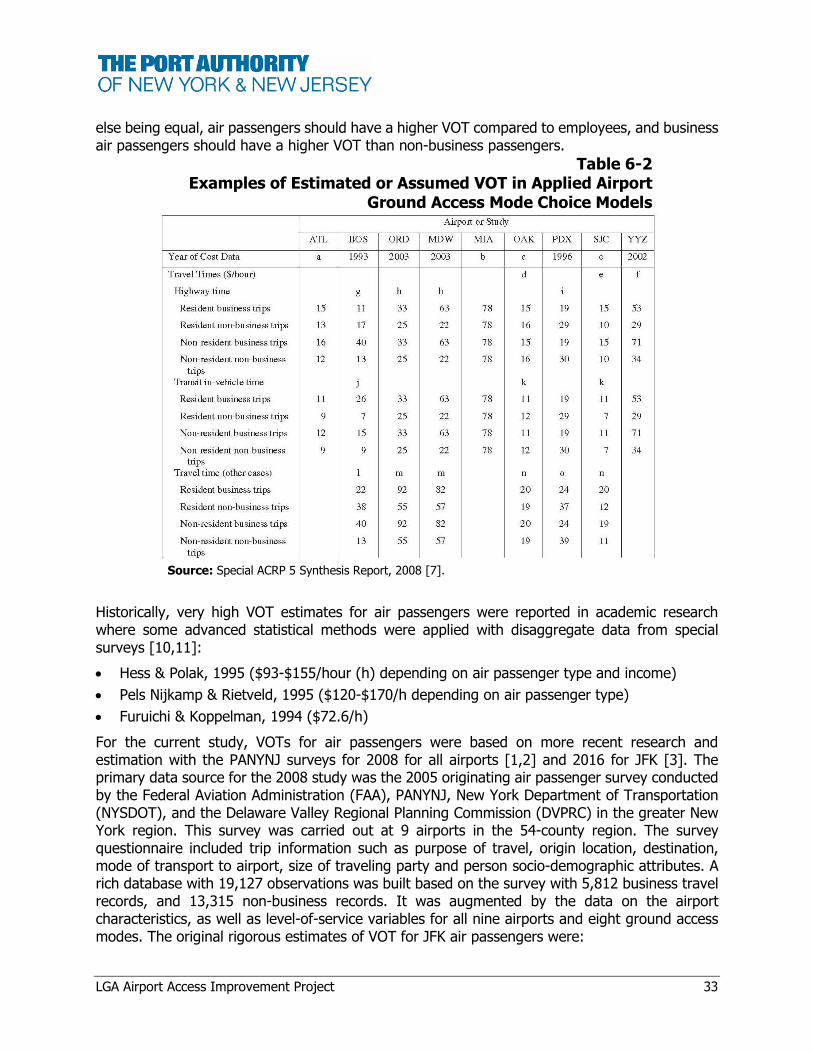
LGA Airport Access Improvement Project 33
else being equal, air passengers should have a higher VOT compared to employees, and business air passengers should have a higher VOT than non-business passengers.
Table 6-2 Examples of Estimated or Assumed VOT in Applied Airport
Ground Access Mode Choice Models
Source: Special ACRP 5 Synthesis Report, 2008 [7].
Historically, very high VOT estimates for air passengers were reported in academic research where some advanced statistical methods were applied with disaggregate data from special surveys [10,11]:
Hess & Polak, 1995 ($93-$155/hour (h) depending on air passenger type and income)
Pels Nijkamp & Rietveld, 1995 ($120-$170/h depending on air passenger type)
Furuichi & Koppelman, 1994 ($72.6/h)
For the current study, VOTs for air passengers were based on more recent research and estimation with the PANYNJ surveys for 2008 for all airports [1,2] and 2016 for JFK [3]. The primary data source for the 2008 study was the 2005 originating air passenger survey conducted by the Federal Aviation Administration (FAA), PANYNJ, New York Department of Transportation (NYSDOT), and the Delaware Valley Regional Planning Commission (DVPRC) in the greater New York region. This survey was carried out at 9 airports in the 54-county region. The survey questionnaire included trip information such as purpose of travel, origin location, destination, mode of transport to airport, size of traveling party and person socio-demographic attributes. A rich database with 19,127 observations was built based on the survey with 5,812 business travel records, and 13,315 non-business records. It was augmented by the data on the airport characteristics, as well as level-of-service variables for all nine airports and eight ground access modes. The original rigorous estimates of VOT for JFK air passengers were:
34 LGA Airport Access Improvement Project
$63/h for business air passengers
$42/h for non-business air passengers
Subsequent corrections were introduced for LGA VOT for air passengers based on the comparison of the average income of the LGA air passengers to JFK that was available in the LGA and JFK ground access surveys. LGA air passengers have a higher average household income ($108,200) than JFK air passengers ($86,300). Strategic Highway Research Program 2 (SHRP 2) C04 Report Improving Our Understanding of How Highway Congestion and Pricing Affect Travel Demand,substantiated a VOT elasticity with respect to income [16]. VOT grows with income but not linearly. VOT growth is proportional to income growth raised to the 0.8 power (so-called “constant elasticity” model). Application of this method for LGA air passengers resulted in the following VOT that was adopted for this study:
$75/h for business air passengers
$50/h for non-business air passengers
It should be noted that the observed mode choice for LGA air passengers with a very high share (more than 50 percent) of the most expensive modes such as taxi/For Hire Vehicles serves as indirect evidence of a high VOT. Additionally, an extensive set of sensitivity tests for AirTrain ridership with different VOTs showed a relatively low ridership elasticity with respect to VOT, which means that the ridership forecast did not change drastically with either higher or lower VOT in a reasonable range. This can be explained by the fact that for LGA, the main “competition” for AirTrain comes from the expensive taxi/For Hire Vehicles modes. In this regard, a higher VOT value actually makes taxi/For Hire Vehicles more competitive against AirTrain. Conversely, a lower VOT assumption makes transit (and AirTrain, in particular) more competitive against taxi/For Hire Vehicles. Thus, the adopted VOT for the current study does not automatically favor AirTrain in the ground access mode competition. However, higher VOTs in general reduce the AirTrain ridership elasticity with respect to the fares.
For the LGA employees, and in order to be consistent with the way level-of-service (LOS) variables were generated by the BPM (Figure 5-2), VOT was directly adopted from the BPM. The BPM uses the following VOT that was rigorously estimated based on the New York Metropolitan Transportation Council household survey, 1997:
$16/h for work trips – this VOT was adopted for LGA employees.
$10-$12/h for non-work trips depending on the detailed trip purpose.
For LGA employees, AirTrain ridership sensitivity to the VOT assumptions proved to be relatively low but for a different reason.

LGA Airport Access Improvement Project 35
LEVEL-OF-SERVICE (LOS) DATA AND ASSUMPTIONS
As described above, the LGA ground access model was developed for both the No Build and Build alternatives using the travel time (with adjustment) and cost of trip information contained in NYMTC’s BPM for each mode and/or combination of modes of trips to and from LGA.16 Thousands of individual records were processed from BPM to obtain the actual trip origins (for trips to LGA) and destinations (for trips from LGA), covering a wide geography in the New York metropolitan region. To develop the LGA mode choice model, BPM’s travel time and cost of trip assumptions were assigned to each Origin-Destination (O&D) pair observed in the trip database, and for all possible mode combinations including AirTrain mode combinations in the Build Alternative. Travel time and cost of trip was assigned by time of day, for both highway and transit modes, to and from several LGA access points, including LGA itself and Willets Point.
In the BPM, a single Transportation Analysis Zone (TAZ) represents the entire airport with no specific representation of access to individual terminals. As a result, the LGA mode choice model was developed to include micro-level on-airport detail to supplement the BPM’s representation of the region (which contains more than 4,000 TAZs). The AirTrain LGA alignment between WP and the airport terminals was coded into the model by defining the travel time and cost of trip characteristics for the proposed service. The assumptions used in the Baseline and Build alternatives are described below.
7.1 BASELINE ALTERNATIVE
Cost of trip components such as tolls, transit fares, and parking fees are based on current fare policies and expressed in base year (2017) dollars, whether obtained from BPM or other sources. For the 2025 and 2045 forecasts, inflationary effects are not represented since each mode would increase proportionally and the relative difference between modes and the model’s mode choice assignments would not be materially affected. Potential changes in fare policies and fare hikes beyond inflationary increases, on the other hand, have the potential to alter mode choice decisions and these would need to be represented in the model relative to the cost of trip information for the other modes that would be unaffected by such changes.
The following assumptions and adjustments to the BPM base model were used to develop the LGA ground access model for the Baseline Alternative:
Based on a review of taxi GPS data, it was determined that BPM underestimates travel time by 10 to 40 percent. As a result, the travel times for automobile trips were adjusted accordingly (see Appendix C). A congestion growth factor was also applied for future years.17
Taxi fares represented in BPM were raised by 30 percent, to reflect the taxi GPS data
16 In BPM, the decision to stay on a given mode or switch to a different one is based on a generalized cost of travel, which is computed using time and cost variables weighted to account for the Value of Time (VOT).
17 For purposes of projecting future year travel times, highway travel times generated by BPM were used to calculate a travel time growth factor reflecting projected increases in congestion from 2017 to 2025 and 2045, while the 2017 highway travel times were based on observed taxi GPS data for trips to and from LGA.
36 LGA Airport Access Improvement Project
Transit times were extracted from the BPM for bus, subway, and commuter rail modes. The subway transit times include a possible combination with (transfer to/from) bus, while the rail travel times include a possible combination with bus and subway.
For planning purposes, LIRR’s future service18 at Willets Point connecting to both New York Penn Station and Grand Central Terminal was coded into the model assuming two trains per hour from each Manhattan terminal (four trains per hour combined) with an in-vehicle travel time of 18 minutes19 for each route. Fares were kept consistent with the current LIRR fare policy (between $6.50 and $8.75, depending on the time-of-day period);
A 20 to 23 minute trip was assumed for airport shuttle service to Rental Cars and Long-Term Parking/Off-Airport Parking at LGA;20
Based upon projected travel times when the LGA Redevelopment program roadway improvements are complete, three minutes was added to BPM travel times for automobile trips to account for time between the entrance to the airport and the terminal pickup/drop-off area.
7.2 BUILD ALTERNATIVE
The travel time and cost of trip assumptions defined above for the No Build Alternative were maintained and the characteristics of AirTrain LGA were added to represent the Build Alternative. The model analysis assumed AirTrain LGA to operate with four-minute headways.
The modeled transit travel time to LGA consists of the following components:
Walk time from the origin and wait time at the LIRR or subway station;
In-vehicle or ride time on the LIRR and/or subway;
Intermediate transfer and wait time if multiple transit modes (e.g., subway to LIRR transfer) are needed to reach Willets Point;
Walk time to the AirTrain station at Willets Point;
Wait time for the AirTrain at Willets Point; and
AirTrain LGA in-vehicle time.
The modeled transit travel time from LGA includes the following components:
Wait for the AirTrain at LGA;
AirTrain LGA in-vehicle time;
Walk time to the LIRR or subway at Willets Point;
Wait time for the LIRR or subway at Willets Point;
LIRR or subway in-vehicle time;
18 The completion of the East Side Access Project would enable the MTA to provide regular service to Willets Point, subject to the approval of the MTA Board.
19 For modeling purposes, 18 minutes was used for the LIRR in-vehicle travel time between both New York Penn Station and Grand Central Terminal and Mets-Willets Point. 18 minutes was chosen to be conservative even though most trains for LIRR special event service are currently scheduled at 16 minutes from Penn Station to Mets-Willets Point.
20 The total trip time assumption for airport shuttle service to Rental Cars and Long-Term Parking/Off-Airport Parking was based upon 10 to 13 minutes of travel time and approximately 10 minutes of wait time.
LGA Airport Access Improvement Project 37
Intermediate transfer and wait time if multiple transit modes (e.g., subway to LIRR transfer) are needed to reach Willets Point; and
Walk time between the LIRR or subway station and the destination.
Appendix G shows the modeled transit travel times between selected locations and the airport including all of the components identified above.
Fare policy for the proposed AirTrain LGA service has not yet been determined by PANYNJ. Additionally, various policy proposals are currently under consideration to add congestion pricing at several bridge crossings on roadway routes between LGA and Manhattan. For purposes of this study, no congestion charges on private vehicles, taxis or For Hire Vehicles were assumed due to the uncertainty of the timing and pricing of these potential future policy changes. At this early stage of planning, fares for the proposed AirTrain LGA service were assumed to be consistent with current day fares for AirTrain JFK and AirTrain EWR. A single ride fare of $5.00 (in 2017 dollars), which equates to approximately $5.75 in 2023 dollars, was assumed for both forecast years. Three fare levels were considered: single ride, 10-day pass, and monthly pass. For this study, all air passengers were assumed to use the single-ride pass. Employees were assumed to use either a 10-day pass or a monthly pass, whichever is more economical per-ride based on the average number of days worked in a week. Since many employees work part-time, the 10-day pass might be more economical than a monthly pass.
An additional scenario was developed to test the sensitivity to several key inputs. The sensitivity test assumed a higher AirTrain LGA fare ($8.65 in 2017 dollars), which equates to approximately $10.00 in 2023 dollars. In addition, a $5 surcharge was assumed in this sensitivity analysis for taxi, limousine, and For Hire Vehicle trips at the airport as a proxy for potential future changes in airport ground access pricing policy.

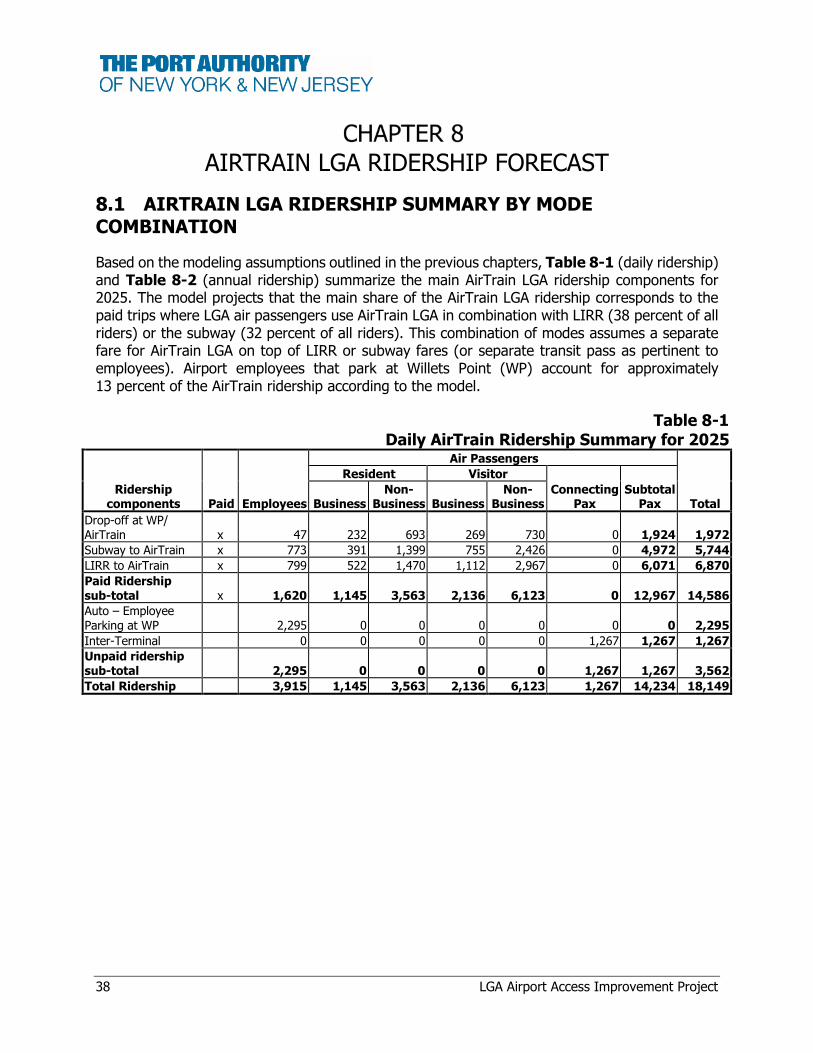
38 LGA Airport Access Improvement Project
AIRTRAIN LGA RIDERSHIP FORECAST
8.1 AIRTRAIN LGA RIDERSHIP SUMMARY BY MODE COMBINATION
Based on the modeling assumptions outlined in the previous chapters, Table 8-1 (daily ridership) and Table 8-2 (annual ridership) summarize the main AirTrain LGA ridership components for 2025. The model projects that the main share of the AirTrain LGA ridership corresponds to the paid trips where LGA air passengers use AirTrain LGA in combination with LIRR (38 percent of all riders) or the subway (32 percent of all riders). This combination of modes assumes a separate fare for AirTrain LGA on top of LIRR or subway fares (or separate transit pass as pertinent to employees). Airport employees that park at Willets Point (WP) account for approximately 13 percent of the AirTrain ridership according to the model.
Table 8-1Daily AirTrain Ridership Summary for 2025
Ridership components Paid Employees
Air Passengers
Total
Resident Visitor
Connecting Pax
Subtotal Pax Business
Non-Business Business
Non-Business
Drop-off at WP/ AirTrain x 47 232 693 269 730 0 1,924 1,972
Subway to AirTrain x 773 391 1,399 755 2,426 0 4,972 5,744
LIRR to AirTrain x 799 522 1,470 1,112 2,967 0 6,071 6,870
Paid Ridership sub-total x 1,620 1,145 3,563 2,136 6,123 0 12,967 14,586
Auto – Employee Parking at WP 2,295 0 0 0 0 0 0 2,295
Inter-Terminal 0 0 0 0 0 1,267 1,267 1,267
Unpaid ridership sub-total 2,295 0 0 0 0 1,267 1,267 3,562
Total Ridership 3,915 1,145 3,563 2,136 6,123 1,267 14,234 18,149
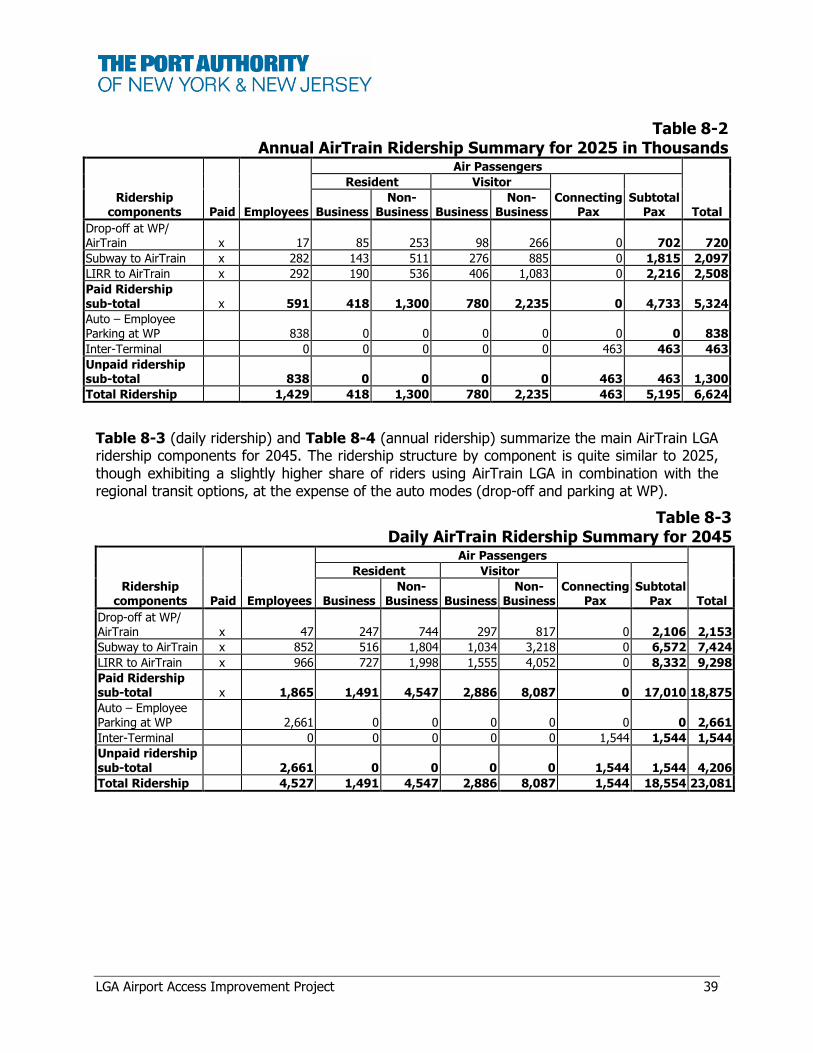
LGA Airport Access Improvement Project 39
Table 8-2Annual AirTrain Ridership Summary for 2025 in Thousands
Ridership components Paid Employees
Air Passengers
Total
Resident Visitor
Connecting Pax
Subtotal Pax Business
Non-Business Business
Non-Business
Drop-off at WP/ AirTrain x 17 85 253 98 266 0 702 720
Subway to AirTrain x 282 143 511 276 885 0 1,815 2,097
LIRR to AirTrain x 292 190 536 406 1,083 0 2,216 2,508
Paid Ridership sub-total x 591 418 1,300 780 2,235 0 4,733 5,324
Auto – Employee Parking at WP 838 0 0 0 0 0 0 838
Inter-Terminal 0 0 0 0 0 463 463 463
Unpaid ridership sub-total 838 0 0 0 0 463 463 1,300
Total Ridership 1,429 418 1,300 780 2,235 463 5,195 6,624
Table 8-3 (daily ridership) and Table 8-4 (annual ridership) summarize the main AirTrain LGA ridership components for 2045. The ridership structure by component is quite similar to 2025, though exhibiting a slightly higher share of riders using AirTrain LGA in combination with the regional transit options, at the expense of the auto modes (drop-off and parking at WP).
Table 8-3Daily AirTrain Ridership Summary for 2045
Ridership components Paid Employees
Air Passengers
Total
Resident Visitor
Connecting Pax
Subtotal Pax Business
Non-Business Business
Non-Business
Drop-off at WP/ AirTrain x 47 247 744 297 817 0 2,106 2,153
Subway to AirTrain x 852 516 1,804 1,034 3,218 0 6,572 7,424
LIRR to AirTrain x 966 727 1,998 1,555 4,052 0 8,332 9,298
Paid Ridership sub-total x 1,865 1,491 4,547 2,886 8,087 0 17,010 18,875
Auto – Employee Parking at WP 2,661 0 0 0 0 0 0 2,661
Inter-Terminal 0 0 0 0 0 1,544 1,544 1,544
Unpaid ridership sub-total 2,661 0 0 0 0 1,544 1,544 4,206
Total Ridership 4,527 1,491 4,547 2,886 8,087 1,544 18,554 23,081
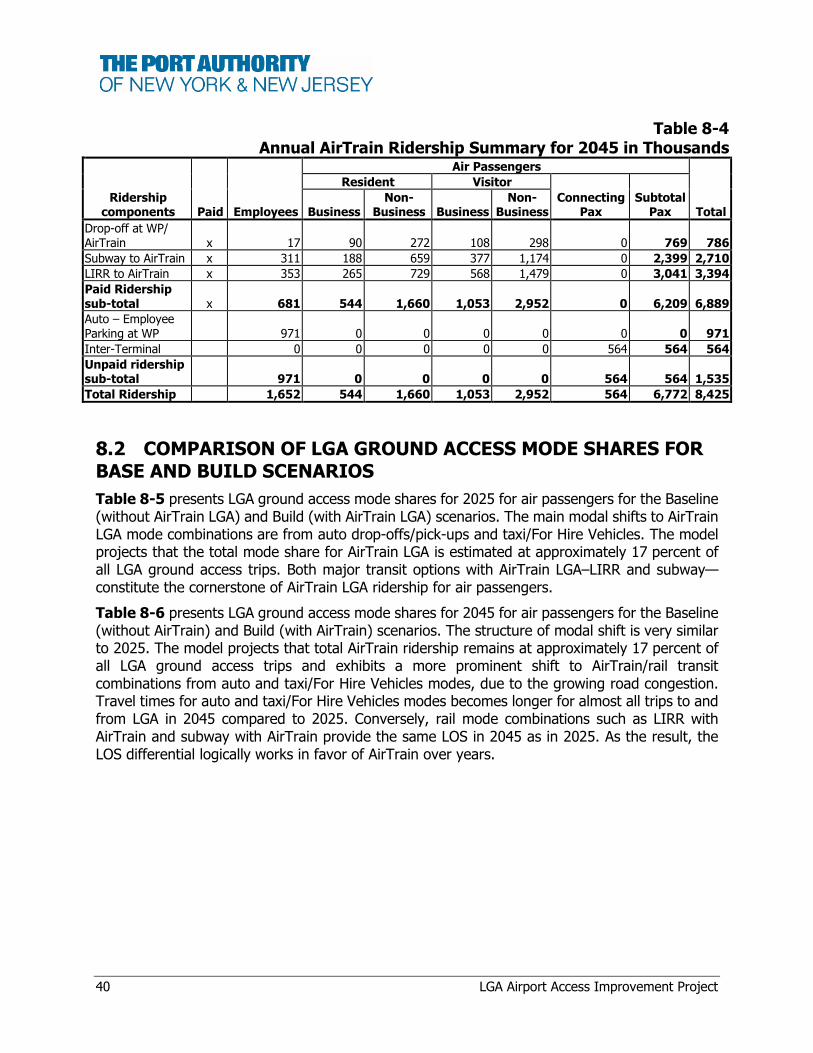
40 LGA Airport Access Improvement Project
Table 8-4Annual AirTrain Ridership Summary for 2045 in Thousands
Ridership components Paid Employees
Air Passengers
Total
Resident Visitor
Connecting Pax
Subtotal Pax Business
Non-Business Business
Non-Business
Drop-off at WP/ AirTrain x 17 90 272 108 298 0 769 786
Subway to AirTrain x 311 188 659 377 1,174 0 2,399 2,710
LIRR to AirTrain x 353 265 729 568 1,479 0 3,041 3,394
Paid Ridership sub-total x 681 544 1,660 1,053 2,952 0 6,209 6,889
Auto – Employee Parking at WP 971 0 0 0 0 0 0 971
Inter-Terminal 0 0 0 0 0 564 564 564
Unpaid ridership sub-total 971 0 0 0 0 564 564 1,535
Total Ridership 1,652 544 1,660 1,053 2,952 564 6,772 8,425
8.2 COMPARISON OF LGA GROUND ACCESS MODE SHARES FOR BASE AND BUILD SCENARIOS
Table 8-5 presents LGA ground access mode shares for 2025 for air passengers for the Baseline (without AirTrain LGA) and Build (with AirTrain LGA) scenarios. The main modal shifts to AirTrain LGA mode combinations are from auto drop-offs/pick-ups and taxi/For Hire Vehicles. The model projects that the total mode share for AirTrain LGA is estimated at approximately 17 percent of all LGA ground access trips. Both major transit options with AirTrain LGA–LIRR and subway—constitute the cornerstone of AirTrain LGA ridership for air passengers.
Table 8-6 presents LGA ground access mode shares for 2045 for air passengers for the Baseline (without AirTrain) and Build (with AirTrain) scenarios. The structure of modal shift is very similar to 2025. The model projects that total AirTrain ridership remains at approximately 17 percent of all LGA ground access trips and exhibits a more prominent shift to AirTrain/rail transit combinations from auto and taxi/For Hire Vehicles modes, due to the growing road congestion. Travel times for auto and taxi/For Hire Vehicles modes becomes longer for almost all trips to and from LGA in 2045 compared to 2025. Conversely, rail mode combinations such as LIRR with AirTrain and subway with AirTrain provide the same LOS in 2045 as in 2025. As the result, the LOS differential logically works in favor of AirTrain over years.
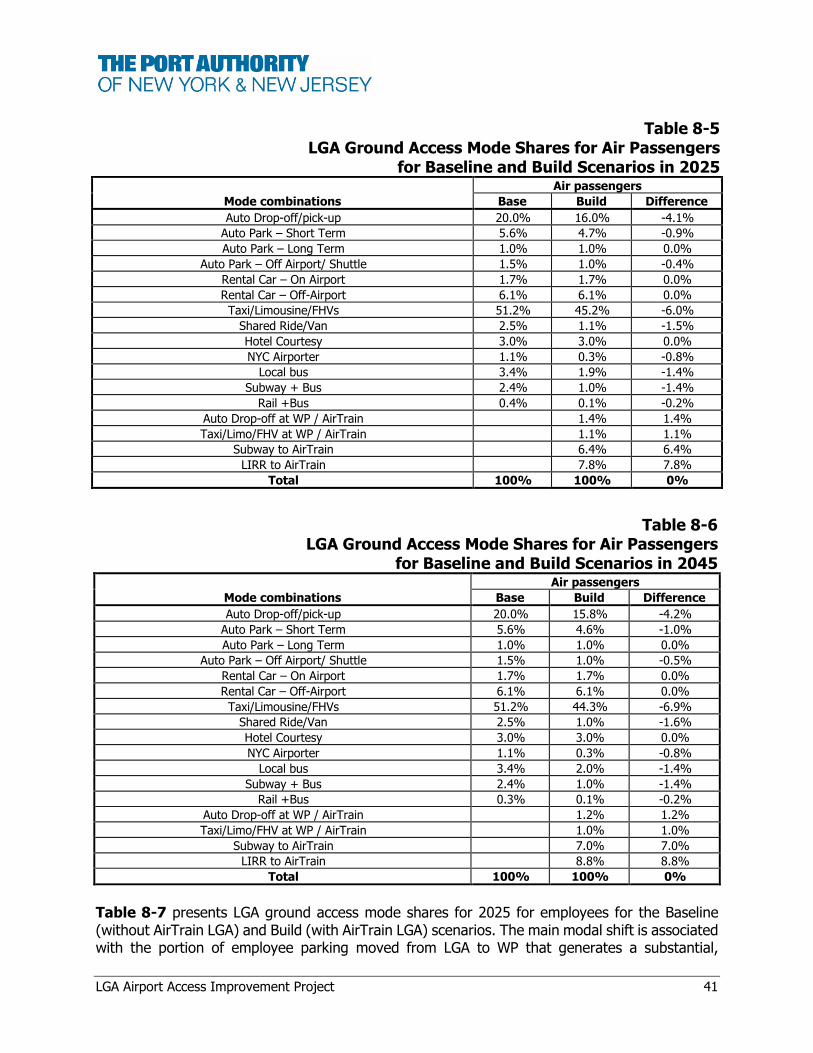
LGA Airport Access Improvement Project 41
Table 8-5LGA Ground Access Mode Shares for Air Passengers
for Baseline and Build Scenarios in 2025
Mode combinations
Air passengers
Base Build Difference
Auto Drop-off/pick-up 20.0% 16.0% -4.1%
Auto Park – Short Term 5.6% 4.7% -0.9%
Auto Park – Long Term 1.0% 1.0% 0.0%
Auto Park – Off Airport/ Shuttle 1.5% 1.0% -0.4%
Rental Car – On Airport 1.7% 1.7% 0.0%
Rental Car – Off-Airport 6.1% 6.1% 0.0%
Taxi/Limousine/FHVs 51.2% 45.2% -6.0%
Shared Ride/Van 2.5% 1.1% -1.5%
Hotel Courtesy 3.0% 3.0% 0.0%
NYC Airporter 1.1% 0.3% -0.8%
Local bus 3.4% 1.9% -1.4%
Subway + Bus 2.4% 1.0% -1.4%
Rail +Bus 0.4% 0.1% -0.2%
Auto Drop-off at WP / AirTrain 1.4% 1.4%
Taxi/Limo/FHV at WP / AirTrain 1.1% 1.1%
Subway to AirTrain 6.4% 6.4%
LIRR to AirTrain 7.8% 7.8%
Total 100% 100% 0%
Table 8-6LGA Ground Access Mode Shares for Air Passengers
for Baseline and Build Scenarios in 2045
Mode combinations
Air passengers
Base Build Difference
Auto Drop-off/pick-up 20.0% 15.8% -4.2%
Auto Park – Short Term 5.6% 4.6% -1.0%
Auto Park – Long Term 1.0% 1.0% 0.0%
Auto Park – Off Airport/ Shuttle 1.5% 1.0% -0.5%
Rental Car – On Airport 1.7% 1.7% 0.0%
Rental Car – Off-Airport 6.1% 6.1% 0.0%
Taxi/Limousine/FHVs 51.2% 44.3% -6.9%
Shared Ride/Van 2.5% 1.0% -1.6%
Hotel Courtesy 3.0% 3.0% 0.0%
NYC Airporter 1.1% 0.3% -0.8%
Local bus 3.4% 2.0% -1.4%
Subway + Bus 2.4% 1.0% -1.4%
Rail +Bus 0.3% 0.1% -0.2%
Auto Drop-off at WP / AirTrain 1.2% 1.2%
Taxi/Limo/FHV at WP / AirTrain 1.0% 1.0%
Subway to AirTrain 7.0% 7.0%
LIRR to AirTrain 8.8% 8.8%
Total 100% 100% 0%
Table 8-7 presents LGA ground access mode shares for 2025 for employees for the Baseline (without AirTrain LGA) and Build (with AirTrain LGA) scenarios. The main modal shift is associated with the portion of employee parking moved from LGA to WP that generates a substantial,

42 LGA Airport Access Improvement Project
although non-paid, AirTrain LGA ridership. Another important modal shift relates to the AirTrain LGA connections with LIRR and subway at the expense of local bus and subway (with local bus transfers).
Table 8-7LGA Ground Access Mode Shares for Employees Baseline and Build Scenarios
in 2025
Mode combinations
Employees
Base Build Difference
Auto Driver – Park at Employee/P10 lot 44.4% 29.0% -15.3%
Auto Passenger – Park at Employee/P10 lot 1.0% 0.7% -0.3%
Auto Driver – Park elsewhere 11.4% 11.4% 0.0%
Auto Passenger – Park elsewhere 0.6% 0.6% 0.0%
Taxis/FHV 1.3% 0.7% -0.5%
NYC Airporter 0.4% 0.0% -0.4%
Bus 20.7% 16.6% -4.1%
Subway + Bus 17.9% 12.3% -5.6%
LIRR + Bus/Taxi 1.4% 0.7% -0.7%
Non-Motorized 1.0% 1.0% 0.0%
Auto Driver – Empl Parking at WP 15.5% 15.5%
Auto Passenger – Empl Parking at WP 0.3% 0.3%
Taxi/Limo/FHV at WP/AirTrain 0.3% 0.3%
Subway to AirTrain 5.3% 5.3%
LIRR to AirTrain 5.5% 5.5%
Total 100% 100% 0%
Table 8-8 presents LGA ground access mode shares for 2045 for employees for the Base (without AirTrain LGA) and Build (with AirTrain LGA) scenarios. The modal shifts are similar to 2025 with a slightly more prominent shift from the existing transit options to the new transit options provided by the AirTrain LGA combinations with LIRR and subway.
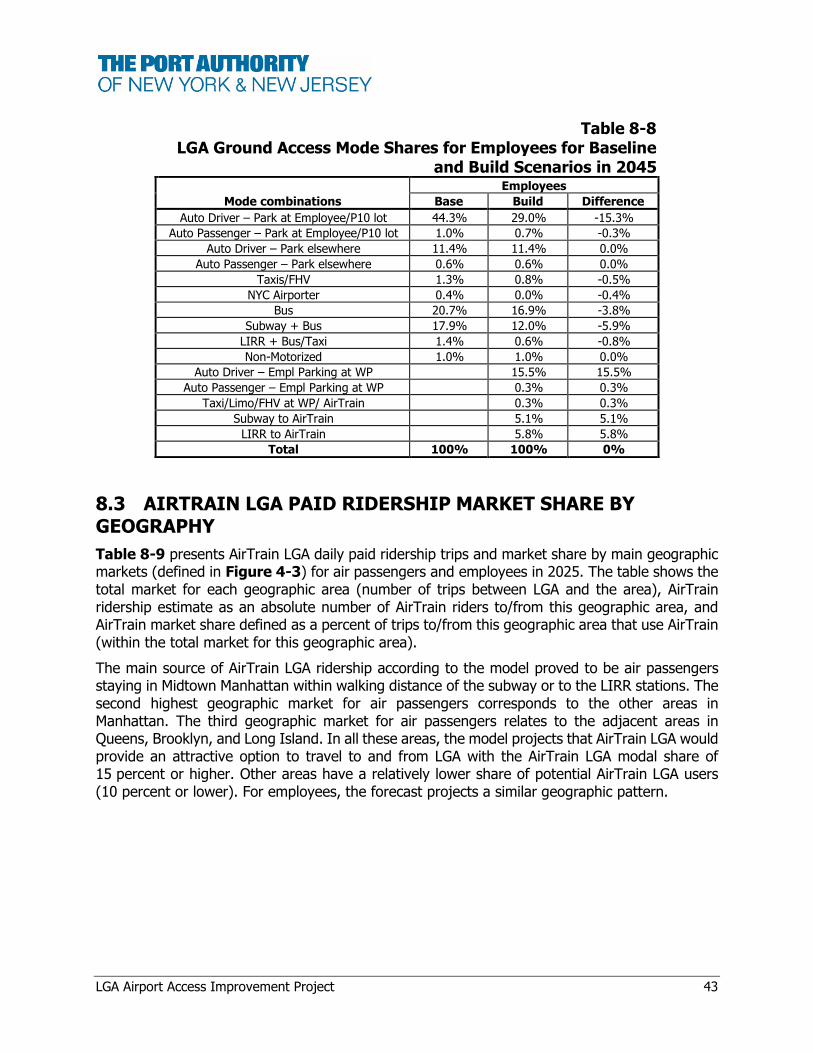
LGA Airport Access Improvement Project 43
Table 8-8LGA Ground Access Mode Shares for Employees for Baseline
and Build Scenarios in 2045
Mode combinations
Employees
Base Build Difference
Auto Driver – Park at Employee/P10 lot 44.3% 29.0% -15.3%
Auto Passenger – Park at Employee/P10 lot 1.0% 0.7% -0.3%
Auto Driver – Park elsewhere 11.4% 11.4% 0.0%
Auto Passenger – Park elsewhere 0.6% 0.6% 0.0%
Taxis/FHV 1.3% 0.8% -0.5%
NYC Airporter 0.4% 0.0% -0.4%
Bus 20.7% 16.9% -3.8%
Subway + Bus 17.9% 12.0% -5.9%
LIRR + Bus/Taxi 1.4% 0.6% -0.8%
Non-Motorized 1.0% 1.0% 0.0%
Auto Driver – Empl Parking at WP 15.5% 15.5%
Auto Passenger – Empl Parking at WP 0.3% 0.3%
Taxi/Limo/FHV at WP/ AirTrain 0.3% 0.3%
Subway to AirTrain 5.1% 5.1%
LIRR to AirTrain 5.8% 5.8%
Total 100% 100% 0%
8.3 AIRTRAIN LGA PAID RIDERSHIP MARKET SHARE BY GEOGRAPHY
Table 8-9 presents AirTrain LGA daily paid ridership trips and market share by main geographic markets (defined in Figure 4-3) for air passengers and employees in 2025. The table shows the total market for each geographic area (number of trips between LGA and the area), AirTrain ridership estimate as an absolute number of AirTrain riders to/from this geographic area, and AirTrain market share defined as a percent of trips to/from this geographic area that use AirTrain (within the total market for this geographic area).
The main source of AirTrain LGA ridership according to the model proved to be air passengers staying in Midtown Manhattan within walking distance of the subway or to the LIRR stations. The second highest geographic market for air passengers corresponds to the other areas in Manhattan. The third geographic market for air passengers relates to the adjacent areas in Queens, Brooklyn, and Long Island. In all these areas, the model projects that AirTrain LGA would provide an attractive option to travel to and from LGA with the AirTrain LGA modal share of 15 percent or higher. Other areas have a relatively lower share of potential AirTrain LGA users (10 percent or lower). For employees, the forecast projects a similar geographic pattern.
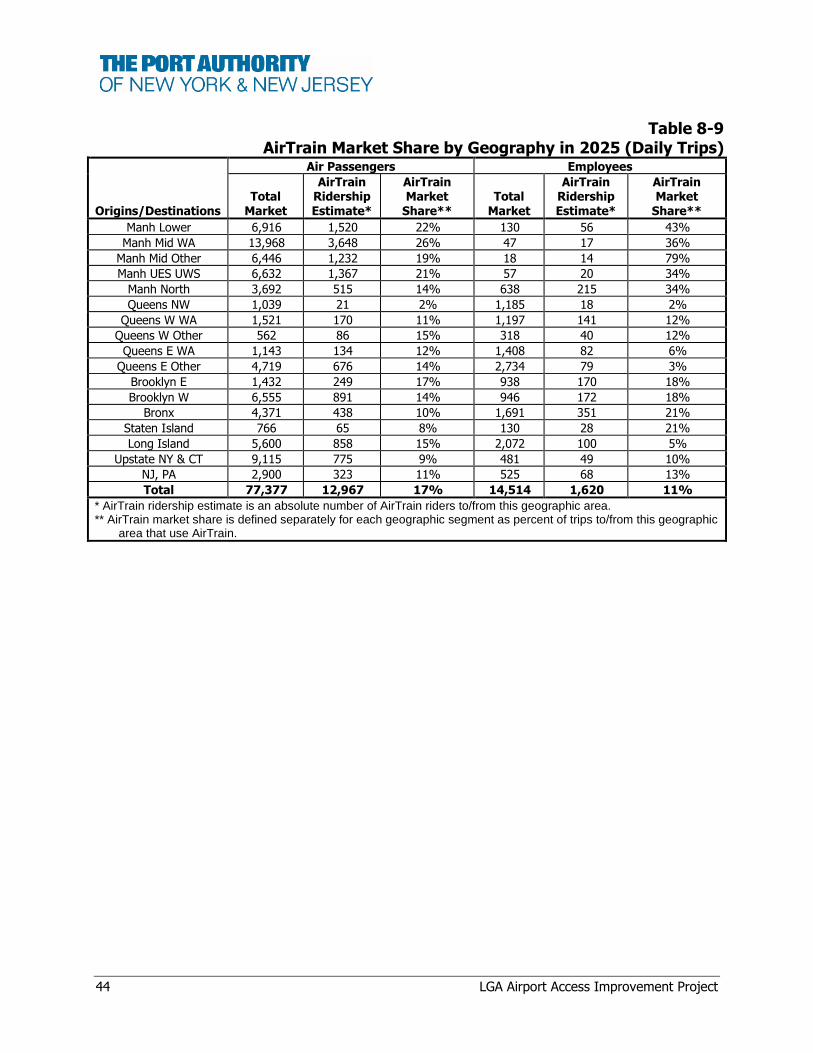
44 LGA Airport Access Improvement Project
Table 8-9AirTrain Market Share by Geography in 2025 (Daily Trips)
Origins/Destinations
Air Passengers Employees
Total Market
AirTrain Ridership Estimate*
AirTrain Market
Share** Total
Market
AirTrain Ridership Estimate*
AirTrain Market
Share**
Manh Lower 6,916 1,520 22% 130 56 43%
Manh Mid WA 13,968 3,648 26% 47 17 36%
Manh Mid Other 6,446 1,232 19% 18 14 79%
Manh UES UWS 6,632 1,367 21% 57 20 34%
Manh North 3,692 515 14% 638 215 34%
Queens NW 1,039 21 2% 1,185 18 2%
Queens W WA 1,521 170 11% 1,197 141 12%
Queens W Other 562 86 15% 318 40 12%
Queens E WA 1,143 134 12% 1,408 82 6%
Queens E Other 4,719 676 14% 2,734 79 3%
Brooklyn E 1,432 249 17% 938 170 18%
Brooklyn W 6,555 891 14% 946 172 18%
Bronx 4,371 438 10% 1,691 351 21%
Staten Island 766 65 8% 130 28 21%
Long Island 5,600 858 15% 2,072 100 5%
Upstate NY & CT 9,115 775 9% 481 49 10%
NJ, PA 2,900 323 11% 525 68 13%
Total 77,377 12,967 17% 14,514 1,620 11%
* AirTrain ridership estimate is an absolute number of AirTrain riders to/from this geographic area. ** AirTrain market share is defined separately for each geographic segment as percent of trips to/from this geographic
area that use AirTrain.
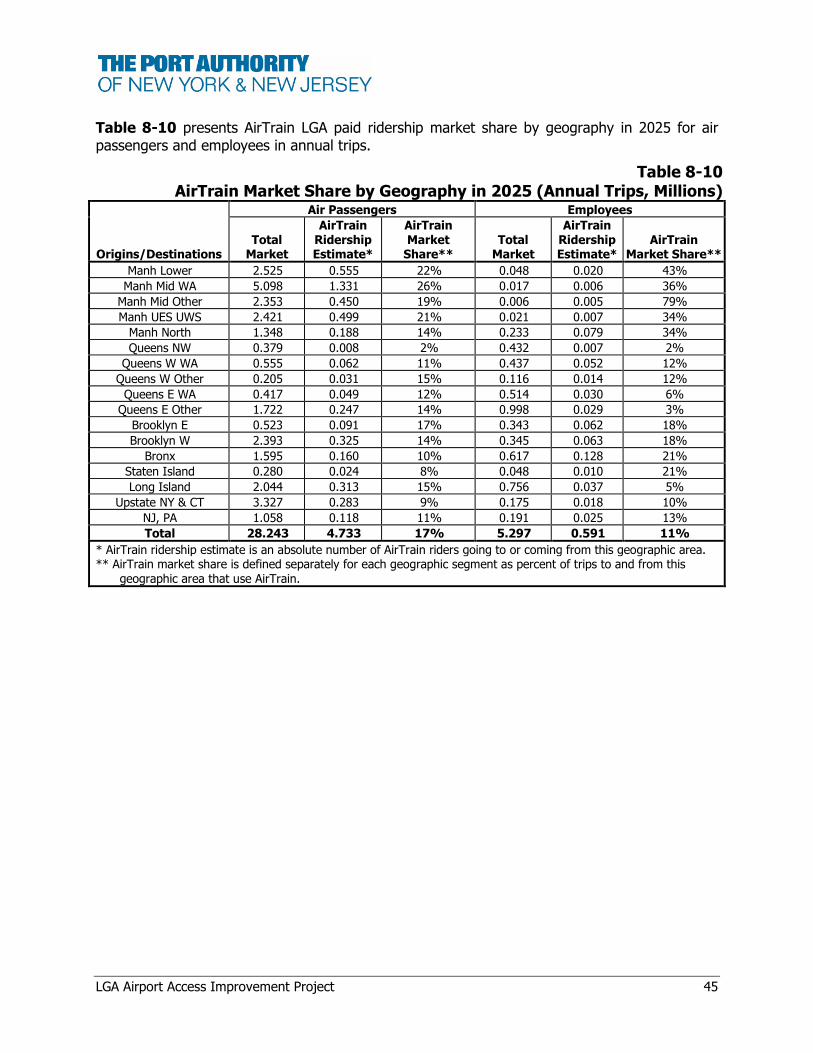
LGA Airport Access Improvement Project 45
Table 8-10 presents AirTrain LGA paid ridership market share by geography in 2025 for air passengers and employees in annual trips.
Table 8-10AirTrain Market Share by Geography in 2025 (Annual Trips, Millions)
Origins/Destinations
Air Passengers Employees
Total Market
AirTrain Ridership Estimate*
AirTrain Market
Share** Total
Market
AirTrain Ridership Estimate*
AirTrain Market Share**
Manh Lower 2.525 0.555 22% 0.048 0.020 43%
Manh Mid WA 5.098 1.331 26% 0.017 0.006 36%
Manh Mid Other 2.353 0.450 19% 0.006 0.005 79%
Manh UES UWS 2.421 0.499 21% 0.021 0.007 34%
Manh North 1.348 0.188 14% 0.233 0.079 34%
Queens NW 0.379 0.008 2% 0.432 0.007 2%
Queens W WA 0.555 0.062 11% 0.437 0.052 12%
Queens W Other 0.205 0.031 15% 0.116 0.014 12%
Queens E WA 0.417 0.049 12% 0.514 0.030 6%
Queens E Other 1.722 0.247 14% 0.998 0.029 3%
Brooklyn E 0.523 0.091 17% 0.343 0.062 18%
Brooklyn W 2.393 0.325 14% 0.345 0.063 18%
Bronx 1.595 0.160 10% 0.617 0.128 21%
Staten Island 0.280 0.024 8% 0.048 0.010 21%
Long Island 2.044 0.313 15% 0.756 0.037 5%
Upstate NY & CT 3.327 0.283 9% 0.175 0.018 10%
NJ, PA 1.058 0.118 11% 0.191 0.025 13%
Total 28.243 4.733 17% 5.297 0.591 11%
* AirTrain ridership estimate is an absolute number of AirTrain riders going to or coming from this geographic area. ** AirTrain market share is defined separately for each geographic segment as percent of trips to and from this
geographic area that use AirTrain.
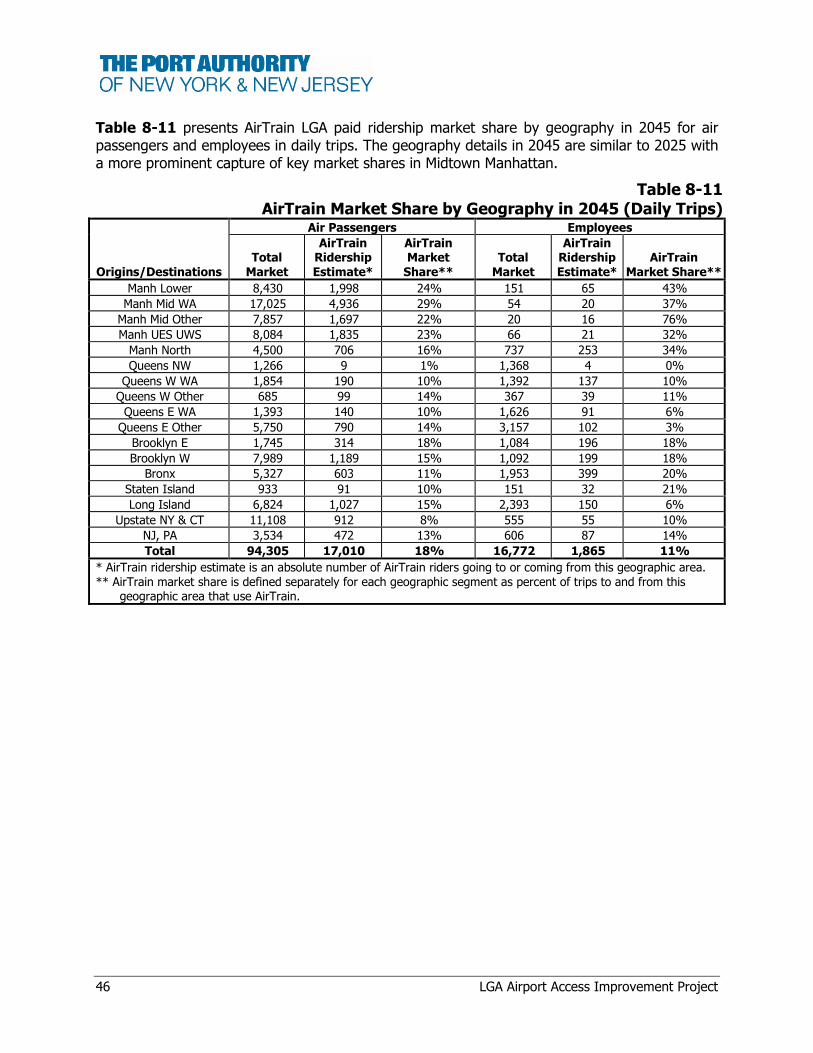
46 LGA Airport Access Improvement Project
Table 8-11 presents AirTrain LGA paid ridership market share by geography in 2045 for air passengers and employees in daily trips. The geography details in 2045 are similar to 2025 with a more prominent capture of key market shares in Midtown Manhattan.
Table 8-11AirTrain Market Share by Geography in 2045 (Daily Trips)
Origins/Destinations
Air Passengers Employees
Total Market
AirTrain Ridership Estimate*
AirTrain Market
Share** Total
Market
AirTrain Ridership Estimate*
AirTrain Market Share**
Manh Lower 8,430 1,998 24% 151 65 43%
Manh Mid WA 17,025 4,936 29% 54 20 37%
Manh Mid Other 7,857 1,697 22% 20 16 76%
Manh UES UWS 8,084 1,835 23% 66 21 32%
Manh North 4,500 706 16% 737 253 34%
Queens NW 1,266 9 1% 1,368 4 0%
Queens W WA 1,854 190 10% 1,392 137 10%
Queens W Other 685 99 14% 367 39 11%
Queens E WA 1,393 140 10% 1,626 91 6%
Queens E Other 5,750 790 14% 3,157 102 3%
Brooklyn E 1,745 314 18% 1,084 196 18%
Brooklyn W 7,989 1,189 15% 1,092 199 18%
Bronx 5,327 603 11% 1,953 399 20%
Staten Island 933 91 10% 151 32 21%
Long Island 6,824 1,027 15% 2,393 150 6%
Upstate NY & CT 11,108 912 8% 555 55 10%
NJ, PA 3,534 472 13% 606 87 14%
Total 94,305 17,010 18% 16,772 1,865 11%
* AirTrain ridership estimate is an absolute number of AirTrain riders going to or coming from this geographic area. ** AirTrain market share is defined separately for each geographic segment as percent of trips to and from this
geographic area that use AirTrain.

LGA Airport Access Improvement Project 47
Table 8-12 presents AirTrain LGA paid ridership market share by geography in 2045 for air passengers and employees in annual trips.
Table 8-12AirTrain Market Share by Geography in 2045 (Annual Trips)
Origins/Destinations
Air Passengers Employees
Total Market
AirTrain Ridership Estimate*
AirTrain Market
Share** Total
Market
AirTrain Ridership Estimate*
AirTrain Market
Share**
Manh Lower 3.077 0.729 24% 0.055 0.024 43%
Manh Mid WA 6.214 1.802 29% 0.020 0.007 37%
Manh Mid Other 2.868 0.619 22% 0.007 0.006 76%
Manh UES UWS 2.951 0.670 23% 0.024 0.008 32%
Manh North 1.642 0.258 16% 0.269 0.092 34%
Queens NW 0.462 0.003 1% 0.499 0.002 0%
Queens W WA 0.677 0.070 10% 0.508 0.050 10%
Queens W Other 0.250 0.036 14% 0.134 0.014 11%
Queens E WA 0.509 0.051 10% 0.593 0.033 6%
Queens E Other 2.099 0.288 14% 1.152 0.037 3%
Brooklyn E 0.637 0.115 18% 0.396 0.071 18%
Brooklyn W 2.916 0.434 15% 0.399 0.072 18%
Bronx 1.944 0.220 11% 0.713 0.146 20%
Staten Island 0.341 0.033 10% 0.055 0.012 21%
Long Island 2.491 0.375 15% 0.873 0.055 6%
Upstate NY & CT 4.054 0.333 8% 0.203 0.020 10%
NJ, PA 1.290 0.172 13% 0.221 0.032 14%
Total 34.421 6.209 18% 6.122 0.681 11%
* AirTrain ridership estimate is an absolute number of AirTrain riders going to or coming from this geographic area. ** AirTrain market share is defined separately for each geographic segment as percent of trips to and from this
geographic area that use AirTrain.
8.4 MODE SWITCHES FROM THE EXISTING MODES TO AIRTRAIN LGA
Table 8-13 presents detailed mode switches from the existing modes to AirTrain LGA for air passengers in 2025. In this detailed table view, rows represent existing modes in the Baseline scenario and columns represents existing and new modes (the last shaded columns) in the Build scenario. Since the Baseline scenario corresponds to the equilibrated mode choices in 2025 or 2045 given the LOS pertinent to these future years, the switches only occur from the existing modes to new modes and not between the existing modes. The model indicates that the most important switches correspond to taxi/For Hire Vehicle users to AirTrain LGA in combination with LIRR or the subway; however, many other existing modes lose their share to AirTrain LGA, including auto drop-offs and practically all existing transit modes.
Table 8-14 presents detailed mode switches from the existing modes to AirTrain LGA for air passengers in 2045.
Table 8-15 presents detailed mode switches from the existing modes to AirTrain LGA for employees in 2025. The logic of the switching table for employees is the same as for air passengers, but the subset of available modes is different (as was listed in Table 5-1) and explained in the corresponding section. The major modal shift relates to the moving of a portion
48 LGA Airport Access Improvement Project
of employee parking from LGA to WP (unpaid AirTrain ridership) and switching from the existing transit modes (bus, subway, and LIRR with the current bus access to LGA) to the subway or LIRR connection with AirTrain LGA.
Table 8-16 presents detailed mode switches from the existing modes to AirTrain LGA for air passengers in 2045.
8.5 RIDERSHIP SENSITIVITY TEST RESULTS
An additional test was run to analyze the sensitivity of ridership to changes in key financial inputs. Based on this analysis, the model indicates that a higher AirTrain fare of $8.65 (in 2017 dollars) and a $5 surcharge for taxi, limousine, and For Hire Vehicle trips would result in an overall three percent reduction in total trips on AirTrain LGA. The largest reduction in trips compared to the base scenario would occur in the resident non-business market at 5.5 percent. By comparison, the reduction of visitor-business trips would be about two percent. Employee trips would be reduced by about 1.5 percent.
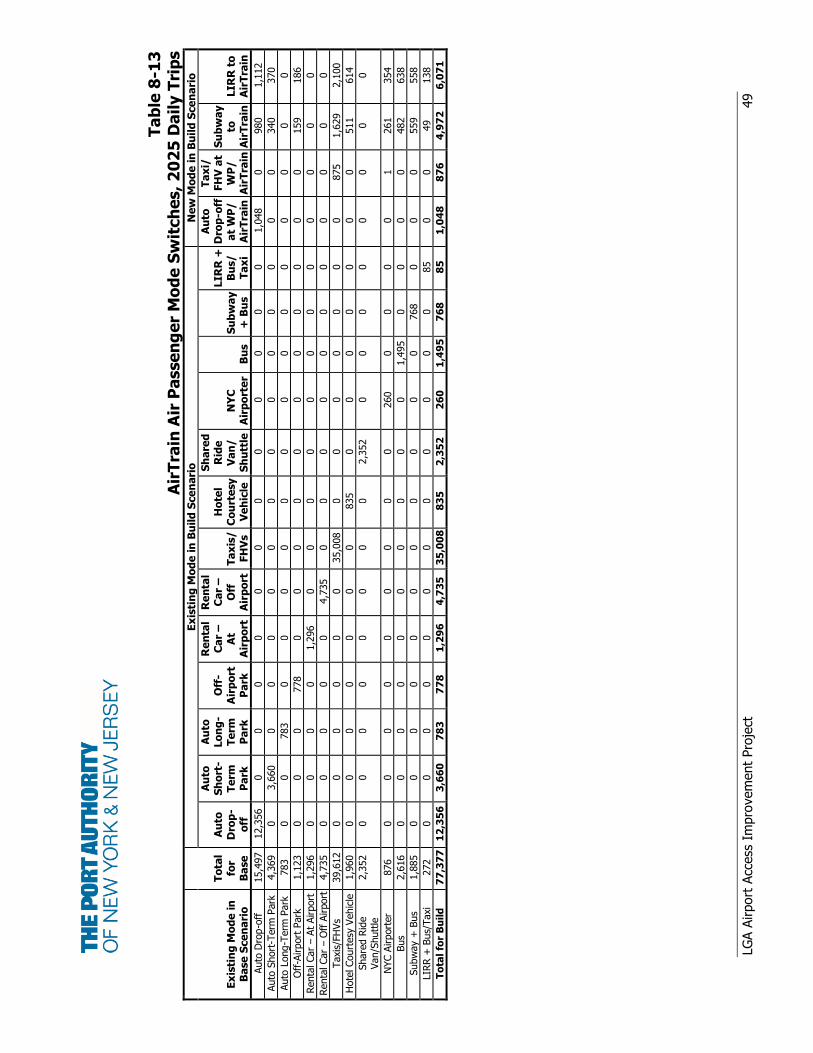
LGA A
irport
Acc
ess
Im
pro
vem
ent
Pro
ject
49
Ta
ble
8-1
3A
irT
rain
Air
Pa
sse
ng
er
Mo
de
Sw
itch
es,
20
25
Da
ily T
rip
s
Ex
isti
ng
Mo
de
in
B
ase
Sce
na
rio
To
tal
for
Ba
se
Ex
isti
ng
Mo
de
in
Bu
ild
Sce
nari
oN
ew
Mo
de
in
Bu
ild
Sce
na
rio
Au
to
Dro
p-
off
Au
to
Sh
ort
-T
erm
P
ark
Au
to
Lo
ng
-T
erm
P
ark
Off
-A
irp
ort
P
ark
Re
nta
l C
ar
–
At
Air
po
rt
Re
nta
l C
ar
–
Off
A
irp
ort
Ta
xis
/
FH
Vs
Ho
tel
Co
urt
esy
V
eh
icle
Sh
are
d
Rid
e
Va
n/
Sh
utt
leN
YC
A
irp
ort
er
Bu
s
Su
bw
ay
+ B
us
LIR
R +
B
us/
Ta
xi
Au
to
Dro
p-o
ff
at
WP
/
Air
Tra
in
Ta
xi/
FH
V a
t W
P/
Air
Tra
in
Su
bw
ay
to
Air
Tra
inLIR
R t
o
Air
Tra
in
Auto
Dro
p-o
ff15,4
97
12,3
56
00
00
00
00
00
00
1,0
48
0980
1,1
12
Auto
Short
-Term
Park
4,3
69
03,6
60
00
00
00
00
00
00
0340
370
Auto
Long-T
erm
Park
783
00
783
00
00
00
00
00
00
00
Off
-Airport
Park
1,1
23
00
0778
00
00
00
00
00
0159
186
Renta
l Car
–At
Airport
1,2
96
00
00
1,2
96
00
00
00
00
00
00
Renta
l Car
–O
ff A
irport
4,7
35
00
00
04,7
35
00
00
00
00
00
0
Taxi
s/FH
Vs
39,6
12
00
00
00
35,0
08
00
00
00
0875
1,6
29
2,1
00
Hote
l Court
esy
Vehic
le1,9
60
00
00
00
0835
00
00
00
0511
614
Share
d R
ide
Van/S
hutt
le
2,3
52
00
00
00
00
2,3
52
00
00
00
00
NYC A
irport
er
876
00
00
00
00
0260
00
00
1261
354
Bus
2,6
16
00
00
00
00
00
1,4
95
00
00
482
638
Subw
ay
+ B
us
1,8
85
00
00
00
00
00
0768
00
0559
558
LIRR +
Bus/
Taxi
272
00
00
00
00
00
00
85
00
49
138
To
tal
for
Bu
ild
77
,37
71
2,3
56
3,6
60
78
37
78
1,2
96
4,7
35
35
,00
88
35
2,3
52
26
01
,49
57
68
85
1,0
48
87
64
,97
26
,07
1
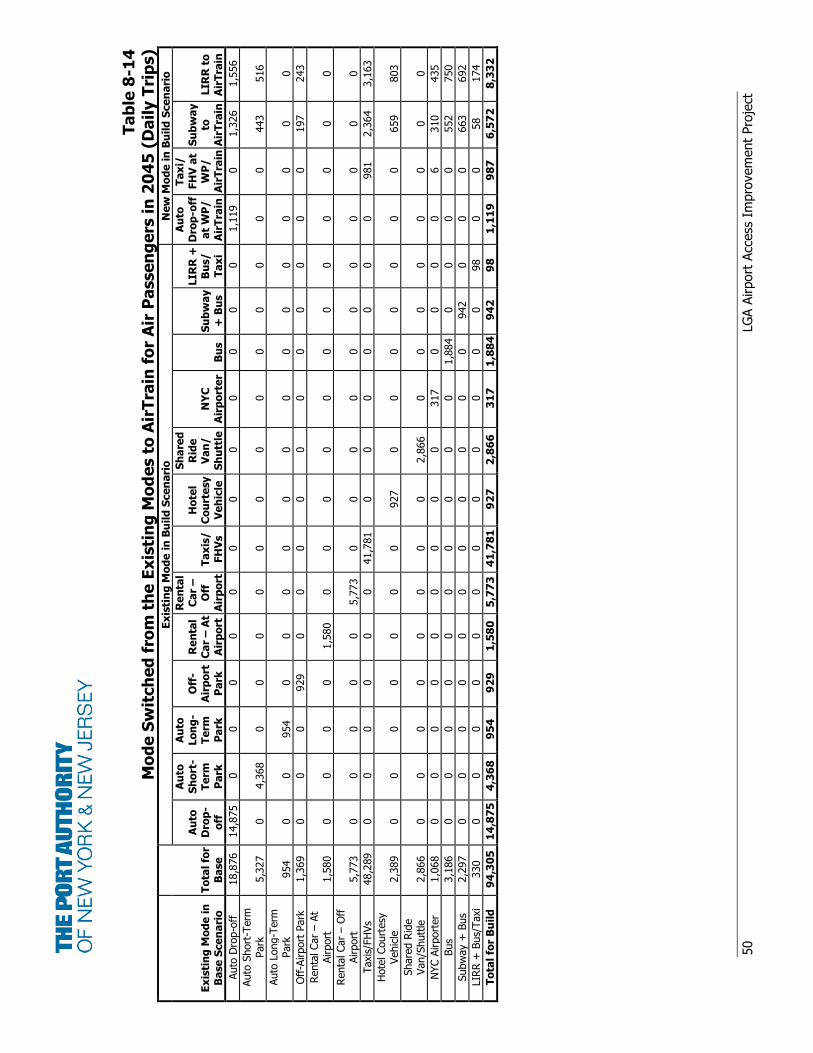
50
LGA A
irport
Acc
ess
Im
pro
vem
ent
Pro
ject
Ta
ble
8-1
4M
od
e S
wit
ch
ed
fro
m t
he
Ex
isti
ng
Mo
de
s t
o A
irT
rain
fo
r A
ir P
asse
ng
ers
in
20
45
(D
ail
y T
rip
s)
Ex
isti
ng
Mo
de
in
B
ase
Sce
na
rio
T
ota
l fo
r B
ase
Ex
isti
ng
Mo
de
in
Bu
ild
Sce
nari
oN
ew
Mo
de
in
Bu
ild
Sce
na
rio
Au
to
Dro
p-
off
Au
to
Sh
ort
-T
erm
P
ark
Au
to
Lo
ng
-T
erm
P
ark
Off
-A
irp
ort
P
ark
Re
nta
l C
ar
– A
t A
irp
ort
Re
nta
l C
ar
–
Off
A
irp
ort
Ta
xis
/
FH
Vs
Ho
tel
Co
urt
esy
V
eh
icle
Sh
are
d
Rid
e
Va
n/
Sh
utt
leN
YC
A
irp
ort
er
Bu
s
Su
bw
ay
+ B
us
LIR
R +
B
us/
Ta
xi
Au
to
Dro
p-o
ff
at
WP
/
Air
Tra
in
Ta
xi/
FH
V a
t W
P/
Air
Tra
in
Su
bw
ay
to
Air
Tra
inLIR
R t
o
Air
Tra
in
Auto
Dro
p-o
ff18,8
76
14,8
75
00
00
00
00
00
00
1,1
19
01,3
26
1,5
56
Auto
Short
-Term
Park
5,3
27
0
4,3
68
0
0
0
0
0
0
0
0
0
0
0
0
0
443
516
Auto
Long-T
erm
Park
954
0
0
954
0
0
0
0
0
0
0
0
0
0
0
0
0
0
Off
-Airport
Park
1,3
69
00
0929
00
00
00
00
00
0197
243
Renta
l Car
–At
Airport
1,5
80
0
0
0
0
1,5
80
0
0
0
0
0
0
0
0
0
0
0
0
Renta
l Car
–O
ff
Airport
5,7
73
0
0
0
0
0
5,7
73
0
0
0
0
0
0
0
0
0
0
0
Taxi
s/FH
Vs
48,2
89
00
00
00
41,7
81
00
00
00
0981
2,3
64
3,1
63
Hote
l Court
esy
Vehic
le
2,3
89
0
0
0
0
0
0
0
927
0
0
0
0
0
0
0
659
803
Share
d R
ide
Van/S
hutt
le
2,8
66
0
0
0
0
0
0
0
0
2,8
66
0
0
0
0
0
0
0
0
NYC A
irport
er
1,0
68
00
00
00
00
0317
00
00
6310
435
Bus
3,1
86
00
00
00
00
00
1,8
84
00
00
552
750
Subw
ay
+ B
us
2,2
97
00
00
00
00
00
0942
00
0663
692
LIR
R +
Bus/
Taxi
330
00
00
00
00
00
00
98
00
58
174
To
tal
for
Bu
ild
94
,30
51
4,8
75
4,3
68
95
49
29
1,5
80
5,7
73
41
,78
19
27
2,8
66
31
71
,88
49
42
98
1,1
19
98
76
,57
28
,33
2

LGA A
irport
Acc
ess
Im
pro
vem
ent
Pro
ject
51
Ta
ble
8-1
5M
od
e S
wit
ch
ed
fro
m t
he
Ex
isti
ng
Mo
de
s t
o A
irT
rain
fo
r E
mp
loye
es i
n 2
02
5 (
Da
ily T
rip
s)
Ex
isti
ng
Mo
de
in
B
ase
Sce
na
rio
T
ota
l fo
r B
ase
Ex
isti
ng
Mo
de
in
Bu
ild
Sce
nari
oN
ew
Mo
de
in
Bu
ild
Sce
na
rio
Au
to D
rive
r –
Pa
rk a
t E
mp
loye
e/
P1
0 l
ot
Au
to
Pa
sse
ng
er
– P
ark
at
Em
plo
ye
e/
P1
0 l
ot
Au
to
Dri
ve
r –
P
ark
e
lse
wh
ere
Au
to
Pa
sse
ng
er
–P
ark
e
lse
wh
ere
Ta
xis
/
FH
Vs
NY
C
Air
po
rte
rB
us
Su
bw
ay
+ B
us
LIR
R +
B
us/
Ta
xi
No
n-
Mo
tori
ze
d
Au
to
Dri
ve
r-E
mp
l P
ark
ing
a
t W
P
Au
to
Pa
sse
ng
er-
Em
pl
Pa
rkin
g
at
WP
Ta
xi/
FH
V a
t W
P/
Air
Tra
in
Su
bw
ay
to
Air
Tra
inLIR
R t
o
Air
Tra
in
Auto
Drive
r –
Park
at
Em
plo
yee/P
10 lot
6,4
39
4,2
12
0
0
0
0
0
0
0
0
0
2,2
20
0
0
1
5
Auto
Pass
enger
–Park
at
Em
plo
yee/P
10 lot
143
0
95
0
0
0
0
0
0
0
0
0
48
0
0
0
Auto
Drive
r – P
ark
els
ew
here
1,6
52
0
0
1,6
52
0
0
0
0
0
0
0
0
0
0
0
0
Auto
Pass
enger
–Park
els
ew
here
83
0
0
0
83
0
0
0
0
0
0
0
0
0
0
0
Taxi
s/FH
Vs
184
00
00
108
00
00
027
047
12
NYC A
irport
er
52
00
00
01
00
00
00
024
27
Bus
3,0
08
00
00
00
2,4
15
00
00
00
338
254
Subw
ay
+ B
us
2,6
04
00
00
00
01,7
90
00
00
0399
414
LIR
R +
Bus/
Taxi
205
00
00
00
00
99
00
00
997
Non-M
oto
rize
d144
00
00
00
00
0144
00
00
0
To
tal
for
Bu
ild
14
,51
44
,21
29
51
,65
28
31
08
12
,41
51
,79
09
91
44
2,2
47
48
47
77
37
99
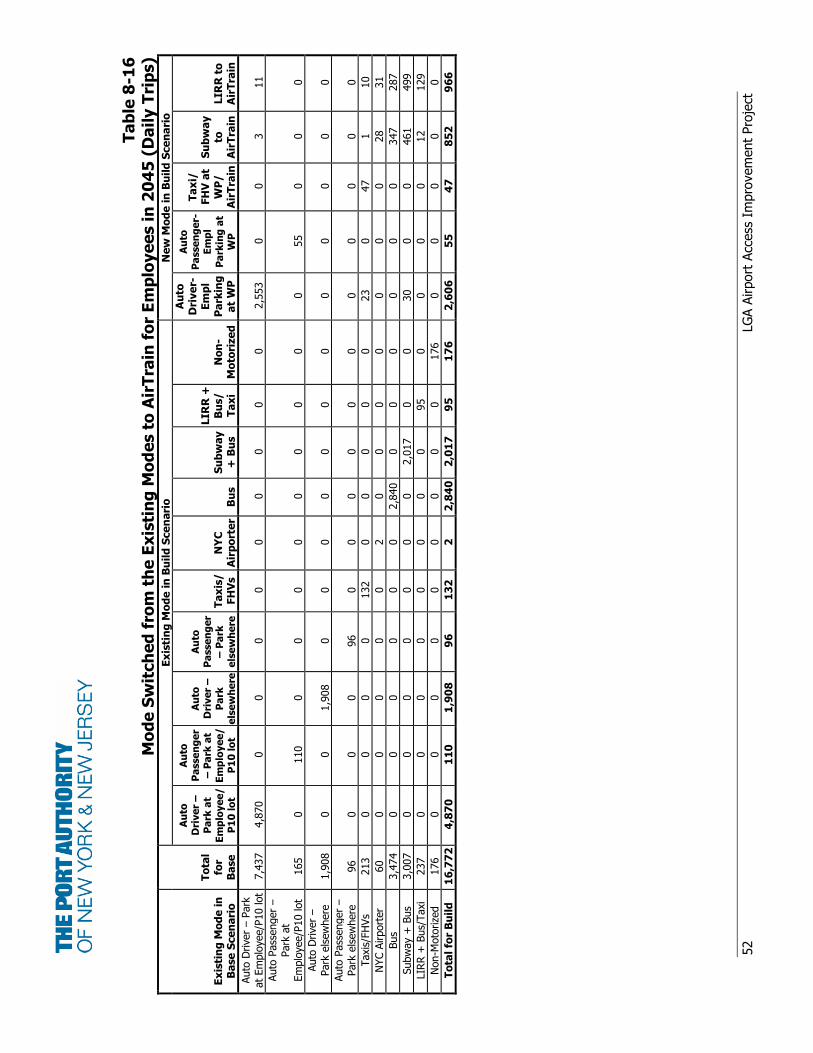
52
LGA A
irport
Acc
ess
Im
pro
vem
ent
Pro
ject
Ta
ble
8-1
6M
od
e S
wit
ch
ed
fro
m t
he
Ex
isti
ng
Mo
de
s t
o A
irT
rain
fo
r E
mp
loye
es i
n 2
04
5 (
Da
ily T
rip
s)
Ex
isti
ng
Mo
de
in
B
ase
Sce
na
rio
To
tal
for
Ba
se
Ex
isti
ng
Mo
de
in
Bu
ild
Sce
nari
oN
ew
Mo
de
in
Bu
ild
Sce
na
rio
Au
to
Dri
ve
r –
P
ark
at
Em
plo
ye
e/
P1
0 l
ot
Au
to
Pa
sse
ng
er
– P
ark
at
Em
plo
ye
e/
P1
0 l
ot
Au
to
Dri
ve
r –
P
ark
e
lse
wh
ere
Au
to
Pa
sse
ng
er
– P
ark
e
lse
wh
ere
Ta
xis
/
FH
Vs
NY
C
Air
po
rte
rB
us
Su
bw
ay
+ B
us
LIR
R +
B
us/
Ta
xi
No
n-
Mo
tori
ze
d
Au
to
Dri
ve
r-E
mp
l P
ark
ing
a
t W
P
Au
to
Pa
sse
ng
er-
Em
pl
Pa
rkin
g a
t W
P
Ta
xi/
FH
V a
t W
P/
Air
Tra
in
Su
bw
ay
to
Air
Tra
inLIR
R t
o
Air
Tra
in
Auto
Drive
r –
Park
at
Em
plo
yee/P
10 lot
7,4
37
4,8
70
0
0
0
0
0
0
0
0
0
2,5
53
0
0
3
11
Auto
Pass
enger
–Park
at
Em
plo
yee/P
10 lot
165
0
110
0
0
0
0
0
0
0
0
0
55
0
0
0
Auto
Drive
r –
Park
els
ew
here
1,9
08
0
0
1,9
08
0
0
0
0
0
0
0
0
0
0
0
0
Auto
Pass
enger
–Park
els
ew
here
96
0
0
0
96
0
0
0
0
0
0
0
0
0
0
0
Taxi
s/FH
Vs
213
0
0
0
0
132
0
0
0
0
0
23
0
47
1
10
NYC A
irport
er
60
0
0
0
0
0
2
0
0
0
0
0
0
0
28
31
Bus
3,4
74
0
0
0
0
0
0
2,8
40
0
0
0
0
0
0
347
287
Subw
ay
+ B
us
3,0
07
0
0
0
0
0
0
0
2,0
17
0
0
30
0
0
461
499
LIR
R +
Bus/
Taxi
237
0
0
0
0
0
0
0
0
95
0
0
0
0
12
129
Non-M
oto
rize
d176
0
0
0
0
0
0
0
0
0
176
0
0
0
0
0
To
tal
for
Bu
ild
16
,77
2
4,8
70
1
10
1
,90
8
96
1
32
2
2
,84
0
2,0
17
9
5
17
6
2,6
06
5
5
47
8
52
9
66

LGA Airport Access Improvement Project 53
REFERENCES
1. Gupta, S., P. Vovsha, and R. Donnelly (2008) Air Passenger Preferences for Choice of Airport
and Ground Access Mode in the New York City Metropolitan Region. Transportation
Research Record 2042, pp. 3-11.
2. Task C FAA Regional Air Demand Study, PANYNJ, 2007.
3. PANYNJ Airport and Ground Access Choice Model User Guide (2016).
4. Bernardo C., S. Gupta, and P. Vovsha (2017) Airport and Ground Access Choice Modeling.
Presented at the 16th TRB National Transportation Planning Applications Conference.
5. PANYNJ JFK Ground Access Model (2016).
6. Airport Cooperative Research Program (ACRP) Synthesis 4 (2008). Ground Access to Major
Airports by Public Transportation. Washington, DC: The National Academies Press.
7. Airport Cooperative Research Program (ACRP) Synthesis 5 (2008). Airport Ground Access
Mode Choice Models. A Synthesis of Airport Practices. Washington, DC: The National
Academies Press.
8. Airport Cooperative Research Program (ACRP) Synthesis 22 (2012). Passenger Value of
Time, Benefit-Cost Analysis and Airport Capital Investment Decisions. Volume 1: Guidebook
for Valuing User Time Savings in Airport Capital Investment Decision Analysis. Washington,
DC: The National Academies Press.
9. Vovsha, P., J. Hicks, B. Paul, V. Livshits, P. Maneva, and K. Jeon (2015) New Features of
Population Synthesis. Presented at the 94th Annual Meeting of the Transportation Research
Board.
10. Hess, S. and J. W. Polak (2005) Accounting for random taste heterogeneity in airport-choice
modelling. Transportation Research Record, 1915, pp. 36-43.
11. Hess, S. and J. W. Polak (2006) Airport, airline and access mode choice in the San Francisco
Bay area. Papers in Regional Science, 85.4, pp. 543-567.
12. Koster, P., Kroes, E., and E. Verhoef (2011) Travel time variability and airport accessibility.
Transportation Research Part B, 10, 1545–1559.
13. 2014 Airport Traffic Report. The Port Authority of NY & NJ.
14. 2015 Airport Traffic Report. The Port Authority of NY & NJ
15. 2016 Airport Traffic Report, The Port Authority of NY & NJ
54 LGA Airport Access Improvement Project
16. Strategic Highway Research Program 2 Report S2-C04-RW-1: Improving Our Understanding
of How Highway Congestion and Pricing Affect Travel Demand (2013).
17. Taxi GPS Datasets. The NYC Taxi and Limousine Commission.
LGA Airport Access Improvement Project 55
LIST OF CONTRIBUTORS
WSP (Technical Consultant)
Peter Vosha, Ph.D., Technical Lead
Surabhi Gupta, Senior Data Scientist
Christi Byrd, Technical Review
Rosella Picado, Technical Review
AKRF, Inc.
Jennifer Hogan, C.M., Technical Review, QA/QC
Christopher M. Calvert, AICP, Technical Review, QA/QC
Audrey Heffernan, LEED AP, Technical Review
PANYNJ
Patty Clark, Aviation Strategy Officer
Matthew DiScenna, Senior Program Manager, Aviation Department
Lou Venech, General Manager of Transportation Policy and Planning
Eunah Kang, Manager of Transportation Planning/Modeling
Michael Lafazia, Principal Traffic Engineer, LaGuardia Redevelopment