Embed Size (px)
Citation preview
Lessons Learned From Commissioning Protective Relaying Systems
Karl Zimmerman and David Costello Schweitzer Engineering Laboratories, Inc.
Revised edition released January 2012
Previously presented at the International Protection Testing Symposium, October 2009,
and 63rd Annual Georgia Tech Protective Relaying Conference, April 2009
Originally presented at the 62nd Annual Conference for Protective Relay Engineers, March 2009

1
Lessons Learned From Commissioning Protective Relaying Systems
Karl Zimmerman and David Costello, Schweitzer Engineering Laboratories, Inc.
Abstract—Commissioning protective relays has changed with the increased use of microprocessor-based relays. Many relays have multiple functions, and logic that used to be contained in wiring diagrams or control schematics now resides in relay settings.
However, the newer relays also provide many advantages in commissioning, including:
• Event reports that show a precise capture of voltage and current waveforms, inputs and outputs, and relay elements.
• Sequential Events Recorders (SERs) that show time-stamped assertion and deassertion of relay elements.
• Metering and synchrophasor data that can be used for instantaneous monitoring of input signals.
Using personal experiences and those learned from working with field personnel, we provide a variety of testing examples on transmission, distribution, and plant systems. We show what the expected performance is, what to look for, problems to avoid, and lessons learned from system data taken from relays during commissioning.
I. INTRODUCTION At one petrochemical company, there have been at least
eight unintended operations of microprocessor-based relays over a period of years, spread among several refineries. The root cause of almost all of these events can be attributed to settings mistakes and application errors. More importantly, these mistakes and errors made their way into service because there was a failure to discover them during commissioning tests. Why is this?
The petrochemical company was quick to clarify that hardware failure, recalls, and service bulletins are given equal negative weight to misoperations due to settings or application errors. In other words, plant management and executives equate misoperations due to settings or application errors to overly complex products and poor designs.
To blame all of these incidents on more complicated relays or schemes is a disservice. The fact is, many of us simply:
• Do not emphasize training and mentorship. • Do not document designs on paper with descriptions
and diagrams. • Do not develop and test standard schemes in the lab. • Do not use peer review. • Do not develop checklists and test plans. • Do not perform thorough commissioning tests. As an industry, we have replaced detailed drawings with
electronic settings files. In the past, detailed control schematics served as a visual description of our intended
scheme. For a technician, the diagram did more than explain the circuit, it provided a troubleshooting and testing road map. Without this picture, a technician is forced to examine electronic settings files, interpret intended scheme operation, and assume what needs to be tested. Without it, a commissioning plan or checklist is replaced with “winging it.” Our most critical commissioning tests are often done at the very end of a project, after many dates have slid except for the final in-service date, leaving precious little time for detail and our best efforts.
Combine this with the use of protocols and features that may be new to a user. Protocols are often touted as revolutionizing, but regardless of how control logic is implemented, the protection system still needs to be documented, validated, and tested.
Often, standard schemes are not developed, which makes each new project a custom job. Having someone check or review our work is valuable, fosters greater accountability and fewer errors, but is rarely done. Few of us test entire schemes in the lab to learn, find errors, and thoroughly check the system before we go to the field.
Add to this that we all face the challenge of retiring experience in our industry and the difficulty of hiring new employees with the expertise needed to start on day one. Many managers lower training budgets and promote more on-the-job training. Increasingly, there is no formal commitment to mentorship, and the development and retention of experienced engineers and technicians have suffered.
These trends have created an environment with risk of failures. Cost savings have been achieved in the design, documentation, and testing areas, at the sacrifice of misoperations later on that may be much more costly.
In this paper, we promote a commitment to a comprehensive approach to commissioning. We have an opportunity to influence positive change that will lead to fewer misoperations and improved power system reliability. Specifically, as an industry, we can:
• Require complete documentation, including logic diagrams, expected operation descriptions, and results of testing.
• Perform peer review of designs, settings, and testing. • Develop and test standard schemes in the lab. • Create and use commissioning and testing checklists. • Move element and scheme testing earlier in a project
timeline, and perform this work in the lab versus in the field.

2
• Make commissioning a separate line item, in budget and time, not easily dismissed.
• Commit increased effort and resources to training and mentorship.
II. COMPREHENSIVE APPROACH TO COMMISSIONING The goal of commissioning testing is to achieve as close to
100 percent certainty as possible that the protective relay system will perform correctly for all scenarios. Funda-mentally, this means that the protective relay system:
• Trips (within a prescribed time) for correct trip conditions
• Does not trip for nontrip conditions Consider all of the elements that must perform correctly to
clear a fault or whose malfunction could cause an undesired operation:
• Circuit breaker (mechanical and electrical trip coil) • Battery/dc system(s) • DC control wiring, including grounding • Primary bus and feeder conductor connections • Current transformers (CTs) • CT secondary wiring, including grounding • Voltage transformers (VTs) • VT secondary wiring, including grounding • Protective relay properly applied and set • Protective relay performance • Communications equipment properly set • Communications equipment performance Edmund O. Schweitzer, III, Bill Fleming, Tony Lee, and
Paul Anderson proposed a method for measuring protection reliability using fault tree analysis [1]. We would like to extend that analysis to evaluate the impact of comprehensive commissioning on reliability.
The example system evaluated is a transmission line protected by relays using a permissive overreaching transfer trip (POTT) scheme over a microwave channel. Fig. 1 shows a one-line diagram of the system.
52 52
21 21ToneEquipment
MicrowaveTransceiver
ToneEquipment
MicrowaveTransceiver
Bus S Bus R
125 Vdc 48 Vdc 48 Vdc 125 Vdc
µW Channel
Fig. 1. One-Line Diagram of a Tone/Microwave-Based POTT Scheme
The top event for the fault tree in Fig. 2 is chosen to be “protection fails to clear fault within prescribed time.” The values shown are unavailability. Unavailability takes into account the failure rate of individual elements and the time required to detect the failure. The unavailability data are from the earlier referenced paper [1] and from field experience. We can substitute any of these data points if better data are available.
Unavailability is a fraction of time a device cannot perform; it is unitless. The values are multiplied by 10–6.
Relay and breaker failures can often be detected by self-testing or monitoring. Wiring, settings, and application errors, on the other hand, are often not detected until the protection is challenged, unless proper commissioning is performed. Undetected errors increase the unavailability.
Protection Fails to Clear FaultWithin
Prescribed Time
2620
Protection at S Fails to Clear Fault Within
Prescribed Time
Protection at R Fails to Clear Fault Within
Prescribed TimeMicrowave Channel Fails
100
1260 1260
DCSystFail50
52Fail300
DCWiringError50
CTFails3•10=
30
CTWiringError75
VTFails3•10=
30
VTWiringError75
RelayMis-App/Set200
RelayFails100
ToneEquip.Fails100
Micro-waveEqup.Fails200
CommDC
Fails50
Same as S
x 10–6
Fig. 2. Fault Tree for POTT Scheme Fails to Clear Fault With Inadequate Commissioning

3
With comprehensive commissioning, we can eliminate protection system failures due to wiring, settings, and application errors. Fig. 3 shows that analysis reduces the likelihood of a failure to trip within a prescribed time by about 30 percent (2620 to 1820).
Protection Fails to Clear FaultWithin
Prescribed Time
1820
Protection at S Fails to Clear Fault Within
Prescribed Time
Protection at R Fails to Clear Fault Within
Prescribed TimeMicrowave Channel Fails
100
860 860
DCSystFail50
52Fail300
DCWiringError
0
CTFails3•10=
30
CTWiringError
0
VTFails3•10=
30
VTWiringError
0
RelayMis-App/Set0
RelayFails100
ToneEquip.Fails100
Micro-waveEqup.Fails200
CommDC
Fails50
Same as S
x 10–6
Fig. 3. Fault Tree for POTT Scheme Fails to Clear Fault With Comprehensive Commissioning
We perform the same analysis to discover the likelihood of a false trip of the protection. In general, for a POTT scheme, communications failures are not as likely to produce a false trip, so those unavailability values are lower. Fig. 4 shows the fault tree for a false trip with inadequate commissioning.
Protection Produces an Undesired Trip
1270
Protection at S Produces an Undesired Trip
Protection at R Produces an Undesired Trip
Microwave Channel Fails
10
630 630
DCSystFail50
52Fail30
DCWiringError50
CTFails3•10=
30
CTWiringError75
VTFails3•10=
30
VTWiringError75
RelayMis-App/Set200
RelayFails10
ToneEquip.Fails10
Micro-waveEqup.Fails20
CommDC
Fails50
Same as S
x 10–6
Fig. 4. Fault Tree Analysis of POTT False Trip With Inadequate Commissioning
If we eliminate wiring, settings, and application errors, we can reduce false trips by over 60 percent (1270 to 470), as shown in Fig. 5.
Protection Produces an Undesired Trip
470
Protection at S Produces an Undesired Trip
Protection at R Produces an Undesired Trip
Microwave Channel Fails
10
230 230
DCSystFail50
52Fail30
DCWiringError
0
CTFails3•10=
30
CTWiringError
0
VTFails3•10=
30
VTWiringError
0
RelayMis-App/Set0
RelayFails10
ToneEquip.Fails10
Micro-waveEqup.Fails20
CommDC
Fails50
Same as S
x 10–6
Fig. 5. Fault Tree Analysis of POTT False Trip With Comprehensive Commissioning

4
III. UNDERSTAND THE TOOLS AVAILABLE Using data from event reports to analyze power system
performance is a powerful tool for commissioning power systems. Several recent papers provide definitions of event reports and describe many examples of power system events and root causes of problems [2] [3].
An event report is a time-aligned record of the power system voltages, currents, inputs, outputs, and elements. Usually, the event report is triggered when a breaker is tripped by the relay but can also be triggered manually or by other programmed conditions.
Here is a process for analyzing event reports: Step 1: Understand what is expected to happen for given
conditions. To understand what we can expect, we must look at settings, installation drawings, reference texts, and instruction manuals.
Step 2: Collect all relevant information, including eyewitness testimony, any available information about the fault, SERs, trip targets, and relay event data.
Step 3: Gather available analysis tools, such as instruction manuals, reference texts, and event analysis software.
Step 4: Compare the actual operation to expectations. If there are any differences, resolve these differences by determining root cause. Do not waste time analyzing unused elements or settings. Focus, instead, on trip logic and output contact programming. Do not forget to look at prefault information, and use data from prefault information to perform an offline commissioning test to prove that system installation is correct. Before and during the analysis process, save data intelligently, naming files in a coherent way.
Step 5: Document findings, proposed solutions, and test results.
When we have validated a correct operation or determined root cause and developed a proven solution for an incorrect operation, we are done.
In addition to analyzing event reports, here is a list of testing tools and methods that assist in the commissioning of protective relaying systems:
• I/O contact testing • Functional element testing • Secondary ac injection (steady state or dynamic state
simulation) • Primary ac injection (balanced or unbalanced system
conditions) • SER, metering, and event report data • End-to-end tests using satellite-synchronized test sets • Synchrophasor data • Logic diagrams that break out programmable logic • Lab simulations • COMTRADE replay
• Offline modeling (e.g., use of Real Time Digital Simulator [RTDS®] or Electromagnetic Transients Program [EMTP])
• System event reports used to validate relay performance as part of the commissioning strategy
IV. TOP TEN LESSONS LEARNED FROM COMMISSIONING PROTECTIVE RELAY SYSTEMS
The following are the top ten lessons learned from commissioning protective relaying systems. While every company and engineer may have favorites, adhering to these items will improve system reliability and reduce, or eliminate, slow or undesired trips.
Number 10: Make documentation complete and up to date Number 9: Perform peer review Number 8: Create a checklist and/or plan for
commissioning Number 7: Perform as many tests in the lab as possible Number 6: Validate that the intended settings are in the
correct relays Number 5: Check primary ac wiring Number 4: Check secondary ac wiring Number 3: Check I/O, including dc control wiring,
inputs, outputs, and communications Number 2: Invest in training Number 1: Make commissioning testing a separate line
item for budgeting, timeline, and project planning
A. Number Ten: Make Documentation Complete and Up to Date
Many problems are created due to poor or incomplete documentation. Simply sending out settings and connection drawings is often not enough. For example, if an application includes programmable logic that resides in the relay, that logic must be described and documented. Sometimes this requires complete logic representation.
1) Create the Documentation Necessary for the Application Examples of different methods of depicting relay settings
logic include the following [4]: • Word description • Control circuit representation of logic • Logic gates description of logic • “Ladder” logic • Relay settings All of these can be valuable tools, but the important thing
is to provide adequate documentation for the specific application.
2) Example Documentation for DCB Enable/Disable Logic The following is an example of what to provide to
technicians as documentation. In this particular scheme, control logic is used to enable or disable a directional comparison blocking (DCB) protection scheme. Consider including the following in a document, along with the settings files and schematics.

5
SET1 = IN104 + /RB1 Turn DCB Scheme OFF RST1 = \IN104 + /RB2*!IN104 Turn DCB Scheme ON Where: / = a rising edge trigger \ = a falling edge trigger + = OR operator * = AND operator ! = NOT or inverter Fig. 6 is a graphical representation of the same
programmable logic equations.
S SET Q
R CLR Q
LT1 = 1 DCB OFFLT1 = 0 DCB ON
To BT Logic
IN104/RB1
\IN104
/RB2IN104
Fig. 6. Logic Representation of DCB ON/OFF Control Logic
Logic Description: Latch Bit 1 (LT1) provides ON/OFF control of the DCB scheme. When LT1 is a logical 1, a constant block trip (BT) received is asserted, disabling high-speed trips by the DCB scheme. This effectively reverts the relay to step-distance protection. When LT1 is a logical 0, the DCB scheme is allowed to operate (i.e., high-speed trips are enabled). Either a local control switch (IN104) or a supervisory control and data acquisition (SCADA) control command (RB1, RB2) can enable or disable the DCB scheme via LT1. The local control switch has priority, however; if the local switch is in the OFF position, SCADA cannot turn the DCB scheme ON. If the local switch is in the ON position, SCADA can turn the DCB scheme OFF and ON. This means that there may be times when SCADA has turned the scheme OFF, and the local switch is in the ON position (i.e., the local switch will not match the status of the DCB scheme). If this happens, the local operator must first turn the local switch to OFF, then ON to enable the DCB scheme.
Definitions: IN104 = 1 = local switch disable or block DCB scheme IN104 = 0 = local switch enable DCB scheme (and enable SCADA controls of DCB scheme) RB1 = pulsed 1 = disable DCB scheme via SCADA RB2 = pulsed 1 = enable DCB scheme via SCADA LT1 = 1 = DCB scheme disabled or blocked LT1 = 0 = DCB scheme enabled This type of documentation provides not only the settings
but also an important road map for commissioning. This example also shows how two lines of programming in a relay settings file mask an involved control scheme that is much easier to understand given a drawing and operational description.
3) Documentation Control and Timeline Documents, drawings, and settings files should be
controlled through a strict process. Controls should include a
consistent naming convention for files, where and how data are stored, how documents and files are revised, and how revisions are documented and tracked.
In addition, the documentation should be reviewed at different stages in the project, even if it is simply reviewing changes. Fig. 7 shows a timeline of the different stages of a project where settings and documentation should be created and reviewed.
Design and Expected Operation
Testing Checklist
Lab Testing
Field Commissioning
System Event Analysis
Time
Fig. 7. Documentation Timeline
Here is a guideline for keeping documentation up to date throughout the project:
• Design and expected operation – create initial documentation, (including a description of protection philosophy), proposed ac and dc schematics and connection drawings, logic drawings, proposed settings, and a complete description of the logic (settings and drawings alone are not enough). Logic should be documented and described in some form.
• Testing checklist and/or test plan – each application is different and requires a checklist or test plan to ensure nothing is missed. One recent paper shows several examples of this approach [5].
• Lab testing – test and document as much as possible in the laboratory. Examples of this include relay functional or element tests, logic simulation, communications system performance for local schemes, or a complete simulation of the power system protection.
• Field testing – test and document settings entered, ac primary and secondary wiring, dc circuits, and communications schemes.
• System event analysis – event report analysis validates proper commissioning. In many cases, event reports can serve as documentation for field testing. Additionally, event reports capture the “corner cases” (inrush, capacitive voltage transformer [CVT], CT saturation, etc.) that are not likely to be found in commissioning.
B. Number Nine: Perform Peer Review The following is an excerpt from the book Ethics 101:
What Every Leader Needs to Know [6]: “Has someone ever stood looking over your shoulder as you worked on a project or task? If so, chances are you didn’t like it. Most people don’t.”
Yet author John Maxwell argues that this is exactly what we should invite people to do in order to be held accountable. The author was speaking in the context of living by the highest ethical standards, but these same observations apply to

6
improving the quality and consistency of our technical design and commissioning work as well.
Mr. Maxwell continues, “It’s ironic. We don’t like to be reminded of our shortcomings, and we don’t like our shortcomings exposed to others either. But if we want to grow, we need to face the pain of exposing our actions to others.”
Anyone who has ever toiled over writing and editing a technical paper or developing schematics can relate to the humbling feeling we get when someone with fresh eyes quickly finds an obvious discrepancy in our work during a review. Our egos may be injured, but egos recover, and the product is better after receiving this review and improvement.
Protection system design (and the commissioning testing of those designs) is complicated work. Peer reviews should take place at every stage in the timeline. Engineers benefit from having someone review their drawings and settings. Technicians benefit from having someone check their test plan and results. Project managers benefit from seeing documentation of every step in the overall process.
Peer review is important within the same organization, but it is even more critical when various parts of a project are being completed by different companies. For example, utility engineers may design and set protection at one end of a tie line, while consultants may design and set the other end, while yet different contractors still might be tasked to build, install, and test the equipment. Being held accountable may be annoying, but it works.
C. Number Eight: Create Checklist/Plan for Commissioning Create a test plan that includes some type of checklist
verification. This increases the likelihood that nothing will be overlooked in testing.
As discussed earlier, consider all of the elements that must operate correctly to properly clear a fault or to avoid a false operation. Use this as a basis for testing.
Each application is different, so each checklist or plan will look different. However, once a scheme has been standardized, a consistent process can be created.
A good practice is to review the tests or checks as they are performed. For example, consider putting two check boxes (one for the tester, one for a reviewer), or use a call and response check, similar to what is used in the aviation industry (which has an outstanding safety record).
Some examples of checklists or test plans are included in Appendices A and B. [5] [7]
D. Number Seven: Perform as Many Lab Tests as Possible Testing as much as possible in the lab simplifies field
testing. Once a system is validated in the lab, that portion of the testing need not be repeated in the field.
One advantage is that we can validate and use standardized schemes instead of customizing every scheme.
There is widespread agreement that the more that can be accomplished in the lab, the more successful and less error-prone field commissioning will be. One utility paper lauds the use of standardized schemes and extensive lab testing [8].
Complete simulation of power system protection may require an advanced system like EMTP or RTDS to inject signals representative of actual power system conditions.
E. Number Six: Validate That the Intended Settings Are in the Correct Relays
Even if great effort is exerted to prove settings, logic, and scheme, we should not overlook “housekeeping” issues: to ensure firmware revision and settings are documented and locked down (controlled) as necessary, and are in the relay going into service!
Develop a naming and file storage process and stick with it. Just as drawings have a “controlled” status, so should settings files. Use a simple method for storing, and include a process for controlling revisions.
Use the “compare” function that software programs offer to compare as-set settings with the intended settings files.
One company experienced an undesired trip for an out-of-section fault because sensitive, incorrect settings were found programmed in the backup relay. The event report showed that the desired settings sent to the field never made it into the backup relay [9].
Correct settings were found in the primary relay. The Zone 2 time delay was set for 24 cycles (Z2DP = 24-cycle delay) as shown in Fig.8.
Fig. 8. Intended (Correct) Settings in Primary Relay
Incorrect settings were found in the backup relay. The Zone 2 time delay was set to zero (PTMR = 0-cycle delay).
Fig. 9. Unintended (Incorrect) Settings in Backup Relay
F. Number Five: Check Primary AC Wiring (Phasing, Phase-to-Bushing Connections, Etc.)
Verifying the primary ac connections is usually performed before any protection system testing takes place. However, protective relay testing can identify problems during commissioning that might otherwise become false operations later.
Primary injection tests (balanced and unbalanced) are recommended practice for any protection system checkout. Synchrophasor data from relays can measure precise voltage magnitude and phase angle. Metering and event report data provide snapshots to validate proper power system connections.

7
G. Number Four: Check Secondary AC Wiring (Polarity, Phase Sequence, Neutral Connection, Grounding)
One of the best ways to verify the integrity and correctness of ac secondary wiring is to perform primary injection testing. Appendix C shows a primary injection test for transformer differential applications.
H. Number Three: Check I/O, Including DC Control Wiring, Inputs, Outputs, and Communications
The next item is to check the integrity of all of the inputs and outputs to and from the protection system. This may include dc control wiring or any control scheme that uses communications.
Output contacts should be asserted and verified through their intended operation. Control inputs should be asserted to verify protection or control logic.
Many protection and control functions are now being performed using communications. The integrity of the fiber (metallic, wireless, or other media) should be checked.
Many protocols are being used (e.g., Modbus®, DNP3, IEC 61850, MIRRORED BITS® communications) to communicate and perform protection and control. Test plans should include a way to simulate logic points. Often the best place for this to happen is in the laboratory.
DC systems should be tested per the manufacturer’s specifications, including grounding. Trip and close coils should be checked and monitored whenever possible.
I. Number Two: Invest in Training Make training and mentoring part of the process.
Anticipate the needs for training, and plan accordingly. Sometimes, tighter budgets result in less or no formal training. This should not be so. Make training a priority, and the results in the field improve.
J. Number One: Make Commissioning Testing a Separate Line Item for Budgeting, Timeline, and Project Planning
Gantt charts are commonly used tools for project planning. Individual tasks are itemized and given a duration and priority in terms of their relationship with subsequent tasks. The status and progress of individual tasks are reported visually. Items that must be finished before another can be started are critical path items.
In real projects, dates slip because of weather delays or equipment delivery problems. Interestingly, the in-service date rarely moves. Project planners get creative to figure out how to condense required work so that the finish line can be crossed when originally promised. As many testing technicians can attest to, there can be great pressure at the most critical part of a project to skip steps, do commissioning faster, and get a station energized on time.
One practical piece of advice we can offer is this: move as much testing as possible to earlier in the project. For example, settings or application errors or differences between local line settings versus the remote end settings can be found just as
well in the lab with bench testing as in the field with end-of-project commissioning. The lab is much more likely to be a better and less pressure-filled environment in which to get productive and thoughtful work accomplished. Leave only those tasks to the end that can only be done in the field, such as proving point-to-point wiring terminations are correct.
When separate contractors are used for different parts of the design and testing process, it is especially important to determine the critical path items and what is needed. For example, the testing technician cannot lab-test the scheme until settings and drawings have been delivered. Also, ensure that testing is a separate line item in the project planning whose allotted time and number of days are not sacrificed due to early project schedule slips. Lab and field testing should be separate budget items, with specified deliverables, that are not compromised under any circumstances.
V. APPLICATION EXAMPLES
A. Line Current Differential Testing Discovers Phasing Discrepancy
A short transmission line connects two substations owned by two separate operating companies. The line is protected by line current differential relaying. The differential principle simply states that, for normal load conditions or external faults, the current flowing into the line is equal to the current flowing out of the line. Fig. 10 shows a one-line diagram indicating that the 87L trips (operates) for faults on the line but restrains for external faults.
87L 87L
87L Operate87L Restrain 87L Restrain
Fig. 10. One-Line Diagram of Line Current Differential Application
To commission the protective relaying, the line was energized with a small amount of external load. In this case, we would expect the local currents to be 180 degrees out of phase with respect to the remote currents [5]. Fig. 11 shows the currents present during commissioning.
0
45
90
135
180
225
270
315
ICL ICX
IAL
IAXIBL
IBX
Fig. 11. Phasor Currents During Commissioning

8
IAL, IBL, and ICL represent the local relay currents; IAX, IBX, and ICX represent the remote relay currents. We can see that phase rotation and magnitudes appear correct (ABC). However, we discover that the local (L) relay currents are assigned ABC and the remote (X) currents are assigned BCA. That is, IAL is 180 degrees out of phase with IBX, etc.
The solution is to reassign the phases so that the local and remote input currents are the same (ABC, ABC). If we cannot reassign the primary power system phases, we must reassign the phases on the CT secondaries at one end of the line. This change should be well documented and displayed to avoid future confusion (e.g., the relay indicates an A-phase-to-ground fault when it is actually a power system B-phase-to-ground fault).
This solution should be (and was) discovered in commissioning testing, either through the use of event reports, metering (if it shows local and remote currents), or synchrophasors, which provide precise phase angle measurements.
B. Motor Test Starts Validate Wiring and Settings A facility was installing an older, refurbished motor. The
motor leads were intact but poorly labeled. Facility engineers wanted to verify that the wiring was correct before placing the motor into service. They used two techniques during commissioning.
The first was to “bump” the motor. Technicians applied a momentary load for about 3 cycles to determine whether the motor’s primary and secondary wiring were correct for installation. Fig. 12 shows the voltage and current phasors during this event.
0
45
90
135
180
225
270
315
VCA (V)
IB (A)
IC (A)
VAB (V)
IA (A)
VBC (V)
Fig. 12. Motor Bump Start Event Shows ABC Rotation and Inductive (Lagging) Current
The phasors show that the motor currents and voltages are connected with ABC rotation. Also, as expected for an induction motor, the currents lag the voltages (e.g., for a purely inductive load, IA lags VA by 90 degrees and VAB by 120 degrees).
By looking closer at the raw oscillograph data, we observe that the voltages drop (as expected) during the starting condition (Fig. 13). We also discover that all of the currents have some dc offset and that the A-phase current waveform is distorted, indicative of CT saturation.
IA(A
) IB
(A) I
C(A
)V
AB
(V) V
BC
(V) V
CA
(V)
50S52A
STOPPED
STARTING
5000
0
-5000
2500
0
-2500
Dig
itals
-2.5 0.0 2.5 5.0 7.5 10.0 12.5 15.0Cycles
IA(A) IB(A) IC(A) VAB(V) VBC(V) VCA(V)
Fig. 13. Motor Bump Start Event Shows A-Phase CT Saturation and Expected Voltage Sag
Note that CT saturation is not necessarily a problem unless it affects the performance of the protection system. In this case, the CT saturation lasts only a few cycles, and we can set the instantaneous overcurrent element pickup above the worst-case inrush current.
To verify this, a second, longer test start was applied to the motor with a low-set overcurrent relay purposely set to trip after 20 cycles. Fig. 14 and Fig. 15 show the start and the trip after 20 cycles. Note there was dc offset but no CT saturation.
IA(A) IB(A) IC(A) VAB(V) VBC(V) VCA(V)
-2.5 0.0 2.5 5.0 7.5 10.0 12.5 15.0Cycles
-5000
5000
0
2500
0
-2500
Dig
itals
VA
B(V
) VB
C(V
) VC
A(V
)IA
(A) I
B(A
) IC
(A)
STOPPEDSTARTING52A
Fig. 14. First Portion of 20-Cycle Motor Start/Planned Trip
-5000
5000
0
2500
0
-2500
Dig
itals
VA
B(V
) VB
C(V
) VC
A(V
)IA
(A) I
B(A
) IC
(A)
-2.5 0.0 2.5 5.0 7.5 10.0 12.5 15.0
Cycles
IA(A) IB(A) IC(A) VAB(V) VBC(V) VCA(V)
TRIPSTARTING52A
Fig. 15. Second Portion of 20-Cycle Motor Start/Planned Trip

9
These tests and the accompanying event report data confirm that the motor is connected properly. Also, the starting currents and voltages are known, which aids in establishing reliable overcurrent pickup and time-delay settings.
C. Synchrophasors Check VT Connections at a Substation At one substation, multiple lines use line-side-connected
VTs. Each relay, commissioned separately, showed correct polarities and phase rotation. However, without a common reference, there is no easy way to discern whether all of the VTs are phased properly. Fig. 16 shows a one-line diagram of Maple Substation (a transmission substation). How do we know that ABC-phase voltages on Line 134 correspond to ABC-phase on Line 123? Synchronized phasor measurements are the answer. By obtaining metering data at a specified time reference, we can see the precise voltage (and current) phasors.
Relay 1 Relay 2
Line 134 toElm Substation
Line 123 toChahunas Substation
Fig. 16. Transmission Substation Uses Line-Side VTs
We see from Fig. 17 and Fig. 18 that the phase voltages are synchronized and verified for service.
Fig. 17. Synchronized Phasor Metering Data From Line 134 VTs
Fig. 18. Synchronized Phasor Metering Data From Line 123 VTs
A subtle but very nontrivial feature is on display in Fig. 17 and Fig. 18. The relays have independently captured data at a specified time for comparison. Further, the relays have retained these latest synchronized phasor measurement data in nonvolatile memory that are easily retrieved using a simple command.
D. Main-Tie-Main Scheme Logic Error Found in Lab Simulation
Fig. 19 shows a main-tie-main scheme system diagram. In this scheme, if either source is lost, the relay system is designed to open the breakers from the unhealthy source and close the normally open tie breaker to re-energize the load from the healthy source. Logic also allows automatic restoration of the breakers to the normal position after the source voltages return to normal.
Main 1 (Normally Closed)
Relay 1
Bus 1
Load
Main 2 (Normally Closed)
Relay 2
Bus 2
LoadRelay 3
Tie (Normally
Open)
Relay-to-Relay Communications
Fig. 19. One-Line Diagram and Relay Interconnect for Main-Tie-Main Scheme
One test scenario performed was to remove both sources at the same time and ensure that no transfer occurred. A setting problem was identified when the sources were lost within a few cycles and a transfer was unsuccessful (Main 1 opened, but the tie never closed). Using SER data from the relays in a lab setting identified a logic error and solution. In this case, the problem only occurred when the sources were lost 1.5 to 6 cycles apart [5]. Only thorough lab simulation of this scheme was able to identify this problem.

10
E. DCB Scheme Settings Optimized Using Real Time Digital Simulator Lab Testing
Extensive testing can be performed to validate relay system performance using an RTDS. One utility uses a DCB scheme for transmission line protection. The test system one-line diagram is shown in Fig. 20.
EM Dig
Station L Station R
20% 20%
F3 F4
F2F1
Line 1
Line 2
Fig. 20. One-Line Diagram of Protection System Lab Test Using an RTDS
In the lab, we are able to simulate different fault locations (F1 through F4) and observe relay system performance with different relay designs at each (e.g., electromechanical [EM] relays at Station L and digital relays at Station R, using actual carrier equipment with an allowance for signal delay). The RTDS precisely models line impedances, variable system source impedances, load conditions, evolving faults, and instrument transformer performance. For example, in this case, the model included CVTs.
The basic logic for a DCB scheme is shown in Fig. 21. The local Zone 2 element uses a carrier coordination (CC) delay to allow time for a received block signal (RCVR) from the remote terminal. Typical settings for this timer vary from 0.5 to 2 cycles, but discerning a precise setting can be difficult, so the timer is usually set longer to avoid possible misoperations.
CC
0
Trip
Zone 2
RCVR
Fig. 21. Basic DCB Scheme
From testing, we developed settings and logic to optimize the DCB scheme. One discovery was that there was no improvement in operating speed or performance when using nondirectional carrier start with specific digital relays at each
end. Thus the utility decided to use directional carrier start for these applications. We also were able to lower the overreaching Zone 2 time-delay settings, resulting in lower total trip times. Table I shows the average trip times for one scenario.
TABLE I TRIP TIMES (NOT INCLUDING BREAKER OPERATE TIME)—STATION L
WEAK SOURCE
Relay System
Average Trip Times, Cycles
Fault Location 1 Fault Location 2
L R L R
Station L EM/Station R Digital 2.3 2.3 2.7 2.6
2 Digitals With Directional Carrier Start 2.2 2.3 2.3 2.1
2 Digitals With Directional Carrier Start—Optimized
1.5 1.6 1.7 1.4
Thorough lab simulation using RTDS validated the proposed relay settings and actually provided some setting and application enhancements that would have been difficult or impossible to simulate in the field.
F. Fast Bus Trip Scheme Wiring Error Causes Misoperation A fast bus trip scheme uses the main and feeder relays that
already exist to protect the bus that supplies radial feeders. The scheme uses the main and feeder relays that already exist to also protect the bus. The system configuration for this event is shown in Fig. 22.
Feeder
Main Trip
F1
Input IN6
Block Trip
F2Trip and Close
Output ContactA2
MainCTR 240
PTR 120
Bus 2
Fig. 22. Fast Bus Trip Scheme One-Line Diagram

11
For a fault at F2, the feeder relay detects fault current and sends a blocking signal to the main relay. The main relay is set with a small delay to allow time for the block trip signal to arrive.
For a fault at F1, the feeder relay does not detect any fault current. Therefore, it does not send the blocking signal to the main relay, allowing the main relay to trip with a small time delay for bus faults. The use of this blocking signal provides fast clearing times for bus faults, where coordination of time overcurrent elements would further delay the main relay trip.
The feeder relay in this event is set with a trip equation of TR = 51T + 51NT. The elements in this equation correspond to the timeout of the phase and ground inverse-time overcurrent elements, respectively. The relay is also programmed with output contact A2 to send the blocking signal. The logic equation for this output is A2 = 50L + 50NL, which are phase and ground instantaneous overcurrent elements, respectively. These elements are set to match the fast bus trip scheme elements in the main relay.
The main relay is set as follows: TR = 51T + 51NT + V, where 51T and 51NT provide backup protection to the feeder. V is a logic element programmed for the fast bus trip scheme. It is equal to E • !L, where E = ST and L = IN6. ST is the timeout of logic variable timer S, which is equal to 50NH + 50H. The timer is set with a three-cycle pickup delay. IN6 is the input wired to receive the blocking signal from the feeder relay.
Relay technicians are often given nothing more than electronic settings files or printed settings sheets. From that, they are expected to develop and execute commissioning tests. Even a fairly simple scheme, such as this one, requires numerous programmable logic settings, requiring technicians to decipher elements, their settings, and all interactions from settings files alone. Without substantial documentation, this leaves room for error.
In this case, a fault occurred on the feeder, but the main relay tripped. Why?
Both relays detected the fault and captured event reports. Fig. 23 shows the event reports from both relays combined, where Event 1 is from the main relay and Event 2 is from the feeder relay.
-5000
5000
0
5000
0
-5000
Dig
itals
2_IA
2_I
B 2
_IC
1_IA
1_I
B 1
_IC
55.525 55.550 55.575 55.600 55.625 55.650 55.675 55.700
Event Time (Seconds) 06:56
1_IA 1_IB 1_IC 2_IA 2_IB 2_IC
55.725
2PT
52
P T
2_OUT 1&22_51P2_50LP1_IN 5&61_IN 1&21_50LP
Fig. 23. Fast Bus Trip Scheme Event
The event reports confirmed that the fault was on the feeder. Fig. 23 shows that the feeder relay 51P element was timing to trip. The fast bus trip scheme in the feeder relay also functioned as expected. The 50L element asserted at the same time as the 51P element, and as a result, OUT2 asserted, sending the block signal to the main relay.
On the main relay, IN2 asserted approximately 5 milliseconds later. However, the main relay monitored IN6 for the block input signal, which did not assert, leading to the fast trip. The breaker opened approximately 50 milliseconds after the end of this event.
Because the scheme logic was not properly documented, the commissioning of these relays did not involve testing the entire scheme, allowing this wiring error to go undetected.
In this case, a dc schematic that included a representation of the logic inside the relays and the interaction between relays would have assisted in commissioning this scheme. Fig. 24 shows an example dc schematic for this case.
50NL A250L
A2
IN6
IN6 L
50NH 50H S ST E
L
V
51T 51NT V TRIP A3
S 62 E TR A3
MAIN TC
MAIN 52A
FDR RELAY
MAIN RELAY
Fig. 24. Fast Bus Trip Scheme DC Schematic and Relay Logic Representation
Seeing the logic in the relay combined with the wiring between the relays would have made testing this scheme easier. Had the scheme been fully tested, instead of only individual elements, this error would have been discovered.

12
G. False Trip on Bus-Tie Relay Reveal Wiring and Settings Issues
During initial substation commissioning, one feeder was to be energized from the transformer to allow load current and phasing checks (see Fig. 25). When the feeder Circuit Breaker 20 was closed, the bus-tie Breaker 55 tripped instantaneously. This prompted some quick troubleshooting to determine what had happened.
20
Relay
50
Rel
ay
Rel
ay
Rel
ay
Rel
ay
55
40
25
Rel
ay
15R
elay
70
Future
Fig. 25. System One-Line Diagram
In the event data shown in Fig. 26, we can see that C-phase current in the feeder relay was the larger current. In other data (not shown), we could verify that the current phase angles lagged respective phase voltages by 90 degrees. Notice the ground inverse-time overcurrent element is picked up for about 2.5 cycles, and this element sends a block to the upstream bus-tie breaker relay for fast bus scheme protection. Notice also that the ground current is relatively low compared to the maximum phase current.
750
500
250
0500
400
300
200
100
0
0.0 2.5 5.0 7.5 10.0 12.5 15.0
IAMag IBMag ICMag IGMag
IAM
ag IB
Mag
ICM
agIG
Mag
Dig
itals
Cycles
TMB2A51G1
Fig. 26. Breaker 20 Current Magnitudes and Digital Element Operation
In the event data shown in Fig. 27, from the bus-tie breaker, we can see the trip. First, we note the element that caused the trip is SV5, a programmable logic element, which is a fast bus trip scheme. The logic from the bus-tie relay’s settings are shown as follows:
RID = TIE BREAKER GS 55 TID = NEWMAN SOUTH SUBSTATION CTR = 400 50P1P = 3.00 50G1P = 1.000 SV7PU = 4.00 SV7DO = 0.00 TR = SV2 + SV5 + RMB1A + RMB4A + (PB10 • !LT5) SV5 = SV7T • !RMB3A • !RMB2A • LT7 SV7 = 50P1 + 50G1 SET1 = !LT1 • (PB1 • !LT5 + RB1 • LT3) • !50G1 RST1 = LT1 • (PB1 • !LT5 + RB1 • LT3)
500
0
-500
5
0
-5
0.0 2.5 5.0 7.5 10.0 12.5 15.0Cycles
IA IB IC VA(kV) VB(kV) VC(kV)
IA IB
ICV
A(k
V) V
B(k
V) V
C(k
V)
Dig
itals
52ATRIPRMB2ARMB3ALT7SV7TSV7SV550P150G1
4.5 Cycles
Fig. 27. Tie Breaker 55 Trips From Fast Bus Trip Scheme

13
In the event data shown in Fig. 28, we can see that Breaker 20’s block signal (RMB3A) was received for 2.5 cycles. Notice that the ground element in the tie breaker was picked up for a longer period, although the ground pickup is set less sensitive than the corresponding blocking element in the feeder relay. When looking at the magnitudes, the phase currents match well with Breaker 20’s data, but the ground current in the bus-tie breaker is significantly higher. This led us to resolve the difference in measured ground currents and discover a reverse polarity CT lead in the Breaker 55 relay.
50G1
IAMag IBMag ICMag IGMag
1500
1000
500
0
750
500
250
0
0.0 2.5 5.0 7.5 10.0 12.5 15.0
Cycles
IAM
ag IB
Mag
ICM
agIG
Mag
Dig
itial
s
Fig. 28. Breaker 55 Residual Overcurrent Asserts
The C-phase wire in the bus-tie breaker relay had reverse polarity, clearly evident in the phasor diagram in Fig. 29.
0
45
90
135
180
225
270
315
VC(kV)
VB(kV)
VA(kV)
IA IC
IB
Fig. 29. Breaker 55 Current Phasors Show C-Phase Reverse Polarity
This CT polarity can be rolled at four possible locations (see Fig. 30):
1. Inside the breaker, between the CT and the shorting block in the cabinet. Primary tests are performed to prove CT polarity within the breaker.
2. Between the CT shorting block in the breaker cabinet and terminal block TB4 in the relay panel in the control building. Continuity or impedance checks are done to verify point-to-point wiring between the breaker and the relay panel.
3. Between terminal block TB4 and the relay test switch TS-1. Continuity or impedance checks are done to verify point-to-point wiring within the panel.
4. Between relay test switch TS-1 and the relay. Continuity or impedance checks are done to verify point-to-point wiring within the panel.
55
X5
1
10
A
Z05
C
E
B
D
F
2
6 5
9
3 4
87
11 12
Z03
Z01 Z02
Z04
Z06
GS 55-TS1T1
GS 55-TS1T1
1291011
T1TB4
C4002000:5
C400Short
2
4
6
1
3
5X1 X1 X1 X5X5 X5 X5 X5 X1 X1 X1
Relay
Fig. 30. Three-Line Wiring Diagram Shows Possible Wiring Error Locations
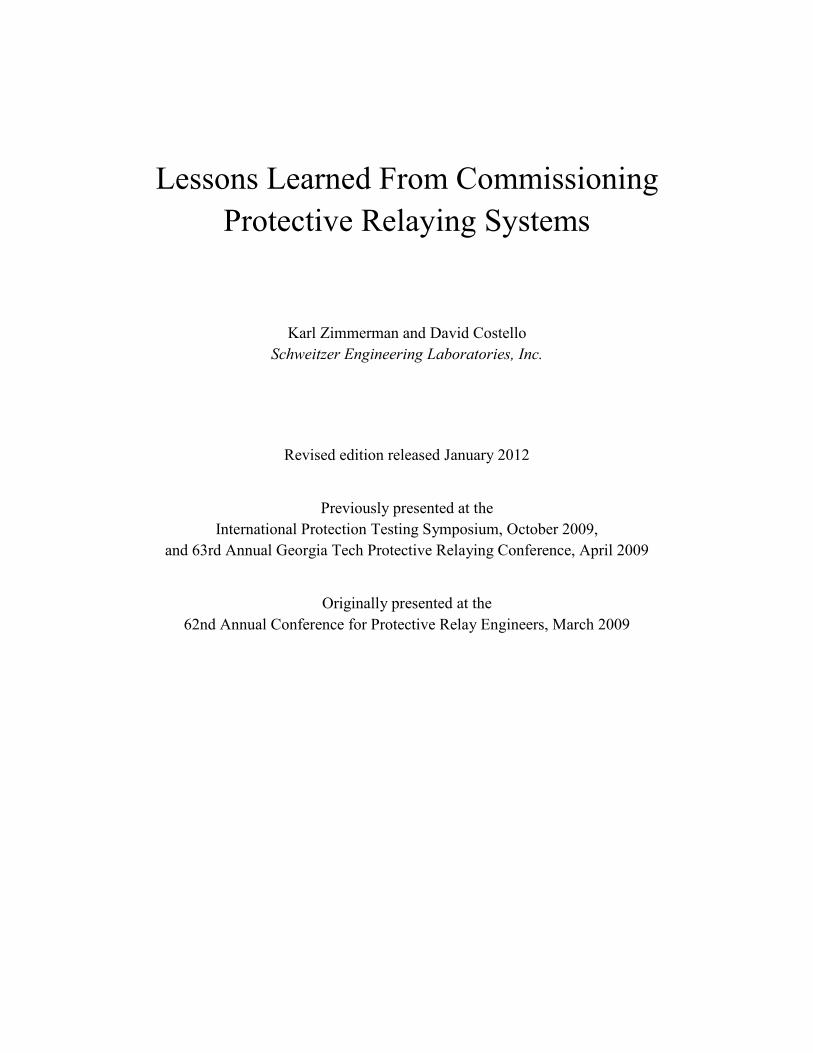
We rolled the leads to terminals Z05 and Z06 on the rear of the relay (Fig. 31 and Fig. 32). A meter command was issued with load on the system, and the C-phase polarity problem was corrected.
Fig. 31. Rear View of Relay Wiring
14
Fig. 32. C-Phase Wires Were Rolled to Fix Wiring Polarity Error
Therefore, we were confident that the wiring problem was between the test switch TS-1 and the relay. This means the wiring error most likely originated at the panel shop. It also means that commissioning tests there, as well as subsequent independent wiring checks during control building factory acceptance testing did not find the polarity problem. Why?
It was learned that control building factory acceptance tests consisted of applying Ia = 1 A, Ib = 2 A, and Ic = 3 A and using the relay meter command to verify correct magnitudes on correct phases. This verifies phasing but not polarity. The standard practice should include also applying currents at balanced 120-degree phase angles to check polarity.
Note that if we look at the terminal wire labels in Fig. 31 and Fig. 32 closely, we can verify that the drawing in Fig. 30 is correct, and we can see that the engineer’s drawings are correct, matching the labels on the wire. This further proves that the wiring error originated in the panel shop, and the error was not caught by two independent layers of factory testing.
It should be noted that before the CT polarity problem was fixed, we had to do something quickly because the feeder Breaker 20’s load was de-energized! With the help of the event data above, in just a few short minutes, we determined that the C-phase polarity was incorrect on the bus-tie breaker and that the ground element in the fast bus trip scheme caused the trip. Because there is a {GROUND ENABLED} pushbutton on the front panel of the bus-tie relay, similar to the feeder breaker relays, we assumed that we could disable ground easily by pushbutton control. We did this and reenergized the distribution circuit. The feeder breaker closed, and nothing tripped. Only days later, looking at an event report, did we learn that we were very fortunate. Our assumption above is incorrect. There is no torque control or supervision of the ground overcurrent element in the bus-tie relay’s settings. We were instead just lucky that the unbalance current during the second energization did not last long enough to trip the fast bus scheme!
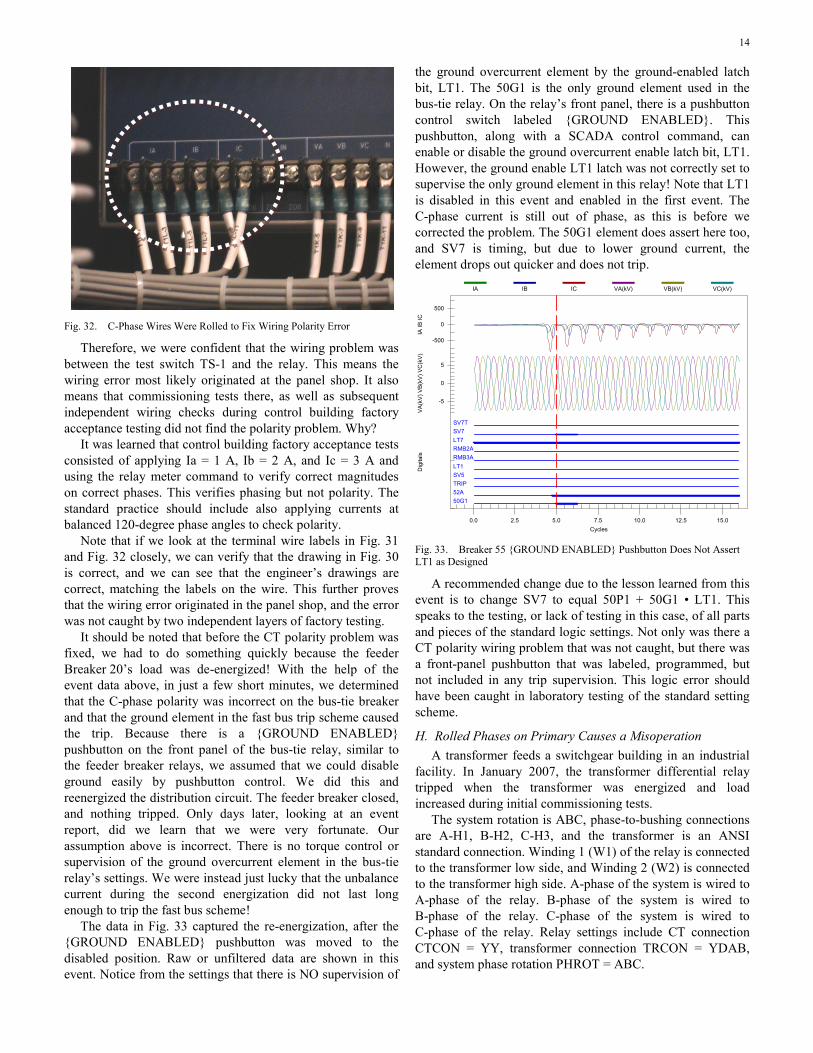
The data in Fig. 33 captured the re-energization, after the {GROUND ENABLED} pushbutton was moved to the disabled position. Raw or unfiltered data are shown in this event. Notice from the settings that there is NO supervision of
the ground overcurrent element by the ground-enabled latch bit, LT1. The 50G1 is the only ground element used in the bus-tie relay. On the relay’s front panel, there is a pushbutton control switch labeled {GROUND ENABLED}. This pushbutton, along with a SCADA control command, can enable or disable the ground overcurrent enable latch bit, LT1. However, the ground enable LT1 latch was not correctly set to supervise the only ground element in this relay! Note that LT1 is disabled in this event and enabled in the first event. The C-phase current is still out of phase, as this is before we corrected the problem. The 50G1 element does assert here too, and SV7 is timing, but due to lower ground current, the element drops out quicker and does not trip.
IA IB IC VA(kV) VB(kV) VC(kV)
5
0
-5
0.0 2.5 5.0 7.5 10.0 12.5 15.0
IA IB
ICV
A(k
V) V
B(k
V) V
C(k
V)
Dig
itals
Cycles
SV7TSV7LT7RMB2ARMB3ALT1SV5TRIP52A50G1
500
0
-500
Fig. 33. Breaker 55 {GROUND ENABLED} Pushbutton Does Not Assert LT1 as Designed
A recommended change due to the lesson learned from this event is to change SV7 to equal 50P1 + 50G1 • LT1. This speaks to the testing, or lack of testing in this case, of all parts and pieces of the standard logic settings. Not only was there a CT polarity wiring problem that was not caught, but there was a front-panel pushbutton that was labeled, programmed, but not included in any trip supervision. This logic error should have been caught in laboratory testing of the standard setting scheme.
H. Rolled Phases on Primary Causes a Misoperation A transformer feeds a switchgear building in an industrial
facility. In January 2007, the transformer differential relay tripped when the transformer was energized and load increased during initial commissioning tests.
The system rotation is ABC, phase-to-bushing connections are A-H1, B-H2, C-H3, and the transformer is an ANSI standard connection. Winding 1 (W1) of the relay is connected to the transformer low side, and Winding 2 (W2) is connected to the transformer high side. A-phase of the system is wired to A-phase of the relay. B-phase of the system is wired to B-phase of the relay. C-phase of the system is wired to C-phase of the relay. Relay settings include CT connection CTCON = YY, transformer connection TRCON = YDAB, and system phase rotation PHROT = ABC.
15
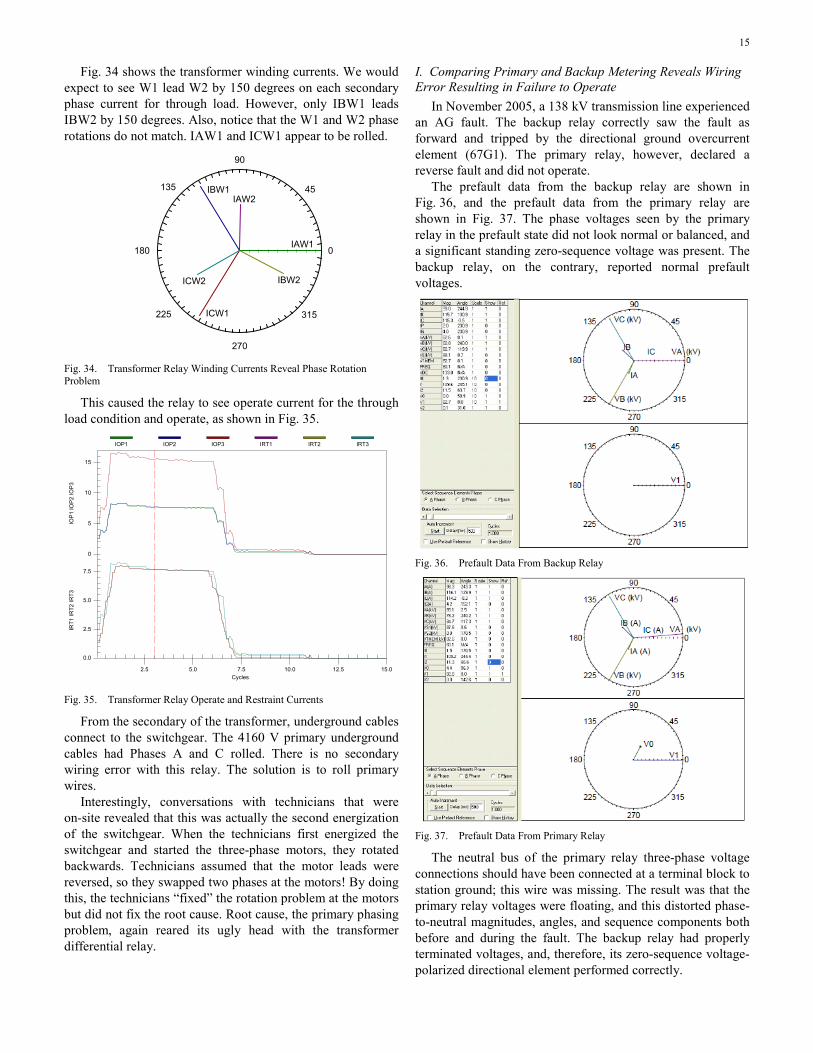
Fig. 34 shows the transformer winding currents. We would expect to see W1 lead W2 by 150 degrees on each secondary phase current for through load. However, only IBW1 leads IBW2 by 150 degrees. Also, notice that the W1 and W2 phase rotations do not match. IAW1 and ICW1 appear to be rolled.
0
45
90
135
180
225
270
315
IBW1
ICW1
IAW1
IAW2
ICW2 IBW2
Fig. 34. Transformer Relay Winding Currents Reveal Phase Rotation Problem
This caused the relay to see operate current for the through load condition and operate, as shown in Fig. 35.
15
10
5
0
7.5
5.0
2.5
0.0
2.5 5.0 7.5 10.0 12.5 15.0
IOP1 IOP2 IOP3 IRT1 IRT2 IRT3
IOP
1 IO
P2
IOP
3IR
T1 IR
T2 IR
T3
Cycles Fig. 35. Transformer Relay Operate and Restraint Currents
From the secondary of the transformer, underground cables connect to the switchgear. The 4160 V primary underground cables had Phases A and C rolled. There is no secondary wiring error with this relay. The solution is to roll primary wires.
Interestingly, conversations with technicians that were on-site revealed that this was actually the second energization of the switchgear. When the technicians first energized the switchgear and started the three-phase motors, they rotated backwards. Technicians assumed that the motor leads were reversed, so they swapped two phases at the motors! By doing this, the technicians “fixed” the rotation problem at the motors but did not fix the root cause. Root cause, the primary phasing problem, again reared its ugly head with the transformer differential relay.
I. Comparing Primary and Backup Metering Reveals Wiring Error Resulting in Failure to Operate
In November 2005, a 138 kV transmission line experienced an AG fault. The backup relay correctly saw the fault as forward and tripped by the directional ground overcurrent element (67G1). The primary relay, however, declared a reverse fault and did not operate.
The prefault data from the backup relay are shown in Fig. 36, and the prefault data from the primary relay are shown in Fig. 37. The phase voltages seen by the primary relay in the prefault state did not look normal or balanced, and a significant standing zero-sequence voltage was present. The backup relay, on the contrary, reported normal prefault voltages.
Fig. 36. Prefault Data From Backup Relay
Fig. 37. Prefault Data From Primary Relay
The neutral bus of the primary relay three-phase voltage connections should have been connected at a terminal block to station ground; this wire was missing. The result was that the primary relay voltages were floating, and this distorted phase-to-neutral magnitudes, angles, and sequence components both before and during the fault. The backup relay had properly terminated voltages, and, therefore, its zero-sequence voltage-polarized directional element performed correctly.

16
The fault data collected from the backup relay showed that zero-sequence current leads the zero-sequence voltage by about 120 degrees, as expected for a forward AG fault. Negative-sequence relationships are similar. The relay was set by the user to enable only zero-sequence quantities for directional decisions. However, the data show that the zero-sequence directional element used (F32V) and the disabled negative-sequence directional element (F32Q) both made the correct directional decision.
The fault data collected from the primary relay are shown in Fig. 38. The zero-sequence current leads the zero-sequence voltage by about 210 degrees, which causes the zero-sequence directional element misoperation. Negative-sequence relation-ships match those reported by the backup relay and are correct. The relay is set by the user to enable only zero-sequence quantities for directional decisions. However, the data show that had the disabled negative-sequence directional element (F32Q) been turned on, it would have made the correct directional decision.
10000
0
-10000
100
0
-100
200
0
-250
0.0 2.5 5.0 7.5 10.0 12.5 15.0
67G1F32VF32QTRIPIN105
IA(A) IB(A) IC(A) VA(kV) VB(kV) VC(kV) V0Ang I0Ang
IA(A
) IB
(A) I
C(A
)V
A(k
V) V
B(k
V) V
C(k
V)
V0A
ng I0
Ang
Dig
itals
Cycles Fig. 38. Fault Data From Primary Relay
Synchronized phasor measurement during commissioning is a useful tool for finding mistakes like these before they cause misoperations. When relays are connected to a common voltage or current source, automation systems can be easily designed to periodically retrieve metering data, compare them, and alarm when differences are discovered. Troubleshooting and repair can then be performed to fix problems before they are discovered by misoperations.
J. Missing CT Secondary Neutral Results in Transformer Differential Relay Misoperation
A single-line-to-ground fault occurred on a 69 kV transmission line. At the same time the fault occurred, a transformer differential relay misoperated. The differential relay protects a generator step-up transformer located behind or on the source side of the transmission relay. The step-up transformer is delta-connected on the generator low side, and those CT inputs are wye-connected to W2 of the relay. The step-up transformer is grounded-wye-connected on the high side, and those CT inputs are wye-connected to W1 of the relay. The generator was online during the fault.
Fig. 39 shows a symmetrical component diagram for the system and fault. Fig. 40 shows the event report that the line relay captured during the fault on its line.
Relay
–+
–+
Relay
Relay
Relay
ST
L
R
Z1S Z1T
Z2S
Z0S
Z2T
Z0T
m • Z1L Z1R
Z2R
Z0R
m • Z2L
m • Z0L
(1 – m)Z1L
(1 – m)Z2L
(1 – m)Z0L
3RF
Fig. 39. Symmetrical Component Diagram for BG Line Fault
Fig. 40. AG Fault on a 69 kV Transmission Line Leaving a Generation Station

17
If the differential relay was installed correctly, we would expect it to restrain for this out-of-zone fault. The data from the transmission line terminal confirm that the fault was an out-of-zone fault for the differential relay. Fig. 41 shows the unexpected operation of the differential relay.
Fig. 41. Misoperation of Generator Step-Up Transformer Differential Relay
For a high-side, line-to-ground fault on a grounded-wye transformer winding with the generator online, we would expect to see the faulted phase current magnitude increase dramatically relative to the other phase currents on W1.
We see, instead, an increase in magnitude for two currents on W1. The fault should appear as a phase-to-phase fault on the low side, and it does. As we see in Fig. 41, however, the W1 currents appear also as a phase-to-phase fault.
The root-cause investigation found that the neutral wire was open-circuited, isolating the neutral of the wye-connected CT from the grounded neutral point at the relay. The CT had been changed from a delta to wye connection, but the addition of the neutral wire run back to the relay had been overlooked during commissioning tests.
The lesson learned is that if actual CT secondary currents do not match expectations for a system fault, investigate potential wiring errors that would provide the observed current flows. Such errors can include missing neutral connections, short circuits, lack of a ground, or multiple grounds. This also points out that many of the commissioning tests we do involve balanced three-phase currents. Note that this problem could have been found by doing primary tests or secondary injection using unbalanced currents and monitoring metering or event data in the relay.
VI. CONCLUSIONS The level of complexity of protection systems has shifted
greatly in the past several years. In some cases, designers espouse the perceived reliability improvements from installing products from multiple manufacturers for primary and backup protection; yet this adds complexity. Digital relays, with programmable logic and easily changed electronic settings files, have been used to eliminate detailed control schematics; yet we have lost our picture of how things work. Mighty protocols are proclaimed to solve all our problems by eliminating wiring altogether; yet, regardless of whether a signal is wired or transmitted, it still needs to be verified.
On the testing front, automated routines have been promoted as eliminating the need for intimate knowledge of the relay; however, programmable supervision and control logic and entire protection schemes are rarely tested by these detailed element tests. Much of our relay testing concentrates on discrete elements, plotting characteristics, and verifying accuracy and settings. However, the smallest effort is devoted to the most critical element—proving that the entire protection system is properly commissioned and most reliable.
Many misoperations or failures to operate can be avoided. As an industry, we can improve protection system reliability by making a commitment to perform comprehensive commissioning. We can do this by:
• Creating and keeping complete and up-to-date documentation.
• Performing peer review. • Creating checklists and/or plans for commissioning. • Performing more lab testing. • Validating correct settings in relays. • Checking primary ac wiring. • Checking secondary ac wiring. • Checking inputs, outputs, dc control wiring, and
communications. • Investing in training. • Making commissioning testing a separate line item for
budgeting, timeline, and project planning. It is up to us to be more diligent to make this happen.

18
VII. APPENDIX A: TRANSFORMER DIFFERENTIAL RELAY COMMISSIONING TEST WORKSHEET
TRANSFORMER AND RELAY DATA
RELAY ID (RID): _______________________________________________________________
TERMINAL ID (TID): ___________________________________________________________
MVA (SIZE): ____________________ METERED LOAD DATA
VWDG1 (Winding 1, kV): __________ MW = _________________
VWDG2 (Winding 2, kV): __________ MVAR = _______________
TRCON (Xfmr Conn): _____________ MVA (Calc): _____________ 2 2MVA : MW MVAR= +
CTCON (CT Conn):_______________
CTR1 (Winding 1 CT Ratio): _______ XMFR Amperes (Calc) MVA •1000AMPS _ PRI :
3 • kV=
CTR2 (Winding 2 CT Ratio): _______ Winding 1 Amperes, Primary: ___________
TAP1 (Winding 1 Tap): ____________ Winding 2 Amperes, Primary: ___________
TAP2 (Winding 2 Tap): ____________
O87P (Rest. Pickup): ______________ RELAY Amperes (Expected)
CTRPRI_AMPS:RELAY_AMPS = (Wye CTs)
AMPS _ PRI • 3AMPS _ RELAY :CTR
= (Delta CTs)
SLP1 (Slope 1%): ________________ Winding 1 Amperes, Secondary: _________
SLP2 (Slope 2%): ________________ Winding 2 Amperes, Secondary: _________
IRS1 (Rest SLP1 Limit): ___________
U87P (Unrest. Pickup): ____________
FIELD TEST MEASUREMENTS
Use METER DIF command (or front panel):
IOP1 = _____ IOP2 = _____ IOP3 = _____ IRT1 = _____ IRT2 = _____ IRT3 = _____
IRTIOP:Mismatch = MM1 = _____ MM2 = _____ MM3 = _____ Mismatch < 0.10 ? _____
If mismatch ratio is less than 0.10, then differential currents are acceptable.
If mismatch ratio is greater than 0.10, then differential currents are too high: check individual current magnitudes and phase angles.
Obtain winding current values using one of the following two methods.
Use the Access Level 1 command METER SEC:
=>METER SEC

19
With older relays this command may not be available. If this command does not work, use the CAL level command TEST METER:
==>>TEST METER
IAW1 = _______ A _______ deg IBW1 = _______ A _______ deg ICW1 = _______ A _______ deg
IAW2 = _______ A _______ deg IBW2 = _______ A _______ deg ICW2 = _______ A _______ deg
CHECKLIST:
1. Expected amperes match measured amperes.
2. Phasor rotation is as expected.
3. Circle the transformer and CT connection:
If:
TRCON = DABY, CTCON = YDAB
TRCON = YDAB, CTCON = DABY
TRCON = DACY, CTCON = YDAC
TRCON = YDAC, CTCON = DACY
TRCON = YY, CTCON = DABDAB
TRCON = YY, CTCON = DACDAC
TRCON = DABDAB, CTCON = YY
TRCON = DACDAC, CTCON = YY
TRCON = YY, CTCON = YY
Then: Phase angles are 180º apart.
PLOT PHASORS:
If:
TRCON = DABY, CTCON = YY TRCON = YDAC, CTCON = YY
Then: IW2 leads IW1 by 150º for PHROT = ABC. Then: IW2 lags IW1 by 150º for PHROT = ACB.
If:
TRCON = DACY, CTCON = YY TRCON = YDAB, CTCON = YY
Then: IW2 lags IW1 by 150º for PHROT = ABC. Then: IW2 leads IW1 by 150º for PHROT = ACB.

20
VIII. APPENDIX B: LINE PROTECTION CHECKLIST
PRODUCT INFORMATION
Relay Model No. ___________________________________
Relay Serial No. ____________________________________
Relay ID No. ______________________________________
Terminal ID No. ____________________________________
APPLICATION REVIEW BEFORE COMMISSIONING
Primary Protection Functions Basic principle of operation described ................................ (POTT, DCB, step-distance, differential, feeder, etc.) Distance protection applied ................................................. (How many zones, purpose of each described) Overcurrent protection applied ............................................ (How many levels, purpose of each described) Backup described (if scheme fails) .....................................
Other Protection Functions Undervoltage applied ..................................................Yes/No Underfrequency applied ..............................................Yes/No Load encroachment applied ........................................Yes/No Line thermal applied ...................................................Yes/No Power swing block/trip applied ...................................Yes/No Loss-of-potential enabled ............................................Yes/No
Control Functions Autoreclosing applied (internal or external to relay) ........... (Scheme described?) Synchronism check/voltage checks ..................................... (Scheme described?) Breaker failure applied (internal or external to relay) ......... (Scheme described?) Breaker monitor enabled and set .........................................
Logic DC control documentation complete ................................... AC schematic/nameplate documentation complete ............. Logic diagrams complete .................................................... Logic design tested and simulated.......................................
BEFORE COMMISSIONING
Physical Properly mounted ................................................................ Clean ................................................................................... Undamaged ......................................................................... Testing correct relay ............................................................ (visibly verified—look under/around panel as needed)
Electrical Case grounded ..................................................................... Connections tight ................................................................. Wiring orderly
Labels visible and legible ................................................. No broken strands or wires ............................................... Neat .................................................................................. Clearances maintained ......................................................
Test Switches CT test switches open (CT shorted) .................................... PT test switches open .......................................................... TRIP output test switches open ........................................... Breaker failure (external) test switches open ....................... DC power test switches closed and relay powered up .........
Relay Status Enable LED on .................................................................... Push target reset—all LEDs illuminate ............................... No warnings or failures on STATUS command .................
Jumpers Password protection enabled ...................................... Yes/No OPEN/CLOSE command enabled ............................ Yes/No _______________________________ ...................... Yes/No _______________________________ ...................... Yes/No
COMMISSIONING
Settings Correct settings on correct relay .......................................... In-service settings saved and stored ....................................
Protection Functions Check Functional tests described .................................................... DC supply voltage does not exceed relay rating.................. Test voltages and currents do not exceed relay continuous ratings ................................................................ Relay operates in expected time (details) ............................ Relay correctly does not operate for out-of-section or external faults (details) ........................................................
Protection Communications Relay connected to correct pilot channel ............................. Channel functioning correctly ............................................. End-to-end testing required and described ..........................
Auxiliary Power (Source Voltage) Battery source is correct and in good condition .................. Battery monitor enabled ......................................................

21
90
–90
45
–45
0180/–180
135
–135
Information Security Passwords enabled (check jumper) ..................................... Passwords changed and documented ..................................
Level 1 _____________ Level 2 _____________
Appropriate people notified of password change ................ Communications channel security requirements described .............................................................................
Data Communications Metering/targeting data to SCADA/communications processor checked ............................................................... Remote engineering access established ...............................
Date, Time, and Reports Synchronized date/time input .............................................. Date and time correct .......................................................... Relay HISTORY/SER buffers cleared (e.g., HIS C) ...........
Alarms Alarm contact connected to remote monitor ....................... Alarm contact connected to local monitor...........................
AFTER COMMISSIONING TESTS AND BEFORE RELAY PLACED IN SERVICE
Voltages from correct PT; PT test switches closed ............. Current from correct CT; CT test switches closed .............. Breaker auxiliary contacts from correct breaker(s) ............. Polarities and phase rotation correct ................................... Plot phasors from METER command or event report ........
Enter magnitude and phase angle for each measured quantity:
IA ______________ IB ______________ IC ______________ VA ______________ VB ______________ VC ______________
Polarity and phase rotation of V and I as expected ............. Nominal unbalance (I2/I1 < 5%, V2/V1 < 5%) .................. Nontrip I/O test switches closed .......................................... No trips asserted (targets reset, no voltage on test switch) .. (Unlatch all trips) Trip circuit to correct breaker or test switch closed ............ Breaker failure trip to correct lockout or test switch closed .................................................................................. 52A contact(s) closed ..........................................................
ENGINEERING SIGN OFF
Designer: _________________________________________
Setter: ___________________________________________
Tester: ___________________________________________
Checker: _________________________________________
NOTES:

22
IX. APPENDIX C: AC PRIMARY CURRENT INJECTION TEST Balanced three-phase current injection verifies primary and
secondary ac current circuits [6]. While this test may require that a small portable generator be on-site or that we use a station service transformer, primary injection provides installers the benefit of discovering problems before transformer energization.
Installers can validate test CT and transformer ratios, polarity, connections, and wiring, as well as related transformer protective relay settings. The verification involves temporarily connecting a reduced-voltage, three-phase power supply to one of the windings of the transformer and applying a three-phase short circuit to ground to the remaining winding.
Balanced three-phase current will circulate through the transformer windings. The circulating current magnitude, which we can calculate, is proportional to the applied voltage and transformer impedance. We can measure secondary current magnitude and angle, as well as operate and restraint quantities, at test switches, terminal blocks, meters, and relays.
To illustrate the procedure, we calculate a test plan for the transformer application shown in Fig. 42.
IH1
IX1 IX2 IX3
IH2 IH3
H1 H2 H3TS 1-1
E
G
I
TS 1-2ICTX3
ICTX2
ICTX1
D
F
H
TS 1-1
H
F
D
TS 1-2
IAW1
IBW1
ICW1
IAW2
IBW2
ICW2
ICTH1
ICTH2
ICTH3
I
G
E
X1 X2 X3 XD
AC Temporary Source
2500:5
24 MVA132 kV – 13.2 kV
Delta – WyeZ% = 15.5%
600:5 MR300
Temporary Jumpers to Ground
Fig. 42. Three-Line Diagram of AC Primary Current Injection Test
Assume a transformer is rated for 24 MVA, with a primary winding voltage of 132 kV (delta connected), a secondary winding voltage of 13.2 kV (wye connected), and an impedance of 15.5 percent at 24 MVA.
Step 1: Calculate one per unit (pu) of the transformer high-side and low-side primary current: 1 pu at 132 kV = 24 MVA/(√3 • 132 kV) = 105 A 1 pu at 13.2 kV = 24 MVA/(√3 • 13.2 kV) = 1050 A
Step 2: Calculate the pu values of current for different power supply voltage levels (240 V shown here) applied to the low side: I @ 240 V (pu) = (240 V/13.2 kV)/(0.155) = 0.1173 pu
Step 3: Calculate the high-side and low-side currents in amperes for different power supply voltage levels (240 V shown as follows): IHS PRI = 105 A • 0.1173 pu = 12.32 A IHS SEC = 12.32 A/60 = 205.3 mA ILS PRI = 1050 A • 0.1173 pu = 123.2 A ILS SEC = 123.2 A/500 = 246.4 mA
Step 4: Select the appropriate ac source voltage level. Reference [1] recommended a typical minimum current of 250 mA secondary for load tests. In this particular case, we can select an ac source voltage of 240 V because it provides almost 250 mA at the secondary of both CTs, and we can obtain a capable generator easily at a commercial rental facility.
Step 5: Calculate the minimum kVA rating for the power supply: Power = (240 V • √3 • 123.2 A)/1000 = 51.21 kVA
We can select a 75 kVA portable generator for the test.
Step 6: Calculate the expected magnitude and phase angles of the through current. All the angles are referenced to A-phase voltage of the test source. We apply ABC system phase rotation (or positive-sequence current) to bushings X1, X2, and X3, respectively. The transformer is a DABy, or Dy1, where the high-side current phase angle leads the low side by 30 degrees. Because the transformer has a highly reactive impedance, we can assume that the current lags the source voltage by 85 degrees. I X1 = 123.2 A @ –85° I X2 = 123.2 A @ –205° I X3 = 123.2 A @ +35° I H1 = 12.32 A @ –55° I H2 = 12.32 A @ –175° I H3 = 12.32 A @ +65°

23
Step 7: Calculate the expected magnitude and angle of the currents leaving the CT polarity marks and going to the relay. Note that if either CT had been connected in delta, we would need to account here for the magnitude and phase angle adjustment necessary for the delta CT. I CTX1 = 246.4 mA @ –85° I CTX2 = 246.4 mA @ –205° I CTX3 = 246.4 mA @ +35° I CTH1 = 205.3 mA @ +125° I CTH2 = 205.3 mA @ +5° I CTH3 = 205.3 mA @ –115°
Step 8: Prepare a table containing the current values we expect to measure during the test. Measuring points will include current flowing into transformer bushings X1, X2, and X3, current leaving transformer bushings H1, H2, and H3, current passing through test switches TS 1-2 and TS 1-1 test jacks, and current the protective relay measures.
Step 9: Connect the power supply to the 13.2 kV transformer terminals, apply a three-phase short circuit to ground to the 132 kV transformer terminals, and turn on the temporary power supply. Confirm correct phase rotation of the temporary power supply. Measure current at all test points, and compare current values measured to the current values expected. Interrogate the transformer differential relay for instantaneous metering and operate and restraint values. Turn off the temporary power supply, and analyze the results. After proper primary injection tests, no misoperation is expected from wiring errors or incorrect phase angle compensation settings.
X. REFERENCES [1] E. O. Schweitzer, III, B. Fleming, T. Lee, and P. Anderson, “Reliability
Analysis of Transmission Protection Using Fault Tree Methods,” proceedings of the 24th Annual Western Protective Relay Conference, Spokane, WA, October 1997.
[2] D. Costello, “Lessons Learned Through Commissioning and Analyzing Data From Transformer Differential Installations,” proceedings of the 33rd Annual Western Protective Relay Conference, Spokane, WA, October 2006.
[3] D. Costello, “Lessons Learned Analyzing Transmission Faults,” proceedings of the 34th Annual Western Protective Relay Conference, Spokane, WA, October 2007.
[4] J. Young and D. Haas, “The Importance of Relay and Programmable Logic Documentation,” proceedings of the DistribuTECH Conference and Exhibition, Tampa, FL, January 2008.
[5] K. Zimmerman, “Commissioning of Protective Relay Systems,” proceedings of the 34th Annual Western Protective Relay Conference, Spokane, WA, October 2007.
[6] J. C. Maxwell, Ethics 101: What Every Leader Needs to Know, New York: Center Street, 2003, pp. 50–51.
[7] SEL-587 Instruction Manual. Available: http:\\ www.selinc.com/instruction_manual.htm.
[8] A. Jezak, “The Benefit and Need for Detailed Test Procedures Based on Standardized Relay Panel Designs,” proceedings of the 55th Annual Conference for Protective Relay Engineers, College Station, TX, 2002.
[9] D. Costello, “Lessons Learned Analyzing Event Reports From Relays,” proceedings of the 49th Annual Conference for Protective Relay Engineers, College Station, TX, 1996.
XI. BIOGRAPHIES Karl Zimmerman is a senior power engineer with Schweitzer Engineering Laboratories, Inc. in Fairview Heights, Illinois. His work includes providing application support and technical training for protective relay users. He is an active member of the IEEE Power System Relaying Committee and is the chairman of the Working Group on Protection Considerations to Mitigate Arc-Flash Hazards. Karl received his BSEE degree at the University of Illinois at Urbana-Champaign and has over 20 years of experience in the area of system protection. He is a past speaker at many technical conferences and has authored over 20 papers and application guides on protective relaying.
David Costello graduated from Texas A&M University in 1991 with a BSEE. He worked as a system protection engineer at Central Power and Light and Central and Southwest Services in Texas and Oklahoma. He has served on the System Protection Task Force for ERCOT. In 1996, David joined Schweitzer Engineering Laboratories, Inc. where he has served as a field application engineer and regional service manager. He presently holds the title of senior application engineer and works in Boerne, Texas. He is a senior member of IEEE and a member of the planning committee for the Conference for Protective Relay Engineers at Texas A&M University.
Previously presented at the 2009 Texas A&M Conference for Protective Relay Engineers. © 2009, 2012 IEEE – All rights reserved.
20120120 • TP6360-01