Embed Size (px)
Citation preview
Lessons from NAFTA: The Case of Mexico's Agricultural Sector Antonio Yunez-Naude ([email protected])
With the collaboration of Fernando Barceinas Paredes * Final Report to the World Bank
(Revised version, December, 2002)
I. INTRODUCTION
The negotiations in 1991 and the implementation of the North American Free Trade Agreement
(NAFTA) in January 1994 lead to expect a sharp transformation of the agriculture of Mexico.
However, after more than eight years of NAFTA implementation, there are not yet published
systematic economic studies to evaluate these predictions with the facts. Some of the reasons
explaining the absence of analyses include the violent consequences to the Mexican economy of
the macroeconomic crisis it experienced one year after the beginning of NAFTA; the complexity
of Mexico’s agricultural sector; the sharp domestic policy changes the last three Mexican
governments have followed; as well as institutional reforms. In terms of empirical analyses, this
indicates that the available information to control for all these events and characteristics is
neither sufficient, nor adequate. 1
The present study intends to contribute to the evaluation of the effects of NAFTA on Mexico’s
agriculture by contrasting the predictions with the facts, and by considering the effects of the
sharp fluctuations the value of the peso experienced during the 1990s. Because of the reasons
previously mentioned and the absence of the required data, our approach in not econometric;
instead, we provide a detailed revision of NAFTA on agriculture, of policy changes and of the
evolution of agricultural trade and domestic production. To give precision to the study, we focus
on major traded non-animal unprocessed agricultural commodities and on trade with the U.S.A.
(Mexico’s major trade partner before and during NAFTA). With this basis, a reflection is made
intended to draw some lessons that the Mexican experience can offer for other Latin American
countries.
* We wish to thank Elisa Moreno for her editing and Fabiola Rivera R. for her work in the data collection. 1 The use of econometric techniques for this type of study requires monthly data (which is not available for all the relevant variables), or inexistent micro data at the plot level and with observations covering pre- and post- NAFTA periods.
2
Any research about the impacts of NAFTA on the Mexican economy has to take into account
domestic reforms. This is so because trade liberalization has been part of a wider set of policy
reforms and since -as in the remaining of Latin America- structural reforms would be financially
unsustainable without internal reforms. In addition, NAFTA has been used by recent Mexican
governments to assure the consolidation and permanence of domestic liberalization. For the case
of the agricultural sector of Mexico, several major measures to reduce government participation
and the creation of new agricultural institutions preceded NAFTA. Furthermore, domestic
policies of transition to help farmers face competition in the grain and oilseeds sub-sector from
its NAFTA partners were put into practice prior to and at the time the agreement was
implemented.
This paper is centered on major non-animal agricultural traded commodities, which are divided
into two categories. In the first group are importables that the Mexican state considered basic for
both Mexican farmers and Mexico´s population and which were heavily regulated before the
reforms and NAFTA implementation: barley, maize, sorghum, soybeans and wheat.2 The second
group of commodities include major exported vegetables and fruits (within them, the most
important are tomatoes, peppers, cucumbers, onions, asparagus, mangoes, and cantaloupe). 3
We begin the study by presenting a summary of the domestic policy changes and the agreements
under NAFTA related to the most traded agricultural products. In Section III we discuss the
expected impacts of these changes. The remaining of the paper evaluates some of these
predictions. In this assessment the effects on trade by the sharp movements of the real exchange
rate of the peso experienced during the 1990s are included. Thus, in Section IV the results of a
price decomposition analysis are presented in order to study if, under NAFTA, real domestic
prices of major agricultural tradables have followed international prices and, with this basis,
evaluate the evolution of policy changes. In Section V we contrast predictions of NAFTA effects
with the trends of agricultural trade and the changes in the domestic conditions of production (as
2 There are other six basic crops. Beans are amongst them and excluded in our study of the evolution of domestic and international prices since beans is an heterogeneous product and because data to compare prices is not available. The other five crops will not be considered here, either because they were liberalized several years before NAFTA (rice) or because they have not been an important component of Mexico's agricultural production since the 80s (copra, cotton, sesame, safflower and sunflower). 3 Coffee is another major exportable; it is excluded in the study because it is not a competitive commodity for Mexico’s North American partners. The exports to the U.S.A. of Mexican sugar produced with sugar cane have risen in recent years. This commodity deserves special attention since sweeteners trade between these two countries has been subject to trade disputes, and will not be considered in this study (see Shwedel, K. 2002).
3
said, we focus on Mexico-U.S.A. trade and on major non-animal agricultural traded
commodities). Taking into account that some of the predicted effects of NAFTA have not
occurred in Mexico’s agriculture, in Section VI we discuss the role that the structure of
agricultural production and the new agricultural policies and institutions have played in
explaining the unexpected trends. In the last Section of the document we present a summary of
our results and a reflection of the lessons Mexico can offer to other Latin American countries
from its experience related to agriculture under NAFTA.
II. POLICY REFORMS
Government intervention in agriculture was a major component of the development policies that
the Mexican state followed from the second half of 1930 until the beginning of the eighties. In
the sixties, 1970s and up the end of the oil boom and the debt crisis of 1982/3, state intervention
in agriculture included: crop price supports to staple producers; subsidies to agricultural inputs,
credit and insurance; and government participation in the processing of grains, oils and powder
milk. The Mexican state had also retail shops to sell basic foods to the rural and urban poor; was
involved in the production of fertilizer and improved seeds and in granting consumption food
subsidies to the poor.
After the macroeconomic crisis of 1982, the de la Madrid administration (1983-1988) began to
adopt policy reforms. During the eighties, producer price supports of five out of the twelve basic
crops were eliminated (those of copra, cotton, suflower, sunflower and sesame seed), and
CONASUPO (the National Company of Popular Subsistence, Mexico's major state enterprise
involved in agriculture, in charge of price supports) was subject to an administrative
reorganization in order to reduce its administrative costs (see CONASUPO: 1986, 1988 and
1989). During its first two years of government, the Salinas administration (1989-1994) reduced
CONASUPO’s participation in the oilseeds markets, eliminated the generalized consumer
subsidies for wheat bread and changed the subsidies given to maize “tortillas” (Yañez-Zazueta:
1997). In addition, all State enterprises began to be privatized or eliminated (Table 1).
In 1986, Mexico became a full member of the General Agreement on Tariffs and Trade (GATT).
However, the Mexican government undertook no major changes in the structure of protection of
agricultural products until 1990. Up to that time, all products in whose markets CONASUPO

4
intervened through producers’ price supports were also subject to import licenses (first two
columns of Table 2). It was until the beginning of the 1990s when domestic reforms and trade
liberalization began to include the most important crops of Mexican agriculture. Between 1990
and 1991 import controls and government direct price supports to the producer of nine of the
eleven basic crops were abolished, 4 and subsidies granted to agricultural inputs, credit and
insurance were drastically reduced
II.1 Domestic reforms during the nineties
Prices of basic crops
It is widely agreed that the most important domestic agricultural policy reform has been the
elimination of price supports to the producers of basic crops and, with it, the elimination of
CONASUPO. This company was a major player in government intervention in agriculture until
the eighties (see first two columns of Table 3). Up to 1989 the company bought a considerable
part of the domestic production of eleven crops at support or guaranteed prices (maize, beans,
wheat, barley, rice, sorghum, soybeans, suflower, copra, sunflower and sesame).5 During 1990,
CONASUPO reduced its market interventions to maize and beans, and producers' price supports
were abolished for all of the remaining basic crops.
In 1991 the Agricultural Marketing Board (ASERCA) was created to substitute the traditional
direct interventions that the government did through CONASUPO for sorghum and wheat.6
Since its creation, ASERCA has followed a scheme of "indifference prices" for these two crops.
It is regional-specific and consists in fixing a "concentrated price" for the crop in question before
the cropping season, taking as a reference the international prices, together with transport costs.
4 Copra, cotton seed, grain barley, rice, soy, sorghum, suflower, sunflower and wheat (sesame seed guaranteed prices were eliminated before). The exceptions were maize and beans. 5 The contribution of these crops to the value of domestic agricultural gross domestic production has been over 30% since the seventies. Amongst these crops, maize is by far the most important one: its weight on the value of domestic production of the eleven crops has been greater than 50% (details in Yunez-Naude and Barceinas: 2000). 6 However, cotton, rice, and soy producers of selected regions have been included in ASERCA's programs during some years, and from 1997 to 2000 marketing support to maize producers was added). For example, notwithstanding that the price of rice was fully liberalized in 1990, supports for rice producers were granted in 1996 because of a drop in its real price (ASERCA: 1996).
5
The producers sell their crop to the processors at the international price, and the government
transfers to the farmers the difference between it and the concentrated price.7
Up to 1994, the Agricultural Council fixed the guaranteed price of maize and beans, which were
administered by CONASUPO. In 1995 the peso devaluation allowed the Zedillo's government to
transform CONASUPO to be just a "last instance buyer" of these two crops, eliminating
domestic price supports for them. During that year CONASUPO did not import maize and, from
purchasing in 1994 45 per cent of the domestic production of the grain, in 1995 just bought 20
per cent. However, and due to the decrease of the international price of maize, in 1996 Mexico
followed an intermediate scheme of price fixation, by which the domestic price was settled
regionally and between the guaranteed price and the international price. The price was called
“base price” (ASERCA: May, 1997, pp. 10 and 13-14). During the winter season of 1996-1997,
the scheme of price supports for maize changed again. Maize, together with beans, was bought
by CONASUPO at “indifference prices” in the production zone. The prices were region-specific
and determined by the average of the international price according to the Chicago Commodity
Exchange plus the international bases of arrival to Mexican port(s) and the operation costs of
storage, transport, financial costs, etc. (SAGAR: July, 97, p. 22). Under this scheme, and until it
was abolished in late 1999, CONASUPO became a “last instance” buyer of white maize for
human consumption in the sense that it allowed sales to those maize growers that could get a
price from the private sector higher than the indifference price.
The figures about the weight of CONASUPO's purchases on domestic production of maize
(mainly white) and beans show that, during the last years of its existence, the Company
decreased its participation in the domestic markets of these two crops. During 1993 and 1994
CONASUPO bought around 45 per cent of the domestic supply of maize, whereas its purchases
were reduced to 20.3 per cent during 1995, and to 8.8 per cent during 1996, to 19 per cent during
1997 and to 12.5 per cent during 1998. As for maize, CONASUPO's weight on domestic
purchases of beans have been reduced: from 30.5 per cent during 1993 to 24.8 per cent in 1994,
to 18.3 per cent in 1995, and to around 8 per cent in the following two years (SAGAR data base).
7 To the scheme of indifference prices, a program of price coverage in the international markets for these crops, plus cotton and maize, was added. For example, during 1996, coverage for 91,920 mts. of wheat and 1.7 millions of maize were placed in the Commodity Exchanges of Chicago and New York. Zedillo: 1996.
6
During the last years of CONASUPO, the Company’s sales of maize were to tortilla producers
or “nixtamaleros” (they ground the maize and elaborate tortillas). In order to support the subsidy
to tortilla consumers, CONASUPO provided the maize to them and sold it at a price that allows
“nixtamaleros” a "reasonable" profit for their tortilla sales at a subsidized price. The other
processors that received a subsidy were the maize millers. They received a cash subsidy for the
maize bought directly in the domestic market (“at prices linked with the international prices”,
Zedillo: 1997) that allowed them a "reasonable" profit so as to support the consumers' tortilla
subsidy program.
Direct income transfers
Three years after the creation of ASERCA, a major transitional program called PROCAMPO
was initiated in the winter season of 1993-94, a few months before the beginning of NAFTA.
PROCAMPO is a decoupled program that substituted previous direct price supports. It consists
of income transfers to farmers producing barley, beans, maize, cotton, rice, sorghum, soy,
sunflower and wheat. The main purposes of PROCAMPO are to support domestic producers of
basic staples to face competition from U.S.A. and Canadian farmers granted by NAFTA, and to
help Mexican producers to switch to more competitive crops under a liberalized context.
PROCAMPO is planned to last until 2008, when full trade liberalization under NAFTA will be
attained, and its beneficiaries have been those producers that cultivated (or continue to cultivate)
the above-mentioned crops during the three years before its implementation. The transferred
amount is per hectare and the same to all farmers, independently of productivity and granted
even if the beneficiaries switch to produce other crops.
Alliance for the Countryside
In addition to the ASERCA and PROCAMPO the Zedillo Administration (1995-2000) created
Alliance for the Countryside (Alianza para el Campo) during his first year in government.
Alliance’s main objective is to increase agricultural productivity and to capitalize farmers by
participating with funds in farmers’ investment and sanitary projects leading to integrate farmers
with the food chain. A major purpose of Alliance is to promote farming efficiency through crop
substitution (mainly from basic crops to fruits and vegetables) for farmers who have a potential
comparative advantage in producing such crops in the context of an open economy. Other

7
important features of Alliance include its decentralized character with state-level control of its
programs and contribution to the funding by participating farmers. (www.sagarpa.gob).
Alliance for the Countryside includes PROCAMPO, as well as other programs. The most
important amongst these is PRODUCE, which focuses on three main activities: the use of
irrigation canals to deliver liquid fertilizer, mechanization, and the improvement of pasture
quality for livestock producers. Alliance also includes a phytosanitary program.
Other reforms
Less government intervention in agriculture was accompanied by the abolition of State
enterprises involved in the sector. As well as the disappearance of CONASUPO, government
companies producing fertilizers, seeds and other inputs, and those involved in the marketing of
coffee, sugar and tobacco were eliminated or privatized.
Credit subsidies and official credit coverage for working capital given to farmers by public
financial institutions for rural development (the most important being BANRURAL) declined
sharply during the nineties. There are several reasons explaining the reduction of government
participation in rural credits, ranging from public budget restrictions to a very high default rate
from the benefited farmers. The gap caused by the decline in governmental rural credit was
expected to be filled by commercial banking.
Another major reform was the amendment of the Constitution in 1991 by the Salinas government
to liberalize property rights in the ejidal sector. Up to that year, peasants that benefited by land
distribution (a result of the Mexican Revolution, and called ejidatarios) were, by law, not
allowed to associate, rent or sell their land. With the reform this mandate has disappeared and
land redistribution ended. The ejidal reform is expected to develop the land market, and to
capitalize agricultural activities by allowing farmers to participate in the private credit market
and by promoting direct private investment.
The Salinas administration created the Ministry of Social Development, and with it, a social
program designed specifically to attend the rural poor (called Progresa during the Zedillo
government).

8
II.2 Trade liberalization and NAFTA
With NAFTA, the structure of border protection for Mexico’s agricultural sector was radically
transformed. Agricultural trade liberalization was then partially extended to other countries
following the Uruguay Round Accord of GATT (Table 2). With NAFTA Mexico also gained
market access to the Canadian and the U.S.A. markets.
Two separate agreements between Mexico and Canada and between Mexico and the U.S. were
negotiated.8
Market access granted by Mexico under NAFTA
Since the beginning of NAFTA, some products that Mexico considered as basic crops were
liberalized. Thus, from January 1994 onwards, sorghum, sesame seeds, suflower and sunflower
from Canada and the U.S. enter free to Mexico. Free trade also applies to seeds for cropping of
barley, beans, maize, cotton, soy, suflower and sunflower, and since January of 1998 all types of
soy also enter free to Mexico from its other two North American partners.
NAFTA became the first free trade agreement using tariff rate quotas (TRQs) as a transition
mechanism to eliminate quantitative restrictions and to move towards a free trade. TRQs are
applied to those products that the governments of the three North American countries considered
very sensitive in the NAFTA negotiations. Under NAFTA, no tariffs for those agricultural
products that are under in-quota imports are charged. A phase-out period of fifteen years of
above-quota tariff reductions and quota increases was settled for the imports of Mexico of maize
and dry beans. 9 TRQs were also established for grain and malt barley, for which free trade will
be reached in 2003.
8 In the following discussion, we will emphasize the agricultural agreement between Mexico and the U.S.A., because, in the short and medium runs, major impacts of NAFTA will be on Mexico-U.S.A. agricultural trade (see below). 9 In the agreement between Mexico and the U.S., powdered milk was also included by Mexico under this scheme.
9
Quota levels were established using trade flows between Mexico and its two North American
partners from 1989 to 1991. In 1994 the quota for maize was settled to 2,500,000 metric tons
(Mts.) for the U.S. and to 1,000 Mts. for Canada, and the above-quota base or consolidated tariff
for both countries was fixed to 215 per cent (or 206.4 U.S.$/mts.). In January of 1994, the quota
for beans was 50,000 Mts. for the U.S. and 1,500 for Canada, and the above quota tariff was 139
per cent (480 U.S. $/Mt). For both, grain and malt barley, the quota was settled in 1994 to
120,000 Mts. for imports from the U.S. and 30,000 Mts. for imports from Canada, and the
above-quota ad-valorem tariff for grain barley was 128%, and 175% for malt barley.
Beginning in 1995, the quotas for barley, beans and maize are growing each year and their above
quota tariffs have been subject to a yearly process of reductions. This process of liberalization
was designed under NAFTA for beans and maize to reach full free entrance to Mexico by
December, 2007. Full liberalization for barley will be faster: it will be reached in January, 2003
(Table 4a).
Until the end of the Zedillo´s Administration in 2000, quota assignments were settled by a
Committee formed by the Ministries of Commerce (SECOFI) and Agriculture (SAGAR), and by
representatives of the private sector. The Mexican government has followed four allocation
mechanisms for TRQs: direct assignment, auctions, government monopoly and "first come-first
served". Maize and barley have been subject to direct allocations, and dry beans to auctions.
Up to 1999, CONASUPO participated indirectly in the allocations of maize quotas since,
together with the Ministry of Agriculture, defined the amount of the crop to be allocated to
accomplish what were the Company's reduced functions (mainly stock pilling and sales to tortilla
producers to sustain the tortilla subsidy program). The rest of the maize quota has been allocated
to private cattle feeders. (See Shagam and Plunkett: 1997).
From the beginning of NAFTA implementation up to 2000, Mexico did not charge above quota
tariffs to any of the crops subject to TRQs. This has been because its import requirements have
been lower than the accorded quota or the Mexican government has increased the quota.
10
Mexico's imports of beans have been lower than the quota, and while this has not been the case
for maize, above quota imports were allowed without applying the high over-quota tariff. 10
In January 1995, Mexico re-structured its protection measures for WTO members following the
Uruguay Round Accord. The main difference between Mexico’s commitments under NAFTA
and under the WTO is twofold. 1) Greater quota access and lower off-quota tariffs for Canada
and the U.S.A. than the rest of the world. 2) By the year 2003 or 2008, and depending on the
commodity, Mexico will abolish all border protection of imports from Canada and the U.S.A.,
whereas Mexico will maintain the 1995 quota levels and off-quota tariffs for other WTO
members and reduce tariffs to MFNs by an average of 24 percent between 1995 and 2000.
Mexico has included a safeguard clause for several agricultural products. Under NAFTA, it can
be used as a "countervailing mechanism" when an increase of imports represent a "considerable
menace" or a "serious damage" to the sector in question. In this case, the measures to be taken
are either to suspend the tariff reduction process or to use (to "snap back" to) the base tariff
settled in 1994. In the WTO, the Mexican government is allowed to set additional import taxes
when "imports rise due to low import prices".
Market access for Mexican exportables granted by the U.S.A. under NAFTA
With NAFTA, market access to Mexican competitive crops --mainly fruits and vegetables--
exported to the U.S. has increased. However, trade liberalization was not immediate for those
products considered by the U.S. as sensitive. For these commodities, the process of negotiations
with Mexico to phase out trade restrictions was based on the complementary or substitutive
character of Mexican exports, meaning that the agreed liberalization process of these products
were based in the productive annual cycles of vegetables and fruits in both countries. Thus, trade
restrictions of some products exported by Mexico to the U.S.A. were eliminated in 1994 (grapes,
mangoes and pineapples); and for most of vegetables and fruits tariffs are charged for some
10 Imports of beans are low because Mexico has been self-sufficient in the type of beans preferred by its population. This crop was included in the TRQ scheme mainly because the farmers that produce beans have marketing problems and because it is a major component of the Mexican diet.
11
periods of the year until its elimination in 2003 or in 2008 (for some of these commodities TRQs
are also applied (Table 4b)11
III. EXPECTED IMPACTS OF AGRICULTURAL LIBERALIZATION AND NAFTA 12
The expected effects on the agricultural sector of Mexico arising from trade liberalization (and of
NAFTA in particular) and policy reform are the following.
1) Agricultural imports would increase by the reduction of tariff and non-tariff barriers and
domestic producers of importables would be forced to compete with foreign goods (especially
those coming from the U.S.). In addition, deregulation of the markets of these products would
probably lead to falling product prices and hence, to a reduction of their domestic supply.
Exportables would benefit from the elimination of restrictions to trade. Overall agricultural trade
would grow, as well as agricultural supply, particularly agricultural exportables.
2) Trade liberalization would improve resource allocation, efficiency and agricultural
productivity. We would hence expect a change in the product mix of agriculture and hence in
area shares, reflecting each crop’s comparative advantage. That is, importables would experience
a decrease in their area share and exportables an increase.
3) Yields of importables would increase under NAFTA, as the least productive land and
producers exit, and also because those farmers still producing importables would have to lower
their unit costs in order to compete with growing imports. The expectation for exportables is that
11 An example is fresh tomatoes. From January 1994 to December 1998, fresh tomatoes had a tariff of 3.3 U.S. cents per kilogram entering the U.S. between July 15th and Sept. 14th (this tariff was eliminated in January 1999). The tariff charged by the U.S. of Mexican tomatoes entering there from March the 1st to July 14th and from Sept 15th to the end of February will be eliminated in Dec. 2003. In addition, Mexico’s exports of tomatoes to the U.S. have a TRQ of 172.3 thousand of metric tons from November 15 to the 28th or 29th of February, and of 165.5 thousand of metric tons from March 1st to June 14th. Over-quota imports to the U.S. are charged the lower of the most-favoured-nation (MFN) tariff in effect before NAFTA and the MNF rate in effect at the time of the over-quota trade. Details are in ERS: August, 1999 and March 2000, and SECOFI: 1994. Mexico’s exports of avocados to the U.S.A. are a special case, since they are subject to phytosanitary restrictions. Partial easing of avocado imports to some regions of the U.S. was decided in 1997 and amplified in 2001 (see Orden, D.: 2002). 12 The following summary is based on documents written by Mexican government officials (Casco and Rosensweig: 2000, Rosensweig: 2000 and Dec. 2000); on the results of General Equilibrium Models applied to Mexico with emphasis on its agricultural sector (Robinson et.al.: 1991 and Levy and Wijnbergen: 1992); and by the works of Krueger, Shiff and Valdes: 1991, Helfand and Castro de Rezende: 2001, and Quiroz and Opazo:2000.
12
productivity gains would be less associated with trade reforms, at least in the short run, because
Mexico was before NAFTA already a highly competitive producer of these crops.
4) The elimination of official credit subsidies and an increased participation of the private sector
in the agricultural credit market should also increase this sector’s productivity.
5) In the medium run, investment in the sector would increase due to the ejidal land reform and
NAFTA. Furthermore, in a more open trade regime this would permit to incorporate modern
imported technology and increase productivity.
6) The process of structural change in agriculture could lead to increase rural out-migration.
7) The elimination of industrial protection should lead to a reduction of agricultural physical
capital and input prices (such as tractors, irrigation equipment, fertilizers and improved seeds). 13
In what follows, our purpose is to assess the above predicted impacts of NAFTA on agriculture
by contrasting them with the trends of the relevant variables. However, the treatment of each of
these impacts varies according to their nature and data availability. To evaluate predicted effects
1 to 4 we will first study the evolution of agricultural prices of major non-animal agricultural
products beginning in the 1980s and up to 2000, and then examine the trends of imports exports
and domestic production during the same period. The remaining expectations will be discussed
with available information.
IV. CHANGES IN AGRICULTURAL PRICES 14
In this Section, we conduct a study of the factor influencing real domestic prices over time of
major Mexican non-animal agricultural commodities, both importables and exportables. The
approach followed is convenient since it is simple, and it includes changes in the real exchange 13 The prediction that NAFTA promotes trade diversion is controversial and difficult to evaluate. Some authors argue that the decision to sign a free trade agreement as NAFTA indicates that trade diversion was expected to out-weight trade creation (see Sanguinetti and Bianchi’s contribution); the results of a Computable General Equilibrium Model about the impacts of NAFTA indicate that NAFTA would not have significant trade diversion effects (Robisnson et.al: 1991); and other specialists argue that NAFTA signature could have helped the multilateral agreement on agriculture of the Uruguay Round (Josling, T.: 1999).
13
rate of the peso, and hence the sharp fluctuations it experienced before and after NAFTA
implementation.
The analysis of the evolution of prices allows us to infer the degree of divergence between
domestic and international prices of the selected traded commodities during the 1980s and 1990s,
as well as the impact of policy changes followed during the latter period. It also helps to explain
the trends of domestic production of major traded crops discussed in Part V below.
Agricultural prices
In order to quantify the impacts of policy reforms and NAFTA in agricultural prices, the
methodology of the “law of one price” proposed by Quiroz and Valdes (1993) is applied for
both, major importable and exportable crops. The method is simple, and consists in decomposing
the percentage change in a good real domestic price into the three components: the percentage
change in its real international price; the percentage change in the real exchange rate (of the
U.S.A. dollar against the peso) and a residual that captures the percentage change in policy and
other factors.
The expression for the decomposition in logs and first differences is:
)T1ln()1ln(RERlnplnpln ititt*itit +∆+θ+∆+∆+∆=∆
where
itp is the real domestic price of good i in time t (nominal domestic price divided by a domestic
inflation index, tit INF/P ),
*itp is the real international price (nominal U.S. price divided by a U.S. inflation index
*t
*it INF/P ),
tRER is the real exchange rate ( t*t*t INF/INFE ),
14 This section follows the study by Helfand and Castro de Rezende (2001) of the evolution of prices of the Brazilian agricultural sector.
14
θit is a markup that includes the transactions costs and a competitive profit margin that are
necessary to make the domestic price comparable with the international price.
itT is the residual proportional difference between the two prices after the markup has been
considered, and can be thought of as the tariff equivalent of good i in time t.
Since itp , *itp , and RERt are easily observable, and changes in itθ are unlikely to be large, 15 we
treat the other factors as a residual in the empirical work. Large variations in the residual can
hence be related to significant changes in policy.
Tables 5 and 6 present the results of the decomposition of the movements of the real domestic
price of Mexico’s major importables and exportables, respectively, from 1977 to 2000. 16 In the
study we use two types of criteria to distinguish this period. 1) The first criterion is to divide it
into three sub-periods in accordance to the trends of government intervention in the Mexican
economy. 1.1) Import substitution policies were implemented up to the debt and macroeconomic
crisis Mexico suffered (that is, from 1977 to 1982). The next eight years marked the beginning of
policy reform. 1.2) A deepening of these reforms was decided between 1991 and 1993; whereas
1.3) NAFTA implementation began in 1994. 2) The second criterion takes into account the sharp
modifications in the real exchange rate of the peso against the U.S.A. dollar that occurred during
the 1990s. So we compare here 1995-96 with respect to 1993-94 (the former years cover the peso
devaluation) and 1997-2000 with 1995-96, when peso appreciated.
Importables
Policy (together with the devaluation of the peso) isolated domestic producers of basic crops
(barley, maize, sorghum, soy beans and wheat) from the drop of their international real prices
from 1983-90 with respect to 1977-82 (Table 5). For example, the real domestic price of barley
15 This because itθ reflects a hypothetical competitive, rather than an actual, profit margin, and changes in transactions costs, in addition, are unlikely to represent a large share of a change in a good’s price. So, following Quiroz and Valdes, we treat itθ as constant over time and drop it out of the equation. 16 Domestic nominal prices are the average producers' prices which come from the Mexican Ministry of Agriculture Statistical Yearbooks; international prices are U.S. prices received by farmers, and come from USDA, Economics and statistics system; the inflation index for Mexico is the consumer price index as reported by World Bank in its World Development Indicators 2001; the foreign inflation index is the U.S. consumer price index, also from the World Bank; and the exchange rate is the price of a U.S. dollar in terms of the peso, and comes from the Central Bank of Mexico (Banco de Mexico).
15
remained practically the same during the period, whereas its real international price decreased by
63%; this drop was compensated by the real devaluation of the peso (25%) and by policy
interventions (44%).
By contrast, and when dividing the period of reforms according to the evolution of the real
exchange rate, changes in real domestic prices of major importables have followed the changes
in international prices: when the latter dropped (1991-93 with respect to 1983-90 and 1997-2000
Vs 1995-6) the former also decreased, and when international prices raised (1995-6 vs 1993-94),
domestic prices also increased. Amongst the five crops considered, the only exception in this
tendency was maize for the first two periods (1991-93/1983-90 and 1995-6/1993-4). That the
real domestic price of corn followed its international price during 1997-2000 with respect to
1995-96 suggests that it was until the end of the 1990s when maize price reforms were really
implemented.
The results presented in Table 5 also suggest that, beginning in 1991-3, the appreciation of the
peso was accompanied by increasing regulation and that the opposite happened when the peso
devaluated. That is, the first period of real appreciation of the peso (-20% from 1991-93 with
respect to 1983-90) coincides with a positive policy residual (10%); the next period,
characterized a peso devaluation in real terms (39% from 1995-6 with respect to 1993-94), was
when the policy residual decreased (-34%); and when the peso appreciated again (-33% from
1997-2000 with respect to the previous two-year period), the policy residual raised again (25%).
This was also the case for each of the imported commodities, but for maize during two periods:
when the peso appreciated (1991-3/1983-90), the policy residual was negative (-25%), and when
the peso suffered a devaluation (1995-6 with respect to 1994-93), the policy residual was
positive, although low (0.09%, in Part V below, we discuss this result in the light of the observed
tendencies on domestic production).
As expected, real domestic prices of all basic crops decreased under NAFTA (that is from 1994-
2000 with respect to 1991-93). In addition, the policy residual was also negative for this period
and for each crop. Again, the only exception is maize, for which the policy residual was positive
(10%), helping to partially isolate maize real domestic price from the drop it suffered from 1994-
2000 with respect to the previous three-year period (last row of each component of Table 5).
Also in accordance with the expectations is that, since 1991-93 with respect to 1983-90, 1995-6
16
in relation to 1993-94 and 1997-2000 with respect to the previous two year period, the real
domestic prices of the studied importables taken together have followed more closely
international prices.
Exportables
Before discussing our results of the price decomposition analyses for major vegetables and fruits
exported by Mexico, it is necessary to consider three aspects related to these commodities. 1) In
contrast with other Latin American countries, the Mexican governments did not have taxed
directly exports of vegetables and fruits; 2) these commodities are highly perishable, meaning
that their marketing conditions are volatile since they change in very short periods of time;17 and
3) these commodities are heterogeneous between them and within them (for example, the best
quality vegetables and fruits are the ones that are exported, whereas those of less quality are sold
to the domestic market). However, our price decomposition calculations are based on annual data
and no distinction about the quality of the studied crops is made. Notwithstanding this, some
insights can be obtained from our estimations of their price movements.
For the study of exportables we selected the eight fresh/frozen vegetables and the ten fruits
whose trade liberalization process under NAFTA are presented in Table 4b (as will be seen in
Part V, these commodities are the most exported agricultural commodities to the U.S.A.). 18
The simple average changes in the residual of the selected vegetables and fruits show that their
sign was the same and the percentage change similar to importables during the 1990s; that is:
from 1995-96 with respect to 1993-94, from 1997-2000 as compared to 1995-96, and also during
NAFTA with respect to 1991-93 (compare last column and last rows of Tables 6a and 6b with
last column and rows of Table 5). In addition, from 1995-96, real domestic prices followed real
international prices for both major importables and exportables (the exemption are vegetables,
from 1995-6 with respect to 1993-4; compare 3rd and 4th columns, three last rows of Tables 5, 6a
and 6b). If we add that as for importables, the policy residual was, for both groups of
commodities, negative when the peso devaluated (1995-96) and positive when peso appreciated
17 A seasonal or monthly analysis is required to consider this feature. 18 Eggplants are another important exported commodity. It was excluded in the analysis since no data for the whole period under study were found.
17
(1997-2000), all this suggests that, overall, exportables and importables have had a similar policy
treatment during NAFTA, and/or that the residual made the changes in domestic prices of traded
commodities to be close to the modifications of their international prices under a context of
strong modifications in the real exchange rate of the peso.
The results of our price decompositions by each major exportable, show that for most of them,
the changes in the residual during the three last studied periods have the same sign as for the
simple average (the exceptions being asparagus, garlic, peppers and papaws, but for just one of
the these three periods, Tables 6a and 6b). However, when taken separately, changes in real
domestic prices of major exported vegetables and fruits do not coincide with the variations of
their international prices (although this is not the case for some fruits). This may be explained by
the differences in quality between exported vegetables and fruits with respect to those sold in the
domestic market, a question that needs further study.
V. TRENDS IN TRADE AND IN DOMESTIC PRODUCTION
In this Section, we study whether or not NAFTA implementation has been accompanied by: a
rise in non-animal agricultural trade; a change in the domestic supply of major importables and
exportables; a productivity increase; and a modification of the crop mix of agricultural
commodities produced by Mexico. In the discussion we will refer to the results obtained in
Section IV, and consider the heterogeneous character of Mexican agriculture by distinguishing
rain-fed and irrigated production of importables. 19
As predicted, Mexico's overall agricultural trade has grown during the nineties, and this has been
especially so since the beginning of NAFTA. The above is shown in Table 7 and, in particular,
by the raising weight of Mexico’s agricultural trade on agricultural domestic production: it
increased from an average of 23% during the four years before NAFTA to more than 39% from
1994 to 2001.
19 We did not distinguish irrigated and rain-fed conditions of production exportables. This is because --in contrast with importables--, most of vegetables and fruits are produced for the market. In addition, there is not a clear cut between domestic and foreign sales according to water availability.
18
The weight of the U.S.A. in Mexico’s agricultural trade has been very high before and after
NAFTA. From 1990 to 1993 imports from the U.S.A. accounted for 86.7% of Mexico’s total
value of agricultural imports, and the figure was 85% for the following eight years; whereas the
participation of Mexican agricultural exports to its northern neighbor were 93% and 97% for the
same two periods. 20
The raising weight of Mexico’s foreign agricultural trade is basically explained by the increasing
trade of Mexico with the U.S.A. (Table 8). 21 The value of Mexico’s total agricultural trade with
its northern neighbor jumped from 5,898 millions of dollars during 1990-93 to almost 10,000
millions during 1994-2001. However, the tendency was disrupted by the macro economic crisis
Mexico had in December of 1994 and during 1995, when the peso suffered a strong real
devaluation, and total agricultural imports collapsed from 4,593 millions of dollars in 1994 to
3,540 millions in 1995 and exports raised from $2,895 to $3,863 for the same two years.
When macro stabilization began, Mexico’s agricultural imports from the U.S.A. raised again to
an annual average of more than 6,000 millions of dollars during 1996 to 2001. The trend of
agricultural exports from Mexico to the U.S.A. has been somehow different since,
notwithstanding their jump in 1995, the value of agricultural exports have been greater than the
level attained in 1995 in every of the following six years.
The most imported goods by Mexico to the U.S.A.--before and during NAFTA implementation--
are grains and feeds, and oilseeds, accounting, from 1990 to 2001, for 28.3% and 16.2%
respectively of the total value of agricultural imports. Major agricultural exports of Mexico are
vegetables and fruits, explaining, respectively, around 30% and 11% of Mexico’s total value of
agricultural exports to the U.S.A. 22
20 A note of caution is necessary for the figures on exports, since the data on total exports given by Mexican official sources are, for some years, lower than the figures on U.S.A. imports from Mexico as reported by the U.S.D.A. (for example, compare figures of third row, Table 7, with those of total exports from Mexico to the U.S.A. of Table 8. Notwithstanding this, the above weights coincide with the figures of SECOFI since, according to this source, the weight of the U.S.A. on Mexico total agricultural trade raised from 74% during 1990 to 79% during 1999 (Casco and Rosensweig: 2000, p. 69). 21 Almost all of Mexico imports of maize and sorghum come from the U.S.A.; most of imports of barley and wheat from this country and Canada; and most of Mexican exports of vegetables and fruits go to the U.S.A. (see ERS: August, 1999). The two major imported cereals by Mexico are maize and wheat, accounting for 55% and 31% respectively of Mexico’s imports of cereals (Rosensweig: feb 2000). 22 See details below. In addition to vegetables and fruits, coffee is another major Mexican agricultural export, whose weight in the value of total agricultural exports of Mexico to the U.S.A. is around 10%.
19
Since the beginning of NAFTA and with the exception of 1995, Mexico has experienced a deficit
in total agricultural trade with the U.S.A. The deficit increased from an annual average of 756
million of dollars from 1990 to 1993 to 1,250 millions since the beginning of NAFTA
implementation (Table 8).
Major non competitive crops
The data on domestic production and imports show that, after seven years of NAFTA
implementation, only soybeans and wheat decreased in domestic production and increased in
imports.23 Imports of barley, beans, maize, and sorghum also grew during the same period, but
their domestic production did not drop (compare columns 3 and 4a of Table 9).
Both, cultivated and cropped area of major importables has remained practically the same during
NAFTA as compared with the period covering 1983-90, whereas both declined from 1991-93
(Table 9, last three rows of Cols. 5a and 6a, respectively). Looses slightly declined during
NAFTA with respect to 1983-90 and yields grew during the three years before NAFTA and have
remained practically unchanged since then (from an annual average of 2.02 Mt. Tons per hectare
(Ha.) during 1983-90, to 2.28 during 1991-93 and to 2.29 for 1994-2000.
However, if one considers the production conditions of these grains and oilseed --approximating
this feature by distinguishing whether these crops are obtained using irrigated or rain-fed lands--,
the previous assessment changes. Total production of these commodities in irrigated lands raised
during 1991-93 with respect to 1983-90 (15%) and remained practically unchanged during
NAFTA (-0.01%); and both, area planted and cropped did not change during 1980-90 with
respect to 1991-93, and dropped during the NAFTA period (Table 9, last rows, Cols. 4b, 5b and
6b, respectively). This meant that yields under irrigated conditions have increased continuously
during the whole period under study (from 3.61 Mt. Tons per Ha. during 1983-90, to 4 Mt. Tons
and to 4.6 during the NAFTA period). By contrast, production, cultivated and cropped area of
grains obtained under rain-fed conditions increased during NAFTA (15%, 19% and 14%,
respectively), whereas yields in these lands have remained practically the same (from 1.5 Mt.
Tons per Ha. during 1983-90, to 1.7 during NAFTA).
20
Similar contrasts between the evolution of irrigated and rain-fed production are observed if we
consider crop by crop. For example, maize yields under irrigated conditions increased from 3.13
Mt. Tons/Ha through 1983-90 to 4.15 during the three years before NAFTA and to 4.94 from
1994 to 2000. By contrast, yields of rain-fed land used to produce maize were 1.58 during the
first period, and 1.83 through the following two periods under study.
So, the expectation that by the competition caused by NAFTA the domestic productivity of
importables would raise holds for crops produced under irrigated lands. If we consider that in
general, commercial farmers are the ones with access to irrigation, and subsistence farmers are
not, we can propose that trade liberalization of importables have promoted a more efficient land
use by the latter type of farmers. 24
The differences in reaction to external shocks between producers of major importables under
irrigated and rain-fed lands are also shown when relating our price decomposition study with
production. As expected, during the devaluation period of 1995-6 with respect to 1993-94 (39%)
and when government intervention was reduced (-34%, Table 5), production of major
importables under irrigated lands dropped (-16%), but supply under rain-fed lands increased
(28%, Table 9, columns 4b and 4c, respectively). The same observation applies when
considering crop by crop and separating production according to water conditions. The only
exception is irrigated sorghum, whose production increased during the period of peso
devaluation (70% from 1995-6/1993-4). 25
As discussed in Part IV, an unexpected trend also applied to maize for the previous period (1991-
93 with respect to 1983-90), because in this period the peso appreciated, but the policy residual
was negative. Notwithstanding this, the production of irrigated maize raised, whereas the
tendency for the remaining irrigated crops (but for barley) was the opposite and the expected
one. A closer look of the data shows that the changes in production (and in cultivated area) for
23 However, the collapse of the domestic production of soybeans beginning in 1995 was mainly because the crop suffered white fly infestation in soybean production areas. 24 The contrast of looses between irrigated and cropped lands shown in Table 9 also reflect the sharp differences in the production conditions according to water access. 25 Soybeans is a special case, because of the disease we already mentioned and since most of its production is done under irrigated lands.

21
irrigated maize and sorghum during these two periods have opposite signs. 26 This observation,
together with the unexpected changes in the production of maize and sorghum discussed
previously, indicate that commercial producers of these two crops may have reacted to external
shocks by switching from sorghum to maize production and vice-versa (this hypothesis has to be
tested and is plausible because, in terms of production, these two commodities are substitutes).
The relative isolation of production under rain-fed lands to external shocks could be explained by
the fact that most of rain-fed production is conducted by small farmers facing high transaction
costs. This is specially the case of maize since a considerable portion of Mexico's supply of this
staple comes from small household farms with rain-fed land, lacking infrastructure and
producing for their families' own consumption.27.
If we consider that most of Mexico rural population is involved in maize production, the above
could explain why rural out-migration has not sharply increased during NAFTA, as was
expected. The validity of the hypothesis is also suggested by the facts that non-agricultural
sectors have just barely absorbed the new comers to Mexico’s labor force during the 1990s, and
that agricultural employment did not change during the same period (Yunez-Naude: Jan. 2001)
Major Exportables
As expected, total Mexican agricultural exports to the U.S. has grown since NAFTA: from an
annual average of around 2,571 millions of dollars during 1990-93 to 4,316 during 1994-2001
(Table 8). The same trend experienced major exported vegetables and fruits of Mexico, whose
exports to the U.S.A. raised by 57% during NAFTA as compared to 1992-3 (Table 10a).
The eighteen selected vegetables and fruits for the price decomposition analysis are the most
important exports of Mexico: between 1992-3 and 1994-2000 they account for around 37% and
40% respectively of total agricultural exports of Mexico to the U.S.A. (the total includes animals,
live cattle and processed agricultural products, last row of Table 10a). Within them, vegetables
26 Irrigated cultivated area with maize increased during 1991-93 with respect to 1983-90 (98%) and declined during the following period (-26%), whereas sorghum experienced changes in to opposite directions (-29% and 70%, respectively, Table 5). 27 According to the Agricultural Census of 1990, more than 55 percent of the agricultural units under 5 hectares of
arable land produce for the household's own consumption (Hernandez Estrada, 2000). See Taylor’s contribution for an analysis of the effects of exogenous shocks in a context of market imperfections.
22
are the most imported and commodities, explaining between 71% (1992-3) and 77% (1994-
2000) of total exports of selected vegetables and fruits.
Most of the selected vegetables and fruits were considered by its northern neighbor as
competitive, and hence, have not yet full access to the U.S.A. market (the exceptions are garlic,
grapes, papaws and strawberries, see Table 4b).
Notwithstanding the above, Mexican exports of major vegetables and fruits to the U.S.A. have
grown during NAFTA: from an annual average of 6.6 millions of U.S. constant dollars to 10.4
millions during NAFTA, and all of major selected commodities have experienced a growth in
their exports: from 9% (mangoes and guabas) to 213% (asparagus) from 1994-2000 with respect
to 1992-3 (Table 10a). 28 However, the figures show that this trend had two periods caused by
the evolution of the real exchange rate of the peso against the U.S.A. dollar. Taken together,
exports of major vegetables and fruits to the U.S.A. increased by more than 30.8% during 1995-
96 (the period of the peso devaluation as compared to the previous two-year period). When the
Mexican economy and the exchange rate was stabilized, the rate of growth diminished (11.1%
from 1997-2000 with respect to 1995-6)
As exports, total domestic production of selected vegetables and fruits has also been growing
during NAFTA implementation: from an annual average of 3.6 millions of Mt. Tons during
1983-90 to 4.0 millions during 1991-93 and to 4.2 millions during 1994-2000 for the former
commodities, and from 6.1 millions of Mt. Tons to 6.9 and to 8.4 millions during the same
periods for fruits (fourth column and last rows of Tables 11a and 11b). This was also the case of
each of major exported vegetables and fruits. However, exports of these products --either taken
together or by commodity-- have grown considerably more than their domestic production. The
volume of total exports of vegetables grew by 68% during the first seven years of NAFTA with
respect to 1992-93, whereas the rise of the volume of Mexican production of these crops was just
over 5% during the same phase; and the figures for major exported fruits were 75% and 25%,
respectively (compare Cols. 3 and 4 of Tables 11a and 11b).
28 Mexican sales to Canada of major exported vegetables and fruits have also grown: from 12.1 millions of U.S.A. dollars during 1992-3 to 17 millions during 1994-2000 (Table 10b). However, as compared to exports to the U.S.A., these figures have remained extremely low.
23
The data on the evolution of cultivated and cropped area of major exported vegetables show that
it raised from 1991-3 (22% and 23%, respectively) with respect to 1983-90 and declined during
NAFTA (–16% and –14%, respectively), while yields had the opposite tendency (they decreased
during the first period by –8% and increased by 22% during NAFTA as compared to 1991-93,
last rows, columns 5th, 6th and 8th of Table 11a).
A plausible explanation of these trends is that during NAFTA negotiations (1991-93), the
expectations amongst Mexican commercial farmers was that with the agreement they would have
freer access to the U.S.A. market than before (that is, during 1983-90), and acted accordingly by
planting more vegetables. Since NAFTA implementation meant freer but limited market access
for Mexico’s competitive vegetables, Mexican farmers reacted by increasing (land) productivity.
The above hypothesis is not contradicted when considering the sharp changes in the real
exchange rate that the peso experienced during the 1990s. This is so because the rate of growth
of exports of major vegetables to the U.S.A. was very similar during NAFTA negotiations and
peso appreciation (10% from 1991-93 as compared with 1983-90) with respect to the period
where the peso appreciated again, under NAFTA (11% from 1997-2000 as compared with 1995-
6, Tables 9 and 11a). 29
Cantaloupe and watermelon (or melons) had a similar trend of cultivated area and yields as
major selected vegetables; that is, cultivated area increased considerably during 1991-93 and
decreased during NAFTA, whereas yields had the opposite tendency (Table 11b). Adding to this
the fact that, as vegetables, these two commodities compete with U.S.A. production, the
proposed hypothesis to explain the trends of vegetables can be applied to melons.
As for the remaining major exported fruits, cultivated area increased during the two periods, but
the rate of growth was much lower during NAFTA (2%) as compared with the sharp increase it
experienced during 1991-93/1983-90 (18%). By contrasts to vegetables and melons, yields of
these commodities have remained practically the same during NAFTA as compared to 1991-93
or even to 1983-90 (the exemption being strawberries). If we consider that all of this remaining
exported commodities (but strawberries) are plantations, whose nature limits the substitution of
29 As expected, during the period of the real depreciation of the peso (1995-6), exports of vegetables sharply raised to 40% with respect to 1993-4.
24
other land use for trees, it can be argued that, as vegetables and melons, the observed trends in
the domestic production of plantations is explained by the favorable expectations that farmers
had about their future business under a free trade agreement with the U.S.A. (this hypothesis is
evaluated in the following section).
The rising exports of vegetables and fruits from Mexico to the U.S.A. indicate that NAFTA has
promoted them. However, according to the ERS the explanation lies outside NAFTA. The
argument is that --among other commodity-specific reasons-- peso devaluation and increasing
consumer demand in the U.S.A. of vegetables and fruits are two major factors explaining
Mexico’s increasing exports of these commodities during NAFTA (ERS: 1999 and 2000).
However, data used by ERS published studies are up to 1998, and our more updated information
indicates that Mexican exports of these commodities continued to rise in 1999 and 2000 or, what
is the same, considerably grew during the peso appreciation period of 1997-2000. 30
In summary, the evolution of domestic production and exports to the U.S.A. of major vegetables
and fruits during NAFTA backs the prediction that freer agricultural trade would promote trade;
it also suggests that Mexican producers of these commodities have reoriented its sales to North
America. The fact that only competitive vegetables have experienced higher yields during
NAFTA, indicates that greater but restricted access to the U.S.A. market has promoted a more
efficient use of land in this component of Mexico’s agriculture, probably through technological
change.
What has been common to all major exported vegetables and fruits is that the ratio of planted to
cropped area (or looses) has sharply decreased during NAFTA implementation for each of
vegetables and fruits (the only exception are cauliflower and broccoli, Col. 7 of Tables 11a and
11b). This suggests (together with observed rise in yields for vegetables) that a more efficient
land use has occurred during NAFTA.
Changes in the crops mix
30 In addition, part of the growth of consumer demand in the U.S.A. of vegetables and fruits may be due to lower prices arising, precisely, from NAFTA.
25
Notwithstanding the above findings, the data on the trends on domestic production of agricultural
importables and exportables before and during NAFTA does not suggest a major change in land
use.
In order to study the validity of this contention, we did a correlation analysis between cropped
area with importables and exportables before and during NAFTA. We found evidence that, for
1990-93, exportables substituted importables, whereas this was not the case for the NAFTA
period (1994-2000). That is, in terms of area planted, importables and exportables have followed
their own trend during NAFTA implementation.
The result suggests that NAFTA has not provoked a change in the crop mix. In addition, the
evidence that this did happen before NAFTA (i.e. during the beginning of deep domestic
agricultural policy reforms) and that PROCAMPO and Alliance for the Countryside began to be
implemented after that period (1994 and 1995, respectively), indicates that these transitional
agricultural policies, although in a context of market-orientation, may have helped Mexican
farmers --specially so for producers of importables to face competition from its North American
counterparts. To evaluate this hypothesis, a revision of agricultural supports implemented during
NAFTA is required.
VI. THE ROLE OF GOVERNMENT SUPPORTS
Credit is a major variable that has to be considered in a discussion of the role of the Mexican
government in the context of policy reforms. Before them the government granted credit
subsidies to farmers and provided 55% of total credit given to the agricultural sector during the
19980s. Since 1990, official credit has been sharply reduced, and private credit raised its
participation to more than 73% (Table 12). The amount of credit channeled to agriculture grew
during the first four years of the 1990s (11% in constant pesos), and has sharply decreased since
the financial crisis of 1995 (total credit granted to agriculture was 21% higher in 1983-90 with
respect to 1996-2000). In addition, rural banking in Mexico is imperfect, segmented and the
limited supply of credit has been channeled mainly to big farmers (Aceves, R: 2000).
The above trends indicate that the banking crisis was a major factor impeding the rise of private
credit to agriculture, expected to happen with the economic and ejidal reforms.
26
Lower credit access may have forced farmers to use raising government decoupled supports as a
substitute for credit in order to continue production; and credit restriction may have limited the
option that liberalization provided to farmers to change their production to competitive crops
under NAFTA.
The above is not contradicted by the findings of the evaluation of Alliance for the Countryside,
FAO and the Mexican Ministry of Agriculture have made. Instead of accomplishing its objective
to promote changes in the crop mix, 96% of the beneficiaries of Alliance did not change their
land use during 2000, and most of them produce for the domestic market (FAO and SAGAR:
2000).
PROCAMPO is the other major agricultural governmental program applied during NAFTA, and
much more important than Alliance in terms of public spending (it has been several thousand
times greater than Alliance for the Countryside) and coverage. As well as focusing on producers
of importables, another difference that PROCAMPO beneficiaries include small farmers,
whereas Alliance have benefited medium and big (“potentially competitive”) farmers. 31
As for the case of the beneficiaries of Alliance, the data on those farmers covered by
PROCAMPO suggest that most of them have continued to produce what they used to produce:
that is importables or basic crops (ASERCA: 1994 to 2001). PROCAMPO has not only
contributed to support the income of farmers facing competition from the U.S.A. producers of
staples and small farmers; it has also promoted the use of commercial inputs, leading to a rise in
productivity as the studies for the ejidal sub-sector of Cord and Wodon (2001) and Davis et.al.
(2002) show.
The above does not mean that under NAFTA the context on which the decisions of Mexican
farmers has remained as before: domestic real agricultural prices now follow closely
31 PROCAMPO includes producers with lands of any size and water access; the average size of the plots of producers that benefited from PROCAMPO has been around 4.8 hectares. By contrast the beneficiaries of Alliance have an average of 33 hectares and more than 40% of them have irrigation (Casco and Rosensweig: 2000 and FAO and SAGAR: 2000, respectively).
27
international prices, and the new agricultural policies have tended to be more and more
decoupled. 32
Notwithstanding this, the credit crisis had limited domestic investment in agriculture, and U.S.A
investment in Mexico’s field crops has remained low (see Casco and Rosensweig: 2000 and
Bolding, et.al.: 1999).
VII. CONCLUSIONS Our findings indicate that, as expected,
1) Since NAFTA, domestic real prices of major non-animal agricultural importables have
decreased, and followed more closely their international prices than before.
2) Imports and exports has grown within North America, specially so between Mexico and
the U.S.A., and the weight of agricultural trade on domestic production has considerably
increased.
3) Yields have also grown during NAFTA, for both major importables and exportables.
However, our study also suggests
4) Increasing yields of major importables or basic crops have been concentrated in irrigated
lands
5) Domestic production of importables, and of maize in particular, has not collapsed
6) Rural out-migration has not raised sharply, and
7) Private credit to agriculture has shrunk
We have proposed that the diverse trend in yields between irrigated and rain-fed production is
explained by the heterogeneous character of Mexican agriculture, and that the persistence of
basic crops as a major component of Mexico’s agricultural supply could be due to the raising
productivity of irrigated lands, to the continuation of production for own consumption by small
farmers, and to government supports. In this later respect, we argued that transformation of
public policies towards agriculture has cushioned the negative effects on Mexican commercial
32 The exception could be the marketing supports that ASERCA has been giving since its creation in 1991 to commercial farmers in some regions of Mexico. According to OECD estimates, market price supports are still an important component of the supports the Mexican government grants to the producers of staples (OECD). Notwithstanding this, former officials of the Mexican Agricultural Ministry argue that OECD estimates of market price supports for Mexico do not measure with rigor the degree to which government policies produce a gap between domestic and international prices (Casco and Rosensweig: 2000, pp. 224-6).
28
producers of importables caused by the bigger market access for U.S.A. producers granted by
NAFTA. In addition, the fact that production of maize under rain-fed conditions has not
collapsed, is one of the reasons why --as opposed to the expectations-- rural-out migration has
not grown during NAFTA at higher rates than the historical tendencies.
The evolution of the real exchange rate of the peso also had played an important role in
explaining the unexpected trends of the agriculture of Mexico. The devaluation of 1995 helped
farmers to face competition from U.S.A. producers of grains, and promoted the exports of
Mexico of vegetables and fruits. At the same time, the financial problems caused by the
devaluation of the peso, resulted in an acute rural credit crisis. As for trade, governmental
supports to agriculture have helped farmers to face credit limitations.
When full liberalization in North America is attained in 2008, and if macro-economic stability
continues in Mexico, some of the other predicted impacts of NAFTA on agriculture would
follow. It is also likely that imports from U.S.A. producers of grains and oilseeds will increase
following the supports just granted through the U.S.A. new Farm Bill, unless the Mexican
government raises its direct supports to the domestic producers of basic crops.
In relation to the latter, recent events in the political economy arena have put pressures on the
Fox Administration to renegotiate the agricultural chapter of NAFTA and to increase its
subsidies to agriculture for the year 2003 in particular to the producers of basic grains (and hogs
and poultry). Based on the probable effects of the U.S.A. Farm Bill and on the belief that the new
phase of NAFTA implementation --beginning in 2003 and in which all tariffs and tariff rate
quotas will be eliminated (except for corn, beans and powdered milk)--, organized farmers and
groups against NAFTA have been arguing that this will mean an almost immediate collapse of
the agriculture of Mexico and a politically dangerous food dependence on U.S.A. suppliers for
the country.
As we previously stated in this study, Mexican agricultural liberalization began before NAFTA;
the implementation of this trade agreement has been done gradually for those crops that the
Mexican government considered sensitive; and domestic production of basic crops has not
collapsed. Thus, it is our understanding that the pressures from farmers and other groups to
renegotiate the agricultural chapter of NAFTA may be explained by other reasons, which are
29
related to the fact that farmers producing basic crops and animals for the market did not
participate actively during NAFTA negotiations, as well as the recent and more democratic
political arena under which Congress is no longer controlled by the Executive. This situation has
recently become evident during the 2003 budget reviews by Congress wherein Congressmen --
most of them from opposing political parties-- have taken farmer interests to raise the allocated
agricultural budget over and above the one proposed by the Executive.
The experience of the Mexican agricultural sector under NAFTA could be used to propose
lessons for other Latin American countries in their trade negotiations with the U.S.A. These
lessons could be particularly relevant for Central America, because the structure of production of
their agricultural sector is similar to that prevailing in Mexico, and since the U.S.A. is their major
trade partner.
1) Most of Latin American countries have already reduced its trade barriers, including those
related to agriculture. So and at least in the medium run, one can expect that there will be
no drastic changes in the domestic supply of non-competitive crops.
2) An agricultural Free Trade Agreement (FTA) with the U.S.A. will have as a consequence
losers and winners. As for Mexico, producers of grains could be negatively affected and
producers of fruits and vegetables could win.
3) However, trade and domestic liberalization will not produce all of the expected results as
predicted by economic theory: the functioning of markets and government domestic
policies do matter.
a. The substitution of competitive crops (such as fruits and vegetables) for grains by
commercial farmers requires credit access and investment, as well as a stable
macro-economic situation
b. The transformation of small scale farming producing partially food for self-
consumption requires that small farmers have access to markets for their products
and that they adopt technical change. Another option for them is to find
remunerative employment in the domestic non-agricultural sub-sector.
c. The agricultural transformation could be supported by the government, but this
requires scarce public resources. Extending the coverage of tax subjects, making
more efficient tax collection and a fiscal reform are, hence, required.
4) Finally, the political economy situation also matters: the participation of farmers in trade
negotiations is needed and a national accord on the potential benefits of a freer trade is
30
required; and not only this, the positive effects of trade agreements must be evident to the
population, for example, through higher growth and employment rates.
References Aceves Ávila R.: 2000, “El campo que nos tienen prometido...Notas para una nueva
agenda para la organización económica del medio rural”, Manuscript. ASERCA, Claridades Agropecuarias, 1994-2001. Bolding Ch., J. Calderon J. and Ch. Handy (May-Aug. 1999) “U.S. invests in Mexico’s
processed food industry”, Food Review, ERS, Vol. 22 Issue 2. Casco, A. (1999), "CONASUPO: A Case Study of State Trading Deregulation, Paper presented
at the Simposium: Globalization and its Impacts on Governmental Organization and Parastatals, Canadian Agricultural Economics Society, Ottawa, April, 21st.
Casco, A. And F\A. Rosensweig: 2000, La política sectorial agropecuaria en México: Balance de una década, Instituto Interamericano de Cooperación para la Agricultura (IICA), México, D.F.
CONASUPO: 1986, 1988 and 1989, Informe de Actividades del Sistema CONASUPO, Dirección de Planeación, Mexico.
Cord L. and Q. Wodon, “Do agricultural programs in Mexico alleviate poverty? Evidence from the ejido sector”, Cuadernos de Economía, v.38 n.114 Aug. 2001.
Davis, B. et.al. (June, 2002), “Conditionality and the impact of program design on household welfare. Comparing the effects of two diverse cash transfer programs on the rural poor in Mexico”, FAO, Mimeo.
ERS (Economic Research Service of the U.S. Department of Agriculture): August: 1999, ERS NAFTA REPORT.pdf, WRS-99-1, at www.econ.ag.gov
___: March 2000, ERS Commodity Report (NAFTA).pdf at www.econ.ag.gov FAO and SAGARPA, 2000, Evaluación de la Alianza Para el Campo: Informe Global,
http://www.rlc.fao.org/prior/desrural/document/alianza.htm. Helfand, Steven M. and Castro de Rezende, Gervásio, Sept. 2001, "The impact of sector-specific
and economy-wide policy reforms on agriculture: the case of Brazil, 1980-98, Working Paper 01-34, Department of Economics, University of California, Riverside, Sept. 2001.
Hernandez Estrada: 2000, "Tipología de productores agropecuarios", in Yunez-Naude, A. (Editor) Los Pequeños Productores Rurales: Las Reformas y las Opciones, El Colegio de Mexico.
Information Workshop, Puerto Vallarta. the paper is available at www.farmfoundation/… Krueger, Anne O., M. Schiff, and A. Valdés (editors), 1991, The Political Economy of
Agricultural Pricing Policy, Volume 1: Latin America, Baltimore: The Johns Hopkins University Press, 1991.
Levy, S. and S. van Wijnbergen: 1991. “Mexican agriculture in the free trade agreement: Transition Problems in Economic Reform”, OECD Development Centre, Technical Papers No. 63, 1992.
OECD: 1997, Examen de las políticas agrícolas de México: políticas nacionales y comercio agrícola, Paris.
OECD: 2000, Agriculture and Food: Producer and Consumer Support Estimates. OECD data base: 1986-1999, Edition in Compact Disk).
Orden, David: March 2002, “Partial Easing of U.S. Avocado Restrictions through a Systems Approach to Pest”, paper presented at the Eighth Agricultural and Food Policy Information Workshop, Puerto Vallarta. the paper is available at www.farmfoundation/
31
Quiroz, Jorge, and Luis Opazo, 2000 “The Krueger-Schiff-Valdés Study Ten Years Later: A Latin American Perspective,” Economic Developmnet and Cultural Change, 181-196.
Quiroz, Jorge and Alberto Valdes, 1993, “Agricultural Incentives and International Competitiveness in Four African Countries: Government Interventions and Exogenous Shocks,” in Agricultural Policy Reforms and Regional Market Integration in Malawi, Zambia, and Zimbabwe, edited by Valdés, Alberto and Kay Muir-Leresche, Washington D.C.: IFPRI.
Robinson, S., M.E. Burfisher, R. Hinojosa-Ojeda and K.E. Thierfelder; 1991, "Agricultural Policies and Migration in a U.S.-Mexico Free Trade Area: A Computable General Equilibrium Analysis." UC Berkeley, Department of Agricultural and Resource Economics Working Paper No. 617, December.
Rosenzweig, A.: 2000, "Mexican Agricultural Trade under NAFTA: Am Assessment after five years of implementation", paper presented at the, 7th Policy Disputes Information Consortium Workshop, San Diego, Feb. 16-19.
Rosenzweig, A.: Dec. 2000, "On NAFTA: Mexican Experience after Six Years of implementation", draft of a paper to be presented at the 7th Policy Disputes Information Consortium Workshop, Tucson, February, 14-17, 2001.
Shwedel, Ken: March 2002, “Trade disputes in an unsettled industry: Mexican sugar”, paper presented at the Eighth Agricultural and Food Policy
SAGAR, Programas y Proyectos en Apoyo al Campo 1996, July, 97, p. 22 SECOFI: 1994, Fracciones arancelarias y plazos de desgravación, Ed. Miguel Angel Porrúa,
México. Shagam, S. and D. Plunkett: Dec., 1997 “Tariff Rate Quotas Administration in Mexico: 1994-97”,
Paper presented at the IATRC, San Diego. USDA Economic Research Service (ERS): 1999, “ERS NAFTA Report”, August. Yañez-Zazueta: Sept. 1997, "Food Security Programmes in Mexico, 1930-1995: The Case of the
Maize Sector", Unpublished M.A. Dissertation, Department of Economic History, The London School of Economics and Political Science.
Yunez-Naude, A: Jan. 2001, “Mexican Agricultural change and Mexico – US immigration", Unpublished paper presented at the Conference of the Project Changing Face of Rural California, University of California, Davis, Holtville, CA.
Yunez-Naude, A: 1998, “Small-Scale Maize and Livestock Mexican Farmers”, in Loyns, R.M.A., R.D. Knuston and K. Meilke, Economic Harmonization in the Canadian/U.S./Mexican Grain-Livestock Sub sector, Friesen Printers, Winnipeg, 1998, pp. 209-230.
Yunez-Naude A.: March, 2002, “Report to the World Bank”, Mimeo. Yunez-Naude A. and F. Barceinas: 2000, "Efectos de la desaparición de la CONASUPO en el
comercio y los precios de los cultivos básicos", Estudios Económicos. Zedillo, E. (Poder Ejecutivo Federal): 1997 to 2000, Governmental Reports, Presidencia de la
Republica.
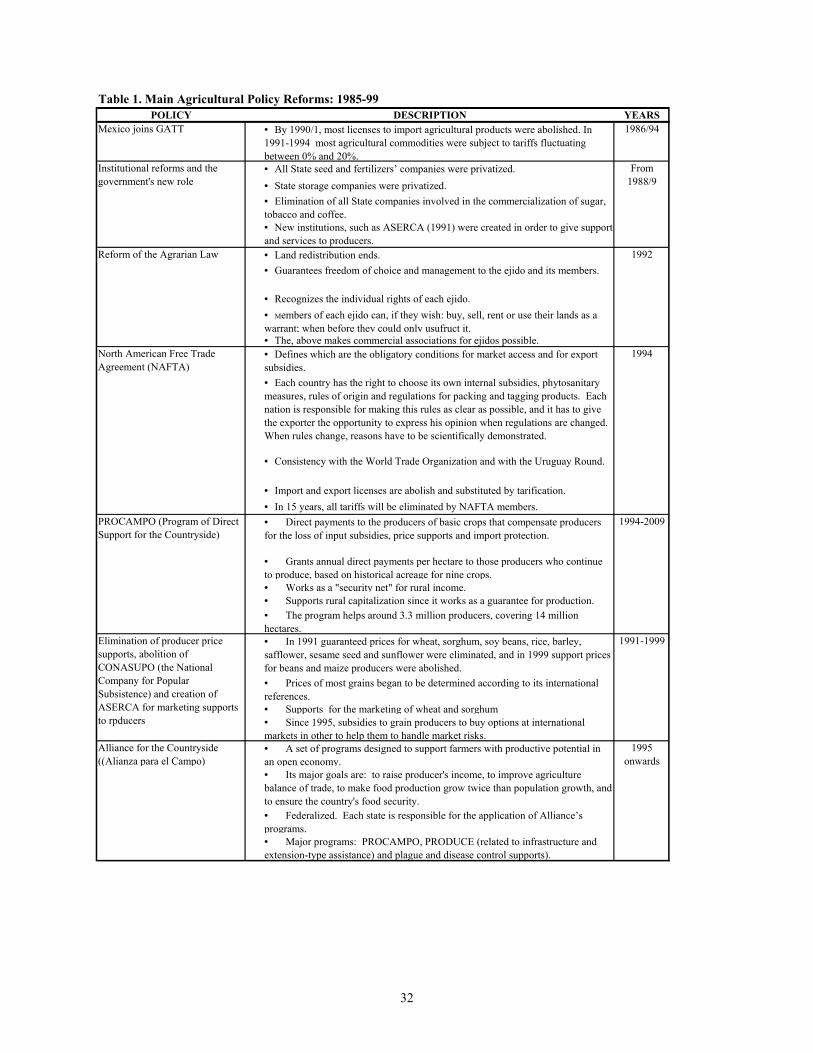
32
Table 1. Main Agricultural Policy Reforms: 1985-99POLICY DESCRIPTION YEARS
Mexico joins GATT • By 1990/1, most licenses to import agricultural products were abolished. In 1991-1994 most agricultural commodities were subject to tariffs fluctuating between 0% and 20%.
1986/94
• All State seed and fertilizers’ companies were privatized.• State storage companies were privatized.• Elimination of all State companies involved in the commercialization of sugar, tobacco and coffee.• New institutions, such as ASERCA (1991) were created in order to give support and services to producers.• Land redistribution ends.• Guarantees freedom of choice and management to the ejido and its members.
• Recognizes the individual rights of each ejido.• Members of each ejido can, if they wish: buy, sell, rent or use their lands as a warrant; when before they could only usufruct it.• The, above makes commercial associations for ejidos possible.• Defines which are the obligatory conditions for market access and for export subsidies.• Each country has the right to choose its own internal subsidies, phytosanitary measures, rules of origin and regulations for packing and tagging products. Each nation is responsible for making this rules as clear as possible, and it has to give the exporter the opportunity to express his opinion when regulations are changed. When rules change, reasons have to be scientifically demonstrated.
• Consistency with the World Trade Organization and with the Uruguay Round.
• Import and export licenses are abolish and substituted by tarification.• In 15 years, all tariffs will be eliminated by NAFTA members.• Direct payments to the producers of basic crops that compensate producers for the loss of input subsidies, price supports and import protection.
• Grants annual direct payments per hectare to those producers who continue to produce, based on historical acreage for nine crops.• Works as a "security net" for rural income.• Supports rural capitalization since it works as a guarantee for production.• The program helps around 3.3 million producers, covering 14 million hectares.• In 1991 guaranteed prices for wheat, sorghum, soy beans, rice, barley, safflower, sesame seed and sunflower were eliminated, and in 1999 support prices for beans and maize producers were abolished.• Prices of most grains began to be determined according to its international references.• Supports for the marketing of wheat and sorghum• Since 1995, subsidies to grain producers to buy options at international markets in other to help them to handle market risks.
Alliance for the Countryside ((Alianza para el Campo)
• A set of programs designed to support farmers with productive potential in an open economy.• Its major goals are: to raise producer's income, to improve agriculture balance of trade, to make food production grow twice than population growth, and to ensure the country's food security.• Federalized. Each state is responsible for the application of Alliance’s programs.• Major programs: PROCAMPO, PRODUCE (related to infrastructure and extension-type assistance) and plague and disease control supports).
Elimination of producer price supports, abolition of CONASUPO (the National Company for Popular Subsistence) and creation of ASERCA for marketing supports to rpducers
1991-1999
1995 onwards
North American Free Trade Agreement (NAFTA)
1994
PROCAMPO (Program of Direct Support for the Countryside)
1994-2009
Institutional reforms and the government's new role
From 1988/9
Reform of the Agrarian Law 1992
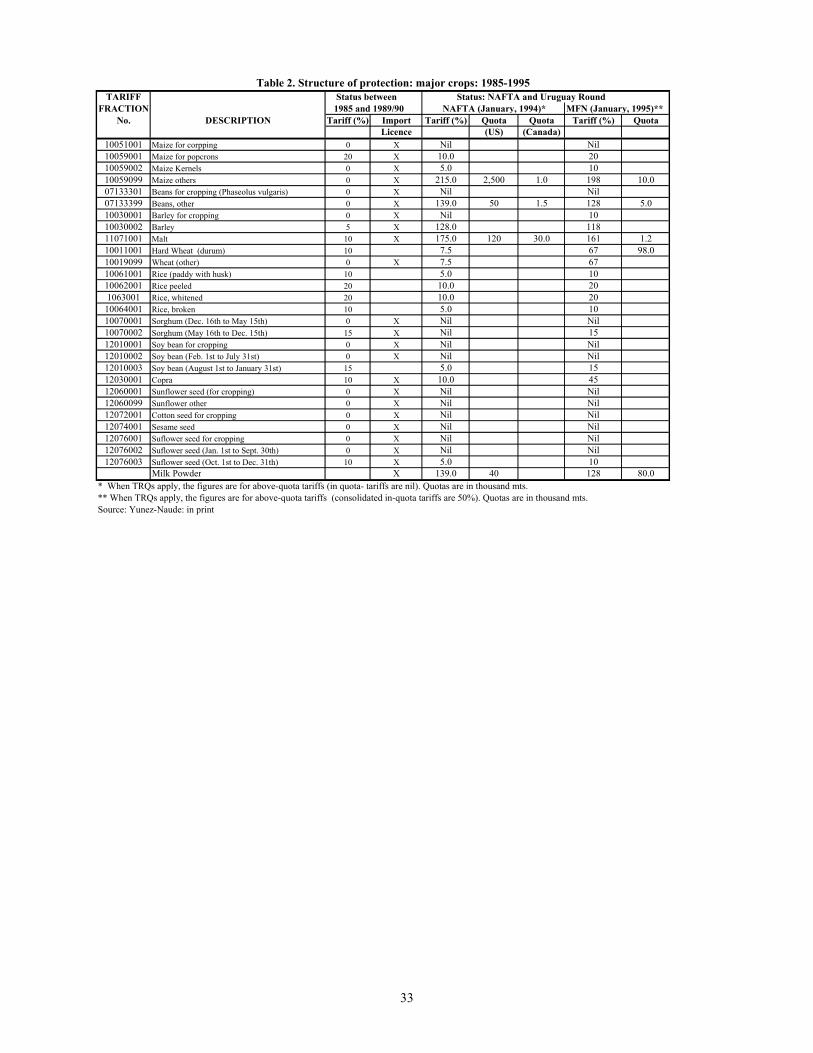
33
TARIFF Status between Status: NAFTA and Uruguay RoundFRACTION 1985 and 1989/90 NAFTA (January, 1994)* MFN (January, 1995)**
No. DESCRIPTION Tariff (%) Import Tariff (%) Quota Quota Tariff (%) QuotaLicence (US) (Canada)
10051001 Maize for corpping 0 X Nil Nil10059001 Maize for popcrons 20 X 10.0 2010059002 Maize Kernels 0 X 5.0 1010059099 Maize others 0 X 215.0 2,500 1.0 198 10.007133301 Beans for cropping (Phaseolus vulgaris) 0 X Nil Nil07133399 Beans, other 0 X 139.0 50 1.5 128 5.010030001 Barley for cropping 0 X Nil 1010030002 Barley 5 X 128.0 11811071001 Malt 10 X 175.0 120 30.0 161 1.210011001 Hard Wheat (durum) 10 7.5 67 98.010019099 Wheat (other) 0 X 7.5 6710061001 Rice (paddy with husk) 10 5.0 1010062001 Rice peeled 20 10.0 201063001 Rice, whitened 20 10.0 20
10064001 Rice, broken 10 5.0 1010070001 Sorghum (Dec. 16th to May 15th) 0 X Nil Nil10070002 Sorghum (May 16th to Dec. 15th) 15 X Nil 1512010001 Soy bean for cropping 0 X Nil Nil12010002 Soy bean (Feb. 1st to July 31st) 0 X Nil Nil12010003 Soy bean (August 1st to January 31st) 15 5.0 1512030001 Copra 10 X 10.0 4512060001 Sunflower seed (for cropping) 0 X Nil Nil12060099 Sunflower other 0 X Nil Nil12072001 Cotton seed for cropping 0 X Nil Nil12074001 Sesame seed 0 X Nil Nil12076001 Suflower seed for cropping 0 X Nil Nil12076002 Suflower seed (Jan. 1st to Sept. 30th) 0 X Nil Nil12076003 Suflower seed (Oct. 1st to Dec. 31th) 10 X 5.0 10
Milk Powder X 139.0 40 128 80.0* When TRQs apply, the figures are for above-quota tariffs (in quota- tariffs are nil). Quotas are in thousand mts.** When TRQs apply, the figures are for above-quota tariffs (consolidated in-quota tariffs are 50%). Quotas are in thousand mts.Source: Yunez-Naude: in print
Table 2. Structure of protection: major crops: 1985-1995
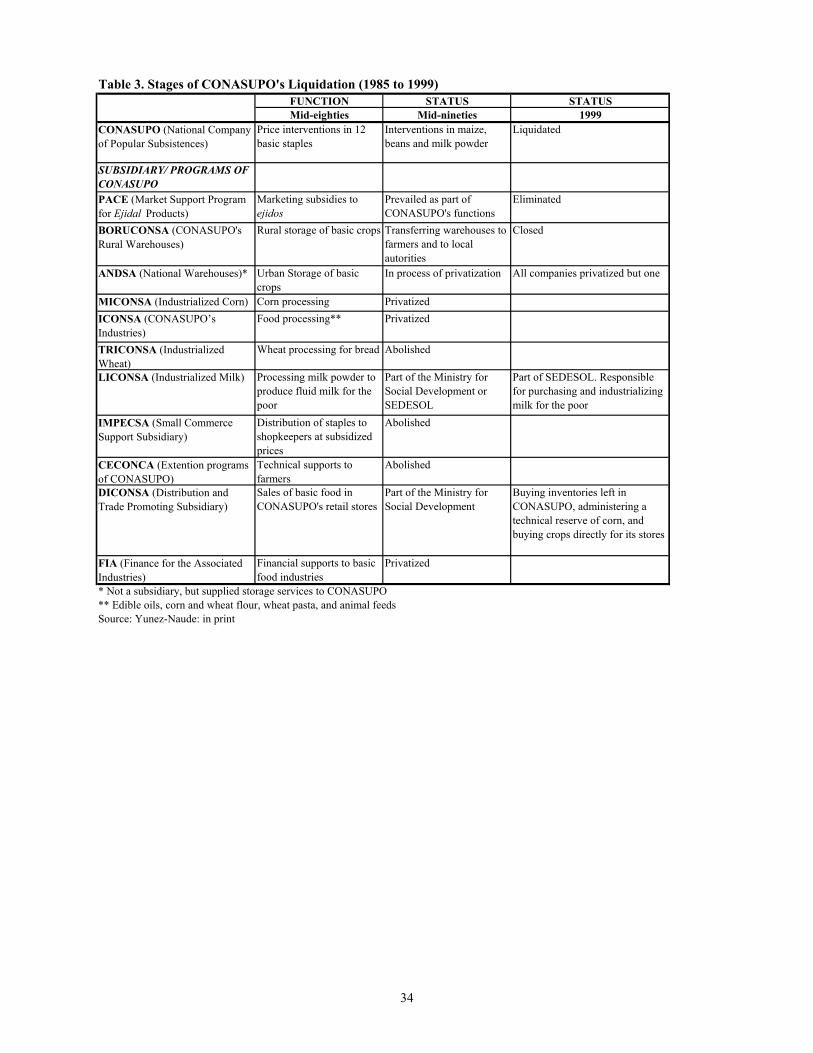
34
Table 3. Stages of CONASUPO's Liquidation (1985 to 1999)FUNCTION STATUS STATUS Mid-eighties Mid-nineties 1999
CONASUPO (National Company of Popular Subsistences)
Price interventions in 12 basic staples
Interventions in maize, beans and milk powder
Liquidated
SUBSIDIARY/ PROGRAMS OF CONASUPOPACE (Market Support Program for Ejidal Products)
Marketing subsidies to ejidos
Prevailed as part of CONASUPO's functions
Eliminated
BORUCONSA (CONASUPO's Rural Warehouses)
Rural storage of basic crops Transferring warehouses to farmers and to local autorities
Closed
ANDSA (National Warehouses)* Urban Storage of basic crops
In process of privatization All companies privatized but one
MICONSA (Industrialized Corn) Corn processing PrivatizedICONSA (CONASUPO’s Industries)
Food processing** Privatized
TRICONSA (Industrialized Wheat)
Wheat processing for bread Abolished
LICONSA (Industrialized Milk) Processing milk powder to produce fluid milk for the poor
Part of the Ministry for Social Development or SEDESOL
Part of SEDESOL. Responsible for purchasing and industrializing milk for the poor
IMPECSA (Small Commerce Support Subsidiary)
Distribution of staples to shopkeepers at subsidized prices
Abolished
CECONCA (Extention programs of CONASUPO)
Technical supports to farmers
Abolished
DICONSA (Distribution and Trade Promoting Subsidiary)
Sales of basic food in CONASUPO's retail stores
Part of the Ministry for Social Development
Buying inventories left in CONASUPO, administering a technical reserve of corn, and buying crops directly for its stores
FIA (Finance for the Associated Industries)
Financial supports to basic food industries
Privatized
* Not a subsidiary, but supplied storage services to CONASUPO** Edible oils, corn and wheat flour, wheat pasta, and animal feeds Source: Yunez-Naude: in print
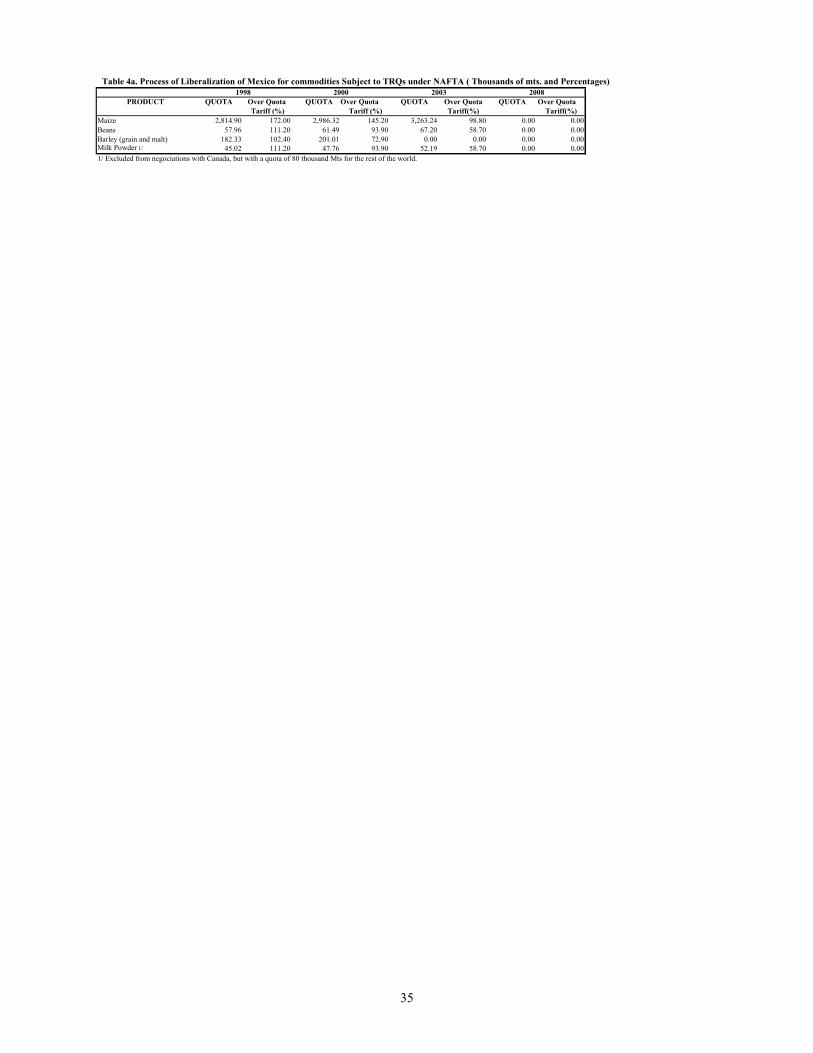
35
Table 4a. Process of Liberalization of Mexico for commodities Subject to TRQs under NAFTA ( Thousands of mts. and Percentages)
PRODUCT QUOTA Over Quota QUOTA Over Quota QUOTA Over QuotaTariff (%) Tariff (%) Tariff(%) Tariff(%)
Maize 2,814.90 172.00 2,986.32 145.20 3,263.24 98.80 0.00 0.00Beans 57.96 111.20 61.49 93.90 67.20 58.70 0.00 0.00Barley (grain and malt) 182.33 102.40 201.01 72.90 0.00 0.00 0.00 0.00Milk Powder 1/ 45.02 111.20 47.76 93.90 52.19 58.70 0.00 0.001/ Excluded from negociations with Canada, but with a quota of 80 thousand Mts for the rest of the world.
20082000 QUOTA Over Quota
1998 2003
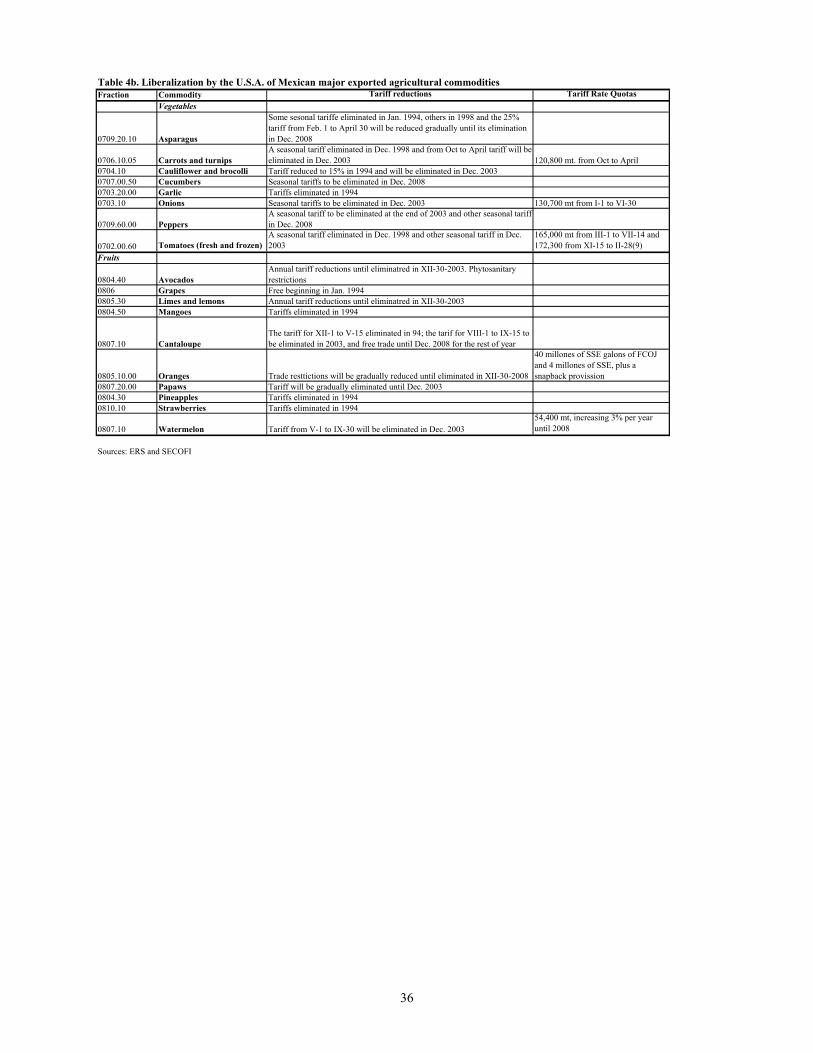
36
Table 4b. Liberalization by the U.S.A. of Mexican major exported agricultural commoditiesFraction Commodity Tariff reductions Tariff Rate Quotas
Vegetables
0709.20.10 Asparagus
Some sesonal tariffe eliminated in Jan. 1994, others in 1998 and the 25% tariff from Feb. 1 to April 30 will be reduced gradually until its elimination in Dec. 2008
0706.10.05 Carrots and turnipsA seasonal tariff eliminated in Dec. 1998 and from Oct to April tariff will be eliminated in Dec. 2003 120,800 mt. from Oct to April
0704.10 Cauliflower and brocolli Tariff reduced to 15% in 1994 and will be eliminated in Dec. 20030707.00.50 Cucumbers Seasonal tariffs to be eliminated in Dec. 20080703.20.00 Garlic Tariffs eliminated in 19940703.10 Onions Seasonal tariffs to be eliminated in Dec. 2003 130,700 mt from I-1 to VI-30
0709.60.00 PeppersA seasonal tariff to be eliminated at the end of 2003 and other seasonal tariff in Dec. 2008
0702.00.60 Tomatoes (fresh and frozen)A seasonal tariff eliminated in Dec. 1998 and other seasonal tariff in Dec. 2003
165,000 mt from III-1 to VII-14 and 172,300 from XI-15 to II-28(9)
Fruits
0804.40 AvocadosAnnual tariff reductions until eliminatred in XII-30-2003. Phytosanitary restrictions
0806 Grapes Free beginning in Jan. 19940805.30 Limes and lemons Annual tariff reductions until eliminatred in XII-30-20030804.50 Mangoes Tariffs eliminated in 1994
0807.10 CantaloupeThe tariff for XII-1 to V-15 eliminated in 94; the tarif for VIII-1 to IX-15 to be eliminated in 2003, and free trade until Dec. 2008 for the rest of year
0805.10.00 Oranges Trade resttictions will be gradually reduced until eliminated in XII-30-2008
40 millones of SSE galons of FCOJ and 4 millones of SSE, plus a snapback provission
0807.20.00 Papaws Tariff will be gradually eliminated until Dec. 20030804.30 Pineapples Tariffs eliminated in 19940810.10 Strawberries Tariffs eliminated in 1994
0807.10 Watermelon Tariff from V-1 to IX-30 will be eliminated in Dec. 200354,400 mt, increasing 3% per year until 2008
Sources: ERS and SECOFI
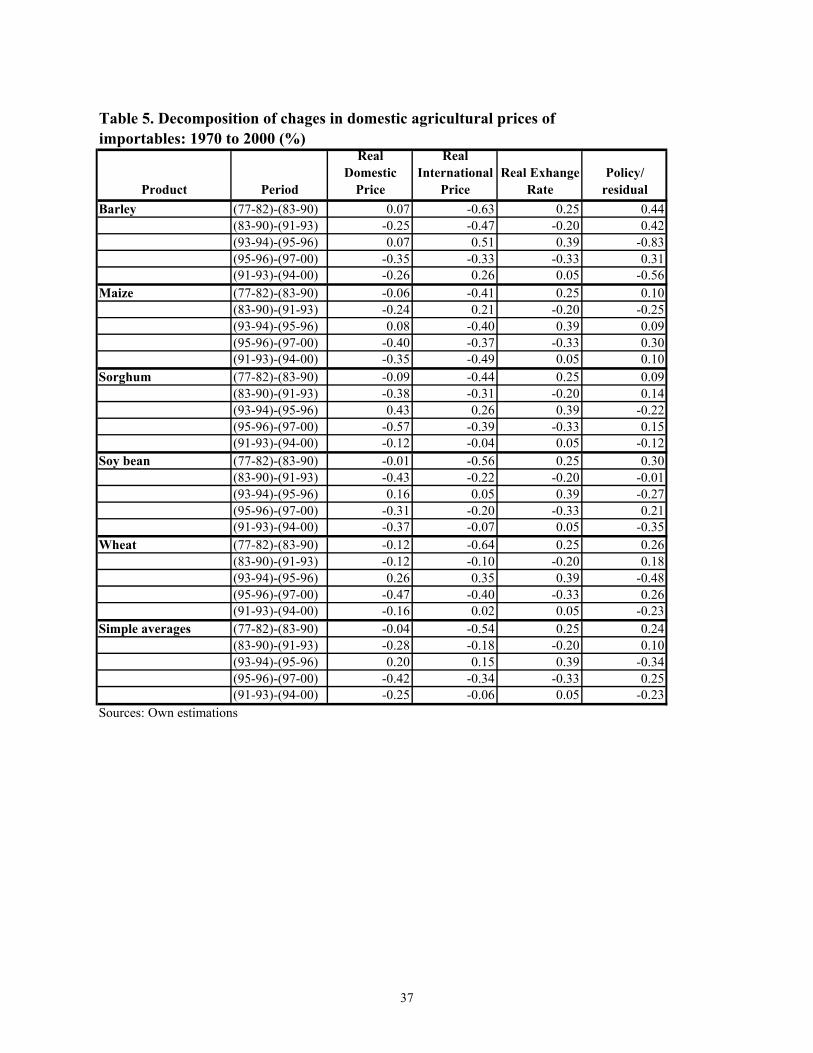
37
Table 5. Decomposition of chages in domestic agricultural prices of importables: 1970 to 2000 (%)
Product Period
Real Domestic
Price
Real International
PriceReal Exhange
RatePolicy/
residualBarley (77-82)-(83-90) 0.07 -0.63 0.25 0.44
(83-90)-(91-93) -0.25 -0.47 -0.20 0.42(93-94)-(95-96) 0.07 0.51 0.39 -0.83(95-96)-(97-00) -0.35 -0.33 -0.33 0.31(91-93)-(94-00) -0.26 0.26 0.05 -0.56
Maize (77-82)-(83-90) -0.06 -0.41 0.25 0.10(83-90)-(91-93) -0.24 0.21 -0.20 -0.25(93-94)-(95-96) 0.08 -0.40 0.39 0.09(95-96)-(97-00) -0.40 -0.37 -0.33 0.30(91-93)-(94-00) -0.35 -0.49 0.05 0.10
Sorghum (77-82)-(83-90) -0.09 -0.44 0.25 0.09(83-90)-(91-93) -0.38 -0.31 -0.20 0.14(93-94)-(95-96) 0.43 0.26 0.39 -0.22(95-96)-(97-00) -0.57 -0.39 -0.33 0.15(91-93)-(94-00) -0.12 -0.04 0.05 -0.12
Soy bean (77-82)-(83-90) -0.01 -0.56 0.25 0.30(83-90)-(91-93) -0.43 -0.22 -0.20 -0.01(93-94)-(95-96) 0.16 0.05 0.39 -0.27(95-96)-(97-00) -0.31 -0.20 -0.33 0.21(91-93)-(94-00) -0.37 -0.07 0.05 -0.35
Wheat (77-82)-(83-90) -0.12 -0.64 0.25 0.26(83-90)-(91-93) -0.12 -0.10 -0.20 0.18(93-94)-(95-96) 0.26 0.35 0.39 -0.48(95-96)-(97-00) -0.47 -0.40 -0.33 0.26(91-93)-(94-00) -0.16 0.02 0.05 -0.23
Simple averages (77-82)-(83-90) -0.04 -0.54 0.25 0.24(83-90)-(91-93) -0.28 -0.18 -0.20 0.10(93-94)-(95-96) 0.20 0.15 0.39 -0.34(95-96)-(97-00) -0.42 -0.34 -0.33 0.25(91-93)-(94-00) -0.25 -0.06 0.05 -0.23
Sources: Own estimations
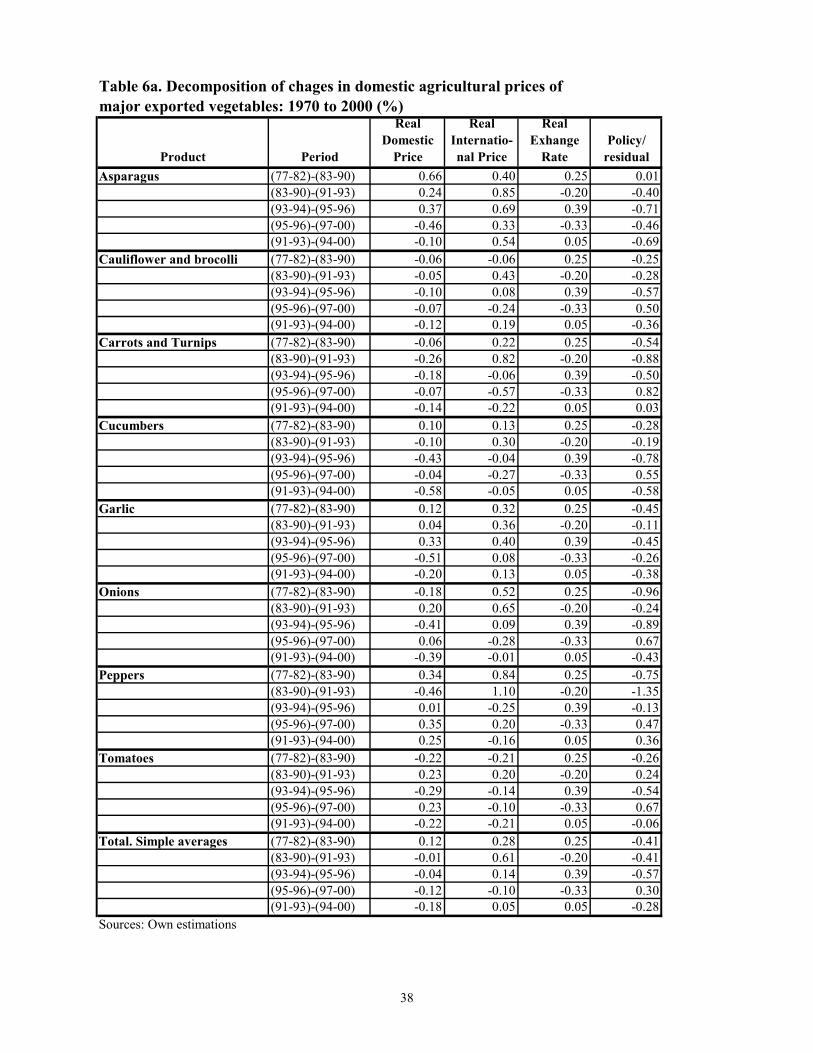
38
Table 6a. Decomposition of chages in domestic agricultural prices of major exported vegetables: 1970 to 2000 (%)
Product Period
Real Domestic
Price
Real Internatio-nal Price
Real Exhange
RatePolicy/
residualAsparagus (77-82)-(83-90) 0.66 0.40 0.25 0.01
(83-90)-(91-93) 0.24 0.85 -0.20 -0.40(93-94)-(95-96) 0.37 0.69 0.39 -0.71(95-96)-(97-00) -0.46 0.33 -0.33 -0.46(91-93)-(94-00) -0.10 0.54 0.05 -0.69
Cauliflower and brocolli (77-82)-(83-90) -0.06 -0.06 0.25 -0.25(83-90)-(91-93) -0.05 0.43 -0.20 -0.28(93-94)-(95-96) -0.10 0.08 0.39 -0.57(95-96)-(97-00) -0.07 -0.24 -0.33 0.50(91-93)-(94-00) -0.12 0.19 0.05 -0.36
Carrots and Turnips (77-82)-(83-90) -0.06 0.22 0.25 -0.54(83-90)-(91-93) -0.26 0.82 -0.20 -0.88(93-94)-(95-96) -0.18 -0.06 0.39 -0.50(95-96)-(97-00) -0.07 -0.57 -0.33 0.82(91-93)-(94-00) -0.14 -0.22 0.05 0.03
Cucumbers (77-82)-(83-90) 0.10 0.13 0.25 -0.28(83-90)-(91-93) -0.10 0.30 -0.20 -0.19(93-94)-(95-96) -0.43 -0.04 0.39 -0.78(95-96)-(97-00) -0.04 -0.27 -0.33 0.55(91-93)-(94-00) -0.58 -0.05 0.05 -0.58
Garlic (77-82)-(83-90) 0.12 0.32 0.25 -0.45(83-90)-(91-93) 0.04 0.36 -0.20 -0.11(93-94)-(95-96) 0.33 0.40 0.39 -0.45(95-96)-(97-00) -0.51 0.08 -0.33 -0.26(91-93)-(94-00) -0.20 0.13 0.05 -0.38
Onions (77-82)-(83-90) -0.18 0.52 0.25 -0.96(83-90)-(91-93) 0.20 0.65 -0.20 -0.24(93-94)-(95-96) -0.41 0.09 0.39 -0.89(95-96)-(97-00) 0.06 -0.28 -0.33 0.67(91-93)-(94-00) -0.39 -0.01 0.05 -0.43
Peppers (77-82)-(83-90) 0.34 0.84 0.25 -0.75(83-90)-(91-93) -0.46 1.10 -0.20 -1.35(93-94)-(95-96) 0.01 -0.25 0.39 -0.13(95-96)-(97-00) 0.35 0.20 -0.33 0.47(91-93)-(94-00) 0.25 -0.16 0.05 0.36
Tomatoes (77-82)-(83-90) -0.22 -0.21 0.25 -0.26(83-90)-(91-93) 0.23 0.20 -0.20 0.24(93-94)-(95-96) -0.29 -0.14 0.39 -0.54(95-96)-(97-00) 0.23 -0.10 -0.33 0.67(91-93)-(94-00) -0.22 -0.21 0.05 -0.06
Total. Simple averages (77-82)-(83-90) 0.12 0.28 0.25 -0.41(83-90)-(91-93) -0.01 0.61 -0.20 -0.41(93-94)-(95-96) -0.04 0.14 0.39 -0.57(95-96)-(97-00) -0.12 -0.10 -0.33 0.30(91-93)-(94-00) -0.18 0.05 0.05 -0.28
Sources: Own estimations
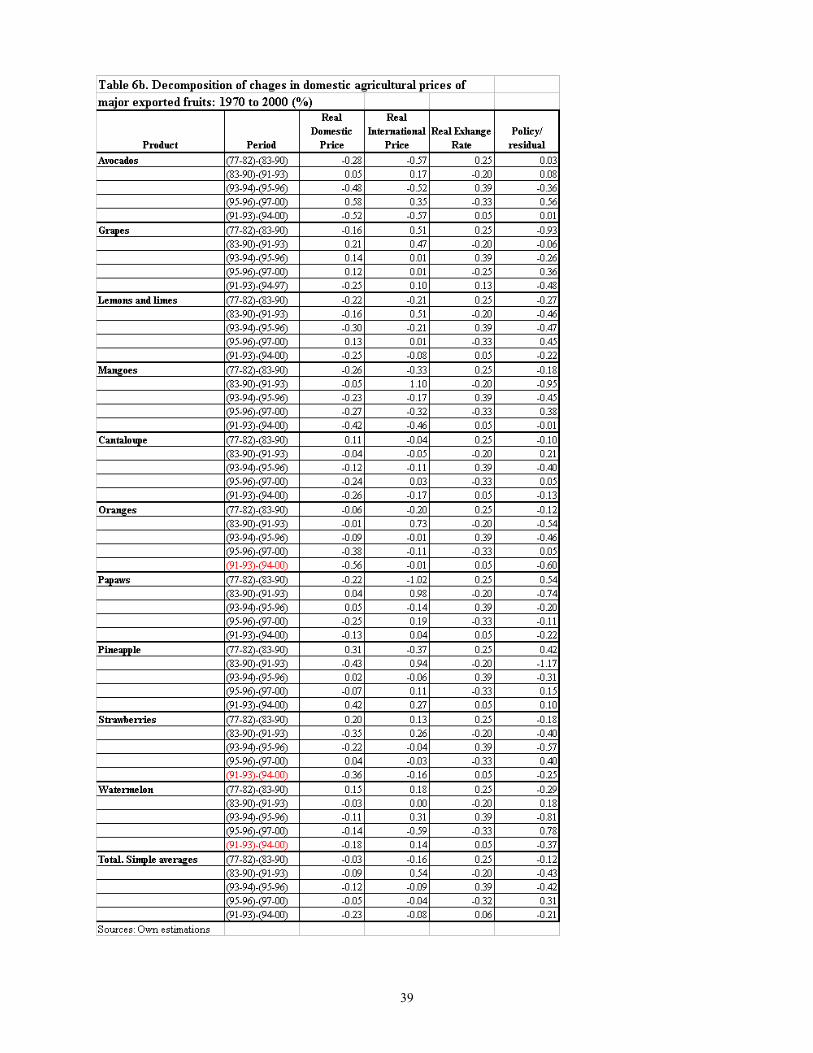
39
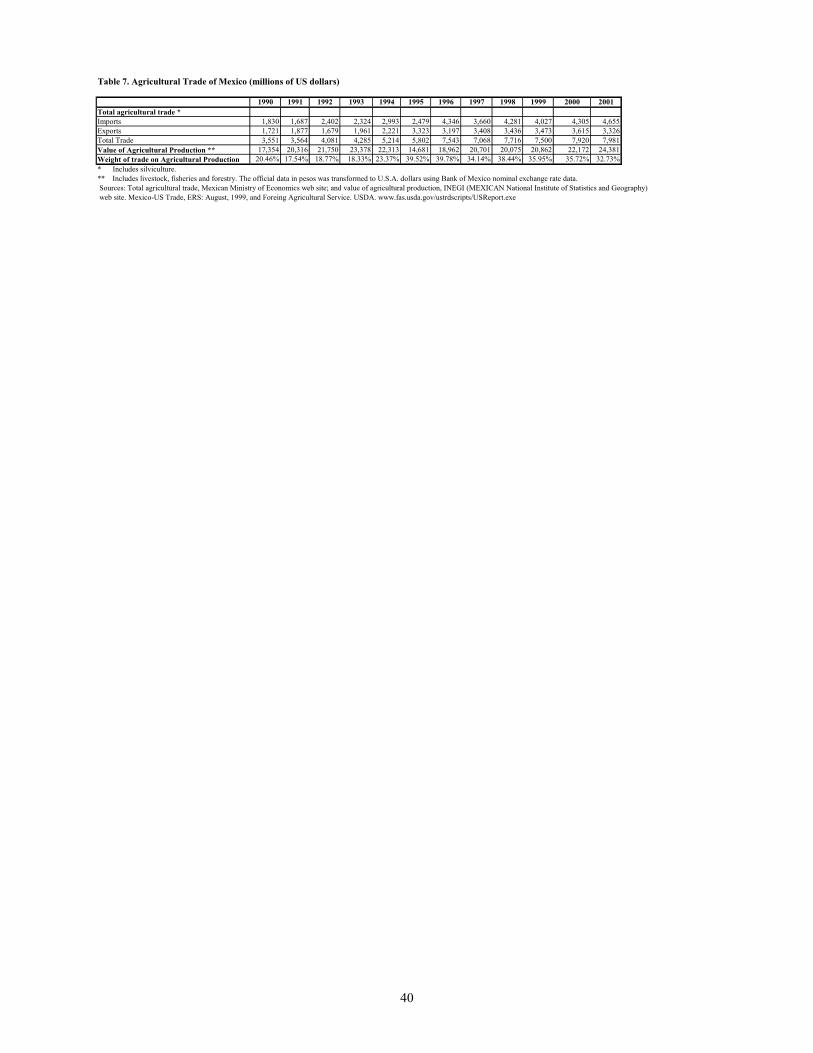
40
Table 7. Agricultural Trade of Mexico (millions of US dollars)
1990 1991 1992 1993 1994 1995 1996 1997 1998 1999 2000 2001Total agricultural trade *Imports 1,830 1,687 2,402 2,324 2,993 2,479 4,346 3,660 4,281 4,027 4,305 4,655Exports 1,721 1,877 1,679 1,961 2,221 3,323 3,197 3,408 3,436 3,473 3,615 3,326Total Trade 3,551 3,564 4,081 4,285 5,214 5,802 7,543 7,068 7,716 7,500 7,920 7,981Value of Agricultural Production ** 17,354 20,316 21,750 23,378 22,313 14,681 18,962 20,701 20,075 20,862 22,172 24,381Weight of trade on Agricultural Production 20.46% 17.54% 18.77% 18.33% 23.37% 39.52% 39.78% 34.14% 38.44% 35.95% 35.72% 32.73%* Includes silviculture. ** Includes livestock, fisheries and forestry. The official data in pesos was transformed to U.S.A. dollars using Bank of Mexico nominal exchange rate data. Sources: Total agricultural trade, Mexican Ministry of Economics web site; and value of agricultural production, INEGI (MEXICAN National Institute of Statistics and Geography) web site. Mexico-US Trade, ERS: August, 1999, and Foreing Agricultural Service. USDA. www.fas.usda.gov/ustrdscripts/USReport.exe
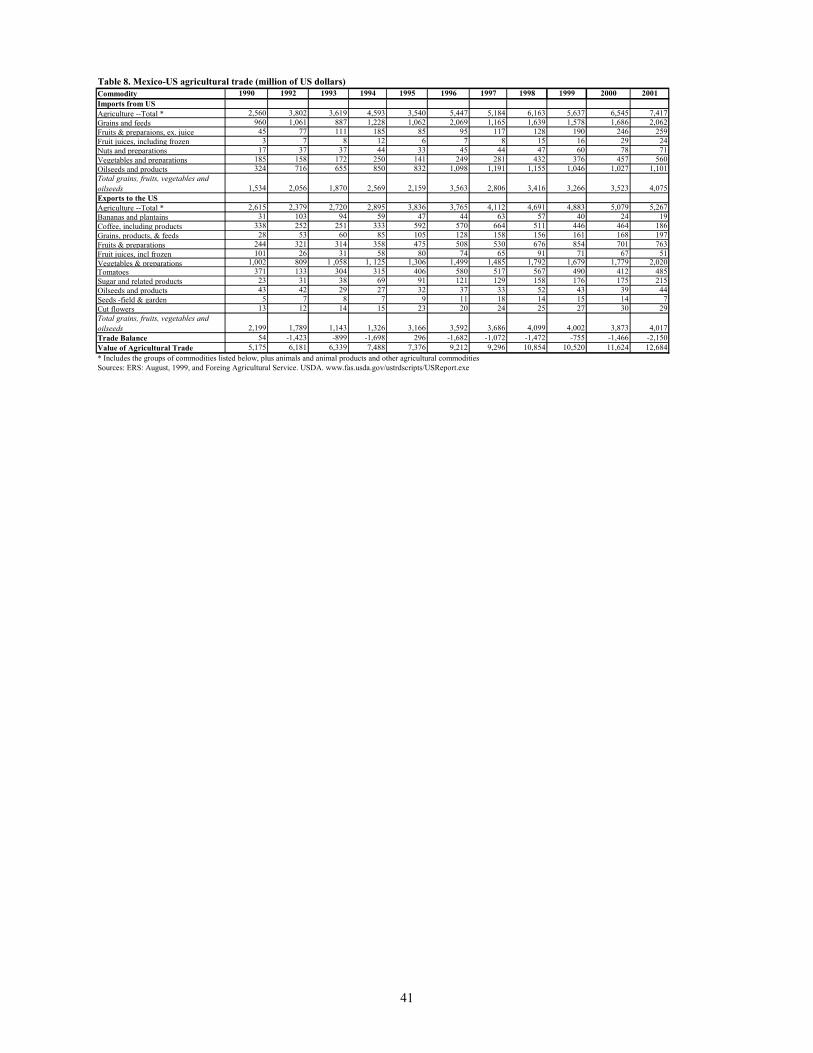
41
Table 8. Mexico-US agricultural trade (million of US dollars)Commodity 1990 1992 1993 1994 1995 1996 1997 1998 1999 2000 2001Imports from USAgriculture --Total * 2,560 3,802 3,619 4,593 3,540 5,447 5,184 6,163 5,637 6,545 7,417Grains and feeds 960 1,061 887 1,228 1,062 2,069 1,165 1,639 1,578 1,686 2,062Fruits & preparaions, ex. juice 45 77 111 185 85 95 117 128 190 246 259Fruit juices, including frozen 3 7 8 12 6 7 8 15 16 29 24Nuts and preparations 17 37 37 44 33 45 44 47 60 78 71Vegetables and preparations 185 158 172 250 141 249 281 432 376 457 560Oilseeds and products 324 716 655 850 832 1,098 1,191 1,155 1,046 1,027 1,101Total grains, fruits, vegetables and oilseeds 1,534 2,056 1,870 2,569 2,159 3,563 2,806 3,416 3,266 3,523 4,075Exports to the USAgriculture --Total * 2,615 2,379 2,720 2,895 3,836 3,765 4,112 4,691 4,883 5,079 5,267Bananas and plantains 31 103 94 59 47 44 63 57 40 24 19Coffee, including products 338 252 251 333 592 570 664 511 446 464 186Grains, products, & feeds 28 53 60 85 105 128 158 156 161 168 197Fruits & preparations 244 321 314 358 475 508 530 676 854 701 763Fruit juices, incl frozen 101 26 31 58 80 74 65 91 71 67 51Vegetables & preparations 1,002 809 1 ,058 1, 125 1,306 1,499 1,485 1,792 1,679 1,779 2,020Tomatoes 371 133 304 315 406 580 517 567 490 412 485Sugar and related products 23 31 38 69 91 121 129 158 176 175 215Oilseeds and products 43 42 29 27 32 37 33 52 43 39 44Seeds -field & garden 5 7 8 7 9 11 18 14 15 14 7Cut flowers 13 12 14 15 23 20 24 25 27 30 29Total grains, fruits, vegetables and oilseeds 2,199 1,789 1,143 1,326 3,166 3,592 3,686 4,099 4,002 3,873 4,017Trade Balance 54 -1,423 -899 -1,698 296 -1,682 -1,072 -1,472 -755 -1,466 -2,150Value of Agricultural Trade 5,175 6,181 6,339 7,488 7,376 9,212 9,296 10,854 10,520 11,624 12,684* Includes the groups of commodities listed below, plus animals and animal products and other agricultural commoditiesSources: ERS: August, 1999, and Foreing Agricultural Service. USDA. www.fas.usda.gov/ustrdscripts/USReport.exe
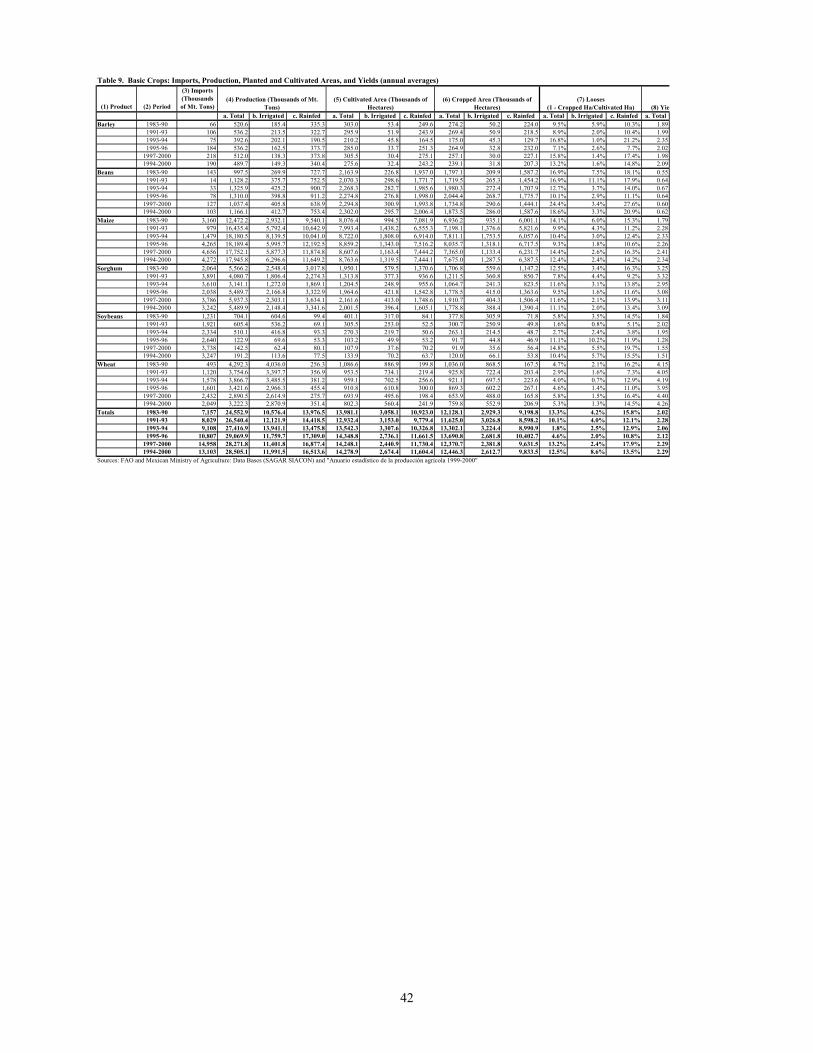
42
Table 9. Basic Crops: Imports, Production, Planted and Cultivated Areas, and Yields (annual averages)
(1) Product (2) Period
(3) Imports (Thousands of Mt. Tons)
a. Total b. Irrigated c. Rainfed a. Total b. Irrigated c. Rainfed a. Total b. Irrigated c. Rainfed a. Total b. Irrigated c. Rainfed a. TotalBarley 1983-90 66 520.6 185.4 335.3 303.0 53.4 249.6 274.2 50.2 224.0 9.5% 5.9% 10.3% 1.89
1991-93 106 536.2 213.5 322.7 295.9 51.9 243.9 269.4 50.9 218.5 8.9% 2.0% 10.4% 1.991993-94 75 392.6 202.1 190.5 210.2 45.8 164.5 175.0 45.3 129.7 16.8% 1.0% 21.2% 2.351995-96 184 536.2 162.5 373.7 285.0 33.7 251.3 264.9 32.8 232.0 7.1% 2.6% 7.7% 2.02
1997-2000 218 512.0 138.3 373.8 305.5 30.4 275.1 257.1 30.0 227.1 15.8% 1.4% 17.4% 1.981994-2000 190 489.7 149.3 340.4 275.6 32.4 243.2 239.1 31.8 207.3 13.2% 1.6% 14.8% 2.09
Beans 1983-90 143 997.5 269.9 727.7 2,163.9 226.8 1,937.0 1,797.1 209.9 1,587.2 16.9% 7.5% 18.1% 0.551991-93 14 1,128.2 375.7 752.5 2,070.3 298.6 1,771.7 1,719.5 265.3 1,454.2 16.9% 11.1% 17.9% 0.641993-94 33 1,325.9 425.2 900.7 2,268.3 282.7 1,985.6 1,980.3 272.4 1,707.9 12.7% 3.7% 14.0% 0.671995-96 78 1,310.0 398.8 911.2 2,274.8 276.8 1,998.0 2,044.4 268.7 1,775.7 10.1% 2.9% 11.1% 0.64
1997-2000 127 1,037.4 405.8 638.9 2,294.8 300.9 1,993.8 1,734.8 290.6 1,444.1 24.4% 3.4% 27.6% 0.601994-2000 103 1,166.1 412.7 753.4 2,302.0 295.7 2,006.4 1,873.5 286.0 1,587.6 18.6% 3.3% 20.9% 0.62
Maize 1983-90 3,160 12,472.2 2,932.1 9,540.1 8,076.4 994.5 7,081.9 6,936.2 935.1 6,001.1 14.1% 6.0% 15.3% 1.791991-93 979 16,435.4 5,792.4 10,642.9 7,993.4 1,438.2 6,555.3 7,198.1 1,376.6 5,821.6 9.9% 4.3% 11.2% 2.281993-94 1,479 18,180.5 8,139.5 10,041.0 8,722.0 1,808.0 6,914.0 7,811.1 1,753.5 6,057.6 10.4% 3.0% 12.4% 2.331995-96 4,265 18,189.4 5,995.7 12,192.5 8,859.2 1,343.0 7,516.2 8,035.7 1,318.1 6,717.5 9.3% 1.8% 10.6% 2.26
1997-2000 4,656 17,752.1 5,877.3 11,874.8 8,607.6 1,163.4 7,444.2 7,365.0 1,133.4 6,231.7 14.4% 2.6% 16.3% 2.411994-2000 4,272 17,945.8 6,296.6 11,649.2 8,763.6 1,319.5 7,444.1 7,675.0 1,287.5 6,387.5 12.4% 2.4% 14.2% 2.34
Sorghum 1983-90 2,064 5,566.2 2,548.4 3,017.8 1,950.1 579.5 1,370.6 1,706.8 559.6 1,147.2 12.5% 3.4% 16.3% 3.251991-93 3,891 4,080.7 1,806.4 2,274.3 1,313.8 377.3 936.6 1,211.5 360.8 850.7 7.8% 4.4% 9.2% 3.321993-94 3,610 3,141.1 1,272.0 1,869.1 1,204.5 248.9 955.6 1,064.7 241.3 823.5 11.6% 3.1% 13.8% 2.951995-96 2,038 5,489.7 2,166.8 3,322.9 1,964.6 421.8 1,542.8 1,778.5 415.0 1,363.6 9.5% 1.6% 11.6% 3.08
1997-2000 3,786 5,937.3 2,303.1 3,634.1 2,161.6 413.0 1,748.6 1,910.7 404.3 1,506.4 11.6% 2.1% 13.9% 3.111994-2000 3,242 5,489.9 2,148.4 3,341.6 2,001.5 396.4 1,605.1 1,778.8 388.4 1,390.4 11.1% 2.0% 13.4% 3.09
Soybeans 1983-90 1,231 704.1 604.6 99.4 401.1 317.0 84.1 377.8 305.9 71.8 5.8% 3.5% 14.5% 1.841991-93 1,921 605.4 536.2 69.1 305.5 253.0 52.5 300.7 250.9 49.8 1.6% 0.8% 5.1% 2.021993-94 2,334 510.1 416.8 93.3 270.3 219.7 50.6 263.1 214.5 48.7 2.7% 2.4% 3.8% 1.951995-96 2,640 122.9 69.6 53.3 103.2 49.9 53.2 91.7 44.8 46.9 11.1% 10.2% 11.9% 1.28
1997-2000 3,738 142.5 62.4 80.1 107.9 37.6 70.2 91.9 35.6 56.4 14.8% 5.5% 19.7% 1.551994-2000 3,247 191.2 113.6 77.5 133.9 70.2 63.7 120.0 66.1 53.8 10.4% 5.7% 15.5% 1.51
Wheat 1983-90 493 4,292.3 4,036.0 256.3 1,086.6 886.9 199.8 1,036.0 868.5 167.5 4.7% 2.1% 16.2% 4.151991-93 1,120 3,754.6 3,397.7 356.9 953.5 734.1 219.4 925.8 722.4 203.4 2.9% 1.6% 7.3% 4.051993-94 1,578 3,866.7 3,485.5 381.2 959.1 702.5 256.6 921.1 697.5 223.6 4.0% 0.7% 12.9% 4.191995-96 1,601 3,421.6 2,966.3 455.4 910.8 610.8 300.0 869.3 602.2 267.1 4.6% 1.4% 11.0% 3.95
1997-2000 2,432 2,890.5 2,614.9 275.7 693.9 495.6 198.4 653.9 488.0 165.8 5.8% 1.5% 16.4% 4.401994-2000 2,049 3,222.3 2,870.9 351.4 802.3 560.4 241.9 759.8 552.9 206.9 5.3% 1.3% 14.5% 4.26
Totals 1983-90 7,157 24,552.9 10,576.4 13,976.5 13,981.1 3,058.1 10,923.0 12,128.1 2,929.3 9,198.8 13.3% 4.2% 15.8% 2.021991-93 8,029 26,540.4 12,121.9 14,418.5 12,932.4 3,153.0 9,779.4 11,625.0 3,026.8 8,598.2 10.1% 4.0% 12.1% 2.281993-94 9,108 27,416.9 13,941.1 13,475.8 13,542.3 3,307.6 10,326.8 13,302.1 3,224.4 8,990.9 1.8% 2.5% 12.9% 2.061995-96 10,807 29,069.9 11,759.7 17,309.0 14,348.8 2,736.1 11,661.5 13,690.8 2,681.8 10,402.7 4.6% 2.0% 10.8% 2.12
1997-2000 14,958 28,271.8 11,401.8 16,877.4 14,248.1 2,440.9 11,730.4 12,370.7 2,381.8 9,631.5 13.2% 2.4% 17.9% 2.291994-2000 13,103 28,505.1 11,991.5 16,513.6 14,278.9 2,674.4 11,604.4 12,446.3 2,612.7 9,833.5 12.5% 8.6% 13.5% 2.29
Sources: FAO and Mexican Ministry of Agriculture: Data Bases (SAGAR SIACON) and "Anuario estadístico de la producción agrícola 1999-2000"
(7) Looses (1 - Cropped Ha/Cultivated Ha) (8) Yiel
(4) Production (Thousands of Mt. Tons)
(5) Cultivated Area (Thousands of Hectares)
(6) Cropped Area (Thousands of Hectares)
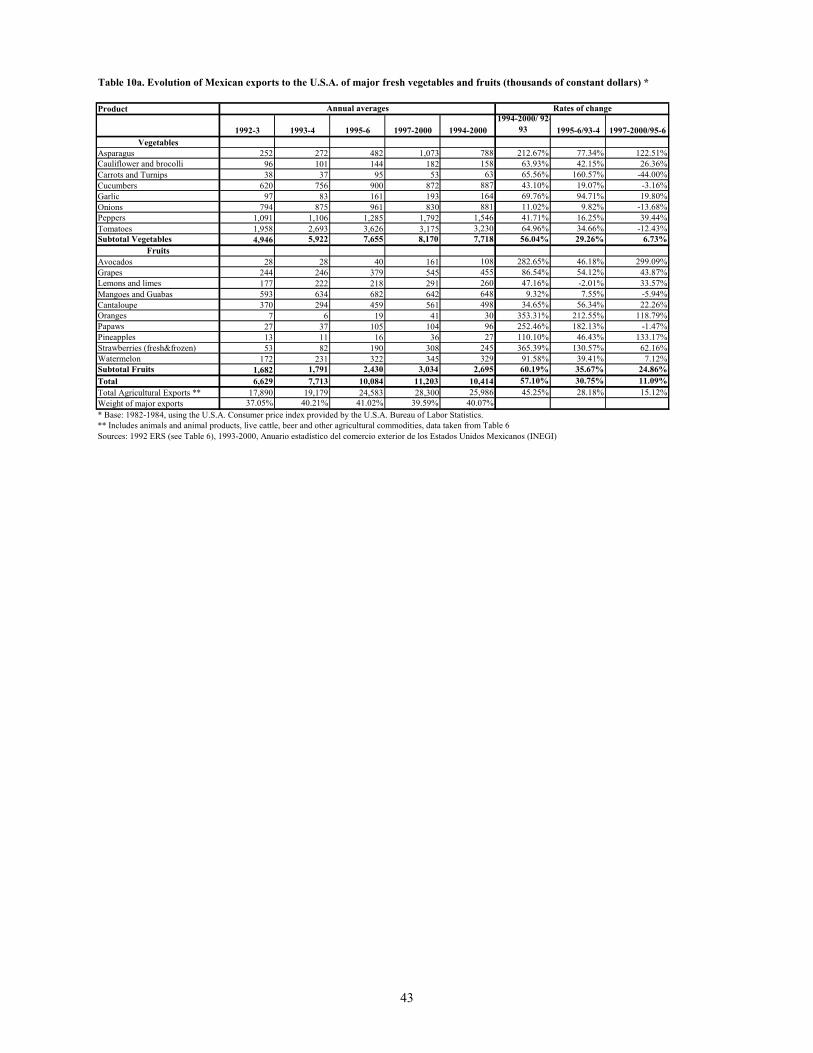
43
Table 10a. Evolution of Mexican exports to the U.S.A. of major fresh vegetables and fruits (thousands of constant dollars) *
Product
1992-3 1993-4 1995-6 1997-2000 1994-20001994-2000/ 92-
93 1995-6/93-4 1997-2000/95-6Vegetables
Asparagus 252 272 482 1,073 788 212.67% 77.34% 122.51%Cauliflower and brocolli 96 101 144 182 158 63.93% 42.15% 26.36%Carrots and Turnips 38 37 95 53 63 65.56% 160.57% -44.00%Cucumbers 620 756 900 872 887 43.10% 19.07% -3.16%Garlic 97 83 161 193 164 69.76% 94.71% 19.80%Onions 794 875 961 830 881 11.02% 9.82% -13.68%Peppers 1,091 1,106 1,285 1,792 1,546 41.71% 16.25% 39.44%Tomatoes 1,958 2,693 3,626 3,175 3,230 64.96% 34.66% -12.43%Subtotal Vegetables 4,946 5,922 7,655 8,170 7,718 56.04% 29.26% 6.73%
FruitsAvocados 28 28 40 161 108 282.65% 46.18% 299.09%Grapes 244 246 379 545 455 86.54% 54.12% 43.87%Lemons and limes 177 222 218 291 260 47.16% -2.01% 33.57%Mangoes and Guabas 593 634 682 642 648 9.32% 7.55% -5.94%Cantaloupe 370 294 459 561 498 34.65% 56.34% 22.26%Oranges 7 6 19 41 30 353.31% 212.55% 118.79%Papaws 27 37 105 104 96 252.46% 182.13% -1.47%Pineapples 13 11 16 36 27 110.10% 46.43% 133.17%Strawberries (fresh&frozen) 53 82 190 308 245 365.39% 130.57% 62.16%Watermelon 172 231 322 345 329 91.58% 39.41% 7.12%Subtotal Fruits 1,682 1,791 2,430 3,034 2,695 60.19% 35.67% 24.86%Total 6,629 7,713 10,084 11,203 10,414 57.10% 30.75% 11.09%Total Agricultural Exports ** 17,890 19,179 24,583 28,300 25,986 45.25% 28.18% 15.12%Weight of major exports 37.05% 40.21% 41.02% 39.59% 40.07%* Base: 1982-1984, using the U.S.A. Consumer price index provided by the U.S.A. Bureau of Labor Statistics. ** Includes animals and animal products, live cattle, beer and other agricultural commodities, data taken from Table 6Sources: 1992 ERS (see Table 6), 1993-2000, Anuario estadístico del comercio exterior de los Estados Unidos Mexicanos (INEGI)
Rates of changeAnnual averages
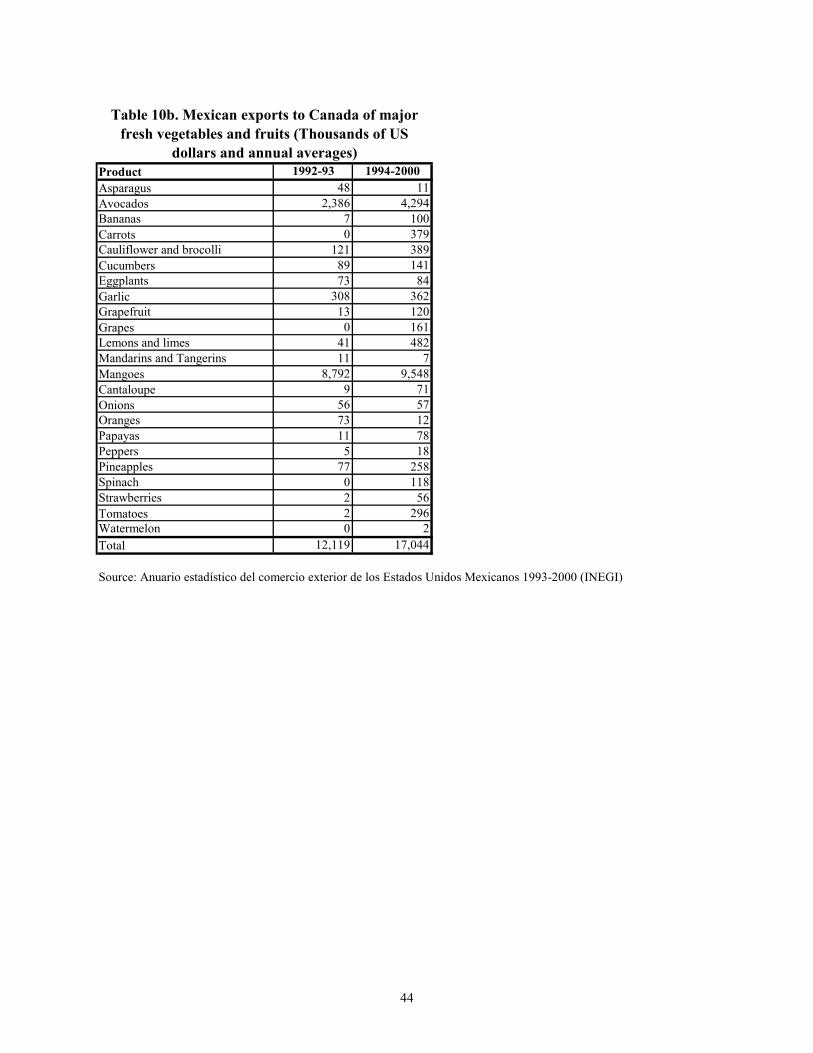
44
Product 1992-93 1994-2000Asparagus 48 11Avocados 2,386 4,294Bananas 7 100Carrots 0 379Cauliflower and brocolli 121 389Cucumbers 89 141Eggplants 73 84Garlic 308 362Grapefruit 13 120Grapes 0 161Lemons and limes 41 482Mandarins and Tangerins 11 7Mangoes 8,792 9,548Cantaloupe 9 71Onions 56 57Oranges 73 12Papayas 11 78Peppers 5 18Pineapples 77 258Spinach 0 118Strawberries 2 56Tomatoes 2 296Watermelon 0 2Total 12,119 17,044
Source: Anuario estadístico del comercio exterior de los Estados Unidos Mexicanos 1993-2000 (INEGI)
Table 10b. Mexican exports to Canada of major fresh vegetables and fruits (Thousands of US
dollars and annual averages)
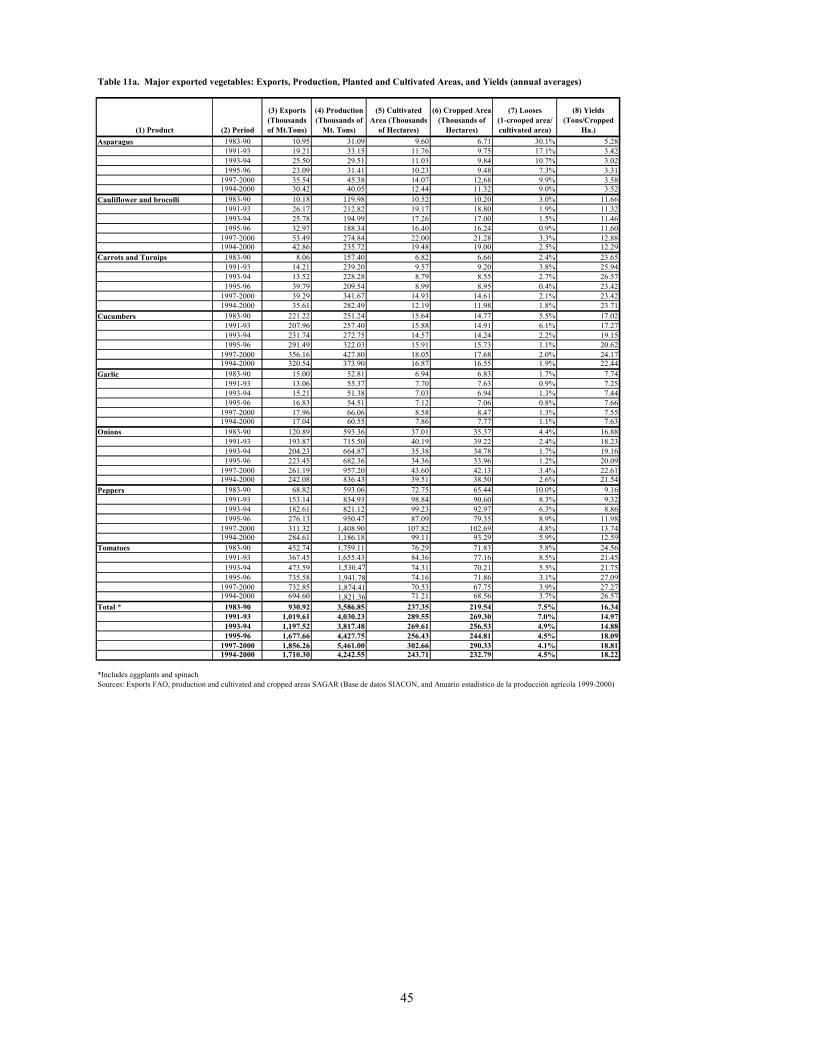
45
Table 11a. Major exported vegetables: Exports, Production, Planted and Cultivated Areas, and Yields (annual averages)
(1) Product (2) Period
(3) Exports (Thousands of Mt.Tons)
(4) Production (Thousands of
Mt. Tons)
(5) Cultivated Area (Thousands
of Hectares)
(6) Cropped Area (Thousands of
Hectares)
(7) Looses (1-crooped area/ cultivated area)
(8) Yields (Tons/Cropped
Ha.)Asparagus 1983-90 10.95 31.09 9.60 6.71 30.1% 5.28
1991-93 19.21 33.15 11.76 9.75 17.1% 3.421993-94 25.50 29.51 11.03 9.84 10.7% 3.021995-96 23.09 31.41 10.23 9.48 7.3% 3.31
1997-2000 35.54 45.38 14.07 12.68 9.9% 3.581994-2000 30.42 40.05 12.44 11.32 9.0% 3.52
Cauliflower and brocolli 1983-90 10.18 119.98 10.52 10.20 3.0% 11.661991-93 26.17 212.82 19.17 18.80 1.9% 11.321993-94 25.78 194.99 17.26 17.00 1.5% 11.461995-96 32.97 188.34 16.40 16.24 0.9% 11.60
1997-2000 53.49 274.84 22.00 21.28 3.3% 12.881994-2000 42.86 235.72 19.48 19.00 2.5% 12.29
Carrots and Turnips 1983-90 8.06 157.40 6.82 6.66 2.4% 23.651991-93 14.21 239.20 9.57 9.20 3.8% 25.941993-94 13.52 228.28 8.79 8.55 2.7% 26.571995-96 39.79 209.54 8.99 8.95 0.4% 23.42
1997-2000 39.29 341.67 14.93 14.61 2.1% 23.421994-2000 35.61 282.49 12.19 11.98 1.8% 23.71
Cucumbers 1983-90 221.22 251.24 15.64 14.77 5.5% 17.021991-93 207.96 257.40 15.88 14.91 6.1% 17.271993-94 231.74 272.75 14.57 14.24 2.2% 19.151995-96 291.49 322.03 15.91 15.73 1.1% 20.62
1997-2000 356.16 427.80 18.05 17.68 2.0% 24.171994-2000 320.54 373.90 16.87 16.55 1.9% 22.44
Garlic 1983-90 15.00 52.81 6.94 6.83 1.7% 7.741991-93 13.06 55.37 7.70 7.63 0.9% 7.251993-94 15.21 51.38 7.03 6.94 1.3% 7.441995-96 16.83 54.51 7.12 7.06 0.8% 7.66
1997-2000 17.96 66.06 8.58 8.47 1.3% 7.551994-2000 17.04 60.55 7.86 7.77 1.1% 7.63
Onions 1983-90 120.89 593.36 37.01 35.37 4.4% 16.881991-93 193.87 715.50 40.19 39.22 2.4% 18.231993-94 204.23 664.87 35.38 34.78 1.7% 19.161995-96 223.45 682.36 34.36 33.96 1.2% 20.09
1997-2000 261.19 957.20 43.60 42.13 3.4% 22.611994-2000 242.08 836.43 39.51 38.50 2.6% 21.54
Peppers 1983-90 68.82 593.06 72.75 65.44 10.0% 9.161991-93 153.14 834.93 98.84 90.60 8.3% 9.321993-94 182.61 821.12 99.23 92.97 6.3% 8.861995-96 276.13 950.47 87.09 79.35 8.9% 11.98
1997-2000 311.32 1,408.90 107.82 102.69 4.8% 13.741994-2000 284.61 1,186.18 99.11 93.29 5.9% 12.59
Tomatoes 1983-90 452.74 1,759.11 76.29 71.83 5.8% 24.561991-93 367.45 1,655.43 84.36 77.16 8.5% 21.451993-94 473.59 1,530.47 74.31 70.21 5.5% 21.751995-96 735.58 1,941.78 74.16 71.86 3.1% 27.09
1997-2000 732.85 1,874.41 70.53 67.75 3.9% 27.271994-2000 694.60 1,821.36 71.21 68.56 3.7% 26.57
Total * 1983-90 930.92 3,586.85 237.35 219.54 7.5% 16.341991-93 1,019.61 4,030.23 289.55 269.30 7.0% 14.971993-94 1,197.52 3,817.48 269.61 256.53 4.9% 14.881995-96 1,677.66 4,427.75 256.43 244.81 4.5% 18.09
1997-2000 1,856.26 5,461.00 302.66 290.33 4.1% 18.811994-2000 1,710.30 4,242.55 243.71 232.79 4.5% 18.22
*Includes eggplants and spinachSources: Exports FAO, production and cultivated and cropped areas SAGAR (Base de datos SIACON, and Anuario estadístico de la producción agrícola 1999-2000)
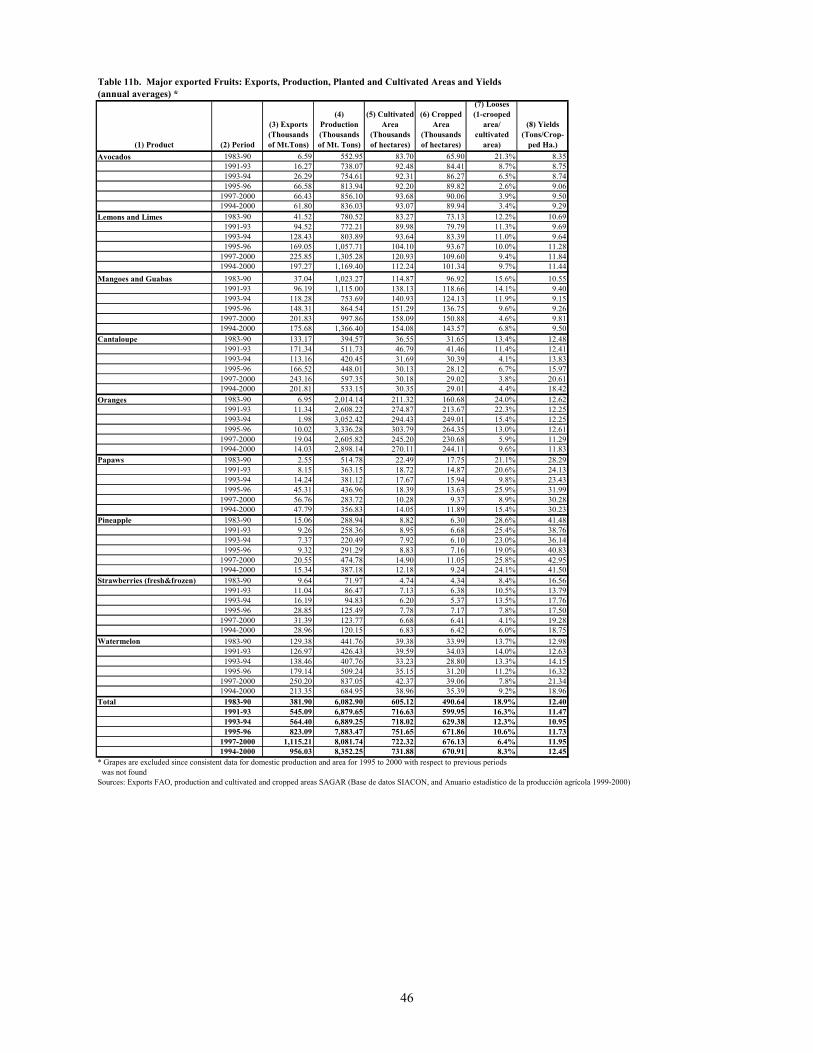
46
Table 11b. Major exported Fruits: Exports, Production, Planted and Cultivated Areas and Yields(annual averages) *
(1) Product (2) Period
(3) Exports (Thousands of Mt.Tons)
(4) Production (Thousands of Mt. Tons)
(5) Cultivated Area
(Thousands of hectares)
(6) Cropped Area
(Thousands of hectares)
(7) Looses (1-crooped
area/ cultivated
area)
(8) Yields (Tons/Crop-
ped Ha.)Avocados 1983-90 6.59 552.95 83.70 65.90 21.3% 8.35
1991-93 16.27 738.07 92.48 84.41 8.7% 8.751993-94 26.29 754.61 92.31 86.27 6.5% 8.741995-96 66.58 813.94 92.20 89.82 2.6% 9.06
1997-2000 66.43 856.10 93.68 90.06 3.9% 9.501994-2000 61.80 836.03 93.07 89.94 3.4% 9.29
Lemons and Limes 1983-90 41.52 780.52 83.27 73.13 12.2% 10.691991-93 94.52 772.21 89.98 79.79 11.3% 9.691993-94 128.43 803.89 93.64 83.39 11.0% 9.641995-96 169.05 1,057.71 104.10 93.67 10.0% 11.28
1997-2000 225.85 1,305.28 120.93 109.60 9.4% 11.841994-2000 197.27 1,169.40 112.24 101.34 9.7% 11.44
Mangoes and Guabas 1983-90 37.04 1,023.27 114.87 96.92 15.6% 10.551991-93 96.19 1,115.00 138.13 118.66 14.1% 9.401993-94 118.28 753.69 140.93 124.13 11.9% 9.151995-96 148.31 864.54 151.29 136.75 9.6% 9.26
1997-2000 201.83 997.86 158.09 150.88 4.6% 9.811994-2000 175.68 1,366.40 154.08 143.57 6.8% 9.50
Cantaloupe 1983-90 133.17 394.57 36.55 31.65 13.4% 12.481991-93 171.34 511.73 46.79 41.46 11.4% 12.411993-94 113.16 420.45 31.69 30.39 4.1% 13.831995-96 166.52 448.01 30.13 28.12 6.7% 15.97
1997-2000 243.16 597.35 30.18 29.02 3.8% 20.611994-2000 201.81 533.15 30.35 29.01 4.4% 18.42
Oranges 1983-90 6.95 2,014.14 211.32 160.68 24.0% 12.621991-93 11.34 2,608.22 274.87 213.67 22.3% 12.251993-94 1.98 3,052.42 294.43 249.01 15.4% 12.251995-96 10.02 3,336.28 303.79 264.35 13.0% 12.61
1997-2000 19.04 2,605.82 245.20 230.68 5.9% 11.291994-2000 14.03 2,898.14 270.11 244.11 9.6% 11.83
Papaws 1983-90 2.55 514.78 22.49 17.75 21.1% 28.291991-93 8.15 363.15 18.72 14.87 20.6% 24.131993-94 14.24 381.12 17.67 15.94 9.8% 23.431995-96 45.31 436.96 18.39 13.63 25.9% 31.99
1997-2000 56.76 283.72 10.28 9.37 8.9% 30.281994-2000 47.79 356.83 14.05 11.89 15.4% 30.23
Pineapple 1983-90 15.06 288.94 8.82 6.30 28.6% 41.481991-93 9.26 258.36 8.95 6.68 25.4% 38.761993-94 7.37 220.49 7.92 6.10 23.0% 36.141995-96 9.32 291.29 8.83 7.16 19.0% 40.83
1997-2000 20.55 474.78 14.90 11.05 25.8% 42.951994-2000 15.34 387.18 12.18 9.24 24.1% 41.50
Strawberries (fresh&frozen) 1983-90 9.64 71.97 4.74 4.34 8.4% 16.561991-93 11.04 86.47 7.13 6.38 10.5% 13.791993-94 16.19 94.83 6.20 5.37 13.5% 17.761995-96 28.85 125.49 7.78 7.17 7.8% 17.50
1997-2000 31.39 123.77 6.68 6.41 4.1% 19.281994-2000 28.96 120.15 6.83 6.42 6.0% 18.75
Watermelon 1983-90 129.38 441.76 39.38 33.99 13.7% 12.981991-93 126.97 426.43 39.59 34.03 14.0% 12.631993-94 138.46 407.76 33.23 28.80 13.3% 14.151995-96 179.14 509.24 35.15 31.20 11.2% 16.32
1997-2000 250.20 837.05 42.37 39.06 7.8% 21.341994-2000 213.35 684.95 38.96 35.39 9.2% 18.96
Total 1983-90 381.90 6,082.90 605.12 490.64 18.9% 12.401991-93 545.09 6,879.65 716.63 599.95 16.3% 11.471993-94 564.40 6,889.25 718.02 629.38 12.3% 10.951995-96 823.09 7,883.47 751.65 671.86 10.6% 11.73
1997-2000 1,115.21 8,081.74 722.32 676.13 6.4% 11.951994-2000 956.03 8,352.25 731.88 670.91 8.3% 12.45
* Grapes are excluded since consistent data for domestic production and area for 1995 to 2000 with respect to previous periods was not foundSources: Exports FAO, production and cultivated and cropped areas SAGAR (Base de datos SIACON, and Anuario estadístico de la producción agrícola 1999-2000)
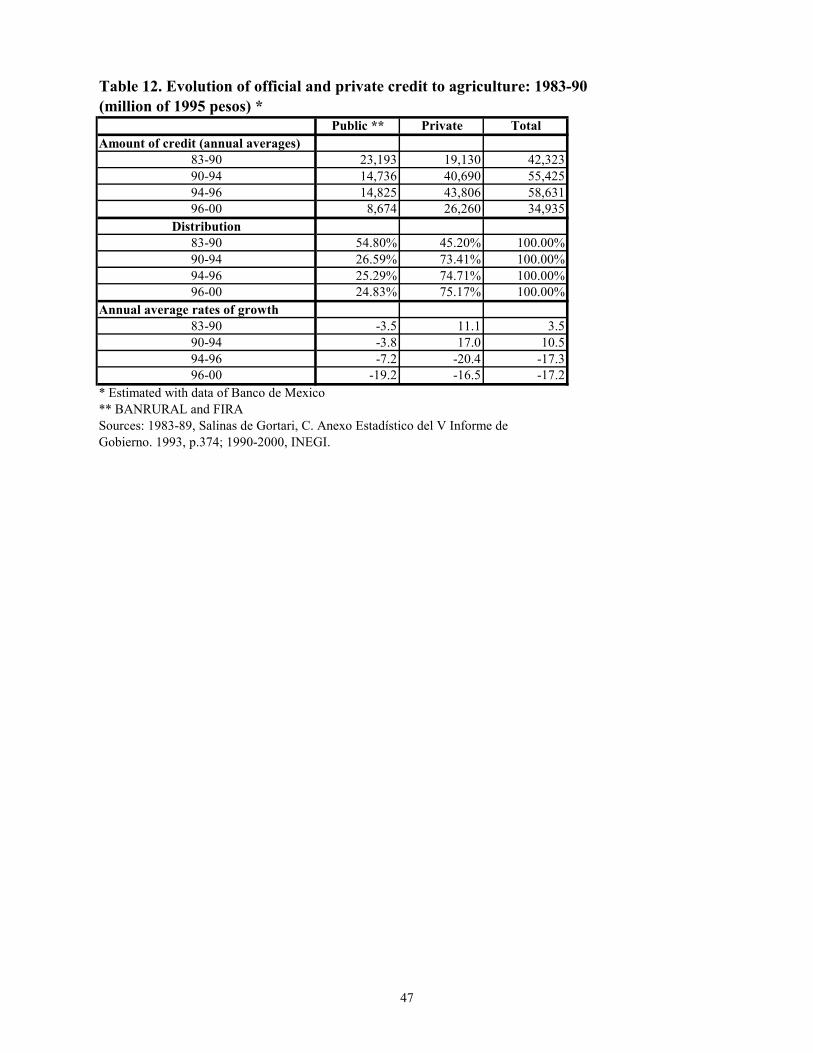
47
Table 12. Evolution of official and private credit to agriculture: 1983-90 (million of 1995 pesos) *
Public ** Private TotalAmount of credit (annual averages)
83-90 23,193 19,130 42,32390-94 14,736 40,690 55,42594-96 14,825 43,806 58,63196-00 8,674 26,260 34,935
Distribution83-90 54.80% 45.20% 100.00%90-94 26.59% 73.41% 100.00%94-96 25.29% 74.71% 100.00%96-00 24.83% 75.17% 100.00%
Annual average rates of growth83-90 -3.5 11.1 3.590-94 -3.8 17.0 10.594-96 -7.2 -20.4 -17.396-00 -19.2 -16.5 -17.2
* Estimated with data of Banco de Mexico** BANRURAL and FIRASources: 1983-89, Salinas de Gortari, C. Anexo Estadístico del V Informe de Gobierno. 1993, p.374; 1990-2000, INEGI.

48

49