Embed Size (px)
Citation preview
Newsletter 2nd Quarter 2017
Lessons From Buffett’s Bet
1
Recently, Warren Buffett reminded us that in Berkshire Hathaway’s 2005 annual report he had “argued that active investment management by professionals—in aggregate—would over a period of years underperform
the returns achieved by rank amateurs who simply sat still.” The culprit: fees. In 2008, Buffett wagered $1 million that, over a 10-year period, the S&P 500 would outperform a portfolio of funds of hedge funds.
While there is still a year remaining in the bet’s term, it’s clearly all over—the S&P 500 won by a mile. Here, then, are some lessons from America’s most admired—but least imitated—investor.
Warren Buffett is America’s most admired—but least
imitated—investor.
In his 2017 letter to Berkshire Hathaway shareholders, he strongly endorsed the case for low-fee indexing not just as the best approach for individual investors, but also for institu-tional investors.
On pages 21-25 of the letter, Buffett described “The Bet,” which was originally posted on the Long Bets website (longbets.org/362/). Here is Buffett’s argument from the original bet:
Over a ten-year period commencing on January 1, 2008, and ending on December 31, 2017, the S&P 500 will outperform a portfolio of funds of hedge funds, when performance is measured on a basis net of fees, costs and expenses.
A lot of very smart people set out to do better than average in securities markets. Call them active investors.
Their opposites, passive investors, will by defi-nition do about average. In aggregate their positions will more or less approximate those of an index fund. Therefore, the balance of the universe—the active investors—must do about
average as well. However, these investors will incur far greater costs. So, on balance, their aggregate results after these costs will be worse than those of the passive investors.
Costs skyrocket when large annual fees, large performance fees, and active trading costs are all added to the active
investor’s equation. Funds of hedge funds accentuate this cost problem because their fees are superimposed on the large fees charged by the hedge funds in which the funds of funds are invested.
A number of smart people are involved in running hedge funds. But to a great extent their efforts are self-neutralizing, and their IQs will not overcome the costs they impose on investors. Investors, on average and over time, will do better with a low-cost index fund than with a group of funds of funds.
After a long period of silence, someone finally accepted Buffett’s $1 million wager: Ted Seides, a co-manager of Protégé Partners. Protégé is a fund of funds, and Mr. Seides selected five funds of funds for his side of the bet to compete against an S&P 500 index fund.
Please see BUFFETTpage 2
2
2nd Quarter 2017
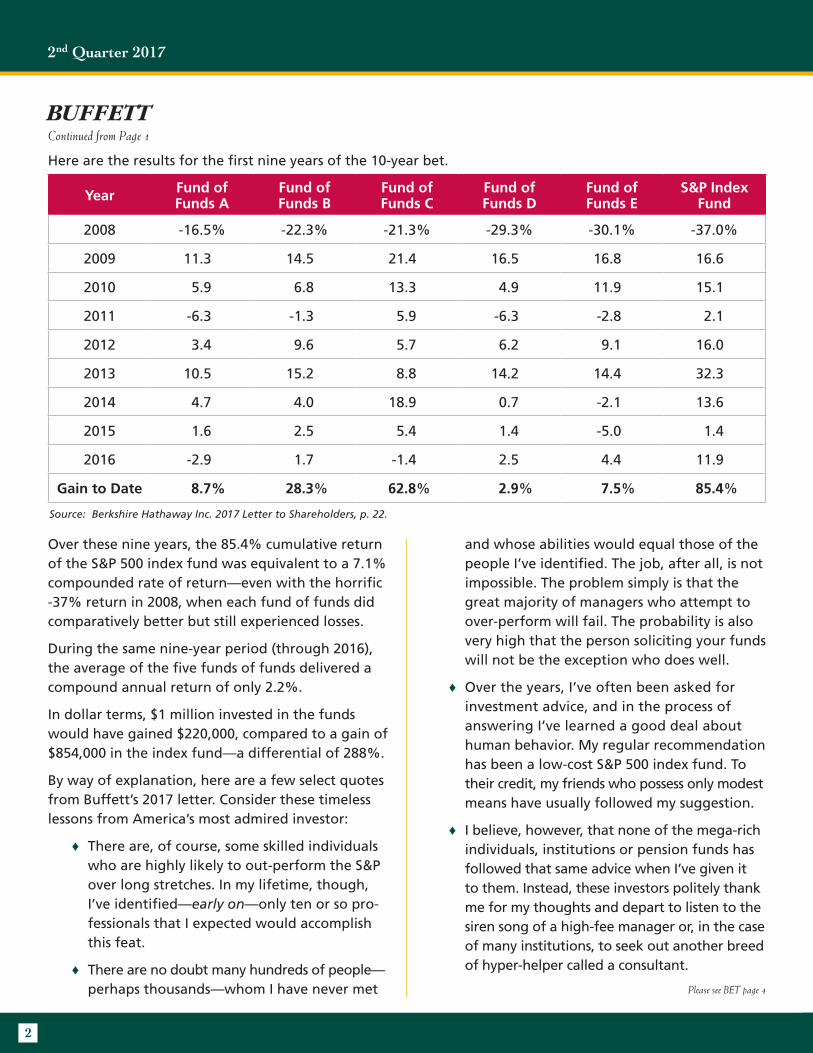
Here are the results for the first nine years of the 10-year bet.
BUFFETTContinued from Page 1
Over these nine years, the 85.4% cumulative return of the S&P 500 index fund was equivalent to a 7.1% compounded rate of return—even with the horrific -37% return in 2008, when each fund of funds did comparatively better but still experienced losses.
During the same nine-year period (through 2016), the average of the five funds of funds delivered a compound annual return of only 2.2%.
In dollar terms, $1 million invested in the funds would have gained $220,000, compared to a gain of $854,000 in the index fund—a differential of 288%.
By way of explanation, here are a few select quotes from Buffett’s 2017 letter. Consider these timeless lessons from America’s most admired investor:
♦ There are, of course, some skilled individuals who are highly likely to out-perform the S&P over long stretches. In my lifetime, though, I’ve identified—early on—only ten or so pro-fessionals that I expected would accomplish this feat.
♦ There are no doubt many hundreds of people— perhaps thousands—whom I have never met
and whose abilities would equal those of the people I’ve identified. The job, after all, is not impossible. The problem simply is that the great majority of managers who attempt to over-perform will fail. The probability is also very high that the person soliciting your funds will not be the exception who does well.
♦ Over the years, I’ve often been asked for investment advice, and in the process of answering I’ve learned a good deal about human behavior. My regular recommendation has been a low-cost S&P 500 index fund. To their credit, my friends who possess only modest means have usually followed my suggestion.
♦ I believe, however, that none of the mega-rich individuals, institutions or pension funds has followed that same advice when I’ve given it to them. Instead, these investors politely thank me for my thoughts and depart to listen to the siren song of a high-fee manager or, in the case of many institutions, to seek out another breed of hyper-helper called a consultant.
Year Fund of Funds A
Fund of Funds B
Fund of Funds C
Fund of Funds D
Fund of Funds E
S&P Index Fund
2008 -16.5% -22.3% -21.3% -29.3% -30.1% -37.0%
2009 11.3 14.5 21.4 16.5 16.8 16.6
2010 5.9 6.8 13.3 4.9 11.9 15.1
2011 -6.3 -1.3 5.9 -6.3 -2.8 2.1
2012 3.4 9.6 5.7 6.2 9.1 16.0
2013 10.5 15.2 8.8 14.2 14.4 32.3
2014 4.7 4.0 18.9 0.7 -2.1 13.6
2015 1.6 2.5 5.4 1.4 -5.0 1.4
2016 -2.9 1.7 -1.4 2.5 4.4 11.9
Gain to Date 8.7% 28.3% 62.8% 2.9% 7.5% 85.4%
Please see BET page 4
Source: Berkshire Hathaway Inc. 2017 Letter to Shareholders, p. 22.
2nd Quarter 2017
3
Earnings: The 95% Solution
Volatility Does Not Equal Risk
The correlation between earnings and stock prices since 1935 has
been 95%. Since 1975, earnings have compounded at about 7% per year, and the S&P 500 price (excluding dividends) has compounded at about 8% a year. The earnings recession caused by the drag from the energy sector over the past three years has ended. Given projected earnings for 2017 and current interest rates and inflation relative to their historical averages, the equity market is not overvalued.
Let’s check the premise that equities are overvalued with some basic valuation arithmetic.
♦ On Jan. 31, 2017, the S&P 500 closed at 2,278.87.
♦ According to FactSet, the consensus calendar year 2017 earnings estimate for the S&P 500 is about $133.
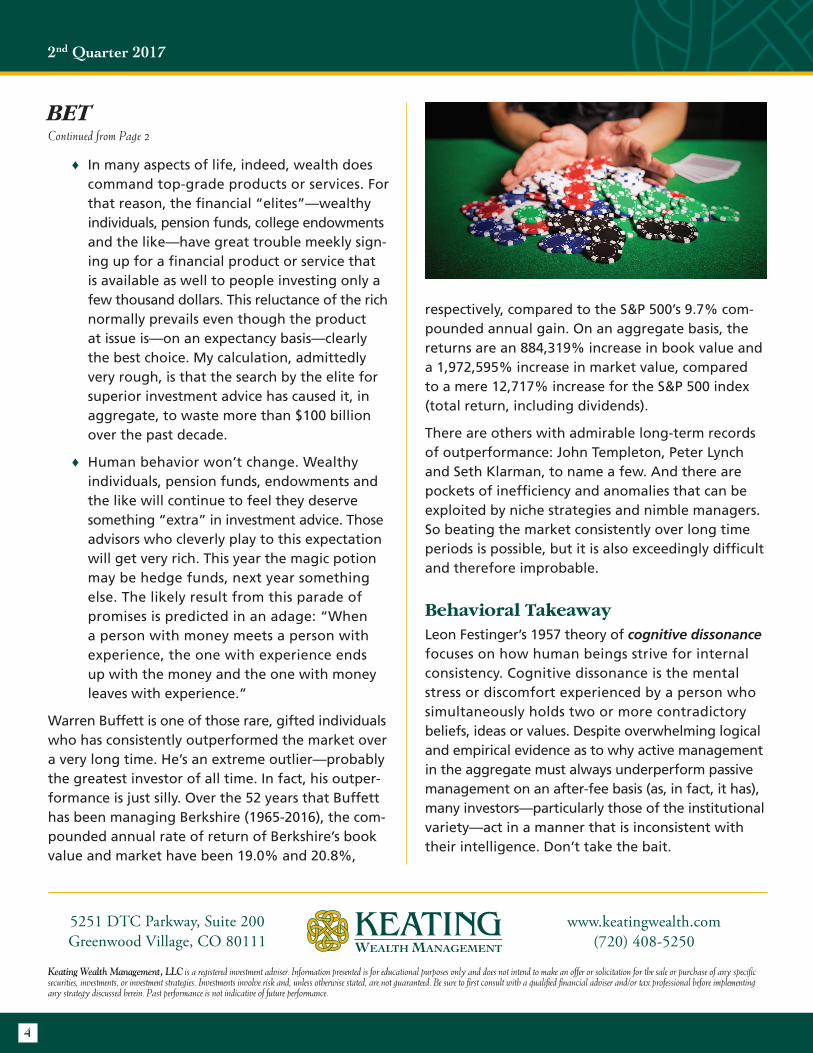
The “volatility equals risk”
movement was born in academia with the advent of modern portfolio theory. Out went the quaint notion of defining risk as the erosion or permanent loss of capital, and in came
the quantification of risk as “variance,” or fluctuations around a mean. It’s madness—just the latest financial fad that promises to achieve the unachievable: suppress volatility without also suppressing returns. Don’t buy it.
Because we think in decades, not days, our definition of risk is old-fashioned. We start with two core principles: (i) money is purchasing power, and
This is a highly condensed version of a blog published in January 2017. For the complete article, please visit the Blog section of our website: http://www.keatingwealth.com/blog/earnings-the-95-solution/
This is a highly condensed version of a blog published in February 2017. For the complete article, please visit the Blog section of our website: http://www.keatingwealth.com/blog/volatility-does-not-equal-risk/
♦ Based on this earnings estimate, the forward 12-month P/E ratio for the S&P 500 is 17.1x, above both the 5-year average of 14.8x (source: FactSet) and the 25-year average of 15.9x (source: J.P. Morgan).
(ii) the safety of an asset class is its ability to pre-serve purchasing power over time.
Thus, the relative safety or riskiness of a particular security or asset class can be measured by the re-duction or accretion of purchasing power over time, not by short-term fluctuations in price.
Over time, stock prices are inextricably linked to the earnings and dividends they generate for their owners, though not at all precisely. They fluctuate. And the stock market historically has advanced over time, though not in a straight line.
The volatile and asymmetric returns experienced over days (S&P 500 up 53% of the time) and weeks are smoother over the course of months (up 59% of the time) and years (up 67% of the time). Over the long term, volatility is more accurately defined as a measure of unpredictability rather than as a measure of risk.
♦ Over the last 25 years, the average yield of the 10-year Treasury has been 4.55%, compared to 2.45% on Jan. 31, 2017 (source: J.P. Morgan).
♦ Therefore, we conclude that with the interest rates used for discounting dividends sitting at just over half their 25-year average, the roughly one per-centage point premium between today’s forward earnings multiple and the 25-year average is fully justified, if not modest.
4
2nd Quarter 2017
5251 DTC Parkway, Suite 200Greenwood Village, CO 80111
www.keatingwealth.com (720) 408-5250
Keating Wealth Management, LLC is a registered investment adviser. Information presented is for educational purposes only and does not intend to make an offer or solicitation for the sale or purchase of any specific securities, investments, or investment strategies. Investments involve risk and, unless otherwise stated, are not guaranteed. Be sure to first consult with a qualified financial adviser and/or tax professional before implementing any strategy discussed herein. Past performance is not indicative of future performance.
♦ In many aspects of life, indeed, wealth does command top-grade products or services. For that reason, the financial “elites”—wealthy individuals, pension funds, college endowments and the like—have great trouble meekly sign-ing up for a financial product or service that is available as well to people investing only a few thousand dollars. This reluctance of the rich normally prevails even though the product at issue is—on an expectancy basis—clearly the best choice. My calculation, admittedly very rough, is that the search by the elite for superior investment advice has caused it, in aggregate, to waste more than $100 billion over the past decade.
♦ Human behavior won’t change. Wealthy individuals, pension funds, endowments and the like will continue to feel they deserve something “extra” in investment advice. Those advisors who cleverly play to this expectation will get very rich. This year the magic potion may be hedge funds, next year something else. The likely result from this parade of promises is predicted in an adage: “When a person with money meets a person with experience, the one with experience ends up with the money and the one with money leaves with experience.”
Warren Buffett is one of those rare, gifted individuals who has consistently outperformed the market over a very long time. He’s an extreme outlier—probably the greatest investor of all time. In fact, his outper-formance is just silly. Over the 52 years that Buffett has been managing Berkshire (1965-2016), the com-pounded annual rate of return of Berkshire’s book value and market have been 19.0% and 20.8%,
respectively, compared to the S&P 500’s 9.7% com-pounded annual gain. On an aggregate basis, the returns are an 884,319% increase in book value and a 1,972,595% increase in market value, compared to a mere 12,717% increase for the S&P 500 index (total return, including dividends).
There are others with admirable long-term records of outperformance: John Templeton, Peter Lynch and Seth Klarman, to name a few. And there are pockets of inefficiency and anomalies that can be exploited by niche strategies and nimble managers. So beating the market consistently over long time periods is possible, but it is also exceedingly difficult and therefore improbable.
Behavioral TakeawayLeon Festinger’s 1957 theory of cognitive dissonance focuses on how human beings strive for internal consistency. Cognitive dissonance is the mental stress or discomfort experienced by a person who simultaneously holds two or more contradictory beliefs, ideas or values. Despite overwhelming logical and empirical evidence as to why active management in the aggregate must always underperform passive management on an after-fee basis (as, in fact, it has), many investors—particularly those of the institutional variety—act in a manner that is inconsistent with their intelligence. Don’t take the bait.
BETContinued from Page 2