Embed Size (px)
Citation preview
NYS COMMON CORE MATHEMATICS CURRICULUM M4 Lesson 9
ALGEBRA I
𝑓(𝑥) = 𝑎(𝑥 − 𝑚)(𝑥 − 𝑛) Lesson 9: Graphing Quadratic Functions from Factored Form,
94
This work is derived from Eureka Math ™ and licensed by Great Minds. ©2015 Great Minds. eureka-math.org This file derived from ALG I-M4-TE-1.3.0-09.2015
This work is licensed under a Creative Commons Attribution-NonCommercial-ShareAlike 3.0 Unported License.
Lesson 9: Graphing Quadratic Functions from Factored
Form, 𝒇(𝒙) = 𝒂(𝒙 − 𝒎)(𝒙 − 𝒏)
Student Outcomes
Students use the factored form of a quadratic equation to construct a rough graph, use the graph of a
quadratic equation to construct a quadratic equation in factored form, and relate the solutions of a quadratic
equation in one variable to the zeros of the function it defines.
Students understand that the number of zeros in a polynomial function corresponds to the number of linear
factors of the related expression and that different functions may have the same zeros but different maxima or
minima.
Lesson Notes
Throughout this lesson, students apply mathematics to solve problems that arise in the physical world, specifically for
objects in motion. They identify the important quantities of the situation and map the relationships between those
quantities using graphs.
In this lesson, students relate the solutions of a quadratic equation in one variable to the zeros of the function it defines.
They sketch graphs of quadratic functions from tables, expressions, and verbal descriptions of relationships in real-world
contexts, identifying key features of the quadratic functions from their graphs (A-APR.B.3). Also central to the lesson is
F-IF.C.7a, requiring students to graph and show the intercepts and minimum or maximum point. If students do not have
time in class to complete Exercise 4, consider adding it to the problem set.
Classwork
Opening Exercise (3 minutes)
Have students complete the opening exercise individually. This review of solving a quadratic equation by factoring leads
into the concept development in Example 1.
Opening Exercise
Solve the following equation.
𝒙𝟐 + 𝟔𝒙 − 𝟒𝟎 = 𝟎
The factored form is (𝒙 + 𝟏𝟎)(𝒙 − 𝟒) = 𝟎, so 𝒙 = −𝟏𝟎 or 𝟒.
MP.4
Scaffolding:
Remind students of the
product-sum rule for factoring
quadratic expressions when
the leading coefficient is 1:
What two factors of the
constant term can be added to
give the coefficient of the
linear term?
Or remind them that they can
use the method of splitting the
linear term.
NYS COMMON CORE MATHEMATICS CURRICULUM M4 Lesson 9
ALGEBRA I
𝑓(𝑥) = 𝑎(𝑥 − 𝑚)(𝑥 − 𝑛) Lesson 9: Graphing Quadratic Functions from Factored Form,
95
This work is derived from Eureka Math ™ and licensed by Great Minds. ©2015 Great Minds. eureka-math.org This file derived from ALG I-M4-TE-1.3.0-09.2015
This work is licensed under a Creative Commons Attribution-NonCommercial-ShareAlike 3.0 Unported License.
Example 1 (7 minutes)
Display the equation 𝑦 = 𝑥2 + 6𝑥 − 40 on the board or screen. Make sure students have graph paper before the lesson
begins. Have students work with a partner or in small groups to answer the following questions based on the equation.
Example 1
Consider the equation 𝒚 = 𝒙𝟐 + 𝟔𝒙 − 𝟒𝟎.
a. Given this quadratic equation, can you find the point(s) where the graph crosses the 𝒙-axis?
(If students stall here, offer a hint. Ask: What is the 𝑦-value when the graph crosses the 𝑥-axis?)
The factors for 𝒙𝟐 + 𝟔𝒙 − 𝟒𝟎 are (𝒙 − 𝟒)(𝒙 + 𝟏𝟎), so the solutions for the equation with 𝒚 = 𝟎 are
𝒙 = 𝟒 or 𝒙 = −𝟏𝟎.
Give students about two minutes to work with a partner to find the solution. Students should have a head start in
figuring out how to proceed based on their results from Example 1. Have students record and label the two 𝑥-
intercepts. Point out that the ordered pairs are called the 𝑥-intercepts of the graph and that the 𝑥-values alone, when
the equation is equal to zero, are called the zeros or roots of the equation. Students should be able to generalize that for
any quadratic equation, the roots are the solution(s), where 𝑦 = 0, and these solutions correspond to the points where
the graph of the equation crosses the 𝑥-axis.
b. In the last lesson, we learned about the symmetrical nature of the graph of a quadratic function. How can we
use that information to find the vertex for the graph?
Since the 𝒙-value of the vertex is halfway between the two roots, we just need to find the midpoint of the two
roots’ 𝒙-values: 𝟒+(−𝟏𝟎)
𝟐= −𝟑. Once students know the 𝒙-value of the vertex (which also tells us the
equation for the axis of symmetry), they can substitute that value back into the equation: 𝒚 = (𝒙 − 𝟒)(𝒙 + 𝟏𝟎). Thus, 𝒚 = (−𝟑 − 𝟒)(−𝟑 + 𝟏𝟎) = (−𝟕)(𝟕) = −𝟒𝟗, and the vertex is (−𝟑, −𝟒𝟗).
c. How could we find the 𝒚-intercept (where the graph crosses the 𝒚-axis and where 𝒙 = 𝟎)?
If we set 𝒙 equal to 𝟎, we can find where the graph crosses the 𝒚-axis.
𝒚 = (𝒙 − 𝟒)(𝒙 + 𝟏𝟎) = (𝟎 − 𝟒)(𝟎 + 𝟏𝟎) = (−𝟒)(𝟏𝟎) = −𝟒𝟎
The 𝒚-intercept is (𝟎, −𝟒𝟎).
d. What else can we say about the graph based on our knowledge of the symmetrical nature of the graph of a
quadratic function? Can we determine the coordinates of any other points?
We know that the axis of symmetry is at 𝒙 = −𝟑 and that 𝟎 is 𝟑 units to the right of −𝟑. Because the graph
of a quadratic function is symmetrical, there exists another point with an 𝒙-coordinate 𝟑 units to the left of
−𝟑, which would be 𝒙 = −𝟔. The points with 𝒙-coordinates of 𝟎 and −𝟔 will have the same 𝒚-coordinate,
which is −𝟒𝟎. Therefore, another point on this graph would be (−𝟔, −𝟒𝟎).
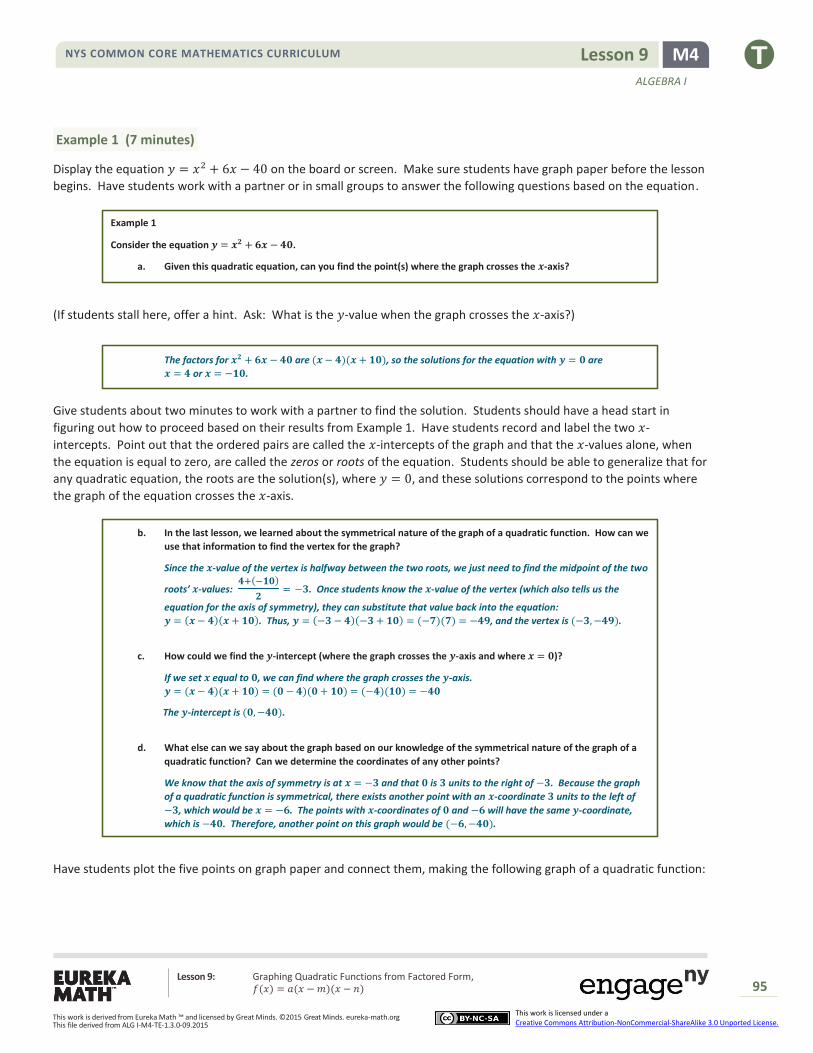
Have students plot the five points on graph paper and connect them, making the following graph of a quadratic function:
NYS COMMON CORE MATHEMATICS CURRICULUM M4 Lesson 9
ALGEBRA I
𝑓(𝑥) = 𝑎(𝑥 − 𝑚)(𝑥 − 𝑛) Lesson 9: Graphing Quadratic Functions from Factored Form,
96
This work is derived from Eureka Math ™ and licensed by Great Minds. ©2015 Great Minds. eureka-math.org This file derived from ALG I-M4-TE-1.3.0-09.2015
This work is licensed under a Creative Commons Attribution-NonCommercial-ShareAlike 3.0 Unported License.
e. Plot the points you know for this equation on graph paper, and connect them to show the graph of the
equation.
Exercise 1 (10 minutes)
Have students work with a partner or in small groups to graph the following quadratics. Discuss as a class what the key
features of a quadratic graph are.
Exercise 1
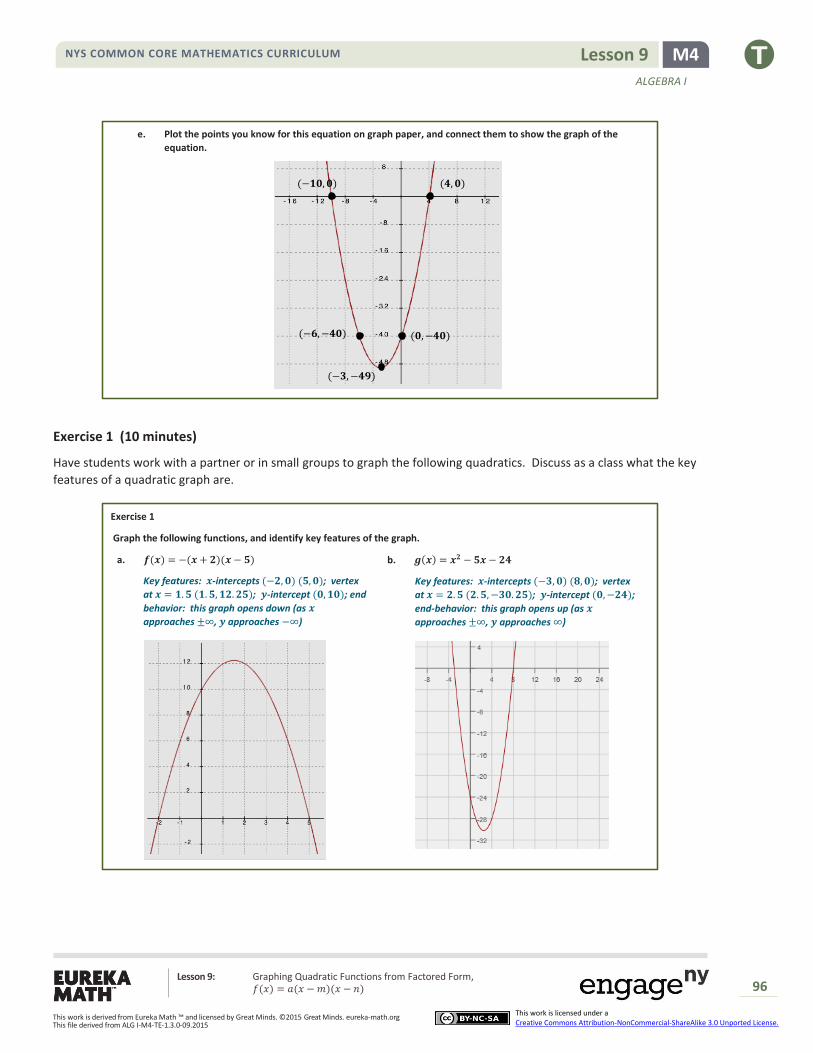
Graph the following functions, and identify key features of the graph.
a. 𝒇(𝒙) = −(𝒙 + 𝟐)(𝒙 − 𝟓)
Key features: 𝒙-intercepts (−𝟐, 𝟎) (𝟓, 𝟎); vertex
at 𝒙 = 𝟏. 𝟓 (𝟏. 𝟓, 𝟏𝟐. 𝟐𝟓); 𝒚-intercept (𝟎, 𝟏𝟎); end
behavior: this graph opens down (as 𝒙
approaches ±∞, 𝒚 approaches −∞)
b. 𝒈(𝒙) = 𝒙𝟐 − 𝟓𝒙 − 𝟐𝟒
Key features: 𝒙-intercepts (−𝟑, 𝟎) (𝟖, 𝟎); vertex
at 𝒙 = 𝟐. 𝟓 (𝟐. 𝟓, −𝟑𝟎. 𝟐𝟓); 𝒚-intercept (𝟎, −𝟐𝟒);
end-behavior: this graph opens up (as 𝒙
approaches ±∞, 𝒚 approaches ∞)
(𝟒,𝟎) (−𝟏𝟎,𝟎)
(−𝟑, −𝟒𝟗)
(𝟎, −𝟒𝟎) (−𝟔, −𝟒𝟎)
NYS COMMON CORE MATHEMATICS CURRICULUM M4 Lesson 9
ALGEBRA I
𝑓(𝑥) = 𝑎(𝑥 − 𝑚)(𝑥 − 𝑛) Lesson 9: Graphing Quadratic Functions from Factored Form,
97
This work is derived from Eureka Math ™ and licensed by Great Minds. ©2015 Great Minds. eureka-math.org This file derived from ALG I-M4-TE-1.3.0-09.2015
This work is licensed under a Creative Commons Attribution-NonCommercial-ShareAlike 3.0 Unported License.
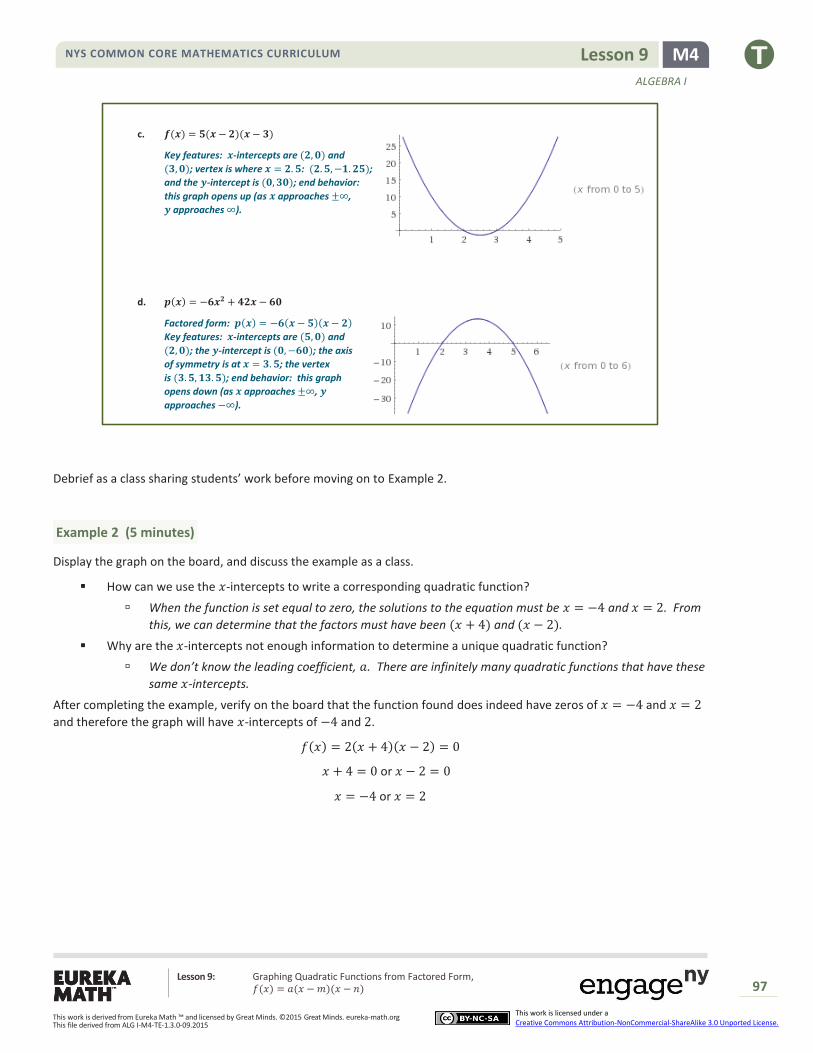
c. 𝒇(𝒙) = 𝟓(𝒙 − 𝟐)(𝒙 − 𝟑)
Key features: 𝒙-intercepts are (𝟐, 𝟎) and
(𝟑, 𝟎); vertex is where 𝒙 = 𝟐. 𝟓: (𝟐. 𝟓, −𝟏. 𝟐𝟓);
and the 𝒚-intercept is (𝟎, 𝟑𝟎); end behavior:
this graph opens up (as 𝒙 approaches ±∞,
𝒚 approaches ∞).
d. 𝒑(𝒙) = −𝟔𝒙𝟐 + 𝟒𝟐𝒙 − 𝟔𝟎
Factored form: 𝒑(𝒙) = −𝟔(𝒙 − 𝟓)(𝒙 − 𝟐)
Key features: 𝒙-intercepts are (𝟓, 𝟎) and
(𝟐, 𝟎); the 𝒚-intercept is (𝟎, −𝟔𝟎); the axis
of symmetry is at 𝒙 = 𝟑. 𝟓; the vertex
is (𝟑. 𝟓, 𝟏𝟑. 𝟓); end behavior: this graph
opens down (as 𝒙 approaches ±∞, 𝒚
approaches −∞).
Debrief as a class sharing students’ work before moving on to Example 2.
Example 2 (5 minutes)
Display the graph on the board, and discuss the example as a class.
How can we use the 𝑥-intercepts to write a corresponding quadratic function?
When the function is set equal to zero, the solutions to the equation must be 𝑥 = −4 and 𝑥 = 2. From
this, we can determine that the factors must have been (𝑥 + 4) and (𝑥 − 2).
Why are the 𝑥-intercepts not enough information to determine a unique quadratic function?
We don’t know the leading coefficient, 𝑎. There are infinitely many quadratic functions that have these
same 𝑥-intercepts.
After completing the example, verify on the board that the function found does indeed have zeros of 𝑥 = −4 and 𝑥 = 2
and therefore the graph will have 𝑥-intercepts of −4 and 2.
𝑓(𝑥) = 2(𝑥 + 4)(𝑥 − 2) = 0
𝑥 + 4 = 0 or 𝑥 − 2 = 0
𝑥 = −4 or 𝑥 = 2
NYS COMMON CORE MATHEMATICS CURRICULUM M4 Lesson 9
ALGEBRA I
𝑓(𝑥) = 𝑎(𝑥 − 𝑚)(𝑥 − 𝑛) Lesson 9: Graphing Quadratic Functions from Factored Form,
98
This work is derived from Eureka Math ™ and licensed by Great Minds. ©2015 Great Minds. eureka-math.org This file derived from ALG I-M4-TE-1.3.0-09.2015
This work is licensed under a Creative Commons Attribution-NonCommercial-ShareAlike 3.0 Unported License.
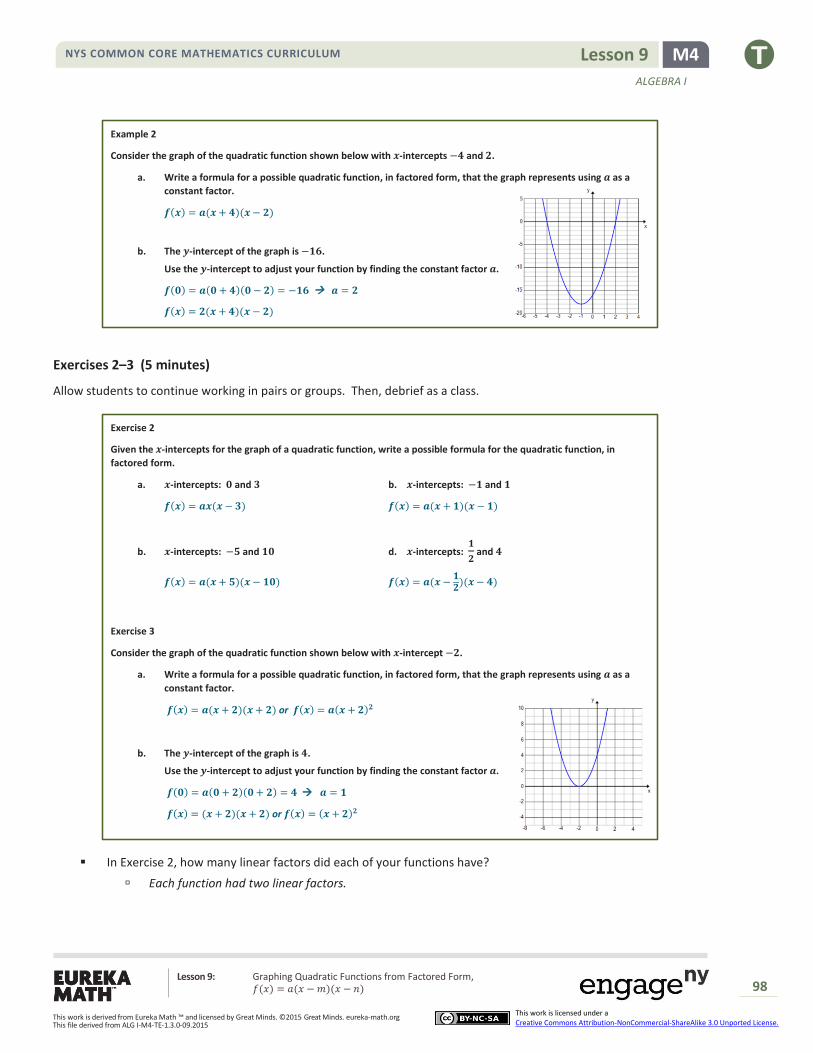
Example 2
Consider the graph of the quadratic function shown below with 𝒙-intercepts −𝟒 and 𝟐.
a. Write a formula for a possible quadratic function, in factored form, that the graph represents using 𝒂 as a
constant factor.
𝒇(𝒙) = 𝒂(𝒙 + 𝟒)(𝒙 − 𝟐)
b. The 𝒚-intercept of the graph is −𝟏𝟔.
Use the 𝒚-intercept to adjust your function by finding the constant factor 𝒂.
𝒇(𝟎) = 𝒂(𝟎 + 𝟒)(𝟎 − 𝟐) = −𝟏𝟔 𝒂 = 𝟐
𝒇(𝒙) = 𝟐(𝒙 + 𝟒)(𝒙 − 𝟐)
Exercises 2–3 (5 minutes)
Allow students to continue working in pairs or groups. Then, debrief as a class.
Exercise 2
Given the 𝒙-intercepts for the graph of a quadratic function, write a possible formula for the quadratic function, in
factored form.
a. 𝒙-intercepts: 𝟎 and 𝟑 b. 𝒙-intercepts: −𝟏 and 𝟏
𝒇(𝒙) = 𝒂𝒙(𝒙 − 𝟑) 𝒇(𝒙) = 𝒂(𝒙 + 𝟏)(𝒙 − 𝟏)
b. 𝒙-intercepts: −𝟓 and 𝟏𝟎 d. 𝒙-intercepts: 𝟏
𝟐 and 𝟒
𝒇(𝒙) = 𝒂(𝒙 + 𝟓)(𝒙 − 𝟏𝟎) 𝒇(𝒙) = 𝒂(𝒙 −𝟏𝟐
)(𝒙 − 𝟒)
Exercise 3
Consider the graph of the quadratic function shown below with 𝒙-intercept −𝟐.
a. Write a formula for a possible quadratic function, in factored form, that the graph represents using 𝒂 as a
constant factor.
𝒇(𝒙) = 𝒂(𝒙 + 𝟐)(𝒙 + 𝟐) or 𝒇(𝒙) = 𝒂(𝒙 + 𝟐)𝟐
b. The 𝒚-intercept of the graph is 𝟒.
Use the 𝒚-intercept to adjust your function by finding the constant factor 𝒂.
𝒇(𝟎) = 𝒂(𝟎 + 𝟐)(𝟎 + 𝟐) = 𝟒 𝒂 = 𝟏
𝒇(𝒙) = (𝒙 + 𝟐)(𝒙 + 𝟐) or 𝒇(𝒙) = (𝒙 + 𝟐)𝟐
In Exercise 2, how many linear factors did each of your functions have?
Each function had two linear factors.
NYS COMMON CORE MATHEMATICS CURRICULUM M4 Lesson 9
ALGEBRA I
𝑓(𝑥) = 𝑎(𝑥 − 𝑚)(𝑥 − 𝑛) Lesson 9: Graphing Quadratic Functions from Factored Form,
99
This work is derived from Eureka Math ™ and licensed by Great Minds. ©2015 Great Minds. eureka-math.org This file derived from ALG I-M4-TE-1.3.0-09.2015
This work is licensed under a Creative Commons Attribution-NonCommercial-ShareAlike 3.0 Unported License.
Why do you think that is?
These are quadratic functions. When written in standard form, the degree (or highest exponent) of all
of the functions will be 2.
In Exercise 3, why were the two linear factors the same?
There was only one 𝑥-intercept, so both factors needed to give the same solution of 𝑥 = −2. There
couldn’t be a different linear factor, or the graph would have a second 𝑥-intercept. There couldn’t be a
single factor of (𝑥 + 2) or the graph would be linear.
In the example below, students must make sense of the quantities presented in the problem. They are given the
problem in its context and must decontextualize to solve the problem and then recontextualize to interpret their
solution.
Example 3 (5 minutes)
Present the following problem, and use the questions that follow to guide discussion to a path to the solutions. Students
may use their graphing calculators to see the graph. However, some class time may be needed to provide instruction in
using the graphing calculator effectively.
Example 3
A science class designed a ball launcher and tested it by shooting a tennis ball straight up from the top of a 𝟏𝟓-story
building. They determined that the motion of the ball could be described by the function:
𝒉(𝒕) = −𝟏𝟔𝒕𝟐 + 𝟏𝟒𝟒𝒕 + 𝟏𝟔𝟎,
where 𝒕 represents the time the ball is in the air in seconds and 𝒉(𝒕) represents the height, in feet, of the ball above the
ground at time 𝒕. What is the maximum height of the ball? At what time will the ball hit the ground?
a. With a graph, we can see the number of seconds it takes for the ball to reach its peak and how long it takes to
hit the ground. How can factoring the expression help us graph this function?
Change the expression to factored form. First, factor out the −𝟏𝟔 (𝑮𝑪𝑭): −𝟏𝟔(𝒕𝟐 − 𝟗𝒕 − 𝟏𝟎). Then, we can
see that the quadratic expression remaining is factorable: −𝟏𝟔(𝒕 + 𝟏)(𝒕 − 𝟏𝟎).
b. Once we have the function in its factored form, what do we need to know in order to graph it? Now graph
the function.
We can find the 𝒕-intercepts, 𝒚-intercept, axis of symmetry, and the vertex and then sketch the graph of the
function. 𝒕-intercepts are (𝟏𝟎, 𝟎) and (−𝟏, 𝟎); 𝒚-intercept is (𝟎, 𝟏𝟔𝟎); the axis of symmetry is 𝒕 = 𝟒. 𝟓; and
the vertex is (𝟒. 𝟓, 𝟒𝟖𝟒). (We find the 𝒚-coordinate of the vertex by substituting 𝟒. 𝟓 into either form of the
equation.)
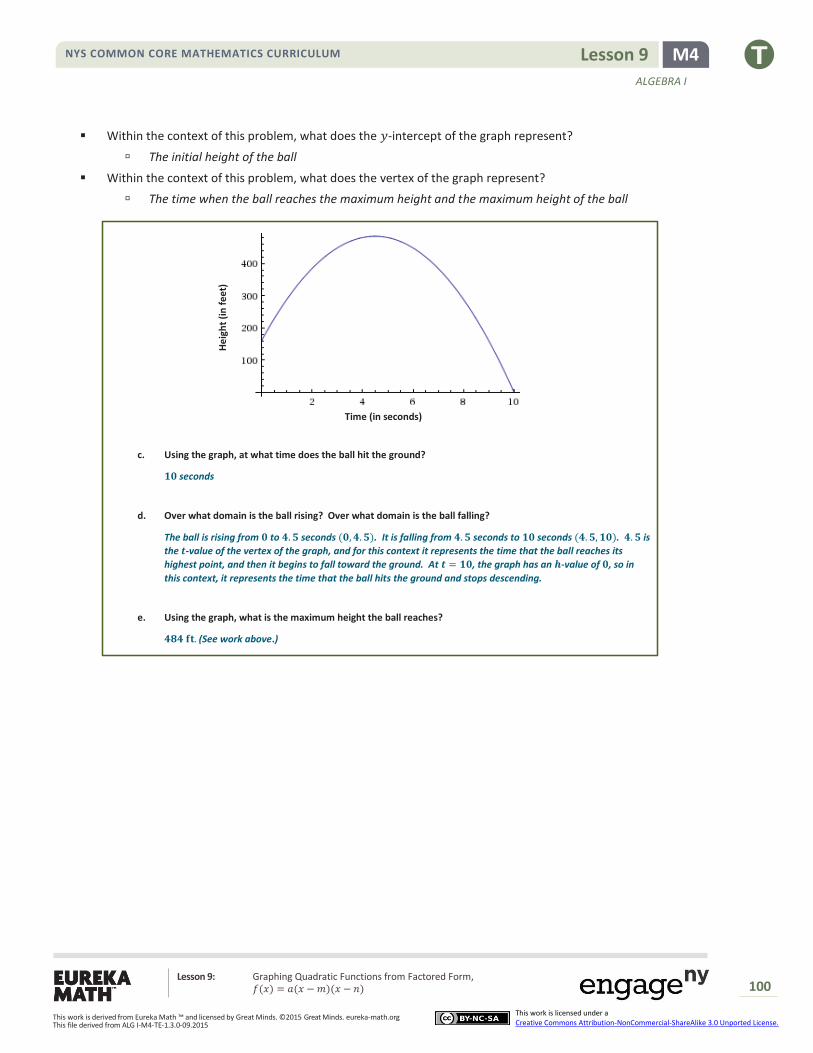
Students determine the key features and graph the function, and the teacher puts the following graph on the board.
Why is the domain of this function [0, 10]?
Because negative time values do not make sense and neither do time values after the ball hits the
ground
Why is the leading coefficient always negative for functions representing falling objects?
Functions with negative leading coefficients have maximums, while functions with positive leading
coefficients have minimums. A launched object rises and then falls and, therefore, has a maximum.
MP.2
NYS COMMON CORE MATHEMATICS CURRICULUM M4 Lesson 9
ALGEBRA I
𝑓(𝑥) = 𝑎(𝑥 − 𝑚)(𝑥 − 𝑛) Lesson 9: Graphing Quadratic Functions from Factored Form,
100
This work is derived from Eureka Math ™ and licensed by Great Minds. ©2015 Great Minds. eureka-math.org This file derived from ALG I-M4-TE-1.3.0-09.2015
This work is licensed under a Creative Commons Attribution-NonCommercial-ShareAlike 3.0 Unported License.
Within the context of this problem, what does the 𝑦-intercept of the graph represent?
The initial height of the ball
Within the context of this problem, what does the vertex of the graph represent?
The time when the ball reaches the maximum height and the maximum height of the ball
c. Using the graph, at what time does the ball hit the ground?
𝟏𝟎 seconds
d. Over what domain is the ball rising? Over what domain is the ball falling?
The ball is rising from 𝟎 to 𝟒. 𝟓 seconds (𝟎, 𝟒. 𝟓). It is falling from 𝟒. 𝟓 seconds to 𝟏𝟎 seconds (𝟒. 𝟓, 𝟏𝟎). 𝟒. 𝟓 is
the 𝒕-value of the vertex of the graph, and for this context it represents the time that the ball reaches its
highest point, and then it begins to fall toward the ground. At 𝒕 = 𝟏𝟎, the graph has an 𝒉-value of 𝟎, so in
this context, it represents the time that the ball hits the ground and stops descending.
e. Using the graph, what is the maximum height the ball reaches?
𝟒𝟖𝟒 𝐟𝐭. (See work above.)
Time (in seconds)
He
igh
t (i
n f
ee
t)
NYS COMMON CORE MATHEMATICS CURRICULUM M4 Lesson 9
ALGEBRA I
𝑓(𝑥) = 𝑎(𝑥 − 𝑚)(𝑥 − 𝑛) Lesson 9: Graphing Quadratic Functions from Factored Form,
101
This work is derived from Eureka Math ™ and licensed by Great Minds. ©2015 Great Minds. eureka-math.org This file derived from ALG I-M4-TE-1.3.0-09.2015
This work is licensed under a Creative Commons Attribution-NonCommercial-ShareAlike 3.0 Unported License.
Exercise 4 (5 minutes)
Have students work with a partner or in small groups. If available, they could use technology to confirm their answers.
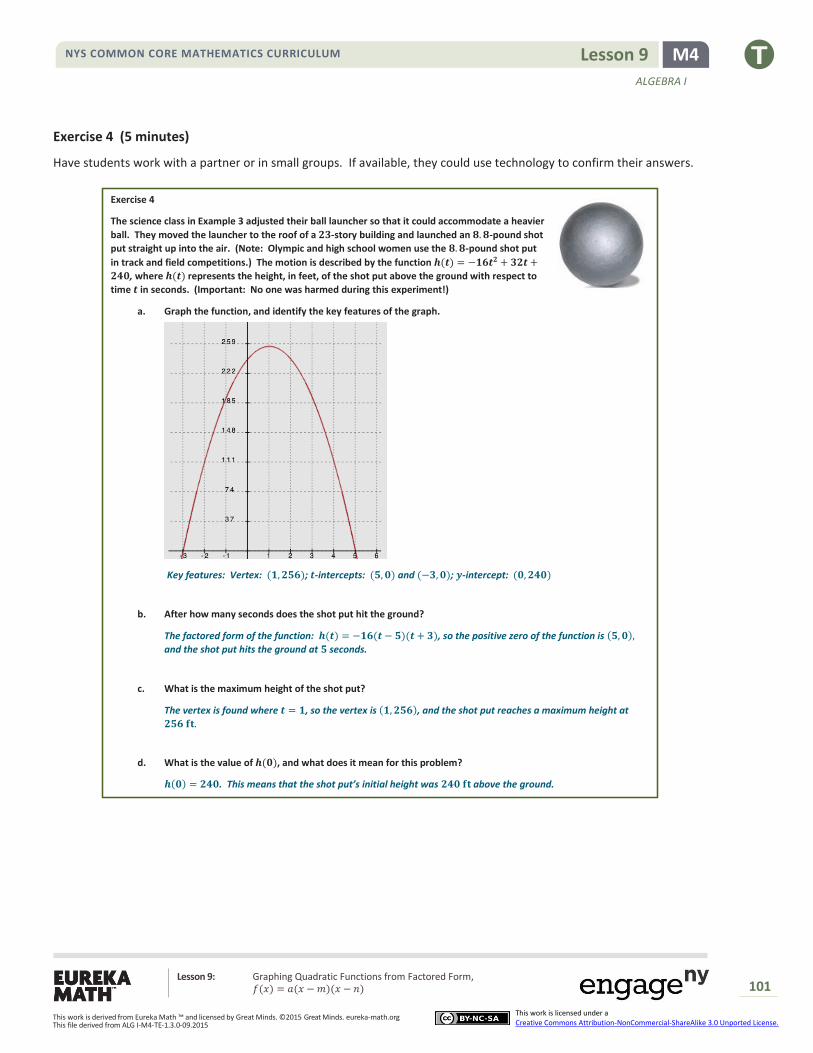
Exercise 4
The science class in Example 3 adjusted their ball launcher so that it could accommodate a heavier
ball. They moved the launcher to the roof of a 𝟐𝟑-story building and launched an 𝟖. 𝟖-pound shot
put straight up into the air. (Note: Olympic and high school women use the 𝟖. 𝟖-pound shot put
in track and field competitions.) The motion is described by the function 𝒉(𝒕) = −𝟏𝟔𝒕𝟐 + 𝟑𝟐𝒕 +
𝟐𝟒𝟎, where 𝒉(𝒕) represents the height, in feet, of the shot put above the ground with respect to
time 𝒕 in seconds. (Important: No one was harmed during this experiment!)
a. Graph the function, and identify the key features of the graph.
Key features: Vertex: (𝟏, 𝟐𝟓𝟔); 𝒕-intercepts: (𝟓, 𝟎) and (−𝟑, 𝟎); 𝒚-intercept: (𝟎, 𝟐𝟒𝟎)
b. After how many seconds does the shot put hit the ground?
The factored form of the function: 𝒉(𝒕) = −𝟏𝟔(𝒕 − 𝟓)(𝒕 + 𝟑), so the positive zero of the function is (𝟓, 𝟎),
and the shot put hits the ground at 𝟓 seconds.
c. What is the maximum height of the shot put?
The vertex is found where 𝒕 = 𝟏, so the vertex is (𝟏, 𝟐𝟓𝟔), and the shot put reaches a maximum height at
𝟐𝟓𝟔 𝐟𝐭.
d. What is the value of 𝒉(𝟎), and what does it mean for this problem?
𝒉(𝟎) = 𝟐𝟒𝟎. This means that the shot put’s initial height was 𝟐𝟒𝟎 𝐟𝐭 above the ground.
NYS COMMON CORE MATHEMATICS CURRICULUM M4 Lesson 9
ALGEBRA I
𝑓(𝑥) = 𝑎(𝑥 − 𝑚)(𝑥 − 𝑛) Lesson 9: Graphing Quadratic Functions from Factored Form,
102
This work is derived from Eureka Math ™ and licensed by Great Minds. ©2015 Great Minds. eureka-math.org This file derived from ALG I-M4-TE-1.3.0-09.2015
This work is licensed under a Creative Commons Attribution-NonCommercial-ShareAlike 3.0 Unported License.
Closing (2 minute)
Have students write responses to these questions or share responses with a partner before sharing as a class.
When graphing a quadratic function, why might it be convenient to write the function in factored form?
When the quadratic is in factored form, the 𝑥-intercepts of the graph can be easily found. Then, the
axis of symmetry can be found by averaging the 𝑥-intercepts.
If given the 𝑥-intercepts of the graph of a quadratic, can you write the equation of the corresponding function?
Given the 𝑥-intercepts, you can only write a general formula for the quadratic function. If the
𝑥-intercepts are 𝑚 and 𝑛, the formula for the function would be 𝑓(𝑥) = 𝑎(𝑥 − 𝑚)(𝑥 − 𝑛). You would
need to know another point on the graph in order to find the leading coefficient, 𝑎.
Exit Ticket (3 minutes)
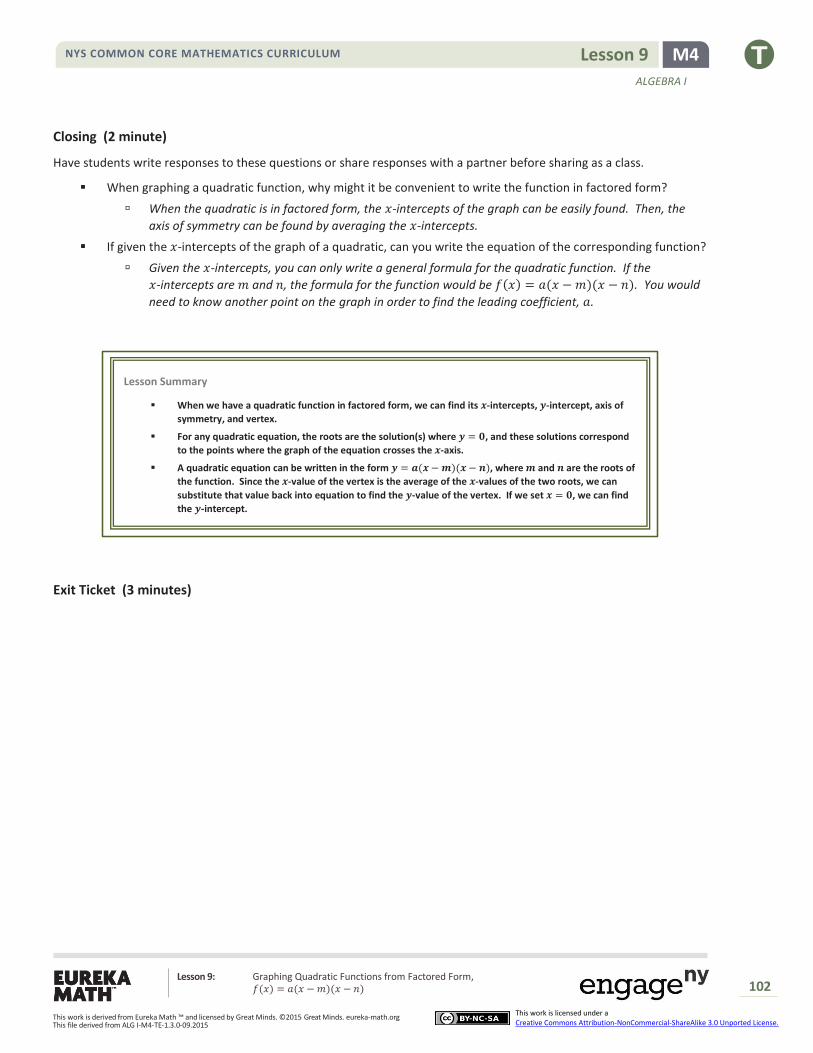
Lesson Summary
When we have a quadratic function in factored form, we can find its 𝒙-intercepts, 𝒚-intercept, axis of
symmetry, and vertex.
For any quadratic equation, the roots are the solution(s) where 𝒚 = 𝟎, and these solutions correspond
to the points where the graph of the equation crosses the 𝒙-axis.
A quadratic equation can be written in the form 𝒚 = 𝒂(𝒙 − 𝒎)(𝒙 − 𝒏), where 𝒎 and 𝒏 are the roots of
the function. Since the 𝒙-value of the vertex is the average of the 𝒙-values of the two roots, we can
substitute that value back into equation to find the 𝒚-value of the vertex. If we set 𝒙 = 𝟎, we can find
the 𝒚-intercept.
NYS COMMON CORE MATHEMATICS CURRICULUM M4 Lesson 9
ALGEBRA I
𝑓(𝑥) = 𝑎(𝑥 − 𝑚)(𝑥 − 𝑛) Lesson 9: Graphing Quadratic Functions from Factored Form,
103
This work is derived from Eureka Math ™ and licensed by Great Minds. ©2015 Great Minds. eureka-math.org This file derived from ALG I-M4-TE-1.3.0-09.2015
This work is licensed under a Creative Commons Attribution-NonCommercial-ShareAlike 3.0 Unported License.
Name Date
Lesson 9: Graphing Quadratic Functions from Factored Form,
𝒇(𝒙) = 𝒂(𝒙 − 𝒎)(𝒙 − 𝒏)
Exit Ticket
Graph the following function, and identify the key features of the graph: 𝑡(𝑥) = 𝑥2 + 8𝑥 − 20.
NYS COMMON CORE MATHEMATICS CURRICULUM M4 Lesson 9
ALGEBRA I
𝑓(𝑥) = 𝑎(𝑥 − 𝑚)(𝑥 − 𝑛) Lesson 9: Graphing Quadratic Functions from Factored Form,
104
This work is derived from Eureka Math ™ and licensed by Great Minds. ©2015 Great Minds. eureka-math.org This file derived from ALG I-M4-TE-1.3.0-09.2015
This work is licensed under a Creative Commons Attribution-NonCommercial-ShareAlike 3.0 Unported License.
Exit Ticket Sample Solutions
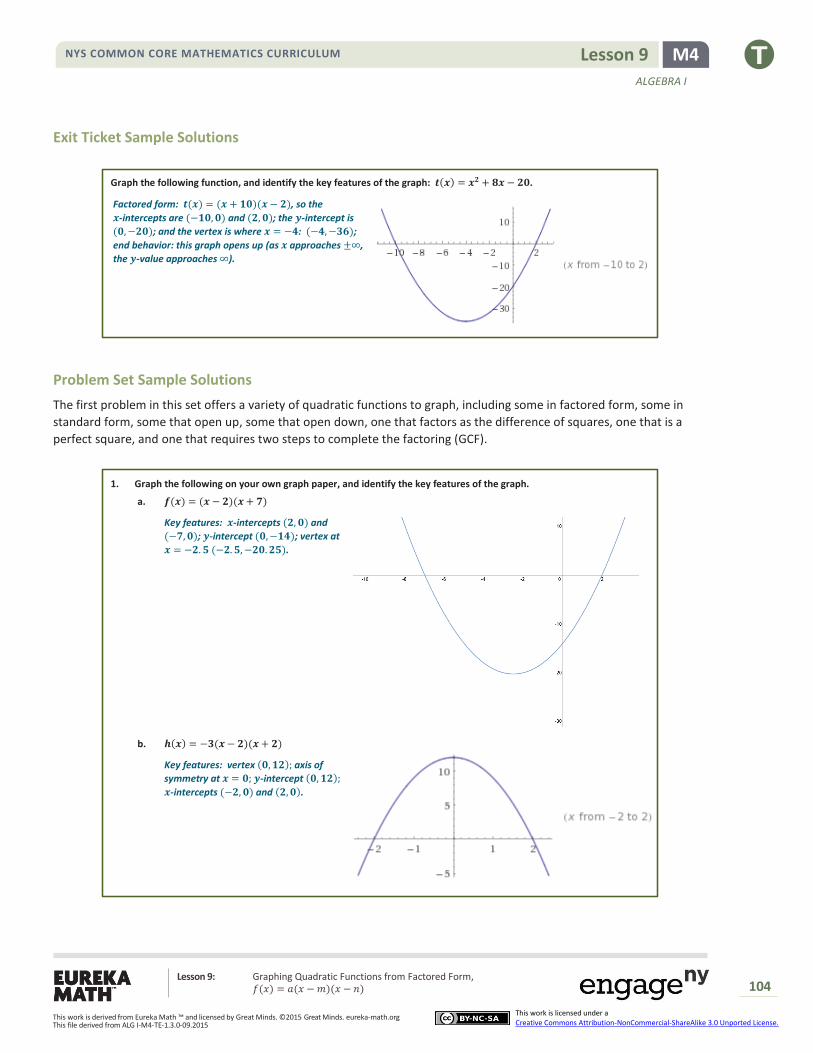
Graph the following function, and identify the key features of the graph: 𝒕(𝒙) = 𝒙𝟐 + 𝟖𝒙 − 𝟐𝟎.
Factored form: 𝒕(𝒙) = (𝒙 + 𝟏𝟎)(𝒙 − 𝟐), so the
𝒙-intercepts are (−𝟏𝟎, 𝟎) and (𝟐, 𝟎); the 𝒚-intercept is
(𝟎, −𝟐𝟎); and the vertex is where 𝒙 = −𝟒: (−𝟒, −𝟑𝟔);
end behavior: this graph opens up (as 𝒙 approaches ±∞,
the 𝒚-value approaches ∞).
Problem Set Sample Solutions
The first problem in this set offers a variety of quadratic functions to graph, including some in factored form, some in
standard form, some that open up, some that open down, one that factors as the difference of squares, one that is a
perfect square, and one that requires two steps to complete the factoring (GCF).
1. Graph the following on your own graph paper, and identify the key features of the graph.
a. 𝒇(𝒙) = (𝒙 − 𝟐)(𝒙 + 𝟕)
Key features: 𝒙-intercepts (𝟐, 𝟎) and
(−𝟕, 𝟎); 𝒚-intercept (𝟎, −𝟏𝟒); vertex at
𝒙 = −𝟐. 𝟓 (−𝟐. 𝟓, −𝟐𝟎. 𝟐𝟓).
b. 𝒉(𝒙) = −𝟑(𝒙 − 𝟐)(𝒙 + 𝟐)
Key features: vertex (𝟎, 𝟏𝟐); axis of
symmetry at 𝒙 = 𝟎; 𝒚-intercept (𝟎, 𝟏𝟐);
𝒙-intercepts (−𝟐, 𝟎) and (𝟐, 𝟎).
NYS COMMON CORE MATHEMATICS CURRICULUM M4 Lesson 9
ALGEBRA I
𝑓(𝑥) = 𝑎(𝑥 − 𝑚)(𝑥 − 𝑛) Lesson 9: Graphing Quadratic Functions from Factored Form,
105
This work is derived from Eureka Math ™ and licensed by Great Minds. ©2015 Great Minds. eureka-math.org This file derived from ALG I-M4-TE-1.3.0-09.2015
This work is licensed under a Creative Commons Attribution-NonCommercial-ShareAlike 3.0 Unported License.
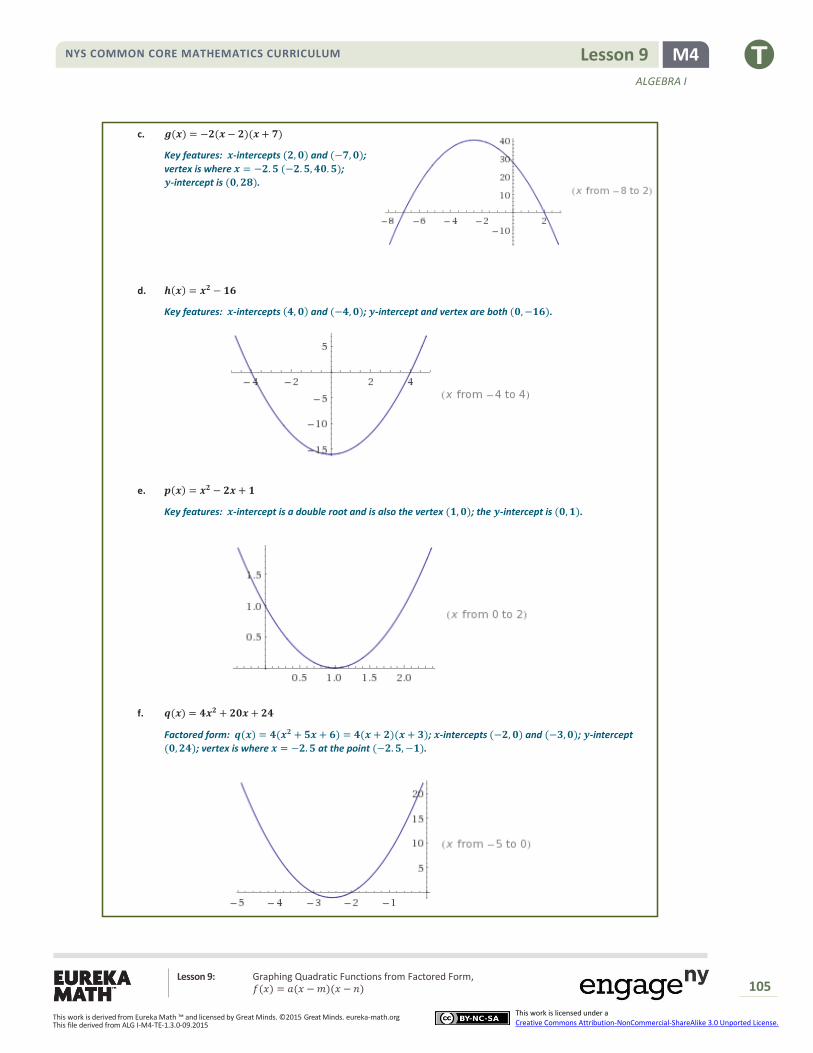
c. 𝒈(𝒙) = −𝟐(𝒙 − 𝟐)(𝒙 + 𝟕)
Key features: 𝒙-intercepts (𝟐, 𝟎) and (−𝟕, 𝟎);
vertex is where 𝒙 = −𝟐. 𝟓 (−𝟐. 𝟓, 𝟒𝟎. 𝟓);
𝒚-intercept is (𝟎, 𝟐𝟖).
d. 𝒉(𝒙) = 𝒙𝟐 − 𝟏𝟔
Key features: 𝒙-intercepts (𝟒, 𝟎) and (−𝟒, 𝟎); 𝒚-intercept and vertex are both (𝟎, −𝟏𝟔).
e. 𝒑(𝒙) = 𝒙𝟐 − 𝟐𝒙 + 𝟏
Key features: 𝒙-intercept is a double root and is also the vertex (𝟏, 𝟎); the 𝒚-intercept is (𝟎, 𝟏).
f. 𝒒(𝒙) = 𝟒𝒙𝟐 + 𝟐𝟎𝒙 + 𝟐𝟒
Factored form: 𝒒(𝒙) = 𝟒(𝒙𝟐 + 𝟓𝒙 + 𝟔) = 𝟒(𝒙 + 𝟐)(𝒙 + 𝟑); 𝒙-intercepts (−𝟐, 𝟎) and (−𝟑, 𝟎); 𝒚-intercept
(𝟎, 𝟐𝟒); vertex is where 𝒙 = −𝟐. 𝟓 at the point (−𝟐. 𝟓, −𝟏).
NYS COMMON CORE MATHEMATICS CURRICULUM M4 Lesson 9
ALGEBRA I
𝑓(𝑥) = 𝑎(𝑥 − 𝑚)(𝑥 − 𝑛) Lesson 9: Graphing Quadratic Functions from Factored Form,
106
This work is derived from Eureka Math ™ and licensed by Great Minds. ©2015 Great Minds. eureka-math.org This file derived from ALG I-M4-TE-1.3.0-09.2015
This work is licensed under a Creative Commons Attribution-NonCommercial-ShareAlike 3.0 Unported License.
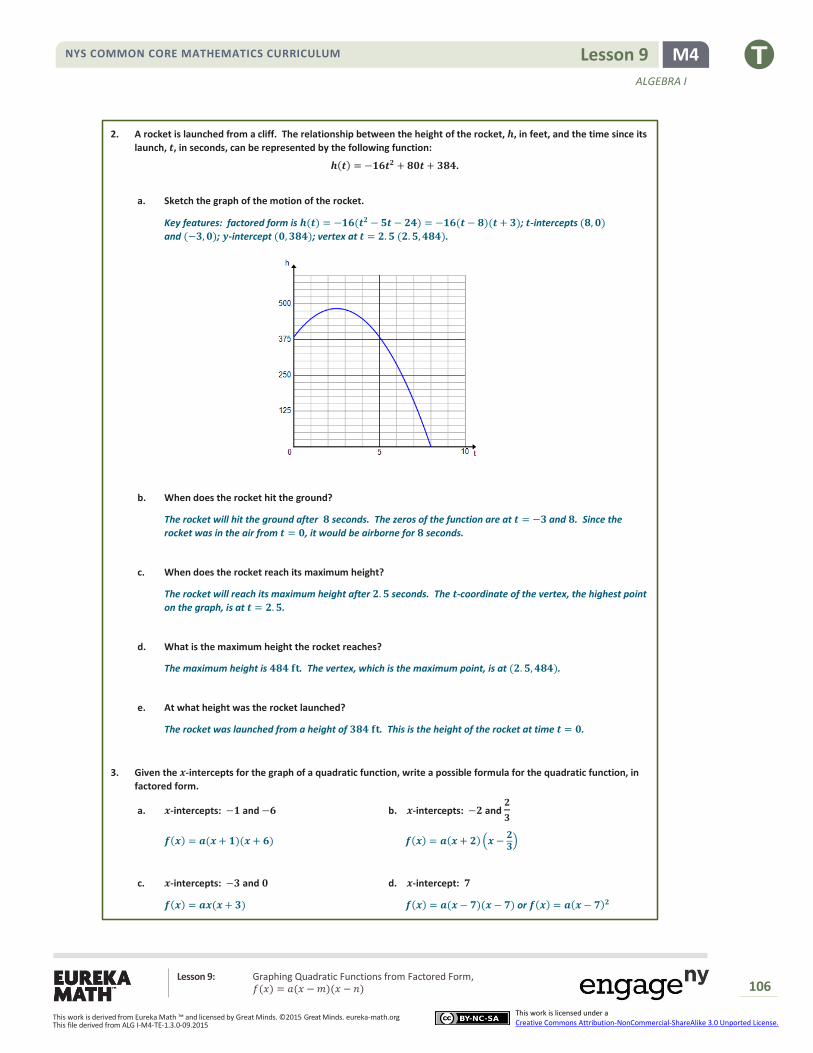
2. A rocket is launched from a cliff. The relationship between the height of the rocket, 𝒉, in feet, and the time since its
launch, 𝒕, in seconds, can be represented by the following function:
𝒉(𝒕) = −𝟏𝟔𝒕𝟐 + 𝟖𝟎𝒕 + 𝟑𝟖𝟒.
a. Sketch the graph of the motion of the rocket.
Key features: factored form is 𝒉(𝒕) = −𝟏𝟔(𝒕𝟐 − 𝟓𝒕 − 𝟐𝟒) = −𝟏𝟔(𝒕 − 𝟖)(𝒕 + 𝟑); 𝒕-intercepts (𝟖, 𝟎)
and (−𝟑, 𝟎); 𝒚-intercept (𝟎, 𝟑𝟖𝟒); vertex at 𝒕 = 𝟐. 𝟓 (𝟐. 𝟓, 𝟒𝟖𝟒).
b. When does the rocket hit the ground?
The rocket will hit the ground after 𝟖 seconds. The zeros of the function are at 𝒕 = −𝟑 and 𝟖. Since the
rocket was in the air from 𝒕 = 𝟎, it would be airborne for 𝟖 seconds.
c. When does the rocket reach its maximum height?
The rocket will reach its maximum height after 𝟐. 𝟓 seconds. The 𝒕-coordinate of the vertex, the highest point
on the graph, is at 𝒕 = 𝟐. 𝟓.
d. What is the maximum height the rocket reaches?
The maximum height is 𝟒𝟖𝟒 𝐟𝐭. The vertex, which is the maximum point, is at (𝟐. 𝟓, 𝟒𝟖𝟒).
e. At what height was the rocket launched?
The rocket was launched from a height of 𝟑𝟖𝟒 𝐟𝐭. This is the height of the rocket at time 𝒕 = 𝟎.
3. Given the 𝒙-intercepts for the graph of a quadratic function, write a possible formula for the quadratic function, in
factored form.
a. 𝒙-intercepts: −𝟏 and −𝟔 b. 𝒙-intercepts: −𝟐 and 𝟐
𝟑
𝒇(𝒙) = 𝒂(𝒙 + 𝟏)(𝒙 + 𝟔) 𝒇(𝒙) = 𝒂(𝒙 + 𝟐) (𝒙 −𝟐𝟑
)
c. 𝒙-intercepts: −𝟑 and 𝟎 d. 𝒙-intercept: 𝟕
𝒇(𝒙) = 𝒂𝒙(𝒙 + 𝟑) 𝒇(𝒙) = 𝒂(𝒙 − 𝟕)(𝒙 − 𝟕) or 𝒇(𝒙) = 𝒂(𝒙 − 𝟕)𝟐
NYS COMMON CORE MATHEMATICS CURRICULUM M4 Lesson 9
ALGEBRA I
𝑓(𝑥) = 𝑎(𝑥 − 𝑚)(𝑥 − 𝑛) Lesson 9: Graphing Quadratic Functions from Factored Form,
107
This work is derived from Eureka Math ™ and licensed by Great Minds. ©2015 Great Minds. eureka-math.org This file derived from ALG I-M4-TE-1.3.0-09.2015
This work is licensed under a Creative Commons Attribution-NonCommercial-ShareAlike 3.0 Unported License.
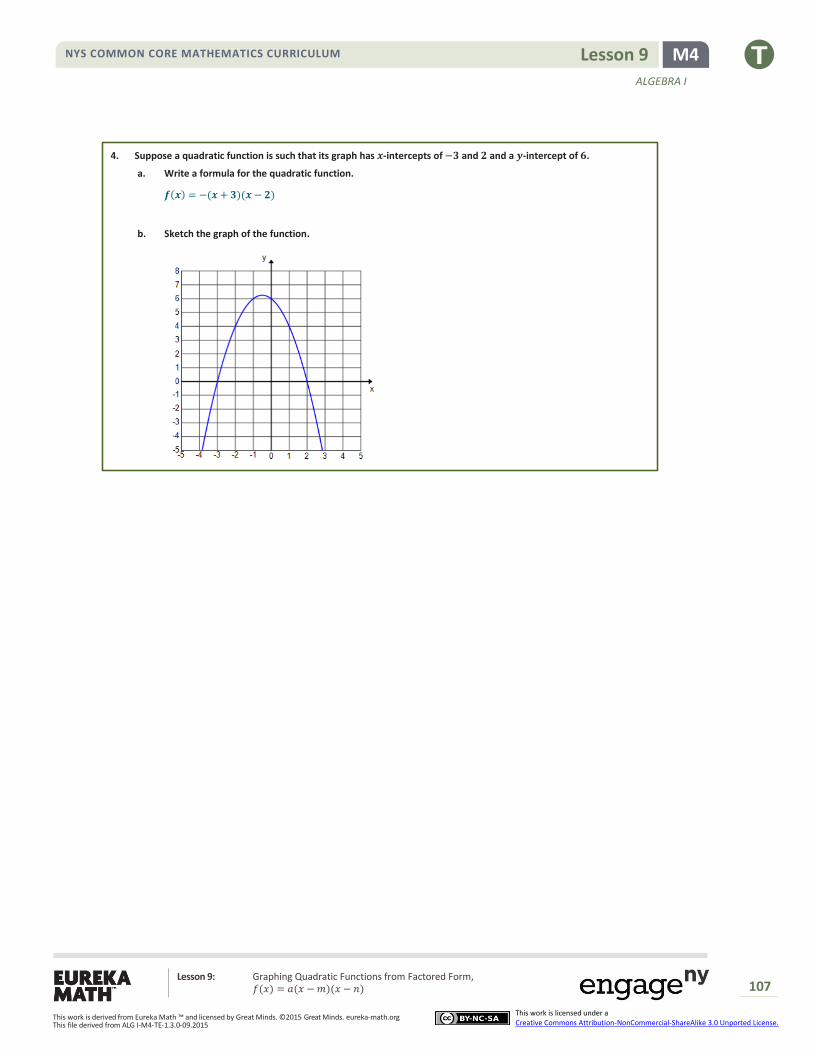
4. Suppose a quadratic function is such that its graph has 𝒙-intercepts of −𝟑 and 𝟐 and a 𝒚-intercept of 𝟔.
a. Write a formula for the quadratic function.
𝒇(𝒙) = −(𝒙 + 𝟑)(𝒙 − 𝟐)
b. Sketch the graph of the function.