Embed Size (px)
Citation preview

i
Lehigh Valley
Employment Forecast …
2040
Industry and Occupational Employment Forecasts
Prepared by the
Lehigh Valley Planning Commission

ii
Lehigh Valley Planning Commission
Matthew Glennon, ChairKent H. Herman, Vice ChairLiesel Dreisbach, TreasurerNorman E. BlattBecky Bradley (alt.)John B. CallahanGordon M. CampbellJohn CusickJohn N. DiacogiannisKaren D. DolanPercy H. DoughertyKaren DuerholzCharles W. ElliottCharles L. FraustGeorge F. GemmelSteven L. GlickmanArmand V. GrecoWilliam HansellMichael C. Hefele (alt.)
Darlene Heller (alt.)Benjamin F. Howells, Jr.Edward D. Hozza, Jr.Robert A. LammiTerry J. LeeEarl B. LynnJeffrey D. ManziRoss Marcus (alt.)Kenneth M. McClainChristina V. MorganThomas J. NolanSalvatore J. Panto, Jr.Edward PawlowskiStephen RepaschMichael RephVirginia Savage (alt.)Lisa SchellerJohn StoffaDonna Wright
Lehigh Valley Planning Commission StaffProject Report
David P. Berryman, Chief Planner, Project ManagerAlice J. Lipe, Senior Planning Technician, Layout and Cover DesignSusan L. Rockwell, Senior Environmental Planner, Editor
Michael N. Kaiser, AICP, Executive DirectorGeoffrey A. Reese, P.E., Assistant DirectorJoseph L. Gurinko, AICP, Chief Transportation PlannerDavid E. Manhardt, AICP, GIS ManagerLynette E. Romig, Senior GIS AnalystNgozi Obi, Senior Community PlannerMichael S. Donchez, Senior Transportation PlannerTeresa Mackey, Senior PlannerTravis I. Bartholomew, P.E., Senior EngineerChristopher S. DiMenichi, Jr., EIT, Transportation PlannerAnne L. Esser, MBA, Administrative AssistantKathleen M. Sauerzopf, Secretary
Lehigh Valley Planning Commission961 Marcon Boulevard, Suite 310Allentown, Pennsylvania 18109
Phone: 610-264-4544Fax: 610-264-2616
E-mail: [email protected]: www.lvpc.org
Approved for release by the Lehigh Valley Planning Com-mission on October 25, 2012.
The preparation of this report has been financed in part through grant(s) from the Federal Highway Administration and Federal Transit Administration, U.S. Department of Transportation, un-der the Metropolitan Planning Program, Section 104(f) of Title 23, U.S. Code. The contents of this report reflect the views of the authors who are responsible for the facts and the accuracy of the data presented herein. The contents do not necessar-ily reflect the official views or policies of the U.S. Department of Transportation, Federal Highway Administration (FHWA), Federal Transit Administration (FTA) or the Commonwealth of Pennsylvania at the time of publication. This report does not constitute a standard, specification or regulation.
TABLE OF CONTENTSSection One: Lehigh Valley Employment Analysis and Forecast ............................................................1 Past and Present Trends .......................................1 How We Forecast Future Employment .................4 Future Population, Labor Participation and Employment .......................................................7 Lehigh Valley Industry Sector Details .................21Section Two: Lehigh Valley Occupational Forecast and Analysis ............................................34Glossary .....................................................................38
TABLES1 Total Full Time and Part Time Employment by Industry from 2001 to 2010 - Lehigh Valley .....22 Comparison of Job Gain/Loss by Industry Lehigh Valley and the United States 2001-2010 .............................................................53 Employment Projections by Sector for the Lehigh Valley - 2010-2040 .................................. 114 Employment Projections by Sector for the United States 2010-2040 .................................... 125 Comparison of Employment Diversity by Industry - Lehigh Valley and the United States 2010 .................................................................... 146 Employment Projections by Sector for Lehigh County - 2010-2040 ................................ 167 Employment Projections by Sector for Northampton County - 2010-2040 ...................... 178 Change in Number of Jobs by Regional Geography - 2010-2040 ...................................... 199 Percent Change in Jobs by Sector by Geography - 2010-2040 ......................................2010.01 - 10.23 Change in the Number of Jobs by Industry Segment 2010-2040 - Lehigh and Northampton Counties ............................21-3311 Top Ten Occupations by Change in Jobs Lehigh and Northampton Counties - 2010-2040 ...........................................................3512 Job Gain/Loss by Occupation - Various Geographies - 2010-2040 ...................................36
GRAPHS1 Job Loss/Gain 2001-2010 - Lehigh Valley ............32 Model Linkages .....................................................63 Population, Employment and Labor Force Projections - 2010-2040 - Lehigh Valley ...............84 Job Loss/Gain - 2010-2040 Lehigh and Northampton Counties ........................................ 105 Change in the Percentage of Employment Diversity by Industry - 2010-2040 Lehigh Valley ....................................................... 13

1
SECTION ONE: LEHIGH VALLEY EMPLOYMENT ANALYSISAND FORECAST
The Lehigh Valley Planning Commission (LVPC) has developed a set of long-term industry and occupational employment forecasts for Lehigh and Northampton counties through 2040. The employment forecasts developed through this process are an extrapolation of historical and more current demographic and economic trends into the future. The forecasts show what the Lehigh Valley economy may look like at some future time if present trends continue. The LVPC needs the employment forecasts to update the region’s travel demand model which uses population and employment data to calculate the expected demand for transportation facilities. We also will use the employment forecasts in the upcoming jobs/housing balance studies and other planning projects.
These forecasts are not goal or policy driven. Future forecasts may be altered by policy changes or initiatives which alter current and future business practices and employment trends. They are based on previous data, trends, and knowledge that are available at the time of forecast. Because the economy is constantly changing, they are unlikely to be exactly right. Instead, employment forecasts should be seen as the most likely employment growth out of many possible outcomes, given the knowledge and information available at the time of forecast. Forecasts on total employment and some larger, more stable, industries are likely to be more reliable detailed forecasts at the occupation level which may be subject to greater error but provide general insight into which occupations are expected to grow in the future.
In the Lehigh Valley, the long-term trend of employment growth will continue to occur in the service-providing industries. Service-providing industries in the Lehigh Valley are expected to add jobs between 2010 and 2040 while jobs in the goods-producing industries are expected to decline. The employment decline in goods-producing industries is the result of continuing declines in manufacturing.
PAST AND PRESENT TRENDS
Table 1 and Graph 1 show job growth and decline in Lehigh Valley industry sectors. Note that the tables go back to 2001 and not 2000. The North American Industry Classification System (NAICS) replaced the existing Standard Industrial Classification (SIC) system in the United States in 2000. NAICS consolidated some industries and separated out others.
The SIC coding system grouped companies and businesses by their primary type of activity. If a company’s primary focus was making furniture, every activity in that company was given the SIC code for manufacturing. The NAICS coding system groups companies and businesses according to similar production process or activity. NAICS separates out the various functions within the same furniture company, giving management of the company its own NAICS code and the actual manufacturing of furniture a separate NAICS code.
The time from 2001-2010 was marked by a stagnant job market in the Lehigh Valley and the nation. The period began and ended with recessions (March-November 2001 and December 2007- June 2009 respectively), the latter of which was longer and more damaging than the former. The Lehigh Valley experienced an overall 7.7% increase in jobs between 2001 and 2010, but the loss of

2
TAB
LE 1
Tota
l Ful
l Tim
e an
d Pa
rt T
ime
Empl
oym
ent b
y In
dust
ry fr
om 2
001
to 2
010
Lehi
gh V
alle
y20
0120
0220
0320
0420
0520
0620
0720
0820
0920
10%
Cha
nge
# Jo
bs/T
ime
Tota
l em
ploy
men
t32
3,17
132
1,98
232
4,38
233
1,13
133
9,21
334
7,48
235
2,91
435
4,55
134
5,70
334
8,11
87.
7%24
,947
Wag
e an
d sa
lary
em
ploy
men
t27
8,92
327
6,16
727
7,29
328
1,76
328
7,02
329
3,20
229
6,42
729
5,73
228
6,19
628
7,74
93.
2%8,
826
Pro
prie
tors
em
ploy
men
t44
,247
45,2
0946
,867
48,7
8751
,064
55,6
3155
,408
58,8
1959
,507
59,7
6835
.1%
15,5
21Fa
rm p
ropr
ieto
rs e
mpl
oym
ent
1,11
01,
092
1,06
61,
066
1,07
41,
070
1,06
286
986
586
6-2
2.0%
-244
Non
farm
pro
prie
tors
em
ploy
men
t 43
,137
44,1
1745
,801
47,7
2149
,990
54,5
6154
,346
57,9
5058
,642
58,9
0236
.5%
15,7
65Fa
rm e
mpl
oym
ent
1,57
91,
461
1,38
31,
381
1,37
51,
387
1,36
61,
176
1,16
31,
199
-24.
1%-3
80N
onfa
rm e
mpl
oym
ent
321,
591
320,
418
322,
980
329,
808
337,
954
346,
271
351,
709
353,
375
344,
540
346,
318
7.7%
24,7
27
Priv
ate
empl
oym
ent
290,
504
288,
723
290,
392
296,
808
304,
593
312,
574
317,
447
318,
390
309,
277
310,
855
7.0%
20,3
51Fo
rest
ry, f
ishi
ng, r
elat
ed a
ctiv
ities
, and
oth
er
456
459
443
371
418
491
583
590
564
559
22.6
%10
3M
inin
g42
238
043
952
052
054
751
753
552
254
228
.4%
120
Util
ities
3,05
13,
290
1,66
51,
825
1,12
11,
010
982
970
951
934
-69.
4%-2
,117
Con
stru
ctio
n17
,662
17,5
0718
,084
19,4
1220
,560
20,4
3220
,218
19,3
2517
,075
16,1
38-8
.6%
-1,5
24M
anuf
actu
ring
47,5
8043
,163
36,0
5833
,540
33,1
8632
,780
32,0
7931
,556
28,9
4028
,229
-40.
7%-1
9,35
1W
hole
sale
trad
e11
,381
11,2
4211
,194
11,6
7012
,509
13,2
1613
,603
13,7
8113
,215
13,0
9515
.1%
1,71
4R
etai
l tra
de37
,255
38,0
8839
,035
38,8
6539
,562
39,7
0839
,748
39,0
7437
,997
37,8
551.
6%60
0Tr
ansp
orta
tion
and
war
ehou
sing
11,0
4111
,256
11,7
0811
,547
12,7
6614
,319
14,7
9014
,426
13,9
1214
,057
27.3
%3,
016
Info
rmat
ion
8,47
07,
243
7,28
17,
145
7,11
26,
924
7,01
17,
067
6,56
05,
144
-39.
3%-3
,326
Fina
nce
and
insu
ranc
e15
,436
15,2
8815
,354
15,3
9015
,766
16,2
0016
,572
17,2
5217
,936
18,2
0718
.0%
2,77
1R
eal e
stat
e an
d re
ntal
and
leas
ing
9,70
810
,398
10,2
3410
,682
11,9
1112
,286
12,4
4813
,234
12,8
8512
,779
31.6
%3,
071
Pro
fess
iona
l, sc
ient
ific,
and
tech
nica
l ser
vice
s14
,081
14,6
4914
,683
16,6
5316
,480
17,1
2717
,714
17,9
3317
,556
17,4
1223
.7%
3,33
1M
anag
emen
t of c
ompa
nies
and
ent
erpr
ises
3,60
13,
151
4,91
24,
917
10,4
5910
,077
10,3
7910
,105
9,70
39,
763
171.
1%6,
162
Adm
inis
trativ
e an
d w
aste
ser
vice
s18
,740
18,3
0718
,262
20,2
8820
,843
22,2
8123
,468
22,5
0221
,055
24,5
8231
.2%
5,84
2E
duca
tiona
l ser
vice
s10
,050
9,82
19,
731
9,90
710
,218
10,5
6811
,392
11,0
5311
,303
11,6
7216
.1%
1,62
2H
ealth
car
e an
d so
cial
ass
ista
nce
38,8
2839
,934
41,5
2343
,192
44,2
7546
,433
48,1
3049
,701
50,3
9851
,631
33.0
%12
,803
Arts
, ent
erta
inm
ent,
and
recr
eatio
n5,
893
6,30
16,
481
6,73
76,
957
7,17
27,
159
7,31
97,
920
8,42
643
.0%
2,53
3A
ccom
mod
atio
n an
d fo
od s
ervi
ces
17,9
4519
,048
19,9
0120
,647
21,0
1221
,626
21,9
6922
,603
21,9
8722
,039
22.8
%4,
094
Oth
er s
ervi
ces,
exc
ept p
ublic
adm
inis
tratio
n18
,905
19,5
3519
,391
19,5
6319
,402
20,3
7519
,995
19,3
7318
,829
18,3
57-2
.9%
-548
G
over
nmen
t and
gov
ernm
ent e
nter
pris
es31
,087
31,6
9532
,542
32,9
4933
,316
33,6
6834
,228
34,9
8535
,263
35,4
9814
.2%
4,41
1Fe
dera
l, ci
vilia
n2,
253
2,21
62,
246
2,16
12,
190
2,14
62,
190
2,15
02,
087
2,24
6-0
.3%
-7M
ilita
ry1,
933
1,95
32,
032
1,89
31,
875
1,91
51,
806
1,75
11,
719
1,72
9-1
0.6%
-204
Sta
te a
nd lo
cal
26,9
0127
,526
28,2
6428
,895
29,2
5129
,607
30,2
3231
,084
31,4
5731
,523
17.2
%4,
622
Sta
te g
over
nmen
t2,
377
2,44
12,
502
2,60
82,
593
2,57
02,
561
2,60
12,
681
2,64
211
.1%
265
Loca
l gov
ernm
ent
24,5
2425
,085
25,7
5426
,270
26,7
0127
,077
27,7
2428
,483
28,7
7628
,881
17.8
%4,
357
Sour
ce:
Reg
iona
l Eco
nom
ic In
form
atio
n S
yste
m; B
urea
u of
Eco
nom
ic A
naly
sis;
U.S
. Dep
artm
ent o
f Com
mer
ce, T
able
CA
25N
.N
otes
:S
ome
empl
oym
ent i
n th
e ut
ilitie
s se
ctor
was
recl
assi
fied
to m
anag
emen
t of c
ompa
nies
and
ent
erpr
ises
with
the
2002
NA
ICS
upd
ate
and
expl
ains
the
sign
ifica
nt e
mpl
oym
ent d
eclin
e in
util
ities
and
sig
nific
ant i
ncre
ase
in
man
agem
ent o
f com
pani
es a
nd e
nter
pris
es e
mpl
oym
ent i
n 20
03.
Loca
l gov
ernm
ent e
mpl
oym
ent i
nclu
des
empl
oyee
s of
pub
lic s
choo
l dis
trict
s.

3
GR
APH
1Jo
b Lo
ss/G
ain
2001
-201
0Le
high
Val
ley
Sour
ce:
Bur
eau
of E
cono
mic
Ana
lysi
s; U
.S. D
epar
tmen
t of C
omm
erce
, Tab
le C
A25
N, L
ehig
h V
alle
y P
lann
ing
Com
mis
sion
1,71
4
-19,
351
3,01
5
2,77
0
3,07
1
3,33
16,16
2
5,84
2
1,62
2
12,8
03
2,53
3
4,09
4
-7
-204
-2,1
17
-1,5
24
-548
120
600
103
-3,3
26
-50,
000
-40,
000
-30,
000
-20,
000
-10,
000
010
,000
20,0
0030
,000
40,0
0050
,000
Fore
stry
and
fish
ing
Min
ing
Util
ities
Con
stru
ctio
n
Who
lesa
le tr
ade
Man
ufac
turin
g
Ret
ail t
rade
Tran
spor
tatio
n an
d w
areh
ousi
ng
Info
rmat
ion
Fina
nce
and
insu
ranc
e
Rea
l est
ate
and
rent
al a
nd le
asin
g
Pro
fess
iona
l, sc
ient
ific,
and
tech
nica
l ser
vice
s
Man
agem
ent o
f com
pani
es a
nd e
nter
pris
es
Adm
inis
trativ
e an
d w
aste
ser
vice
s
Edu
catio
nal s
ervi
ces
Hea
lth c
are
and
soci
al a
ssis
tanc
e
Arts
, ent
erta
inm
ent,
and
recr
eatio
n
Acc
omm
odat
ion
and
food
ser
vice
s
Oth
er s
ervi
ces,
exc
ept p
ublic
adm
inis
tratio
n
Fede
ral,
civi
lian
Mili
tary

4
6,428 jobs or 1.8% decrease between 2008 to 2010 offset years of strong job growth in the middle of the decade. Manufacturing, construction and the information industries experienced sizeable declines in jobs during the time period between 2001-2010.
According to Table 2 the Lehigh Valley job growth of 7.7% outpaced the national job growth of 4.6%. This is substantially less than the job growth experienced during the 1990s when the Lehigh Valley and the nation posted double digit percentages in job growth. Table 2 also shows which Lehigh Valley industries did better and worse the last decade in job loss and gain compared to the rest of the nation. The Lehigh Valley lost more manufacturing jobs than the nation as a whole, but has several industries such as arts, healthcare and management of companies that added more jobs than the nation. This may suggest the Lehigh Valley has a niche in those industries. Service industries such as health care, arts and recreation and warehousing saw sizeable increases in the number of jobs which support the continued transition from the 20th century goods based Lehigh Valley economy to a 21st century service-oriented economy.
HOW WE FORECAST FUTURE EMPLOYMENT
The Lehigh Valley Planning Commission used an econometric model to forecast future employment in Lehigh and Northampton counties.
The REMI PI+ Model, published by Regional Economic Models, Inc. is a large econometric model of the Lehigh Valley region that has been built with data that is specific to Lehigh and Northampton counties and includes national but not state data. Models of this type have been used in every state in the nation. The database consists of data obtained from reliable sources such as the United States Department of Commerce, and Bureaus of Labor Statistics and Census. The primary national, state, and county data source for REMI PI+ is the Bureau of Economic Analysis (BEA) State Personal Income (SPI) and Local Area Personal Income (REIS) series (which also include employment and total population). Industries covered in the model reflect the 2007 North American Industrial Classification System (NAICS). The model forecasts the number of jobs, full-time plus part-time, by place of work. Employees, sole proprietors, and active partners are included, but unpaid family workers and volunteers are not included. The REMI PI+ model is reasonably transparent in its structure and data. Its equations in general are well documented, and the LVPC has the ability to focus on specific components of the model, such as industries and occupations, as we do in this report.
The REMI model is a structural model, meaning that it clearly includes cause-and-effect relationships. In the model, businesses produce goods to sell to other fi rms, consumers, investors, governments, and purchasers outside the region. The output is produced using labor, capital, fuel, and intermediate inputs. The demand for labor, capital, and fuel per unit of output depends on their relative costs. The supply of labor in the model depends on the number of people in the population and the proportion of those people who participate in the labor force. Economic migration affects the population size. More people will move into an area if the real after-tax wage rates or the likelihood of being employed increases in a region. Every input and component of the local economy is connected to one another, as shown in Graph 2. There is cause and effect from changing one or more inputs.
The REMI PI+ Model has a two year history lag. The current REMI PI+ Model’s last year of history is 2010. However, adjustments were made to the demographic module of the REMI PI+

5
TAB
LE 2
Com
paris
on o
f Job
Gai
n/Lo
ss b
y In
dust
ryLe
high
Val
ley
and
the
Uni
ted
Stat
es20
01-2
010
Lehi
gh V
alle
yU
nite
d St
ates
Indu
stry
2001
2010
% C
hang
e #
Jobs
/Tim
e20
0120
10%
Cha
nge
# Jo
bs/T
ime
Fore
stry
, Fis
hing
, Rel
ated
Act
iviti
es, a
nd O
ther
456
559
22.6
%10
380
1,49
982
7,51
83.
2%26
,019
Min
ing
422
542
28.4
%12
080
6,40
094
3,52
217
.0%
137,
122
Util
ities
3,05
193
4-6
9.4%
-2,1
1761
5,80
054
8,68
2-1
0.9%
-67,
118
Con
stru
ctio
n17
,662
16,1
38-8
.6%
-1,5
249,
817,
700
9,08
3,44
2-7
.5%
-734
,258
Man
ufac
turin
g47
,580
28,2
29-4
0.7%
-19,
351
16,9
13,6
0012
,470
,843
-26.
3%-4
,442
,757
Who
lesa
le T
rade
11,3
8113
,095
15.1
%1,
714
6,23
1,40
06,
060,
263
-2.7
%-1
71,1
37R
etai
l Tra
de37
,255
37,8
551.
6%60
018
,256
,801
17,6
37,0
39-3
.4%
-619
,762
Tran
spor
tatio
n an
d W
areh
ousi
ng11
,041
14,0
5727
.3%
3,01
65,
478,
000
5,70
5,06
24.
1%22
7,06
2In
form
atio
n8,
470
5,14
4-3
9.3%
-3,3
264,
047,
800
3,07
5,46
1-2
4.0%
-972
,339
Fina
nce
and
Insu
ranc
e15
,436
18,2
0718
.0%
2,77
17,
805,
600
8,53
3,03
49.
3%72
7,43
4R
eal E
stat
e an
d R
enta
l and
Lea
sing
9,70
812
,779
31.6
%3,
071
5,54
7,40
18,
135,
089
46.6
%2,
587,
688
Pro
fess
iona
l and
Tec
hnic
al S
ervi
ces
14,0
8117
,412
23.7
%3,
331
10,2
72,8
0012
,226
,777
19.0
%1,
953,
977
Man
agem
ent o
f Com
pani
es a
nd E
nter
pris
es3,
601
9,76
317
1.1%
6,16
21,
786,
300
1,88
8,48
25.
7%10
2,18
2A
dmin
istra
tive
and
Was
te S
ervi
ces
18,7
4024
,582
31.2
%5,
842
9,60
4,50
010
,650
,283
10.9
%1,
045,
783
Edu
catio
nal S
ervi
ces
10,0
5011
,672
16.1
%1,
622
3,01
9,30
04,
041,
522
33.9
%1,
022,
222
Hea
lth C
are
and
Soc
ial A
ssis
tanc
e38
,828
51,6
3133
.0%
12,8
0315
,247
,400
18,3
61,3
3220
.4%
3,11
3,93
2A
rts, E
nter
tain
men
t, an
d R
ecre
atio
n5,
893
8,42
643
.0%
2,53
33,
165,
100
3,75
4,20
018
.6%
589,
100
Acc
omm
odat
ion
and
Food
Ser
vice
s17
,945
22,0
3922
.8%
4,09
410
,807
,200
12,1
72,4
3212
.6%
1,36
5,23
2O
ther
Ser
vice
s, e
xcep
t Pub
lic A
dmin
istra
tion
18,9
0518
,357
-2.9
%-5
489,
074,
600
10,1
72,5
3012
.1%
1,09
7,93
0S
tate
and
Loc
al G
over
nmen
t26
,901
31,5
2317
.2%
4,62
218
,351
,000
19,1
79,2
444.
5%82
8,24
4Fe
dera
l Civ
ilian
2,25
32,
246
-0.3
%-7
2,72
9,00
02,
965,
646
8.7%
236,
646
Fede
ral M
ilita
ry1,
933
1,72
9-1
0.6%
-204
2,07
1,00
02,
213,
384
6.9%
142,
384
Farm
1,57
91,
199
-24.
1%-3
803,
060,
000
2,51
8,07
9-1
7.7%
-541
,921
323,
171
348,
118
7.7%
24,9
4716
5,51
0,20
117
3,16
3,86
64.
6%7,
653,
665
1990
2000
1990
2000
286,
922
323,
171
12.6
%36
,249
138,
330,
906
165,
370,
797
19.5
%27
,039
,891
Sour
ce:
Leh
igh
Val
ley
Pla
nnin
g C
omm
issi
on, R
EM
I Pi+
Mod
el, J
une
2012

6
Model to further increase accuracy and precision by calibrating it to the updated LVPC population forecasts, released in July 2012.
The REMI PI+ Model can quantify the response of the regional economy to specific shocks and also detail how these impacts are distributed over time. For this employment forecast, no “shocks” to the regional economy were assumed to occur during the forecast period. This means that the LVPC did not assume events such as recessions or natural disasters or major companies moving into or out of the Lehigh Valley would occur. While the LVPC is aware that unexpected shocks to the economy and movements in the business cycle will have an impact on the Lehigh Valley economy, there is no objective way to predict such unexpected events. However, the LVPC will continue to update and revise its long-term regional economic forecasts as more data become available and as significant events occur that may impact the long term future.
The reader should be aware that forecasting future demographic and economic trends is a difficult task. The REMI PI+ Model has been used in the Lehigh Valley to forecast employment through 2040. The LVPC uses this forecasting capability because we believe it provides valuable insight

7
into what industries will emerge in the local economy and this knowledge can help guide local decision making.
FUTURE POPULATION, LABOR PARTICIPATION AND EMPLOYMENT
The 2007 recession has changed employment in the Lehigh Valley. Shifting demographics and technology will change it even more. The jobs with the fastest growth over the next decade are largely the jobs that will relate to the needs of elderly baby boomers, namely health care and those to meet the continuing rise in population, such as construction.
Population
Jobs result from the relationship that exists among the population, the labor force, and the demand for goods and services. The population restricts the size of the labor force, which consists of working individuals and those looking for work. The population of the Lehigh Valley is expected to grow significantly between now and 2040. The size and productivity of the labor force limits the quantity of goods and services that can be produced. Changes in the demand for goods and services influence which industries expand or contract. Industries respond by hiring the workers necessary to produce goods and provide services.
According to the July 2012 report Population Forecasts for Lehigh and Northampton Counties: 2010-2040 published by the LVPC, the Lehigh Valley population will increase by 226,722 people from 2010 to 2040. This is an increase of 35% over three decades. This projected increase in population represents faster growth than experienced over the previous three decades (1980-2010) which was 30%. Lehigh County’s population will increase by 120,478 people from 2010 to 2040, 11.5% per decade. In comparison, the population grew at a rate of 9.4% per decade over the previous 30 years. Northampton County’s population will increase by 106,244 people from 2010 to 2040, 11.9% per decade. In comparison, the population grew at a rate of 10.7% per decade over the previous 30 years.
Labor Force
The REMI model also forecasts future labor force. The civilian labor force includes all people over 16 who are working or actively seeking work. An expanding labor force is necessary to supply businesses with a pool of workers. The labor force forecast is based on the forecast of the future size and composition of the Lehigh Valley population. Compared with the labor force of the past decades, today’s regional labor force is older, more racially and ethnically diverse, and composed of more women. These trends are expected to continue to shape the future of the workforce. The Lehigh Valley labor force will increase 30.2% from 335,611 people in 2010 to 436,889 people in 2040. However, labor force growth per decade will be lower than previous decades due to changing demographics. Labor force growth between 2000-2010 was 14.9%. The labor force growth between 2010-2020 is forecast to be 10.7%; 2020-2030, 6.9%; 2030-2040, 10.1%. In the future, businesses in the region may have to rely on increasing numbers of commuters coming into the Lehigh Valley to work from surrounding areas.

8
GR
APH
3
Popu
latio
n, E
mpl
oym
ent a
nd L
abor
For
ce P
roje
ctio
ns20
10-2
040
Lehi
gh V
alle
y
Sour
ce:L
ehig
h V
alle
y P
lann
ing
Com
mis
sion
, RE
MI P
i+ M
odel
, Jun
e 20
12
873,
954
832,
691
792,
928
753,
674
715,
226
679,
262
647,
232
436,
889
415,
366
396,
869
382,
921
371,
406
355,
416
335,
611
479,
532
458,
861
436,
858
417,
134
398,
086
379,
560
348,
118
0
100,
000
200,
000
300,
000
400,
000
500,
000
600,
000
700,
000
800,
000
900,
000
1,00
0,00
0
2010
2015
2020
2025
2030
2035
2040
Pop
ulat
ion
Labo
r For
ceE
mpl
oym
ent
9
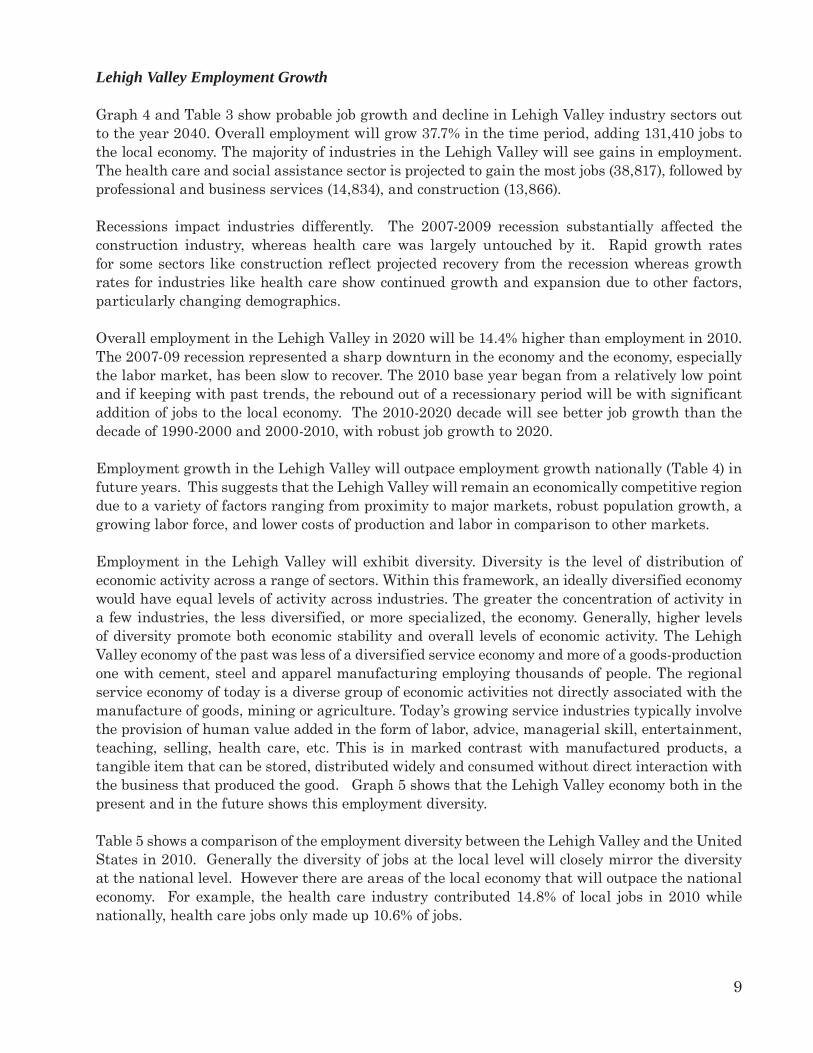
Lehigh Valley Employment Growth
Graph 4 and Table 3 show probable job growth and decline in Lehigh Valley industry sectors out to the year 2040. Overall employment will grow 37.7% in the time period, adding 131,410 jobs to the local economy. The majority of industries in the Lehigh Valley will see gains in employment. The health care and social assistance sector is projected to gain the most jobs (38,817), followed by professional and business services (14,834), and construction (13,866).
Recessions impact industries differently. The 2007-2009 recession substantially affected the construction industry, whereas health care was largely untouched by it. Rapid growth rates for some sectors like construction reflect projected recovery from the recession whereas growth rates for industries like health care show continued growth and expansion due to other factors, particularly changing demographics.
Overall employment in the Lehigh Valley in 2020 will be 14.4% higher than employment in 2010. The 2007-09 recession represented a sharp downturn in the economy and the economy, especially the labor market, has been slow to recover. The 2010 base year began from a relatively low point and if keeping with past trends, the rebound out of a recessionary period will be with significant addition of jobs to the local economy. The 2010-2020 decade will see better job growth than the decade of 1990-2000 and 2000-2010, with robust job growth to 2020.
Employment growth in the Lehigh Valley will outpace employment growth nationally (Table 4) in future years. This suggests that the Lehigh Valley will remain an economically competitive region due to a variety of factors ranging from proximity to major markets, robust population growth, a growing labor force, and lower costs of production and labor in comparison to other markets.
Employment in the Lehigh Valley will exhibit diversity. Diversity is the level of distribution of economic activity across a range of sectors. Within this framework, an ideally diversified economy would have equal levels of activity across industries. The greater the concentration of activity in a few industries, the less diversified, or more specialized, the economy. Generally, higher levels of diversity promote both economic stability and overall levels of economic activity. The Lehigh Valley economy of the past was less of a diversified service economy and more of a goods-production one with cement, steel and apparel manufacturing employing thousands of people. The regional service economy of today is a diverse group of economic activities not directly associated with the manufacture of goods, mining or agriculture. Today’s growing service industries typically involve the provision of human value added in the form of labor, advice, managerial skill, entertainment, teaching, selling, health care, etc. This is in marked contrast with manufactured products, a tangible item that can be stored, distributed widely and consumed without direct interaction with the business that produced the good. Graph 5 shows that the Lehigh Valley economy both in the present and in the future shows this employment diversity.
Table 5 shows a comparison of the employment diversity between the Lehigh Valley and the United States in 2010. Generally the diversity of jobs at the local level will closely mirror the diversity at the national level. However there are areas of the local economy that will outpace the national economy. For example, the health care industry contributed 14.8% of local jobs in 2010 while nationally, health care jobs only made up 10.6% of jobs.

10
GR
APH
4
Job
Loss
/Gai
n - 2
010-
2040
Lehi
gh a
nd N
orth
ampt
on C
ount
ies
Sour
ce:
Lehi
gh V
alle
y P
lann
ing
Com
mis
sion
, RE
MI P
i+ M
odel
, Jun
e 20
12
249
13,8
66
-704
697
3,85
06,51
5
2,91
3
3,69
3
14,8
34
1,97
6
10,3
36
4,49
9
38,8
17
3,41
0
7,87
2
7,32
0
12,8
53
-411
-331
-194
-317
-269
-60
-500
00-4
0000
-300
00-2
0000
-100
000
1000
020
000
3000
040
000
5000
0
Fore
stry
/Fis
hing
Min
ing
Util
ities
Con
stru
ctio
n
Man
ufac
turin
g
Who
lesa
le T
rade
Ret
ail T
rade
Tran
spor
tatio
n an
d W
areh
ousi
ng
Info
rmat
ion
Fina
nce
and
Insu
ranc
e
Rea
l Est
ate
and
Ren
tal a
nd L
easi
ng
Pro
fess
iona
l and
Tec
hnic
al S
ervi
ces
Man
agem
ent o
f Com
pani
es a
nd E
nter
pris
es
Adm
inis
trativ
e an
d W
aste
Ser
vice
s
Edu
catio
nal S
ervi
ces
Hea
lth C
are
and
Soc
ial A
ssis
tanc
e
Arts
, Ent
erta
inm
ent,
and
Rec
reat
ion
Acc
omm
odat
ion
and
Food
Ser
vice
s
Oth
er S
ervi
ces,
exc
ept P
ublic
Adm
inis
tratio
n
Sta
te a
nd L
ocal
Gov
ernm
ent
Fede
ral C
ivili
an
Fede
ral M
ilita
ry
Farm

11
TAB
LE 3
Empl
oym
ent P
roje
ctio
ns b
y Se
ctor
for t
he L
ehig
h Va
lley
2010
-204
0Le
high
Val
ley
2010
%20
15%
2020
%20
25%
2030
%20
35%
2040
%%
Cha
nge/
Tim
eC
hang
e in
Job
s/Ti
me
Fore
stry
, Fis
hing
, Rel
ated
Act
iviti
es, a
nd O
ther
559
0.2%
585
0.2%
609
0.2%
665
0.2%
717
0.2%
765
0.2%
808
0.2%
44.5
%24
9
Min
ing
542
0.2%
531
0.1%
492
0.1%
468
0.1%
471
0.1%
479
0.1%
482
0.1%
-11.
1%-6
0
Util
ities
934
0.3%
877
0.2%
778
0.2%
691
0.2%
624
0.1%
573
0.1%
523
0.1%
-44.
0%-4
11
Con
stru
ctio
n16
,138
4.6%
21,8
335.
8%24
,000
6.0%
26,3
276.
3%28
,147
6.4%
29,2
116.
4%30
,004
6.3%
85.9
%13
,866
Man
ufac
turin
g28
,229
8.1%
28,9
897.
6%28
,257
7.1%
27,5
826.
6%27
,429
6.3%
27,5
246.
0%27
,525
5.7%
-2.5
%-7
04
Who
lesa
le T
rade
13,0
953.
8%13
,472
3.5%
13,3
363.
4%13
,512
3.2%
13,6
603.
1%13
,805
3.0%
13,7
922.
9%5.
3%69
7
Ret
ail T
rade
37,8
5510
.9%
38,1
3710
.0%
37,7
749.
5%38
,808
9.3%
39,6
759.
1%40
,895
8.9%
41,7
058.
7%10
.2%
3,85
0
Tran
spor
tatio
n an
d W
areh
ousi
ng14
,057
4.0%
15,3
064.
0%15
,815
4.0%
16,6
744.
0%17
,778
4.1%
19,1
364.
2%20
,572
4.3%
46.3
%6,
515
Info
rmat
ion
5,14
41.
5%5,
326
1.4%
5,61
21.
4%5,
490
1.3%
5,28
01.
2%5,
067
1.1%
4,81
31.
0%-6
.4%
-331
Fina
nce
and
Insu
ranc
e18
,207
5.2%
19,0
095.
0%19
,463
4.9%
19,9
914.
8%20
,391
4.7%
20,8
224.
5%21
,120
4.4%
16.0
%2,
913
Rea
l Est
ate
and
Ren
tal a
nd L
easi
ng12
,779
3.7%
14,1
953.
7%14
,777
3.7%
15,2
213.
6%15
,622
3.6%
16,0
533.
5%16
,472
3.4%
28.9
%3,
693
Prof
essi
onal
and
Tec
hnic
al S
ervi
ces
17,4
125.
0%21
,184
5.6%
23,5
945.
9%25
,241
6.1%
27,2
566.
2%29
,648
6.5%
32,2
466.
7%85
.2%
14,8
34
Man
agem
ent o
f Com
pani
es a
nd E
nter
pris
es9,
763
2.8%
10,1
932.
7%10
,202
2.6%
10,5
422.
5%10
,976
2.5%
11,4
132.
5%11
,739
2.4%
20.2
%1,
976
Adm
inis
trat
ive
and
Was
te S
ervi
ces
24,5
827.
1%26
,907
7.1%
28,3
147.
1%29
,802
7.1%
31,4
257.
2%33
,241
7.2%
34,9
187.
3%42
.0%
10,3
36
Educ
atio
nal S
ervi
ces
11,6
723.
4%13
,576
3.6%
14,6
053.
7%14
,957
3.6%
15,3
003.
5%15
,777
3.4%
16,1
713.
4%38
.5%
4,49
9
Hea
lth C
are
and
Soci
al A
ssis
tanc
e51
,631
14.8
%58
,650
15.5
%65
,687
16.5
%71
,672
17.2
%77
,535
17.7
%84
,038
18.3
%90
,448
18.9
%75
.2%
38,8
17
Art
s, E
nter
tain
men
t, an
d R
ecre
atio
n8,
426
2.4%
9,12
82.
4%9,
393
2.4%
9,83
12.
4%10
,382
2.4%
11,0
822.
4%11
,836
2.5%
40.5
%3,
410
Acc
omm
odat
ion
and
Food
Ser
vice
s22
,039
6.3%
23,4
036.
2%23
,686
5.9%
25,0
236.
0%26
,475
6.1%
28,1
916.
1%29
,911
6.2%
35.7
%7,
872
Oth
er S
ervi
ces,
exc
ept P
ublic
Adm
inis
trat
ion
18,3
575.
3%20
,311
5.4%
21,3
935.
4%22
,412
5.4%
23,4
505.
4%24
,590
5.4%
25,6
775.
4%39
.9%
7,32
0
Stat
e an
d Lo
cal G
over
nmen
t31
,523
9.1%
32,8
658.
7%35
,257
8.9%
37,3
879.
0%39
,601
9.1%
42,0
279.
2%44
,376
9.3%
40.8
%12
,853
Fede
ral C
ivili
an2,
246
0.6%
2,21
00.
6%2,
153
0.5%
2,11
40.
5%2,
084
0.5%
2,06
90.
5%2,
052
0.4%
-8.6
%-1
94
Fede
ral M
ilita
ry1,
729
0.5%
1,72
00.
5%1,
793
0.5%
1,69
40.
4%1,
596
0.4%
1,50
20.
3%1,
412
0.3%
-18.
3%-3
17
Farm
1,19
90.
3%1,
153
0.3%
1,09
60.
3%1,
030
0.2%
984
0.2%
953
0.2%
930
0.2%
-22.
4%-2
69
348,
118
379,
560
398,
086
417,
134
436,
858
458,
861
479,
532
37.7
%13
1,41
4
49,9
68 jo
bs38
,772
jobs
42,6
74 jo
bs
1990
2000
2000
2010
286,
922
321,
676
12.1
%34
,754
321,
676
348,
118
8.2%
26,4
42
14.4
% J
ob G
row
th9.
7% J
ob G
row
th9.
8% J
ob G
row
th
Sour
ce:
Leh
igh
Val
ley
Pla
nnin
g C
omm
issi
on, R
EM
I Pi+
Mod
el, J
une
2012
His
toric
al C
ompa
rison
of E
mpl
oym
ent G
row
th

12
TAB
LE 4
Empl
oym
ent P
roje
ctio
ns b
y Se
ctor
for t
he U
nite
d St
ates
2010
-204
0
Uni
ted
Stat
es20
10%
2015
%20
20%
2025
%20
30%
2035
%20
40%
% C
hang
e/Ti
me
Cha
nge
in J
obs/
Tim
e
Fore
stry
, Fis
hing
, Rel
ated
Act
iviti
es, a
nd O
ther
827,
518
0.6%
882,
946
0.6%
913,
649
0.5%
972,
334
0.5%
1,03
3,39
40.
5%1,
093,
050
0.5%
1,16
0,53
60.
5%40
.2%
333,
018
Min
ing
943,
522
0.7%
918,
496
0.7%
854,
074
0.4%
753,
199
0.4%
740,
380
0.3%
751,
542
0.3%
762,
624
0.3%
-19.
2%-1
80,8
98
Util
ities
548,
682
0.4%
534,
095
0.4%
492,
192
0.2%
448,
230
0.2%
414,
953
0.2%
390,
320
0.2%
368,
596
0.2%
-32.
8%-1
80,0
86
Con
stru
ctio
n9,
083,
442
6.9%
12,1
29,5
558.
7%13
,326
,439
6.7%
14,2
73,9
546.
9%15
,042
,368
7.0%
15,5
31,1
036.
9%15
,957
,864
6.8%
75.7
%6,
874,
422
Man
ufac
turin
g12
,470
,843
9.5%
12,5
20,9
099.
0%12
,163
,848
6.1%
11,8
09,2
765.
7%11
,668
,225
5.4%
11,6
39,5
935.
2%11
,601
,493
5.0%
-7.0
%-8
69,3
50
Who
lesa
le T
rade
6,06
0,26
34.
6%6,
274,
467
4.5%
6,27
3,42
23.
2%6,
332,
638
3.1%
6,38
2,70
33.
0%6,
445,
796
2.9%
6,45
0,72
12.
8%6.
4%39
0,45
8
Ret
ail T
rade
17,6
37,0
3913
.5%
18,0
58,1
0713
.0%
18,0
67,3
169.
1%18
,402
,490
8.9%
18,7
11,1
438.
7%19
,267
,988
8.6%
19,7
00,9
758.
4%11
.7%
2,06
3,93
6
Tran
spor
tatio
n an
d W
areh
ousi
ng5,
705,
062
4.4%
6,24
8,81
54.
5%6,
477,
132
3.3%
6,81
8,85
73.
3%7,
243,
531
3.4%
7,76
1,86
93.
5%8,
312,
342
3.6%
45.7
%2,
607,
280
Info
rmat
ion
3,07
5,46
12.
3%3,
234,
680
2.3%
3,43
8,84
41.
7%3,
351,
618
1.6%
3,23
5,93
21.
5%3,
152,
112
1.4%
3,05
1,88
81.
3%-0
.8%
-23,
573
Fina
nce
and
Insu
ranc
e8,
533,
034
6.5%
9,05
7,45
96.
5%9,
418,
262
4.7%
9,68
4,82
94.
7%9,
851,
559
4.6%
9,99
6,52
64.
5%10
,038
,527
4.3%
17.6
%1,
505,
493
Rea
l Est
ate
and
Ren
tal a
nd L
easi
ng8,
135,
089
6.2%
9,11
9,78
36.
6%9,
534,
410
4.8%
9,76
0,76
24.
7%10
,006
,751
4.7%
10,3
12,7
534.
6%10
,588
,773
4.5%
30.2
%2,
453,
684
Prof
essi
onal
and
Tec
hnic
al S
ervi
ces
12,2
26,7
779.
3%14
,638
,225
10.5
%16
,273
,881
8.2%
17,2
52,7
568.
4%18
,399
,293
8.6%
19,7
23,7
198.
8%21
,071
,240
9.0%
72.3
%8,
844,
463
Man
agem
ent o
f Com
pani
es a
nd E
nter
pris
es1,
888,
482
1.4%
1,96
8,17
31.
4%1,
964,
157
1.0%
2,02
3,50
51.
0%2,
107,
680
1.0%
2,19
7,60
21.
0%2,
270,
144
1.0%
20.2
%38
1,66
2
Adm
inis
trat
ive
and
Was
te S
ervi
ces
10,6
50,2
838.
1%11
,757
,938
8.5%
12,4
69,6
296.
3%13
,083
,861
6.3%
13,7
68,0
756.
4%14
,548
,312
6.5%
15,2
79,0
326.
6%43
.5%
4,62
8,74
9
Educ
atio
nal S
ervi
ces
4,04
1,52
23.
1%4,
703,
836
3.4%
5,06
7,28
52.
5%5,
192,
778
2.5%
5,31
3,38
22.
5%5,
464,
797
2.4%
5,58
8,84
42.
4%38
.3%
1,54
7,32
2
Hea
lth C
are
and
Soci
al A
ssis
tanc
e18
,361
,332
14.0
%21
,190
,525
15.2
%23
,959
,607
12.1
%26
,046
,309
12.6
%28
,139
,531
13.1
%30
,483
,514
13.6
%32
,881
,734
14.1
%79
.1%
14,5
20,4
02
Art
s, E
nter
tain
men
t, an
d R
ecre
atio
n3,
754,
200
2.9%
4,02
4,73
32.
9%4,
142,
605
2.1%
4,31
8,43
42.
1%4,
549,
613
2.1%
4,85
6,44
02.
2%5,
185,
524
2.2%
38.1
%1,
431,
324
Acc
omm
odat
ion
and
Food
Ser
vice
s12
,172
,432
9.3%
12,9
44,2
779.
3%13
,132
,905
6.6%
13,7
64,4
126.
7%14
,461
,373
6.7%
15,3
13,5
936.
8%16
,161
,979
6.9%
32.8
%3,
989,
547
Oth
er S
ervi
ces,
exc
ept P
ublic
Adm
inis
trat
ion
10,1
72,5
307.
8%11
,234
,314
8.1%
11,8
07,5
955.
9%12
,233
,037
5.9%
12,6
98,2
865.
9%13
,295
,461
5.9%
13,9
01,3
526.
0%36
.7%
3,72
8,82
2
Stat
e an
d Lo
cal G
over
nmen
t19
,179
,244
14.6
%19
,987
,799
14.4
%21
,510
,902
10.8
%22
,642
,154
11.0
%23
,819
,781
11.1
%25
,136
,750
11.2
%26
,419
,154
11.3
%37
.7%
7,23
9,91
0
Fede
ral C
ivili
an2,
965,
646
2.3%
2,91
7,97
72.
1%2,
841,
944
1.4%
2,79
0,36
81.
4%2,
751,
606
1.3%
2,73
1,72
61.
2%2,
709,
683
1.2%
-8.6
%-2
55,9
63
Fede
ral M
ilita
ry2,
213,
384
1.7%
2,20
1,15
71.
6%2,
295,
762
1.2%
2,16
9,18
51.
1%2,
042,
691
1.0%
1,92
2,24
50.
9%1,
807,
576
0.8%
-18.
3%-4
05,8
08
Farm
2,51
8,07
91.
9%2,
420,
909
1.7%
2,30
0,40
11.
2%2,
164,
170
1.0%
2,06
5,56
01.
0%2,
002,
104
0.9%
1,95
3,46
70.
8%-2
2.4%
-564
,612
173,
163,
866
188,
969,
175
198,
726,
261
206,
289,
156
214,
447,
810
224,
018,
915
233,
224,
068
34.7
%60
,060
,202
1990
2000
2000
2010
138,
330,
906
165,
370,
797
19.5
%27
,039
,891
165,
370,
797
173,
163,
891
4.7%
7,79
3,09
4
8.8%
Job
Gro
wth
18,7
76,2
58 jo
bs
Sour
ce:
Leh
igh
Val
ley
Pla
nnin
g C
omm
issi
on, R
EM
I Pi+
Mod
el, J
une
2012
14.8
% J
ob G
row
th
25,5
62,3
95 jo
bs
7.9%
Job
Gro
wth
15,7
21,5
49 jo
bs
His
toric
al C
ompa
rison
of E
mpl
oym
ent G
row
th

13
GR
APH
5C
hang
e in
the
Perc
enta
ge o
f Em
ploy
men
t Div
ersi
ty b
y In
dust
ry -
2010
-204
0Le
high
Val
ley
Sour
ce:
Lehi
gh V
alle
y P
lann
ing
Com
mis
sion
, RE
MI P
i+ M
odel
, Jun
e 20
12
0.2%
0.2%0.3%
8.1%
3.8%
10.9
%
4.0%
1.5%
5.2%
3.7%
2.8%
2.4%
6.3%
5.3%
9.1%
0.6%
0.5%
6.3%6.
7%
4.6%5.
0%
0.3%
7.1%
3.4%
14.8
%
0.2%
0.1%
0.1%
2.9%
1.0%
3.4%
5.4%
9.3%
0.4%
2.4%
7.3%
3.4%
5.7%
18.9
%
8.7%
4.3%
6.2%
2.5%
0.3%
0.2%
4.4%
00.
020.
040.
060.
080.
10.
120.
140.
160.
180.
2
Fore
stry
, Fis
hing
, Rel
ated
Act
iviti
es, a
nd O
ther
Min
ing
Util
ities
Con
stru
ctio
n
Man
ufac
turin
g
Who
lesa
le T
rade
Ret
ail T
rade
Tran
spor
tatio
n an
d W
areh
ousi
ng
Info
rmat
ion
Fina
nce
and
Insu
ranc
e
Rea
l Est
ate
and
Ren
tal a
nd L
easi
ng
Pro
fess
iona
l and
Tec
hnic
al S
ervi
ces
Man
agem
ent o
f Com
pani
es a
nd E
nter
pris
es
Adm
inis
trativ
e an
d W
aste
Ser
vice
s
Edu
catio
nal S
ervi
ces
Hea
lth C
are
and
Soc
ial A
ssis
tanc
e
Arts
, Ent
erta
inm
ent,
and
Rec
reat
ion
Acc
omm
odat
ion
and
Food
Ser
vice
s
Oth
er S
ervi
ces,
exc
ept P
ublic
Adm
inis
tratio
n
Sta
te a
nd L
ocal
Gov
ernm
ent
Fede
ral C
ivilia
n
Fede
ral M
ilita
ry
Farm
2010
2040

14
TAB
LE 5
Com
paris
on o
f Em
ploy
men
t Div
ersi
ty b
y In
dust
ryLe
high
Val
ley
and
the
Uni
ted
Stat
es20
10
Lehi
gh V
alle
y20
10%
of e
mpl
oym
ent
mar
ket
Uni
ted
Stat
es20
10%
of e
mpl
oym
ent
mar
ket
Fore
stry
, Fis
hing
, Rel
ated
Act
iviti
es, a
nd O
ther
559
0.2%
827,
518
0.5%
Min
ing
542
0.2%
943,
522
0.5%
Util
ities
934
0.3%
548,
682
0.3%
Con
stru
ctio
n16
,138
4.6%
9,08
3,44
25.
2%M
anuf
actu
ring
28,2
298.
1%12
,470
,843
7.2%
Who
lesa
le T
rade
13,0
953.
8%6,
060,
263
3.5%
Ret
ail T
rade
37,8
5510
.9%
17,6
37,0
3910
.2%
Tran
spor
tatio
n an
d W
areh
ousi
ng14
,057
4.0%
5,70
5,06
23.
3%In
form
atio
n5,
144
1.5%
3,07
5,46
11.
8%Fi
nanc
e an
d In
sura
nce
18,2
075.
2%8,
533,
034
4.9%
Rea
l Est
ate
and
Ren
tal a
nd L
easi
ng12
,779
3.7%
8,13
5,08
94.
7%P
rofe
ssio
nal a
nd T
echn
ical
Ser
vice
s17
,412
5.0%
12,2
26,7
777.
1%M
anag
emen
t of C
ompa
nies
and
Ent
erpr
ises
9,76
32.
8%1,
888,
482
1.1%
Adm
inis
trat
ive
and
Was
te S
ervi
ces
24,5
827.
1%10
,650
,283
6.2%
Educ
atio
nal S
ervi
ces
11,6
723.
4%4,
041,
522
2.3%
Hea
lth C
are
and
Soci
al A
ssis
tanc
e51
,631
14.8
%18
,361
,332
10.6
%A
rts,
Ent
erta
inm
ent,
and
Rec
reat
ion
8,42
62.
4%3,
754,
200
2.2%
Acc
omm
odat
ion
and
Food
Ser
vice
s22
,039
6.3%
12,1
72,4
327.
0%O
ther
Ser
vice
s, e
xcep
t Pub
lic A
dmin
istra
tion
18,3
575.
3%10
,172
,530
5.9%
Sta
te a
nd L
ocal
Gov
ernm
ent
31,5
239.
1%19
,179
,244
11.1
%Fe
dera
l Civ
ilian
2,24
60.
6%2,
965,
646
1.7%
Fede
ral M
ilita
ry1,
729
0.5%
2,21
3,38
41.
3%Fa
rm1,
199
0.3%
2,51
8,07
91.
5%34
8,11
810
0.0%
173,
163,
866
100.
0%S
ourc
e: L
ehig
h V
alle
y P
lann
ing
Com
mis
sion
, RE
MI P
i+ M
odel
, Jun
e 20
12

15
Note the low diversity percentages for goods producing industries. Goods include the following: agriculture, mining, construction and manufacturing. Economic modeling suggests the local economy will be similar to the national economy, with the continued focus on employment in the service industries. The service-providing industries are comprised of transportation and warehousing, wholesale trade, retail trade, information, fi nance and insurance, real estate and rental and leasing, professional, scientifi c and technical services, management of companies and enterprises, administrative and support and waste management and remediation services, educational services, health care and social assistance, arts, entertainment and recreation, services, and government.
While manufacturing is on the list with 704 jobs lost, the majority of the manufacturing jobs in the Lehigh Valley left decades ago due to competition overseas or increased usage of technology. The model suggests that while state and local government employment will gain jobs over the next 30 years in response to growing population, local jobs in the federal government will shrink due to budgetary and fiscal concerns. Following the hiring trends of the last two decades, federal employment reductions are done without layoffs. When workers quit or retire, the government hires fewer replacements. Relative to the farming sector, increased use of technology and machines requires fewer employees to operate farms and harvest crops.
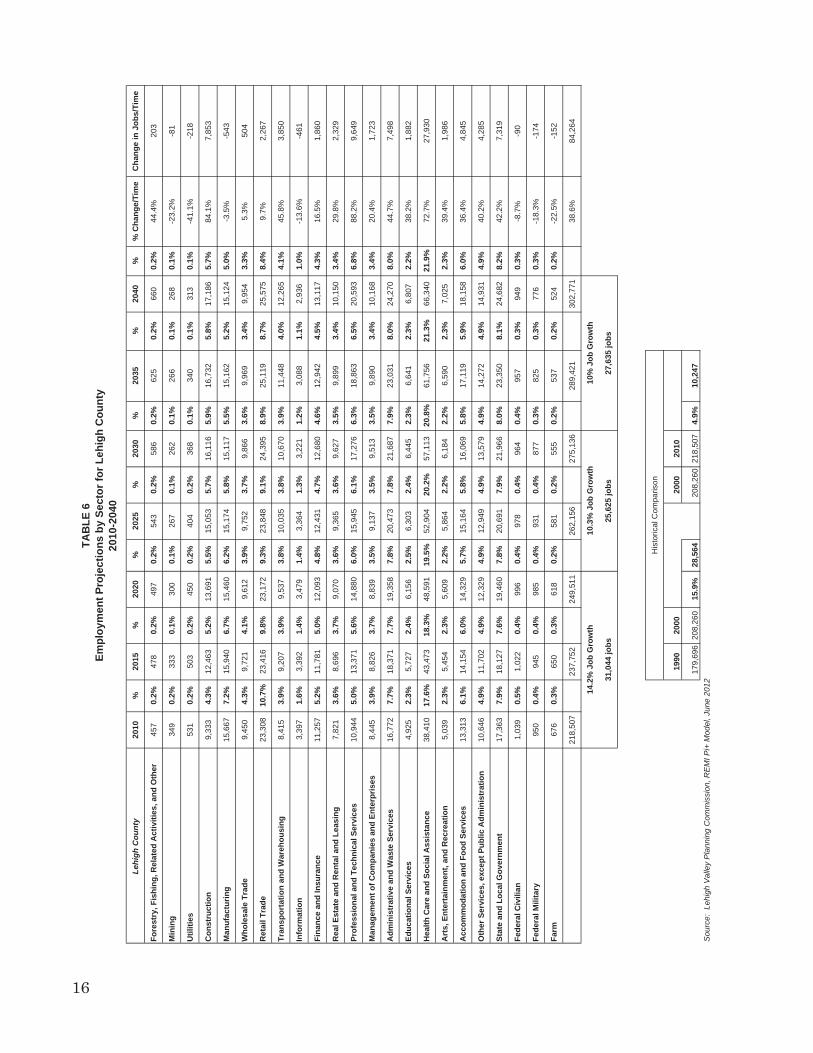
Employment Growth by County
Tables 6 and 7 show the industry sectors in each county. Note that each county has its own strengths and weaknesses when it comes to job gains and losses in industry sectors. Each county experienced job growth in different decades, with Northampton County seeing considerable job growth in the 2000s and Lehigh County’s job growth occurring in the 1990s.
In Lehigh County, the 2010-2020 decade will experience a 14.2% increase in jobs which is better than the growth experienced between 2000 and 2010 but lower than the growth experienced during the 1990s when Lehigh County had a 15.9% increase in jobs. Table 6 shows job growth will decline in coming decades but will remain higher than 2000-2010 levels.
In Northampton County, the trend in job growth will differ from Lehigh County. The 2010-2020 decade will see a 9.4% increase in jobs which will be less than the growth experienced between 2000-2010 but higher than the growth experienced in the 1990s. Also, Northampton County will experience a relatively stable pattern of job growth between decades with no significant decreases as forecasted for Lehigh County. Northampton County will see employment growth in the same industries as Lehigh County, i.e.: health care, professional and technical services, local government and construction
The total number of new jobs in Lehigh County (84,264) will be 44% higher than the number of new jobs than Northampton County (47,150) largely because in 2010, it employs significantly more people in the health care and retail sectors and Lehigh County population will increase by more people over the forecast period. The reasons for the significant growth in health care employment are well documented: an aging baby boom population, increasing life expectancies combined with continuing advances in health care technology. Lehigh County will have more population due to more births than in Northampton County. From 2010 to 2040, there are projected to be 154,284 births in Lehigh County and only 117,153 deaths leading to a population growth of 37,131 persons. In the same period in Northampton County there are projected to be only 105,871 births and
16
TAB
LE 6
Empl
oym
ent P
roje
ctio
ns b
y Se
ctor
for L
ehig
h C
ount
y20
10-2
040
Lehi
gh C
ount
y20
10%
2015
%20
20%
2025
%20
30%
2035
%20
40%
% C
hang
e/Ti
me
Cha
nge
in J
obs/
Tim
e
Fore
stry
, Fis
hing
, Rel
ated
Act
iviti
es, a
nd O
ther
457
0.2%
478
0.2%
497
0.2%
543
0.2%
586
0.2%
625
0.2%
660
0.2%
44.4
%20
3
Min
ing
349
0.2%
333
0.1%
300
0.1%
267
0.1%
262
0.1%
266
0.1%
268
0.1%
-23.
2%-8
1
Util
ities
531
0.2%
503
0.2%
450
0.2%
404
0.2%
368
0.1%
340
0.1%
313
0.1%
-41.
1%-2
18
Con
stru
ctio
n9,
333
4.3%
12,4
635.
2%13
,691
5.5%
15,0
535.
7%16
,116
5.9%
16,7
325.
8%17
,186
5.7%
84.1
%7,
853
Man
ufac
turin
g15
,667
7.2%
15,9
406.
7%15
,460
6.2%
15,1
745.
8%15
,117
5.5%
15,1
625.
2%15
,124
5.0%
-3.5
%-5
43
Who
lesa
le T
rade
9,45
04.
3%9,
721
4.1%
9,61
23.
9%9,
752
3.7%
9,86
63.
6%9,
969
3.4%
9,95
43.
3%5.
3%50
4
Ret
ail T
rade
23,3
0810
.7%
23,4
169.
8%23
,172
9.3%
23,8
489.
1%24
,395
8.9%
25,1
198.
7%25
,575
8.4%
9.7%
2,26
7
Tran
spor
tatio
n an
d W
areh
ousi
ng8,
415
3.9%
9,20
73.
9%9,
537
3.8%
10,0
353.
8%10
,670
3.9%
11,4
484.
0%12
,265
4.1%
45.8
%3,
850
Info
rmat
ion
3,39
71.
6%3,
392
1.4%
3,47
91.
4%3,
364
1.3%
3,22
11.
2%3,
088
1.1%
2,93
61.
0%-1
3.6%
-461
Fina
nce
and
Insu
ranc
e11
,257
5.2%
11,7
815.
0%12
,093
4.8%
12,4
314.
7%12
,680
4.6%
12,9
424.
5%13
,117
4.3%
16.5
%1,
860
Rea
l Est
ate
and
Ren
tal a
nd L
easi
ng7,
821
3.6%
8,69
63.
7%9,
070
3.6%
9,36
53.
6%9,
627
3.5%
9,89
93.
4%10
,150
3.4%
29.8
%2,
329
Prof
essi
onal
and
Tec
hnic
al S
ervi
ces
10,9
445.
0%13
,371
5.6%
14,8
806.
0%15
,945
6.1%
17,2
766.
3%18
,863
6.5%
20,5
936.
8%88
.2%
9,64
9
Man
agem
ent o
f Com
pani
es a
nd E
nter
pris
es8,
445
3.9%
8,82
63.
7%8,
839
3.5%
9,13
73.
5%9,
513
3.5%
9,89
03.
4%10
,168
3.4%
20.4
%1,
723
Adm
inis
trat
ive
and
Was
te S
ervi
ces
16,7
727.
7%18
,371
7.7%
19,3
587.
8%20
,473
7.8%
21,6
877.
9%23
,031
8.0%
24,2
708.
0%44
.7%
7,49
8
Educ
atio
nal S
ervi
ces
4,92
52.
3%5,
727
2.4%
6,15
62.
5%6,
303
2.4%
6,44
52.
3%6,
641
2.3%
6,80
72.
2%38
.2%
1,88
2
Hea
lth C
are
and
Soci
al A
ssis
tanc
e38
,410
17.6
%43
,473
18.3
%48
,591
19.5
%52
,904
20.2
%57
,113
20.8
%61
,756
21.3
%66
,340
21.9
%72
.7%
27,9
30
Art
s, E
nter
tain
men
t, an
d R
ecre
atio
n5,
039
2.3%
5,45
42.
3%5,
609
2.2%
5,86
42.
2%6,
184
2.2%
6,59
02.
3%7,
025
2.3%
39.4
%1,
986
Acc
omm
odat
ion
and
Food
Ser
vice
s13
,313
6.1%
14,1
546.
0%14
,329
5.7%
15,1
645.
8%16
,069
5.8%
17,1
195.
9%18
,158
6.0%
36.4
%4,
845
Oth
er S
ervi
ces,
exc
ept P
ublic
Adm
inis
trat
ion
10,6
464.
9%11
,702
4.9%
12,3
294.
9%12
,949
4.9%
13,5
794.
9%14
,272
4.9%
14,9
314.
9%40
.2%
4,28
5
Stat
e an
d Lo
cal G
over
nmen
t17
,363
7.9%
18,1
277.
6%19
,460
7.8%
20,6
917.
9%21
,966
8.0%
23,3
508.
1%24
,682
8.2%
42.2
%7,
319
Fede
ral C
ivili
an1,
039
0.5%
1,02
20.
4%99
60.
4%97
80.
4%96
40.
4%95
70.
3%94
90.
3%-8
.7%
-90
Fede
ral M
ilita
ry95
00.
4%94
50.
4%98
50.
4%93
10.
4%87
70.
3%82
50.
3%77
60.
3%-1
8.3%
-174
Farm
676
0.3%
650
0.3%
618
0.2%
581
0.2%
555
0.2%
537
0.2%
524
0.2%
-22.
5%-1
52
218,
507
237,
752
249,
511
262,
156
275,
136
289,
421
302,
771
38.6
%84
,264
His
toric
al C
ompa
rison
1990
2000
2000
2010
179,
696
208,
260
15.9
%28
,564
208,
260
218,
507
4.9%
10,2
47S
ourc
e: L
ehig
h V
alle
y P
lann
ing
Com
mis
sion
, RE
MI P
i+ M
odel
, Jun
e 20
12
14.2
% J
ob G
row
th
31,0
44 jo
bs
10.3
% J
ob G
row
th
25,6
25 jo
bs
10%
Job
Gro
wth
27,6
35 jo
bs

17
TAB
LE 7
Empl
oym
ent P
roje
ctio
ns b
y Se
ctor
for N
orth
ampt
on C
ount
y20
10-2
040
Nor
tham
pton
Cou
nty
2010
%20
15%
2020
%20
25%
2030
%20
35%
2040
%%
Cha
nge/
Tim
eC
hang
e in
Job
s/Ti
me
Fore
stry
, Fis
hing
, Rel
ated
Act
iviti
es, a
nd O
ther
102
0.1%
107
0.1%
112
0.1%
122
0.1%
131
0.1%
140
0.1%
148
0.1%
45.1
%46
Min
ing
193
0.1%
198
0.1%
192
0.1%
201
0.1%
209
0.1%
213
0.1%
214
0.1%
10.9
%21
Util
ities
403
0.3%
374
0.3%
328
0.2%
287
0.2%
256
0.2%
233
0.1%
210
0.1%
-47.
9%-1
93
Con
stru
ctio
n6,
805
5.3%
9,37
06.
6%10
,309
6.9%
11,2
747.
3%12
,031
7.4%
12,4
797.
4%12
,818
7.3%
88.4
%6,
013
Man
ufac
turin
g12
,562
9.7%
13,0
499.
2%12
,797
8.6%
12,4
088.
0%12
,312
7.6%
12,3
627.
3%12
,401
7.0%
-1.3
%-1
61
Who
lesa
le T
rade
3,64
52.
8%3,
751
2.6%
3,72
42.
5%3,
760
2.4%
3,79
42.
3%3,
836
2.3%
3,83
82.
2%5.
3%19
3
Ret
ail T
rade
14,5
4711
.2%
14,7
2110
.4%
14,6
029.
8%14
,960
9.7%
15,2
809.
4%15
,776
9.3%
16,1
309.
1%10
.9%
1,58
3
Tran
spor
tatio
n an
d W
areh
ousi
ng5,
642
4.4%
6,09
94.
3%6,
278
4.2%
6,63
94.
3%7,
108
4.4%
7,68
84.
5%8,
307
4.7%
47.2
%2,
665
Info
rmat
ion
1,74
71.
3%1,
934
1.4%
2,13
31.
4%2,
126
1.4%
2,05
91.
3%1,
979
1.2%
1,87
71.
1%7.
4%13
0
Fina
nce
and
Insu
ranc
e6,
950
5.4%
7,22
85.
1%7,
370
5.0%
7,56
04.
9%7,
711
4.8%
7,88
04.
7%8,
003
4.5%
15.2
%1,
053
Rea
l Est
ate
and
Ren
tal a
nd L
easi
ng4,
958
3.8%
5,49
93.
9%5,
707
3.8%
5,85
63.
8%5,
995
3.7%
6,15
43.
6%6,
322
3.6%
27.5
%1,
364
Prof
essi
onal
and
Tec
hnic
al S
ervi
ces
6,46
85.
0%7,
813
5.5%
8,71
45.
9%9,
296
6.0%
9,98
06.
2%10
,785
6.4%
11,6
536.
6%80
.2%
5,18
5
Man
agem
ent o
f Com
pani
es a
nd E
nter
pris
es1,
318
1.0%
1,36
71.
0%1,
363
0.9%
1,40
60.
9%1,
463
0.9%
1,52
30.
9%1,
571
0.9%
19.2
%25
3
Adm
inis
trat
ive
and
Was
te S
ervi
ces
7,81
16.
0%8,
535
6.0%
8,95
66.
0%9,
329
6.0%
9,73
86.
0%10
,210
6.0%
10,6
486.
0%36
.3%
2,83
7
Educ
atio
nal S
ervi
ces
6,74
75.
2%7,
849
5.5%
8,44
95.
7%8,
654
5.6%
8,85
55.
5%9,
136
5.4%
9,36
45.
3%38
.8%
2,61
7
Hea
lth C
are
and
Soci
al A
ssis
tanc
e13
,220
10.2
%15
,178
10.7
%17
,096
11.5
%18
,767
12.1
%20
,422
12.6
%22
,282
13.2
%24
,108
13.6
%82
.4%
10,8
88
Art
s, E
nter
tain
men
t, an
d R
ecre
atio
n3,
387
2.6%
3,67
42.
6%3,
784
2.5%
3,96
72.
6%4,
198
2.6%
4,49
22.
7%4,
811
2.7%
42.0
%1,
424
Acc
omm
odat
ion
and
Food
Ser
vice
s8,
726
6.7%
9,24
96.
5%9,
357
6.3%
9,85
96.
4%10
,406
6.4%
11,0
726.
5%11
,753
6.6%
34.7
%3,
027
Oth
er S
ervi
ces,
exc
ept P
ublic
Adm
inis
trat
ion
7,71
15.
9%8,
609
6.1%
9,06
46.
1%9,
463
6.1%
9,87
16.
1%10
,318
6.1%
10,7
466.
1%39
.4%
3,03
5
Stat
e an
d Lo
cal G
over
nmen
t14
,160
10.9
%14
,738
10.4
%15
,797
10.6
%16
,696
10.8
%17
,635
10.9
%18
,677
11.0
%19
,694
11.1
%39
.1%
5,53
4
Fede
ral C
ivili
an1,
207
0.9%
1,18
80.
8%1,
157
0.8%
1,13
60.
7%1,
120
0.7%
1,11
20.
7%1,
103
0.6%
-8.6
%-1
04
Fede
ral M
ilita
ry77
90.
6%77
50.
5%80
80.
5%76
30.
5%71
90.
4%67
70.
4%63
60.
4%-1
8.4%
-143
Farm
523
0.4%
503
0.4%
478
0.3%
449
0.3%
429
0.3%
416
0.2%
406
0.2%
-22.
4%-1
17
129,
611
141,
808
148,
575
154,
978
161,
722
169,
440
176,
761
36.4
%47
,150
His
toric
al C
ompa
rison
1990
2000
2000
2010
107,
226
113,
412
5.8%
6,18
611
3,41
212
9,61
114
.3%
16,1
99
9.3%
Job
Gro
wth
15,0
39 jo
bs
Sou
rce:
Leh
igh
Val
ley
Pla
nnin
g C
omm
issi
on, R
EM
I Pi+
Mod
el, J
une
20129.4%
Job
Gro
wth
18,9
64 jo
bs
8.9%
Job
Gro
wth
13,1
47 jo
bs

18
109,666 deaths leading to a population decrease of 3,795 persons. However, since migration into Northampton County is greater than migration into Lehigh County, the difference in net growth is not as large. Lehigh County’s net growth is projected to be 119,935 compared to Northampton County’s 106,238; a difference of 13,697.
Table 8 shows the change in the number of jobs by sector by county. Both counties gain thousands of jobs in various sectors but the health care sector will see the most robust growth.
Table 9 shows the comparison of the percentage change in job growth between 2010 and 2040 between counties, the Lehigh Valley and the United States. Generally, the Lehigh Valley economy will follow the trends of the national economy. However, in 11 of the 23 sectors, the percentage growth in the Lehigh Valley will be higher between now and 2040 than the United States. The rate of decline for manufacturing jobs in the Lehigh Valley (-2.5%) will be lower than the rate nationally (-7%).

19
TAB
LE 8
Cha
nge
in N
umbe
r of J
obs
by R
egio
nal G
eogr
aphy
2010
-204
0Le
high
Val
ley
Lehi
gh C
ount
yN
orth
ampt
on C
ount
y
Hea
lth C
are
and
Soc
ial A
ssis
tanc
e38
,817
Hea
lth C
are
and
Soc
ial A
ssis
tanc
e27
,930
Hea
lth C
are
and
Soc
ial A
ssis
tanc
e10
,888
Pro
fess
iona
l and
Tec
hnic
al S
ervi
ces
14,8
34P
rofe
ssio
nal a
nd T
echn
ical
Ser
vice
s9,
649
Con
stru
ctio
n6,
013
Con
stru
ctio
n13
,866
Con
stru
ctio
n7,
853
Sta
te a
nd L
ocal
Gov
ernm
ent
5,53
4
Sta
te a
nd L
ocal
Gov
ernm
ent
12,8
53A
dmin
istra
tive
and
Was
te S
ervi
ces
7,49
8P
rofe
ssio
nal a
nd T
echn
ical
Ser
vice
s5,
185
Adm
inis
trativ
e an
d W
aste
Ser
vice
s10
,336
Sta
te a
nd L
ocal
Gov
ernm
ent
7,31
9O
ther
Ser
vice
s, e
xcep
t Pub
lic A
dmin
istra
tion
3,03
5
Acc
omm
odat
ion
and
Food
Ser
vice
s7,
872
Acc
omm
odat
ion
and
Food
Ser
vice
s4,
845
Acc
omm
odat
ion
and
Food
Ser
vice
s3,
027
Oth
er S
ervi
ces,
exc
ept P
ublic
Adm
inis
tratio
n7,
320
Oth
er S
ervi
ces,
exc
ept P
ublic
Adm
inis
tratio
n4,
285
Adm
inis
trativ
e an
d W
aste
Ser
vice
s2,
837
Tran
spor
tatio
n an
d W
areh
ousi
ng6,
515
Tran
spor
tatio
n an
d W
areh
ousi
ng3,
850
Tran
spor
tatio
n an
d W
areh
ousi
ng2,
665
Edu
catio
nal S
ervi
ces
4,49
9R
eal E
stat
e an
d R
enta
l and
Lea
sing
2,32
9E
duca
tiona
l Ser
vice
s2,
617
Ret
ail T
rade
3,85
0R
etai
l Tra
de2,
267
Ret
ail T
rade
1,58
3
Rea
l Est
ate
and
Ren
tal a
nd L
easi
ng3,
693
Arts
, Ent
erta
inm
ent,
and
Rec
reat
ion
1,98
6A
rts, E
nter
tain
men
t, an
d R
ecre
atio
n1,
424
Arts
, Ent
erta
inm
ent,
and
Rec
reat
ion
3,41
0E
duca
tiona
l Ser
vice
s1,
882
Rea
l Est
ate
and
Ren
tal a
nd L
easi
ng1,
364
Fina
nce
and
Insu
ranc
e2,
913
Fina
nce
and
Insu
ranc
e1,
860
Fina
nce
and
Insu
ranc
e1,
053
Man
agem
ent o
f Com
pani
es a
nd E
nter
pris
es1,
976
Man
agem
ent o
f Com
pani
es a
nd E
nter
pris
es1,
723
Man
agem
ent o
f Com
pani
es a
nd E
nter
pris
es25
3
Who
lesa
le T
rade
697
Who
lesa
le T
rade
504
Who
lesa
le T
rade
193
Fore
stry
/Fis
hing
249
Fore
stry
/Fis
hing
203
Info
rmat
ion
130
Min
ing
-60
Min
ing
-81
Fore
stry
/Fis
hing
46
Fede
ral C
ivili
an-1
94Fe
dera
l Civ
ilian
-90
Min
ing
21
Farm
-269
Farm
-152
Fede
ral C
ivili
an-1
04
Fede
ral M
ilita
ry-3
17Fe
dera
l Mili
tary
-174
Farm
-117
Info
rmat
ion
-331
Util
ities
-218
Fede
ral M
ilita
ry-1
43
Util
ities
-411
Info
rmat
ion
-461
Man
ufac
turin
g-1
61
Man
ufac
turin
g-7
04M
anuf
actu
ring
-543
Util
ities
-193
Tota
l Job
Cha
nge
131,
414
Tota
l Job
Cha
nge
84,2
64To
tal J
ob C
hang
e47
,150
Sour
ce:L
ehig
h V
alle
y P
lann
ing
Com
mis
sion
, RE
MI P
i+ M
odel
, Jun
e 20
12

20
TAB
LE 9
Perc
ent C
hang
e in
Job
s by
Sec
tor b
y G
eogr
aphy
2010
-204
0Le
high
Cou
nty
Nor
tham
pton
Cou
nty
Lehi
gh V
alle
yU
nite
d St
ates
Fore
stry
, Fis
hing
, Rel
ated
Act
iviti
es, a
nd O
ther
44.2
%45
.1%
44.5
%40
.2%
Min
ing
-23.
5%10
.9%
-11.
3%-1
9.2%
Util
ities
-41.
1%-4
7.9%
-44.
0%-3
2.8%
Con
stru
ctio
n84
.1%
88.4
%85
.9%
75.7
%M
anuf
actu
ring
-3.5
%-1
.3%
-2.5
%-7
.0%
Who
lesa
le T
rade
5.3%
5.3%
5.3%
6.4%
Ret
ail T
rade
9.7%
10.9
%10
.2%
11.7
%Tr
ansp
orta
tion
and
War
ehou
sing
45.7
%47
.3%
46.3
%45
.7%
Info
rmat
ion
-13.
5%7.
4%-6
.4%
-0.8
%Fi
nanc
e an
d In
sura
nce
16.5
%15
.2%
16.0
%17
.6%
Rea
l Est
ate
and
Ren
tal a
nd L
easi
ng29
.8%
27.5
%28
.9%
30.2
%P
rofe
ssio
nal a
nd T
echn
ical
Ser
vice
s88
.2%
80.2
%85
.2%
72.3
%M
anag
emen
t of C
ompa
nies
and
Ent
erpr
ises
20.4
%19
.2%
20.2
%20
.2%
Adm
inis
trativ
e an
d W
aste
Ser
vice
s44
.7%
36.3
%42
.0%
43.5
%E
duca
tiona
l Ser
vice
s38
.2%
38.8
%38
.5%
38.3
%H
ealth
Car
e an
d S
ocia
l Ass
ista
nce
72.7
%82
.3%
75.2
%79
.1%
Arts
, Ent
erta
inm
ent,
and
Rec
reat
ion
39.4
%42
.1%
40.5
%38
.1%
Acc
omm
odat
ion
and
Food
Ser
vice
s36
.4%
34.7
%35
.7%
32.8
%O
ther
Ser
vice
s, e
xcep
t Pub
lic A
dmin
istra
tion
40.2
%39
.4%
39.9
%36
.7%
Sta
te a
nd L
ocal
Gov
ernm
ent
42.2
%39
.1%
40.8
%37
.7%
Fede
ral C
ivili
an-8
.7%
-8.6
%-8
.6%
-8.6
%Fe
dera
l Mili
tary
-18.
3%-1
8.4%
-18.
3%-1
8.3%
Farm
-22.
5%-2
2.4%
-22.
4%-2
2.4%
Sour
ce:
Leh
igh
Val
ley
Pla
nnin
g C
omm
issi
on, R
EM
I Pi+
Mod
el, J
une
2012

21
LEHIGH VALLEY INDUSTRY SECTOR DETAILS
Listed below are the summaries for the 70 industry segments of the Lehigh Valley shown on Table 10.1 through 10.23. Analyzing industries by segment provides even greater detail in which specific segments of the Lehigh Valley economy will gain and lose jobs between 2010 and 2040. Historical data by industry is provided from 2001-2010 to illustrate whether trends of job loss or gain will continue over time.
Forestry, Fishing, Related Activities, and Other
The Agriculture, Forestry, Fishing and Hunting sector is comprised of establishments primarily engaged in growing crops, raising animals, harvesting timber, and harvesting fish and other animals from a farm, ranch, or their natural habitats. The establishments in this sector are often described as farms, ranches, dairies, greenhouses, nurseries, orchards, or hatcheries.
Mining
The Mining sector is comprised of establishments that extract naturally occurring mineral solids, such as coal and ores; liquid minerals, such as crude petroleum; and gases, such as natural gas. The term mining is used in the broad sense to include quarrying, well operations, beneficiating (e.g., crushing, screening, washing, and flotation), and other preparation customarily performed at the mine site, or as a part of mining activity. The Lehigh Valley has an existing concentration of gravel and quarrying operations. Demand will increase for nonmetallic minerals such as granite and gravel and other materials used in residential and nonresidential construction as construction activity increases during the forecast period.
TABLE 10.01LEHIGH VALLEY - Historical 2001 2010 # Change % Change
Forestry 456 559 103 22.6%Forestry and logging; Fishing, hunting, and trapping 269 31 -238 -88.5%Agriculture and forestry support activities; Other 187 528 341 182.4%
LEHIGH VALLEY - Forecast 2010 2040 # Change % ChangeForestry 559 808 249 44.5%
Forestry and logging; Fishing, hunting, and trapping 31 39 8 25.8%Agriculture and forestry support activities; Other 528 769 241 45.6%
TABLE 10.02LEHIGH VALLEY - Historical 2001 2010 # Change % Change
Mining 422 542 120 28.4%Oil and gas extraction 144 154 10 6.9%Mining (except oil and gas) 278 364 86 30.9%Support activities for mining 0 24 24 0.0%
LEHIGH VALLEY - Forecast 2010 2040 # Change % ChangeMining 542 482 -60 -11.1%
Oil and gas extraction 154 36 -118 -76.6%Mining (except oil and gas) 364 409 45 12.4%Support activities for mining 24 37 13 54.2%

22
Utilities
The Utilities sector is comprised of establishments engaged in the provision of the following utility services: electric power, natural gas, steam supply, water supply, and sewage removal. Within this sector, the specific activities associated with the utility services provided vary by utility: electric power includes generation, transmission, and distribution; natural gas includes distribution; steam supply includes provision and/or distribution; water supply includes treatment and distribution; and sewage removal includes collection, treatment, and disposal of waste through sewer systems and sewage treatment facilities.
Please note that this sector does not include the employees involved in the management of utility companies as those employees are allocated in the management of companies and enterprises industry sector. The utility sector includes only the employees involved in the production or provision of a utility such as power line repair and installation, meter readers, and mechanics and technicians that maintain the specific utility, regardless of power source (electricity or gas) or function (water, sewer or energy production).
According to the Bureau of Labor Statistics, increased competition, conservation, improved equipment and appliances, technological advancements and more efficient power plants will require fewer employees in this industry in the future.
Construction
The Construction sector is comprised of establishments primarily engaged in the construction of buildings or engineering projects (e.g., highways and utility systems). Establishments primarily engaged in the preparation of sites for new construction and establishments primarily engaged in subdividing land for sale as building sites also are included in this sector. The expansive growth of construction trade jobs is forecast in part due to the rise in population. It should be noted that while there is expansive growth in this sector it does not immediately reveal future housing bubbles that the Lehigh Valley has experienced in the mid 2000s as shown in Table 1 when the local economy added and then sharply decreased the number of construction jobs. A housing bubble would be readily identified examining the diversity of jobs in Table 5, looking at the percentage of share the construction sector had of all jobs. The model suggests the market share will fluctuate between 4.6-6.3% of all jobs in the local economy which is in line with BEA data that states in a “normal” economy, construction jobs nationally account for 5.7% of all jobs in the economy. The model suggests that the growth and number of construction jobs will outpace national estimates but is not forecasting any emerging housing bubbles.
TABLE 10.03LEHIGH VALLEY - Historical 2001 2010 # Change % Change
Utilities 3,051 934 -2,117 -69.4%LEHIGH VALLEY - Forecast 2010 2040 # Change % Change
Utilities 934 523 -411 -44.0%
TABLE 10.04LEHIGH VALLEY - Historical 2001 2010 # Change % Change
Construction 17,662 16,139 -1,523 -8.6%LEHIGH VALLEY - Forecast 2010 2040 # Change % Change
Construction 16,138 30,004 13,866 85.9%

23
Manufacturing
The Manufacturing sector is comprised of establishments engaged in the mechanical, physical, or chemical transformation of materials, substances, or components into new products. Establishments in the manufacturing sector are often described as plants, factories, or mills and characteristically use power-driven machines and materials-handling equipment. However, establishments that
TABLE 10.05LEHIGH VALLEY - Historical 2001 2010 # Change % Change
Manufacturing 47,580 28,229 -19,351 -40.7%Wood product manufacturing 872 421 -451 -51.7%Nonmetallic mineral product manufacturing 2,033 1,917 -116 -5.7%Primary metal manufacturing 1,909 1,279 -630 -33.0%Fabricated metal product manufacturing 3,219 2,834 -385 -12.0%Machinery manufacturing 2,731 2,224 -507 -18.6%Computer and electronic product manufacturing 5,519 945 -4,574 -82.9%Electrical equipment and appliance manufacturing 1,736 1,911 175 10.1%Motor vehicles, bodies & trailers, and parts manufacturing 1,249 658 -591 -47.3%Other transportation equipment manufacturing 1,001 722 -279 -27.9%Furniture and related product manufacturing 983 791 -192 -19.5%Miscellaneous manufacturing 4,473 3,257 -1,216 -27.2%Food manufacturing 3,236 2,572 -664 -20.5%Beverage and tobacco product manufacturing 1,315 1,594 279 21.2%Textile mills 827 181 -646 -78.1%Textile product mills 1,020 270 -750 -73.5%Apparel manufacturing 2,819 1,384 -1,435 -50.9%Leather and allied product manufacturing 0 0 0 0.0%Paper manufacturing 890 710 -180 -20.2%Printing and related support activities 2,094 1,181 -913 -43.6%Petroleum and coal product manufacturing 220 85 -135 -61.4%Chemical manufacturing 7,084 1,647 -5,437 -76.8%Plastics and rubber product manufacturing 2,350 1,646 -704 -30.0%
LEHIGH VALLEY - Forecast 2010 2040 # Change % ChangeManufacturing 28,229 27,524 -705 -2.5%
Wood product manufacturing 421 370 -51 -12.1%Nonmetallic mineral product manufacturing 1,917 2,531 614 32.0%Primary metal manufacturing 1,279 774 -505 -39.5%Fabricated metal product manufacturing 2,834 2,926 92 3.2%Machinery manufacturing 2,224 2,219 -5 -0.2%Computer and electronic product manufacturing 945 825 -120 -12.7%Electrical equipment and appliance manufacturing 1,911 1,997 86 4.5%Motor vehicles, bodies & trailers, and parts manufacturing 658 348 -310 -47.1%Other transportation equipment manufacturing 722 771 49 6.8%Furniture and related product manufacturing 791 471 -320 -40.5%Miscellaneous manufacturing 3,257 3,758 501 15.4%Food manufacturing 2,572 2,429 -143 -5.6%Beverage and tobacco product manufacturing 1,594 1,787 193 12.1%Textile mills 181 85 -96 -53.0%Textile product mills 270 263 -7 -2.6%Apparel manufacturing 1,384 1,395 11 0.8%Leather and allied product manufacturing 0 0 0 0.0%Paper manufacturing 710 513 -197 -27.7%Printing and related support activities 1,181 653 -528 -44.7%Petroleum and coal product manufacturing 85 64 -21 -24.7%Chemical manufacturing 1,647 1,667 20 1.2%Plastics and rubber product manufacturing 1,646 1,678 32 1.9%

24
transform materials or substances into new products by hand or in the worker’s home and those engaged in selling to the general public products made on the same premises from which they are sold, such as bakeries, candy stores, and custom tailors, may also be included in this sector. Manufacturing establishments may process materials or may contract with other establishments to process their materials for them. Both types of establishments are included in manufacturing.
The area has already shed a large number of jobs in primary metal, computer, motor vehicle manufacturing and printing and this is a trend that is likely to continue due to foreign competition and technological advancements that require less people locally to manufacture products. This sector will see big gains in nonmetallic mineral product and beverage and food manufacturing that will offset other losses.
An explanation for the small amount of job loss is that the majority of local manufacturing jobs left the area over the last forty years, with considerable losses in the last decade (Table 1), which follows a national trend. The United States lost 41 percent of its manufacturing jobs between June 1979 when manufacturing employment peaked, and December 2009 when it reached its recent low point. Nationally, between 2000 and 2010, manufacturing’s share of total employment fell from 13.2 percent in January 2000 to 8.9 percent in December 2009.
Wholesale Trade
The Wholesale Trade sector is comprised of establishments engaged in wholesaling merchandise, generally without transformation, and rendering services incidental to the sale of merchandise. The merchandise described in this sector includes the outputs of agriculture, mining, manufacturing, and certain information industries, such as publishing. The wholesaling process is an intermediate step in the distribution of merchandise. Wholesalers are organized to sell or arrange the purchase or sale of (a) goods for resale (i.e., goods sold to other wholesalers or retailers), (b) capital or durable non-consumer goods, and (c) raw and intermediate materials and supplies used in production. Wholesalers sell merchandise to other businesses and normally operate from a warehouse or office. These warehouses and offices are characterized by having little or no display of merchandise. In addition, neither the design nor the location of the premises is intended to solicit walk-in traffic.
Retail Trade
The Retail Trade sector is comprised of establishments engaged in retailing merchandise, generally without transformation, and rendering services incidental to the sale of merchandise. The retailing process is the final step in the distribution of merchandise; retailers are, therefore, organized to sell merchandise in small quantities to the general public. This sector comprises two main types of retailers: store and non-store retailers.
TABLE 10.06LEHIGH VALLEY - Historical 2001 2010 # Change % Change
Wholesale Trade 11,381 13,095 1,714 15.1%LEHIGH VALLEY - Forecast 2010 2040 # Change % Change
Wholesale Trade 13,095 13,792 697 5.3%

25
Store retailers operate fixed point-of-sale locations, located and designed to attract a high volume of walk-in customers. In general, retail stores have extensive displays of merchandise and use mass-media advertising to attract customers. They typically sell merchandise to the general public for personal or household consumption, but some also serve business and institutional clients. In addition to retailing merchandise, some types of store retailers are also engaged in the provision of after-sales services, such as repair and installation.
Non-store retailers, like store retailers, are organized to serve the general public, but their retailing methods differ. The establishments of this subsector reach customers and market merchandise with methods such as the broadcasting of “infomercials,” the broadcasting and publishing of direct-response advertising, the publishing of paper and electronic catalogs, door-to-door solicitation, in-home demonstration, selling from portable stalls (street vendors, except food), and distribution through vending machines. This industry sees plenty of turnover with workers entering and leaving the industry, which means there will be a large number of job openings. This job growth combined with the large size of the occupation should result in employment opportunities.
Transportation and Warehousing
The Transportation and Warehousing sector includes industries providing transportation of passengers and cargo, warehousing and storage for goods, scenic and sightseeing transportation, and support activities related to modes of transportation. Establishments in these industries use transportation equipment or transportation related facilities as a productive asset. The type of equipment depends on the mode of transportation. The modes of transportation are air, rail,
TABLE 10.07LEHIGH VALLEY - Historical 2001 2010 # Change % Change
Retail Trade 37,255 37,855 600 1.6%LEHIGH VALLEY - Forecast 2010 2040 # Change % Change
Retail Trade 37,855 41,705 3,850 10.2%
TABLE 10.08LEHIGH VALLEY - Historical 2001 2010 # Change % Change
Transportation and Warehousing 11,042 14,057 3,015 27.3%Air transportation 512 235 -277 -54.1%Rail transportation 390 310 -80 -20.5%Water transportation 7 0 -7 0.0%Truck transportation; Couriers and messengers 4,651 5,777 1,126 24.2%Transit and ground passenger transportation 1,805 2,007 202 11.2%Pipeline transportation 155 161 6 3.9%Scenic and sightseeing transportation; support activities 221 633 412 186.4%Warehousing and storage 3,301 4,934 1,633 49.5%
LEHIGH VALLEY - Forecast 2010 2040 # Change % ChangeTransportation and Warehousing 14,057 20,573 6,516 46.4%
Air transportation 235 279 44 18.7%Rail transportation 310 338 28 9.0%Water transportation 0 0 0 0.0%Truck transportation; Couriers and messengers 5,777 8,207 2,430 42.1%Transit and ground passenger transportation 2,007 2,688 681 33.9%Pipeline transportation 161 109 -52 -32.3%Scenic and sightseeing transportation; support activities 633 1,181 548 86.6%Warehousing and storage 4,934 7,771 2,837 57.5%

26
water, road, and pipeline. Truck transportation is the most widely used method of hauling freight within the United States and trucks transport nearly all components and finished goods during some point in the supply chain of a product. Further, the Lehigh Valley already has a sizeable transportation and warehousing industry sector employing thousands of people along Interstate 78, Route 33 and in the cities of Allentown and Bethlehem. The region is within a one-day truck drive of one-third of the U.S. market and one-half of the Canadian market. Norfolk Southern provides mainline railroad freight service in the country. A major classification yard is located in Allentown. Intermodal terminals in Salisbury Township and Bethlehem serve the Lehigh Valley area. Employment in trucking generally follows the larger business cycle. As orders for goods and shipments fluctuate, there will be accompanying gains and losses in the demand for freight services.
Information
The Information sector is comprised of establishments engaged in the following processes: (a) producing and distributing information and cultural products, (b) providing the means to transmit or distribute these products as well as data or communications, and (c) processing data. The main components of this sector are the publishing industries, including software publishing, and both traditional publishing and publishing exclusively on the Internet; the motion picture and sound recording industries; the broadcasting industries, including traditional broadcasting and those broadcasting exclusively over the Internet; the telecommunications industries; Web search portals, data processing industries, and the information services industries.
Finance and Insurance
The Finance and Insurance sector is comprised of establishments primarily engaged in financial transactions (transactions involving the creation, liquidation, or change in ownership of financial assets) and/or in facilitating financial transactions. Three principal types of activities are identified:
□ Raising funds by taking deposits and/or issuing securities and, in the process, incurring liabilities. Establishments engaged in this activity use raised funds to acquire financial assets by making loans and/or purchasing securities. Putting themselves at risk, they channel funds from lenders to borrowers and transform or repackage the funds with respect to maturity, scale, and risk. This activity is known as financial intermediation.
TABLE 10.09LEHIGH VALLEY - Historical 2001 2010 # Change % Change
Information 8,470 5,142 -3,328 -39.3%Publishing industries, except Internet 2,837 1,610 -1,227 -43.2%Motion picture, video, and sound recording industries 341 265 -76 -22.3%Internet publishing and broadcasting 1,434 1,301 -133 -9.3%Broadcasting, except Internet; Telecommunications 3,858 1,966 -1,892 -49.0%
LEHIGH VALLEY - Forecast 2010 2040 # Change % ChangeInformation 5,142 4,814 -328 -6.4%
Publishing industries, except Internet 1,610 1,356 -254 -15.8%Motion picture, video, and sound recording industries 265 347 82 30.9%Internet publishing and broadcasting 1,301 1,635 334 25.7%Broadcasting, except Internet; Telecommunications 1,966 1,476 -490 -24.9%

27
□ Pooling of risk by underwriting insurance and annuities. Establishments engaged in this activity collect fees, insurance premiums, or annuity considerations; build up reserves; invest those reserves; and make contractual payments. Fees are based on the expected incidence of the insured risk and the expected return on investment.
□ Providing specialized services facilitating or supporting financial intermediation, insurance, and employee benefit programs. In addition, monetary authorities charged with monetary control are included in this sector. Demand in the industry will rise as the number of people reaching retirement age seek advice on retirement and health care options.
Real Estate and Rental and Leasing
The Real Estate and Rental and Leasing sector is comprised of establishments primarily engaged in renting, leasing, or otherwise allowing the use of tangible or intangible assets, and establishments providing related services. The major portion of this sector is comprised of establishments that rent, lease, or otherwise allow the use of their own assets by others. The assets may be tangible, as is the case of real estate and equipment, or intangible, as is the case with patents and trademarks.
This sector also includes establishments primarily engaged in managing real estate for others, selling, renting and/or buying real estate for others, and appraising real estate.
Professional and Technical Services
The Professional, Scientific, and Technical Services sector is comprised of establishments that specialize in performing professional, scientific, and technical activities for others. These activities require a high degree of expertise and training. The establishments in this sector specialize
TABLE 10.10LEHIGH VALLEY - Historical 2001 2010 # Change % Change
Finance and Insurance 15,437 18,207 2,770 17.9%Monetary authorities 3,862 4,798 936 24.2%Securities, commodity contracts, investments 1,891 2,951 1,060 56.1%Insurance carriers and related activities 9,684 10,458 774 8.0%
LEHIGH VALLEY - Forecast 2010 2040 # Change % ChangeFinance and Insurance 18,207 21,119 2,912 16.0%
Monetary authorities 4,798 5,162 364 7.6%Securities, commodity contracts, investments 2,951 4,251 1,300 44.1%Insurance carriers and related activities 10,458 11,706 1,248 11.9%
TABLE 10.11LEHIGH VALLEY - Historical 2001 2010 # Change % Change
Real Estate 9,708 12,779 3,071 31.6%Real estate 8,252 11,602 3,350 40.6%Rental and leasing services 1,456 1,177 -279 -19.2%
LEHIGH VALLEY - Forecast 2010 2040 # Change % ChangeReal Estate 12,779 16,473 3,694 28.9%
Real estate 11,602 15,181 3,579 30.8%Rental and leasing services 1,177 1,292 115 9.8%

28
according to expertise and provide these services to clients in a variety of industries and, in some cases, to households. Activities performed include: legal advice and representation; accounting, bookkeeping, and payroll services; architectural, engineering, and specialized design services; computer services; consulting services; research services; advertising services; photographic services; translation and interpretation services; veterinary services; and other professional, scientific, and technical services.
Management of Companies and Enterprises
The Management of Companies and Enterprises sector is comprised of (1) establishments that hold the securities of (or other equity interests in) companies and enterprises for the purpose of owning a controlling interest or influencing management decisions or (2) establishments (except government establishments) that administer, oversee, and manage establishments of the company or enterprise and that normally undertake the strategic or organizational planning and decision making role of the company or enterprise. Establishments that administer, oversee, and manage may hold the securities of the company or enterprise.
Administrative and Waste Services
The Administrative and Support and Waste Management and Remediation Services sector is comprised of establishments performing routine support activities for the day-to-day operations of other organizations. These essential activities are often undertaken in-house by establishments in many sectors of the economy. The establishments in this sector specialize in one or more of these support activities and provide these services to clients in a variety of industries and, in some cases, to households. Activities performed include: office administration, hiring and placing of personnel, document preparation and similar clerical services, solicitation, collection, security and surveillance services, cleaning, and waste disposal services.
TABLE 10.12LEHIGH VALLEY - Historical 2001 2010 # Change % Change
Professional and Technical Services 14,081 17,412 3,331 23.7%LEHIGH VALLEY - Forecast 2010 2040 # Change % Change
Professional and Technical Services 17,412 32,246 14,834 85.2%
TABLE 10.13LEHIGH VALLEY - Historical 2001 2010 # Change % Change
Management of Companies and Enterprises 3,601 9,763 6,162 171.1%LEHIGH VALLEY - Forecast 2010 2040 # Change % Change
Management of Companies and Enterprises 9,763 11,739 1,976 20.2%
TABLE 10.14LEHIGH VALLEY - Historical 2001 2010 # Change % Change
Administrative and Waste Services 18,740 24,582 5,842 31.2%Administrative and support services 17,772 23,603 5,831 32.8%Waste management and remediation services 968 979 11 1.1%
LEHIGH VALLEY - Forecast 2010 2040 # Change % ChangeAdministrative and Waste Services 24,582 34,919 10,337 42.1%
Administrative and support services 23,603 33,581 9,978 42.3%Waste management and remediation services 979 1,338 359 36.7%

29
Educational Services
The Educational Services sector is comprised of establishments that provide instruction and training in a wide variety of subjects. This instruction and training is provided by specialized establishments, such as trade schools, colleges, universities, and training centers. These establishments may be privately owned and operated for profit or not for profit. They may also offer food and/or accommodation services to their students. Educational services are usually delivered by teachers or instructors. Instruction is imparted in diverse settings, such as educational institutions, the workplace, or the home, and through diverse means, such as correspondence, television, the Internet, or other electronic and distance-learning methods. This industry does not include employees of public school districts.
Health Care and Social Assistance
The Health Care and Social Assistance sector is comprised of establishments providing health care and social assistance for individuals. The sector includes both health care and social assistance because it is sometimes difficult to distinguish between the boundaries of these two activities. The industries in this sector are arranged on a continuum starting with those establishments providing medical care exclusively, continuing with those providing health care and social assistance, and finally finishing with those providing only social assistance.
Due to the aging of the region’s population, advances in medical technologies and the extension of life expectancies, health care and social assistance employment will be in very strong demand.The Lehigh Valley’s aging population will play a major role in shaping health care employment in coming decades. Health care use varies by age and gender, and as the Lehigh Valley’s demographics begin to shift, the health care demands of the region’s population will reflect those changes. Consider the following population forecasts:
□ In 2010, 27.7% of the Lehigh Valley population was 55 or older. It is projected that in 2040, 32.5% of the regional population will be 55 or older.
□ The number of people in the Lehigh Valley that are 55 or older will increase by 58.3% from 179,097 in 2010 to 283,648 in 2040.
□ In 2010, 15.2% of the Lehigh Valley population was 65 or older. It is projected that in 2040, 21.7% of the regional population will be 65 or older.
□ The number of people in the Lehigh Valley that are 65 or older will increase by 92.9% from 98,210 in 2010 to 189,444 in 2040.
TABLE 10.15LEHIGH VALLEY - Historical 2001 2010 # Change % Change
Educational Services 10,050 11,672 1,622 16.1%LEHIGH VALLEY - Forecast 2010 2040 # Change % Change
Educational Services 11,672 16,171 4,499 38.5%

30
□ In 2010, 7.8% of the Lehigh Valley population was 75 or older. It is projected that in 2040, 12.0% of the regional population will be 75 or older. However, the number of people in the Lehigh Valley that are 75 or older will more than double, increasing by 107.6% from 50,439 in 2010 to 104,704 in 2040.
Ambulatory health care service includes offices of health practitioners, which can include offices of physicians, dentists, chiropractors, optometrists, etc., and is expected to be one of the industries with the largest employment gains in the health care industry. Technological advances, cost pressures, and the increased number of people 65 years and older seeking medical care will shift services from inpatient facilities to the offices of health practitioners.
The increasing population of elderly people seeking to maintain some level of independence and improvements in technology allowing younger patients shorter rehabilitation stays will drive growth in the nursing and residential care facilities industry.
Hospitals have a large employment base, however, so the growth in jobs remains significant. The shift of services from hospitals, which are more expensive, to lower cost outpatient or home health services will slow the growth rate in hospital employment relative to other health care services.
Arts, Entertainment and Recreation
The Arts, Entertainment, and Recreation sector includes a wide range of establishments that operate facilities or provide services to meet varied cultural, entertainment, and recreational interests of their patrons. This sector is comprised of (1) establishments that are involved in producing, promoting, or participating in live performances, events, or exhibits intended for public viewing; (2) establishments that preserve and exhibit objects and sites of historical, cultural, or educational interest; and (3) establishments that operate facilities or provide services that enable patrons to participate in recreational activities or pursue amusement, hobby, and leisure-time interests. Dorney Park, the Lehigh Valley Iron Pigs and the Sands Casino/Resort already contribute jobs to this industry sector of the local economy. With the arena in Allentown currently under construction that will be home to a minor league hockey franchise and also serve as a performing arts facility, the regional economy will have at least four major employers in this industry sector in the future.
TABLE 10.16LEHIGH VALLEY - Historical 2001 2010 # Change % Change
Health Care and Social Assistance 38,828 51,631 12,803 33.0%Ambulatory health care services 14,764 20,232 5,468 37.0%Hospitals 11,441 14,621 3,180 27.8%Nursing and residential care facilities 8,405 9,797 1,392 16.6%Social assistance 4,218 6,981 2,763 65.5%
LEHIGH VALLEY - Forecast 2010 2040 # Change % ChangeHealth Care and Social Assistance 51,631 90,448 38,817 75.2%
Ambulatory health care services 20,232 41,465 21,233 104.9%Hospitals 14,621 19,817 5,196 35.5%Nursing and residential care facilities 9,797 17,616 7,819 79.8%Social assistance 6,981 11,550 4,569 65.4%

31
Accommodation and Food Services
The Accommodation and Food Services sector is comprised of establishments providing customers with lodging and/or preparing meals, snacks, and beverages for immediate consumption. The sector includes both accommodation and food services establishments because the two activities are often combined at the same establishment. Job growth is expected to be concentrated in food services and drinking places, reflecting an increase in the population and the growing trend of income being spent on food away from the home, i.e. people dining out more often.
Other Services (except Public Administration)
The Other Services (except Public Administration) sector is comprised of establishments engaged in providing services not specifically provided for elsewhere in the classification system. Establishments in this sector are primarily engaged in activities such as equipment and machinery repairing, promoting or administering religious activities, providing dry cleaning and laundry services, personal care services, death care services, pet care services, photofinishing services, temporary parking services, etc.
TABLE 10.17LEHIGH VALLEY - Historical 2001 2010 # Change % Change
Arts, Entertainment and Recreation 5,893 8,426 2,533 43.0%Performing arts and spectator sports 2,076 3,805 1,729 83.3%Museums, historical sites, zoos, and parks 320 459 139 43.4%Amusement, gambling, and recreation 3,497 4,162 665 19.0%
LEHIGH VALLEY - Forecast 2010 2040 # Change % ChangeArts, Entertainment and Recreation 8,426 11,837 3,411 40.5%
Performing arts and spectator sports 3,805 5,723 1,918 50.4%Museums, historical sites, zoos, and parks 459 797 338 73.6%Amusement, gambling, and recreation 4,162 5,317 1,155 27.8%
TABLE 10.18LEHIGH VALLEY - Historical 2001 2010 # Change % Change
Accommodation and Food Services 17,945 22,039 4,094 22.8%Accommodation 1,222 1,688 466 38.1%Food services and drinking places 16,723 20,351 3,628 21.7%
LEHIGH VALLEY - Forecast 2010 2040 # Change % ChangeAccommodation and Food Services 22,039 29,911 7,872 35.7%
Accommodation 1,688 1,953 265 15.7%Food services and drinking places 20,351 27,958 7,607 37.4%
TABLE 10.19LEHIGH VALLEY - Historical 2001 2010 # Change % Change
Other services (except Public Administration) 18,905 18,357 -548 -2.9%Repair and maintenance 5,137 5,156 19 0.4%Personal and laundry services 6,028 5,034 -994 -16.5%Membership associations and organizations 5,936 6,067 131 2.2%Private households 1,804 2,100 296 16.4%
LEHIGH VALLEY - Forecast 2010 2040 # Change % ChangeOther services (except Public Administration) 18,357 25,677 7,320 39.9%
Repair and maintenance 5,156 6,534 1,378 26.7%Personal and laundry services 5,034 7,809 2,775 55.1%Membership associations and organizations 6,067 8,600 2,533 41.8%Private households 2,100 2,734 634 30.2%

32
Local and State Government
The local and state government sector includes state and municipal employees (borough, township, city and all municipal authorities) and employees of public school districts. Decreasing revenue streams and budget shortfalls have led to hiring freezes, unpaid furloughs, and in many cases, layoffs of local and state government employees locally and across the country. How the continued economic downturn affects projected growth in local and state government jobs is unknown. The largest factors affecting state and local government employment historically are population growth and the health of the underlying economies that produce the government revenues.
Federal Civilian Government
Federal government employment, including jobs in the Postal Service, is expected to decline as officials work to reduce the budget deficits and curb government spending. The widespread use of the Internet and a decrease in the circulation of advertisements and magazines require customers to use fewer services provided by the Postal Service.
Federal Military
This sector is comprised of government establishments of the Armed Forces, including the National Guard, primarily engaged in national security and related activities.
TABLE 10.20LEHIGH VALLEY - Historical 2001 2010 # Change % Change
Government 26,901 31,523 4,622 17.2%State and Local 26,901 31,523 4,622 17.2%
LEHIGH VALLEY - Forecast 2010 2040 # Change % ChangeGovernment 31,523 44,376 12,853 40.8%
State and Local 31,523 44,376 12,853 40.8%
TABLE 10.21LEHIGH VALLEY - Historical 2001 2010 # Change % Change
Government 2,253 2,246 -7 -0.3%Federal Civilian 2,253 2,246 -7 -0.3%
LEHIGH VALLEY - Forecast 2010 2040 # Change % ChangeGovernment 2,246 2,052 -194 -8.6%
Federal Civilian 2,246 2,052 -194 -8.6%
TABLE 10.22LEHIGH VALLEY - Historical 2001 2010 # Change % Change
Government 1,933 1,729 -204 -10.6%Federal Military 1,933 1,729 -204 -10.6%
LEHIGH VALLEY - Forecast 2010 2040 # Change % ChangeGovernment 1,729 1,412 -317 -18.3%
Federal Military 1,729 1,412 -317 -18.3%

33
Farming
The Farming sector is comprised of 1) establishments, such as farms, orchards, groves, greenhouses, and nurseries, primarily engaged in growing crops, plants, vines, or trees and their seeds and 2) establishments, such as ranches, farms, and feedlots primarily engaged in keeping, grazing, breeding, or feeding animals. These animals are kept for the products they produce or for eventual sale. Technological and mechanical advancements provide farmers with the continuing ability to produce more output with fewer workers required.
TABLE 10.23LEHIGH VALLEY - Historical 2001 2010 # Change % Change
Farm 1,579 1,199 -380 -24.1%
LEHIGH VALLEY - Forecast 2010 2040 # Change % ChangeFarm 1,199 930 -269 -22.4%

34
SECTION TWO: LEHIGH VALLEY OCCUPATIONAL FORECAST AND ANALYSIS
The REMI model not only forecasts employment by industry but also by specifi c occupation. Table 11 shows the top ten occupations by change in jobs for the Lehigh Valley. Occupa tions that normally grow with the population in general, such as social workers, retail clerks and police offi cers, usually grow at the average rate for all occupations. By contrast, occupa tions that meet the demand of changing demographics will grow or shrink on the basis of population forecasts for that group. The demand for teachers, for example, is correlated with forecasts of enrollments of school-age children and the demand for police offi cers is correlated with population growth
In the coming decade, the trend with the most implications for occupational change is the aging of the population. The 55-years-and-older age group consumes signifi cantly more health care and social assistance services than any other age group. The aging population that will require more health care and continued advances in medical technology are the major causes of rapid growth among health-related occupations. Job growth, however, may be limited by efforts to control the growth of spending on health care to restrict increases in Medicare and Medicaid reimbursements. These efforts to control health care costs may stimulate the growth of some health care occupations (aides, assistants and technicians), as they assume some duties formerly performed by highly paid health care workers, such as dentists, physicians and therapists. As a result, these occupations will grow even more than overall health care employment and other highly paid health care occupations. Occupations that will experience loss are in industry sectors that will experience overall job loss due to continued foreign competition and technological advancements.
The retirement of people in the baby boomer generation will not only have a substantial impact on growth oriented job openings in industries such as health care but also replacing them across the entire job market as they retire.
Employers with older, retiring workforces will also have to replace baby-boomers exiting occupa-tions critical to their business operations. From 2010-2040, there is expected high demand for re-placement employees in occupations such as business operations specialists (5,097 jobs), computer specialists (4,402 jobs), financial specialists (3,307 jobs) and management (2,223 jobs). Nationally, according to the BLS, there are expected to be numerous industries that may require such replace-ment workers over a number of occupations. Sectors of manufacturing, utilities, wholesale trade, transportation and warehousing, insurance, real estate, educational services, health care and public administration are industries that employed a significantly above-average share of baby-boomer employees nationally in 2010.
Table 12 lists a sample of 91 occupations contained in the REMI model with the changes in those occupations for both counties and the Lehigh Valley. This list is not inclusive of all possible occupations that are in the local economy. Red text denotes occupations with 50% or more growth during the forecast period.

35
TAB
LE 1
1To
p Te
n O
ccup
atio
ns b
y C
hang
e in
Job
s Le
high
and
Nor
tham
pton
Cou
ntie
s20
10-2
040
Occ
upat
ion
% C
hang
eO
ccup
atio
n#
Cha
nge
Occ
upat
iona
l and
phy
sica
l the
rapi
st a
ssis
tant
s an
d ai
des
110.
2%H
ealth
dia
gnos
ing
and
treat
ing
prac
titio
ners
9,18
9N
ursi
ng, p
sych
iatri
c, a
nd h
ome
heal
th a
ides
99.1
%C
onst
ruct
ion
trade
s an
d re
late
d w
orke
rs7,
804
Hel
pers
, con
stru
ctio
n tra
des
89.1
%N
ursi
ng, p
sych
iatri
c, a
nd h
ome
heal
th a
ides
7,67
0O
ther
hea
lthca
re s
uppo
rt oc
cupa
tions
86.0
%Fo
od a
nd b
ever
age
serv
ing
wor
kers
5,46
6P
erso
nal a
ppea
ranc
e w
orke
rs83
.9%
Hea
lth te
chno
logi
sts
and
tech
nici
ans
5,31
7S
uper
viso
rs, c
onst
ruct
ion
and
extra
ctio
n w
orke
rs79
.3%
Bus
ines
s op
erat
ions
spe
cial
ists
5,09
7O
ther
per
sona
l car
e an
d se
rvic
e w
orke
rs73
.6%
Oth
er p
erso
nal c
are
and
serv
ice
wor
kers
4,74
6H
ealth
dia
gnos
ing
and
treat
ing
prac
titio
ners
72.7
%In
form
atio
n an
d re
cord
cle
rks
4,67
9C
onst
ruct
ion
trade
s an
d re
late
d w
orke
rs70
.1%
Sec
reta
ries
and
adm
inis
trativ
e as
sist
ants
4,57
6Li
fe s
cien
tists
69.7
%C
ompu
ter s
peci
alis
ts4,
402
Prin
ting
occu
patio
ns-2
2.3%
Prin
ting
occu
patio
ns-1
67C
omm
unic
atio
ns e
quip
men
t ope
rato
rs-1
6.6%
Com
mun
icat
ions
equ
ipm
ent o
pera
tors
-80
Woo
dwor
kers
-7.9
%W
oodw
orke
rs-3
5M
etal
wor
kers
and
pla
stic
wor
kers
-0.6
%M
etal
wor
kers
and
pla
stic
wor
kers
-25
Agr
icul
tura
l wor
kers
-0.1
%A
gric
ultu
ral w
orke
rs-1
Fish
ing
and
hunt
ing
wor
kers
0.0%
Fish
ing
and
hunt
ing
wor
kers
0Te
xtile
, app
arel
, and
furn
ishi
ngs
occu
patio
ns2.
7%S
uper
viso
rs, f
arm
ing,
fish
ing,
and
fore
stry
wor
kers
11S
uper
viso
rs, p
rodu
ctio
n w
orke
rs5.
3%Fo
rest
, con
serv
atio
n, a
nd lo
ggin
g w
orke
rs17
Food
pro
cess
ing
occu
patio
ns6.
4%W
ater
tran
spor
tatio
n oc
cupa
tions
43To
p ex
ecut
ives
10.6
%E
xtra
ctio
n w
orke
rs48
Sour
ce:
Lehi
gh V
alle
y P
lann
ing
Com
mis
sion
, RE
MI P
i+ M
odel
, Jun
e 20
12
Larg
est P
erce
ntag
e In
crea
se in
Num
ber o
f Job
sLa
rges
t Inc
reas
e in
Num
ber o
f Job
s
Larg
est P
erce
ntag
e D
ecre
ase
in N
umbe
r of J
obs
Larg
est D
ecre
ase
in N
umbe
r of J
obs

36
Lehi
gh C
ount
yN
orth
ampt
on C
ount
yLe
high
Val
ley
Occ
upat
ion
2010
2040
# C
hang
e%
Cha
nge
2010
2040
# C
hang
e%
Cha
nge
2010
2040
# C
hang
e%
Cha
nge
Top
exec
utiv
es3,
572
3,96
339
110
.9%
2,08
72,
296
209
10.0
%5,
659
6,25
960
010
.6%
Adv
ertis
ing,
mar
ketin
g, p
rom
otio
ns, p
ublic
rela
tions
, and
sal
es m
anag
ers
1,09
81,
494
396
36.1
%54
072
718
734
.6%
1,63
82,
221
583
35.6
%O
pera
tions
spe
cial
ties
man
ager
s2,
657
3,44
178
429
.5%
1,41
11,
798
387
27.4
%4,
068
5,23
91,
171
28.8
%O
ther
man
agem
ent o
ccup
atio
ns3,
582
4,99
61,
414
39.5
%2,
143
2,95
280
937
.8%
5,72
57,
948
2,22
338
.8%
Bus
ines
s op
erat
ions
spe
cial
ists
6,55
09,
781
3,23
149
.3%
3,86
25,
728
1,86
648
.3%
10,4
1215
,509
5,09
749
.0%
Fina
ncia
l spe
cial
ists
4,61
96,
788
2,16
947
.0%
2,56
73,
705
1,13
844
.3%
7,18
610
,493
3,30
746
.0%
Com
pute
r spe
cial
ists
5,26
88,
123
2,85
554
.2%
2,89
24,
439
1,54
753
.5%
8,16
012
,562
4,40
253
.9%
Mat
hem
atic
al s
cien
ce o
ccup
atio
ns21
331
310
046
.9%
123
177
5443
.9%
336
490
154
45.8
%A
rchi
tect
s, s
urve
yors
, and
car
togr
aphe
rs29
143
714
650
.2%
178
258
8044
.9%
469
695
226
48.2
%E
ngin
eers
2,01
72,
914
897
44.5
%1,
204
1,69
148
740
.4%
3,22
14,
605
1,38
443
.0%
Dra
fters
, eng
inee
ring,
and
map
ping
tech
nici
ans
1,09
01,
425
335
30.7
%68
086
418
427
.1%
1,77
02,
289
519
29.3
%Li
fe s
cien
tists
365
643
278
76.2
%23
537
514
059
.6%
600
1,01
841
869
.7%
Phy
sica
l sci
entis
ts38
257
018
849
.2%
257
357
100
38.9
%63
992
728
845
.1%
Soc
ial s
cien
tists
and
rela
ted
occu
patio
ns78
11,
302
521
66.7
%44
571
426
960
.4%
1,22
62,
016
790
64.4
%Li
fe, p
hysi
cal,
and
soci
al s
cien
ce te
chni
cian
s42
460
418
042
.5%
303
405
102
33.7
%72
71,
009
282
38.8
%C
ouns
elor
s, S
ocia
l wor
kers
1,55
52,
494
939
60.4
%80
41,
286
482
60.0
%2,
359
3,78
01,
421
60.2
%M
isce
llane
ous
com
mun
ity a
nd s
ocia
l ser
vice
spe
cial
ists
713
1,16
545
263
.4%
382
635
253
66.2
%1,
095
1,80
070
564
.4%
Rel
igio
us w
orke
rs90
31,
290
387
42.9
%69
797
728
040
.2%
1,60
02,
267
667
41.7
%La
wye
rs, j
udge
s, a
nd re
late
d w
orke
rs1,
012
1,45
444
243
.7%
654
933
279
42.7
%1,
666
2,38
772
143
.3%
Lega
l sup
port
wor
kers
685
1,04
536
052
.6%
433
632
199
46.0
%1,
118
1,67
755
950
.0%
Pos
tsec
onda
ry te
ache
rs66
495
529
143
.8%
853
1,23
738
445
.0%
1,51
72,
192
675
44.5
%P
rimar
y, s
econ
dary
, and
spe
cial
edu
catio
n te
ache
rs2,
212
3,14
493
242
.1%
2,48
43,
525
1,04
141
.9%
4,69
66,
669
1,97
342
.0%
Oth
er te
ache
rs a
nd in
stru
ctor
s58
490
732
355
.3%
576
906
330
57.3
%1,
160
1,81
365
356
.3%
Libr
aria
ns, c
urat
ors,
and
arc
hivi
sts
384
539
155
40.4
%35
848
412
635
.2%
742
1,02
328
137
.9%
Oth
er e
duca
tion,
trai
ning
, and
libr
ary
occu
patio
ns93
91,
267
328
34.9
%95
61,
291
335
35.0
%1,
895
2,55
866
335
.0%
Art
and
desi
gn o
ccup
atio
ns88
11,
184
303
34.4
%51
270
018
836
.7%
1,39
31,
884
491
35.2
%E
nter
tain
ers
and
perfo
rmer
s, s
ports
and
rela
ted
occu
patio
ns83
61,
181
345
41.3
%64
392
928
644
.5%
1,47
92,
110
631
42.7
%M
edia
and
com
mun
icat
ion
occu
patio
ns96
11,
317
356
37.0
%53
378
625
347
.5%
1,49
42,
103
609
40.8
%M
edia
and
com
mun
icat
ion
equi
pmen
t occ
upat
ions
294
364
7023
.8%
171
228
5733
.3%
465
592
127
27.3
%H
ealth
dia
gnos
ing
and
treat
ing
prac
titio
ners
9,79
516
,809
7,01
471
.6%
2,83
95,
014
2,17
576
.6%
12,6
3421
,823
9,18
972
.7%
Hea
lth te
chno
logi
sts
and
tech
nici
ans
5,95
29,
761
3,80
964
.0%
2,10
43,
612
1,50
871
.7%
8,05
613
,373
5,31
766
.0%
Oth
er h
ealth
care
pra
ctiti
oner
s an
d te
chni
cal o
ccup
atio
ns25
239
414
256
.3%
123
188
6552
.8%
375
582
207
55.2
%N
ursi
ng, p
sych
iatri
c, a
nd h
ome
heal
th a
ides
5,23
810
,334
5,09
697
.3%
2,49
95,
073
2,57
410
3.0%
7,73
715
,407
7,67
099
.1%
Occ
upat
iona
l and
phy
sica
l the
rapi
st a
ssis
tant
s an
d ai
des
340
706
366
107.
6%11
224
413
211
7.9%
452
950
498
110.
2%O
ther
hea
lthca
re s
uppo
rt oc
cupa
tions
3,02
45,
621
2,59
785
.9%
1,06
71,
989
922
86.4
%4,
091
7,61
03,
519
86.0
%Fi
rst-l
ine
supe
rvis
ors/
man
ager
s, p
rote
ctiv
e se
rvic
e w
orke
rs48
868
619
840
.6%
389
536
147
37.8
%87
71,
222
345
39.3
%Fi
re fi
ghtin
g an
d pr
even
tion
wor
kers
740
1,23
149
166
.4%
599
976
377
62.9
%1,
339
2,20
786
864
.8%
Law
enf
orce
men
t wor
kers
2,81
23,
997
1,18
542
.1%
2,28
73,
174
887
38.8
%5,
099
7,17
12,
072
40.6
%O
ther
pro
tect
ive
serv
ice
wor
kers
2,72
73,
885
1,15
842
.5%
1,51
72,
083
566
37.3
%4,
244
5,96
81,
724
40.6
%S
uper
viso
rs, f
ood
prep
arat
ion
and
serv
ing
wor
kers
1,17
81,
545
367
31.2
%74
697
623
030
.8%
1,92
42,
521
597
31.0
%C
ooks
and
food
pre
para
tion
wor
kers
3,87
75,
169
1,29
233
.3%
2,43
93,
242
803
32.9
%6,
316
8,41
12,
095
33.2
%Fo
od a
nd b
ever
age
serv
ing
wor
kers
8,12
111
,484
3,36
341
.4%
5,13
87,
241
2,10
340
.9%
13,2
5918
,725
5,46
641
.2%
Oth
er fo
od p
repa
ratio
n an
d se
rvin
g re
late
d w
orke
rs1,
706
2,34
563
937
.5%
1,08
11,
474
393
36.4
%2,
787
3,81
91,
032
37.0
%S
uper
viso
rs, b
uild
ing
and
grou
nds
clea
ning
and
mai
nten
ance
wor
kers
457
624
167
36.5
%24
631
973
29.7
%70
394
324
034
.1%
Bui
ldin
g cl
eani
ng a
nd p
est c
ontro
l wor
kers
5,67
66,
759
1,08
319
.1%
3,39
63,
991
595
17.5
%9,
072
10,7
501,
678
18.5
%G
roun
ds m
aint
enan
ce w
orke
rs1,
808
2,77
196
353
.3%
920
1,33
441
445
.0%
2,72
84,
105
1,37
750
.5%
Sup
ervi
sors
, per
sona
l car
e an
d se
rvic
e w
orke
rs32
049
017
053
.1%
200
303
103
51.5
%52
079
327
352
.5%
Sour
ce:
Lehi
gh V
alle
y P
lann
ing
Com
mis
sion
, RE
MI P
i+ M
odel
, Jun
e 20
12
TAB
LE 1
2Jo
b G
ain/
Loss
by
Occ
upat
ion
Reg
iona
l Geo
grap
hies
2010
-204
0

37
Lehi
gh C
ount
yN
orth
ampt
on C
ount
yLe
high
Val
ley
Ani
mal
car
e an
d se
rvic
e w
orke
rs31
552
020
565
.1%
172
287
115
66.9
%48
780
732
065
.7%
Ent
erta
inm
ent a
ttend
ants
and
rela
ted
wor
kers
871
1,20
733
638
.6%
569
794
225
39.5
%1,
440
2,00
156
139
.0%
Fune
ral s
ervi
ce w
orke
rs11
117
463
56.8
%48
8234
70.8
%15
925
697
61.0
%P
erso
nal a
ppea
ranc
e w
orke
rs1,
199
2,16
696
780
.7%
535
1,02
248
791
.0%
1,73
43,
188
1,45
483
.9%
Tran
spor
tatio
n, to
uris
m, a
nd lo
dgin
g at
tend
ants
230
314
8436
.5%
107
147
4037
.4%
337
461
124
36.8
%O
ther
per
sona
l car
e an
d se
rvic
e w
orke
rs3,
948
7,01
83,
070
77.8
%2,
497
4,17
31,
676
67.1
%6,
445
11,1
914,
746
73.6
%S
uper
viso
rs, s
ales
wor
kers
2,28
52,
587
302
13.2
%1,
331
1,51
918
814
.1%
3,61
64,
106
490
13.6
%R
etai
l sal
es w
orke
rs13
,239
15,1
571,
918
14.5
%8,
064
9,31
31,
249
15.5
%21
,303
24,4
703,
167
14.9
%S
ales
repr
esen
tativ
es, s
ervi
ces
2,76
53,
629
864
31.2
%1,
557
2,08
252
533
.7%
4,32
25,
711
1,38
932
.1%
Sal
es re
pres
enta
tives
, who
lesa
le a
nd m
anuf
actu
ring
3,04
63,
585
539
17.7
%1,
399
1,65
725
818
.4%
4,44
55,
242
797
17.9
%O
ther
sal
es a
nd re
late
d w
orke
rs2,
033
2,45
342
020
.7%
1,13
71,
406
269
23.7
%3,
170
3,85
968
921
.7%
Sup
ervi
sors
, offi
ce a
nd a
dmin
istra
tive
supp
ort w
orke
rs2,
376
3,30
893
239
.2%
1,29
71,
771
474
36.5
%3,
673
5,07
91,
406
38.3
%C
omm
unic
atio
ns e
quip
men
t ope
rato
rs33
628
1-5
5-1
6.4%
147
122
-25
-17.
0%48
340
3-8
0-1
6.6%
Fina
ncia
l cle
rks
6,45
88,
597
2,13
933
.1%
3,42
54,
518
1,09
331
.9%
9,88
313
,115
3,23
232
.7%
Info
rmat
ion
and
reco
rd c
lerk
s10
,074
13,1
793,
105
30.8
%5,
417
6,99
11,
574
29.1
%15
,491
20,1
704,
679
30.2
%M
ater
ial r
ecor
ding
, sch
edul
ing,
dis
patc
hing
, and
dis
tribu
ting
occu
patio
ns6,
154
7,00
685
213
.8%
3,85
64,
311
455
11.8
%10
,010
11,3
171,
307
13.1
%S
ecre
tarie
s an
d ad
min
istra
tive
assi
stan
ts7,
537
10,6
423,
105
41.2
%4,
161
5,63
21,
471
35.4
%11
,698
16,2
744,
576
39.1
%O
ther
offi
ce a
nd a
dmin
istra
tive
supp
ort w
orke
rs7,
765
9,60
31,
838
23.7
%4,
660
5,69
41,
034
22.2
%12
,425
15,2
972,
872
23.1
%S
uper
viso
rs, f
arm
ing,
fish
ing,
and
fore
stry
wor
kers
4452
818
.2%
2427
312
.5%
6879
1116
.2%
Agr
icul
tura
l wor
kers
816
846
303.
7%46
243
1-3
1-6
.7%
1,27
81,
277
-1-0
.1%
Fish
ing
and
hunt
ing
wor
kers
55
00.
0%2
20
0.0%
77
00.
0%Fo
rest
, con
serv
atio
n, a
nd lo
ggin
g w
orke
rs46
5812
26.1
%28
335
17.9
%74
9117
23.0
%S
uper
viso
rs, c
onst
ruct
ion
and
extra
ctio
n w
orke
rs76
31,
360
597
78.2
%56
31,
018
455
80.8
%1,
326
2,37
81,
052
79.3
%C
onst
ruct
ion
trade
s an
d re
late
d w
orke
rs6,
461
10,9
254,
464
69.1
%4,
679
8,01
93,
340
71.4
%11
,140
18,9
447,
804
70.1
%H
elpe
rs, c
onst
ruct
ion
trade
s48
390
442
187
.2%
349
669
320
91.7
%83
21,
573
741
89.1
%O
ther
con
stru
ctio
n an
d re
late
d w
orke
rs78
11,
159
378
48.4
%62
489
927
544
.1%
1,40
52,
058
653
46.5
%E
xtra
ctio
n w
orke
rs11
213
624
21.4
%72
9624
33.3
%18
423
248
26.1
%S
uper
viso
rs o
f ins
talla
tion,
mai
nten
ance
, and
repa
ir w
orke
rs74
592
818
324
.6%
501
630
129
25.7
%1,
246
1,55
831
225
.0%
Ele
ctric
al a
nd e
lect
roni
c eq
uipm
ent m
echa
nics
, ins
talle
rs, a
nd re
paire
rs87
81,
035
157
17.9
%47
460
112
726
.8%
1,35
21,
636
284
21.0
%V
ehic
le a
nd m
obile
equ
ipm
ent m
echa
nics
, ins
talle
rs, a
nd re
paire
rs2,
550
3,09
954
921
.5%
1,83
22,
283
451
24.6
%4,
382
5,38
21,
000
22.8
%O
ther
inst
alla
tion,
mai
nten
ance
, and
repa
ir oc
cupa
tions
4,98
67,
009
2,02
340
.6%
3,25
04,
584
1,33
441
.0%
8,23
611
,593
3,35
740
.8%
Sup
ervi
sors
, pro
duct
ion
wor
kers
862
907
455.
2%63
667
135
5.5%
1,49
81,
578
805.
3%A
ssem
bler
s an
d fa
bric
ator
s2,
628
3,01
338
514
.6%
1,47
91,
701
222
15.0
%4,
107
4,71
460
714
.8%
Food
pro
cess
ing
occu
patio
ns89
191
322
2.5%
507
575
6813
.4%
1,39
81,
488
906.
4%M
etal
wor
kers
and
pla
stic
wor
kers
2,49
02,
556
662.
7%1,
992
1,90
1-9
1-4
.6%
4,48
24,
457
-25
-0.6
%P
rintin
g oc
cupa
tions
488
371
-117
-24.
0%26
021
0-5
0-1
9.2%
748
581
-167
-22.
3%Te
xtile
, app
arel
, and
furn
ishi
ngs
occu
patio
ns1,
173
1,20
431
2.6%
1,11
61,
147
312.
8%2,
289
2,35
162
2.7%
Woo
dwor
kers
233
199
-34
-14.
6%20
820
7-1
-0.5
%44
140
6-3
5-7
.9%
Pla
nt a
nd s
yste
m o
pera
tors
502
640
138
27.5
%34
844
810
028
.7%
850
1,08
823
828
.0%
Oth
er p
rodu
ctio
n oc
cupa
tions
3,91
84,
552
634
16.2
%2,
877
3,28
540
814
.2%
6,79
57,
837
1,04
215
.3%
Sup
ervi
sors
, tra
nspo
rtatio
n an
d m
ater
ial m
ovin
g w
orke
rs70
982
111
215
.8%
472
561
8918
.9%
1,18
11,
382
201
17.0
%A
ir tra
nspo
rtatio
n oc
cupa
tions
116
155
3933
.6%
4863
1531
.3%
164
218
5432
.9%
Mot
or v
ehic
le o
pera
tors
6,56
78,
958
2,39
136
.4%
4,25
36,
008
1,75
541
.3%
10,8
2014
,966
4,14
638
.3%
Rai
l tra
nspo
rtatio
n oc
cupa
tions
126
163
3729
.4%
9411
925
26.6
%22
028
262
28.2
%W
ater
tran
spor
tatio
n oc
cupa
tions
4880
3266
.7%
2334
1147
.8%
7111
443
60.6
%O
ther
tran
spor
tatio
n w
orke
rs56
468
812
422
.0%
338
413
7522
.2%
902
1,10
119
922
.1%
Mat
eria
l mov
ing
occu
patio
ns7,
748
8,89
91,
151
14.9
%5,
028
5,80
377
515
.4%
12,7
7614
,702
1,92
615
.1%
Sour
ce:
Lehi
gh V
alle
y P
lann
ing
Com
mis
sion
, RE
MI P
i+ M
odel
, Jun
e 20
12
TAB
LE 1
2 (c
ont.)
Job
Gai
n/Lo
ss b
y O
ccup
atio
nR
egio
nal G
eogr
aphi
es20
10-2
040

38
GLOSSARY
Employment: Total number of persons 16 years and older, on establishment payrolls employed full-or part-time who received pay for any part of the pay period that includes the 12th day of the month. Temporary and intermittent employees are included, as are any employees who are on paid sick leave, on paid holiday, or who work during only part of the specified pay period.
Goods-producing industries: Businesses and enterprises that include manufacturing, construction, and natural resources and mining.
Industry: A group of establishments that produce similar products or provide similar services. For example, all establishments that manufacture automobiles are in the same industry. A given industry, or even a particular establishment in that industry, might have employees in dozens of occupations. The North American Industry Classification System (NAICS) groups similar establishments into industries. NAICS is replacing the former Standard Industrial Classification (SIC) system. Labor force: The labor force includes all persons classified as employed or unemployed. Labor force participation rate: The labor force as a percent of the civilian noninstitutional population. Lehigh Valley: An area composed of Lehigh and Northampton counties, Pennsylvania. LVPC: Lehigh Valley Planning Commission. The official planning commission for Lehigh County and Northampton County and the regional planning commission for the Lehigh Valley. Not in the labor force: Persons aged 16 years and older in the civilian non-institutional population who are neither employed nor unemployed and not seeking employment. Occupation: A set of activities or tasks that employees are paid to perform. Employees that perform essentially the same tasks are in the same occupation, whether or not they work in the same industry. Some occupations are concentrated in a few particular industries; other occupations are found in many industries. REMI PI+: An econometric model produced by Regional Economic Models, Inc. Service-providing industries: Businesses and establishments in trade, transportation, and utilities; information; financial activities; professional and business services; education and health services; leisure and hospitality; other services. Shortages: An event where the demand for workers for a particular occupation is greater than the supply of workers who are qualified, available, and willing to do that job. Unemployed: Persons are classified as unemployed if they do not have a job, have actively looked for work in the prior 4 weeks, and are currently available for work. Unemployment rate: The unemployment rate represents the number unemployed as a percent of the labor force.