Embed Size (px)
Citation preview
'
&
$
%
Chapter 8
Comparing Two Groups
1
'
&
$
%
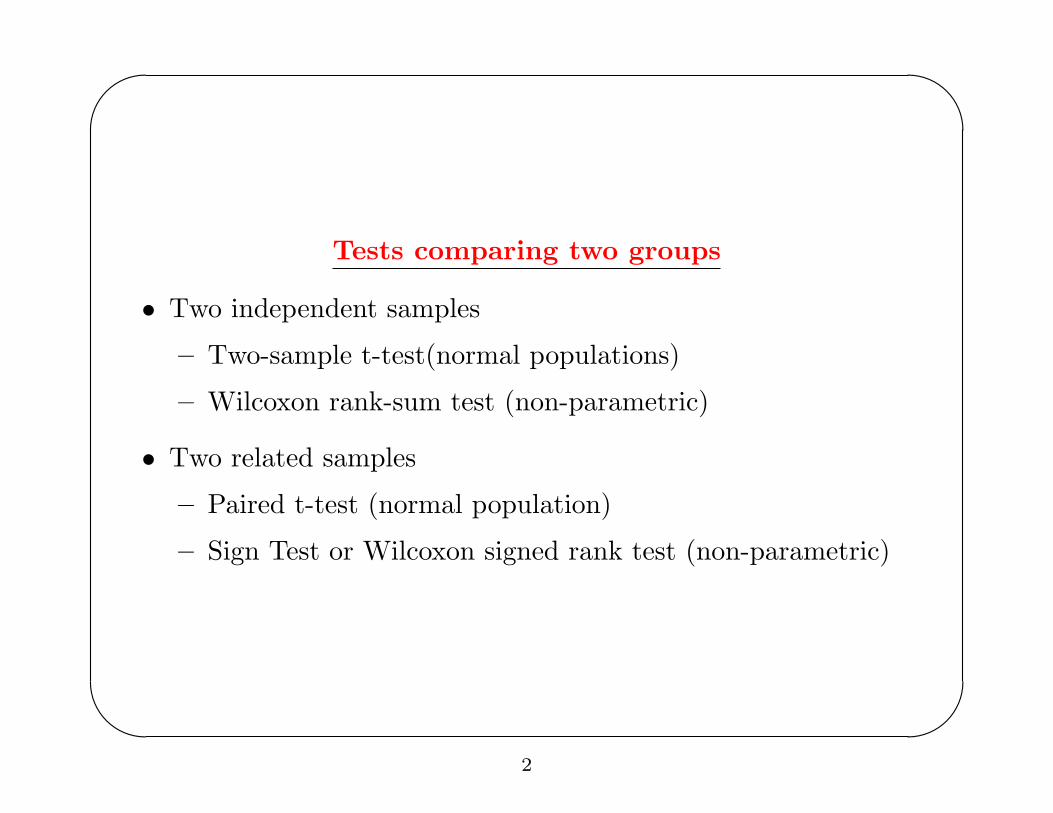
Tests comparing two groups
• Two independent samples
– Two-sample t-test(normal populations)
– Wilcoxon rank-sum test (non-parametric)
• Two related samples
– Paired t-test (normal population)
– Sign Test or Wilcoxon signed rank test (non-parametric)
2
'
&
$
%
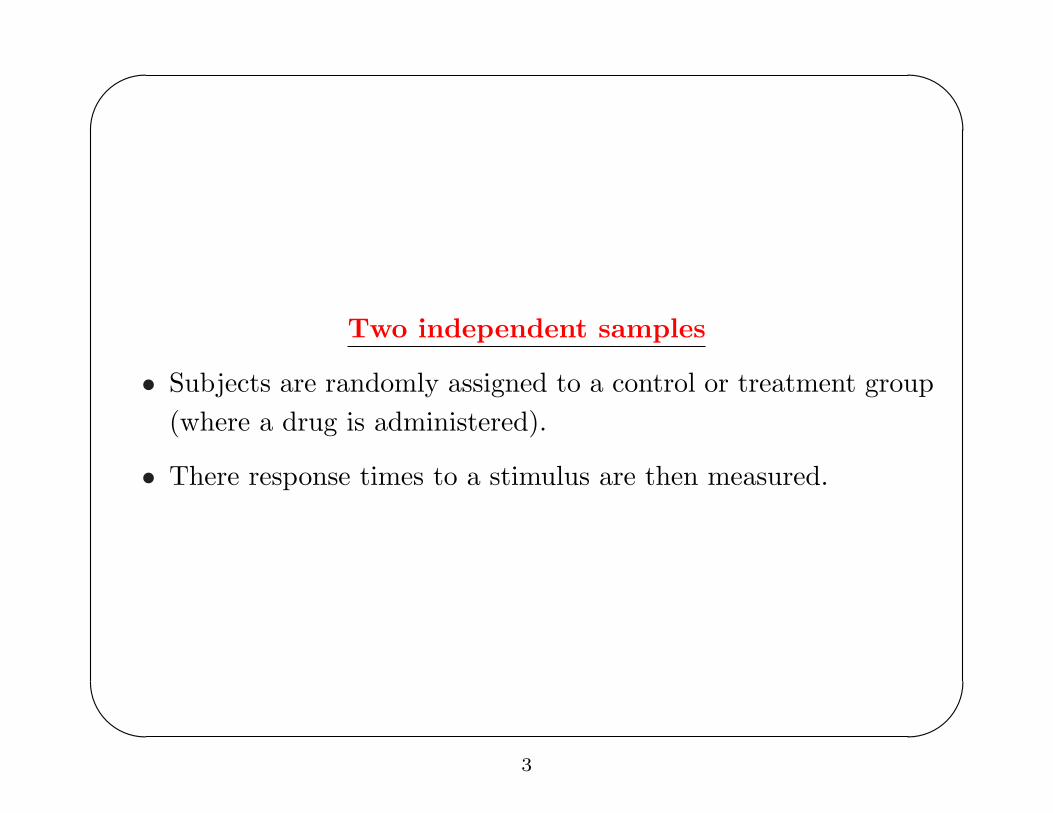
Two independent samples
• Subjects are randomly assigned to a control or treatment group(where a drug is administered).
• There response times to a stimulus are then measured.
3
'
&
$
%
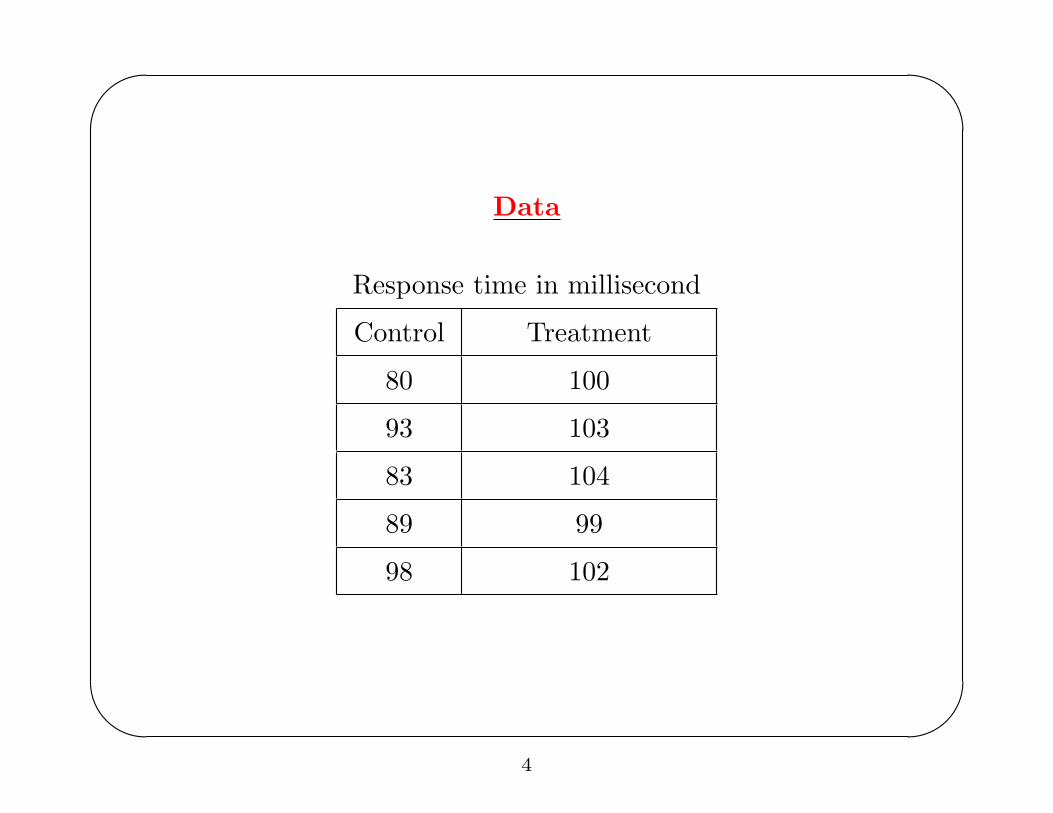
Data
Response time in millisecond
Control Treatment
80 100
93 103
83 104
89 99
98 102
4
'
&
$
%
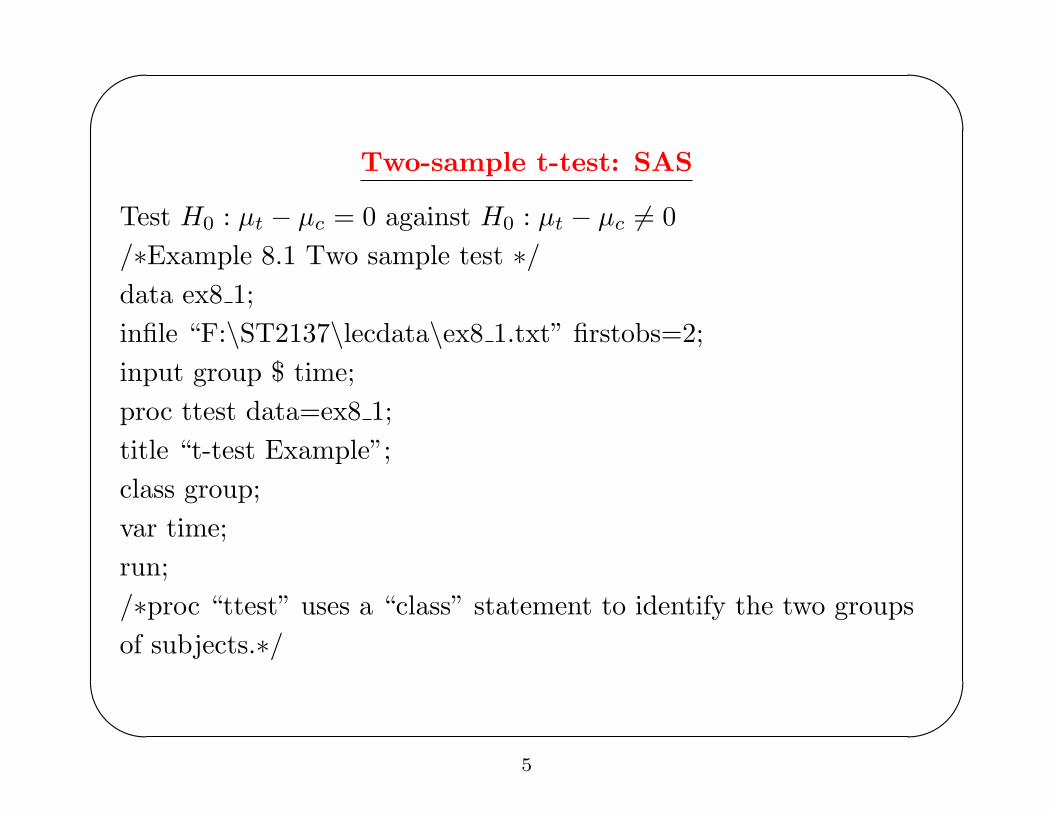
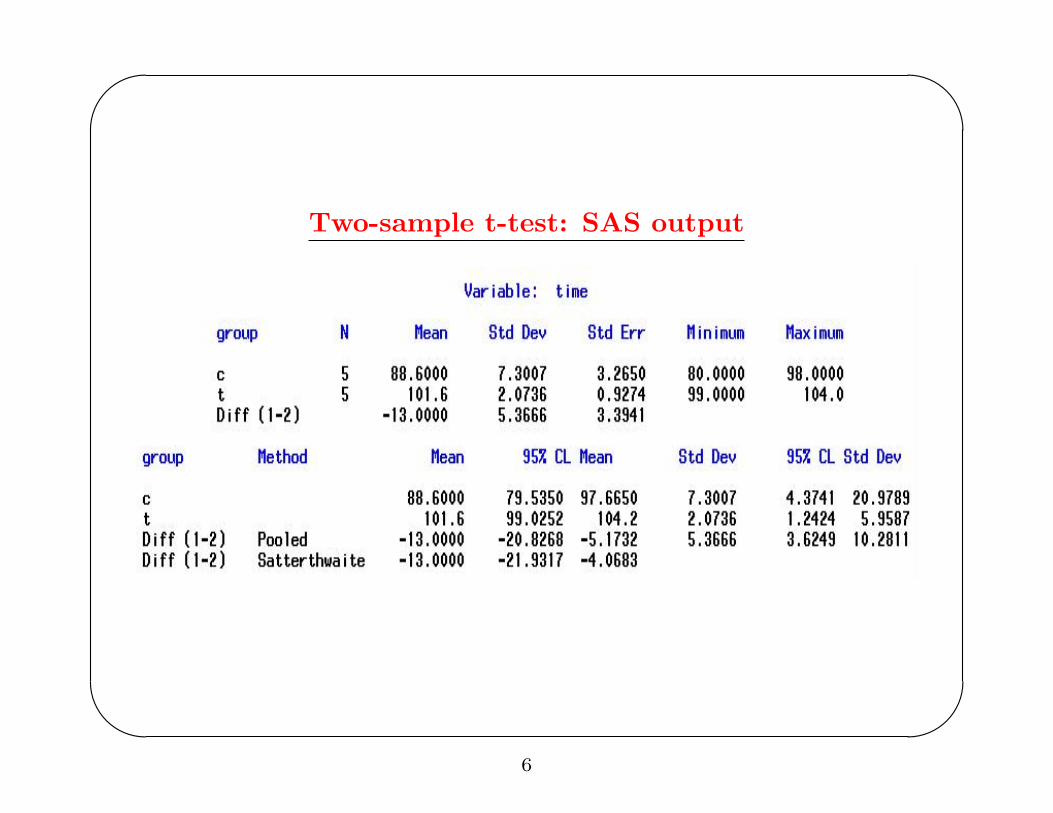
Two-sample t-test: SAS
Test H0 : µt − µc = 0 against H0 : µt − µc 6= 0/∗Example 8.1 Two sample test ∗/data ex8 1;infile “F:\ST2137\lecdata\ex8 1.txt” firstobs=2;input group $ time;proc ttest data=ex8 1;title “t-test Example”;class group;var time;run;/∗proc “ttest” uses a “class” statement to identify the two groupsof subjects.∗/
5
'
&
$
%
Two-sample t-test: SAS output
6
'
&
$
%
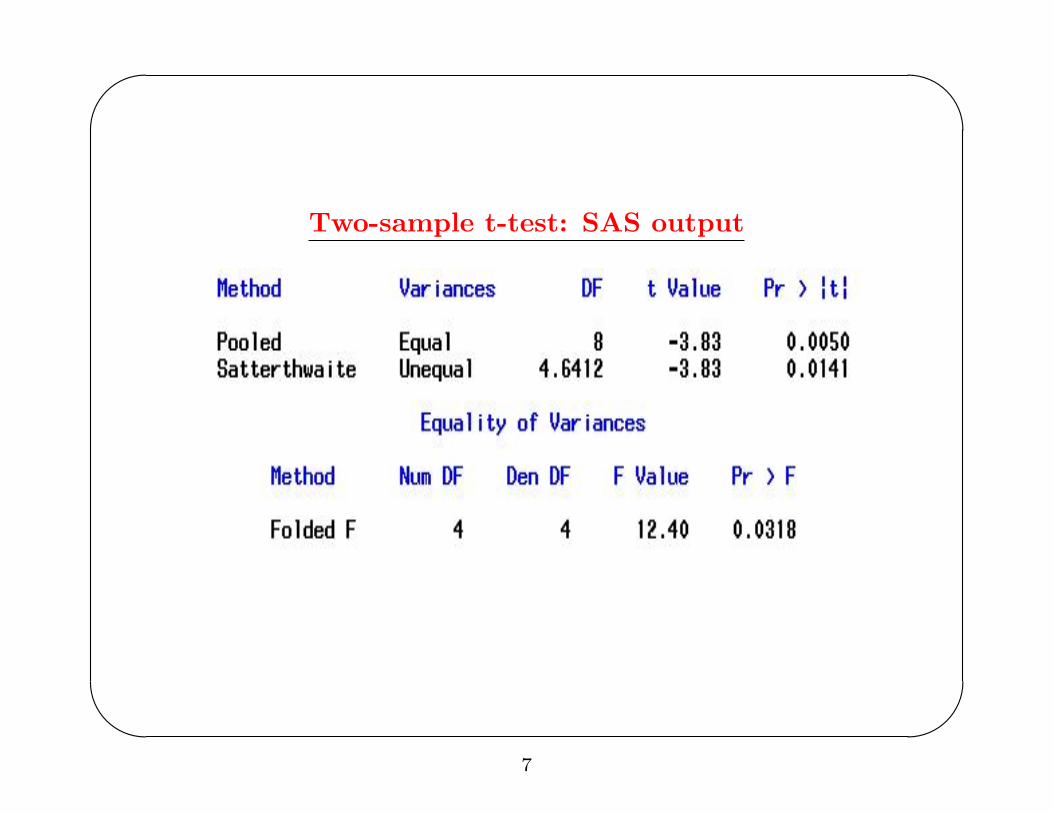
Two-sample t-test: SAS output
7
'
&
$
%
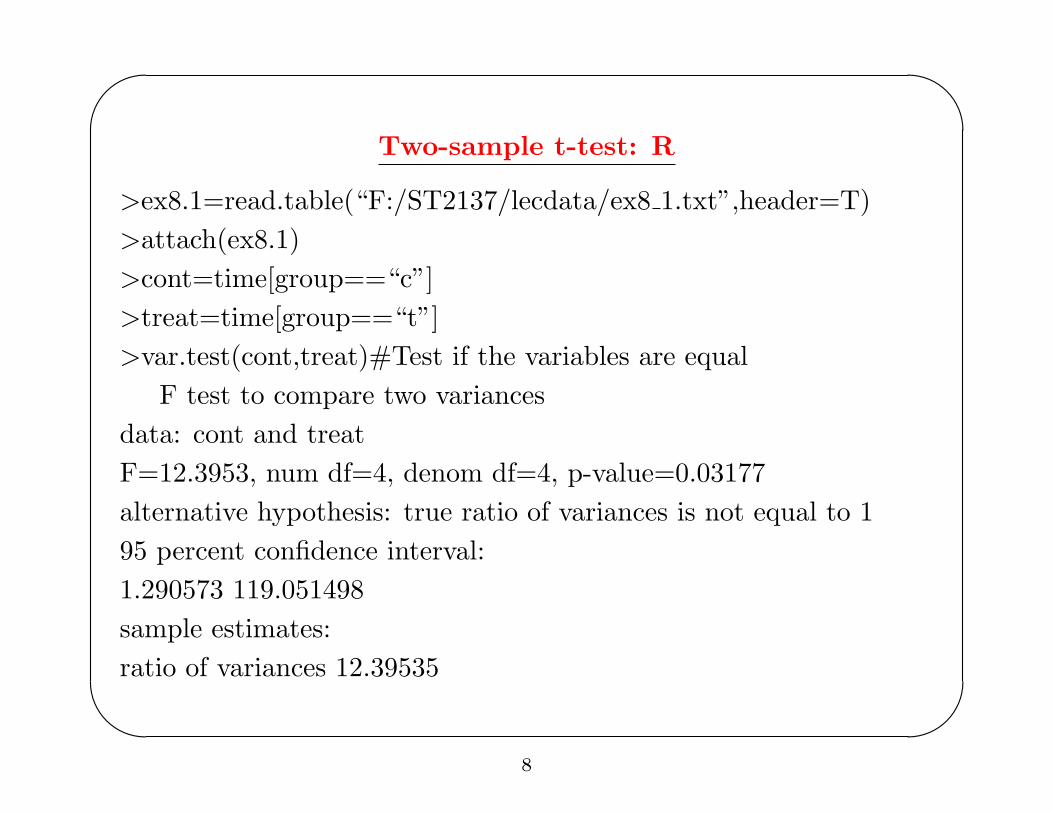
Two-sample t-test: R
>ex8.1=read.table(“F:/ST2137/lecdata/ex8 1.txt”,header=T)>attach(ex8.1)>cont=time[group==“c”]>treat=time[group==“t”]>var.test(cont,treat)#Test if the variables are equal
F test to compare two variancesdata: cont and treatF=12.3953, num df=4, denom df=4, p-value=0.03177alternative hypothesis: true ratio of variances is not equal to 195 percent confidence interval:1.290573 119.051498sample estimates:ratio of variances 12.39535
8
'
&
$
%
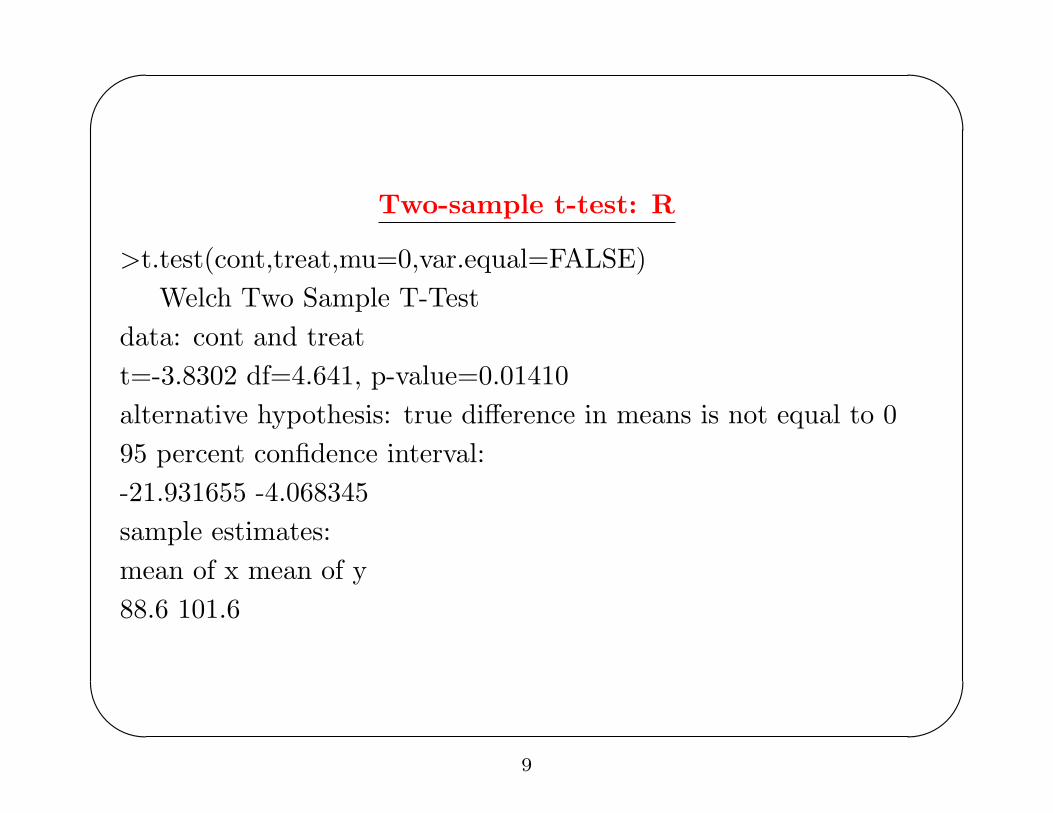
Two-sample t-test: R
>t.test(cont,treat,mu=0,var.equal=FALSE)Welch Two Sample T-Test
data: cont and treatt=-3.8302 df=4.641, p-value=0.01410alternative hypothesis: true difference in means is not equal to 095 percent confidence interval:-21.931655 -4.068345sample estimates:mean of x mean of y88.6 101.6
9
'
&
$
%
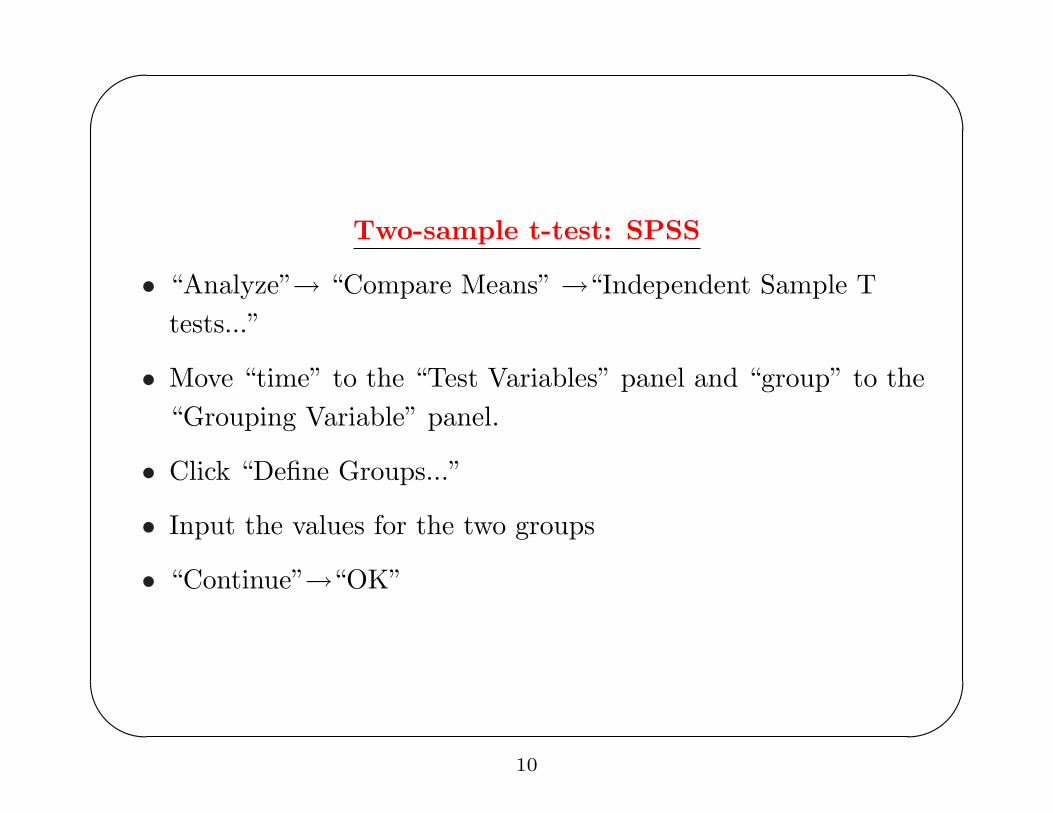
Two-sample t-test: SPSS
• “Analyze”→ “Compare Means” →“Independent Sample Ttests...”
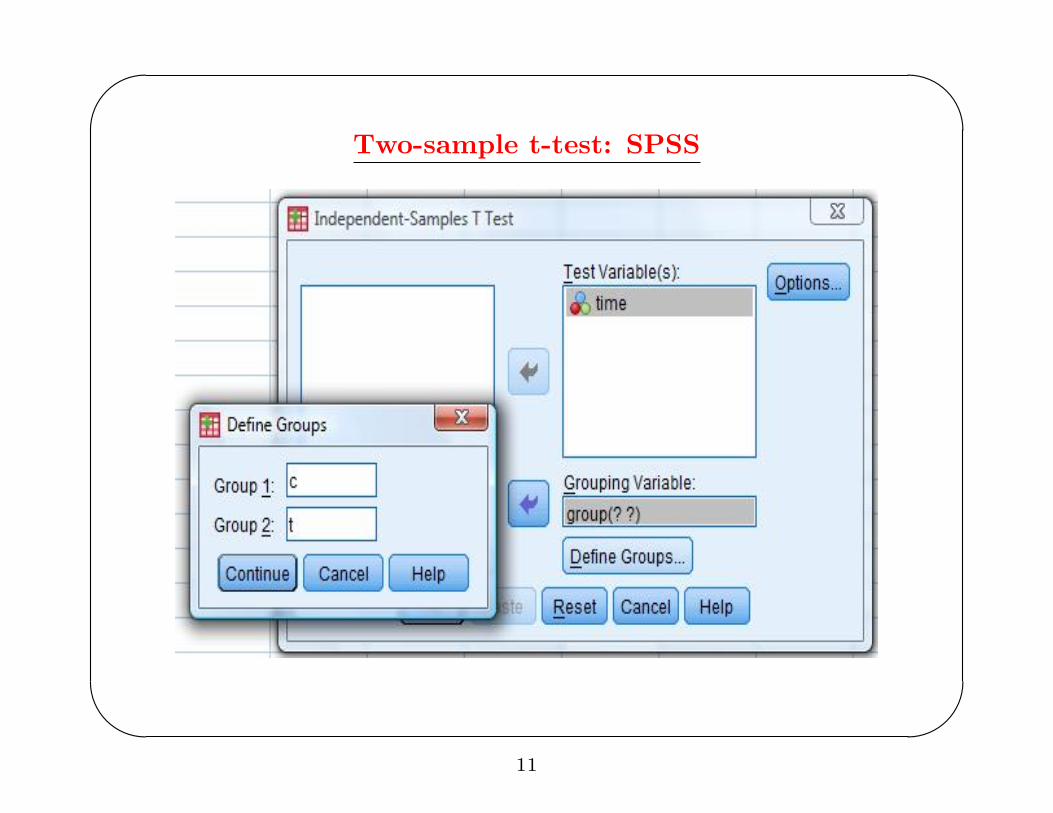
• Move “time” to the “Test Variables” panel and “group” to the“Grouping Variable” panel.
• Click “Define Groups...”
• Input the values for the two groups
• “Continue”→“OK”
10
'
&
$
%
Two-sample t-test: SPSS
11
'
&
$
%
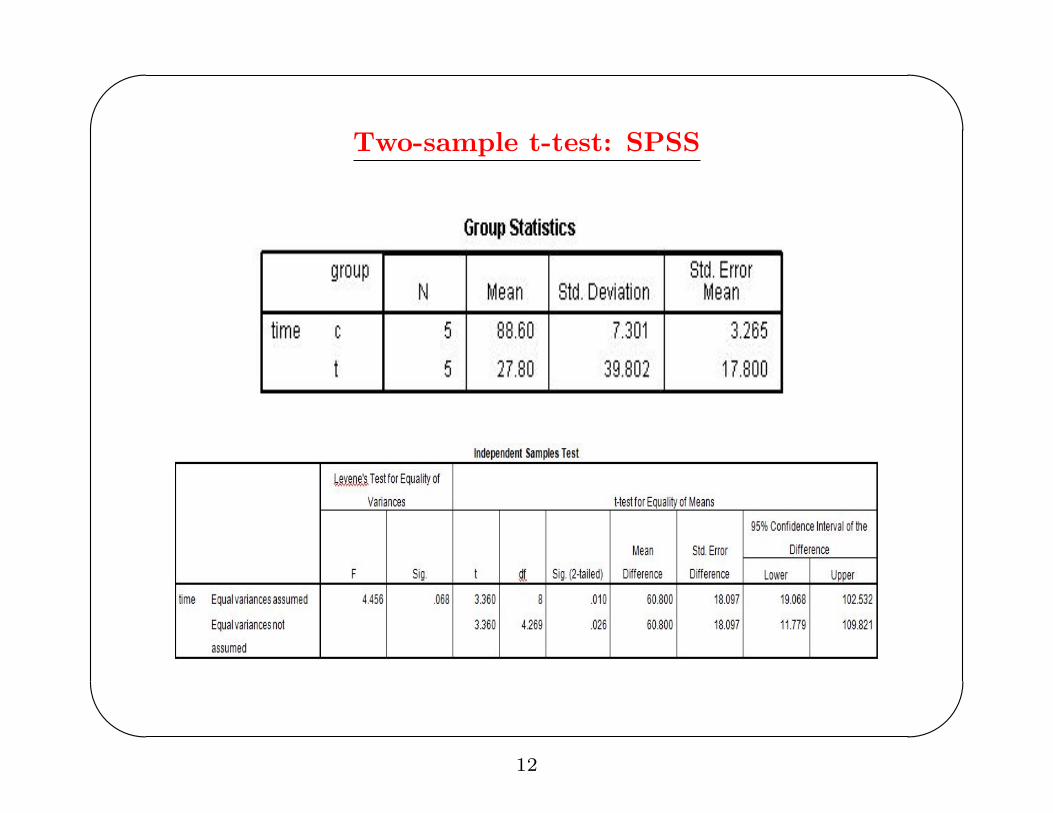
Two-sample t-test: SPSS
12
'
&
$
%
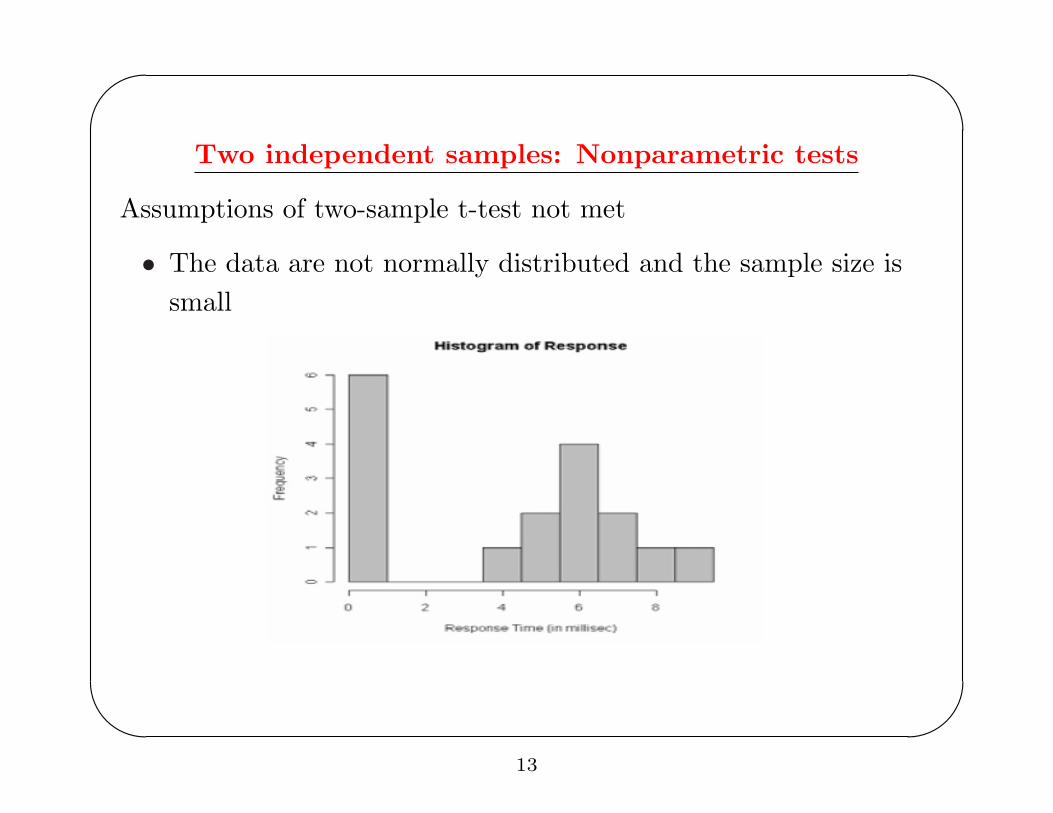
Two independent samples: Nonparametric tests
Assumptions of two-sample t-test not met
• The data are not normally distributed and the sample size issmall
13
'
&
$
%
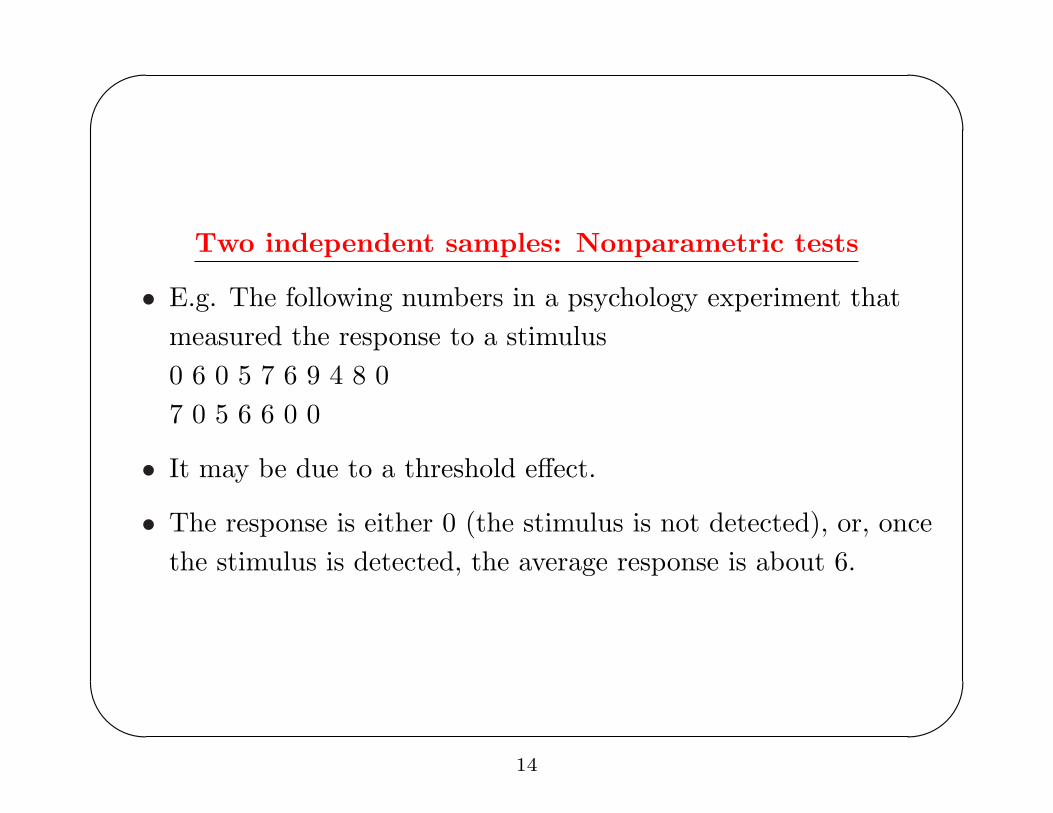
Two independent samples: Nonparametric tests
• E.g. The following numbers in a psychology experiment thatmeasured the response to a stimulus0 6 0 5 7 6 9 4 8 07 0 5 6 6 0 0
• It may be due to a threshold effect.
• The response is either 0 (the stimulus is not detected), or, oncethe stimulus is detected, the average response is about 6.
14
'
&
$
%
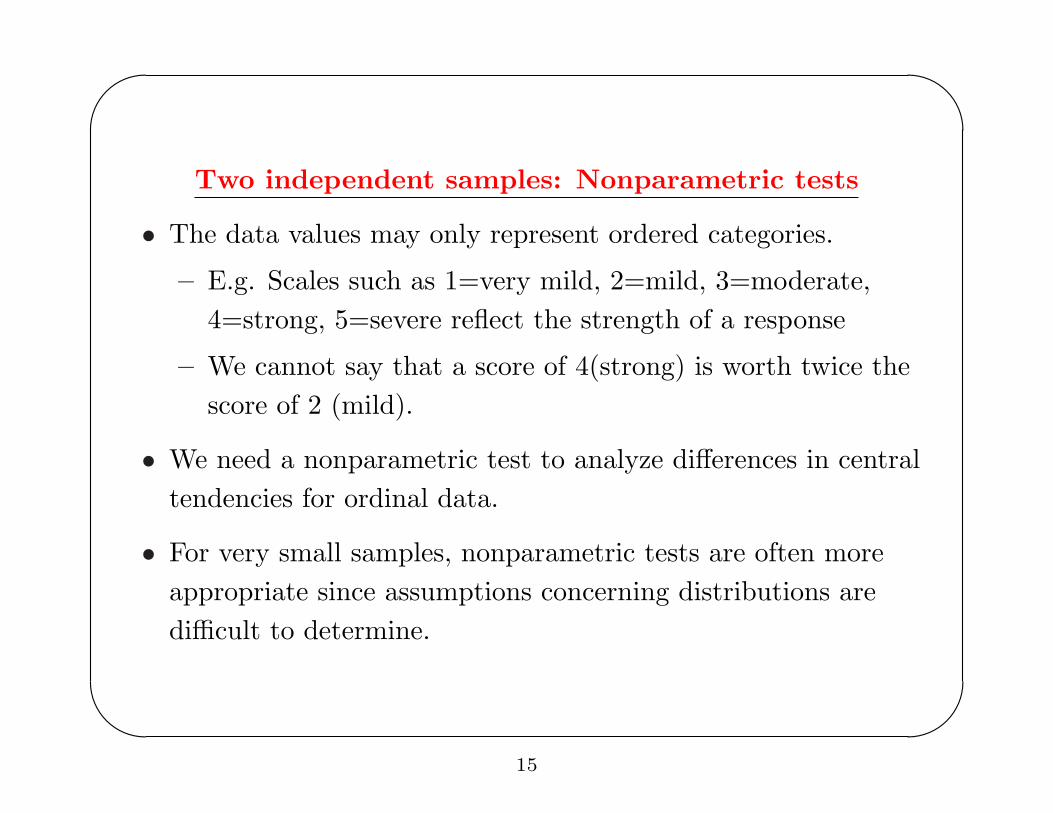
Two independent samples: Nonparametric tests
• The data values may only represent ordered categories.
– E.g. Scales such as 1=very mild, 2=mild, 3=moderate,4=strong, 5=severe reflect the strength of a response
– We cannot say that a score of 4(strong) is worth twice thescore of 2 (mild).
• We need a nonparametric test to analyze differences in centraltendencies for ordinal data.
• For very small samples, nonparametric tests are often moreappropriate since assumptions concerning distributions aredifficult to determine.
15
'
&
$
%
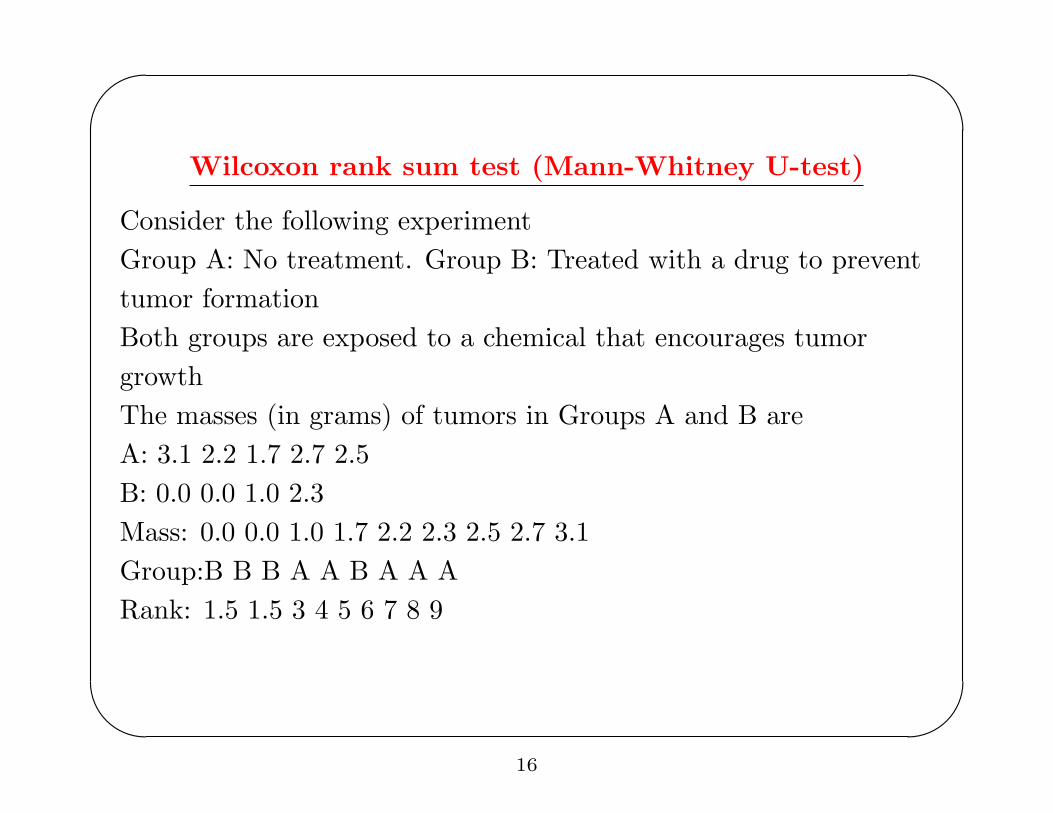
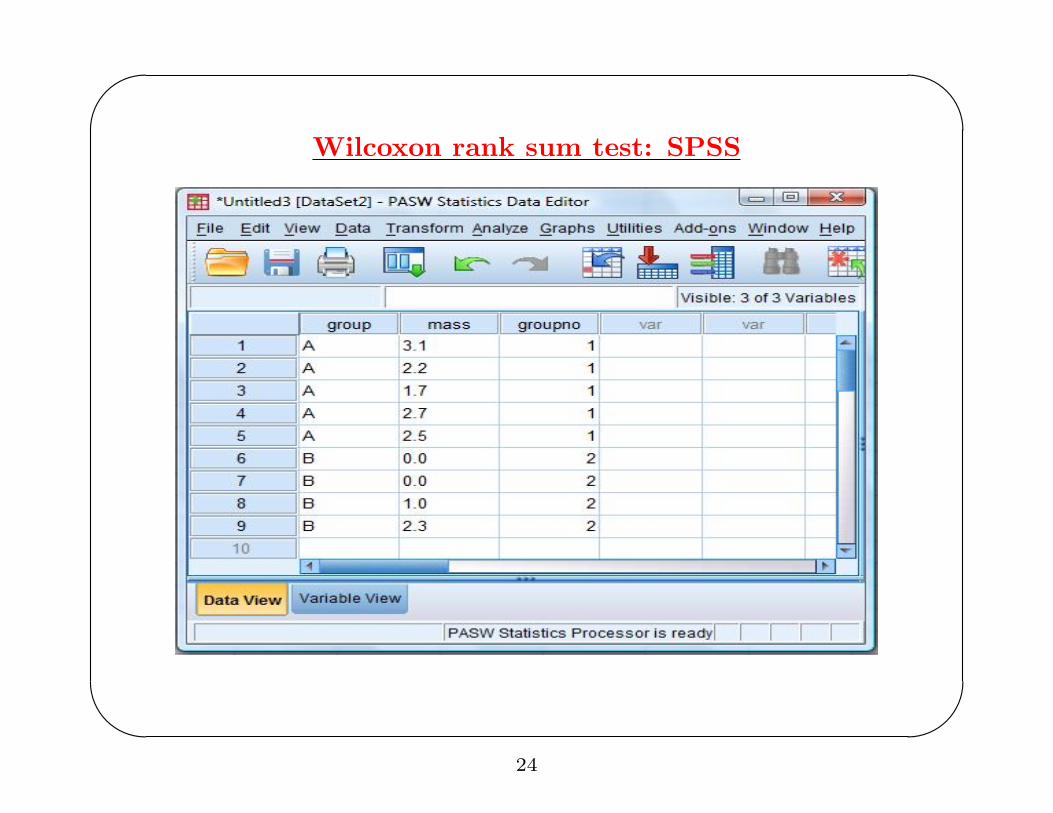
Wilcoxon rank sum test (Mann-Whitney U-test)
Consider the following experimentGroup A: No treatment. Group B: Treated with a drug to preventtumor formationBoth groups are exposed to a chemical that encourages tumorgrowthThe masses (in grams) of tumors in Groups A and B areA: 3.1 2.2 1.7 2.7 2.5B: 0.0 0.0 1.0 2.3Mass: 0.0 0.0 1.0 1.7 2.2 2.3 2.5 2.7 3.1Group:B B B A A B A A ARank: 1.5 1.5 3 4 5 6 7 8 9
16
'
&
$
%
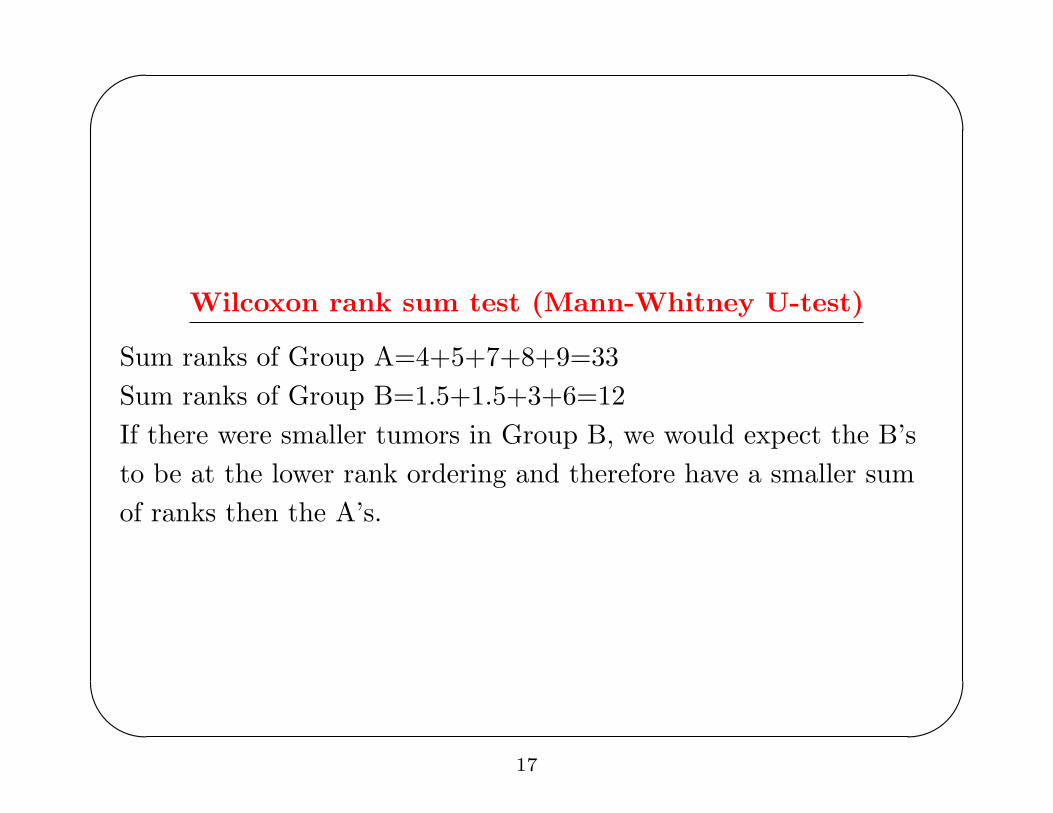
Wilcoxon rank sum test (Mann-Whitney U-test)
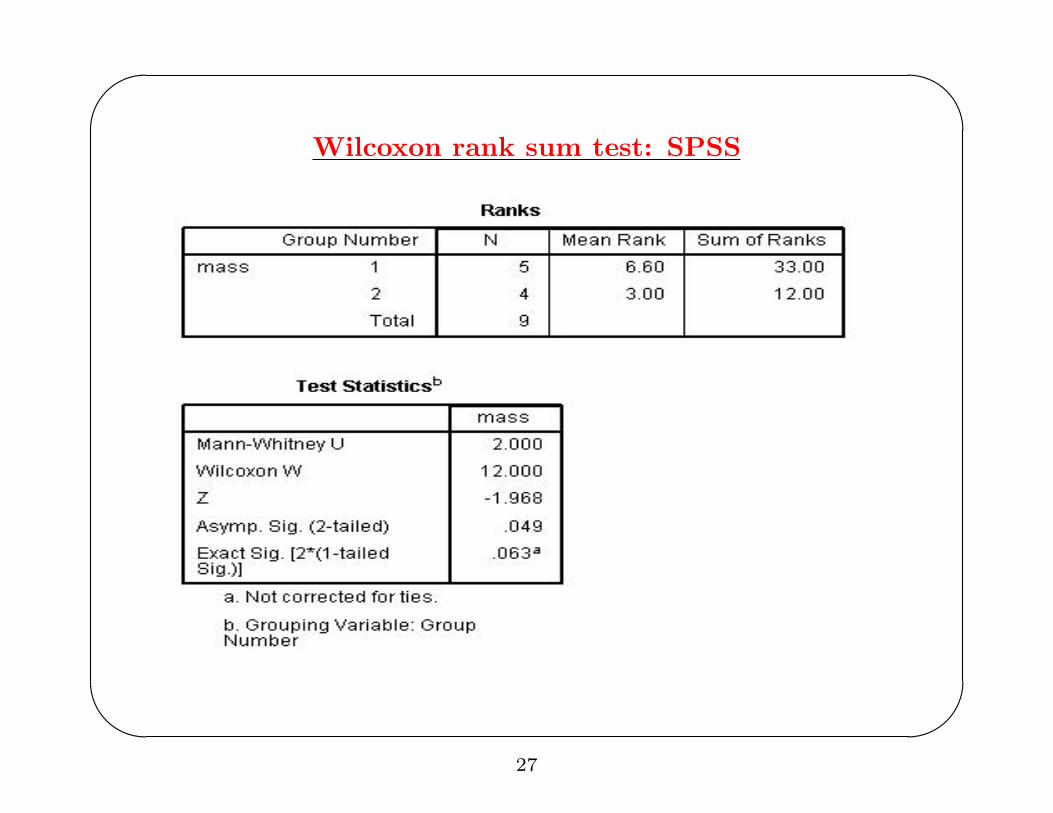
Sum ranks of Group A=4+5+7+8+9=33Sum ranks of Group B=1.5+1.5+3+6=12If there were smaller tumors in Group B, we would expect the B’sto be at the lower rank ordering and therefore have a smaller sumof ranks then the A’s.
17
'
&
$
%
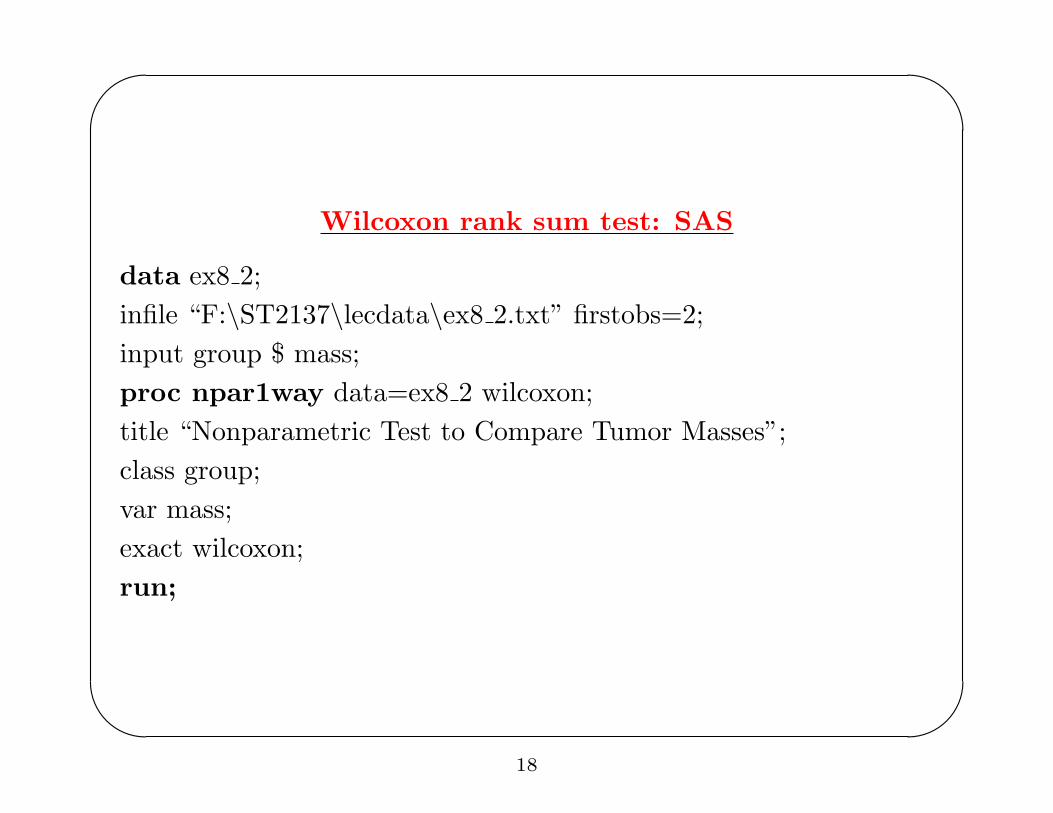
Wilcoxon rank sum test: SAS
data ex8 2;infile “F:\ST2137\lecdata\ex8 2.txt” firstobs=2;input group $ mass;proc npar1way data=ex8 2 wilcoxon;title “Nonparametric Test to Compare Tumor Masses”;class group;var mass;exact wilcoxon;run;
18
'
&
$
%
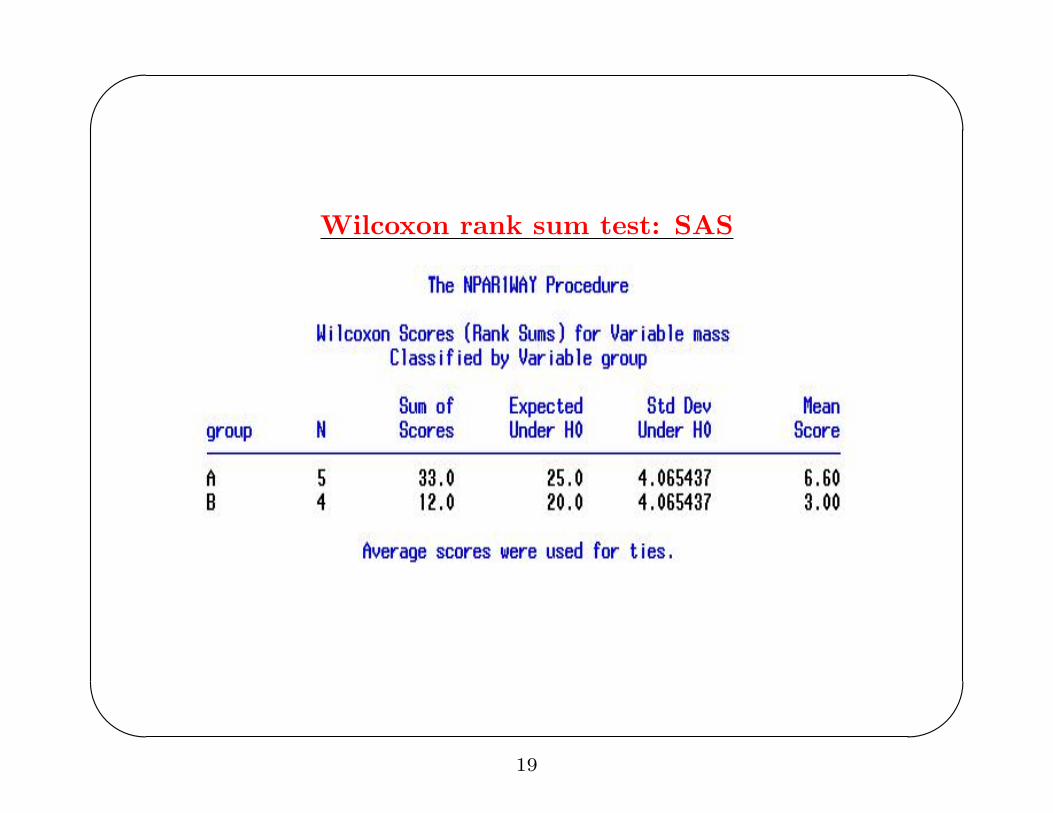
Wilcoxon rank sum test: SAS
19
'
&
$
%
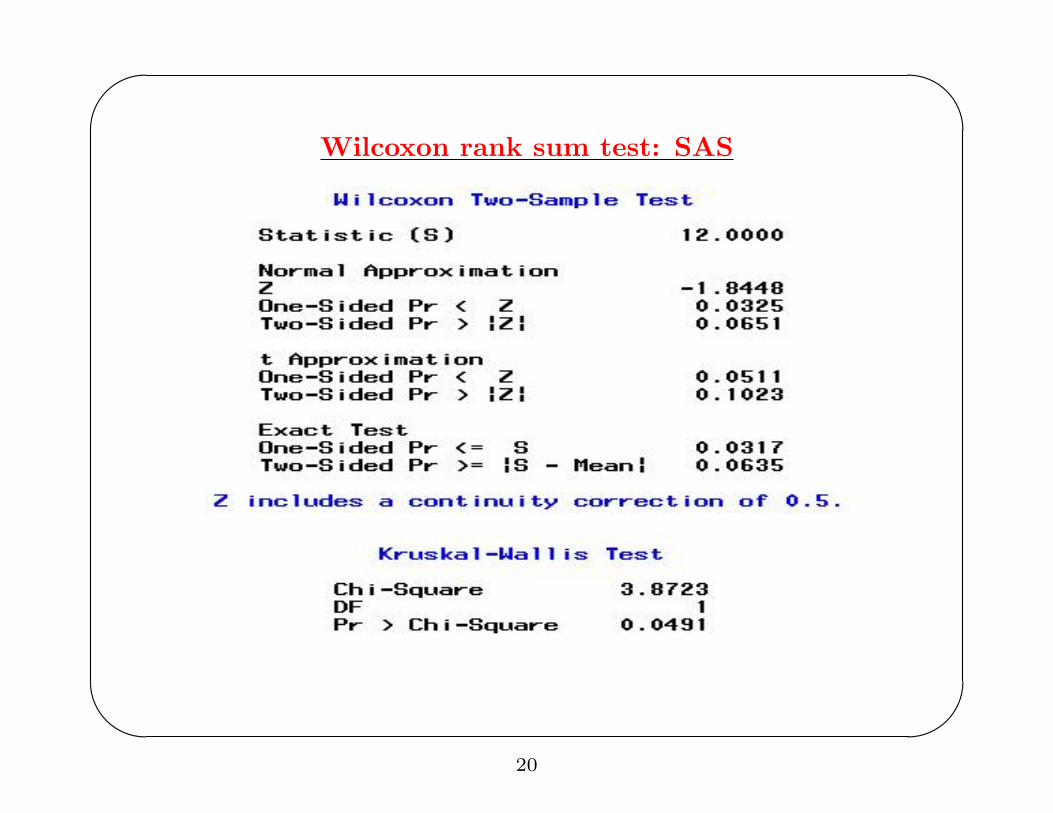
Wilcoxon rank sum test: SAS
20
'
&
$
%
Wilcoxon rank sum test: R
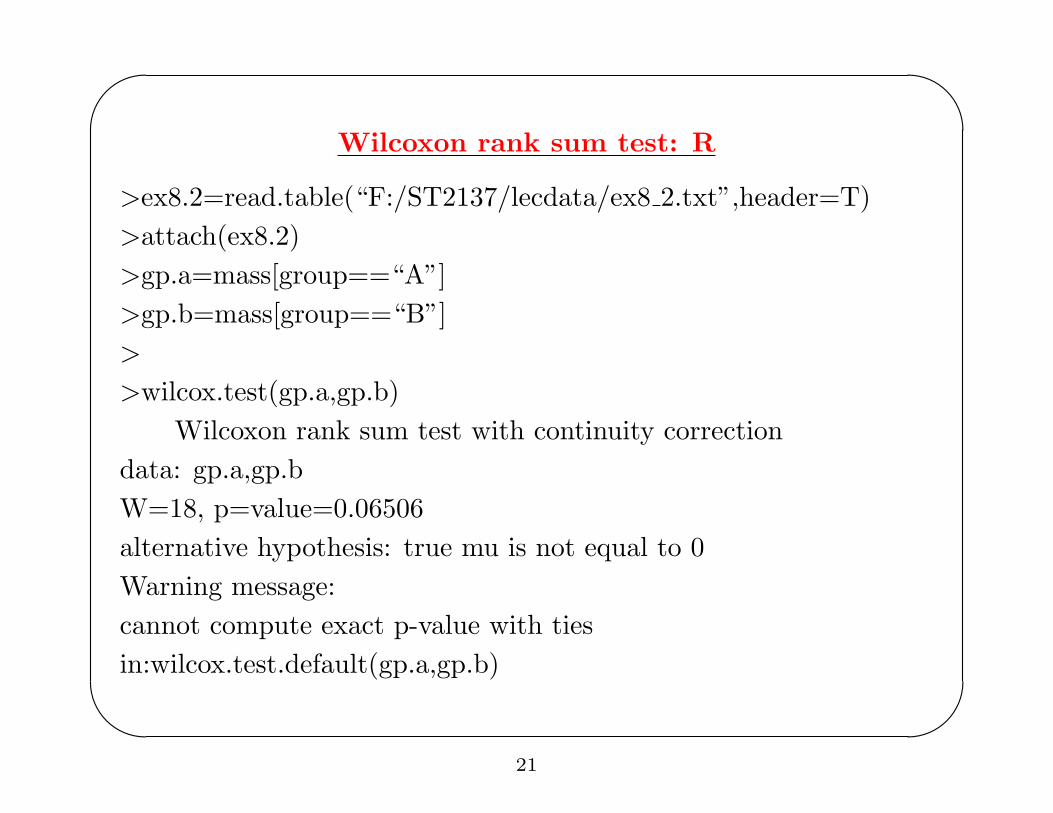
>ex8.2=read.table(“F:/ST2137/lecdata/ex8 2.txt”,header=T)>attach(ex8.2)>gp.a=mass[group==“A”]>gp.b=mass[group==“B”]>
>wilcox.test(gp.a,gp.b)Wilcoxon rank sum test with continuity correction
data: gp.a,gp.bW=18, p=value=0.06506alternative hypothesis: true mu is not equal to 0Warning message:cannot compute exact p-value with tiesin:wilcox.test.default(gp.a,gp.b)
21
'
&
$
%
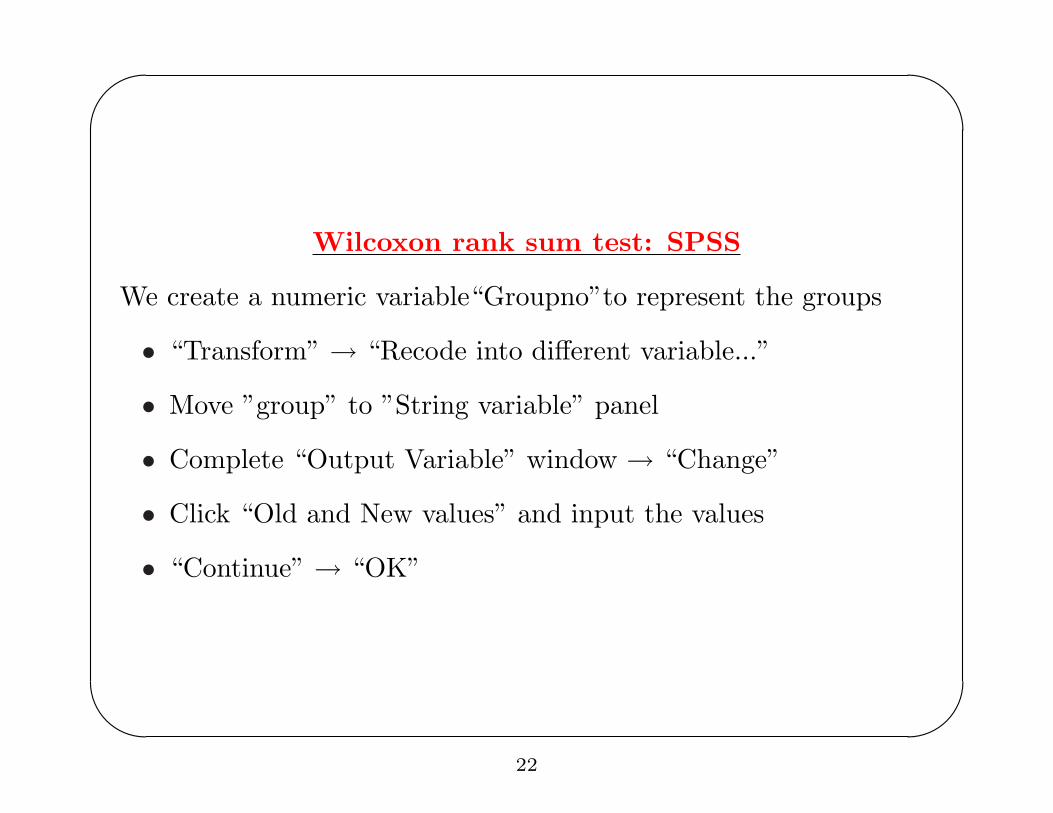
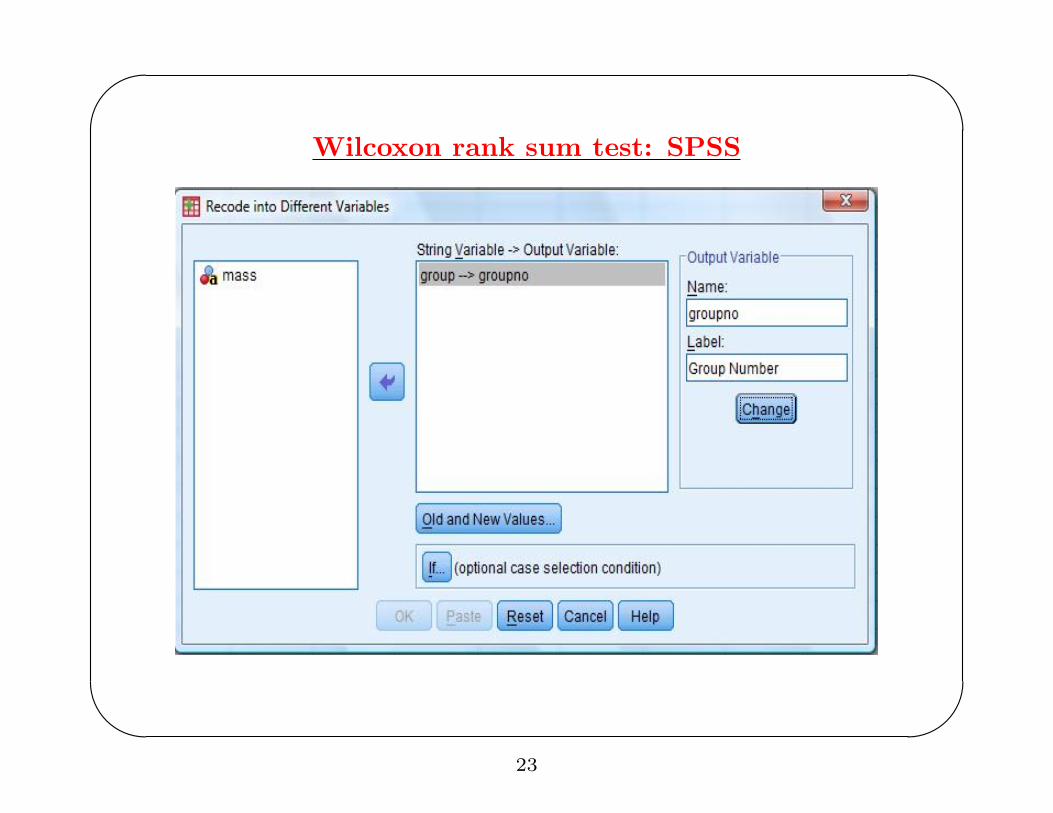
Wilcoxon rank sum test: SPSS
We create a numeric variable“Groupno”to represent the groups
• “Transform” → “Recode into different variable...”
• Move ”group” to ”String variable” panel
• Complete “Output Variable” window → “Change”
• Click “Old and New values” and input the values
• “Continue” → “OK”
22
'
&
$
%
Wilcoxon rank sum test: SPSS
23
'
&
$
%
Wilcoxon rank sum test: SPSS
24
'
&
$
%
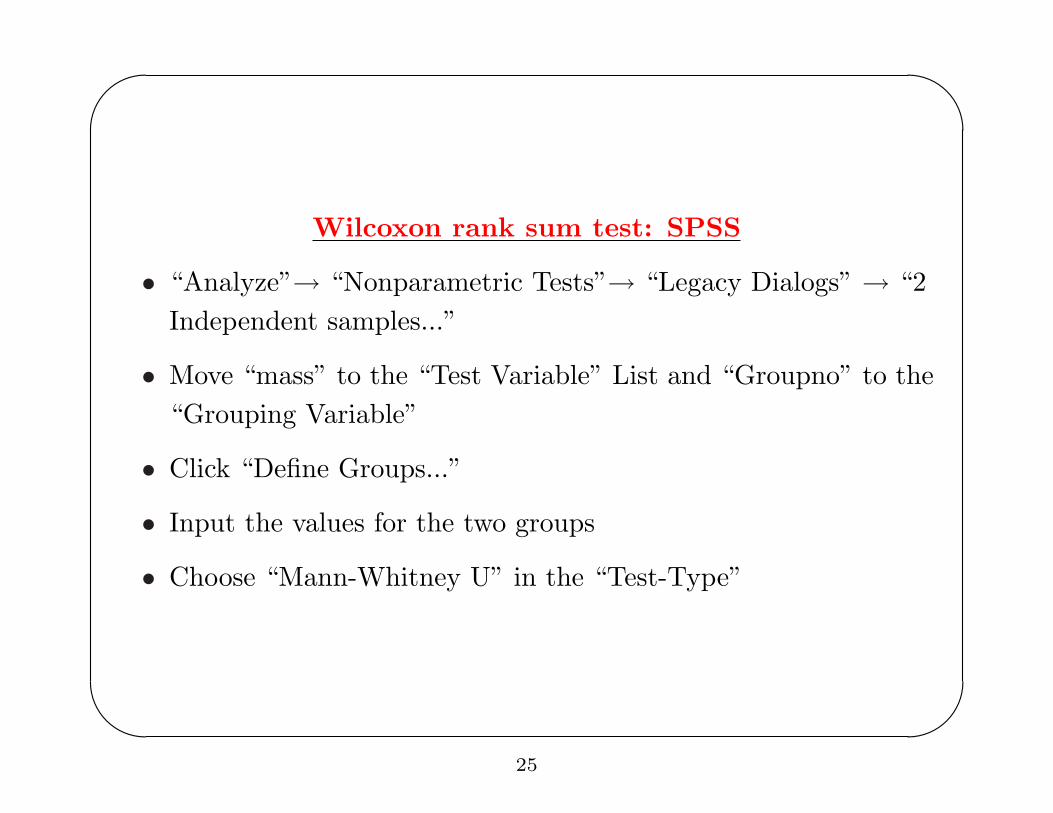
Wilcoxon rank sum test: SPSS
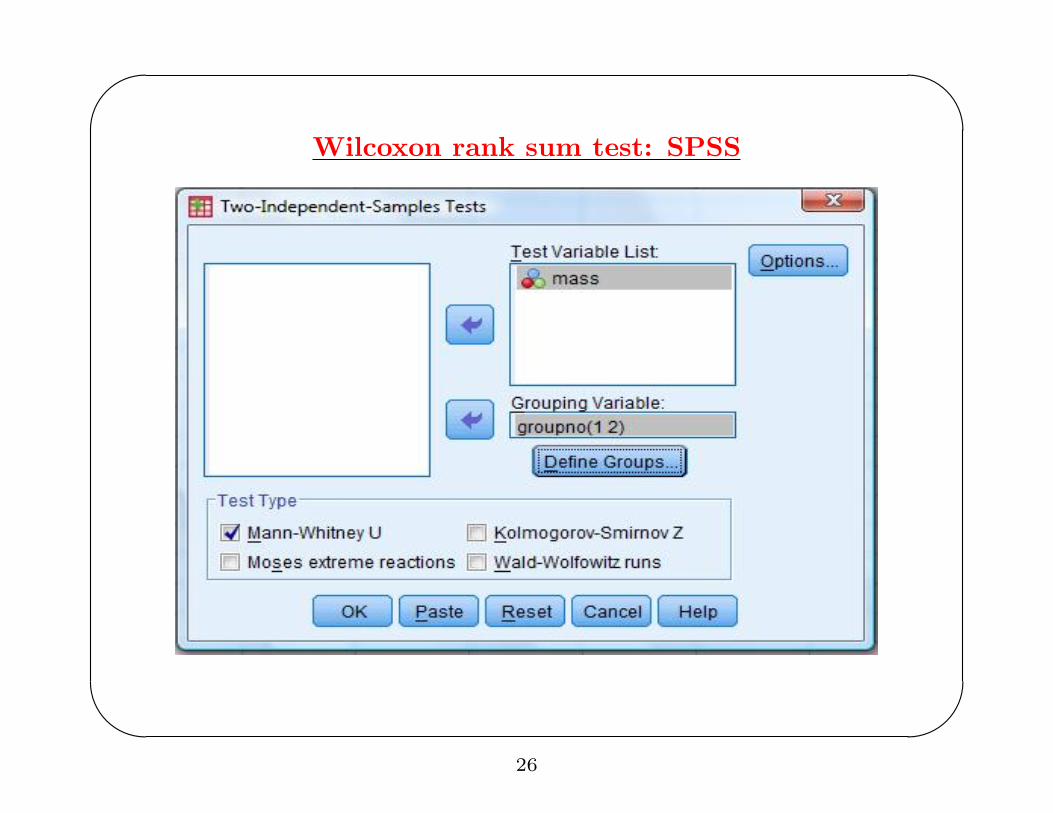
• “Analyze”→ “Nonparametric Tests”→ “Legacy Dialogs” → “2Independent samples...”
• Move “mass” to the “Test Variable” List and “Groupno” to the“Grouping Variable”
• Click “Define Groups...”
• Input the values for the two groups
• Choose “Mann-Whitney U” in the “Test-Type”
25
'
&
$
%
Wilcoxon rank sum test: SPSS
26
'
&
$
%
Wilcoxon rank sum test: SPSS
27
'
&
$
%
Paired t-test (Related Samples)
• There are many situations where each subject receives bothtreatments
– Each subject could have been measured in the absence ofdrug and after receiving the drug
– The response time for the control and treatment groupswould no longer be independent.
• 2-sample t-test cannot be used since the groups are no longerindependent.
• A paired t-test can be used if the differences between beforeand after treatments follow a normal distribution.
28
'
&
$
%
Paired t-test: SAS
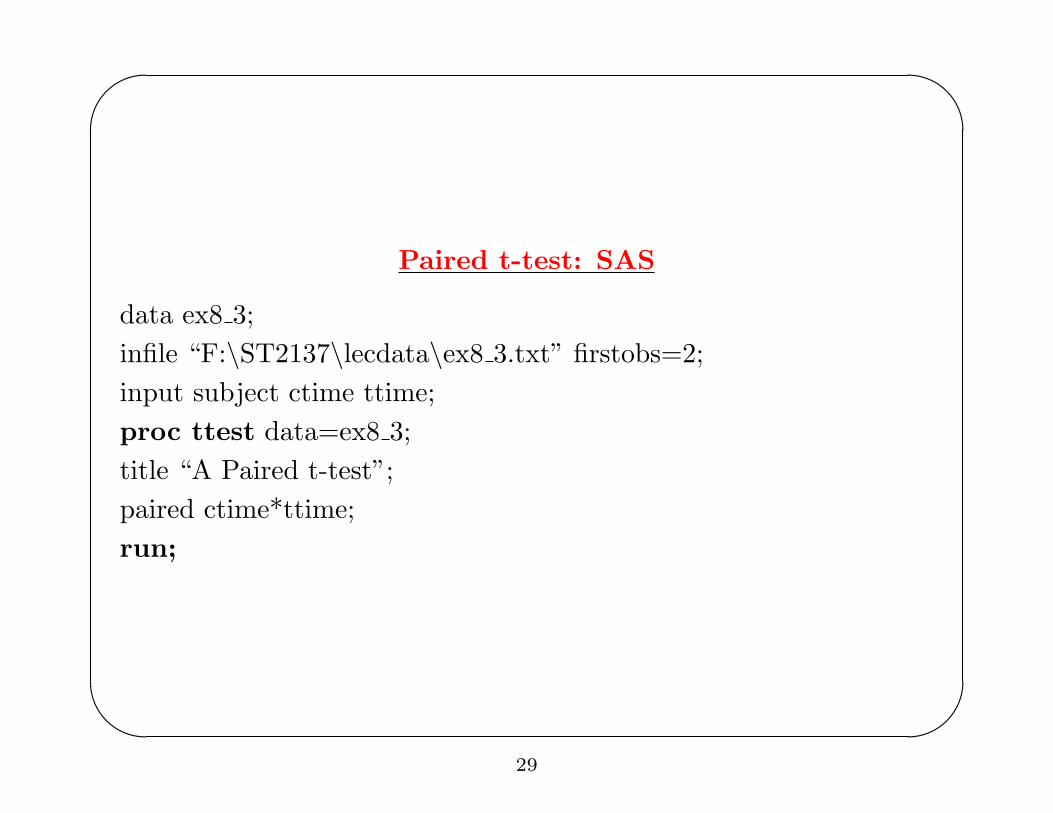
data ex8 3;infile “F:\ST2137\lecdata\ex8 3.txt” firstobs=2;input subject ctime ttime;proc ttest data=ex8 3;title “A Paired t-test”;paired ctime*ttime;run;
29
'
&
$
%
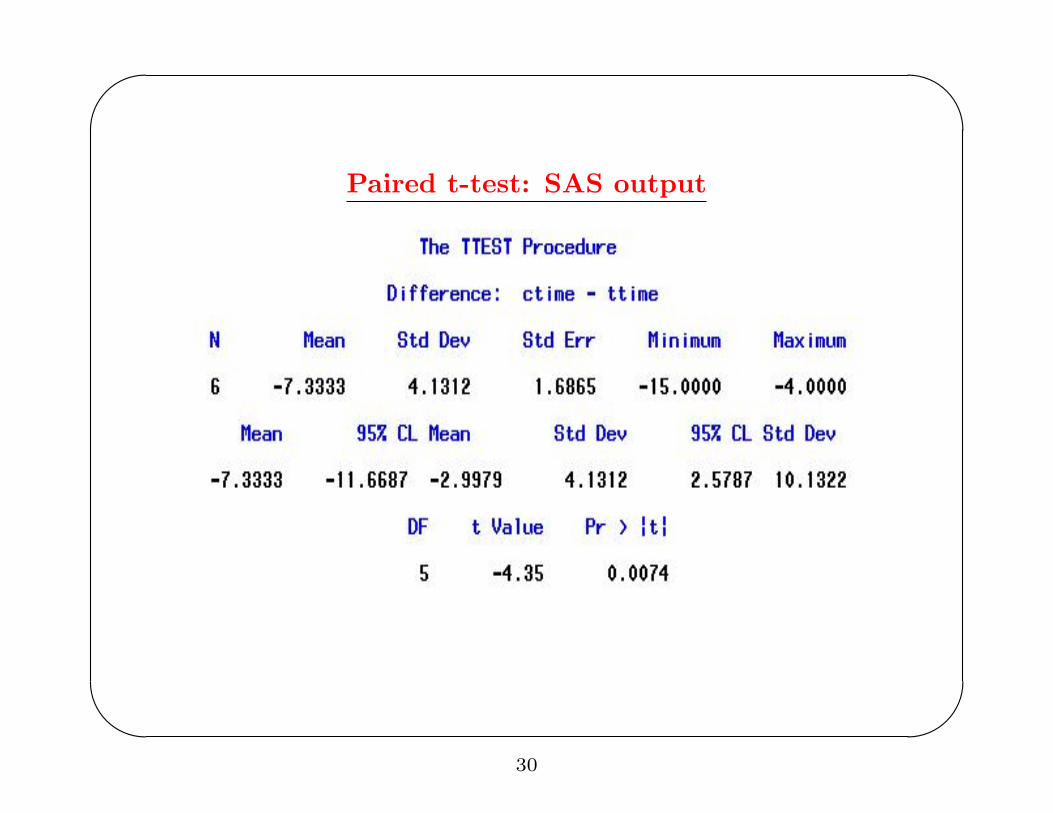
Paired t-test: SAS output
30
'
&
$
%
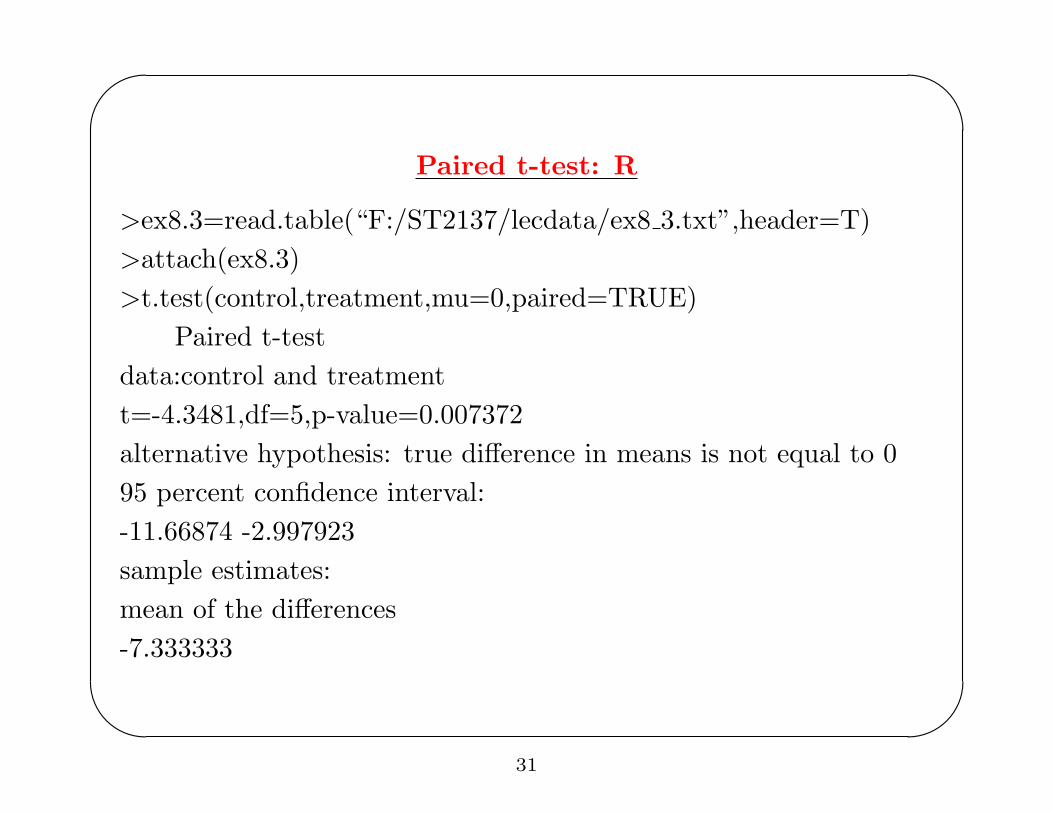
Paired t-test: R
>ex8.3=read.table(“F:/ST2137/lecdata/ex8 3.txt”,header=T)>attach(ex8.3)>t.test(control,treatment,mu=0,paired=TRUE)
Paired t-testdata:control and treatmentt=-4.3481,df=5,p-value=0.007372alternative hypothesis: true difference in means is not equal to 095 percent confidence interval:-11.66874 -2.997923sample estimates:mean of the differences-7.333333
31
'
&
$
%
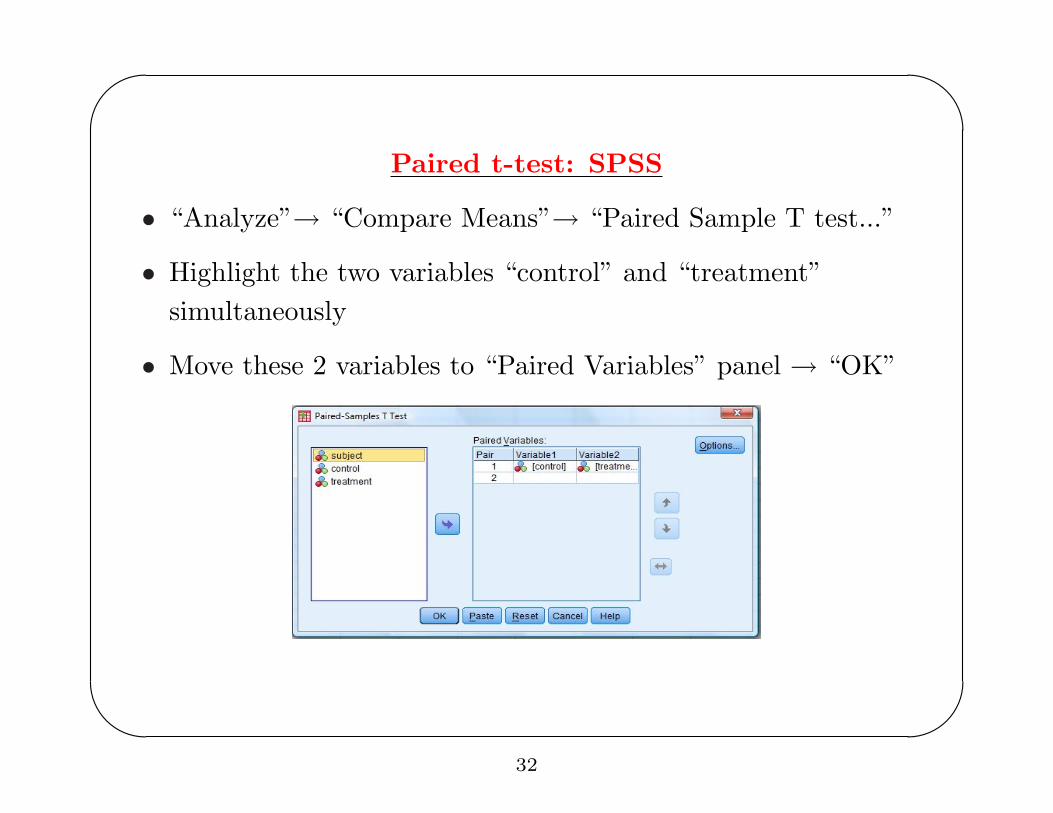
Paired t-test: SPSS
• “Analyze”→ “Compare Means”→ “Paired Sample T test...”
• Highlight the two variables “control” and “treatment”simultaneously
• Move these 2 variables to “Paired Variables” panel → “OK”
32
'
&
$
%
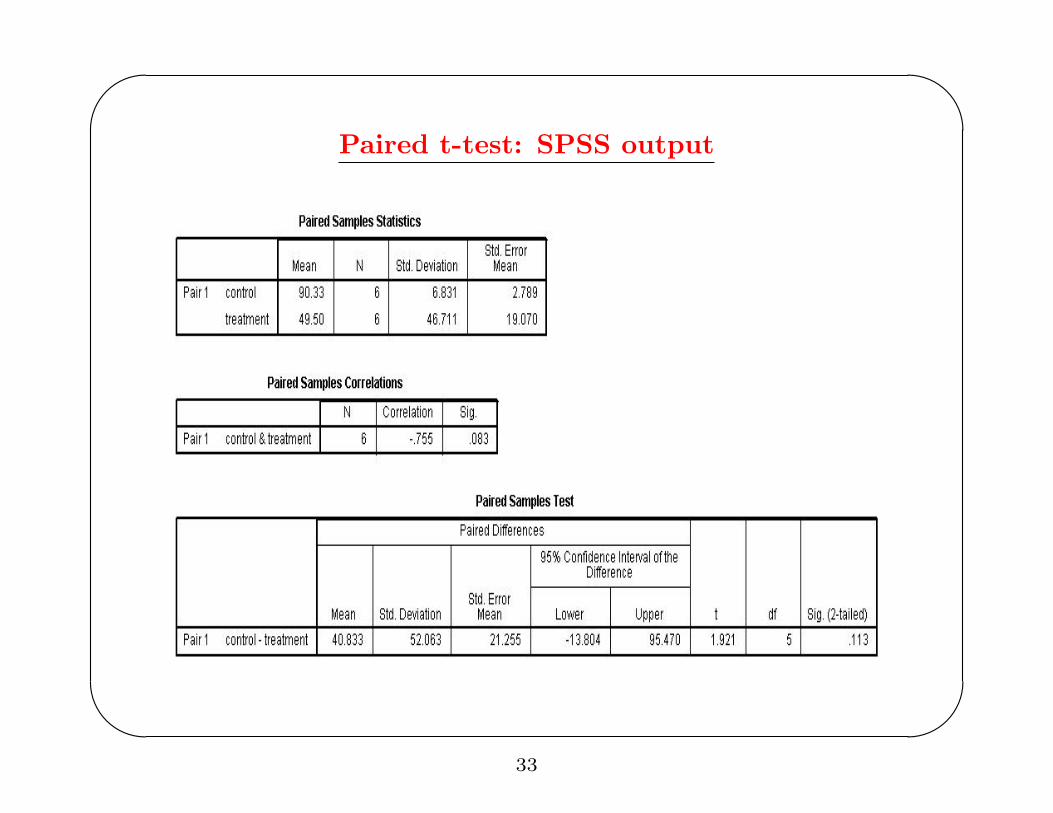
Paired t-test: SPSS output
33
'
&
$
%
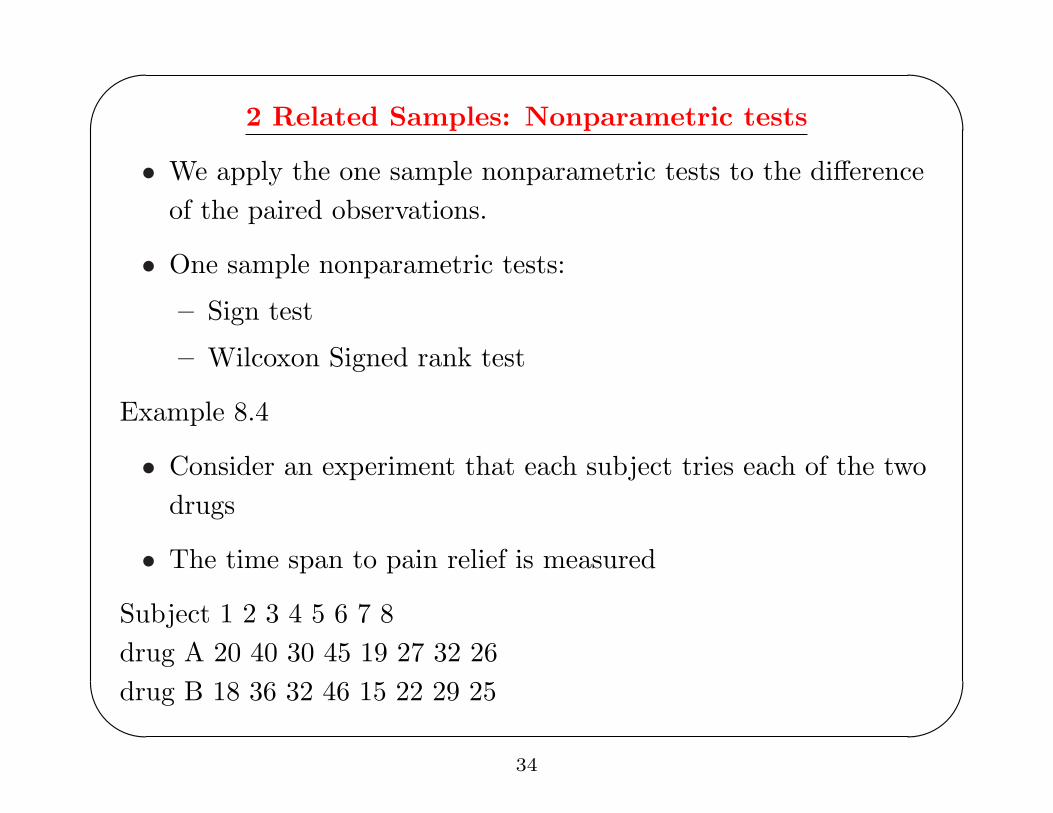
2 Related Samples: Nonparametric tests
• We apply the one sample nonparametric tests to the differenceof the paired observations.
• One sample nonparametric tests:
– Sign test
– Wilcoxon Signed rank test
Example 8.4
• Consider an experiment that each subject tries each of the twodrugs
• The time span to pain relief is measured
Subject 1 2 3 4 5 6 7 8drug A 20 40 30 45 19 27 32 26drug B 18 36 32 46 15 22 29 25
34
'
&
$
%
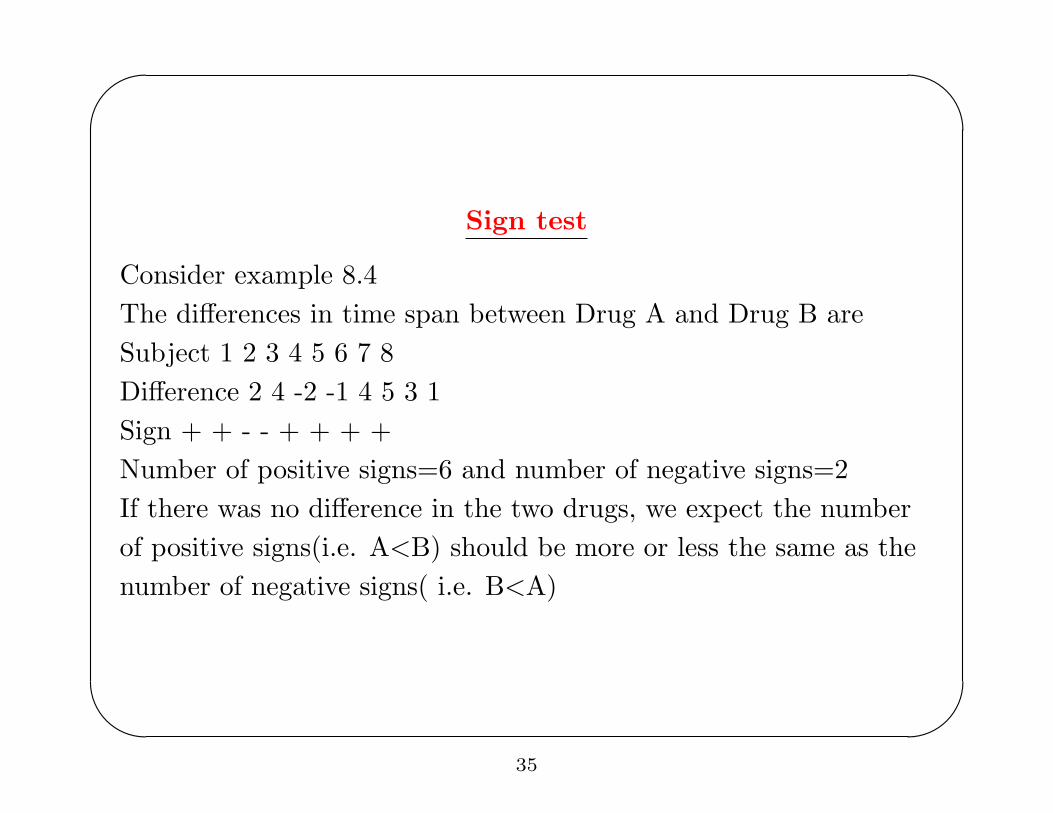
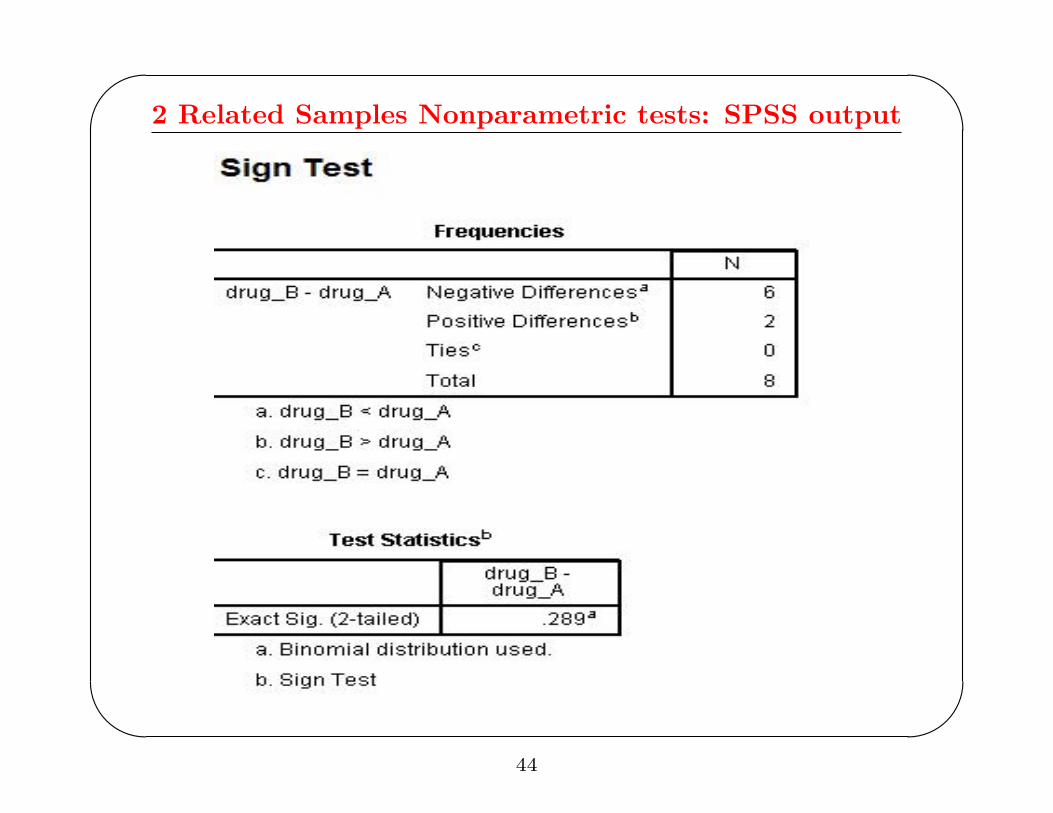
Sign test
Consider example 8.4The differences in time span between Drug A and Drug B areSubject 1 2 3 4 5 6 7 8Difference 2 4 -2 -1 4 5 3 1Sign + + - - + + + +Number of positive signs=6 and number of negative signs=2If there was no difference in the two drugs, we expect the numberof positive signs(i.e. A<B) should be more or less the same as thenumber of negative signs( i.e. B<A)
35
'
&
$
%
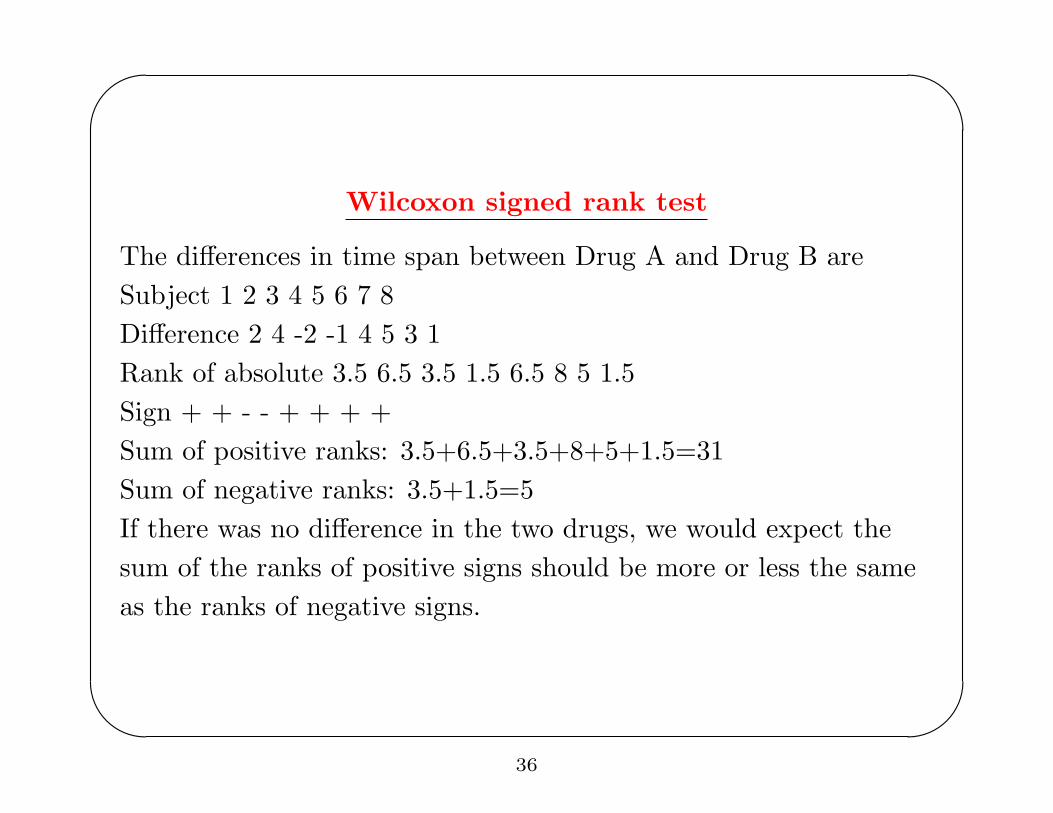
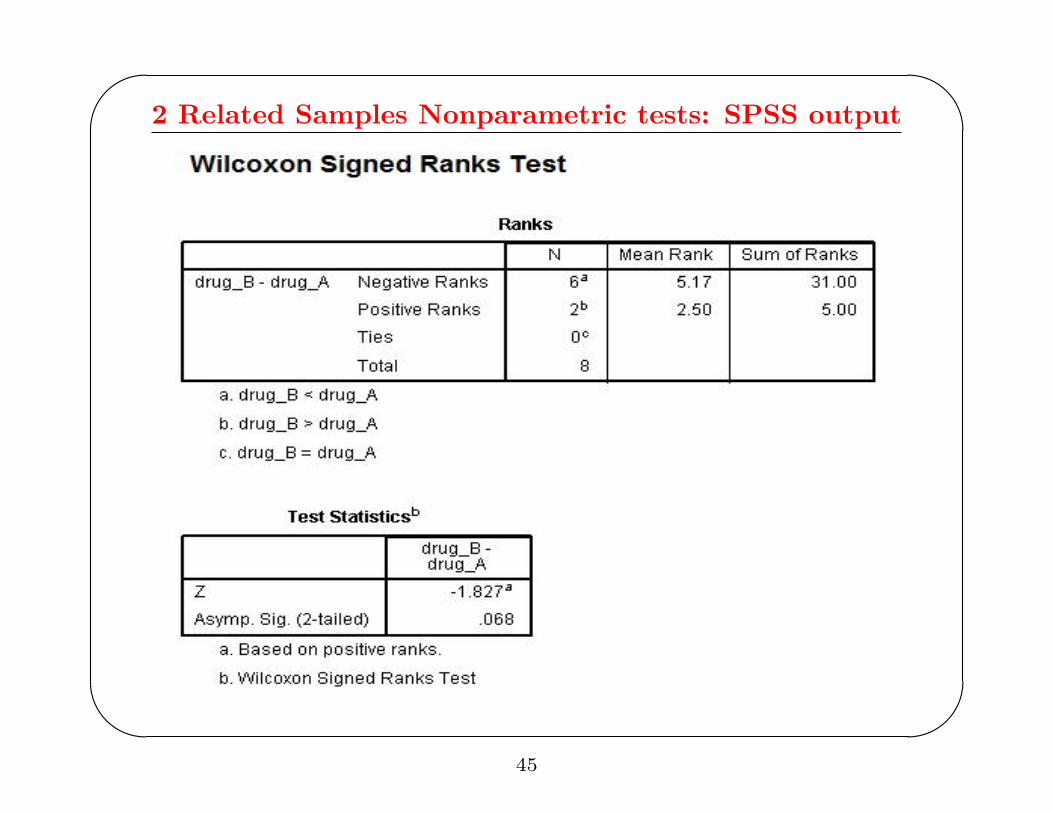
Wilcoxon signed rank test
The differences in time span between Drug A and Drug B areSubject 1 2 3 4 5 6 7 8Difference 2 4 -2 -1 4 5 3 1Rank of absolute 3.5 6.5 3.5 1.5 6.5 8 5 1.5Sign + + - - + + + +Sum of positive ranks: 3.5+6.5+3.5+8+5+1.5=31Sum of negative ranks: 3.5+1.5=5If there was no difference in the two drugs, we would expect thesum of the ranks of positive signs should be more or less the sameas the ranks of negative signs.
36
'
&
$
%
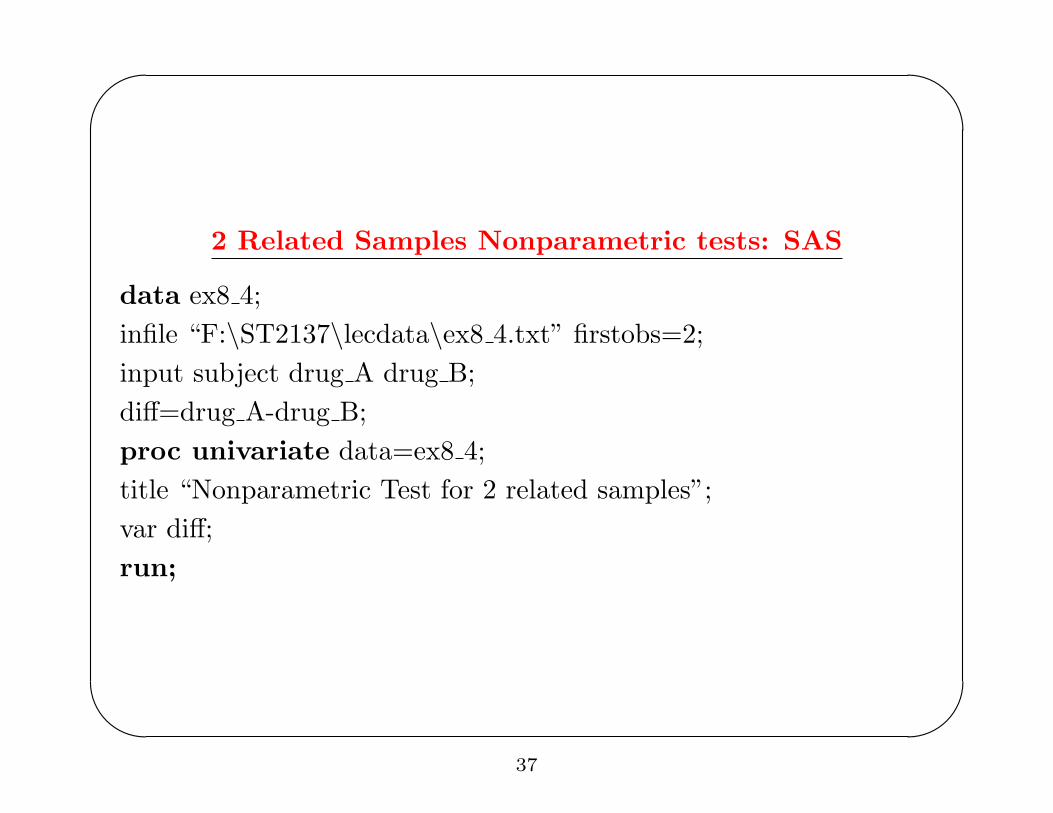
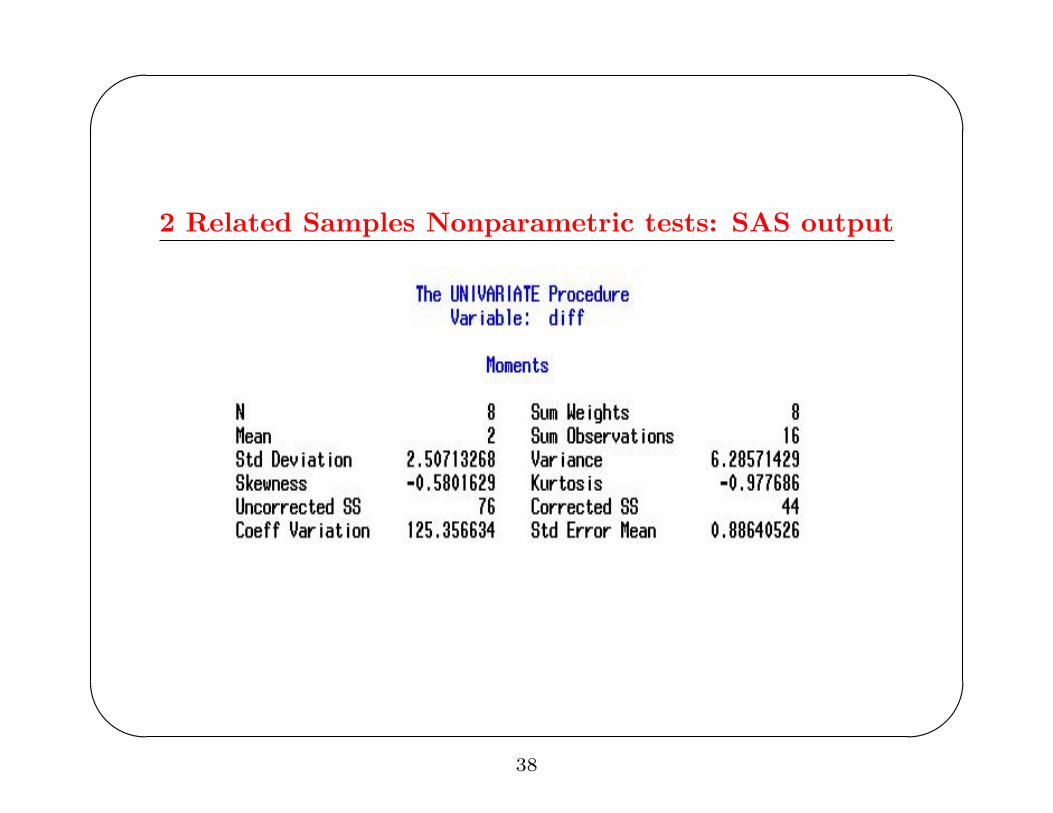
2 Related Samples Nonparametric tests: SAS
data ex8 4;infile “F:\ST2137\lecdata\ex8 4.txt” firstobs=2;input subject drug A drug B;diff=drug A-drug B;proc univariate data=ex8 4;title “Nonparametric Test for 2 related samples”;var diff;run;
37
'
&
$
%
2 Related Samples Nonparametric tests: SAS output
38
'
&
$
%
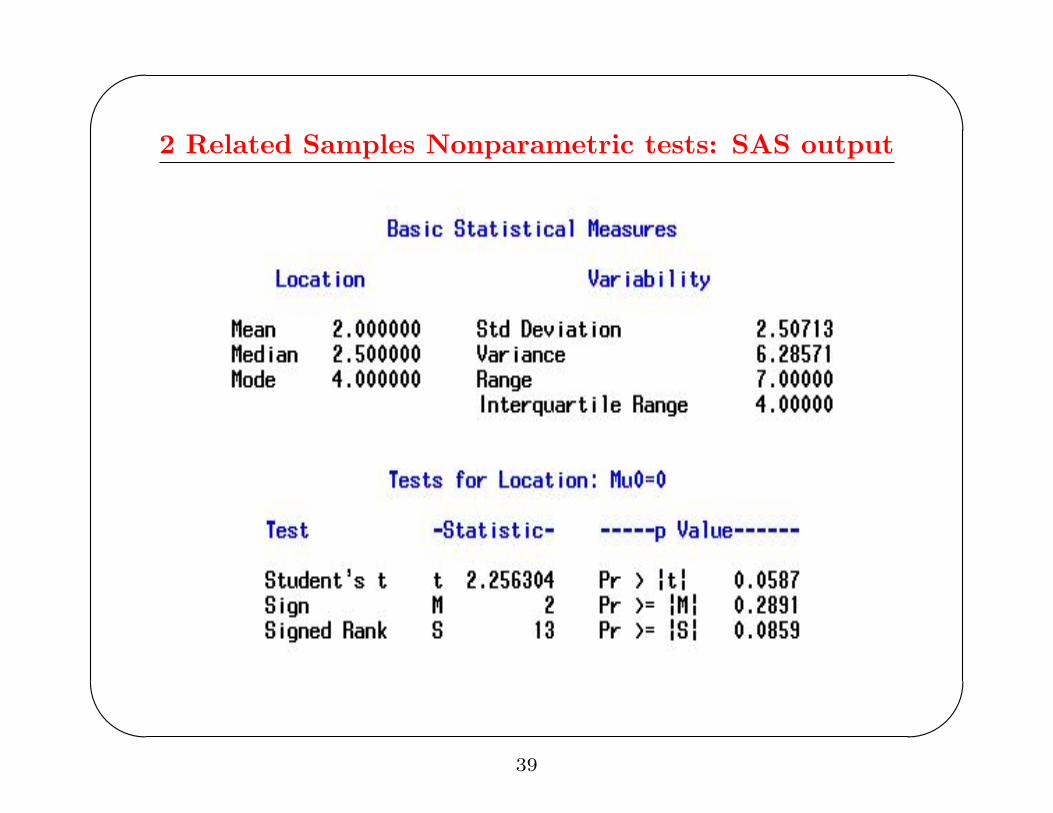
2 Related Samples Nonparametric tests: SAS output
39
'
&
$
%
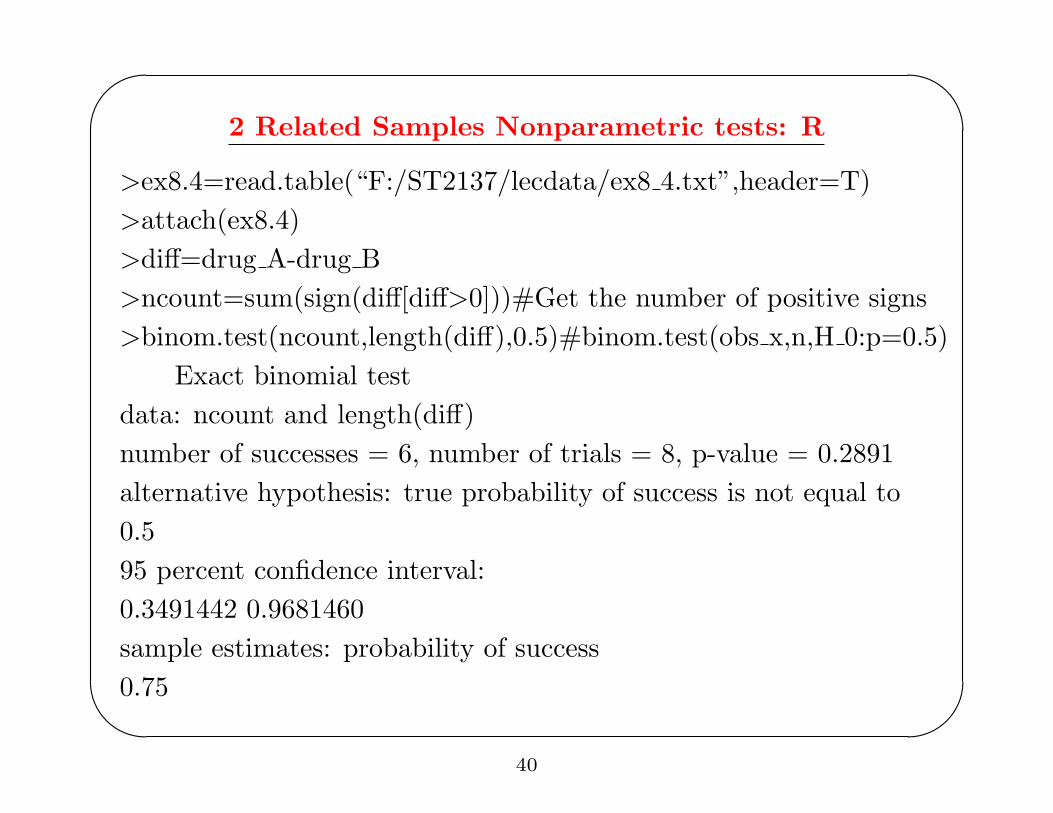
2 Related Samples Nonparametric tests: R
>ex8.4=read.table(“F:/ST2137/lecdata/ex8 4.txt”,header=T)>attach(ex8.4)>diff=drug A-drug B>ncount=sum(sign(diff[diff>0]))#Get the number of positive signs>binom.test(ncount,length(diff),0.5)#binom.test(obs x,n,H 0:p=0.5)
Exact binomial testdata: ncount and length(diff)number of successes = 6, number of trials = 8, p-value = 0.2891alternative hypothesis: true probability of success is not equal to0.595 percent confidence interval:0.3491442 0.9681460sample estimates: probability of success0.75
40
'
&
$
%
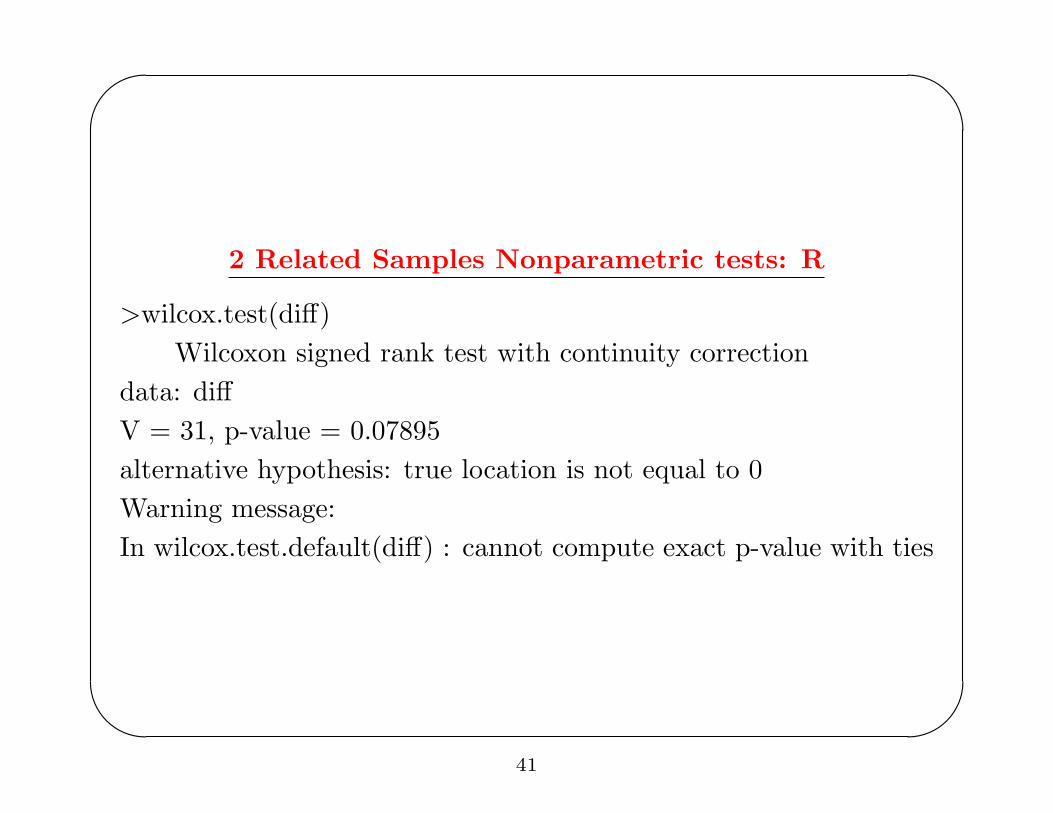
2 Related Samples Nonparametric tests: R
>wilcox.test(diff)Wilcoxon signed rank test with continuity correction
data: diffV = 31, p-value = 0.07895alternative hypothesis: true location is not equal to 0Warning message:In wilcox.test.default(diff) : cannot compute exact p-value with ties
41
'
&
$
%
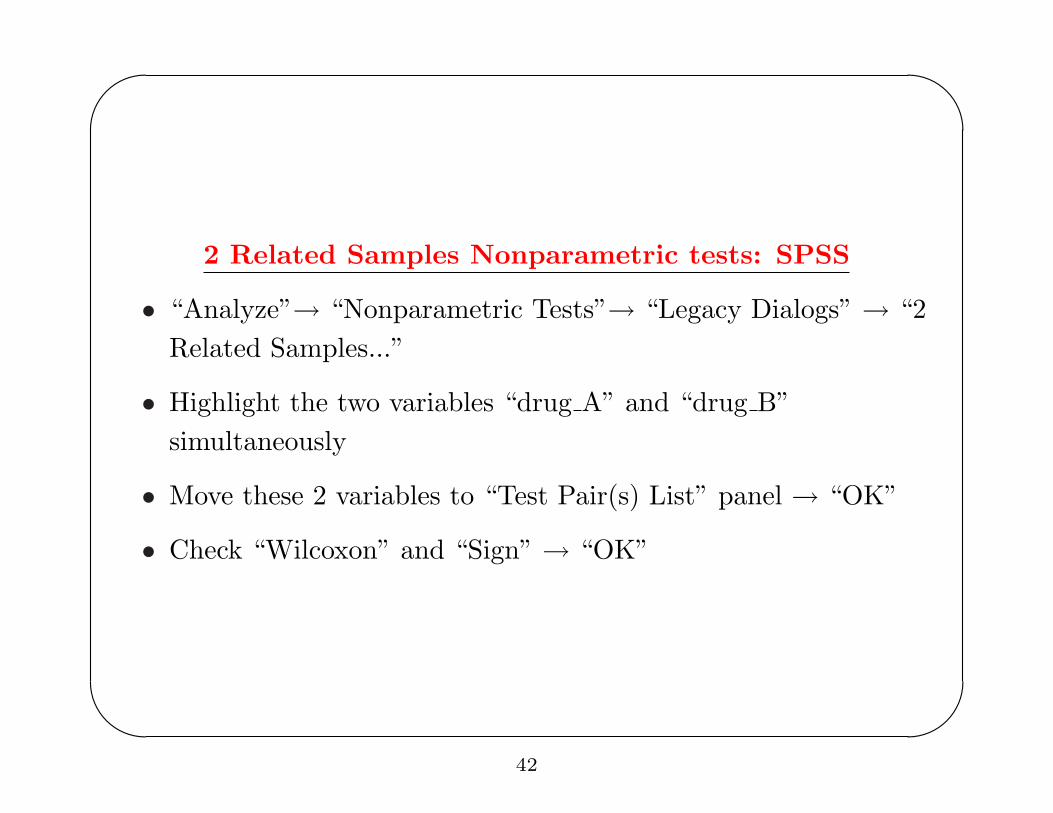
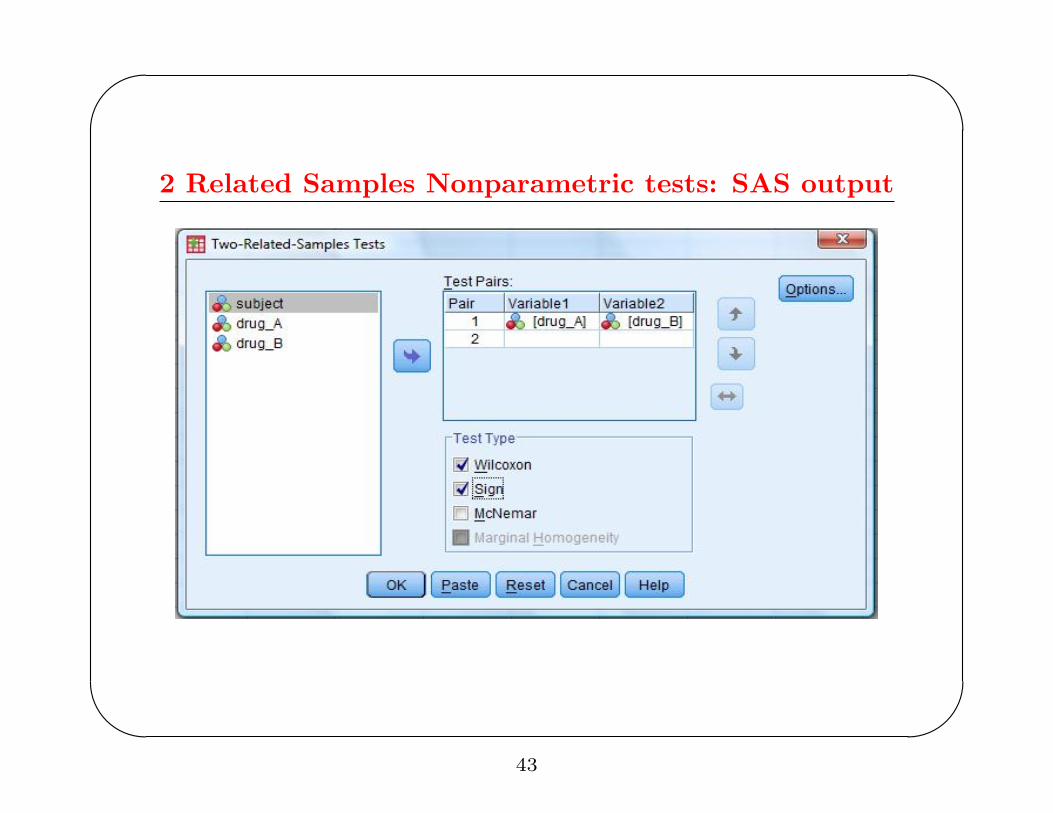
2 Related Samples Nonparametric tests: SPSS
• “Analyze”→ “Nonparametric Tests”→ “Legacy Dialogs” → “2Related Samples...”
• Highlight the two variables “drug A” and “drug B”simultaneously
• Move these 2 variables to “Test Pair(s) List” panel → “OK”
• Check “Wilcoxon” and “Sign” → “OK”
42
'
&
$
%
2 Related Samples Nonparametric tests: SAS output
43
'
&
$
%
2 Related Samples Nonparametric tests: SPSS output
44
'
&
$
%
2 Related Samples Nonparametric tests: SPSS output
45