Embed Size (px)
Citation preview
8/3/2019 Lecture 8 - Liquidity and Working Capital
http://slidepdf.com/reader/full/lecture-8-liquidity-and-working-capital 1/18
1
8Lecture
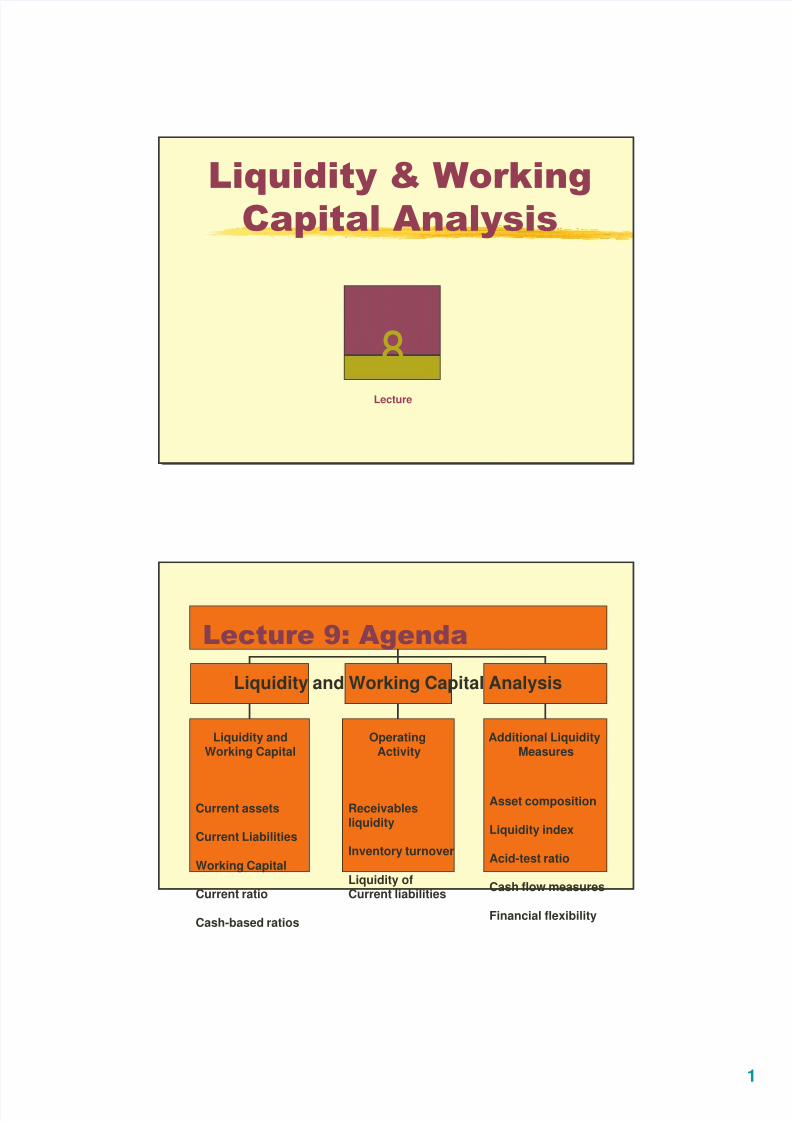
Liquidity and Working Capital Analysis
Liquidity andWorking Capital
Current assets
Current Liabilities
Working Capital
Current ratio
Cash-based ratios
Receivablesliquidity
Inventory turnover
Liquidity ofCurrent liabilities
OperatingActivity
Asset composition
Liquidity index
Acid-test ratio
Cash flow measures
Financial flexibility
Additional LiquidityMeasures
8/3/2019 Lecture 8 - Liquidity and Working Capital
http://slidepdf.com/reader/full/lecture-8-liquidity-and-working-capital 2/18
2
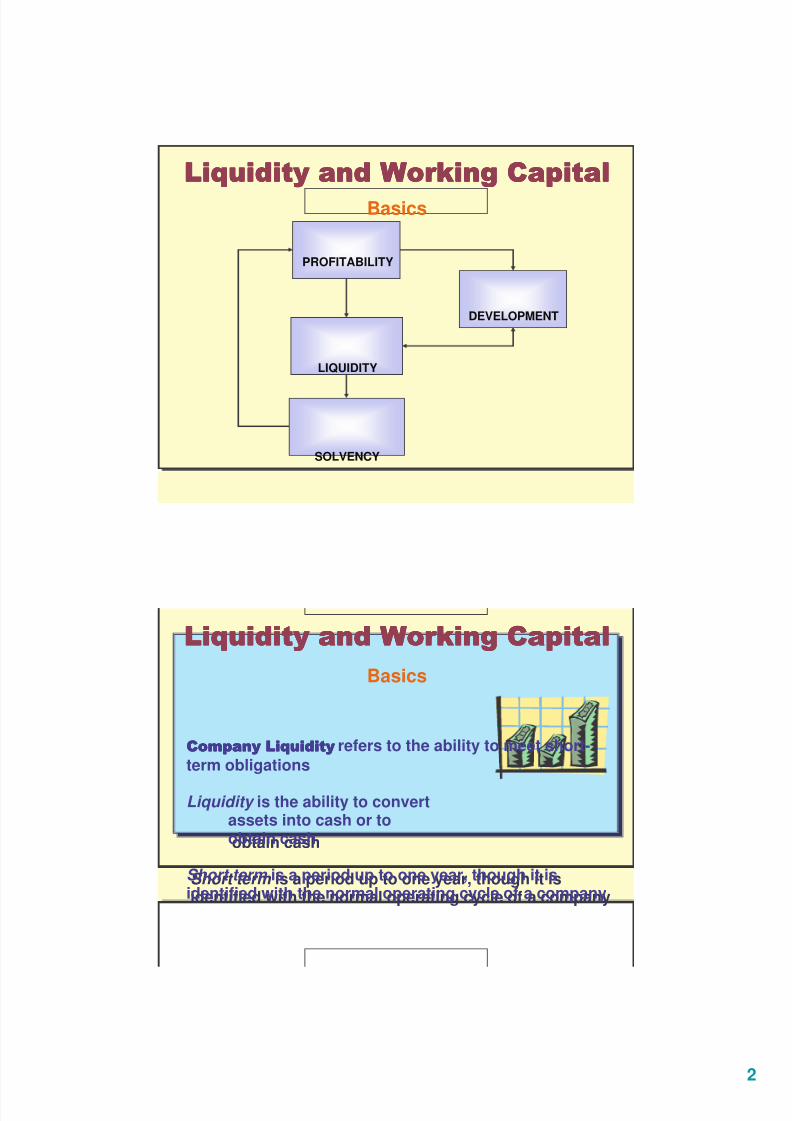
Basics
PROFITABILITY
DEVELOPMENT
LIQUIDITY
SOLVENCY
refers to the ability to meet short-term obligations
Liquidity is the ability to convertassets into cash or toobtain cash
Short term is a period up to one year, though it isidentified with the normal operating cycle of a company
refers to the ability to meet short-term obligations
Liquidity is the ability to convertassets into cash or toobtain cash
Short term is a period up to one year, though it isidentified with the normal operating cycle of a company
Basics
8/3/2019 Lecture 8 - Liquidity and Working Capital
http://slidepdf.com/reader/full/lecture-8-liquidity-and-working-capital 3/18
3
Liquidity is a matter of degreeLack of liquidity can limit:• Advantages of favorable discounts
• Profitable opportunities
• Management actions
• Coverage of current obligations
Severe illiquidity often precedes:• Lower profitability
• Restricted opportunities
• Loss of owner control
• Loss of capital investment
• Insolvency and bankruptcy
Liquidity is a matter of degreeLack of liquidity can limit:• Advantages of favorable discounts
• Profitable opportunities
• Management actions
• Coverage of current obligations
Severe illiquidity often precedes:
• Lower profitability• Restricted opportunities
• Loss of owner control
• Loss of capital investment
• Insolvency and bankruptcy
Basics
Current assets are cash and other assets reasonably expected to be(1) realized in cash, or (2) sold or consumed, during the longer of one-year or the company’s operating cycle
Current assets include:
Cash -- ultimate liquid asset
Cash equivalents -- temporary investments of excess cash
Marketable securities -- debt or equity securities held as s-t investments
Accounts receivable -- amounts due from credit sales
Inventories -- items held for sale in the normal course of business
Prepaid expenses -- advance payments for services and supplies
Current assets are cash and other assets reasonably expected to be(1) realized in cash, or (2) sold or consumed, during the longer of one-year or the company’s operating cycle
Current assets include:
Cash -- ultimate liquid asset
Cash equivalents -- temporary investments of excess cash
Marketable securities -- debt or equity securities held as s-t investments
Accounts receivable -- amounts due from credit sales
Inventories Inventories -- items held for sale in the normal coursenormal course of business
Prepaid expenses -- advance payments for services and supplies
Current Assets
8/3/2019 Lecture 8 - Liquidity and Working Capital
http://slidepdf.com/reader/full/lecture-8-liquidity-and-working-capital 4/18
4
Current liabilities are obligations expected to be satisfied within arelatively short period of time, usually one year
Current liabilities include:
Accounts payable
Notes payable
Short-term bank loans
Tax payable
Accrued expenses
Current portion of long-term debt
Current liabilities are obligations expected to be satisfied within arelatively short period of time, usually one year
Current liabilities include:
Accounts payable
Notes payable
Short-term bank loans
Tax payable
Accrued expenses
Current portion of long-term debt
Current Liabilities
is
defined as the excess of current assets over current liabilities
Widely used measure of short-term liquidity
Deficient when current liabilities exceed current assets
In surplus when current assets exceed current liabilities
A liquid reserve to meet contingencies and uncertainties
A margin of safety for creditors
A constraint for technical default in many debt agreements
is
defined as the excess of current assets over current liabilities
Widely used measure of short-term liquidity Deficient when current liabilities exceed current assets
In surplus when current assets exceed current liabilities
A liquid reserve to meet contingencies and uncertainties
A margin of safety for creditors
A constraint for technical default in many debt agreements
Working Capital
8/3/2019 Lecture 8 - Liquidity and Working Capital
http://slidepdf.com/reader/full/lecture-8-liquidity-and-working-capital 5/18
5
Working capital more relevant when related to other keyvariables such as
Sales
Total assets
Working capital is of limited value as an absoluteamount
Working capital more relevant when related to other keyvariables such as
Sales
Total assets
Working capital is of limited value as an absoluteamount
Working Capital
Current Ratio Reflects on:
• Current liability coverage -- assurance in covering currentliabilities
• Buffer against losses -- margin of safety for shrinkage innoncash current assets
• Reserve of liquid funds --margin of safetyagainst uncertainties and shocks to cash flows
Current Ratio
sliabilitieCurrent
assetsCurrent=ratio
8/3/2019 Lecture 8 - Liquidity and Working Capital
http://slidepdf.com/reader/full/lecture-8-liquidity-and-working-capital 6/18
6
1. Liquidity depends to a large extent on prospective cash flowsprospective cash flows
2.2. No direct relationNo direct relation between working capital account balancesand patterns of future cash flows
3.3. ManagerialManagerial policiespolicies are directed primarilyprimarily atat efficientefficient andandprofitableprofitable assetasset utilizationutilization and secondly at liquidity
4. Cash flow forecasts and pro forma financial statements arepreferred over the current ratio for liquidity and solvencyanalysis
5. Current ratio is a static measurestatic measure of the ability of currentassets to satisfy current liabilities
Current Ratio
Reasons for using the current ratio:1. Understandability2. Simplicity in computation3. Data availability
Two important elements must be evaluated andmeasured before the current ratio can usefully form abasis of analysis:
1. Quality of both current assets and current liabilities
2. Turnover rate of both current assets and currentliabilities
Current Ratio
8/3/2019 Lecture 8 - Liquidity and Working Capital
http://slidepdf.com/reader/full/lecture-8-liquidity-and-working-capital 7/18
7
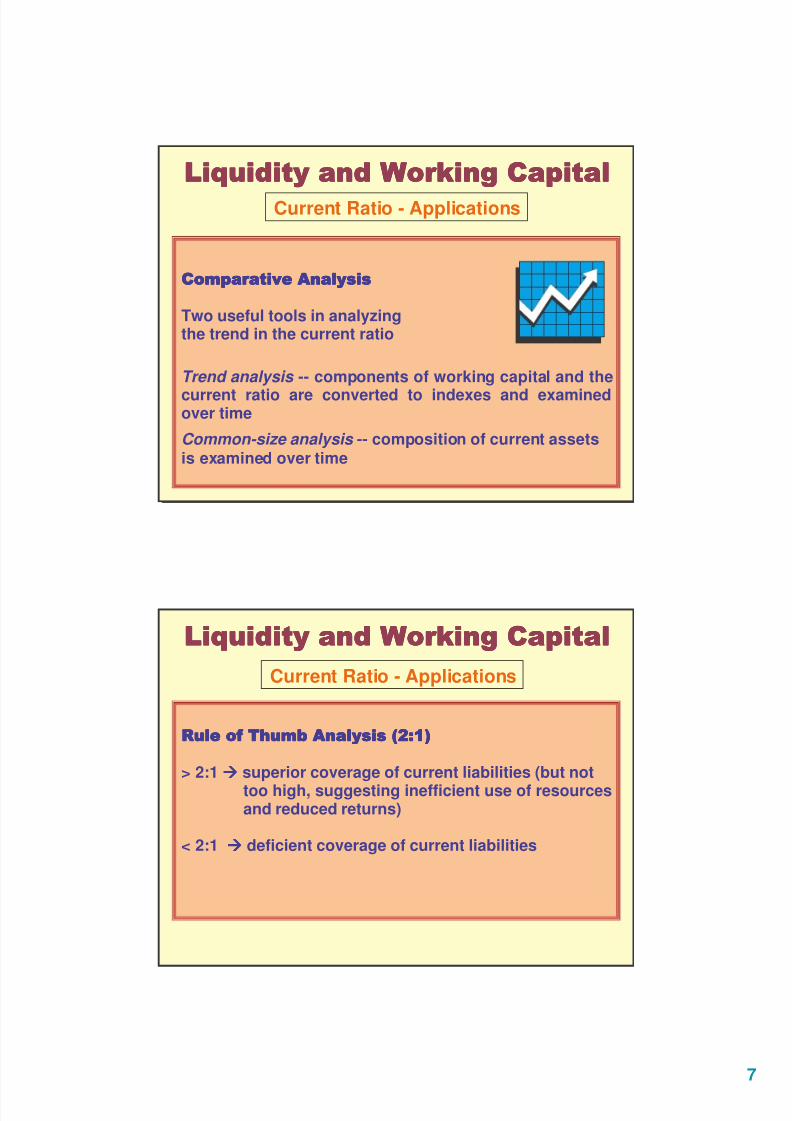
Two useful tools in analyzingthe trend in the current ratio
Trend analysis -- components of working capital and the
current ratio are converted to indexes and examinedover time
Common-size analysis -- composition of current assetsis examined over time
Current Ratio - Applications
!"#$%!"#$%!"#$%!"#$%
> 2:1 superior coverage of current liabilities (but not
too high, suggesting inefficient use of resourcesand reduced returns)
< 2:1 deficient coverage of current liabilities
Current Ratio - Applications
8/3/2019 Lecture 8 - Liquidity and Working Capital
http://slidepdf.com/reader/full/lecture-8-liquidity-and-working-capital 8/18
8
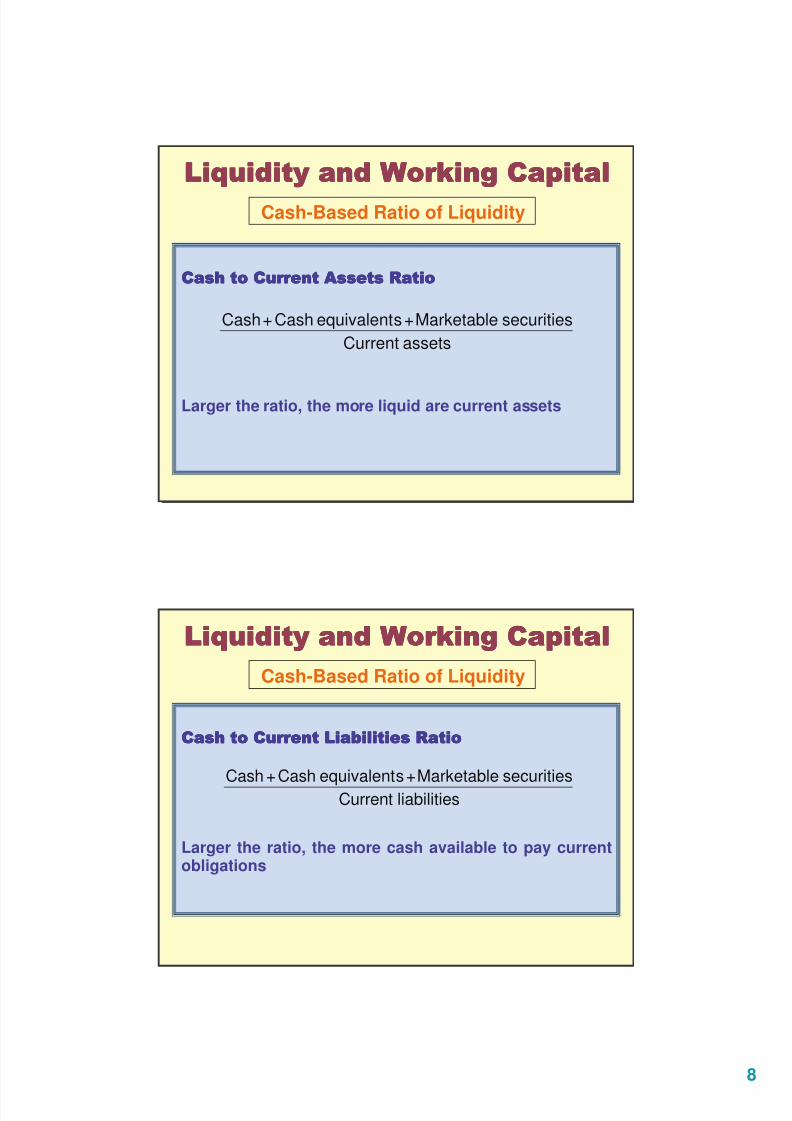
Larger the ratio, the more liquid are current assets
Cash-Based Ratio of Liquidity
assetsCurrent
securitiesMarketable+sequivalentCash+Cash
!!!!
Larger the ratio, the more cash available to pay currentobligations
sliabilitieCurrent
securitiesMarketable+sequivalentCash+Cash
Cash-Based Ratio of Liquidity
8/3/2019 Lecture 8 - Liquidity and Working Capital
http://slidepdf.com/reader/full/lecture-8-liquidity-and-working-capital 9/18
9
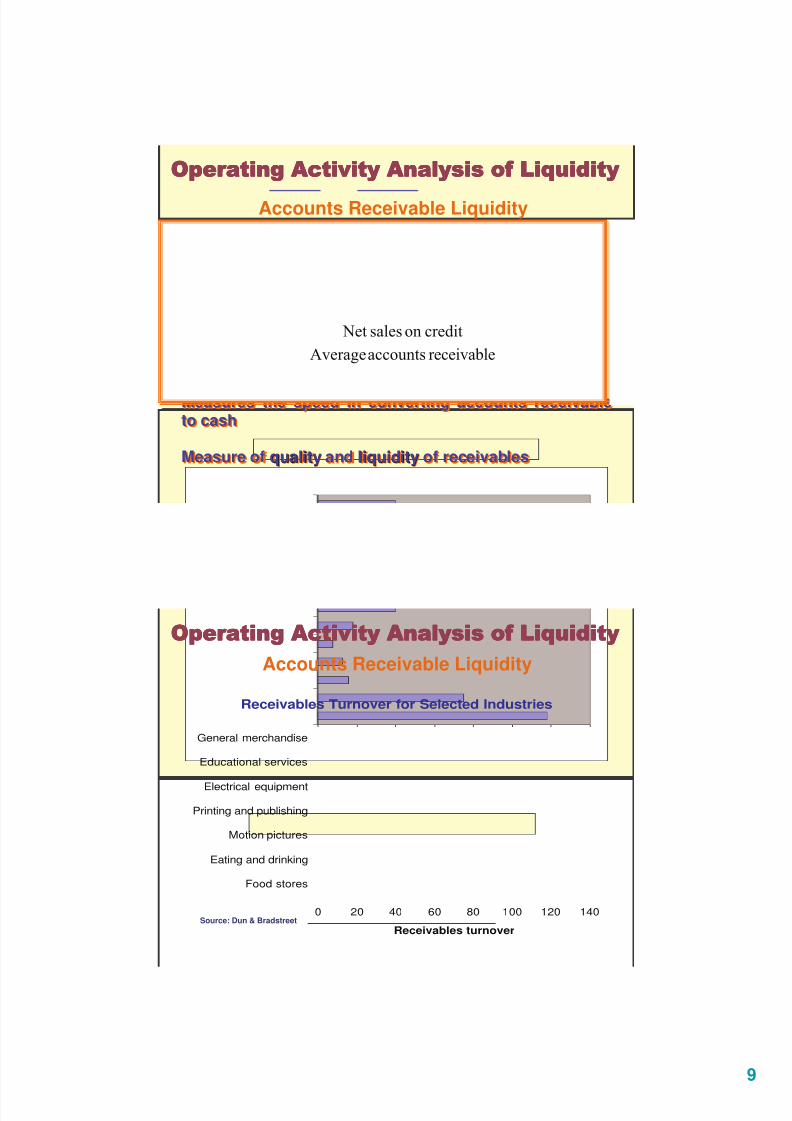
! ! ! !
Measures the speed in converting accounts receivableto cash
Measure of quality and liquidity of receivables
! ! ! !
Measures the speed in converting accounts receivableto cash
Measure of qualityquality and liquidityliquidity of receivables
&&&&
Accounts Receivable Liquidity
&&&&
Accounts Receivable Liquidity
Receivables Turnover for Selected Industries
0 20 40 60 80 100 120 140
Food stores
Eating and drinking
Motion pictures
Printing and publishing
Electrical equipment
Educational services
General merchandise
Receivables turnover
Source: Dun & Bradstreet
8/3/2019 Lecture 8 - Liquidity and Working Capital
http://slidepdf.com/reader/full/lecture-8-liquidity-and-working-capital 10/18
10
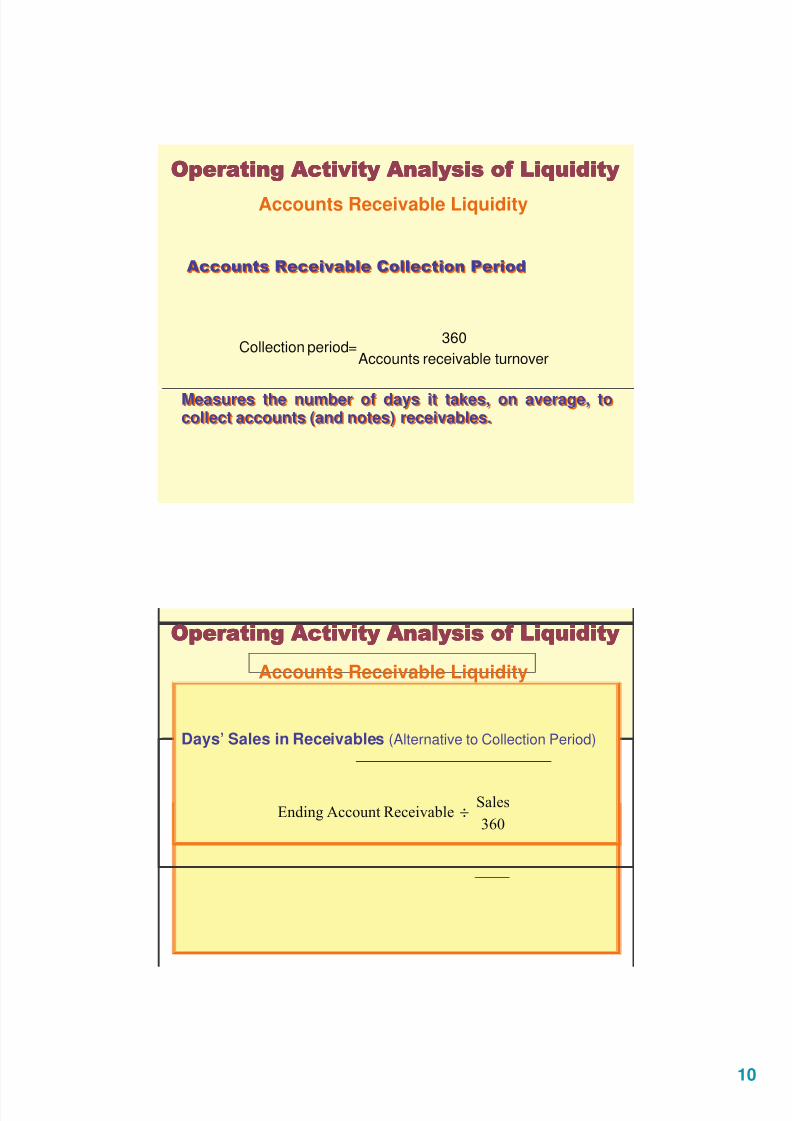
!'
Measures the number of days it takes, on average, tocollect accounts (and notes) receivables.
!'
Measures the number of days it takes, on average, tocollect accounts (and notes) receivables.
&&&&
Accounts Receivable Liquidity
turnoverreceivableAccounts
360=periodCollection
Days’ Sales in Receivables (Alternative to Collection Period)Days’ Sales in Receivables (Alternative to Collection Period)
&&&&
Accounts Receivable Liquidity
÷
8/3/2019 Lecture 8 - Liquidity and Working Capital
http://slidepdf.com/reader/full/lecture-8-liquidity-and-working-capital 11/18
11
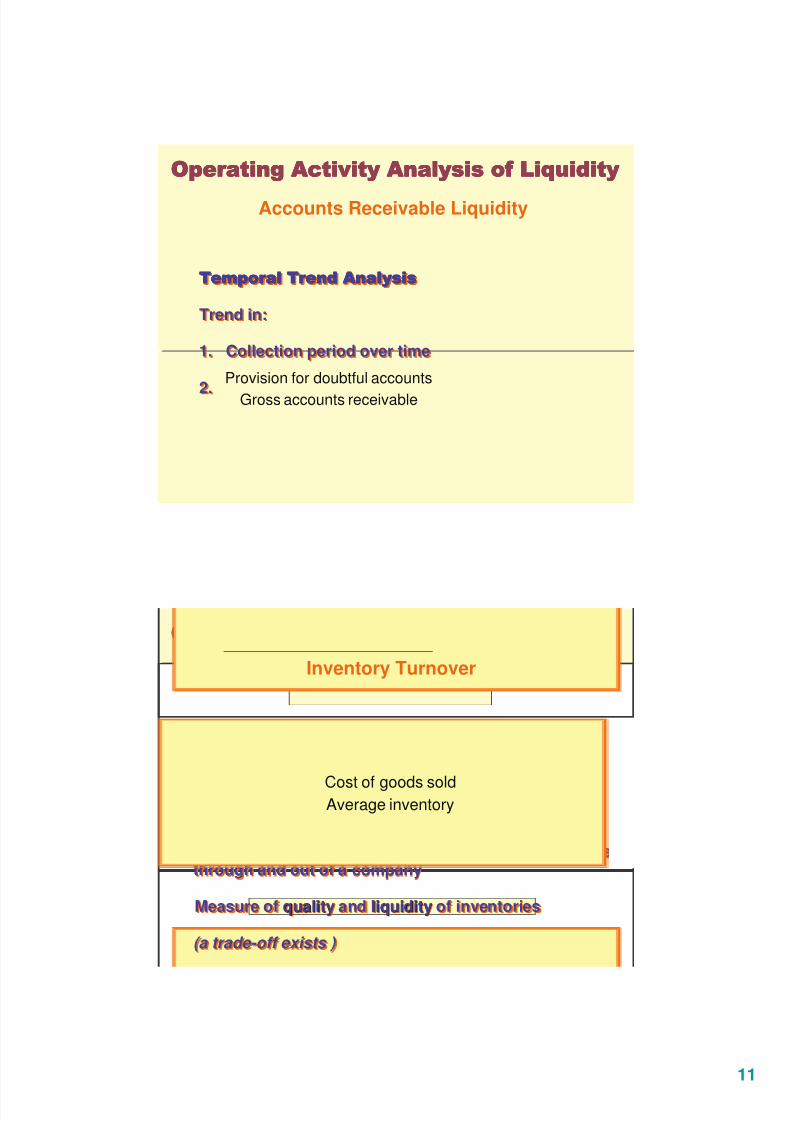
Trend in:
1. Collection period over time
2.
Trend in:
1. Collection period over time
2.
&&&&
Accounts Receivable Liquidity
receivableaccountsGross
accountsdoubtfulforProvision
( ( ( (
Measures the average rate of speed inventories movethrough and out of a company
Measure of quality and liquidity of inventories
(a trade-off exists )
( ( ( (
Measures the average rate of speed inventories movethrough and out of a company
Measure of qualityquality and liquidityliquidity of inventories
(a trade-off exists )
&&&&
Inventory Turnover
inventoryAveragesoldgoodsofCost
8/3/2019 Lecture 8 - Liquidity and Working Capital
http://slidepdf.com/reader/full/lecture-8-liquidity-and-working-capital 12/18
12
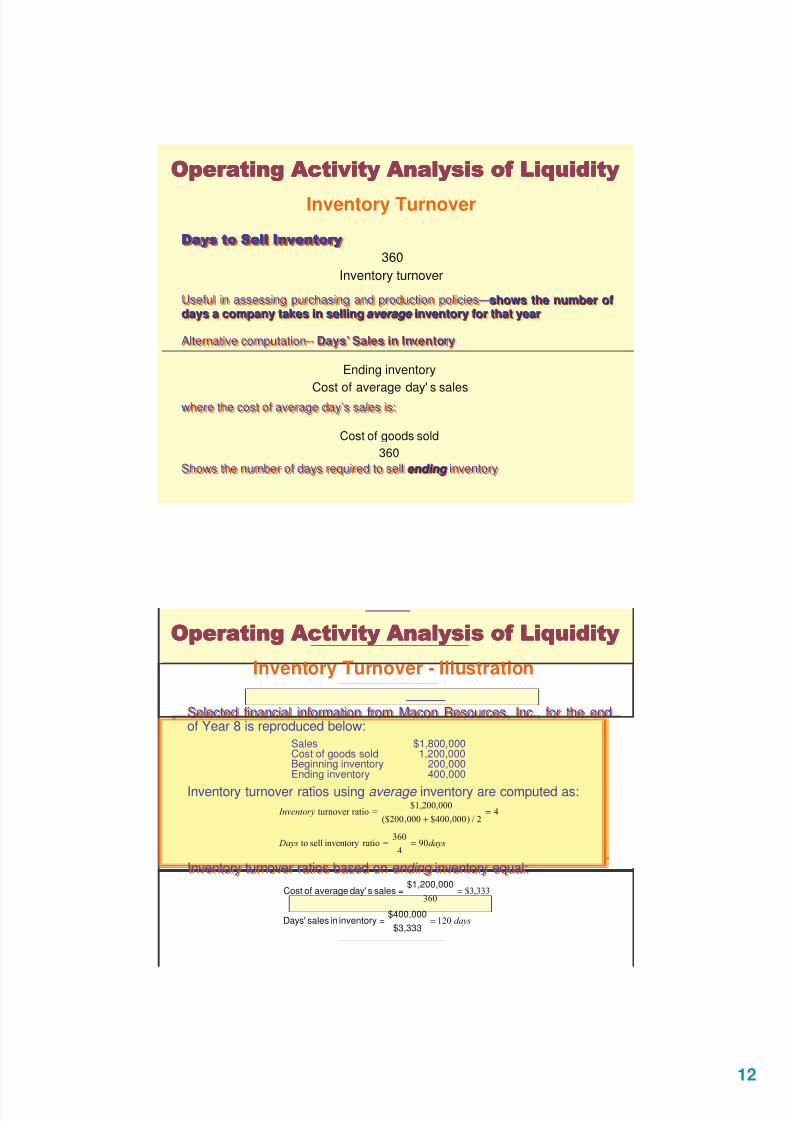
)()()()(
Useful in assessing purchasing and production policies—shows the number ofdays a company takes in selling average inventory for that year
Alternative computation-- Days’ Sales in Inventory
where the cost of average day’s sales is:
Shows the number of days required to sell ending inventory
)()()()(
Useful in assessing purchasing and production policies—shows the number ofshows the number ofdays a company takes in sellingdays a company takes in selling average average inventory for that yearinventory for that year
Alternative computation-- Days’ Sales in Inventory
where the cost of average day’s sales is:
Shows the number of days required to sell ending ending inventory
&&&&
Inventory Turnover
turnoverInventory
360
salessday'averageofCost
inventoryEnding
360
soldgoodsofCost
Selected financial information from Macon Resources, Inc., for the endof Year 8 is reproduced below:
Sales $1,800,000Cost of goods sold 1,200,000Beginning inventory 200,000Ending inventory 400,000
Inventory turnover ratios using average inventory are computed as:
Inventory turnover ratios based on ending inventory equal:
&&&&
Inventory Turnover - Illustration
!"!
!#
=
=
+
$3,333
$400,000=inventoryinsalesDays'
$1,200,000=salessday'averageofCost
#
!
=
=
8/3/2019 Lecture 8 - Liquidity and Working Capital
http://slidepdf.com/reader/full/lecture-8-liquidity-and-working-capital 13/18
13
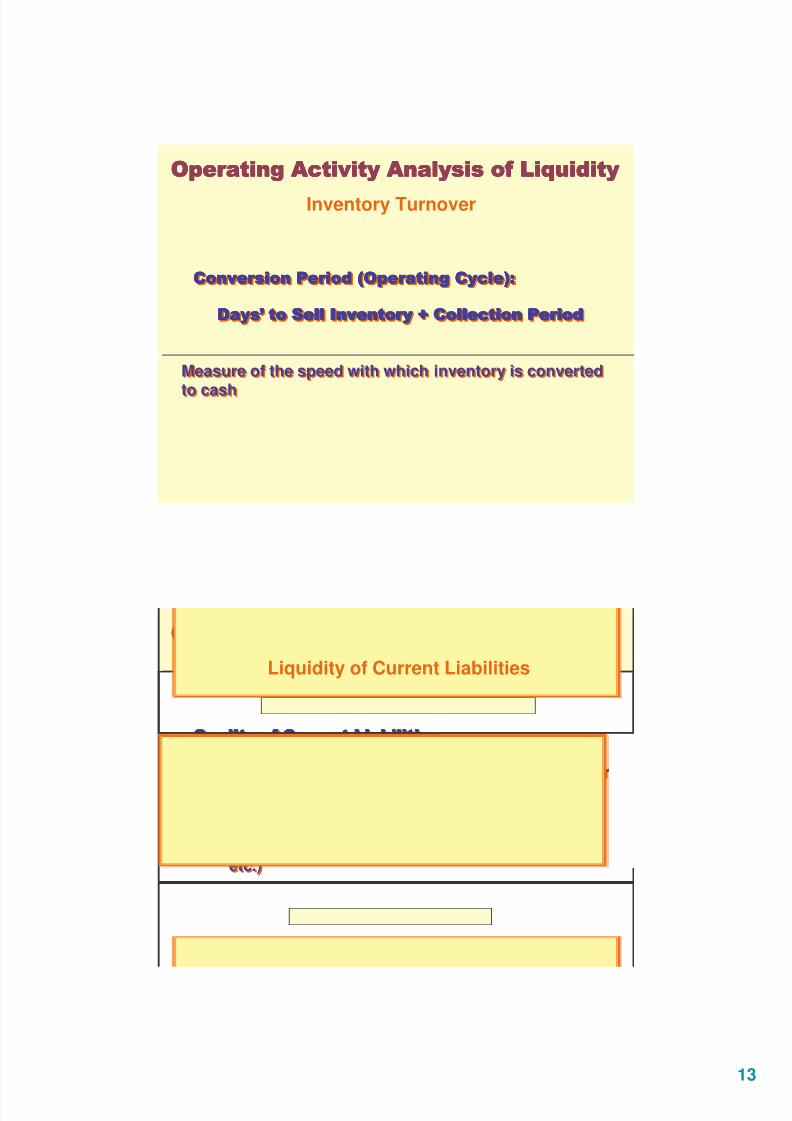
'"&%'"&%'"&%'"&%
))))**** (+'(+'(+'(+'
Measure of the speed with which inventory is converted
to cash
'"&%'"&%'"&%'"&%
))))**** (+'(+'(+'(+'
Measure of the speed with which inventory is converted
to cash
&&&&
Inventory Turnover
,!,!,!,!
• Must be judged on their degree of urgency inpayment
• Must be aware of unrecorded liabilities having aclaim on current funds (i.e. wages, insurances,etc.)
,!,!,!,!
• Must be judged on their degree of urgencurgencyy inin
paymentpayment
• Must be aware of unrecorded liabilitiesunrecorded liabilities having aclaim on current funds (i.e. wages, insurances,etc.)
&&&&
Liquidity of Current Liabilities
8/3/2019 Lecture 8 - Liquidity and Working Capital
http://slidepdf.com/reader/full/lecture-8-liquidity-and-working-capital 14/18
14
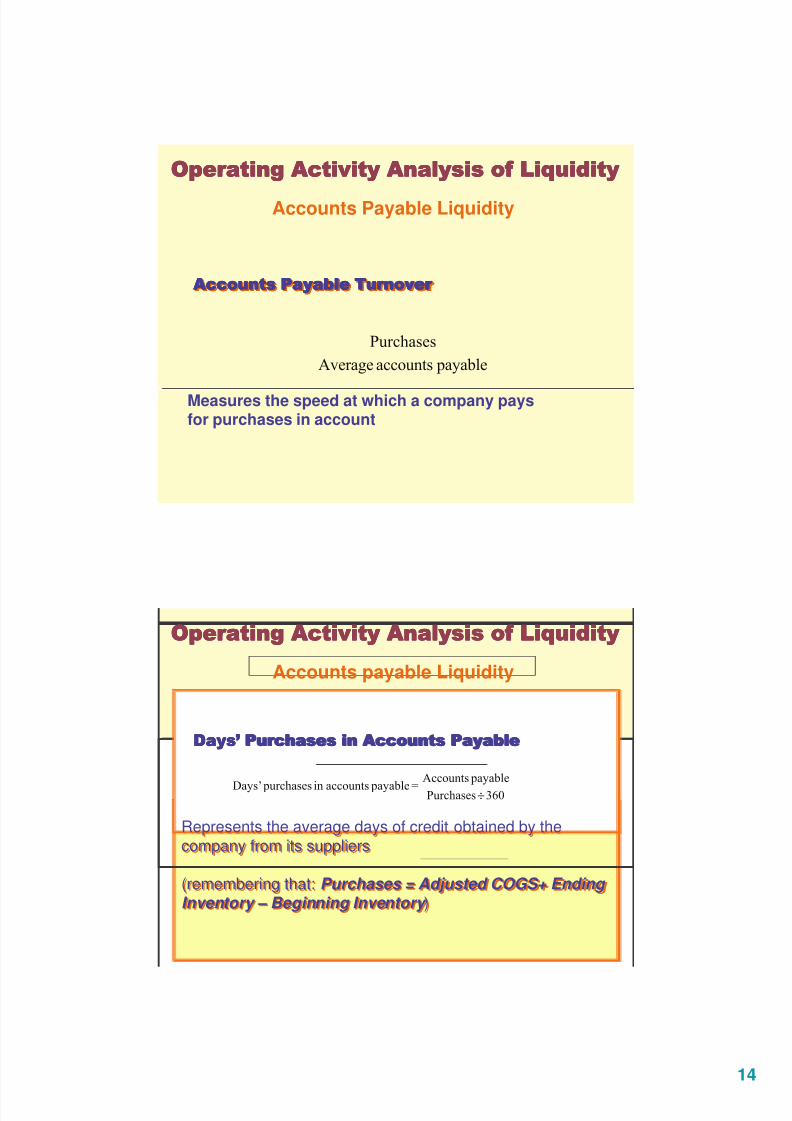
'!'!'!'! '!'!'!'!
&&&&
Accounts Payable Liquidity
$
%&
Measures the speed at which a company paysfor purchases in account
))))**** ''!''!''!''!
Represents the average days of credit obtained by thecompany from its suppliers
(remembering that: Purchases = Adjusted COGS+ Ending Inventory – Beginning Inventory )
))))**** ''!''!''!''!
Represents the average days of credit obtained by thecompany from its suppliers
(remembering that: Purchases = Adjusted COGS+ Ending Inventory – Beginning Inventory )
&&&&
%&
$ $ $&'(
÷
Accounts payable Liquidity
8/3/2019 Lecture 8 - Liquidity and Working Capital
http://slidepdf.com/reader/full/lecture-8-liquidity-and-working-capital 15/18
15
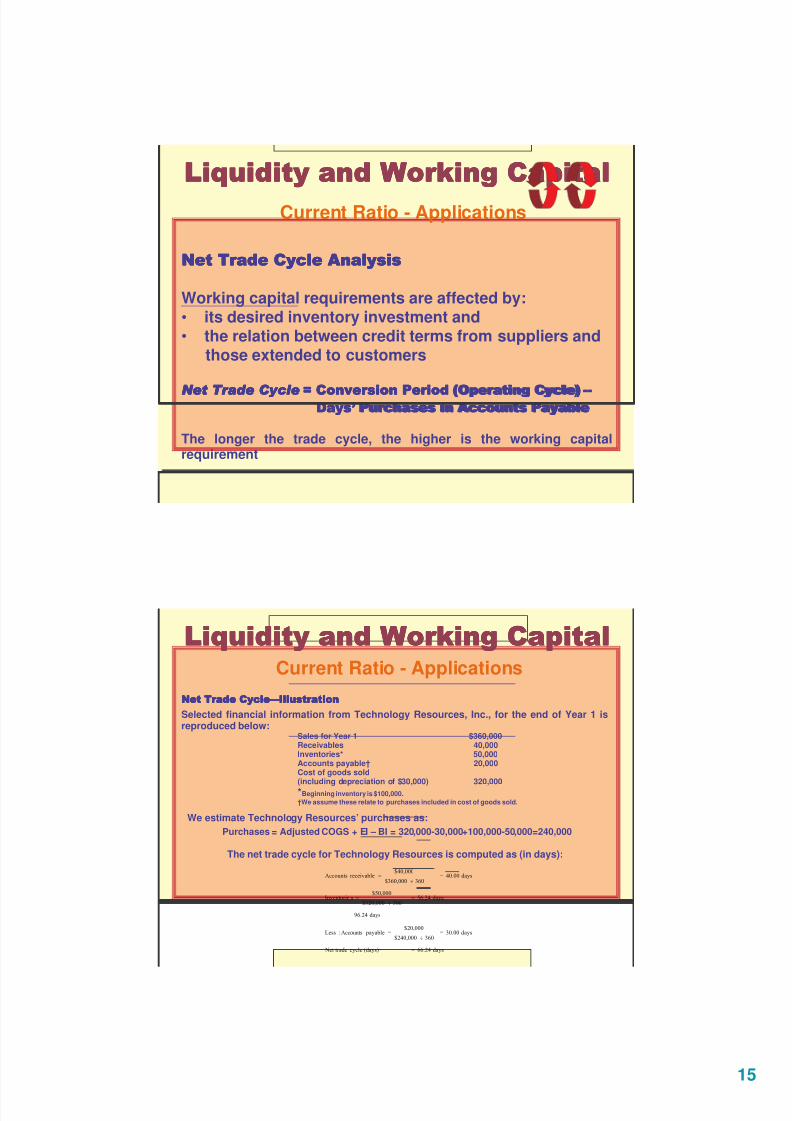
----
Working capital requirements are affected by:• its desired inventory investment and• the relation between credit terms from suppliers and
those extended to customers
....'"&%'"&%'"&%'"&% ////////))))**** ''!''!''!''!
The longer the trade cycle, the higher is the working capitalrequirement
Current Ratio - Applications
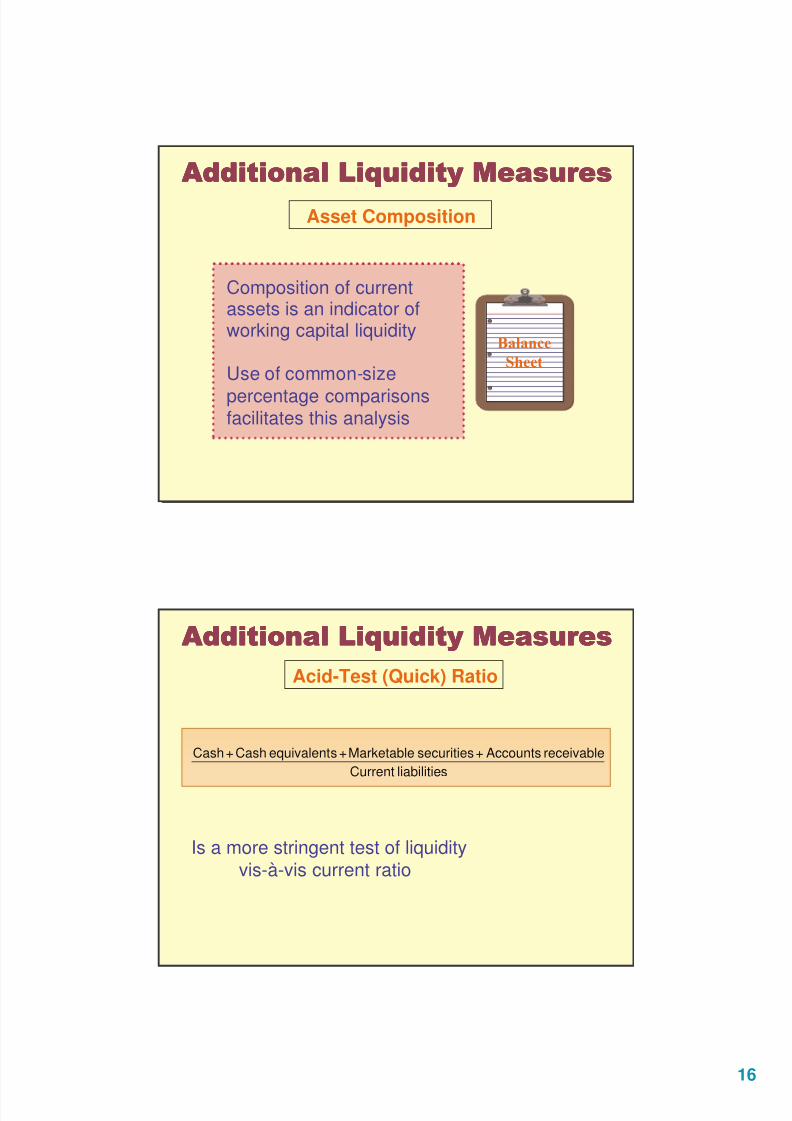
----0 00 0((((
Selected financial information from Technology Resources, Inc., for the end of Year 1 isreproduced below:
Sales for Year 1 $360,000Receivables 40,000Inventories* 50,000Accounts payable† 20,000Cost of goods sold
(including depreciation of $30,000) 320,000*Beginning inventory is $100,000.
†We assume these relate to purchases included in cost of goods sold.
We estimate Technology Resources’ purchases as:
Purchases = Adjusted COGS + EI – BI = 320,000-30,000+100,000-50,000=240,000
The net trade cycle for Technology Resources is computed as (in days):
)"
)!
! $*+
)
,)!
!,-
)!
!
÷
÷
÷
Current Ratio - Applications
8/3/2019 Lecture 8 - Liquidity and Working Capital
http://slidepdf.com/reader/full/lecture-8-liquidity-and-working-capital 16/18
16
1111
Asset Composition
Composition of currentassets is an indicator ofworking capital liquidity
Use of common-size
percentage comparisonsfacilitates this analysis
Acid-Test (Quick) Ratio
sliabilitieCurrent
receivableAccounts+securitiesMarketable+sequivalentCash+Cash
Is a more stringent test of liquidityvis-à-vis current ratio
1111
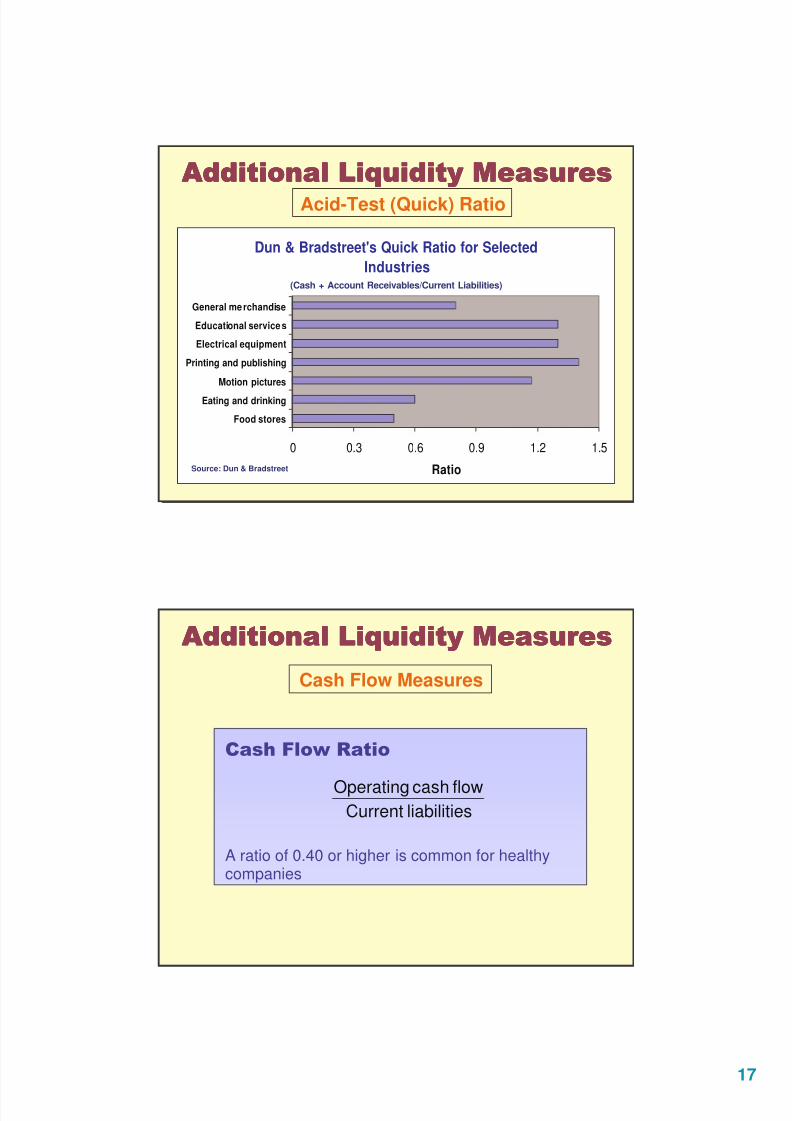
8/3/2019 Lecture 8 - Liquidity and Working Capital
http://slidepdf.com/reader/full/lecture-8-liquidity-and-working-capital 17/18
17
Dun & Bradstreet's Quick Ratio for Selected
Industries
0 0.3 0.6 0.9 1.2 1.5
Food stores
Eating and drinking
Motion pictures
Printing and publishing
Electrical equipment
Educational service s
General me rchandise
Ratio
Acid-Test (Quick) Ratio
1111
Source: Dun & Bradstreet
(Cash + Account Receivables/Current Liabilities)
Cash Flow Measures
23
A ratio of 0.40 or higher is common for healthycompanies
sliabilitieCurrentflowcashOperating
1111
8/3/2019 Lecture 8 - Liquidity and Working Capital
http://slidepdf.com/reader/full/lecture-8-liquidity-and-working-capital 18/18
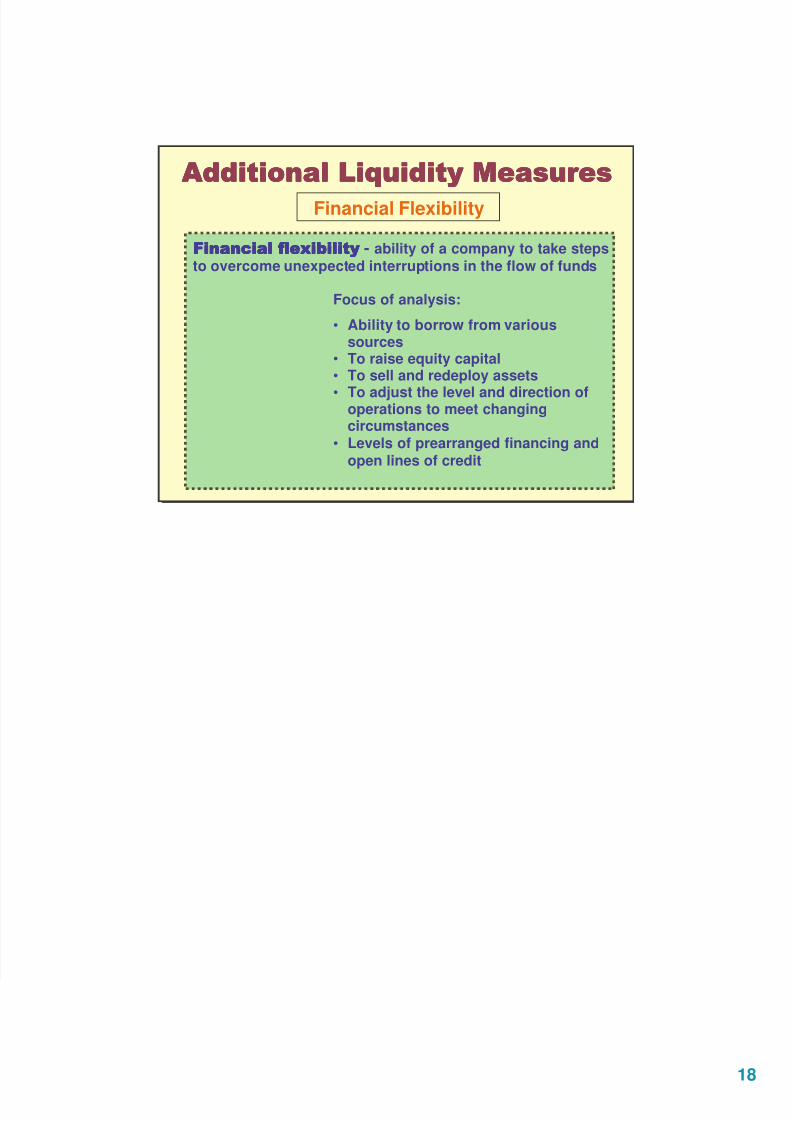
Financial Flexibility
24!24!24!24!- ability of a company to take stepsto overcome unexpected interruptions in the flow of funds
Focus of analysis:
• Ability to borrow from varioussources
• To raise equity capital• To sell and redeploy assets
• To adjust the level and direction ofoperations to meet changingcircumstances
• Levels of prearranged financing andopen lines of credit
1111