Embed Size (px)
Citation preview
Lecture 4
Synchronization and Deadlocks
Lecture Highlights Introduction to Process
Synchronization and Deadlock Handling
Synchronization Methods Deadlocks
What are deadlocks The four necessary conditions
Deadlock Handling
Synchronization and Deadlock HandlingAn Introduction
Concurrent access to shared data can result in data inconsistency.
To ensure orderly execution of processes , the operating system provides mechanisms for job synchronization and communication.
A deadlock state is a state of indefinite wait by one or more processes for an event that can be triggered only by one of the waiting processes.
Operating system also provides mechanisms to ensure that jobs do not get stuck in a deadlock, forever waiting for each other.
Process SynchronizationAn Example
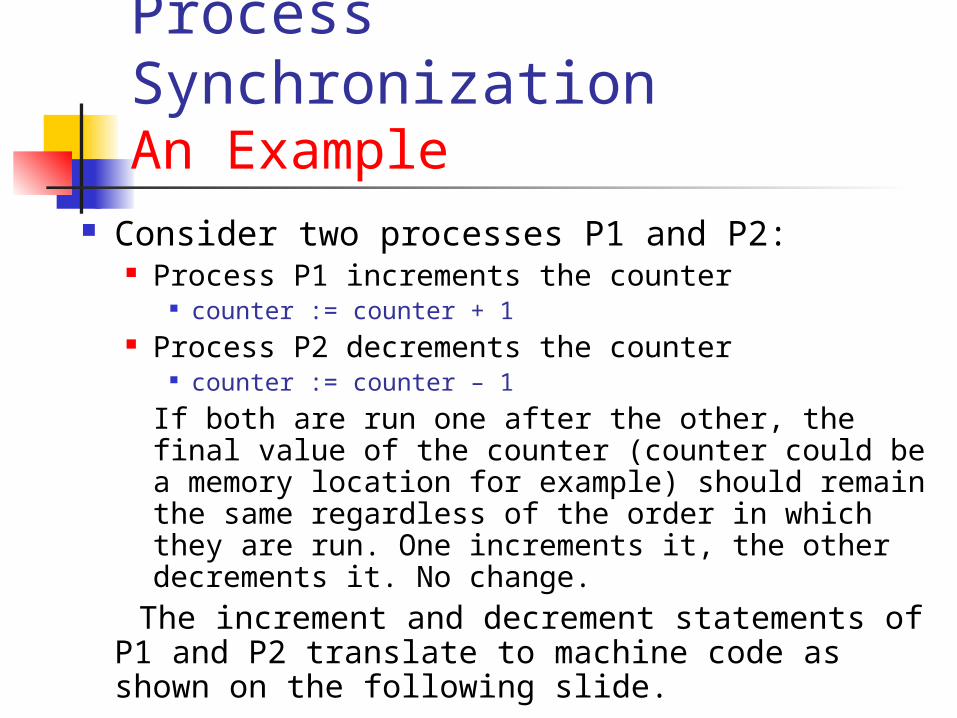
Consider two processes P1 and P2: Process P1 increments the counter
counter := counter + 1 Process P2 decrements the counter
counter := counter – 1
If both are run one after the other, the final value of the counter (counter could be a memory location for example) should remain the same regardless of the order in which they are run. One increments it, the other decrements it. No change.
The increment and decrement statements of P1 and P2 translate to machine code as shown on the following slide.
Process SynchronizationAn Example
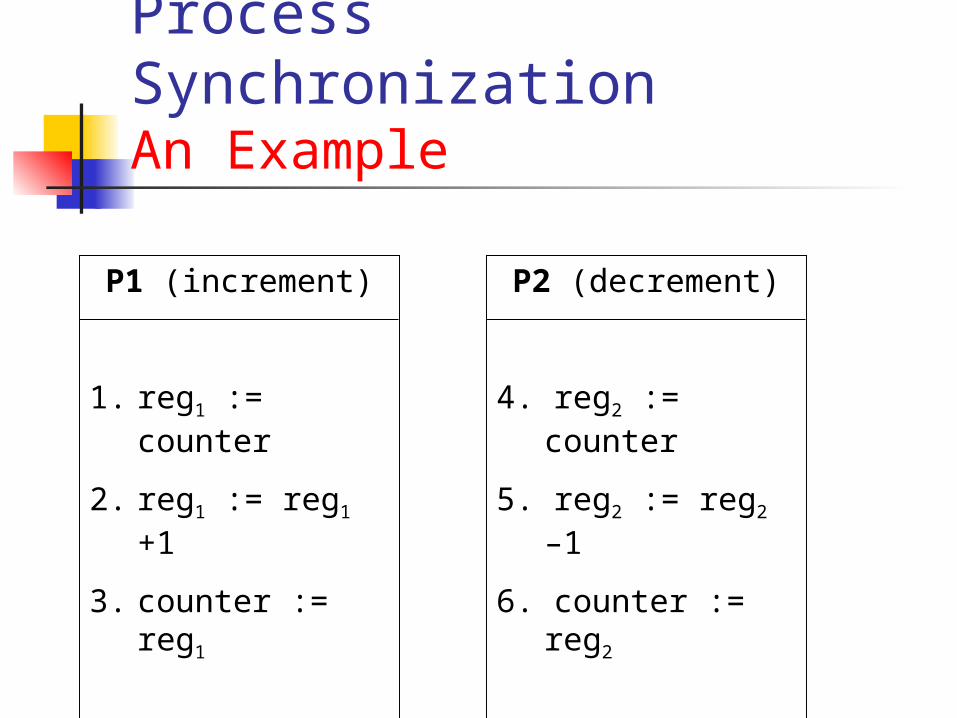
P1 (increment)
1. reg1 := counter
2. reg1 := reg1 +1
3. counter := reg1
P2 (decrement)
4. reg2 := counter
5. reg2 := reg2 –1
6. counter := reg2
Process SynchronizationAn Example
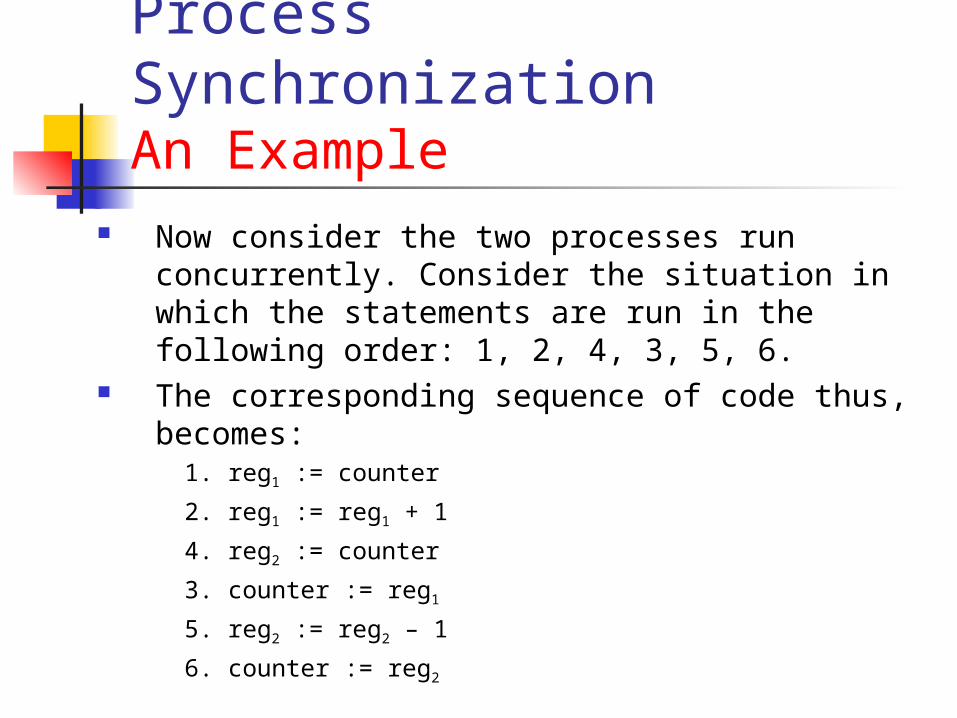
Now consider the two processes run concurrently. Consider the situation in which the statements are run in the following order: 1, 2, 4, 3, 5, 6.
The corresponding sequence of code thus, becomes:
1. reg1 := counter
2. reg1 := reg1 + 1
4. reg2 := counter
3. counter := reg1
5. reg2 := reg2 – 1
6. counter := reg2
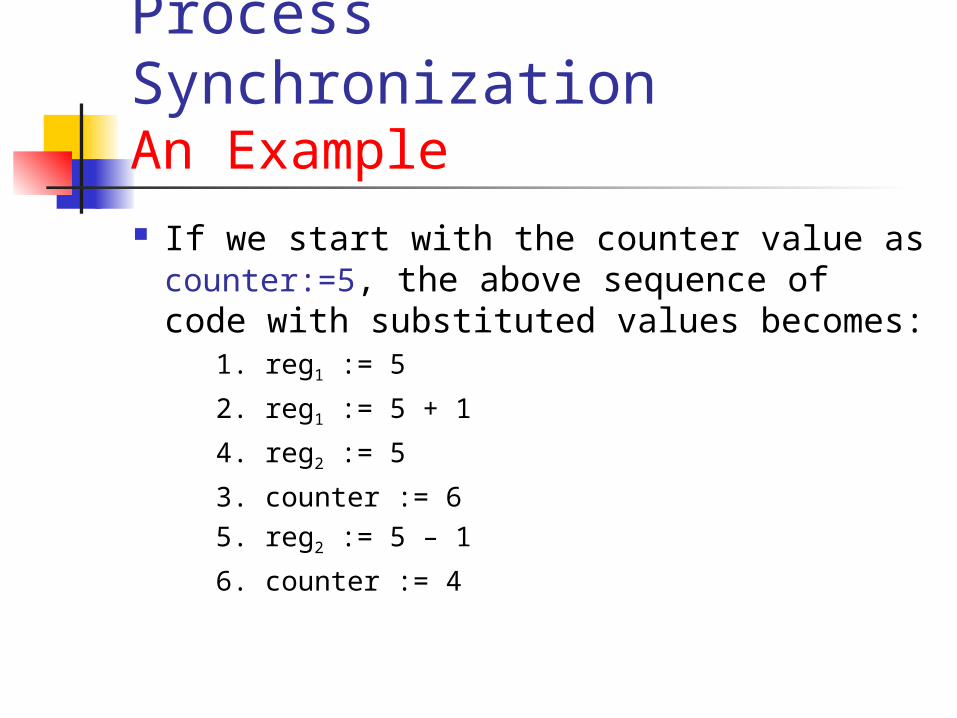
Process SynchronizationAn Example If we start with the counter value as
counter:=5, the above sequence of code with substituted values becomes:
1. reg1 := 5
2. reg1 := 5 + 1
4. reg2 := 5
3. counter := 6
5. reg2 := 5 – 1
6. counter := 4
Process SynchronizationAn Example Thus, we see from the preceding
sequence of code that the counter will not be unchanged upon completion but will be rather decremented by 1.
The above stated problem arose because both sections of code constitute critical sections and these critical sections interleaved. The critical sections must be run atomically.
Process SynchronizationCritical Section and Race Condition A Critical Section is a part of a process that
accesses shared resources. Two processes should not be allowed to enter their critical sections at the same time, thus preventing the above problem.
The situation where several processes access and manipulate the same data concurrently, and the outcome of the execution depends on the particular order in which the access takes place, is called a race condition.
Process SynchronizationMore on Critical SectionImportant points to note about critical
sections: A critical section must be run atomically.
This means that the section is executed either as a whole or not at all. Once the critical section of a process begins, it must be completed or rolled back.
Mutual exclusion of more than one critical section must be ensured
Mutual exclusion is ensured by using pieces of code to block a process that attempts to run its critical section while the critical section of another process is being executed. The process is unblocked when the other process’s critical section completes execution. This is known as Sleep and Wakeup.
Process SynchronizationSynchronization Methods
There are three ways to implement Sleep and Wakeup in order to synchronize processes. The three synchronization methods are: Semaphores Monitors Message Passing
Synchronization MethodsSemaphores
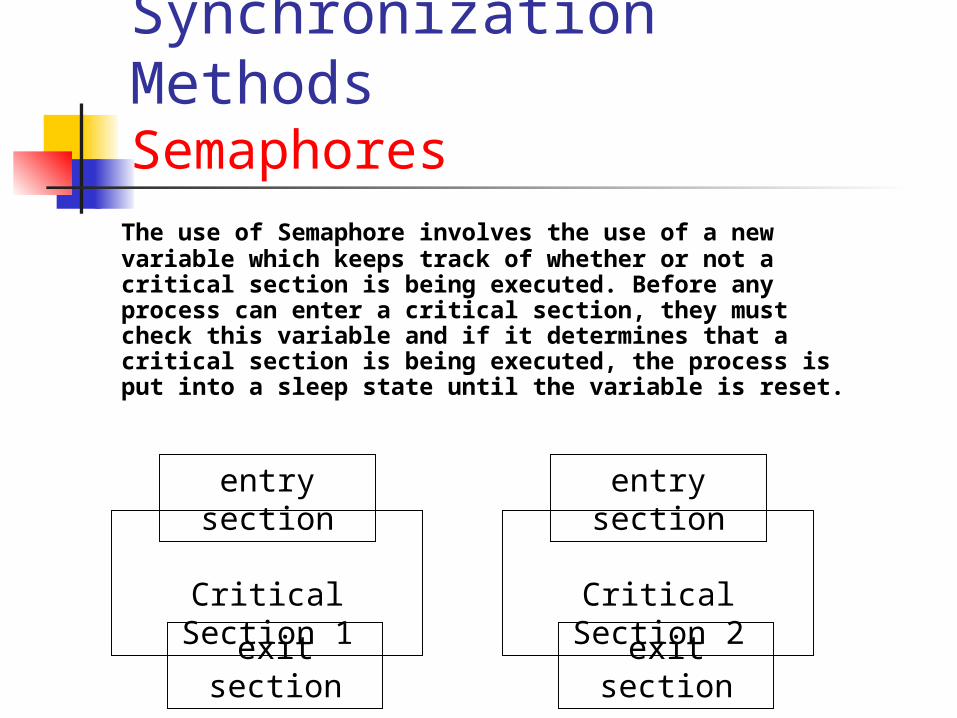
The use of Semaphore involves the use of a new variable which keeps track of whether or not a critical section is being executed. Before any process can enter a critical section, they must check this variable and if it determines that a critical section is being executed, the process is put into a sleep state until the variable is reset.
Critical Section 1
entry section
exit section
Critical Section 2
entry section
exit section
Synchronization MethodsSemaphores
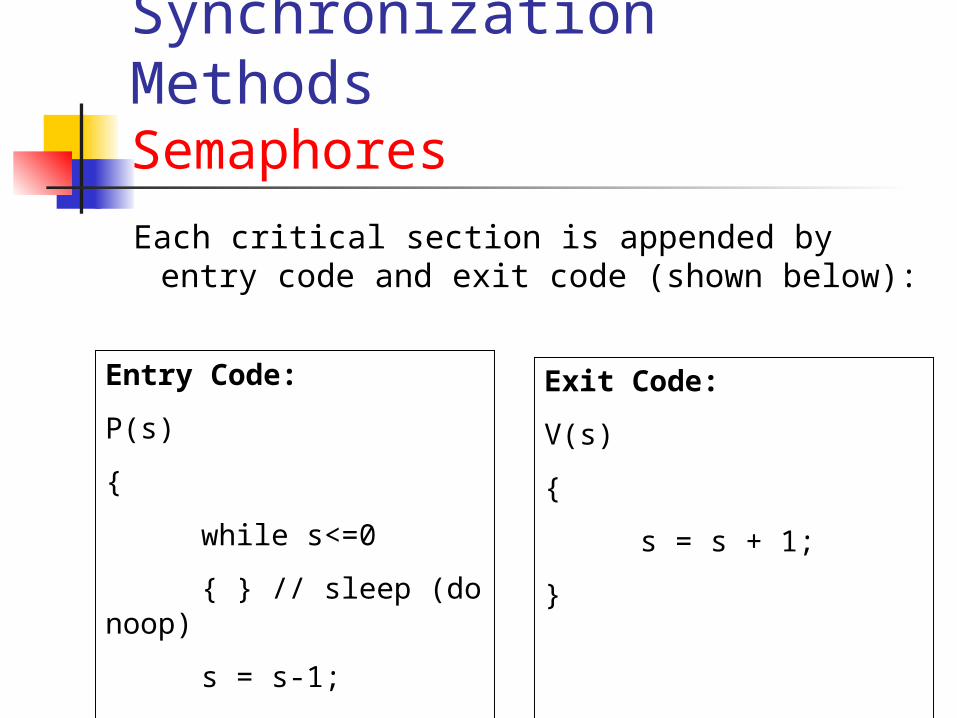
Each critical section is appended by entry code and exit code (shown below):
Entry Code:
P(s)
{
while s<=0
{ } // sleep (do noop)
s = s-1;
}
Exit Code:
V(s)
{
s = s + 1;
}
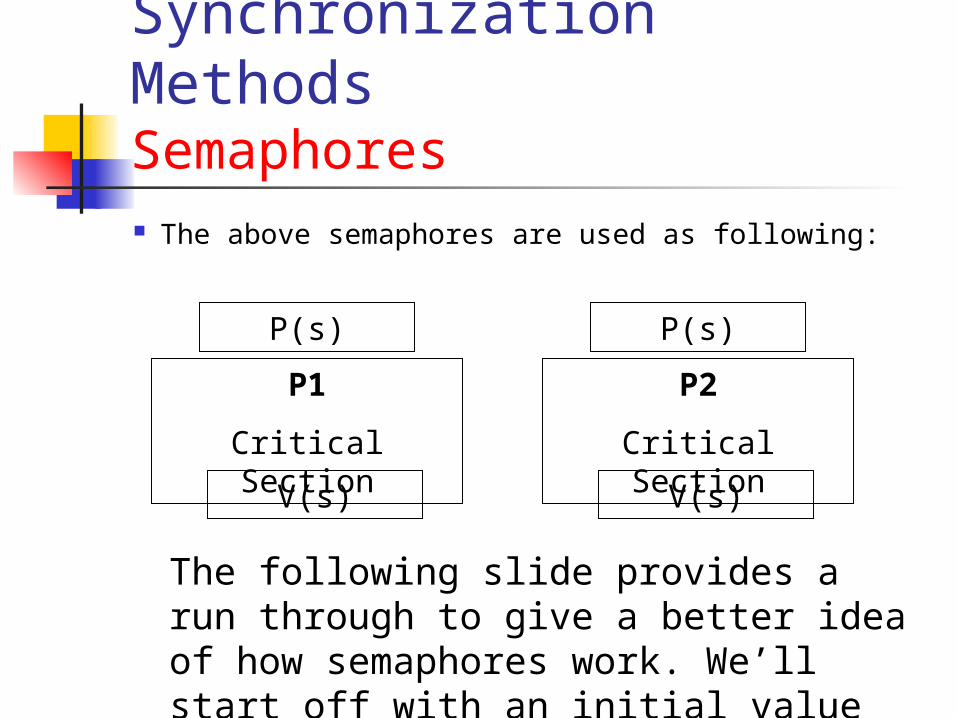
Synchronization MethodsSemaphores The above semaphores are used as following:
P1
Critical Section
P(s)
V(s)
P2
Critical Section
P(s)
V(s)
The following slide provides a run through to give a better idea of how semaphores work. We’ll start off with an initial value of s = 1.
Synchronization MethodsSemaphores – a sample run through
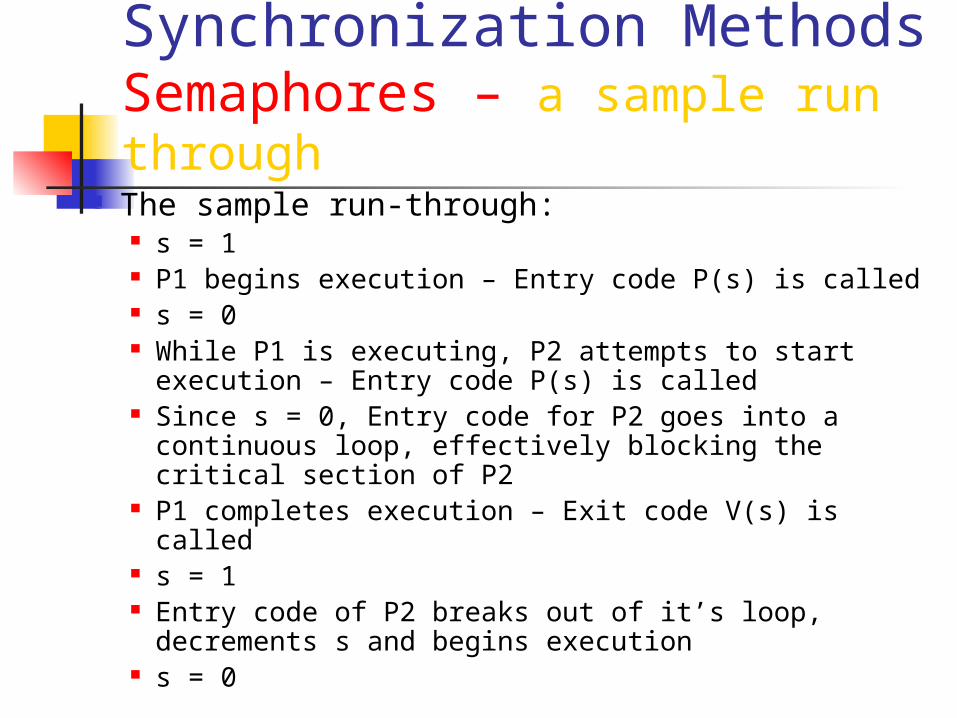
The sample run-through: s = 1 P1 begins execution – Entry code P(s) is called s = 0 While P1 is executing, P2 attempts to start
execution – Entry code P(s) is called Since s = 0, Entry code for P2 goes into a
continuous loop, effectively blocking the critical section of P2
P1 completes execution – Exit code V(s) is called s = 1 Entry code of P2 breaks out of it’s loop,
decrements s and begins execution s = 0
SemaphoresPre-determining order: Some Examples
We can also employ the above semaphores to pre-determine an order in which certain processes will be executed.
For example, consider three processes P1, P2, P3 and we wish their critical sections to be run in the order P1, P2 and then P3. (1 2 3)
SemaphoresPre-determining order – Example 1
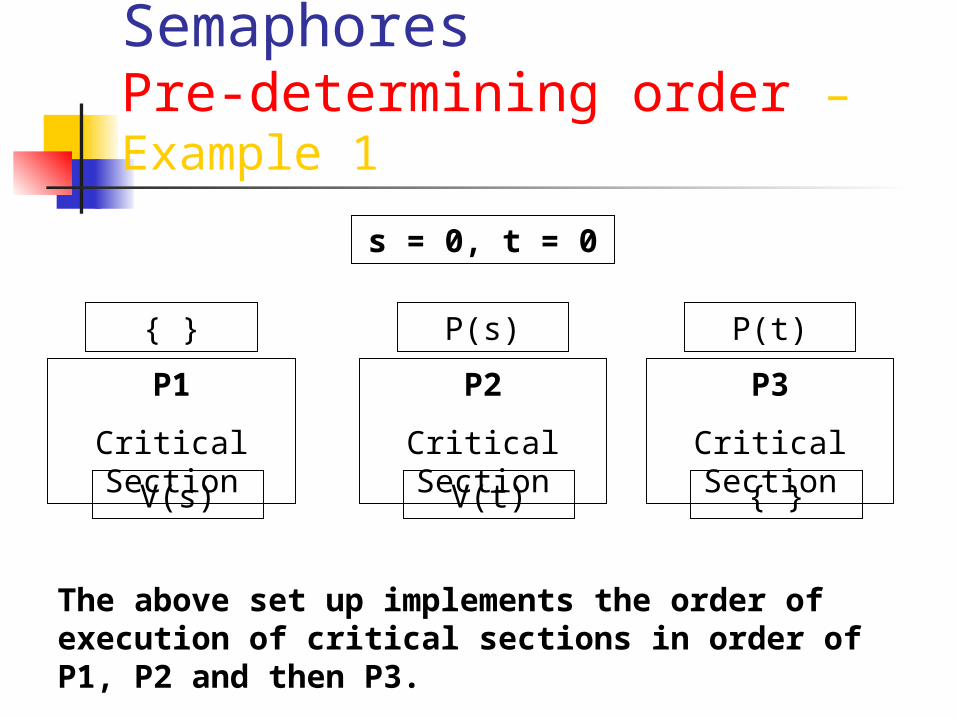
P1
Critical Section
{ }
V(s)
P2
Critical Section
P(s)
V(t)
P3
Critical Section
P(t)
{ }
s = 0, t = 0
The above set up implements the order of execution of critical sections in order of P1, P2 and then P3.
SemaphoresPre-determining order – Example 2
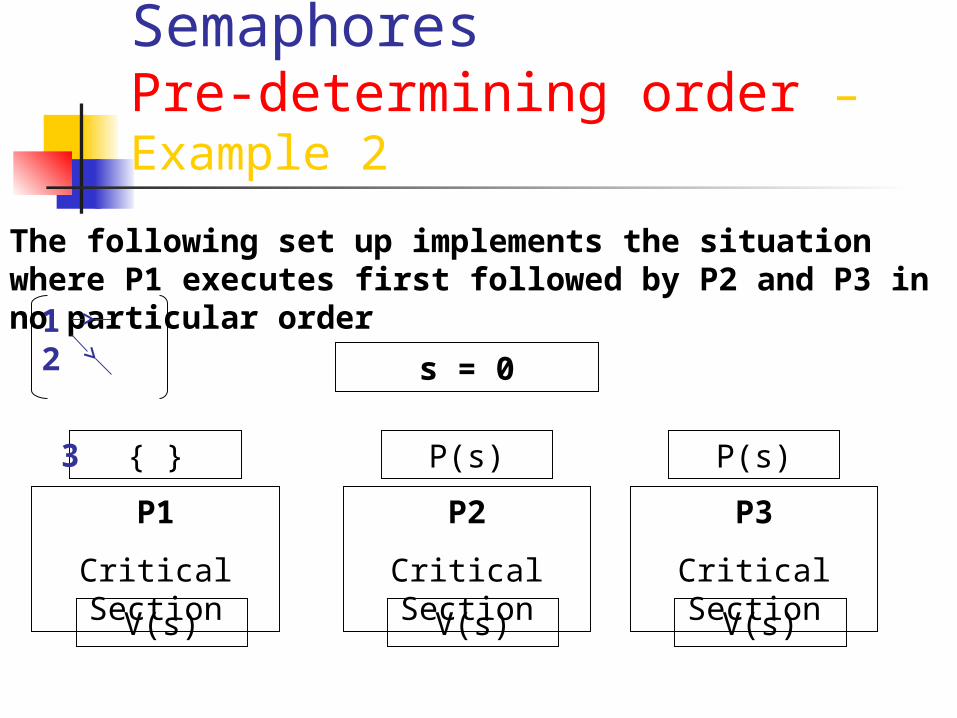
The following set up implements the situation where P1 executes first followed by P2 and P3 in no particular order
P1
Critical Section
{ }
V(s)
P2
Critical Section
P(s)
V(s)
P3
Critical Section
P(s)
V(s)
s = 0
1 2
3
SemaphoresPre-determining order – Example 3
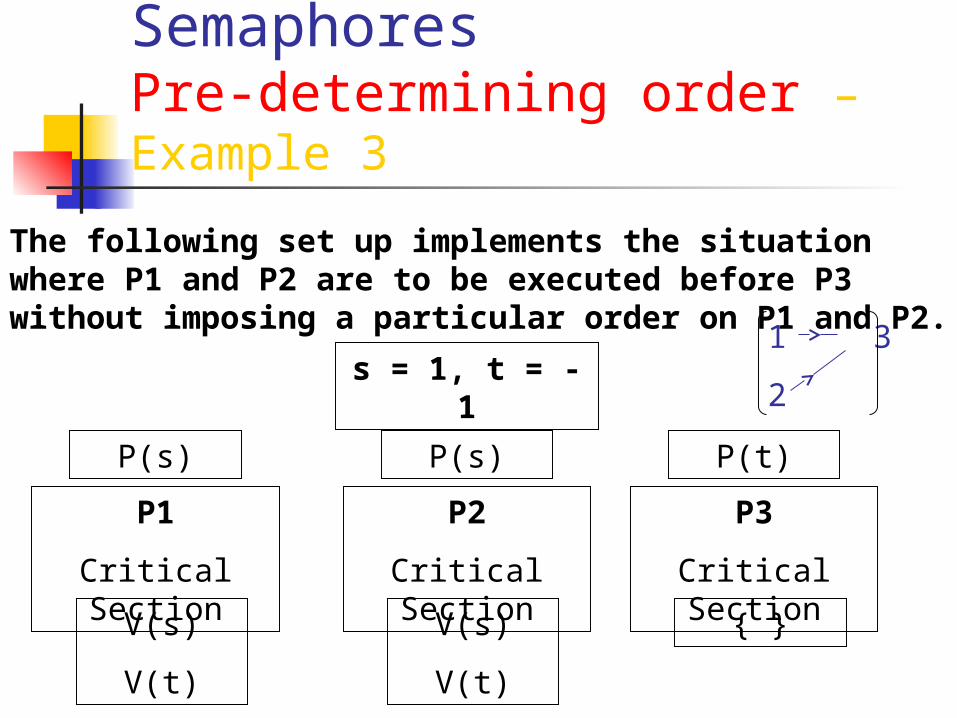
The following set up implements the situation where P1 and P2 are to be executed before P3 without imposing a particular order on P1 and P2.
P1
Critical Section
P(s)
V(s)
V(t)
P2
Critical Section
P(s)
V(s)
V(t)
P3
Critical Section
P(t)
{ }
s = 1, t = -11 3
2
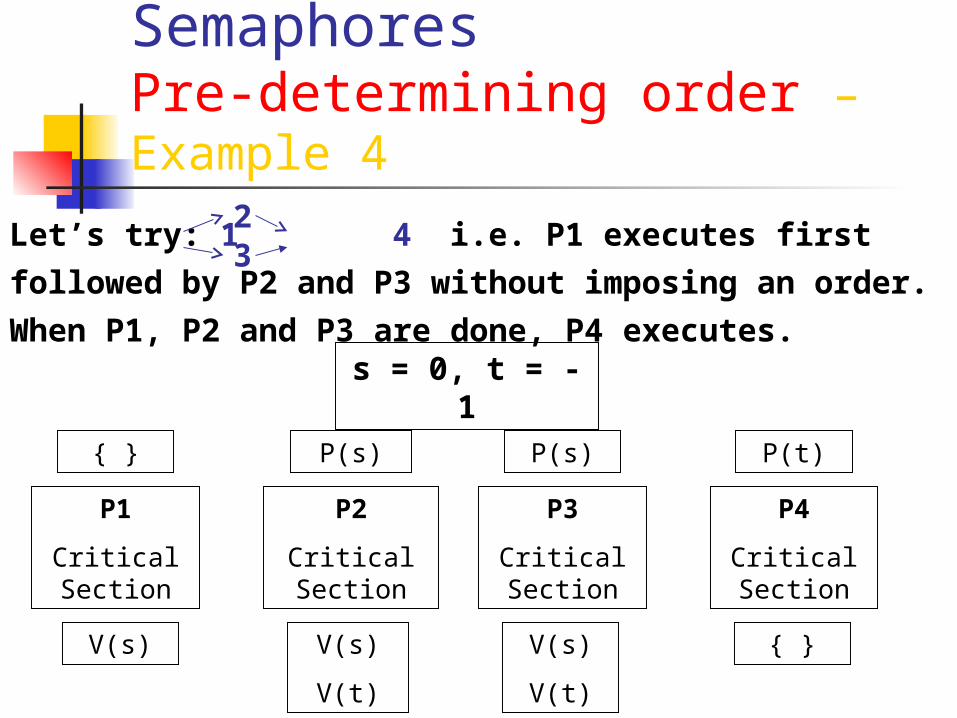
SemaphoresPre-determining order – Example 4
Let’s try: 1 4 i.e. P1 executes first
followed by P2 and P3 without imposing an order.
When P1, P2 and P3 are done, P4 executes.
23
P1
Critical Section
{ }
V(s)
P2
Critical Section
P(s)
V(s)
V(t)
s = 0, t = -1
{ }
P4
Critical Section
P(t)
P3
Critical Section
P(s)
V(s)
V(t)
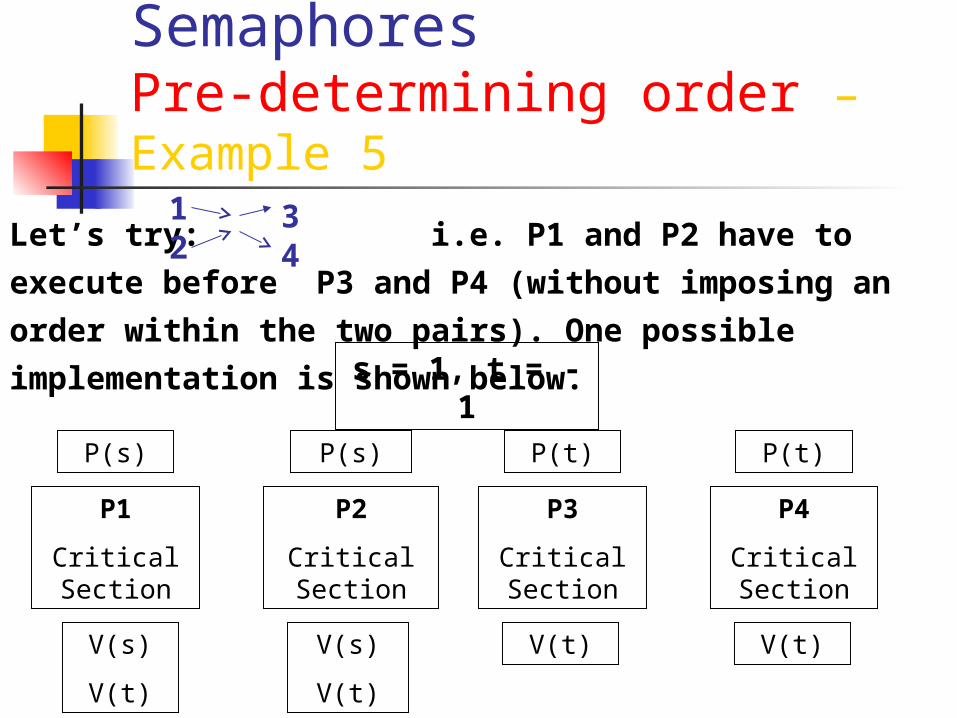
SemaphoresPre-determining order – Example 5
Let’s try: i.e. P1 and P2 have to execute
before P3 and P4 (without imposing an order
within the two pairs). One possible implementation
is shown below.
34
12
P1
Critical Section
P(s)
V(s)
V(t)
P2
Critical Section
P(s)
V(s)
V(t)
s = 1, t = -1
V(t)
P4
Critical Section
P(t)
P3
Critical Section
P(t)
V(t)
Synchronization MethodsMonitors Monitors offer a higher level solution that
offer both synchronization and mutual exclusion where semaphores required use of low-level system calls (these involve risk of deadlock).
Many programming languages offer built-in structures that serve as monitors. Only one process may execute a function within a monitor at any given time. Hence all critical section are called from within a monitor thus allowing only one critical section to run at any given time.
Synchronization MethodsDifference b/w Semaphores & Monitors
A monitor is different from a semaphore because it provides a kind of scheduling queue for critical sections that arrive to be processed. It not only blocks other critical sections while one is already being processed but also puts them in a wait state and processes them in the order in which they arrive.
Synchronization MethodsMessage Passing
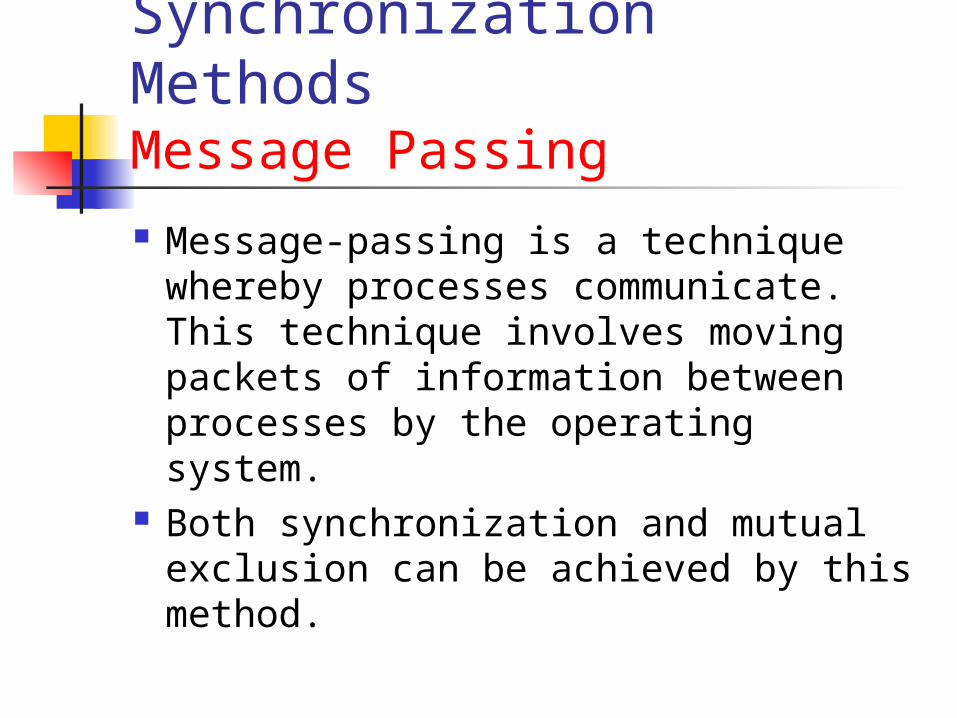
Message-passing is a technique whereby processes communicate. This technique involves moving packets of information between processes by the operating system.
Both synchronization and mutual exclusion can be achieved by this method.
Synchronization MethodsComparison at a glance
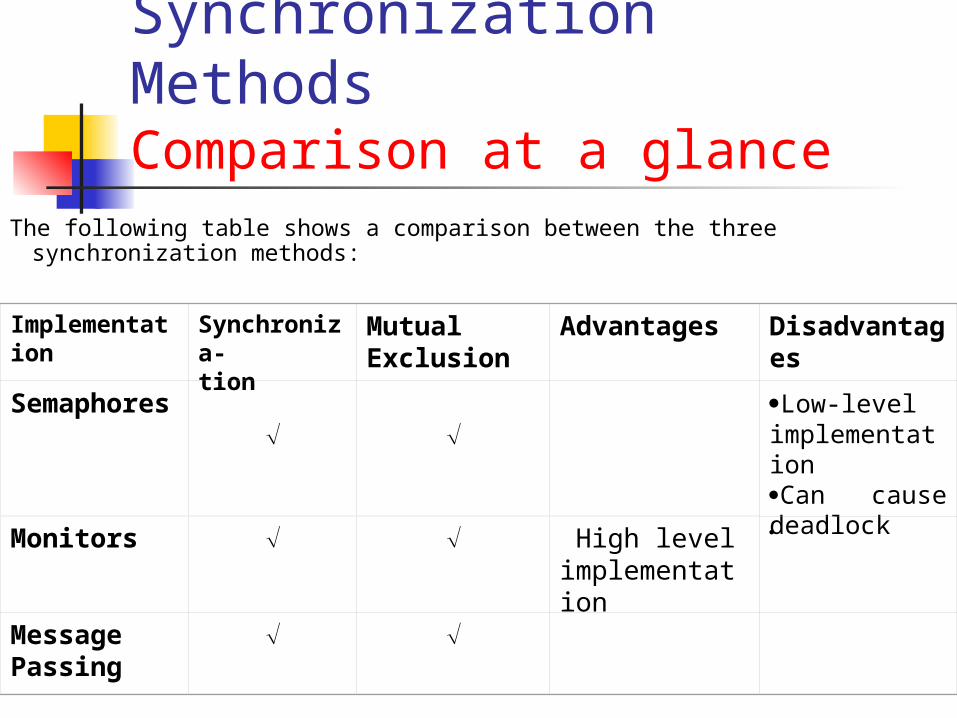
The following table shows a comparison between the three synchronization methods:
Implementation Synchroniza-tion
Mutual Exclusion
Advantages Disadvantages
Semaphores
Low-level implementationCan cause deadlockMonitors High level
implementation
Message Passing
DeadlocksWhat are deadlocks A deadlock state is a state of indefinite
wait by one or more processes for an event that can be triggered only by one of the waiting processes.
Such an event is commonly termed as a resource.
The resource could be tangible such as an I/O resource or intangible e.g. shared data.
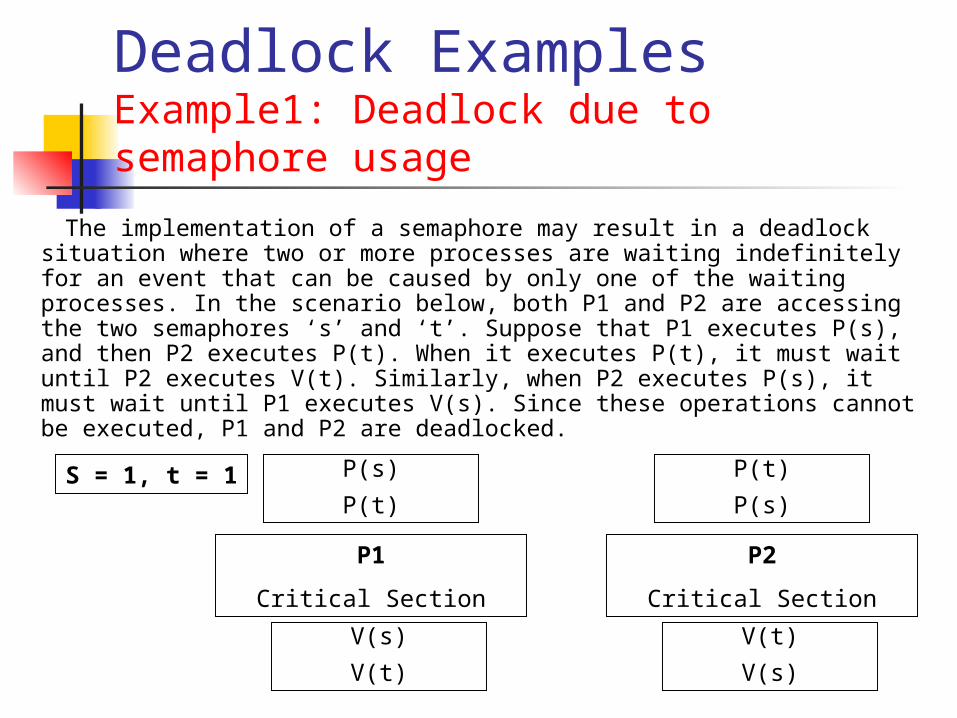
Deadlock ExamplesExample1: Deadlock due to semaphore usage
The implementation of a semaphore may result in a deadlock situation where two or more processes are waiting indefinitely for an event that can be caused by only one of the waiting processes. In the scenario below, both P1 and P2 are accessing the two semaphores ‘s’ and ‘t’. Suppose that P1 executes P(s), and then P2 executes P(t). When it executes P(t), it must wait until P2 executes V(t). Similarly, when P2 executes P(s), it must wait until P1 executes V(s). Since these operations cannot be executed, P1 and P2 are deadlocked.
P1
Critical Section
P(s)
P(t)
V(s)
V(t)
P2
Critical Section
P(t)
P(s)
V(t)
V(s)
S = 1, t = 1
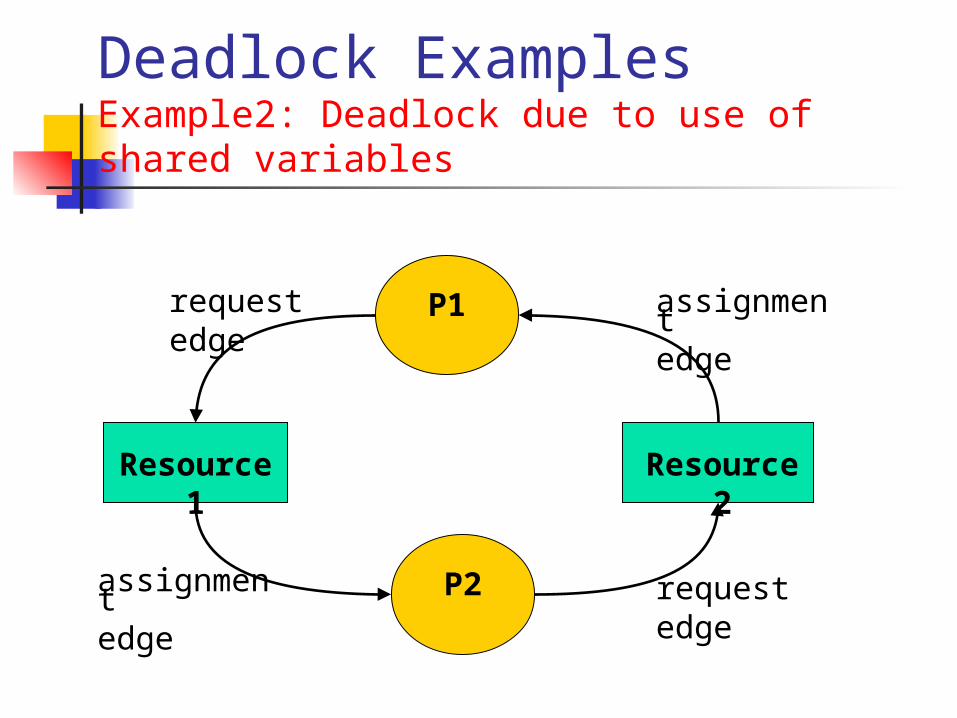
Deadlock ExamplesExample2: Deadlock due to use of shared variables
P1
P2
Resource 1
Resource 2
requestedge
requestedge
assignmentedge
assignmentedge
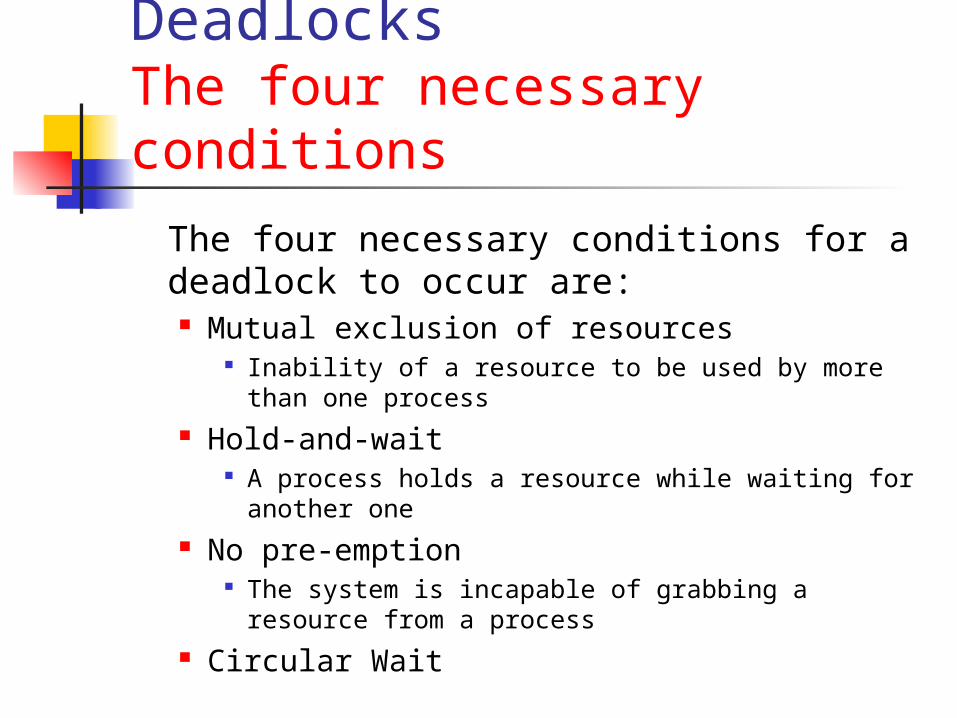
DeadlocksThe four necessary conditions
The four necessary conditions for a deadlock to occur are: Mutual exclusion of resources
Inability of a resource to be used by more than one process
Hold-and-wait A process holds a resource while waiting for
another one No pre-emption
The system is incapable of grabbing a resource from a process
Circular Wait
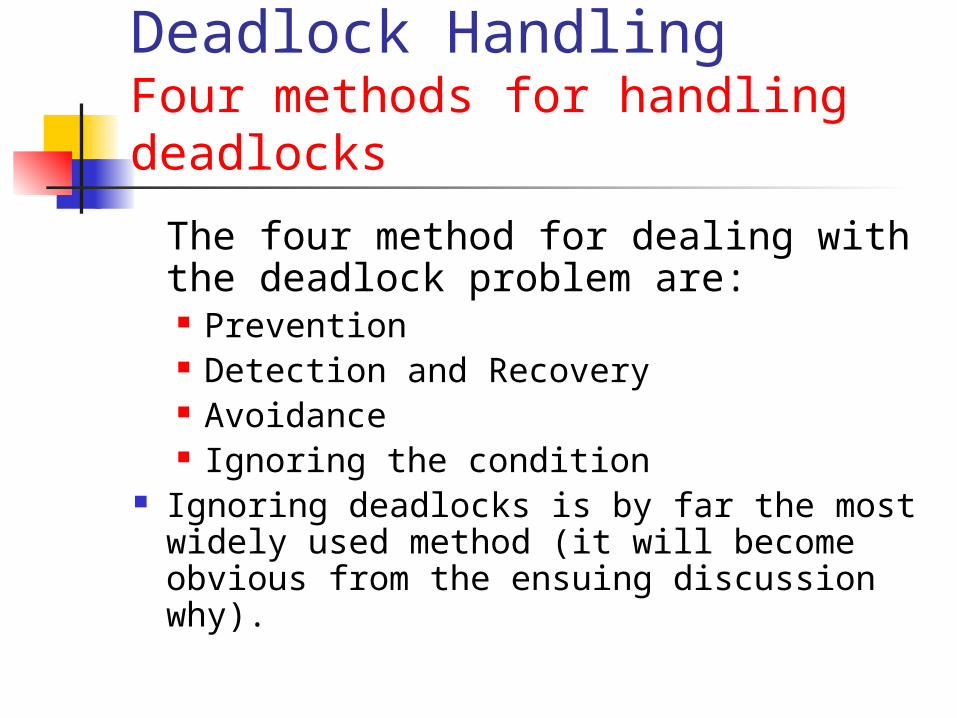
Deadlock HandlingFour methods for handling deadlocks
The four method for dealing with the deadlock problem are: Prevention Detection and Recovery Avoidance Ignoring the condition
Ignoring deadlocks is by far the most widely used method (it will become obvious from the ensuing discussion why).
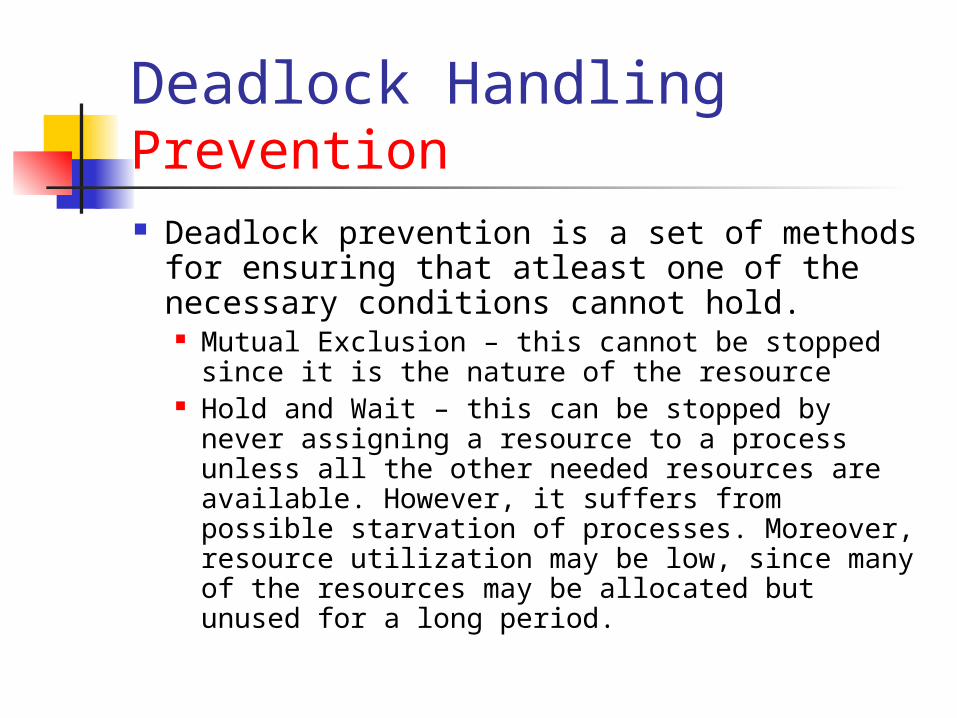
Deadlock HandlingPrevention Deadlock prevention is a set of methods
for ensuring that atleast one of the necessary conditions cannot hold. Mutual Exclusion – this cannot be stopped
since it is the nature of the resource Hold and Wait – this can be stopped by never
assigning a resource to a process unless all the other needed resources are available. However, it suffers from possible starvation of processes. Moreover, resource utilization may be low, since many of the resources may be allocated but unused for a long period.
Deadlock HandlingPrevention (contd.)
No preemption – If a process that is holding some resources requests another resource that cannot be immediately allocated to it, then all resources currently being held are preempted to stop this condition. As evident, it also suffers from potential starvation.
Circular Wait – One way to ensure that the circular-wait condition never holds is to impose a total ordering of all resource types, and to require that each process requests resources in an increasing order of enumeration. The example on the following slide illustrates the same.
Deadlock HandlingPrevention (contd.)
Let us assume that the set of resource types R includes tape drives, disk drives, and printers and the function F (for enumeration) is defined as follows:
F(tape drive) = 1F(disk drive) = 5F(printer) = 12
If any one of the following protocols are used , the circular wait condition cannot hold.
1. Each process can request resources only in an increasing order of enumeration. For example, a process that wants to use the tape drive and printer at the same time must first request the tape drive and then the printer.
2. Whenever, a process requests an instance of resource type Rj, it has released any resources Ri such that F(Ri) F(Rj).
Deadlock HandlingDetection and Recovery
In this environment, the system must provide: An algorithm that examines the state of the
system to determine whether a deadlock has occurred
An algorithm to recover from the deadlock
However, it is important to realize that detection and recovery scheme requires overhead that includes not only the run-time costs of maintaining the necessary information and executing the detection algorithm, but also the potential losses inherent in recovering from deadlock.
Deadlock HandlingDetection and Recovery – Steps
A deadlock detection and recovery algorithm involves the following steps: Reduce P-R graph to wait-for graph Find cycles in the graph Determine non-redundant cycles Determine minimum number of
preemptions
The following example illustrates the above steps.
Deadlock HandlingDetection and Recovery – Step 1
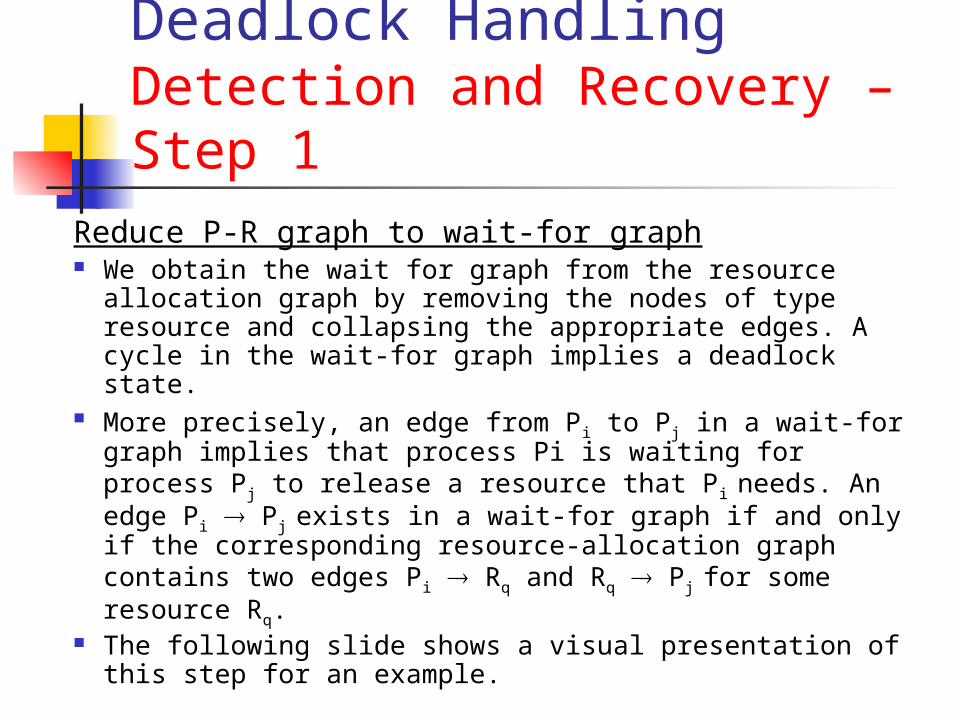
Reduce P-R graph to wait-for graph We obtain the wait for graph from the resource
allocation graph by removing the nodes of type resource and collapsing the appropriate edges. A cycle in the wait-for graph implies a deadlock state.
More precisely, an edge from Pi to Pj in a wait-for graph implies that process Pi is waiting for process Pj to release a resource that Pi needs. An edge Pi Pj
exists in a wait-for graph if and only if the corresponding resource-allocation graph contains two edges Pi Rq and Rq Pj for some resource Rq.
The following slide shows a visual presentation of this step for an example.
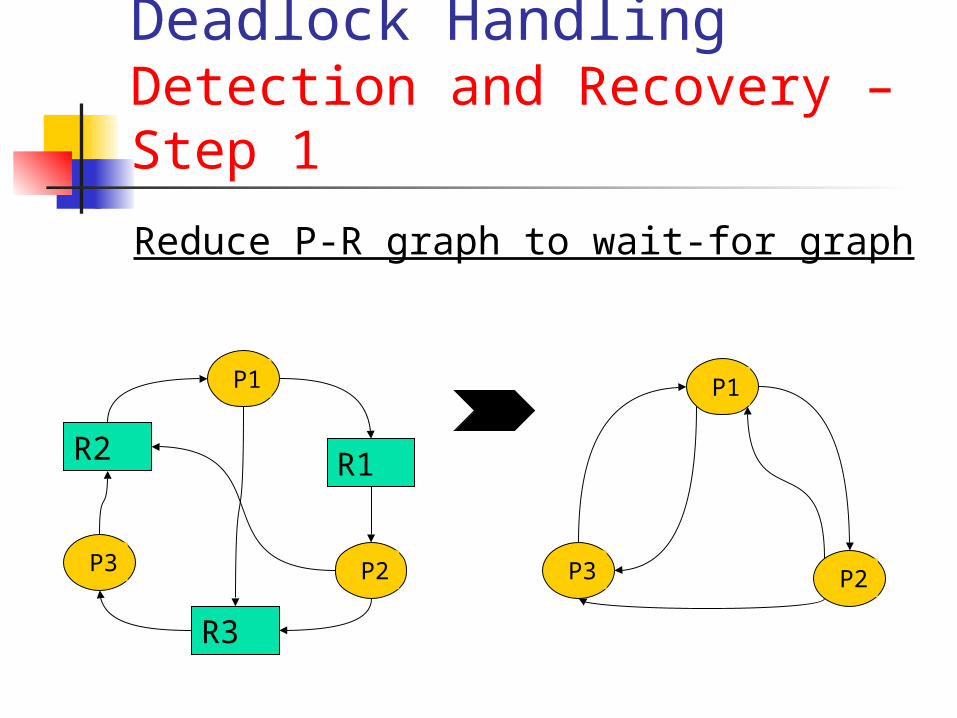
Deadlock HandlingDetection and Recovery – Step 1
Reduce P-R graph to wait-for graph
P1
P3
P2
R2 R1
R3
P1
P3
P2
Deadlock HandlingDetection and Recovery – Step 1 Complexity
Suppose, we have m resources n processes
For each ordered pair of the processes, we have to check if there exists a wait-for relationship for each resource.Here, the number of ordered pair of resources = nP2 = n!/(n-2)! n2
I.e. for one resource the order of operations is O(n2) for m resources the order of operations is O(mn2)
Step 1 complexity is O(mn2)
Deadlock HandlingDetection and Recovery – Step 2
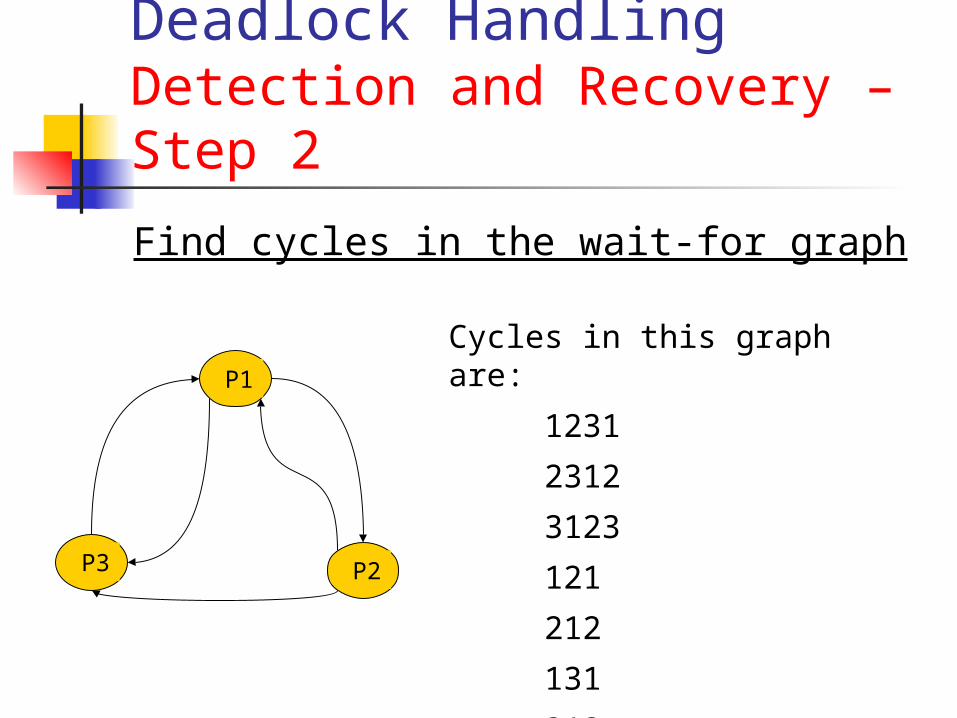
Find cycles in the wait-for graph
P1
P3
P2
Cycles in this graph are:
1231
2312
3123
121
212
131
313
Deadlock HandlingDetection and Recovery – Step 2 Complexity
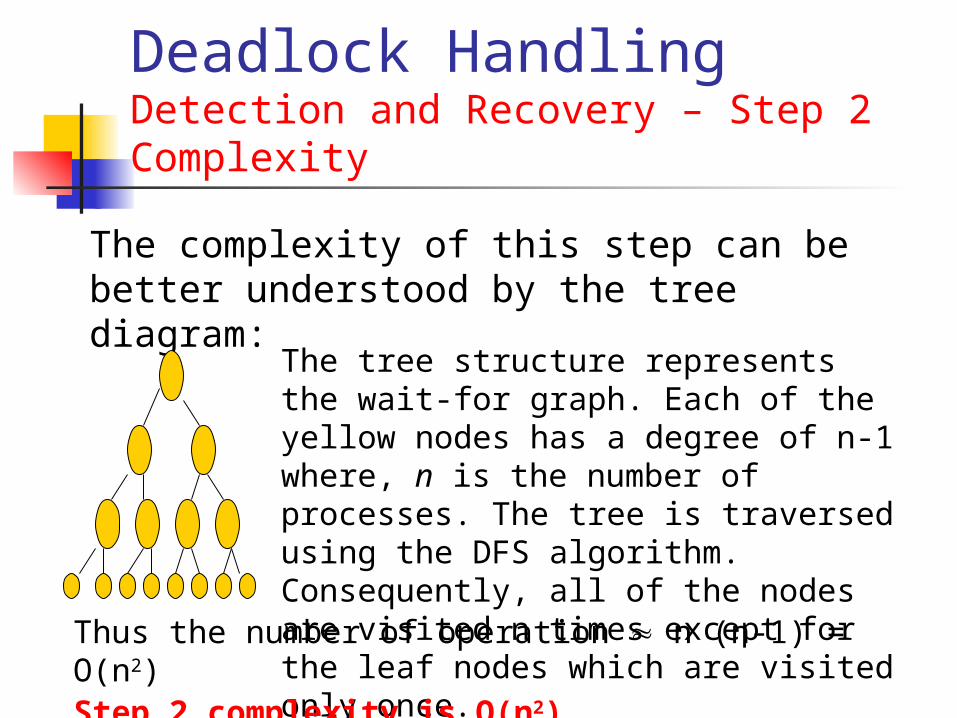
The complexity of this step can be better understood by the tree diagram:
The tree structure represents the wait-for graph. Each of the yellow nodes has a degree of n-1 where, n is the number of processes. The tree is traversed using the DFS algorithm. Consequently, all of the nodes are visited n times except for the leaf nodes which are visited only once.Thus the number of operation n (n-1) = O(n2)
Step 2 complexity is O(n2)
Deadlock HandlingDetection and Recovery – Step 3
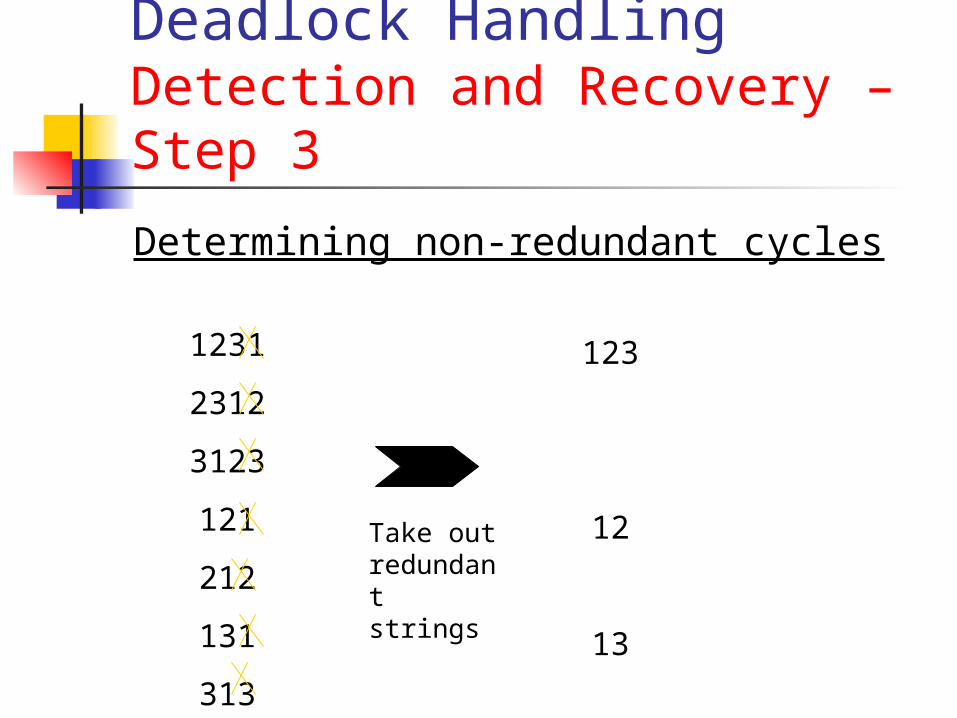
Determining non-redundant cycles
1231
2312
3123
121
212
131
313
123
12
13
Take out redundant strings
Deadlock HandlingDetection and Recovery – Step 3 Complexity
This step can be implemented as part of Step2. In other words, while we are traversing the graph and finding cycles, we can also compare them with previously found cycles and finally take the cycles that are common to the maximum number of cycles.
Thus, the complexity of this step is built in to the step2 complexity of O(n2).
Deadlock HandlingDetection and Recovery – Step 4
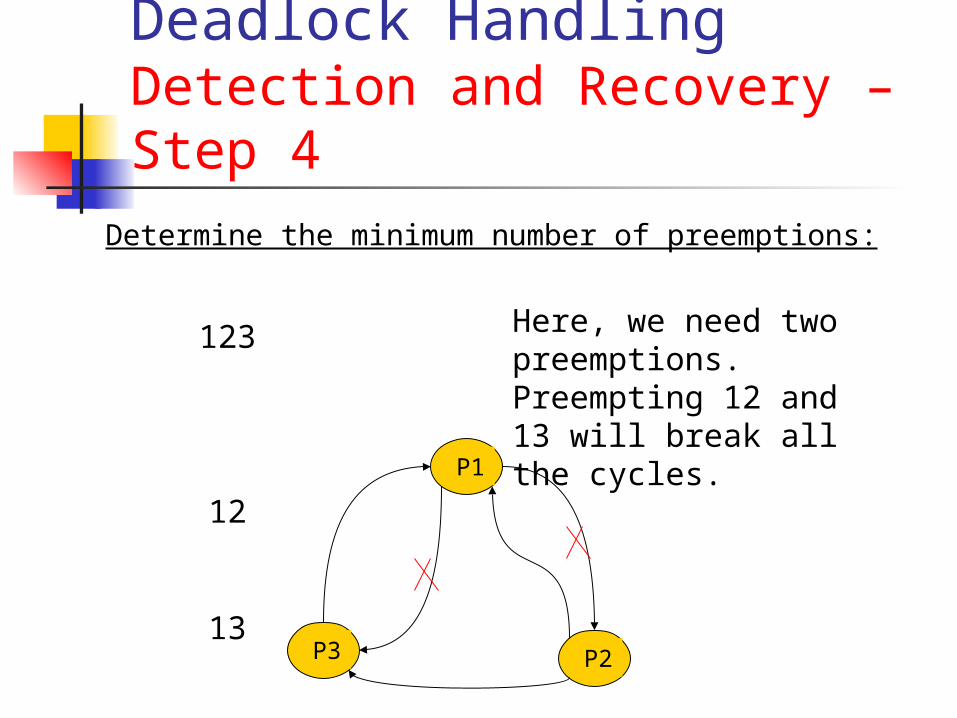
Determine the minimum number of preemptions:
123
12
13
Here, we need two preemptions. Preempting 12 and 13 will break all the cycles.P
1
P3
P2
Deadlock HandlingDetection & Recovery–Summary
As we have seen throughout the discussion, detection and recovery is a very expensive proposition in terms of time complexity.
Moreover, there is also the potential of incurring losses inherent in recovering from deadlock.
Deadlock HandlingAvoidance A deadlock avoidance algorithm
dynamically examines the resource allocation state to ensure that there can never be a circular-wait condition. The resource allocation state is defined by the number of available and allocated resources, and the maximum demands of the processes.
Deadlock HandlingAvoidance – Safe/Unsafe states
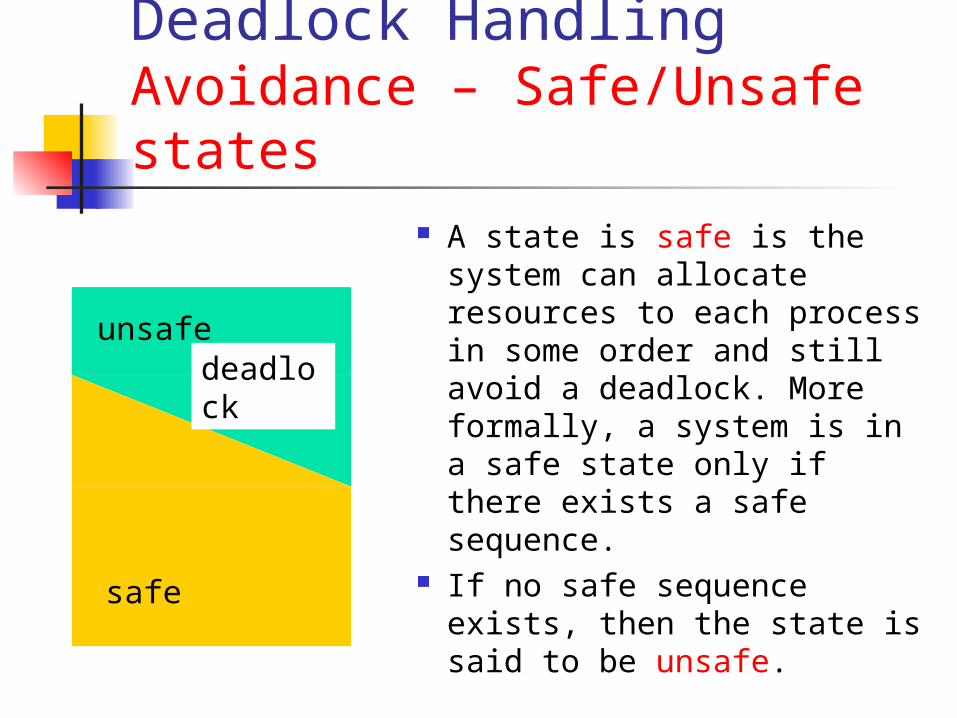
A state is safe is the system can allocate resources to each process in some order and still avoid a deadlock. More formally, a system is in a safe state only if there exists a safe sequence.
If no safe sequence exists, then the state is said to be unsafe.
deadlock
unsafe
safe
Deadlock HandlingAvoidance – An Example
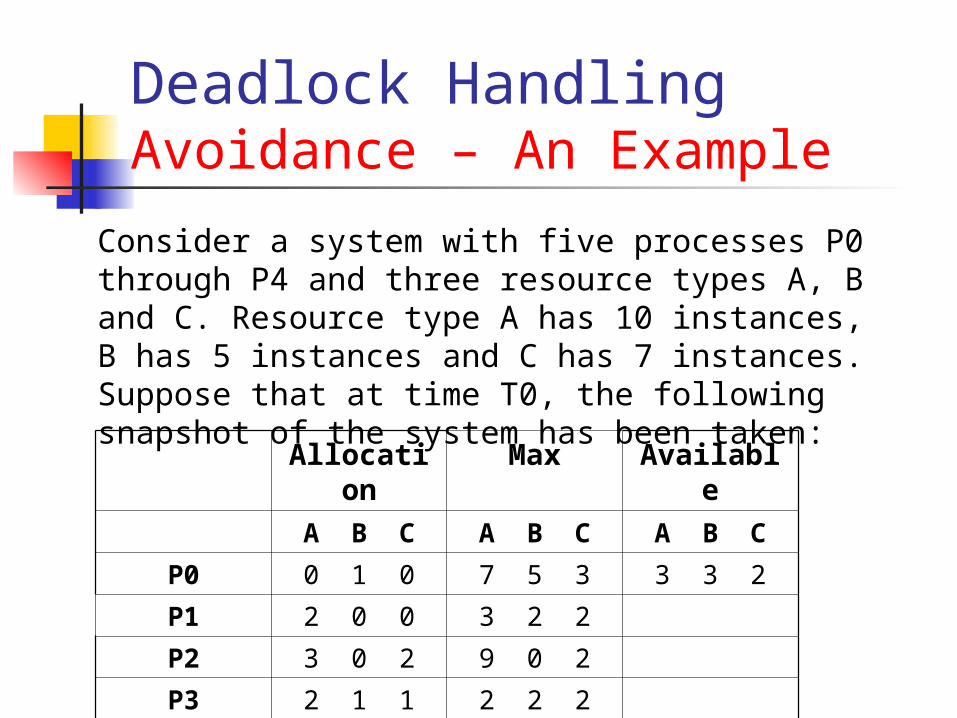
Consider a system with five processes P0 through P4 and three resource types A, B and C. Resource type A has 10 instances, B has 5 instances and C has 7 instances. Suppose that at time T0, the following snapshot of the system has been taken:
Allocation
Max Available
A B C A B C A B C
P0 0 1 0 7 5 3 3 3 2
P1 2 0 0 3 2 2
P2 3 0 2 9 0 2
P3 2 1 1 2 2 2
P4 0 0 2 4 3 3
Deadlock HandlingAvoidance – An Example
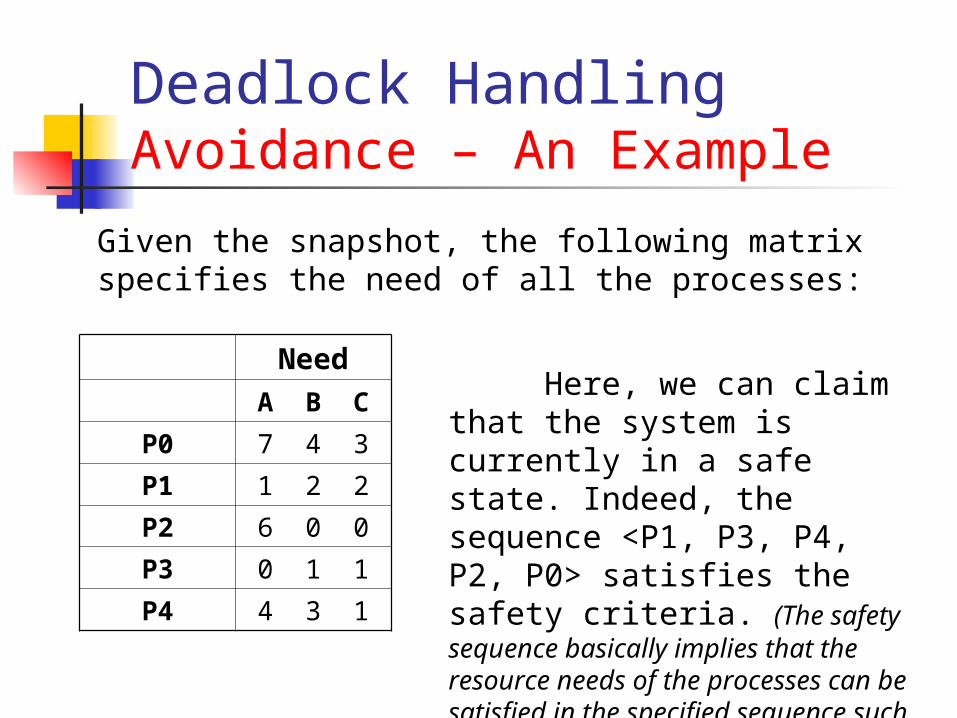
Given the snapshot, the following matrix specifies the need of all the processes:
NeedA B C
P0 7 4 3
P1 1 2 2
P2 6 0 0
P3 0 1 1
P4 4 3 1
Here, we can claim that the system is currently in a safe state. Indeed, the sequence <P1, P3, P4, P2, P0> satisfies the safety criteria. (The safety sequence basically implies that the resource needs of the processes can be satisfied in the specified sequence such that all resource needs of all the processes are met.)
Deadlock HandlingAvoidance – An Example
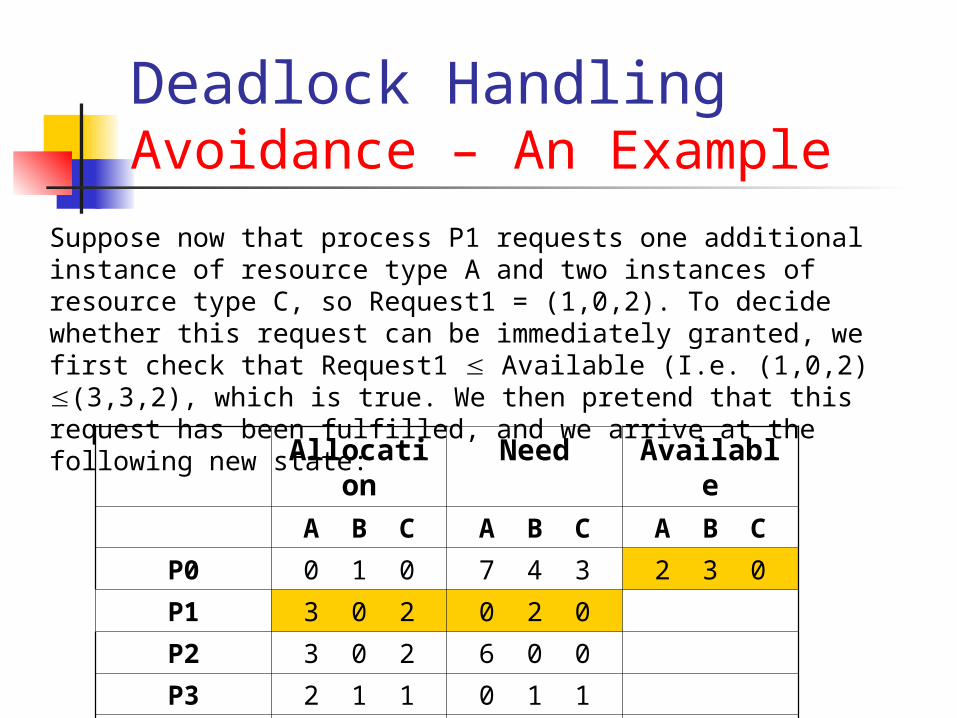
Suppose now that process P1 requests one additional instance of resource type A and two instances of resource type C, so Request1 = (1,0,2). To decide whether this request can be immediately granted, we first check that Request1 Available (I.e. (1,0,2) (3,3,2), which is true. We then pretend that this request has been fulfilled, and we arrive at the following new state:
Allocation
Need Available
A B C A B C A B C
P0 0 1 0 7 4 3 2 3 0
P1 3 0 2 0 2 0
P2 3 0 2 6 0 0
P3 2 1 1 0 1 1
P4 0 0 2 4 3 1
Deadlock HandlingAvoidance – An Example
Now, we must determine whether this new state is safe. To do so, we execute our safety algorithm and find that the sequence <P1, P3, P4, P0, P2> satisfies the safety requirement. Hence, we can immediately grant the request of process P1.
You should be able to see, however, that when the system is in this state, a request for (3,3,0) by P4 cannot be granted, since the resources are not available. A request for (0,2,0) by P0 cannot be granted, even though the resources are available, since the resulting state is unsafe.
Deadlock HandlingAvoidance – Complexity If we consider a system with multiple of
one resource and n processes, we need n operations to step through the processes while determining the safety sequence provided the processes are sorted in terms of the resource requirements. ( sorted order can be maintained at a cost of O(logn)
Thus, if we scale up the system to have m resources, the complexity of the Banker’s algorithm becomes O(mn)
Deadlock HandlingAvoidance – Parameters Involved
The parameters worthy of study in this module are: Total number of processes Total number of available resources Maximum number of resources
required by the processes
Deadlock AvoidanceEffect of Involved Parameters
Effect of total number of processes An increase in the number of processes will
increase the number of requests for resources. Effect of total number of available resources
More the number of available resources, more requests can be granted since for the same requirement there are more resources available.
Effect of maximum number of resources required by the processes This parameter is directly linked to the number of
requests and thus, determines the demand for the resources required. More the resources required, there is more probability of declined requests.
Deadlock AvoidancePerformance Measures
Performance shall be quantified in terms of:
Rejection rate / Denial rate It is the percentage of rejected or
denied requests over the total number of requests.
A higher rejection rate by all means is a sign of poor system performance.
Deadlock AvoidanceDenial Percentage Over Time
When a system starts, initially all requests are granted, as the resources are available and the rejection rate is null at this point.
As more resources are allocated, the available resource number lowers and thus process requests are rejected if they lead to an unsafe state. Rejection increases as more and more resources are allocated.
Then comes the phase when enough resources have been granted to meet the maximum need of some processes. At this time, these processes whose maximum resource needs have been met start releasing the resources. Thus, the available resources start increasing and consequently the denial rate decreases finally coming back to the state of null rejection.
As is evident from the sample data and graph in the following slides, the shape of the rejection rate over time graph closely resembles a normal curve.
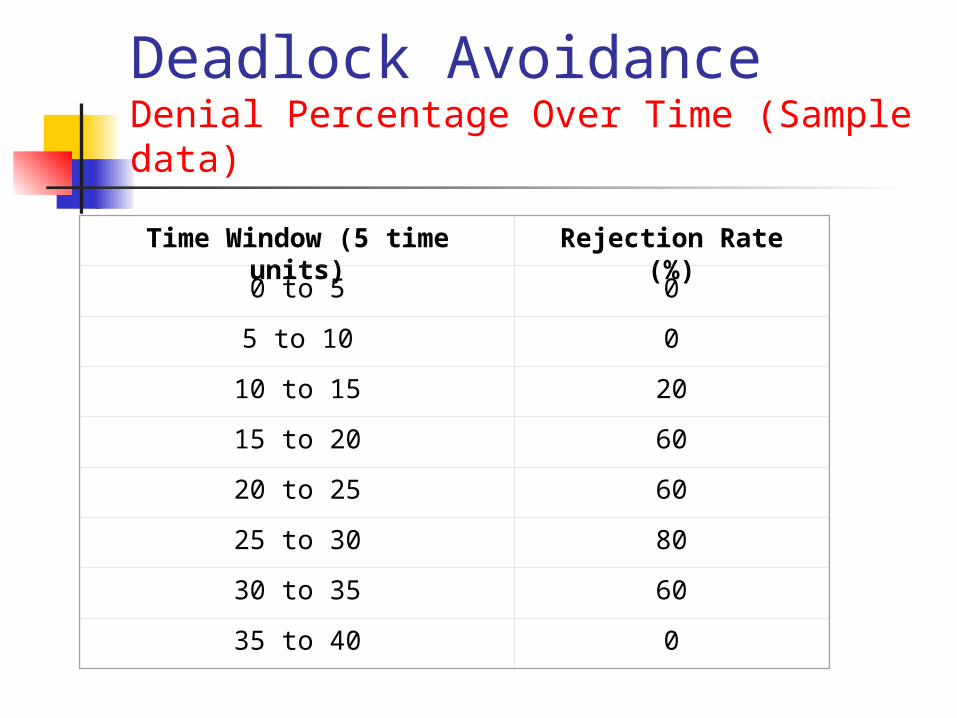
Deadlock AvoidanceDenial Percentage Over Time (Sample data)
Time Window (5 time units) Rejection Rate (%)
0 to 5 0
5 to 10 0
10 to 15 20
15 to 20 60
20 to 25 60
25 to 30 80
30 to 35 60
35 to 40 0
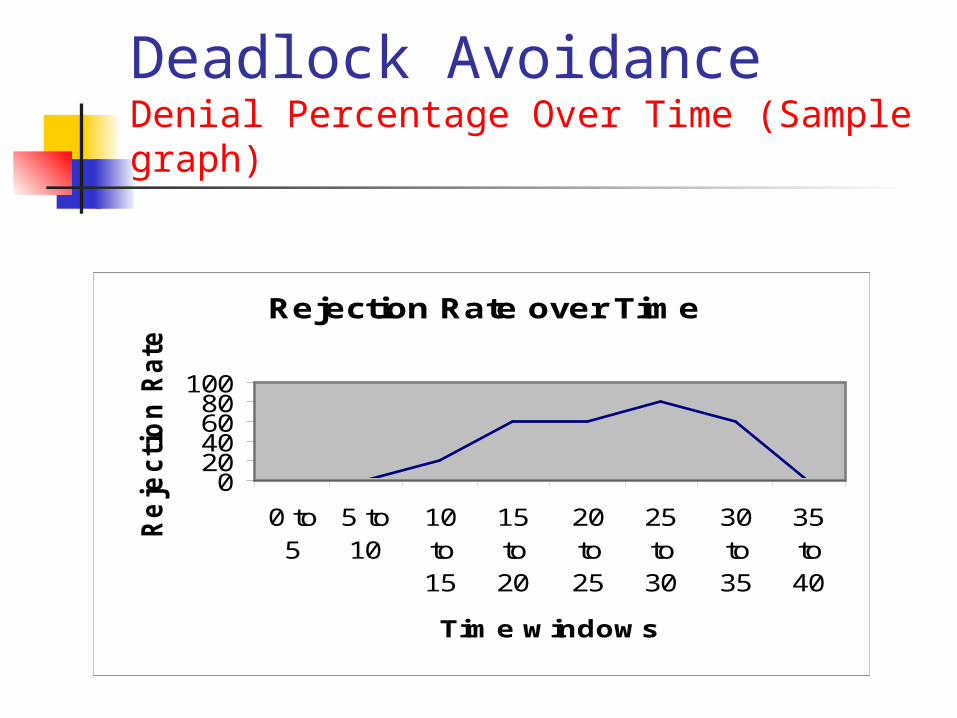
Deadlock AvoidanceDenial Percentage Over Time (Sample graph)
Rejection Rate over Time
020406080
100
0 to5
5 to10
10to15
15to20
20to25
25to30
30to35
35to40
Time windows
Re
jecti
on
Rate
(%
)
Deadlock Handling MethodsImplementation As part of Assignment 2, you’ll implement
three deadlock modules: a graph reduction algorithm, a deadlock detection algorithm and a deadlock avoidance module within an operating system satisfying the given requirements. (For complete details refer to Assignment 2)
We’ll see a brief explanation of the assignment in the following slides.
Graph Reduction AlgorithmImplementation Details
A graph reduction algorithm reduces process-resource allocation graphs into process dependency graphs
Input: Processes Resources Relations
Output: Processes Relations
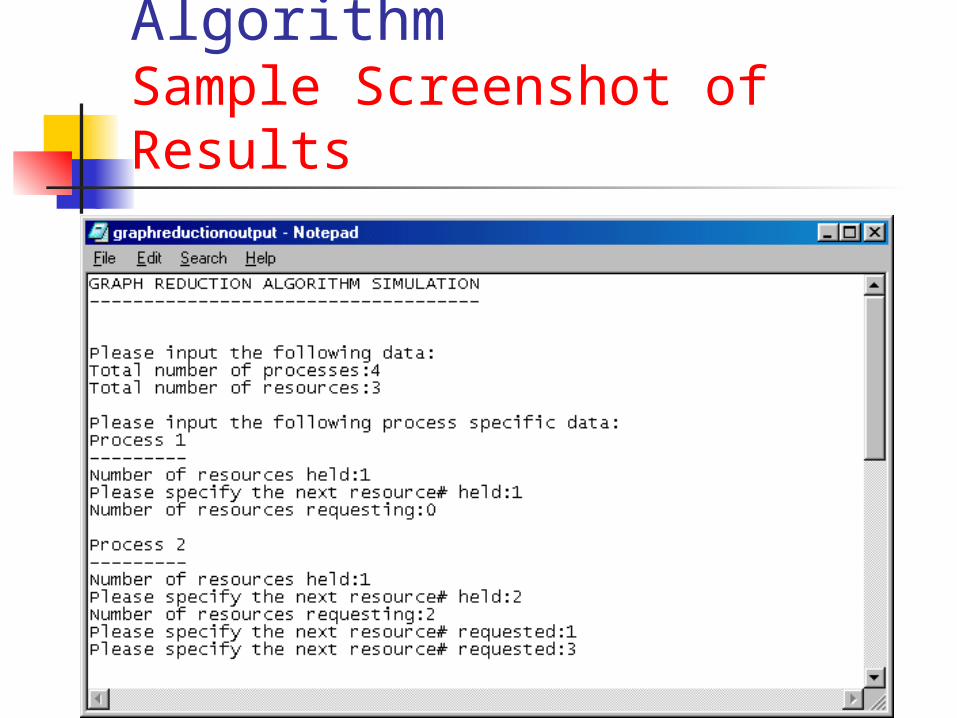
Graph Reduction AlgorithmSample Screenshot of Results
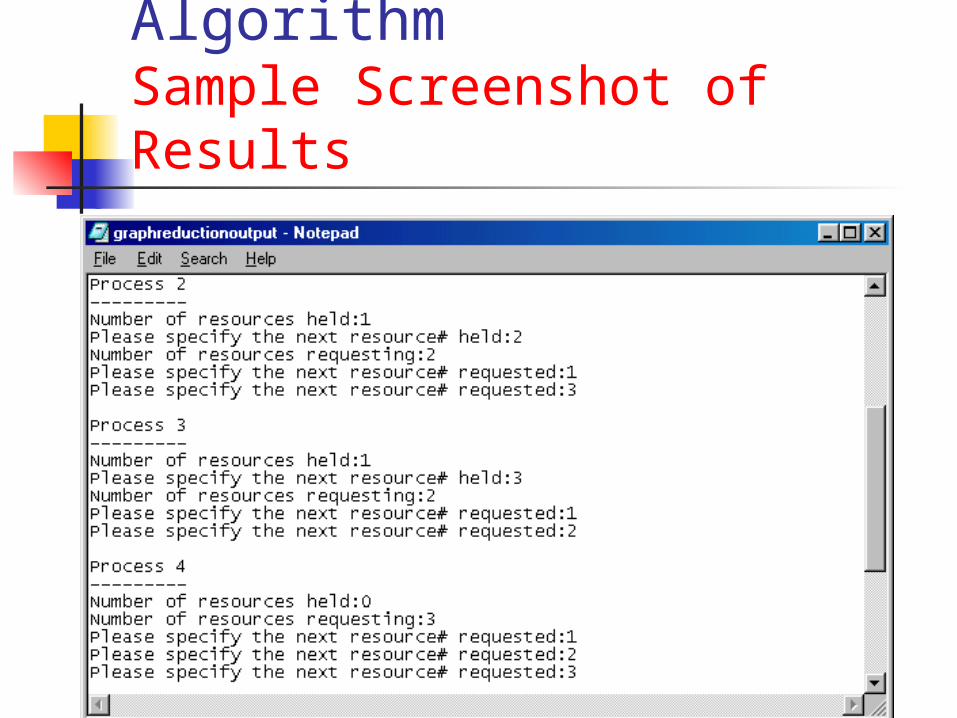
Graph Reduction AlgorithmSample Screenshot of Results
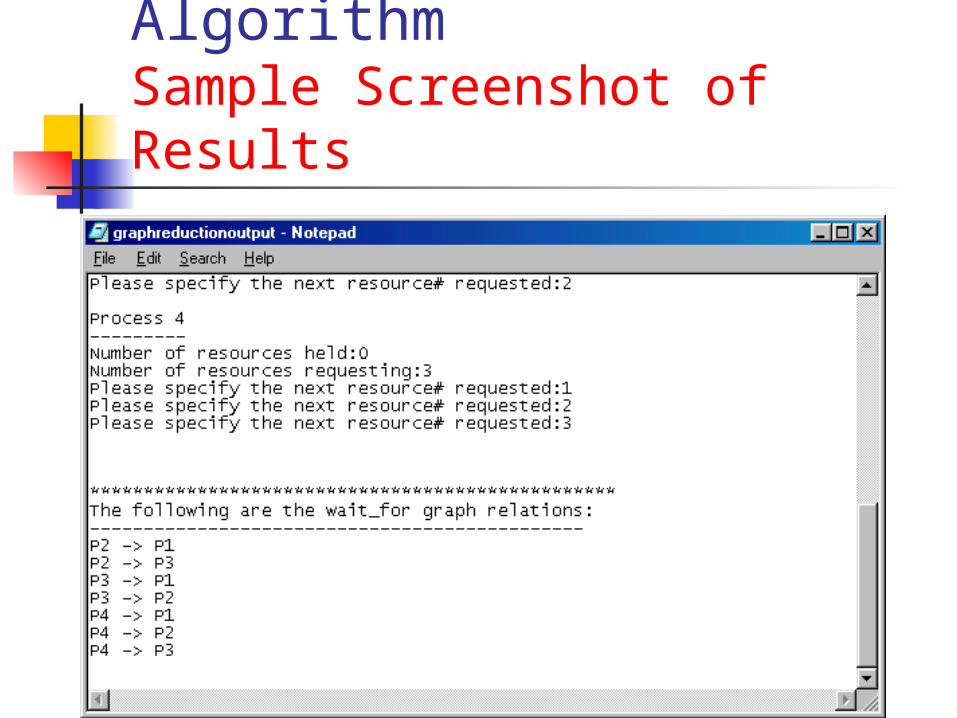
Graph Reduction AlgorithmSample Screenshot of Results
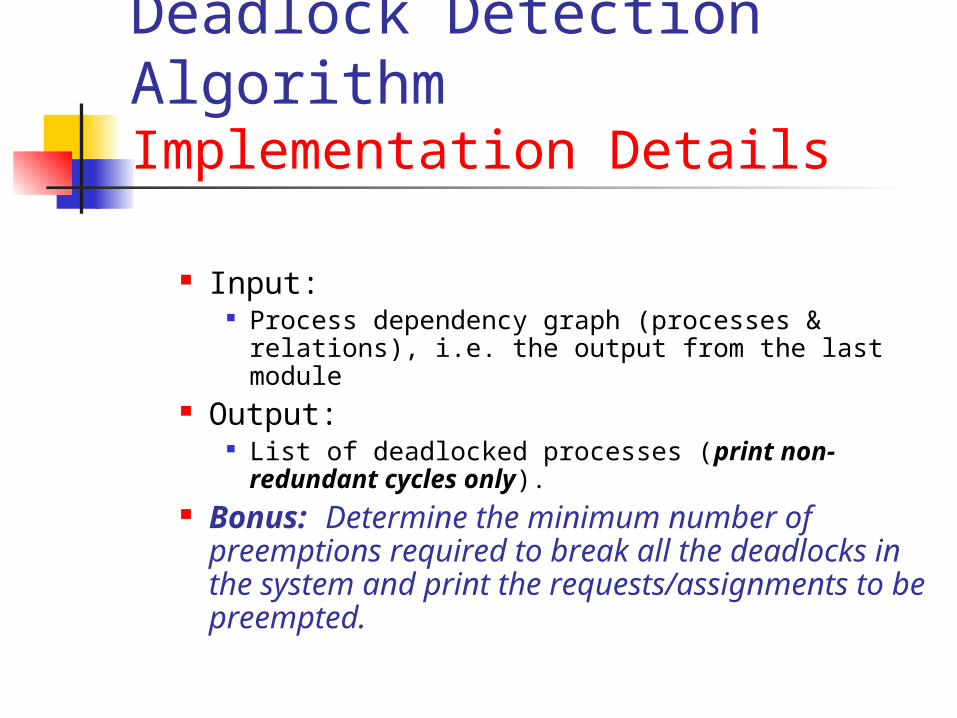
Deadlock Detection AlgorithmImplementation Details
Input: Process dependency graph (processes &
relations), i.e. the output from the last module Output:
List of deadlocked processes (print non-redundant cycles only).
Bonus: Determine the minimum number of preemptions required to break all the deadlocks in the system and print the requests/assignments to be preempted.
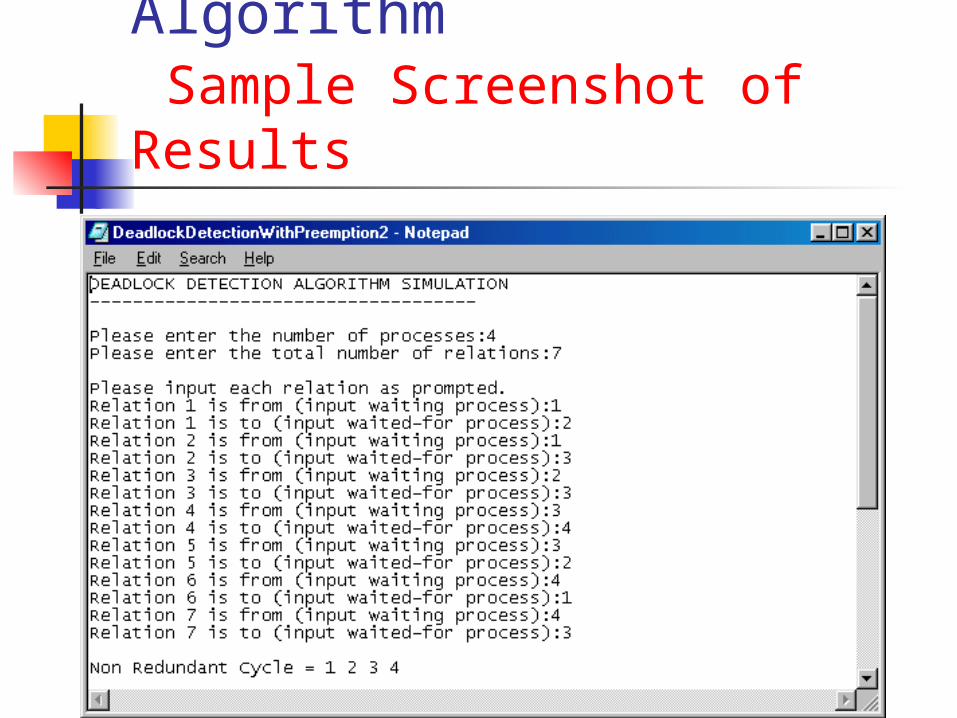
Deadlock Detection Algorithm Sample Screenshot of Results
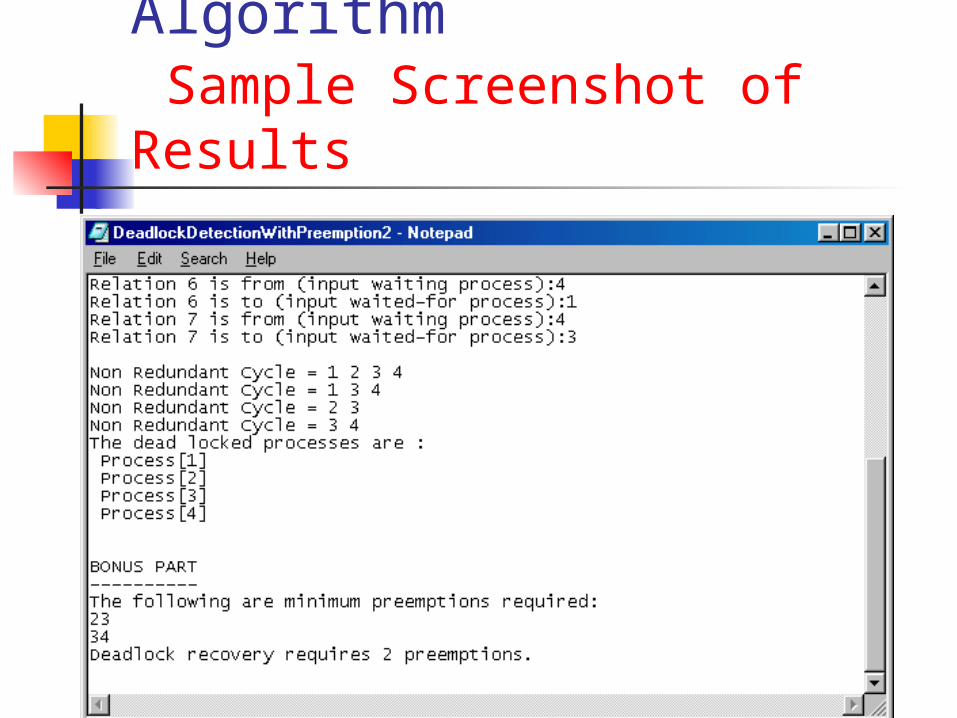
Deadlock Detection Algorithm Sample Screenshot of Results
Deadlock Avoidance ModuleImplementation Details
Deadlock Avoidance Module (using one resource type): Input: Table of
Table of resources, current usage and maximum usage One request
Output: Safe or unsafe state determination
This should be a dynamic algorithm, I.e., allow user to enter a set of consecutive requests and the algorithm would allow them or not based on safety. Implement an option allowing requests to be generated one at a time from different processes randomly.
Deadlock Avoidance Module Implementation Details Once you’ve implemented the deadlock
avoidance algorithm, analyze and do a statistical analysis for the behavior of the denial percentage (percentage of denied requests) versus some parameters like: Total number of resources Maximum number of needed resources per
process Number of processes
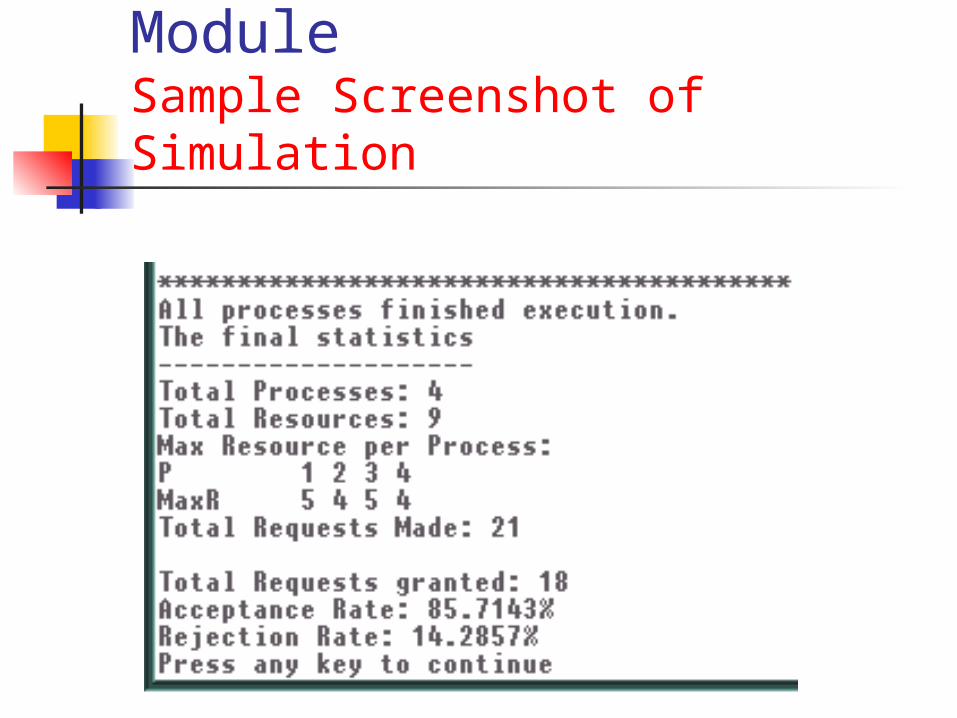
Deadlock Avoidance ModuleSample Screenshot of Simulation
Deadlock AvoidanceSample Data & Analysis from Simulation
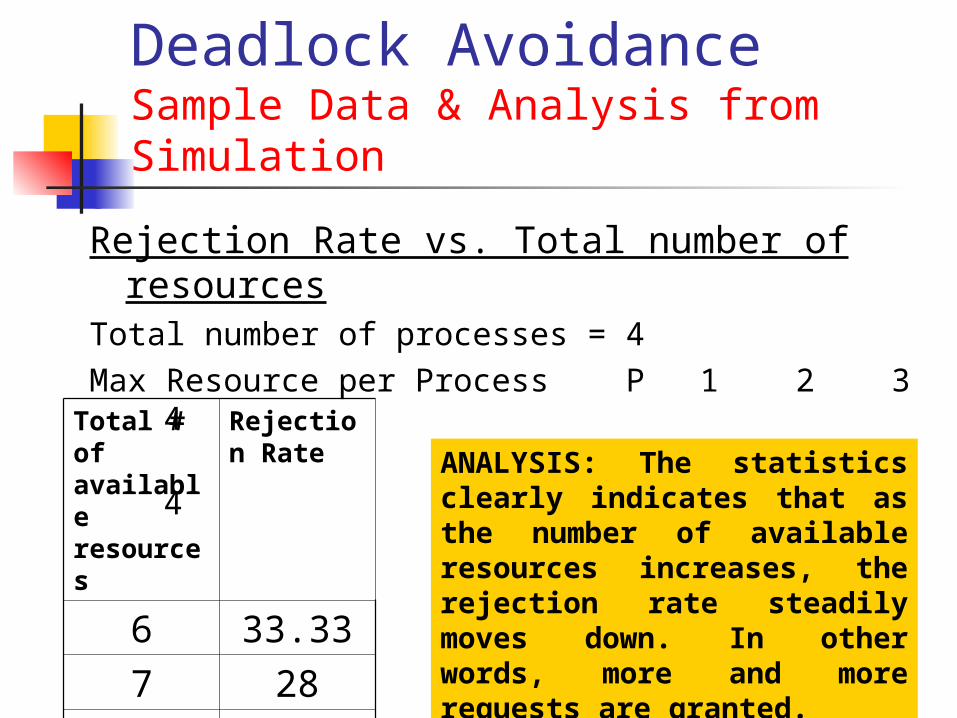
Rejection Rate vs. Total number of resourcesTotal number of processes = 4Max Resource per Process P 1 2 3 4
MaxR 5 4 5 4Total # of available resources
Rejection Rate
6 33.33
7 28
8 18.18
9 14.28
ANALYSIS: The statistics clearly indicates that as the number of available resources increases, the rejection rate steadily moves down. In other words, more and more requests are granted.
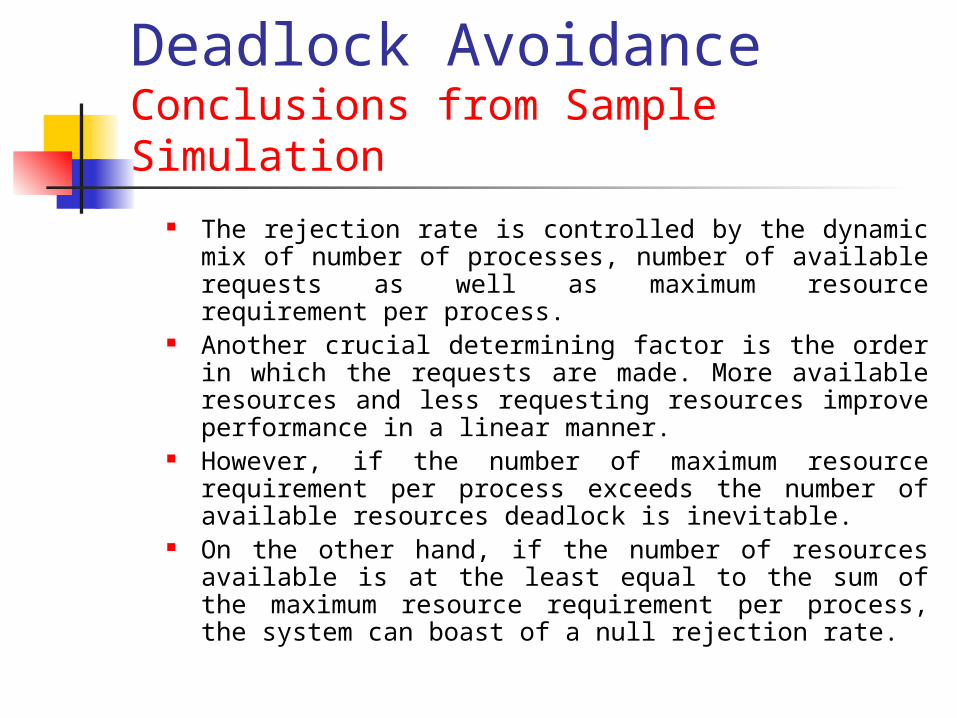
Deadlock AvoidanceConclusions from Sample Simulation
The rejection rate is controlled by the dynamic mix of number of processes, number of available requests as well as maximum resource requirement per process.
Another crucial determining factor is the order in which the requests are made. More available resources and less requesting resources improve performance in a linear manner.
However, if the number of maximum resource requirement per process exceeds the number of available resources deadlock is inevitable.
On the other hand, if the number of resources available is at the least equal to the sum of the maximum resource requirement per process, the system can boast of a null rejection rate.
Lecture Summary Introduction to Process
Synchronization and Deadlock Handling
Synchronization Methods Deadlocks
What are deadlocks The four necessary conditions
Deadlock Handling
Preview of next lectureThe following topics shall be covered in
the next lecture: Introduction to Memory Management
What is memory management Related Problems of Fragmentation,
Redundancy and Synchronization Continuous Memory Allocation Scheme Parameters Involved Parameter-Performance Relationships Some Sample Results