Embed Size (px)
Citation preview
Learning with interactive computer graphicsin the undergraduate neuroscience classroom
John R. Pani • Julia H. Chariker • Farah Naaz •
William Mattingly • Joshua Roberts • Sandra E. Sephton
Received: 25 July 2013 / Accepted: 17 November 2013� Springer Science+Business Media Dordrecht 2014
Abstract Instruction of neuroanatomy depends on graphical representation and
extended self-study. As a consequence, computer-based learning environments that
incorporate interactive graphics should facilitate instruction in this area. The present
study evaluated such a system in the undergraduate neuroscience classroom. The system
used the method of adaptive exploration, in which exploration in a high fidelity
graphical environment is integrated with immediate testing and feedback in repeated
cycles of learning. The results of this study were that students considered the graphical
learning environment to be superior to typical classroom materials used for learning
neuroanatomy. Students managed the frequency and duration of study, test, and feed-
back in an efficient and adaptive manner. For example, the number of tests taken before
reaching a minimum test performance of 90 % correct closely approximated the values
seen in more regimented experimental studies. There was a wide range of student
opinion regarding the choice between a simpler and a more graphically compelling
program for learning sectional anatomy. Course outcomes were predicted by individual
differences in the use of the software that reflected general work habits of the students,
such as the amount of time committed to testing. The results of this introduction into the
classroom are highly encouraging for development of computer-based instruction in
biomedical disciplines.
Keywords Learning � Instruction � Neuroanatomy � Computer-based
learning � Computer graphics
J. R. Pani (&) � J. H. Chariker � F. Naaz � J. Roberts � S. E. SephtonDepartment of Psychological and Brain Sciences, University of Louisville, Louisville, KY 40292, USAe-mail: [email protected]
W. MattinglyComputer Engineering and Computer Science, University of Louisville, Louisville, KY, USA
123
Adv in Health Sci EducDOI 10.1007/s10459-013-9483-3
Introduction
The spatial character of neuroanatomy leads to a method of instruction that makes con-
sistent use of depiction and illustration (as in Felten and Shetty 2010; Mai et al. 2008;
Nolte and Angevine 2007; Standring 2008). In addition, neuroanatomy presents a large and
complex curriculum that requires extensive self-study if students are to obtain mastery.
Many neuroscience texts, for example, are well over 1,000 pages long (Mai and Paxinos
2012; Parent 1996; Squire et al. 2008). The combination of these properties suggests that
computers are a technology platform that will provide valuable resources for neuroanat-
omy instruction. Recent generations of computer systems display graphical material par-
ticularly well (LONI 2013; Surgical Planning Laboratory 2013), and the capabilities of
computers for information management should provide good support for self-study (Saa-
dawi et al. 2008; Koedinger and Corbett 2006). Despite this promise, most reviews of
computer-based instructional applications in the biomedical sciences are not enthusiastic
about the progress that has been made (Collins 2008; Cook 2005; Cook et al. 2010;
Issenberg et al. 2005; Ruiz et al. 2009; Tam et al. 2009).
The present paper is part of a project to develop new methods of neuroanatomy
instruction that benefit from the capabilities of modern interactive computer graphical
systems. A considerable amount of experimental work already has been reported (Chariker
et al. 2011, 2012; Naaz et al. 2014; Pani et al. 2013; see also Pani et al. 2005). This work
was conducted with paid volunteers recruited from a university community. One reason for
that was that the work concerned an untried learning environment, and it could not be
required in relevant courses. Asking students to volunteer as subjects would have provided
smaller samples than were needed, and most participants would not have served for as long
as the research required.
Although valuable information was gathered in these studies, experiments conducted
with paid volunteers have important weaknesses. It is the classroom where a learning
environment ultimately must be successful, and generalization from experimental studies
to the classroom cannot be taken for granted. Students have different perspectives from
experimental subjects, and students may use instructional resources differently. Moreover,
adaptation of instructional methods to the classroom generally leads to procedures that are
modified from those tested in experiments (Barab 2006; Brown 1992; Collins 1992;
Lagemann 2002).
The present paper reports an evaluation of a computer-based learning environment for
neuroanatomy in the undergraduate neuroscience classroom. The opportunity for this work
came from a request by an instructor of neuroscience to integrate experimentally tested
versions of the environment into her courses. In the remainder of this introduction, we
outline the rationale behind development of the learning environment and briefly review
primary experimental findings. We then describe issues that were particularly important in
the introduction of the learning environment into the classroom.
Design of a learning environment for basic neuroanatomy
Graphics controlled by a computer are merely an abstract set of capabilities unless there is
theory to guide design of a system. Our group has been pursuing design based on three ideas.
The first is that instruction of the spatial characteristics of a complex three-dimensional
structure is more effective when people can explore the structure perceptually. This means
that if computer graphics will be used in instruction, they should be high fidelity graphics,
relative to what is to be learned. Perception of target structures should not be impaired by
J. R. Pani et al.
123
incompleteness of the representation, lack of clarity, or difficulty in accessing the informa-
tion. To enable clear perception of neural structures, an accurate three-dimensional (3D)
model of the human brain (Fig. 1) was developed from source material in the Visible Human
cryosections (version 2.0; Ackerman 1995; Ratiu et al. 2003).
The second idea for system design comes from decades of work in the psychology of
learning. People are relatively poor at learning sets of items that are perceived to be
arbitrary collections. People are relatively good at learning items that are integrated (or
organized) according to a set of familiar relations (Ambrose et al. 2010; Bower et al. 1969;
Bransford et al. 2000; Craik and Tulving 1975; Norman 2009; Woods et al. 2007). This has
led us, for example, to teach whole anatomy and cross-sectional (sectional) anatomy
together, so that the global information in whole anatomy can be used to integrate the
variety of samples in sectional anatomy. When teaching whole anatomy, we have enabled
learners to successively remove neural structures in order to reveal what is behind them.
This virtual dissection was intended to encourage a cognitive organization of the anatomy
in terms of the spatial ordering of structures.
The third idea guiding this effort is that instruction must include testing and feedback to
be effective. In a method called adaptive exploration, the learner has available high quality
graphics that permit intuitive exploration of the domain. This capability is included in a
system that tests knowledge of target information and provides detailed feedback on test
performance. Repeated cycles of this sequence show the learner what they need to know,
what they have learned, and what is left to learn. Further exploration can then be directed
to information that will be useful for learning (see Ambrose et al. 2010; Koedinger and
Corbett 2006). In addition, repeated testing improves long term retention (Cepeda et al.
2006; Karpicke and Roediger 2008).
Synopsis of research findings
The primary goal of the experimental studies has been evaluation and comparison of methods
for teaching sectional neuroanatomy. The results of these studies have been encouraging. In
cases where a learning trial might consist of a few minutes of study (e.g., four), a self-timed
test, and a few minutes of feedback (e.g., two), participants learn to recognize 19 structures in
whole neuroanatomy in three trials. Learning of whole anatomy then transfers well to learning
sectional anatomy. In one recent study, for example, test performance after one trial of
sectional anatomy learning was 79 % correct (Naaz et al. 2014).
Retention of neuroanatomy in these studies is high after several weeks (e.g., 88.5 %
retention of sectional neuroanatomy across the three standard views after an interval of
2.5 weeks; Chariker et al. 2011). Generalization to interpreting new biomedical images
also is quite good in many instances. For example, when neuroanatomical structures were
indicated by arrows on Visible Human images of the brain, participants could name 80 %
of them despite never having seen such images before (Chariker et al. 2011).
Finally, the spatial ability of experimental participants was measured and related to
performance in all of the experimental studies. Across several studies, participants with
low spatial ability performed worse in the early trials of learning. However, they learned at
a comparable rate to the other participants and completed learning in just a few more trials.
Questions for introduction of the learning environment into the classroom
To assess the value of this learning environment in the classroom, four basic questions
were addressed. The first concerned the level of student satisfaction with the computer-
Learning with interactive computer graphics
123
based system. With many sources of information about neuroanatomy available to stu-
dents, their opinions about the value of a particular source probably will determine how
much it is used. A questionnaire was administered at the end of neuroanatomy learning to
gather this information.
A second question pertained to student control of the frequency and duration of study,
test, and feedback. In the experimental work, the study period in each trial was constrained
to constant periods, the test was self-timed, and the feedback period again was constrained.
Although this method provided experimental control, it was inflexible, and it seemed likely
to be perceived negatively by students engaged in study for college courses. In the
classroom setting, the durations of study, test, and feedback were controlled by the stu-
dents, and one purpose of the study was to examine how students would manage this
capability. In particular, we asked three questions about timing. Would permitting students
to study for long periods before taking a test lead the students to test themselves less often
than occurred in the experimental studies? Taking fewer tests might reduce levels of long
term retention. Would students use time adaptively, with more time taken earlier in
learning? Finally, the examination of student control of timing would permit gathering
benchmark information. What would the relative durations of study, test, and feedback be
when they were controlled by the students?
A third basic concern was to assess student preference among two software systems for
learning sectional neuroanatomy. One program for learning sectional anatomy presented
only the sectional imagery, as in Fig. 2. A second program was more compelling in its
graphical representation of the brain. The 3D model could be sliced in order to expose the
2D cross-sections as a cut through the whole brain (Fig. 3). Experimental work has sug-
gested that this more complex program has an advantage for long-term retention of sec-
tional neuroanatomy (Naaz et al. 2014). We were interested in whether, because it is more
graphically impressive, this program would have a particular appeal to undergraduates who
were learning neuroanatomy for the first time. Finally, our fourth question concerned
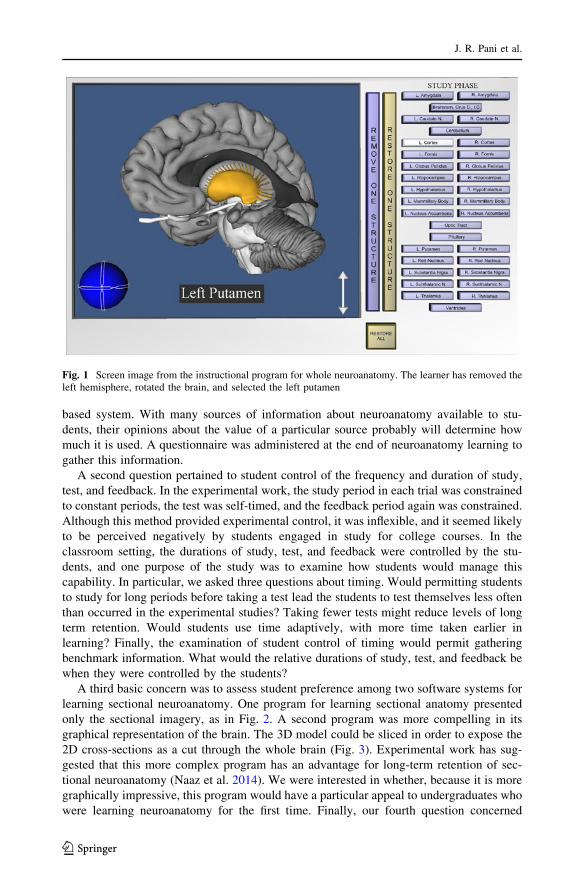
Fig. 1 Screen image from the instructional program for whole neuroanatomy. The learner has removed theleft hemisphere, rotated the brain, and selected the left putamen
J. R. Pani et al.
123
whether individual differences among the students in the use of the computer programs
would correlate with exam or course grades.
The integration of the existing learning environment into courses was tried first with a
graduate course that enrolled 17 students. A focus group was held at the completion of
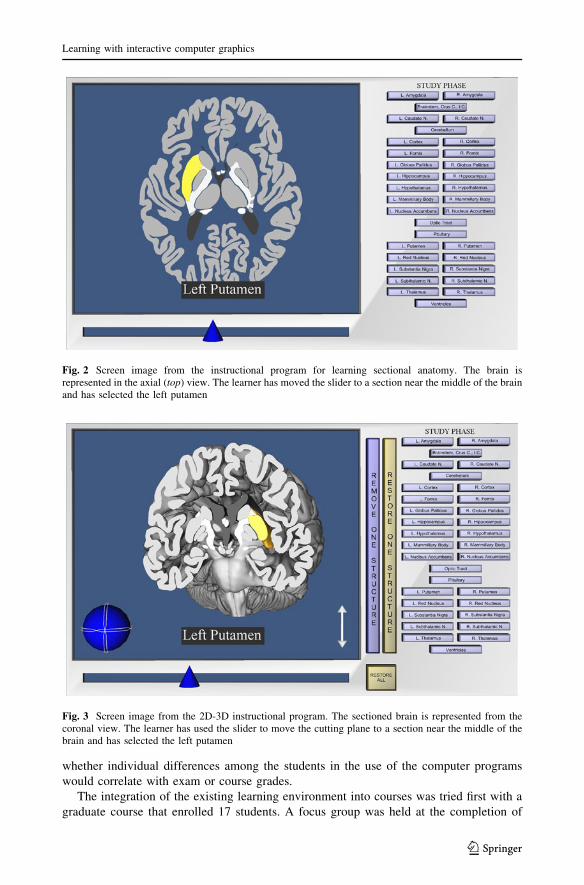
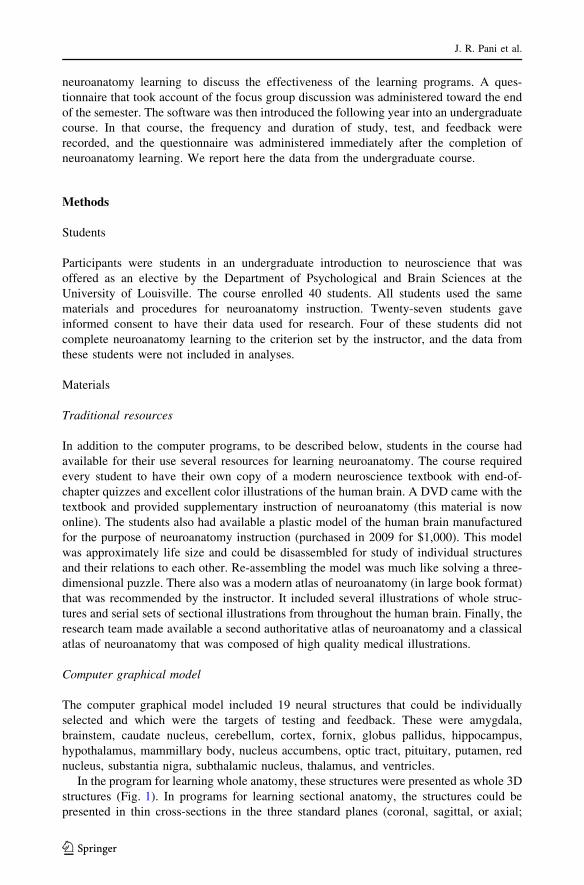
Fig. 2 Screen image from the instructional program for learning sectional anatomy. The brain isrepresented in the axial (top) view. The learner has moved the slider to a section near the middle of the brainand has selected the left putamen
Fig. 3 Screen image from the 2D-3D instructional program. The sectioned brain is represented from thecoronal view. The learner has used the slider to move the cutting plane to a section near the middle of thebrain and has selected the left putamen
Learning with interactive computer graphics
123
neuroanatomy learning to discuss the effectiveness of the learning programs. A ques-
tionnaire that took account of the focus group discussion was administered toward the end
of the semester. The software was then introduced the following year into an undergraduate
course. In that course, the frequency and duration of study, test, and feedback were
recorded, and the questionnaire was administered immediately after the completion of
neuroanatomy learning. We report here the data from the undergraduate course.
Methods
Students
Participants were students in an undergraduate introduction to neuroscience that was
offered as an elective by the Department of Psychological and Brain Sciences at the
University of Louisville. The course enrolled 40 students. All students used the same
materials and procedures for neuroanatomy instruction. Twenty-seven students gave
informed consent to have their data used for research. Four of these students did not
complete neuroanatomy learning to the criterion set by the instructor, and the data from
these students were not included in analyses.
Materials
Traditional resources
In addition to the computer programs, to be described below, students in the course had
available for their use several resources for learning neuroanatomy. The course required
every student to have their own copy of a modern neuroscience textbook with end-of-
chapter quizzes and excellent color illustrations of the human brain. A DVD came with the
textbook and provided supplementary instruction of neuroanatomy (this material is now
online). The students also had available a plastic model of the human brain manufactured
for the purpose of neuroanatomy instruction (purchased in 2009 for $1,000). This model
was approximately life size and could be disassembled for study of individual structures
and their relations to each other. Re-assembling the model was much like solving a three-
dimensional puzzle. There also was a modern atlas of neuroanatomy (in large book format)
that was recommended by the instructor. It included several illustrations of whole struc-
tures and serial sets of sectional illustrations from throughout the human brain. Finally, the
research team made available a second authoritative atlas of neuroanatomy and a classical
atlas of neuroanatomy that was composed of high quality medical illustrations.
Computer graphical model
The computer graphical model included 19 neural structures that could be individually
selected and which were the targets of testing and feedback. These were amygdala,
brainstem, caudate nucleus, cerebellum, cortex, fornix, globus pallidus, hippocampus,
hypothalamus, mammillary body, nucleus accumbens, optic tract, pituitary, putamen, red
nucleus, substantia nigra, subthalamic nucleus, thalamus, and ventricles.
In the program for learning whole anatomy, these structures were presented as whole 3D
structures (Fig. 1). In programs for learning sectional anatomy, the structures could be
presented in thin cross-sections in the three standard planes (coronal, sagittal, or axial;
J. R. Pani et al.
123

Fig. 2) There were 60 coronal sections, 50 sagittal sections, and 46 axial sections, all at
equal intervals. One instructional program for sectional anatomy presented the brain as
whole structures that were truncated at single planes in either the coronal, sagittal, or axial
views (Fig. 3).
Instructional programs
Five computer workstations were made available to the students in a set of four rooms that
were part of a laboratory suite. The computer graphics were displayed on 24-inch color
LCD monitors at a resolution of 1,920 by 1,200 pixels.
A total of five instructional programs were made available to the students on the work-
stations. Three primary programs came from the research studies which explored neuro-
anatomy learning. One program was for learning whole anatomy and the other two were for
learning sectional anatomy. Two 3D computer graphical atlases were constructed to provide
additional coverage of neuroanatomical structures that the instructor wished to be included.
Primary instructional programs: basic program operation The basic operation of the
three primary programs was the same (for more detail, see Chariker et al. 2011). During
study, students could freely explore the brain model using graphical tools available for that
program. Clicking on a structure with a computer mouse highlighted the structure, and its
name appeared prominently at the bottom of the screen.
A single run of the program also included a test phase. Students named the structures they had
learned by clicking on each structure and selecting its name from a button panel that represented
all 19 structures. Students could omit naming structures if they wished, and a name could be
used more than once. After a structure was named, it turned blue to indicate that.
A feedback phase consisted of two parts: a numerical feedback screen and graphical
feedback. The numerical screen was presented first. It indicated the number of structures that
were named correctly, the number of structures named incorrectly, and the number of
structures omitted. The graphical feedback consisted of a color coding of the brain model:
structures named correctly appeared in green, structures named incorrectly appeared in red,
and structures that were omitted appeared in their original colors (typically a single standard
gray). During the feedback stage, students could interact with the color-coded structures
using the same tools that were available in study. Students could click on structures, highlight
them, and see their correct names. The feedback stage ended with the appearance of an exit
screen that displayed the student’s test score in terms of a percentage correct.
Primary instructional programs: whole anatomy program The program for learning
whole anatomy featured the 3D model of the brain. During study, the students could explore
the model with the help of tools provided for rotation, zooming, and virtual dissection. Virtual
dissection was conducted by selecting structures and removing them, using buttons on the
panel at the right side of the screen (Fig. 1). Students also could restore removed structures.
Interaction during the test of whole anatomy was similar to the interaction during study.
Tools for rotating, zooming, and removing and restoring structures were available. Stu-
dents were asked to name as many structures as they could by selecting structures,
selecting their names in the button panel, and clicking a ‘‘Submit Answer’’ button. The
students received numeric feedback and then proceeded to graphical feedback by clicking
on a button. With 19 structures in the 3D model of the brain, the test of knowledge of
whole anatomy consisted of 19 items.
Learning with interactive computer graphics
123
In the whole anatomy program, the initial orientation of the brain was a view from the
front, side, or top. Students were then free to rotate the brain in any amount. The test phase
of a trial, however, restricted rotation of the model to ±45� from the front, side, or top,
consistent with the initial orientation in study. This was done to improve generalization of
learning with whole anatomy to the three standard views of sectional anatomy.
Primary instructional programs: sections only program One program for learning sec-
tional anatomy permitted exploring series of 2D sectional samples from the model of the brain
(called the sections only program). Students saw thin parallel sections of the brain in a single
view (coronal, sagittal, or axial; Fig. 2). Students could move from one section to another by
using a slider provided at the bottom of the screen. In the coronal view, for example, moving
the slider allowed students to see all the sections of the brain from front to back. Students
could go to individual sections of the brain and click on structures to learn their names.
The test of sectional anatomy knowledge was slightly different from the test for whole
anatomy. In sectional anatomy testing, between 12 and 15 sections of the model were
selected for each test. Only a few structures were tested in each of the sections. This
procedure was adopted because testing all structures in multiple sections would create a
test that was too long.
The structures that were tested were indicated by arrows. The students were to name
each structure that was indicated by selecting it, selecting its name from the button panel,
and clicking a ‘‘Submit Answer’’ button. Students could move from one test section to the
next by clicking on a ‘‘Next Section’’ button, but they could not go back to a previous test
section. Longer structures were sampled twice in tests of sectional anatomy (i.e., in two
sections). Thus, there were 29 test items for the coronal and sagittal views of sectional
anatomy and 27 test items for the axial view.
After completing the test stage of a trial, students received numeric feedback followed
by graphical feedback. The graphical feedback phase was similar to the study phase and
included all of the sections of the brain. The test sections were marked. The arrows
indicating the test items remained, and the test items again were color coded to reflect the
performance on the test. The feedback phase allowed students to go through all of the
sections and to see where the test sections were taken from the series. They could select
structures and see their correct names.
Primary instructional programs: 2D-3D program A second program for learning sec-
tional anatomy, called 2D-3D, permitted exploring the 3D model using all of the tools used
earlier in the whole anatomy program (Naaz et al. 2014). In addition, the 3D model could
be sliced to view sectional anatomy with the help of a slider tool. On moving the slider
from left to right, a virtual cutting plane appeared to move through the brain and to remove
the part of the brain in front of the plane. This exposed the 2D cross-sections of the 3D
structures from one end of the brain to the other (Fig. 3). Behind the cutting plane, the 3D
structures remained visible, allowing the students to see the relations between 3D and 2D
representations. The test and feedback phases were identical to the test and feedback
phases of the sections only program (i.e., test and feedback included only the 2D sections).
Additional instructional programs: computer graphical atlases
Two computer graphical atlases were added to the three primary programs (Fig. 4). One
presented a single cortical hemisphere with labels for the cortical lobes and the major gyri
J. R. Pani et al.
123
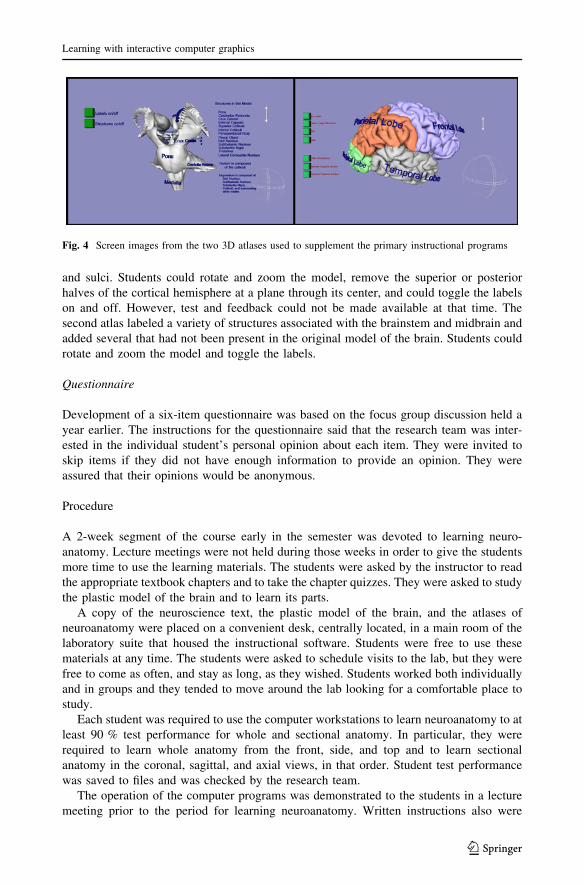
and sulci. Students could rotate and zoom the model, remove the superior or posterior
halves of the cortical hemisphere at a plane through its center, and could toggle the labels
on and off. However, test and feedback could not be made available at that time. The
second atlas labeled a variety of structures associated with the brainstem and midbrain and
added several that had not been present in the original model of the brain. Students could
rotate and zoom the model and toggle the labels.
Questionnaire
Development of a six-item questionnaire was based on the focus group discussion held a
year earlier. The instructions for the questionnaire said that the research team was inter-
ested in the individual student’s personal opinion about each item. They were invited to
skip items if they did not have enough information to provide an opinion. They were
assured that their opinions would be anonymous.
Procedure
A 2-week segment of the course early in the semester was devoted to learning neuro-
anatomy. Lecture meetings were not held during those weeks in order to give the students
more time to use the learning materials. The students were asked by the instructor to read
the appropriate textbook chapters and to take the chapter quizzes. They were asked to study
the plastic model of the brain and to learn its parts.
A copy of the neuroscience text, the plastic model of the brain, and the atlases of
neuroanatomy were placed on a convenient desk, centrally located, in a main room of the
laboratory suite that housed the instructional software. Students were free to use these
materials at any time. The students were asked to schedule visits to the lab, but they were
free to come as often, and stay as long, as they wished. Students worked both individually
and in groups and they tended to move around the lab looking for a comfortable place to
study.
Each student was required to use the computer workstations to learn neuroanatomy to at
least 90 % test performance for whole and sectional anatomy. In particular, they were
required to learn whole anatomy from the front, side, and top and to learn sectional
anatomy in the coronal, sagittal, and axial views, in that order. Student test performance
was saved to files and was checked by the research team.
The operation of the computer programs was demonstrated to the students in a lecture
meeting prior to the period for learning neuroanatomy. Written instructions also were
Fig. 4 Screen images from the two 3D atlases used to supplement the primary instructional programs
Learning with interactive computer graphics
123
available beside each workstation, and a member of the lab was available to answer
questions. The students were informed by the instructor that there would be an exam
specifically on neuroanatomy and that it would draw from all resources that were available
for instruction.
After the students had completed using the instructional programs for whole anatomy,
half of them were shown the sections only program and half were shown the 2D-3D
program. There was one trial of study, test, and feedback with the initial program. The
student was then shown the other program and completed one trial of study, test, and
feedback. After the two introductory trials with the sectional anatomy programs were
completed, the students chose which program they wished to use to complete their learning
of sectional anatomy. They were free to switch to the other program at any time.
Immediately after the introductory trials with the two sectional anatomy programs were
completed, an initial two-item subset of the questionnaire was given to the students. The
full questionnaire was presented immediately after all of neuroanatomy learning was
completed, but before the neuroanatomy exam was taken.
Results
Questionnaire data
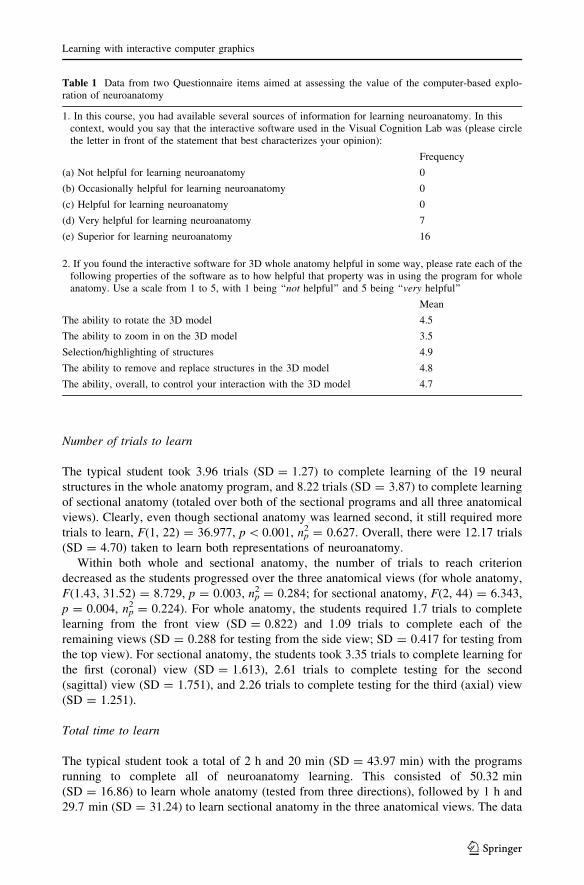
The first two items from the six item questionnaire were most important for assessing
student satisfaction with the graphical learning environment. These items, and the
responses to them collected at the close of neuroanatomy learning, are presented in
Table 1. It is clear that the computer-based graphical software was generally considered a
superior way to learn the assigned material (see also Brewer et al. 2012; Hariri et al. 2004;
Keedy et al. 2011). In addition, the ability to interact with the brain model was deemed
very important to the value of the software.
Performance data
The students did not always use the learning programs with measurable effort in study, test,
and feedback. For example, a student might study for several minutes and then close the
program. They might then leave to attend a class, return the same day and study again, and
then take the test and examine the feedback. For this reason, a breakdown of the data into
learning trials is based on the number of tests taken. A single trial is considered to be the
total study, test, and feedback durations associated with a single test.
Test performance over trials
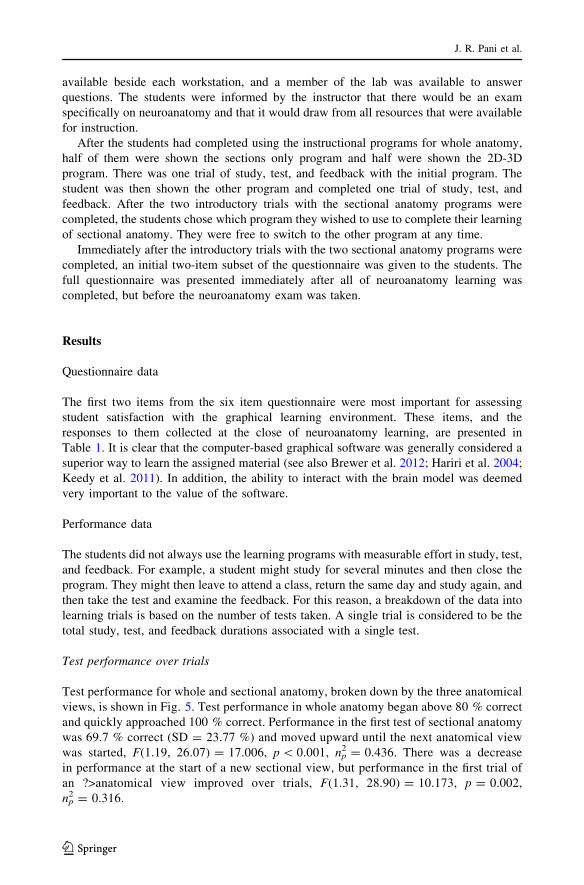
Test performance for whole and sectional anatomy, broken down by the three anatomical
views, is shown in Fig. 5. Test performance in whole anatomy began above 80 % correct
and quickly approached 100 % correct. Performance in the first test of sectional anatomy
was 69.7 % correct (SD = 23.77 %) and moved upward until the next anatomical view
was started, F(1.19, 26.07) = 17.006, p \ 0.001, np2 = 0.436. There was a decrease
in performance at the start of a new sectional view, but performance in the first trial of
an ?>anatomical view improved over trials, F(1.31, 28.90) = 10.173, p = 0.002,
np2 = 0.316.
J. R. Pani et al.
123
Number of trials to learn
The typical student took 3.96 trials (SD = 1.27) to complete learning of the 19 neural
structures in the whole anatomy program, and 8.22 trials (SD = 3.87) to complete learning
of sectional anatomy (totaled over both of the sectional programs and all three anatomical
views). Clearly, even though sectional anatomy was learned second, it still required more
trials to learn, F(1, 22) = 36.977, p \ 0.001, np2 = 0.627. Overall, there were 12.17 trials
(SD = 4.70) taken to learn both representations of neuroanatomy.
Within both whole and sectional anatomy, the number of trials to reach criterion
decreased as the students progressed over the three anatomical views (for whole anatomy,
F(1.43, 31.52) = 8.729, p = 0.003, np2 = 0.284; for sectional anatomy, F(2, 44) = 6.343,
p = 0.004, np2 = 0.224). For whole anatomy, the students required 1.7 trials to complete
learning from the front view (SD = 0.822) and 1.09 trials to complete each of the
remaining views (SD = 0.288 for testing from the side view; SD = 0.417 for testing from
the top view). For sectional anatomy, the students took 3.35 trials to complete learning for
the first (coronal) view (SD = 1.613), 2.61 trials to complete testing for the second
(sagittal) view (SD = 1.751), and 2.26 trials to complete testing for the third (axial) view
(SD = 1.251).
Total time to learn
The typical student took a total of 2 h and 20 min (SD = 43.97 min) with the programs
running to complete all of neuroanatomy learning. This consisted of 50.32 min
(SD = 16.86) to learn whole anatomy (tested from three directions), followed by 1 h and
29.7 min (SD = 31.24) to learn sectional anatomy in the three anatomical views. The data
Table 1 Data from two Questionnaire items aimed at assessing the value of the computer-based explo-ration of neuroanatomy
1. In this course, you had available several sources of information for learning neuroanatomy. In thiscontext, would you say that the interactive software used in the Visual Cognition Lab was (please circlethe letter in front of the statement that best characterizes your opinion):
Frequency
(a) Not helpful for learning neuroanatomy 0
(b) Occasionally helpful for learning neuroanatomy 0
(c) Helpful for learning neuroanatomy 0
(d) Very helpful for learning neuroanatomy 7
(e) Superior for learning neuroanatomy 16
2. If you found the interactive software for 3D whole anatomy helpful in some way, please rate each of thefollowing properties of the software as to how helpful that property was in using the program for wholeanatomy. Use a scale from 1 to 5, with 1 being ‘‘not helpful’’ and 5 being ‘‘very helpful’’
Mean
The ability to rotate the 3D model 4.5
The ability to zoom in on the 3D model 3.5
Selection/highlighting of structures 4.9
The ability to remove and replace structures in the 3D model 4.8
The ability, overall, to control your interaction with the 3D model 4.7
Learning with interactive computer graphics
123
for duration exclude one outlier who took more than twice as long as the next slowest
learner.
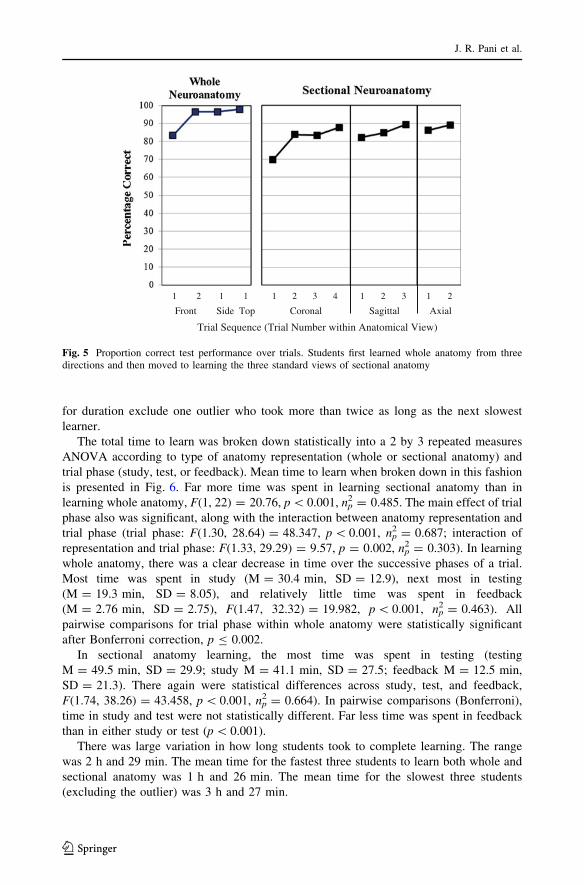
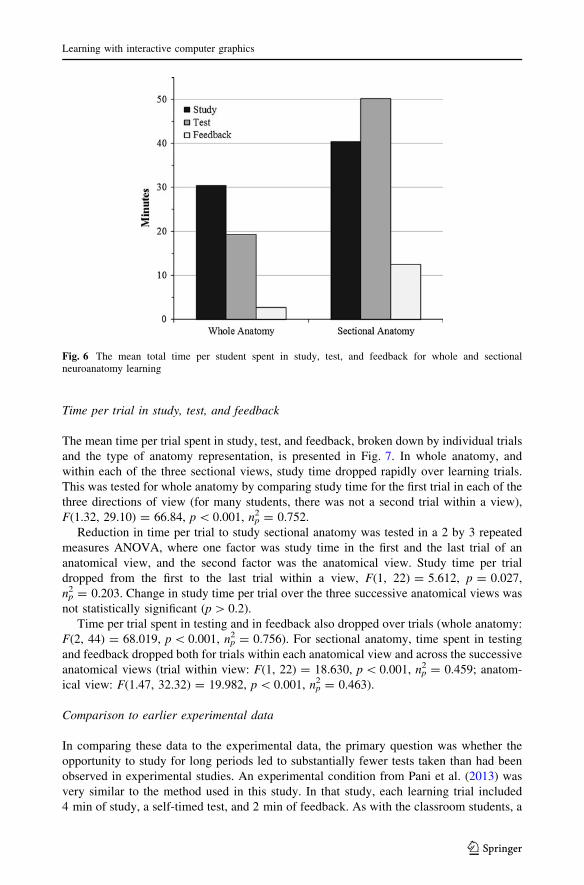
The total time to learn was broken down statistically into a 2 by 3 repeated measures
ANOVA according to type of anatomy representation (whole or sectional anatomy) and
trial phase (study, test, or feedback). Mean time to learn when broken down in this fashion
is presented in Fig. 6. Far more time was spent in learning sectional anatomy than in
learning whole anatomy, F(1, 22) = 20.76, p \ 0.001, np2 = 0.485. The main effect of trial
phase also was significant, along with the interaction between anatomy representation and
trial phase (trial phase: F(1.30, 28.64) = 48.347, p \ 0.001, np2 = 0.687; interaction of
representation and trial phase: F(1.33, 29.29) = 9.57, p = 0.002, np2 = 0.303). In learning
whole anatomy, there was a clear decrease in time over the successive phases of a trial.
Most time was spent in study (M = 30.4 min, SD = 12.9), next most in testing
(M = 19.3 min, SD = 8.05), and relatively little time was spent in feedback
(M = 2.76 min, SD = 2.75), F(1.47, 32.32) = 19.982, p \ 0.001, np2 = 0.463). All
pairwise comparisons for trial phase within whole anatomy were statistically significant
after Bonferroni correction, p B 0.002.
In sectional anatomy learning, the most time was spent in testing (testing
M = 49.5 min, SD = 29.9; study M = 41.1 min, SD = 27.5; feedback M = 12.5 min,
SD = 21.3). There again were statistical differences across study, test, and feedback,
F(1.74, 38.26) = 43.458, p \ 0.001, np2 = 0.664). In pairwise comparisons (Bonferroni),
time in study and test were not statistically different. Far less time was spent in feedback
than in either study or test (p \ 0.001).
There was large variation in how long students took to complete learning. The range
was 2 h and 29 min. The mean time for the fastest three students to learn both whole and
sectional anatomy was 1 h and 26 min. The mean time for the slowest three students
(excluding the outlier) was 3 h and 27 min.
Front Side Top Coronal Sagittal Axial
Trial Sequence (Trial Number within Anatomical View)
1 2 1 1 1 2 3 4 1 2 3 1 2
Fig. 5 Proportion correct test performance over trials. Students first learned whole anatomy from threedirections and then moved to learning the three standard views of sectional anatomy
J. R. Pani et al.
123
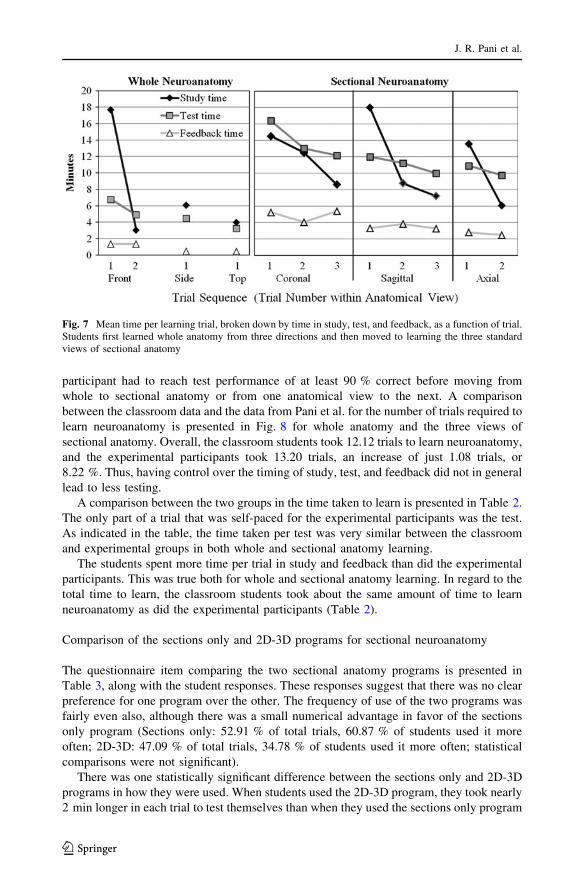
Time per trial in study, test, and feedback
The mean time per trial spent in study, test, and feedback, broken down by individual trials
and the type of anatomy representation, is presented in Fig. 7. In whole anatomy, and
within each of the three sectional views, study time dropped rapidly over learning trials.
This was tested for whole anatomy by comparing study time for the first trial in each of the
three directions of view (for many students, there was not a second trial within a view),
F(1.32, 29.10) = 66.84, p \ 0.001, np2 = 0.752.
Reduction in time per trial to study sectional anatomy was tested in a 2 by 3 repeated
measures ANOVA, where one factor was study time in the first and the last trial of an
anatomical view, and the second factor was the anatomical view. Study time per trial
dropped from the first to the last trial within a view, F(1, 22) = 5.612, p = 0.027,
np2 = 0.203. Change in study time per trial over the three successive anatomical views was
not statistically significant (p [ 0.2).
Time per trial spent in testing and in feedback also dropped over trials (whole anatomy:
F(2, 44) = 68.019, p \ 0.001, np2 = 0.756). For sectional anatomy, time spent in testing
and feedback dropped both for trials within each anatomical view and across the successive
anatomical views (trial within view: F(1, 22) = 18.630, p \ 0.001, np2 = 0.459; anatom-
ical view: F(1.47, 32.32) = 19.982, p \ 0.001, np2 = 0.463).
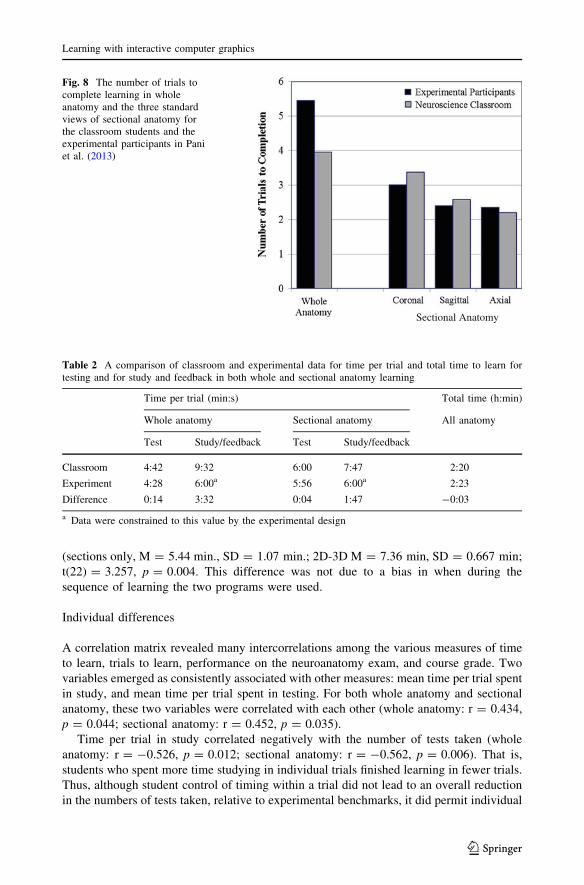
Comparison to earlier experimental data
In comparing these data to the experimental data, the primary question was whether the
opportunity to study for long periods led to substantially fewer tests taken than had been
observed in experimental studies. An experimental condition from Pani et al. (2013) was
very similar to the method used in this study. In that study, each learning trial included
4 min of study, a self-timed test, and 2 min of feedback. As with the classroom students, a
Fig. 6 The mean total time per student spent in study, test, and feedback for whole and sectionalneuroanatomy learning
Learning with interactive computer graphics
123
participant had to reach test performance of at least 90 % correct before moving from
whole to sectional anatomy or from one anatomical view to the next. A comparison
between the classroom data and the data from Pani et al. for the number of trials required to
learn neuroanatomy is presented in Fig. 8 for whole anatomy and the three views of
sectional anatomy. Overall, the classroom students took 12.12 trials to learn neuroanatomy,
and the experimental participants took 13.20 trials, an increase of just 1.08 trials, or
8.22 %. Thus, having control over the timing of study, test, and feedback did not in general
lead to less testing.
A comparison between the two groups in the time taken to learn is presented in Table 2.
The only part of a trial that was self-paced for the experimental participants was the test.
As indicated in the table, the time taken per test was very similar between the classroom
and experimental groups in both whole and sectional anatomy learning.
The students spent more time per trial in study and feedback than did the experimental
participants. This was true both for whole and sectional anatomy learning. In regard to the
total time to learn, the classroom students took about the same amount of time to learn
neuroanatomy as did the experimental participants (Table 2).
Comparison of the sections only and 2D-3D programs for sectional neuroanatomy
The questionnaire item comparing the two sectional anatomy programs is presented in
Table 3, along with the student responses. These responses suggest that there was no clear
preference for one program over the other. The frequency of use of the two programs was
fairly even also, although there was a small numerical advantage in favor of the sections
only program (Sections only: 52.91 % of total trials, 60.87 % of students used it more
often; 2D-3D: 47.09 % of total trials, 34.78 % of students used it more often; statistical
comparisons were not significant).
There was one statistically significant difference between the sections only and 2D-3D
programs in how they were used. When students used the 2D-3D program, they took nearly
2 min longer in each trial to test themselves than when they used the sections only program
Fig. 7 Mean time per learning trial, broken down by time in study, test, and feedback, as a function of trial.Students first learned whole anatomy from three directions and then moved to learning the three standardviews of sectional anatomy
J. R. Pani et al.
123
(sections only, M = 5.44 min., SD = 1.07 min.; 2D-3D M = 7.36 min, SD = 0.667 min;
t(22) = 3.257, p = 0.004. This difference was not due to a bias in when during the
sequence of learning the two programs were used.
Individual differences
A correlation matrix revealed many intercorrelations among the various measures of time
to learn, trials to learn, performance on the neuroanatomy exam, and course grade. Two
variables emerged as consistently associated with other measures: mean time per trial spent
in study, and mean time per trial spent in testing. For both whole anatomy and sectional
anatomy, these two variables were correlated with each other (whole anatomy: r = 0.434,
p = 0.044; sectional anatomy: r = 0.452, p = 0.035).
Time per trial in study correlated negatively with the number of tests taken (whole
anatomy: r = -0.526, p = 0.012; sectional anatomy: r = -0.562, p = 0.006). That is,
students who spent more time studying in individual trials finished learning in fewer trials.
Thus, although student control of timing within a trial did not lead to an overall reduction
in the numbers of tests taken, relative to experimental benchmarks, it did permit individual
Sectional Anatomy
Fig. 8 The number of trials tocomplete learning in wholeanatomy and the three standardviews of sectional anatomy forthe classroom students and theexperimental participants in Paniet al. (2013)
Table 2 A comparison of classroom and experimental data for time per trial and total time to learn fortesting and for study and feedback in both whole and sectional anatomy learning
Time per trial (min:s) Total time (h:min)
Whole anatomy Sectional anatomy All anatomy
Test Study/feedback Test Study/feedback
Classroom 4:42 9:32 6:00 7:47 2:20
Experiment 4:28 6:00a 5:56 6:00a 2:23
Difference 0:14 3:32 0:04 1:47 -0:03
a Data were constrained to this value by the experimental design
Learning with interactive computer graphics
123
differences where those students who spent more time in study took fewer tests (see later
discussion).
Students who completed learning of sectional neuroanatomy in fewer trials generally
performed better on the neuroanatomy exam, r = -0.432, p = 0.044. Completing sec-
tional neuroanatomy in fewer trials also had a marginal relation to course grade, r =
-0.387, p = 0.075 (2-tailed). Overall, course performance was better for those students
who learned faster (see later discussion). No other variable or combination of variables
predicted exam performance.
Students who received an A in the course (56.5 % of the students) had spent more time
per test (1.40 min) than did the other students, t(20) = 3.361, p = 0.003. A relationship
with time per test and scores on the neuroanatomy exam was much weaker. For example,
when students were divided by a median split on exam score, the difference in time per test
was relatively small (0.69 min) and not statistically significant, p = 0.188.
A further finding of interest concerned the total time spent in testing over the course of
neuroanatomy learning. First of all, students who took longer to complete testing for whole
anatomy also tended to take longer for sectional anatomy, r = 0.485, p = 0.022. In
addition, those students who spent more total time taking tests spent more time per trial in
feedback (whole anatomy: r = 0.623, p = 0.022; sectional anatomy: r = 0.500,
p = 0.018). That is, with more difficulty in completing learning, students spent more time
per trial in feedback. The responses to the Questionnaire items not discussed in the Results
section of this article are presented in the Appendix.
Discussion
This study examined an introduction into the undergraduate neuroscience classroom of a
learning environment for basic neuroanatomy. The system was designed to take advantage
of the capabilities of modern interactive computer graphics, to promote integration and
organization of the material, and to incorporate multiple cycles of study, test, and feedback.
Student ratings of the value of the graphical learning environment
The results of a questionnaire administered immediately after the learning of neuroanat-
omy suggested that the students considered the computer-based learning programs to be
Table 3 Data from a Questionnaire item comparing the sections alone and 2D-3D programs for learningsectional anatomy
6. You were introduced to two different methods for learning sectional anatomy. One method, called‘‘sections’’, only showed the sectioned anatomy directly facing the user. The other method, called ‘‘2D3D’’,showed sectional anatomy moving through the whole anatomy model. Which of these programs do you thinkwould work best for future neuroanatomy instruction? Please circle the letter in front of the statement that bestcharacterizes your opinion:
Frequency
(a) The sections only program is much better 4
(b) The sections only program is somewhat better 7
(c) They’re both about equally good 4
(d) The 2D3D method is somewhat better 1
(e) The 2D3D program is much better 7
J. R. Pani et al.
123
superior in the context of the alternative classroom resources. These included textbook
illustrations in book form and on DVD, photographs, diagrams, and illustrations in atlases,
and a plastic model of the brain.
There could be several reasons for the students’ high levels of satisfaction with the computer-
based materials. To begin with, we believe that the ability to explore modern computer graphics
provided more effective display of information about anatomical structures than did the static
diagrams and illustrations. Part of this advantage was the display of information that suited the
momentary concerns of the learner. Rather than seeing a page with 20 labels and 20 arrows
pointing to neural structures, or 20 acronyms to be looked up in tables, the user could individ-
ually highlight structures and see just the relevant names. In addition, the ability to remove
structures to see what was behind them, to change the viewing angle, or to move through serial
sections, provided valuable information about spatial relations. The interactive capabilities of
the learning environment were rated by the students as being very helpful.
Given the large research literature on the use of animation in instruction (Levinson et al.
2007; Mayer et al. 2005; Tversky et al. 2002), it is important to note that the inclusion of
rotation and zooming in the graphics was not intended to provide animation as a contin-
uous event or an intrinsic property of the scene. These were intended to be tools available
to the learner for placing neuroanatomy at a view that was most informative. In other
words, we did not present a rotating brain; we gave the learner an opportunity to reorient
the brain if they wished (see Wang and Simons 1999). In addition, rotational motion of a
3D object is an excellent depth cue that does not depend on special equipment or the
learner’s stereoacuity (Palmer 2002).
In regard to the plastic model, although it was an actual rather than a virtual 3D object,
it was in many ways less realistic than the computer graphics. The parts disassembled into
arbitrary piles, they were obviously plastic, and it was our impression that fitting them
together was more like working a puzzle than studying the brain (e.g., with the necessity to
bend structures and to fit tabs into holes). Physical models are not always the superior form
of spatial representation.
Finally, we believe that two closely related properties of the learning environment were
important to its positive reception. In the first place, study, test, and feedback were inte-
grated into single learning episodes. Second, testing and feedback took place in continuous
cycles, so that students could approach learning as a gradual mastery of the tests, much as
popular computer games encourage mastery of different ‘‘levels’’. Of course, such methods
can be applied to almost any medium. However, they are more efficiently implemented in a
computer-based system. In fact, we think that the comparisons in the present study are
representative of how material such as neuroanatomy is generally taught in classroom
settings. For traditional materials, students are warned what will be on a test, they are
provided resources to use for study, and they are urged to take time and prepare well. The
test comes later, and feedback on the test performance constitutes an exam grade and
marks the end of instruction for that material.
Student management of time in study, test, and feedback
The present data suggest that student management of the frequency and duration of study,
test, and feedback is superior to the more rigid schedule used in the earlier experimental
studies. The students managed their time adaptively. The time invested in learning gen-
erally decreased as learning progressed, except when new challenges were presented.
Students who had more difficulty getting through the testing spent more time exploring the
feedback.
Learning with interactive computer graphics
123
Student control of the time in study, test, and feedback did not lead to an appreciable
decrease in the number of trials required to complete learning. The numbers of tests taken
closely approximated the numbers seen in comparable experimental work, where study and
feedback periods were constrained to relatively short periods. One reason for this con-
sistency was the requirement that demanding performance criteria be met across a variety
of types of test. Thus, whole anatomy was studied over four trials in part because the
students had to identify structures from the front, the side, and the top in separate tests. In
sectional anatomy, which was more difficult to learn, the requirement to reach at least
90 % test performance resulted in most students taking many more than the minimum
number of trials to learn.
A comparison of the total time taken to learn between the students and the experimental
participants revealed a striking similarity. This is particularly interesting given the very
different distributions of times over the course of learning. We believe this to be an
important finding, because there are clear advantages of student control of durations. In
each episode of learning, students will feel that they had enough time to learn and that time
had not been wasted.
Student preference among alternative programs for learning sectional anatomy
There was a wide range of opinion as to which of the two programs for learning sectional
anatomy was superior. Certainly there was not a preference for the graphically more
impressive 2D-3D program. In fact, there was a slight numerical advantage in favor of the
sections only program, both in the frequency of use and in the statement of preference in
the questionnaire. The advantages of the sections only program are that it is simpler, and
the presentation in study is the same as the presentation during test.
It also was found that the students took longer to test themselves when using the 2D-3D
program than when using the sections only program. Again, it is important to remember
that for the sections only program, the study and test materials were identical. In 2D-3D,
the sectional test materials were a highly selective sample of what was seen during study.
The additional effort during testing may be one reason that experimental comparisons
show an advantage for 2D-3D in long-term retention of sectional neuroanatomy (Naaz
et al. 2014; consider Bjork 1999).
Individual differences and use of the learning software
The attempt to relate individual differences in the use of the learning software to exam and
course grades revealed general differences among the students. First of all, those students
who completed learning in fewer trials did better on the neuroanatomy exam. On the face
of it, this finding appears inconsistent with the test effect, in which more testing leads to
better retention of learned material (after 1 week; Karpicke and Roediger 2008). However,
it is clear from the experimental work that there are two factors involved in the relation
between the number of tests taken and retention. One is an individual differences factor
that is evident when the number of tests is a reflection only of the rate of learning of the
individual. The other is a treatment effect that appears when individual differences are
controlled, and the number of tests is varied by an external factor (e.g., an experimental
procedure varied between groups). In our experience, even when there is no treatment
effect, there are individual differences in the rate of learning, and those students who learn
in fewer trials retain more of the material. To put it in simple terms, those students are more
efficient learners on all measures.
J. R. Pani et al.
123

It also was found that students who spent more time on each test were more likely to
receive the highest grade in the course. This result must reflect such general factors as
motivation, learning strategy, and work habits. Why this relationship was not better
reflected in performance on the neuroanatomy exam is not clear. It is probably important
that there was a strict performance criterion for completing neuroanatomy learning. The
students were required to learn the material, and the resulting exam scores 1 week later
were generally high.
Weaknesses of this study
There are several weaknesses of this work. Even including the two 3D atlases that were
provided for use by the class, the students were taught to recognize fewer than fifty neural
structures. Ultimately, a learning environment such as this will have to be scaled up to
include hundreds of structures (or more). This will require development of new techniques
for introducing and moving through a large and complex domain.
A weakness of a different kind is related to the fact that study of real tissue will always
be an important part of biomedical education. As computer-based systems become more
capable, it will be important to explore how they can best be combined with study of real
tissue. This was not attempted in this work. Our hypothesis is that mastery of the graphical
material will provide a good preparation for durable learning with real tissue (consider
Norman 2009).
Summation
The biomedical sciences present a large volume of factual material to be learned. Much of
this material consists of complex spatial structures and systems. A moderate understanding
of the human skull, for example, presents a serious challenge for spatial learning. In such
disciplines, appropriately designed learning environments that take advantage of modern
capabilities for computer graphics will be especially helpful. Computers excel at presenting
graphical material, and they can support the extended self-study required in these
disciplines.
The present study examined classroom use of a computer-based learning environment
for basic neuroanatomy that used high fidelity interactive graphics. The system began by
teaching 3D whole anatomy, and it used the method of adaptive exploration, in which
testing and feedback are an integral part of learning. In a questionnaire given at the
completion of learning, students expressed a belief that the computer-based system was
superior to the typical classroom materials available to facilitate self-study. It was found
that students used the system to learn whole and sectional neuroanatomy in about the same
number of trials as did participants in closely controlled experimental studies. This
learning was efficient, with 2 h and 20 min taken on average to learn to identify 19 neural
structures in whole and in sectional form. Time was invested by the students across study,
test, and feedback in an adaptive and generally sensible manner. The overall pattern of
results suggests that development of interactive computer graphical systems can lead to
significant benefits for instruction in biomedical disciplines.
Acknowledgments Primary support for this research came from grant R01 LM008323 from the NationalLibrary of Medicine, NIH (PI: J. Pani). Additional support was provided by grant IIS-0650138 from theNational Science Foundation and Defense Intelligence Agency.
Learning with interactive computer graphics
123
Appendix: Questionnaire items not presented earlier in this paper
3. In the programs that illustrated sectional anatomy, please rate the importance, in your opinion, of beingable to select a structure and to use the slider to move continuously through the sections. Use a scale from1 to 5, with 1 being ‘‘not important’’ and 5 being ‘‘very important’’
Mean = 4.1,SD = 0.81
4. You learned whole anatomy first and then sectional anatomy. In the future, how should whole andsectional anatomy instruction be ordered (circle the letter in front of the statement that best characterizesyour opinion)
Frequency
(a) Definitely start with sectional anatomy. Move to whole anatomy afterward 0
(b) Probably should start with sectional anatomy, although it may not matter 0
(c) The order would not matter 0
(d) Probably should start with whole anatomy, although it may not matter 6
(e) Definitely start with whole anatomy. Move to sectional anatomy afterward 17
5. Please rate the difficulty in moving from whole anatomy to sectional anatomy. In other words, once youknow whole anatomy, how challenging is it to learn sectional anatomy with these programs? Please circlethe letter in front of the statement that best characterizes your opinion:
Frequency
(a) Whole and sectional anatomy are independent
Knowing one does not help to learn the other 0
(b) Even if you know whole anatomy, sectional anatomy is still very challenging 8
(c) Even if you know whole anatomy, learning sectional anatomy is challenging 6
(d) If you know whole anatomy, learning sectional anatomy is not too bad 8
(e) If you know whole anatomy, learning sectional anatomy is easy 1
References
Ackerman, M. J. (1995). Accessing the visible human project. D-Lib Magazine [On-line]. URL: http://www.dlib.org/dlib/october95/10ackerman.html.
Ambrose, S. A., Bridges, M. W., DePietro, M., Lovett, M. C., & Norman, M. K. (2010). How learningworks: 7 Research-based principles for smart teaching. San Francisco: Jossey-Bass/Wiley.
Barab, S. (2006). Design-based research: A methodological toolkit for the learning scientist. In R. K. Sawyer(Ed.), The Cambridge handbook of the learning sciences (pp. 153–170). New York: CambridgeUniversity Press.
Bjork, R. A. (1999). Assessing our own competence: Heuristics and illusions. In D. Gopher & A. Koriat(Eds.), Attention and performance XVII: Cognitive regulation of performance. Interaction of theoryand application (pp. 435–459). Cambridge, MA: MIT Press.
Bower, G. H., Clark, M. C., Lesgold, A. M., & Winzenz, D. (1969). Hierarchical retrieval schemes in recallof categorized word lists. Journal of Verbal Learning and Verbal Behavior, 8, 323–343. doi:10.1016/S0022-5371(69)80124-6.
Bransford, J. D., Brown, A. L., & Cocking, R. R. (Eds.). (2000). How people learn. Washington, D.C.:National Academy Press.
Brewer, D. N., Wilson, T. D., Eagleson, R., & De Ribaupierre, S. (2012). Evaluation of neuroanatomicaltraining using a 3D visual reality model. Medicine Meets Virtual Reality, 19, 85–91. doi:10.3233/978-1-61499-022-2-85.
Brown, A. L. (1992). Design experiments: Theoretical and methodological challenges in creating complexinterventions in classroom settings. The Journal of the Learning Sciences, 2, 141–178. doi:10.1207/s15327809jls0202_2.
J. R. Pani et al.
123
Cepeda, N. J., Pashler, H., Vul, E., Wixted, J. T., & Rohrer, D. (2006). Distributed practice in verbal recalltasks: A review and quantitative synthesis. Psychological Bulletin, 380(132), 354. doi:10.1037/0033-2909.132.3.354.
Chariker, J. H., Naaz, F., & Pani, J. R. (2011). Computer-based learning of neuroanatomy: A longitudinalstudy of learning, transfer, and retention. Journal of Educational Psychology, 103(1), 19–31. doi:10.1037/a0021680.
Chariker, J. H., Naaz, F., & Pani, J. R. (2012). Item difficulty in the evaluation of computer-basedinstruction: An example from neuroanatomy. Anatomical Sciences Education, 5, 63–75. doi:10.1002/ase.1260.
Collins, A. (1992). Toward a design science of education research. In E. Scanlon & T. O’Shea (Eds.), Newdirections in educational psychology. Berlin: Springer.
Collins, J. P. (2008). Modern approaches to teaching and learning anatomy. BMJ, 337, 665–667.Cook, D. A. (2005). The research we still are not doing: An agenda for the study of computer-based
learning. Academic Medicine, 80, 541–548. doi:10.1097/00001888-200506000-00005.Cook, D. A., Erwin, P. J., & Triola, M. M. (2010). Computerized virtual patients in health professions
education: A systematic review and meta-analysis. Academic Medicine, 85, 1589–1602.Craik, F. I. M., & Tulving, E. (1975). Depth of processing and the retention of words in episodic memory.
Journal of Experimental Psychology: General, 104(3), 268–294. doi:10.1037/0096-3445.104.3.268.Felten, D. L., & Shetty, A. N. (2010). Netter’s atlas of neuroscience (2nd ed.). Philadelphia: Saunders/
Elsevier.Hariri, S., Rawn, C., Srivastava, S., Youngblood, P., & Ladd, A. (2004). Evaluation of a surgical simulator for
learning clinical anatomy. Medical Education, 38, 896–902. doi:10.1111/j.1365-2929.2004.01897.x.Issenberg, S. B., McGaghie, W. C., Petrusa, E. R., Lee Gordon, D., & Scalese, R. J. (2005). Features and
uses of high-fidelity medical simulations that lead to effective learning: A BEME systematic review.Medical Teacher, 27, 10–28.
Karpicke, J. D., & Roediger, H. L, 3rd. (2008). The critical importance of retrieval for learning. Science,319, 966–968.
Keedy, A. W., Durack, J. C., Sandhu, P., Chen, E. M., O’Sullivan, P. S., & Breiman, R. S. (2011).Comparison of traditional methods with 3D computer models in the instruction of hepatobiliaryanatomy. Anatomical Sciences Education, 4, 84–91. doi:10.1002/ase.212.
Koedinger, K. R., & Corbett, A. (2006). Cognitive tutors: Technology bringing learning sciences to theclassroom. In R. K. Sawyer (Ed.), The Cambridge handbook of the learning sciences (pp. 61–77). NewYork: Cambridge University Press.
Lagemann, E. C. (2002). An elusive science: The troubling history of education research. Chicago: Uni-versity of Chicago Press.
Levinson, A. J., Weaver, B., Garside, S., McGinn, H., & Norman, G. R. (2007). Virtual reality and brainanatomy: A randomized trial of e-learning instructional designs. Medical Education, 41, 495–501.doi:10.1111/j.1365-2929.2006.02694.x.
LONI. (2013). Laboratory of neuro imaging, UCLA. [online.] URL: http://www.loni.ucla.edu/. AccessedJuly 15, 2013.
Mai, J. K., & Paxinos, G. (Eds.). (2012). The human nervous system (3rd ed.). New York: Academic Press/Elsevier.
Mai, J. K., Paxinos, G., & Voss, T. (2008). Atlas of the human brain (3rd ed.). New York: Academic Press/Elsevier.
Mayer, R. E., Hegarty, M., Mayer, S., & Campbell, J. (2005). When static media promote active learning:Annotated illustrations versus narrated animations in multimedia instruction. Journal of ExperimentalPsychology: Applied, 11, 256–265.
Naaz, F., Chariker, J. H., & Pani, J. R. (2014). Computer-based learning: Graphical integration of whole andsectional neuroanatomy improves long-term retention. Cognition and Instruction, 32, 1–21. doi:10.1080/07370008.2013.857672.
Nolte, J., & Angevine, J. B. (2007). The human brain in photographs and diagrams (3rd ed.). Philadelphia:Mosby/Elsevier.
Norman, G. R. (2009). Teaching basic science to optimize transfer. Medical Teacher, 31, 807–811.Palmer, S. E. (2002). Vision science: Photons to phenomenology. Cambridge, MA: MIT Press.Pani, J. R., Chariker, J. H., Dawson, T. E., & Johnson, N. (2005). Acquiring new spatial intuitions: Learning
to reason about rotations. Cognitive Psychology, 51, 285–333. doi:10.1016/j.cogpsych.2005.06.002.Pani, J. R., Chariker, J. H., & Naaz, F. (2013). Computer based learning: Interleaving whole and sectional
representation of neuroanatomy. Anatomical Sciences Education, 6, 11–18. doi:10.1002/ase.1297.Parent, A. (1996). Carpenter’s human neuroanatomy (9th ed.). Baltimore: Williams & Wilkens/Waverly.
Learning with interactive computer graphics
123

Ratiu, P., Hillen, B., Glaser, J., & Jenkins, D. P. (2003). Visible Human 2.0: The next generation. In J.D. Westwood, H. M. Hoffman, G. T. Mogel, R. Phillips, R. A. Robb, & D. Stredney (Eds.), Medicinemeets virtual reality 11—NextMed: Health horizon (pp. 275–281). Amsterdam: IOS Press.
Ruiz, J. G., Cook, D. A., & Levinson, A. J. (2009). Computer animations in medical education: A criticalliterature review. Medical Education, 43, 838–846. doi:10.1111/j.1365-2923.2009.03429.x.
Saadawi, G. M., Tseytin, E., Legowski, E., Jukic, D., Castine, M., & Crowley, R. S. (2008). A naturallanguage intelligent tutoring system for training pathologists: Implementation and evaluation.Advances in Health Sciences Education, 13, 709–722. doi:10.1007/s10459-007-9081-3.
Squire, L., Berg, D., Bloom, F., Du Lac, S., Ghosh, A., & Spitzer, N. (Eds.). (2008). Fundamental neu-roscience (3rd ed.). New York: Academic Press/Elsevier.
Standring, S. (Ed.). (2008). Gray’s anatomy: The anatomical basis of clinical practice (40th ed.). London:Churchill Livingstone/Elsevier.
Surgical Planning Laboratory. (2013). The Publication Database hosted by SPL. [online]. URL: http://www.slicer.org/publications/gallery. Accessed July 15, 2013.
Tam, M. D. B. S., Hart, A. R., Williams, S., Heylings, D., & Leinster, S. (2009). Is learning anatomyfacilitated by computer-aided learning? A review of the literature. Medical Teacher, 31, e393–e396.doi:10.1080/01421590802650092.
Tversky, B., Morrison, J. B., & Betrancourt, M. (2002). Animation: Can it facilitate? International Journalof Human Computer Studies, 47, 247–262. doi:10.1006/ijhc.2002.1017.
Wang, R. F., & Simons, D. J. (1999). Active and passive scene recognition across views. Cognition, 70,191–210.
Woods, N. N., Brooks, L. R., & Norman, G. R. (2007). It all make sense: Biomedical knowledge, causalconnections and memory in the novice diagnostician. Advances in Health Sciences Education: Theoryand Practice, 12, 405–415.
J. R. Pani et al.
123


![Programme Specification: Undergraduate For students ... · (ii) Intercalated Bachelor Degree in Natural Sciences [Neuroscience] Subject knowledge and understanding Successful students](https://img.dokumen.tips/doc/110x75/5facce9ba499da0ba0152d9d/programme-specification-undergraduate-for-students-ii-intercalated-bachelor.jpg)