Embed Size (px)
Citation preview

Learning from Experience:
Evaluation of UNICEF's
Water and Environmental Sanitation Programme in India, 1966-1998
Evaluation Office Division of Evaluation, Policy and Planning
UNICEF Headquarters, New York


Learning from Experience
Evaluation of UNICEF's
Water and Environmental Sanitation Programme in India, 1966-1998
Evaluation Office Division of Evaluation, Policy and Planning
UNICEF Headquarters, New York

Copyright © 2000 Evaluation Publications 3 UN Plaza New York, NY 10017 USA
November 2000
The present evaluation report is a working document. Working documents present new ideas, innovative approaches, case studies, bibliographies and research results, prepared either by UNICEF staff or by consultants or other supported by UNICEF. Their purpose is to facilitate the rapid exchange of knowledge and perspectives among field offices and to stimulate discussions. The contents of this report do not necessarily reflect the policies or the views of UNICEF.
The typescript has not been edited to official publication standards, and UNICEF accepts no responsibility for errors.
The designations employed in this publication and the presentation of the material do not imply on part of the United Nations Children's Fund the expression of any opinion whatsoever concerning the legal status of any country or territory, or of its authorities, or the delimitation of its frontiers.

Learning from Experience:
Evaluation of UNICEF's Water and Environmental Sanitation Programme
In India, 1966-1998
This evaluation was managed by Sawon Hong, Senior Programme Officer, Evaluation, UNICEF Headquarters, with advice from the Technical Steering Committee which included Sandy Cairncross, Jan Teun Visscher and Brendan Doyle.
The evaluation is based on an independent report from the five evaluation team members: Pete Kolsky (team leader; sanitation and public health); Erich Baumann (handpump technology and community management); Ramesh Bhatia (economics, finance and resource management); John Chilton (hydrogeology, drilling and groundwater resources), and Christine van Wijk (social aspects of water and environmental sanitation).
The team’s work was complemented by a Desk Review by A.K. Shiva Kumar and Biswajit Sen and a Beneficiary Assessment by the Socio-Economic Unit Foundation, India.
Paula Whitacre edited this report. The report was published by Lucien Back with support from Rema Venu, Evaluation Office, UNICEF Headquarters.
The Department for International Development (DFID, U.K.), the Netherlands Ministry of Foreign Affairs, the Swedish International Development Co-operation Agency (Sida), UNICEF-India and the Division of Evaluation, Policy and Planning (UNICEF Headquarters) funded this evaluation.


Table of Contents
Acronyms ...................................................................................................................................iii
Executive Summary....................................................................................................................v About This Evaluation ............................................................................................................... v Key Findings............................................................................................................................. vi
Chapter 1: Introduction ..............................................................................................................1 Why Evaluate the UNICEF WES Programme in India? ..........................................................21 Key Issues...............................................................................................................................22 Methodology............................................................................................................................22 Organisation of the Report ......................................................................................................24
Chapter 2: The Context of Water and Sanitation in India......................................................25 Introduction..............................................................................................................................25 Water Supply in India ..............................................................................................................25 Sanitation in India....................................................................................................................27
Chapter 3: Water .......................................................................................................................29 Introduction..............................................................................................................................29 Borehole Drilling ......................................................................................................................29 Borehole Rejuvenation ............................................................................................................32 Groundwater Supply Sustainability .........................................................................................34 Handpump Development and Manufacture.............................................................................38 Piped Water Supply.................................................................................................................40 Management of Rural Water Supply .......................................................................................41
Chapter 4: Environmental Sanitation......................................................................................45 Introduction..............................................................................................................................45 The Search for Solutions.........................................................................................................45 Findings about UNICEF’s Sanitation Efforts............................................................................47 Experimentation and Going to Scale.......................................................................................49
Chapter 5: Social Aspects of WES Services ..........................................................................51 Introduction..............................................................................................................................51 UNICEF’s Recognition of the Need for a User Perspective ....................................................51 Community Participation .........................................................................................................52 Gender Perspective in Water and Sanitation ..........................................................................53 Strategies and Activities for Behavioural Change ...................................................................55

Learning from Experience
ii
Chapter 6: Cost-Effectiveness Issues.....................................................................................59 Introduction..............................................................................................................................59 Comparison between Handpump and Powerpump Schemes.................................................60 Economics for a Balanced Alternative.....................................................................................62
Chapter 7: UNICEF Impact on Rural Women, Men and Children..........................................63 Introduction..............................................................................................................................63 Summary of Impact .................................................................................................................63 Specific Findings .....................................................................................................................64
Chapter 8: UNICEF Organisation and Management ..............................................................69 Introduction..............................................................................................................................69 UNICEF Structure and Function..............................................................................................69 Budgets and Trends ................................................................................................................71 Personnel Issues.....................................................................................................................72 Internal Mechanisms for Understanding Performance ............................................................74
Chapter 9: Partnerships ...........................................................................................................77 Introduction..............................................................................................................................77 Duration and Style...................................................................................................................77 UNICEF Contributions to Partners’ Capacity...........................................................................77 Partners’ Perceptions of UNICEF............................................................................................78 UNICEF Staff Perspectives of Partnerships............................................................................80 Co-operation among Partners .................................................................................................80
Chapter 10: Future Directions for the UNICEF WES Programme in India ...........................81 Introduction..............................................................................................................................81 Partners’ Perceptions of Future Directions..............................................................................81 UNICEF Staff Perceptions.......................................................................................................83 Evaluation Team’s Perceptions...............................................................................................85
Chapter 11: Conclusions..........................................................................................................87 Water Supply...........................................................................................................................87 Environmental Sanitation ........................................................................................................88 Social Aspects of WES Services.............................................................................................89 Cost-Effectiveness ..................................................................................................................90 Impact on Users ......................................................................................................................90 UNICEF Organisation and Management.................................................................................91 Partnerships ............................................................................................................................92 Future Directions .....................................................................................................................92
Chapter 12: Recommendations and Lessons Learned .........................................................93 Recommendations ..................................................................................................................93 Lessons Learned.....................................................................................................................95

Table of Contents
List of Boxes
Box 3.1: Advantages of Promoting Local Manufacture ...........................................................31 Box 3.2: Potential and Pitfalls..................................................................................................33 Box 3.3: Quality and Cost........................................................................................................39 Box. 4.1: Going to Scale..........................................................................................................46 Box 5.1: Making WES Services Gender Sensitive ..................................................................53 Box 5.2: Locally Developed Wall Slogans in Villages in Dungapur .........................................56 Box 8.1: Seeking Common Indicators .....................................................................................75
List of Figures
Figure 6.1: Annual Cost/Capita of Handpumps and Powerpumps ..........................................61 Figure 6.2: Cost/Cubic Metre of Handpumps and Powerpumps .............................................62 Figure 8.1: UNICEF Annual Budgets for the WES Programme in India..................................71 Figure 8.2: Comparison of Budgetary Breakdowns, 1985 and 1995.......................................72 Figure 8.3: WES Staff Composition.........................................................................................73 Figure 10.1: Most Relevant Areas for UNICEF by Partner......................................................82 Figure 10.2: Activities That Should Not Be Done by UNICEF, by Type of Partner and Frequency ...............................................................................................................................83
List of Tables
Table 2.1: Plan Allocations to Water and Sanitation, 1951–1985 in Indian Rupees (Rs.).......27 Table 2.2: Per Capita Public Expenditure, 1975-1992, in Indian Rupees ...............................27 Table 7.1: Understanding and Use of ORS (both home made and by package) ....................66 Table 9.1: Areas Where UNICEF Can Improve: Suggestions from Partners ..........................79 Table 10.1: Relative Relevance of WES Activities by Partners and Staff ...............................84 Table 10.2: Key Mechanisms for WES by Partners and Staff .................................................84

Learning from Experience
ii
List of Annexes
Annex 1: Terms of Reference Annex 2: Tools Used in This Evalution Annex 3: List of Persons Interviewed Annex 4: Desktop Review Annex 5: Providing and Sustaining Rural Water Supplies from Groundwater Annex 6: The Handpump Story Annex 7: Sanitation Annex 8: An Approach toward Integrated Management of Water Supply Annex 9: Information, Education and Communication Annex 10: Case Studies in Community Mobilisation Annex 11: Cost-effectiveness Analysis for Rural Water Supply Annex 12: Results from the Participatory User Assessment Annex 13: UNICEF’s Contributions to Water Supply Programmes in India

iii
Acronyms ARWSP Accelerated Rural Water Supply Programme BIS Bureau of Indian Standards CBHM community-based handpump management CBO community-based organisation CCA Convergent Community Action CDD-WATSAN Control of Diarrhoeal Disease-Water and Sanitation CGWB Central Ground Water Board DANIDA Danish International Development Assistance DFID Department for International Development, U.K. DTH down-the-hole EPP Division of Evaluation, Policy and Planning (UNICEF Headquarters) ESA external support agency GOI Government of India GSDA Groundwater Survey and Development Agency (Maharashtra) HRD human resource development ICO India Country Office, UNICEF IEC information, education and communication IERT Institute of Education and Rural Technology ISI Indian Standards Institution KAP knowledge, attitudes and practises lpcd litres per capita per day M&E monitoring and evaluation MIS management information systems MKII India Mark II (handpump) MPO Master Plan of Operations NDWM National Drinking Water Mission NGO non-governmental organisation O&M operations and maintenance ORS oral rehydration salts ORT oral rehydration therapy PHED Public Health Engineering Department PRED Panchayati Raj Engineering Department (Andhra Pradesh) PROMS programme management information system R&D research and development RCRSP Restructured Centrally Sponsored Rural Sanitation Programme RGNDWM Rajiv Gandhi National Drinking Water Mission RSM rural sanitation mart Rs. rupees SC/ST Scheduled Castes/Scheduled Tribes Sida Swedish International Development Agency SWACH Sanitation, Water and Community Health TAG Technical Advisory Group TMC tractor-mounted compressor TPPF twin-pit pour flush (latrine) TWAD Tamil Nadu Water and Drainage Board UNDP United Nations Development Programme UNICEF United Nations Children’s Fund

Learning from Experience
iv
WATSAN water and sanitation WES water and environmental sanitation WESS Water and Environmental Sanitation Section (within UNICEF India
Country Office) WWF World Wide Fund for Nature WHO World Health Organization WSP Water and Sanitation Programme (UNDP/World Bank)

v
Executive Summary UNICEF considers water and sanitation services crucial to its mandate to promote the survival, protection and development of children. The water and environmental sanitation (WES) programme in India is the longest running and one of the most prominent WES programmes that UNICEF supports in countries around the world. UNICEF support of Government of India (GOI) efforts to improve water supply coverage began in the mid-1960s in response to drought emergencies. Its support of sanitation began in the early 1980s.
Although the amount of UNICEF financial support in relation to total government expenditures is small, UNICEF has played an important and catalytic role in developing, testing and advocating key technological and institutional changes that influenced government policy and investment priorities to expand WES services to the Indian population. These included large-scale government investments in rural water supply and sanitation and the adoption of new drilling techniques, contributions to the implementation of a successful handpump-based rural water supply programme and exponential increases in water supply coverage.
About This Evaluation To learn lessons from this rich experience and to guide future directions, UNICEF commissioned an external evaluation of its WES programme in India. The evaluation was carried out in late 1998 and 1999 and was funded by the Department for International Development (DFID, UK); Netherlands Ministry of Foreign Affairs; Swedish International Development Agency (Sida); UNICEF-India; and the UNICEF Division of Evaluation, Policy and Planning (EPP). EPP has managed this evaluation as part of a multi-country thematic evaluation to draw lessons for global application.
The five-member team, composed of international and Indian experts, conducted extensive interviews at all levels, visited field sites, developed a mail survey for UNICEF partners and staff, and reviewed an extensive number of documents. Each member looked at issues related to his or her area of expertise and also came together to examine such interdisciplinary issues as the social aspects of well drilling and handpump development. Two local experts supported the evaluation with a desktop review of literature on WES in the Indian context. A participatory beneficiary assessment of the impact of WES services, conducted by an Indian institute in Rajasthan and Tamil Nadu, also contributed to the evaluation.
In consultation with UNICEF-India, EPP formed a national advisory group to support the work of the team. The advisory group was chaired by the director of the Rajiv Gandhi National Drinking Water Mission (RGNDWM) and also consisted of representatives from Panchayati Raj, non-governmental organisations (NGOs), donor organisations, other UN agencies and an Indian research institution. Preliminary findings of the evaluation were presented in an April 1999 workshop in Delhi with a wide range of active and interested participants in the water and sanitation sector.
Three factors should be kept in mind in reviewing this evaluation of the UNICEF WES programme. First, given the size of the programme, the 30-year time scale, and the need to learn about the UNICEF WES programme from the ground up, the team may not have fully appreciated the relative importance of some issues as perceived by those with longer experience in India’s WES sector. Second, the long time frame was particularly problematic,

Learning from Experience
vi
given the inevitable loss to “housecleaning” of old files or the fact that information, such as cost data, may never have been collected in the first place. Finally, the GOI and state public health engineering departments (PHEDs) or equivalent organisations implement most WES activities, rather than UNICEF itself. This must be appreciated in evaluating the real scope for UNICEF to influence activities at the site level.
Key Findings
Water Supply Given the longer history and the GOI’s emphasis on water supply coverage (relative to sanitation and hygiene promotion), the evaluation team found that many of UNICEF’s long-term, tangible WES successes particularly lie in rural water supply. However, tasks remain in ensuring continued quality of borehole construction and rehabilitation and handpump manufacture. New challenges lie in management of a mix of supplies through a range of institutional mechanisms at the community level, and in better management of water resources and water quality.
• Water supply coverage has increased greatly over the past 30 years to reach 95 per cent of India’s population. However, the balance between achievements in coverage and quality is delicate. Considering the magnitude and spread of the water supply programme and its supply-driven implementation, some trade-off is inevitable between quantity and the quality requirements of sound construction practise. Recognising the difficulty of providing adequate supervision of such an extensive programme, UNICEF support for the development and adoption of standardised borehole design and implementation procedures has helped to achieve minimum acceptable standards. In quality assurance of handpump manufacture, change in responsibility has resulted in relaxed enforcement of quality assurance procedures, resulting in lower quality handpumps and spares.
• UNICEF successes include contributions in drilling and handpump manufacture, which resulted from a strong commitment to quality over the long haul. The evaluation team considered the choice of technology and approaches to be appropriate and cost-effective, although a lack of documentation meant that the team could not rigorously verify the latter point. Management information systems (MIS) could provide useful data on technical and cost feasibility of various water supply options, but UNICEF has not used MIS for this purpose.
• India’s groundwater resources are endangered, but the most appropriate role for UNICEF in their defence remains to be defined. UNICEF can certainly use its advocacy role, but needs to be realistic about its technical capacity and instead partner with other groups with greater expertise in this complex area.
• Community-based management of water supply can alleviate the massive government expenditures in operations and maintenance (O&M), but much sound pilot work and evaluation remains before this goal can be achieved.
Environmental Sanitation With a history only going back to the 1980s, environmental sanitation has not shown the same results as water supply coverage. Only about 26 per cent of the entire population (urban and rural) have what the GOI considers adequate coverage.

Executive Summary
vii
• UNICEF has taken a leading role in shifting the focus in sanitation from a hardware fix to a “package” of services that combines latrine construction with hygiene and health activities, and from full construction subsidies to partial subsidies based on demand.
• Over the past 15 or 20 years, sanitation has seen a number of promising efforts that have not proven sustainable over the long term, such as the too costly twin-pit pour flush (TPPF) latrine advocated by UNICEF and others in the late 1980s. UNICEF is to be commended for its courage to experiment, and the wisdom to see the need for experimentation. The “success” of some of approaches was seized too quickly both within UNICEF and the GOI, in hopes of devising a strategy that could be scaled up in the same way as rural water supply had been.
Social Aspects of WES Services UNICEF recognised at an early stage that technological improvements have to be fully combined with user participation if systems are to be fully utilised and sustained. However, the switch to a systems approach that enables communities to manage and sustain their own water services, sanitation, and hygiene programmes with no or a minimum of continued backstopping from the government has not yet been made.
• Existing efforts, including information, education and communication (IEC) materials and person-to-person contacts, are generally satisfactory. However, UNICEF could better use its resources to pre-test IEC materials and focus their messages, since local government departments, NGOs and the private sector have the capacity to produce them.
• Although UNICEF recognises gender as an issue in water and sanitation, designing and implementing truly gender-sensitive strategies rarely occurs.
• Other approaches—such as public health communications, community management and Convergent Community Action (CCA)—may be more cost-effective ways to bring about change, but these newer approaches have not been sufficiently tested by UNICEF in WES activities in India.
Cost-Effectiveness Although UNICEF clearly bore costs in mind over the years, cost-effectiveness has not been a systematic component of decision-making. In addition, a lack of documentation makes rigorous cost-effectiveness appraisal impossible.
• Using the data currently available on the costs per capita and per cubic metre of handpumps and powerpumps on boreholes, the team estimated that handpumps should be the more cost-effective on a per capita basis for communities with fewer than 4500 people.
• In addition, more qualitative assessments generally support the contention that fundamental decisions about water supply technology selection appear to have been sound.
Impact on Rural Women, Men and Children To try to separate out the direct impact of UNICEF WES efforts, as opposed to its substantial indirect impact through its work with the GOI, the evaluation team sought the views of rural users. They found some improvements in UNICEF-supported districts. Because UNICEF-

Learning from Experience
viii
pioneered action has invariably been taken up by the GOI, differences in the two types of districts may have been greater initially than over time.
• Villages involved in UNICEF activities reported more water use and improved hygiene than villages that had access only to GOI services.
• Women in UNICEF-supported districts exhibited greater knowledge and use of oral rehydration therapy (ORT) to combat diarrhoeal diseases.
• Some improvements in general health and social conditions were noted by villages involved in UNICEF activities. The improvements include better education, including more girls attending school; better health care facilities; and a less restricted life for women in less conservative communities.
UNICEF Organisation and Management How effective UNICEF can be in its WES activities depends, in large part, on its organisation and management.
• The decentralised structure of UNICEF-India and the commitment of its staff is impressive. However, the mix of staff expertise (particularly given the need to focus on behavioural and institutional issues) and the workloads that staff carry are issues of concern.
• The practise in several field offices to “share” software professionals between sectors (e.g., WES and health) may have resulted in insufficient attention to WES social complexities.
• Although actual expenditures are difficult to track, the WES budget allocated to software (approximately 10 per cent of the total) seems low for an organisation that states that it is shifting more towards social aspects in its policy and strategies.
• Field studies have not been set up to compare approaches or systematically assess impact. Examples of ways to increase the use of these studies include developing a common set of criteria against which to measure results, focusing on more significant comparisons, and focusing more on data analysis and less on data presentation. Greater use of participatory research methods would also yield a fuller picture of local WES behaviours and the effects of UNICEF and GOI programmes on those behaviours.
Partnerships • UNICEF staff, partners and the evaluation team concur that UNICEF’s long-standing
partnership with the GOI over the past 30 years has greatly enhanced its access and credibility. The duration of the commitment, as well as the style of close collaboration, contribute to the effectiveness of the relationship.
• Partners cite institutional support, particularly training and information sharing, as UNICEF’s greatest contribution to their capacity.
Future Directions How should UNICEF focus its future WES activities and through which mechanisms? There was general consensus among partners, staff and the evaluation team that UNICEF should focus on fewer subject areas, rather than spread itself too thinly.

Executive Summary
ix
• All partners surveyed felt that health and hygiene are the most important subject areas for the WES programme. Rural water supply and sanitation were also felt to be important, although this view depended on the background of the partner. Most partners felt that UNICEF should not give first priority to pure latrine construction, water quality control and urban services.
• Staff surveyed felt that hygiene and sanitation are the most relevant areas for future UNICEF activity. They are less inclined than partners to consider rural water supply a high priority and more inclined to consider urban services as a relevant area for UNICEF.
• Partners and staff agree that the two key mechanisms that UNICEF should use to support these areas are development of new approaches and capacity-building through training and other activities. Partners were also more likely to cite direct funding; staff were more likely to cite advocacy. Very few in either group supported direct implementation as the most appropriate UNICEF WES activity.
Recommendations The findings of the evaluation led the team to recommend that UNICEF:
• focus its efforts on areas where it has a comparative advantage, such as sanitation and hygiene promotion. This means that UNICEF should leave the leadership of some important areas, such as water quality monitoring and urban WES services, to other organisations and instead contribute through collaboration and partnerships.
• scale back its work in rural water supply. UNICEF still can play a useful role in rural water supply by concentrating on priorities related to sustained and reliable universal access and use of safe water for consumption and sufficient water for hygiene. UNICEF could develop a strategy for holistic community management of an evolving mix of water supply types and service levels. Another remaining priority area is to assure continued quality in borehole construction and handpump manufacture. However, with GOI capacity greatly enhanced over the past several decades, UNICEF should limit its overall role in rural water supply and free up resources.
• make sanitation and hygiene a higher priority. UNICEF must allocate sufficient resources to back up its stated commitment to increase sanitation and hygiene efforts. It should continue to support more affordable latrine options and other pilot approaches.
• strengthen its partnerships through working with fewer, closer partners. If UNICEF works on fewer issues, it will work with a smaller set of partners. This can potentially build stronger relationships.
• change its staffing and staff development system to ensure that social and institutional aspects of WES are adequately addressed. UNICEF needs to look at whether staff has the appropriate expertise to take on these new challenges and that they are not carrying excessive workloads that can compromise quality.
• address the challenges of decentralisation, which offers new opportunities for community-managed services. The GOI and external support agencies (ESAs) need to develop general WES guidelines and frameworks and agree on common objectives and indicators in approaches that would otherwise be locally specific, and then meet regularly to compare progress and results. UNICEF may be in a prime position to develop and facilitate such a partnership.

Learning from Experience
x
• improve its monitoring and evaluation of projects and alternative strategies. Recommended improvements include tighter specification of evaluation studies; closer partnership with those involved in the studies; and definition of clearer outcomes, objectives and criteria for success when the projects are planned.
• collect and use cost data. Areas where cost data are needed but lacking include borehole drilling and rejuvenation technology, sanitation technology and promotion, and approaches for behavioural change. It may be too late to evaluate past decisions, but the data collected now and in the future can greatly assist the UNICEF WES programme in India and in other countries.
• undertake focused studies to fill some information gaps and use the results to improve its programmes. Subjects for further exploration identified in this evaluation include cost-effectiveness analyses of borehole rejuvenation techniques; evaluation (jointly with the Bureau of Indian Standards) of handpump manufacturers’ qualifications and standards; pre-testing of IEC messages; and cost-effectiveness analyses of CCA, social marketing and community-managed services.
• protect and preserve its long-standing, well-deserved legacy and reputation by ensuring that the quality of its programme remains high. UNICEF has built its reputation through hard work over more than 30 years. As it withdraws from some of its activities, it must do so in ways that encourage others to continue to provide quality WES services to the people. By working closely with partners and developing and testing new approaches, UNICEF can sustain its achievements and maintain its hard-earned legacy and reputation in contributing to WES services.
Lessons Learned In addition to the specific recommendations above, the evaluation team gathered lessons that can be more generally applied to UNICEF programmes.
• Long-term commitment and partnership produce results. UNICEF staff, partners and the evaluation team concur that UNICEF has earned the trust and confidence of senior-level officials and credibility at the national, state and district levels through its 30-year-plus relationship with the GOI. This gives UNICEF a tremendous comparative advantage.
• An external agency such as UNICEF has greater freedom to test new approaches than a government has. This relative freedom suggests an important role for UNICEF in many sectors as an organisation that can develop and test new approaches.
• Going to scale too quickly has adverse repercussions. It is tempting to expand on pilot projects that seem successful. However, in the long run, it is better to move slowly to find out through a systematic approach that is gradually scaled up to learn whether a promising strategy is indeed replicable on a larger scale.
• Institutional arrangements at the district and community levels can help or hinder the implementation of centrally made decisions. A supporting national policy framework is important to move ahead in WES and many other sectors. However, what is taking place on the ground will determine the likelihood that a policy is successfully implemented.
• A gender and poverty perspective must be consciously planned for and its systematic implementation monitored. Even with the best of intentions, incorporating such a perspective in participation, education and training will not happen without ongoing and deliberate attention.

Executive Summary
xi
• Programme staff needs to be realistic about how much work they can take on and still be effective. With many pressing tasks, committed staff often shoulder large workloads and find it difficult to scale back or end an activity. However, staff must recognise that with too much to do, they cannot maintain high-quality work and the overall programme suffers.
• Cost data are needed for more effective analyses. It is difficult to collect and keep track of this cost information. However, the lack of such data impedes cost-effectiveness analysis, which, especially in an era of limited resources and greater accountability, is necessary for decision-making.


1
Résumé directif L'UNICEF considère que les services d'approvisionnement en eau et d'assainissement revêtent une très grande importance pour l'exécution du mandat qui lui a été donné de promouvoir la survie, la protection et le développement de l'enfant. Le programme d'approvisionnement en eau et d'assainissement du milieu (AEAM) exécuté en Inde est le plus ancien des programmes de ce genre et l'un des plus importants parmi ceux que l'UNICEF appuie dans le monde. C'est au milieu des années 60 que le Fonds a commencé à aider le Gouvernement indien à accroître le taux de couverture de l'approvisionnement en eau dans le cadre des mesures prises pour faire face aux situations d'urgence créées par la sécheresse. Le Fonds a commencé à appuyer les activités dans le domaine de l'assainissement au début des années 80.
L'appui financier de l'UNICEF est modeste par rapport au montant total des dépenses que le Gouvernement indien consacre à ce programme, mais le Fonds a joué un rôle de catalyseur important pour la mise au point, l'essai et la promotion des principaux changements technologiques et institutionnels qui ont amené le gouvernement à infléchir ses priorités en matière de politiques et d'investissements dans le sens d’un développement des services d'AEAM fournis à la population indienne. C'est ainsi qu'ont vu le jour les nouvelles orientations suivantes : un gros effort d'investissement du gouvernement dans l'approvisionnement en eau et l'assainissement dans les zones rurales et l’adoption de nouvelles techniques de forage; une contribution à l'exécution d'un programme concluant d'approvisionnement en eau des zones rurales reposant sur les pompes à main; et la croissance exponentielle du taux de couverture de l'approvisionnement en eau.
À propos de la présente évaluation Pour tirer les enseignements de cette riche expérience et en dégager de nouvelles orientations pour l'avenir, l'UNICEF a fait établir une évaluation externe de son programme d'AEAM en Inde. Cette évaluation a été réalisée à la fin de 1998 et en 1999 et a été financée par le Département du développement international (DFID) du Royaume-Uni, le Ministère néerlandais des affaires étrangères, l’Agence suédoise de développement international (SIDA), UNICEF-Inde et la Division de l'évaluation, des politiques et de la planification (EPP) de l'UNICEF. L'EPP a géré cette évaluation dans le cadre d'une évaluation thématique multinationale dont les résultats pourraient être mis à profit dans le reste du monde.
Composée de cinq spécialistes internationaux et indiens, l’équipe a interrogé un grand nombre de personnes à tous les niveaux, effectué des tournées d’inspection sur le terrain, interrogé par correspondance les partenaires et les agents de l’UNICEF, et analysé un très grand nombre de documents. Ses membres ont examiné séparément les questions relevant de leurs domaines de compétence respectifs et ont également procédé à un examen collectif de questions interdisciplinaires telles que les aspects sociaux du forage de puits et de la mise au point de pompes à main. Deux spécialistes locaux ont contribué à l’évaluation en procédant à une étude de la documentation relative à l’AEAM dans le contexte indien. L’évaluation a également profité

Learning from Experience
2
d’une étude de l’impact des services d’AEAM qu’un institut indien a réalisée avec la participation des bénéficiaires au Rajasthan et au Tamil Nadu.
En consultation avec UNICEF-Inde, l’EPP a créé un groupe consultatif national chargé d’épauler l’équipe dans son travail. Présidé par le directeur de la Mission nationale d’approvisionnement en eau potable Rajiv Gandhi (MNAEPRG), ce groupe comprenait également des représentants du Panchayati Raj, d’organisations non gouvernementales (ONG), d’organismes donateurs, d’organismes des Nations Unies et d’un Institut de recherche indien. Les conclusions préliminaires de l’évaluation ont été présentées lors d’un atelier qui s’est tenu à New Delhi en avril 1999 et a rassemblé un large éventail de participants s’occupant du secteur de l’approvisionnement en eau et de l’assainissement.
Pour analyser cette évaluation du programme d’AEAM de l’UNICEF, il est bon de garder trois éléments à l’esprit. En premier lieu, étant donné l’ampleur d’un programme étalé sur 30 ans et le fait qu’elle avait tout à apprendre sur ce programme, l’équipe peut ne pas avoir pris pleinement conscience de l’importance relative de certaines questions, à la différence des personnes disposant d’une expérience plus longue du secteur de l’AEAM en Inde. Ensuite, la longueur de la période considérée a posé des problèmes particuliers, qui tenaient soit aux pertes inévitables dues au “nettoyage” des vieux dossiers, soit au fait que certaines informations, telles que les données relatives aux coûts, pouvaient ne jamais avoir été rassemblées. Enfin, l’exécution des activités d’AEAM relève pour l’essentiel non pas de l’UNICEF, mais des départements de génie sanitaire (ou organisations équivalentes) du Gouvernement indien et des États. Il faut en être bien conscient lorsqu’on évalue l’influence que l’UNICEF peut réellement exercer sur le terrain.
Principales conclusions
Approvisionnement en eau Étant donné que l’approvisionnement en eau a précédé la promotion de l’assainissement et de l’hygiène dans les préoccupations du Gouvernement indien et que celui-ci a mis de bonne heure l’accent sur le premier, l’équipe d’évaluation a pu constater que nombre de réalisations tangibles et durables de l’UNICEF en matière d’AEAM concernent l’approvisionnement en eau des zones rurales. Toutefois, il reste à garantir en permanence la qualité de la construction et de la remise en état des puits et de la fabrication des pompes à main. De nouvelles tâches sont imposées par le panachage des approvisionnements mettant en œuvre différents mécanismes institutionnels au niveau communautaire et la nécessité d’améliorer la gestion des ressources en eau et la qualité de l’eau.
• Le taux de couverture de l’approvisionnement en eau a beaucoup augmenté en 30 ans, pour atteindre 95 % de la population indienne. Toutefois, l’équilibre entre les progrès réalisés dans le domaine de l’approvisionnement et la qualité de celui-ci pose des problèmes. Étant donné l’envergure et la diffusion du programme d’approvisionnement en eau et le fait qu’il est exécuté à l’initiative de l’offre, il est inévitable que l’amélioration

Chapter 1: Introduction
3
quantitative des approvisionnements se fasse dans une certaine mesure aux dépens de l’amélioration de la qualité des pratiques de construction. Sachant qu’il est difficile de contrôler comme il se doit un programme de cette ampleur, l’UNICEF a appuyé la conception et l’adoption d’un modèle de puits et de techniques de mise en œuvre normalisés, ce qui a permis d’aboutir à des normes minimales acceptables. S’agissant de l’assurance de la qualité de la fabrication des pompes à main, les changements de direction ont abouti à une application moins stricte des procédures d’assurance de la qualité, ce qui s’est traduit par une diminution de la qualité des pompes et des pièces de rechange.
• Parmi les succès de l’UNICEF figurent les contributions dans les domaines du forage et de la fabrication des pompes à main, qui ont été rendues possibles par une volonté nettement affirmée d’améliorer la qualité dans la longue durée. L’équipe d’évaluation a jugé appropriées et rentables les technologies et approches retenues, encore que l’absence de documents ne lui ait pas permis de faire un travail rigoureux de vérification sur ce point. Les systèmes d’information de gestion (SIG) pourraient renseigner utilement sur la faisabilité technique et financière des différentes options en matière d’approvisionnement en eau, mais l’UNICEF n’a pas utilisé les SIG à cette fin.
• Les ressources indiennes en eaux souterraines sont menacées, mais le rôle le plus approprié que l’UNICEF pourrait jouer pour les protéger n’a pas encore été défini. L’UNICEF peut assurément jouer son rôle de porte-parole, mais il doit demeurer réaliste en ce qui concerne ses capacités techniques et s’employer plutôt à s’associer avec d’autres entités possédant des compétences mieux affirmées dans ce domaine complexe.
• La gestion communautaire de l’approvisionnement en eau peut alléger les énormes dépenses publiques de fonctionnement et d’entretien, mais cet objectif ne pourra être réalisé que moyennant l’exécution et l’évaluation de nombreuses activités pilotes judicieusement choisies.
Assainissement du milieu L’assainissement du milieu n’étant soutenu par l’UNICEF que depuis les années 80, les résultats enregistrés dans ce domaine ne peuvent être les mêmes que pour le taux de couverture de l’approvisionnement en eau. Vingt-six pour cent seulement de la population indienne (urbaine et rurale) bénéficient de ce que le Gouvernement indien considère comme une couverture suffisante.
• L’UNICEF a joué un rôle de premier plan pour réduire la place des méthodes d’assainissement tenant du rafistolage au profit d’un ensemble de services qui combine la construction des latrines et des activités intéressant l’hygiène et la santé, et pour abandonner les subventions à 100 % à la construction au profit de subventions partielles en fonction de la demande.
• Au cours des 15 ou 20 dernières années, l’assainissement a donné lieu à des activités prometteuses qu’il n’a pas été possible de pérenniser. C’est le cas des latrines à double fosse à chasse d’eau manuelle, recommandées par l’UNICEF et d’autres à la fin des années 80. Il convient de rendre hommage à l’UNICEF qui a eu le courage de procéder à des essais et a été assez perspicace pour en comprendre la nécessité. Certaines approches ont été jugées “concluantes” trop hâtivement tant au sein de l’UNICEF que

Learning from Experience
4
du Gouvernement indien, qui espéraient formuler une stratégie de mise à l’échelle comme il avait été fait pour l’approvisionnement en eau des zones rurales.
Aspects sociaux des services d’AEAM L’UNICEF a pris conscience de très bonne heure que l’utilisation et la durabilité des systèmes ne peuvent être assurées que si les progrès techniques sont étroitement associés à la participation des bénéficiaires. outefois, on n’est pas encore passé à une approche systémique qui permette aux communautés de gérer et d’entretenir leurs propres programmes d’approvisionnement en eau, d’assainissement et d’hygiène avec un appui minimal ou nul du gouvernement.
• Les activités existantes, et en particulier les matériels d’information, d’éducation et de communication (IEC) et les contacts interpersonnels, donnent généralement satisfaction. Toutefois, l’UNICEF pourrait faire un meilleur usage de ses ressources pour procéder à des essais préliminaires des matériels d’IEC et en focaliser les messages, puisque les services de l’administration locale, les ONG et le secteur privé ont les capacités voulues pour les produire.
• L’UNICEF a bien conscience que la problématique hommes-femmes n’est pas absente du secteur de l’eau et de l’assainissement, mais il est rare de voir formuler et appliquer des stratégies véritablement attentives aux besoins des femmes.
• D’autres approches — telles que les communications de santé publique, la gestion communautaire et l’action communautaire de convergence (ACC) — peuvent être des moyens plus rentables de faciliter le changement, mais ces approches nouvelles n’ont pas encore été suffisamment testées par l’UNICEF dans le cadre des activités d’AEAM menées en Inde.
Rapport coût-efficacité L’UNICEF a manifestement pris les coûts en considération pendant toutes ces années, mais le rapport coût-efficacité n’a pas fait systématiquement partie intégrante du processus décisionnel. Qui plus est, la pénurie de documents ne permet pas de procéder à une évaluation rigoureuse du rapport coût-efficacité.
• À l’aide des données actuellement disponibles sur les coûts de revient, par habitant et par mètre cube, des pompes à main et des pompes électriques rapportés au nombre de puits, l’équipe a calculé que les pompes à main devraient être les plus rentables par personne pour les communautés de moins de 4 500 habitants.
• En outre, les bilans plus qualitatifs paraissent dans l’ensemble confirmer la thèse selon laquelle les décisions fondamentales concernant le choix des technologies d’approvisionnement en eau semblent avoir été judicieuses.
Conséquences sur les femmes, les hommes et les enfants des zones rurales S’efforçant de distinguer les effets directs des activités d’AEAM de l’UNICEF de leurs effets indirects par le biais de la collaboration avec le Gouvernement indien, l’équipe d’évaluation a

Chapter 1: Introduction
5
sollicité les vues des utilisateurs ruraux. Elle a pu constater certaines améliorations dans les districts bénéficiant d’un appui de l’UNICEF. Dans la mesure où les activités dont le Fonds avait posé les premiers jalons ont invariablement été reprises par le Gouvernement indien, les différences entre les deux types de districts pourraient avoir été plus marquées au départ que par la suite.
• Les villages associés aux activités de l’UNICEF ont signalé une utilisation de l’eau plus importante et une meilleure hygiène que les villages qui n’avaient accès qu’aux services fournis par le Gouvernement indien.
• Les femmes vivant dans les districts bénéficiant d’un appui de l’UNICEF connaissaient mieux et utilisaient davantage la thérapeutique de réhydratation orale (TRO) pour lutter contre les maladies diarrhéiques.
• Certaines améliorations de la situation sanitaire et sociale générale ont été constatées par les villages associés aux activités de l’UNICEF. Il s’agit en particulier d’une amélioration de l’instruction, et notamment d’une augmentation du nombre des filles scolarisées; d’une amélioration des établissements de santé; et d’une diminution des contraintes imposées aux femmes dans les communautés moins conservatrices.
Organisation et gestion de l’UNICEF L’efficacité des activités d’AEAM de l’UNICEF dépend largement de son organisation et de sa gestion.
• La structure décentralisée d’UNICEF-Inde et le dévouement de son personnel sont remarquables. Néanmoins, le dosage des compétences du personnel (compte tenu en particulier de la nécessité de se concentrer sur les questions comportementales et institutionnelles) et le volume de travail de ce personnel sont des questions préoccupantes.
• La pratique suivie par plusieurs bureaux extérieurs consistant à “partager” les spécialistes de la programmation entre les secteurs (par exemple, l’AEAM et la santé) pourrait avoir conduit à ne pas accorder suffisamment d’attention aux subtilités sociales de l’AEAM.
• Le montant effectif des dépenses est difficile à préciser, mais l’enveloppe budgétaire AEAM allouée à la programmation (environ 10 % du total) semble mince pour une organisation qui affirme vouloir donner plus d’importance aux aspects sociaux dans le cadre de ses politiques et stratégies.
• Les études sur le terrain n’ont pas été conçues pour comparer des approches ou évaluer systématiquement un impact. On pourrait avoir davantage recours à ces études pour définir un ensemble de critères d’évaluation des résultats, se concentrer sur des comparaisons plus significatives et accorder une place plus grande à l’analyse des données qu’à leur présentation. En utilisant davantage les méthodes de recherche participatives, on pourrait dégager un tableau plus complet des comportements locaux en matière d’AEAM et des incidences des programmes de l’UNICEF et du Gouvernement indien sur ces comportements.

Learning from Experience
6
Partenariats • Le personnel de l’UNICEF, les partenaires et l’équipe d’évaluation s’accordent à reconnaître
que la collaboration que l’UNICEF apporte depuis 30 ans au GI a renforcé l’accessibilité et la crédibilité du Fonds. La durée de l’engagement et le style de collaboration étroite contribuent à l’efficacité de cette relation.
• Les partenaires considèrent que l’appui institutionnel, en particulier la formation et la mise en commun de l’information, représente la plus importante contribution de l’UNICEF au renforcement de leurs capacités.
Orientations pour l’avenir Sur quoi l’UNICEF devrait-il faire porter ses activités futures en matière d’AEAM et par le biais de quels mécanismes ? Les partenaires, le personnel et l’équipe d’évaluation ont été unanimes à considérer que l’UNICEF devrait se concentrer sur un plus petit nombre de domaines d’activité au lieu de trop disperser ses efforts.
• Tous les partenaires interrogés estimaient que la santé et l’hygiène sont les deux domaines les plus importants pour le programme d’AEAM. L’approvisionnement en eau des zones rurales et l’assainissement ont également été jugés importants, encore que cette opinion ait été fonction de l’expérience des partenaires. La plupart des partenaires ont considéré que l’UNICEF ne devrait pas accorder la priorité à la construction de latrines, au contrôle de la qualité de l’eau et aux services urbains.
• Les membres du personnel interrogés étaient d’avis que l’hygiène et l’assainissement étaient les domaines les plus appropriés pour les activités futures de l’UNICEF. Ils sont moins enclins que les partenaires à considérer que l’approvisionnement en eau des zones rurales revêt un rang de priorité élevée et estiment généralement que les services urbains sont un domaine d’activité approprié pour l’UNICEF.
• Les partenaires et le personnel sont convenus que les deux mécanismes essentiels que l’UNICEF devrait utiliser à l’appui de ces domaines d’activité sont la formulation de nouvelles approches et le renforcement des capacités par le biais de la formation et d’autres activités. Les partenaires ajoutaient plus volontiers le financement direct et le personnel les activités de plaidoyer. Les membres des deux groupes pour lesquels l’exécution directe était l’activité d’AEAM de l’UNICEF la plus appropriée étaient très peu nombreux.
Recommandations Les conclusions de l’évaluation ont amené l’équipe à recommander à l’UNICEF :
• de concentrer ses efforts sur les domaines dans lesquels il dispose d’un avantage comparatif, tels que l’assainissement et la promotion de l’hygiène. C’est dire que le Fonds devrait abandonner la direction de certains domaines importants, tels que le contrôle de la

Chapter 1: Introduction
7
qualité de l’eau et les services d’AEAM dans les zones urbaines, à d’autres organisations et apporter sa contribution par le biais de la collaboration et de partenariats.
• de réduire ses activités dans le domaine de l’approvisionnement en eau des zones rurales. L’UNICEF peut toujours jouer un rôle utile dans ce domaine en concentrant son intervention sur des priorités liées à l’accès universel à l’eau salubre et son utilisation durables et fiables aux fins de la consommation et de l’hygiène. L’UNICEF pourrait formuler une stratégie en vue de la gestion communautaire intégrée d’un ensemble évolutif de types d’approvisionnement en eau et de niveaux de services. Un autre domaine prioritaire touche à la nécessité de maintenir la qualité de la construction des puits et de la fabrication des pompes à main. Toutefois, les capacités du Gouvernement indien ayant été considérablement renforcées ces dernières décennies, l’UNICEF devrait limiter son rôle global dans le domaine de l’approvisionnement en eau des zones rurales, ce qui lui permettrait de libérer des ressources.
• d’accorder un rang de priorité plus élevé à l’assainissement et à l’hygiène. L’UNICEF doit dégager des ressources suffisantes à l’appui de son intention déclarée de renforcer les activités dans les domaines de l’assainissement et de l’hygiène. Il devrait continuer de soutenir la construction de latrines plus économiques et d’autres approches pilotes.
• de consolider ses partenariats en collaborant plus étroitement avec un nombre plus limité de partenaires. S’il décide de s’occuper d’un plus petit nombre de questions, l’UNICEF sera amené à travailler avec un plus petit nombre de partenaires. Il pourra ainsi nouer des relations plus solides avec eux.
• de modifier son système de dotation en personnel et de perfectionnement du personnel de façon à pouvoir compter sur un personnel pouvant s’occuper des aspects sociaux et institutionnels de l’AEAM. L’UNICEF doit se demander si son personnel possède les compétences voulues pour exécuter ces tâches nouvelles et s’assurer que son volume de travail n’est pas de nature à en compromettre la qualité.
• de relever les défis de la décentralisation, qui ouvre de nouvelles perspectives aux services gérés par les collectivités. Le Gouvernement indien et les organismes d’appui extérieur doivent élaborer des directives et cadres d’AEAM et s’entendre sur des objectifs et indicateurs communs dans le cadre d’approches qui sont à tous autres égards spécifiques aux situations locales, puis se rencontrer régulièrement pour comparer les progrès accomplis et les résultats obtenus. L’UNICEF est sans doute particulièrement bien placé pour mettre sur pied et faciliter un tel partenariat.
• d’améliorer le suivi et l’évaluation des projets et des nouvelles stratégies. Les améliorations suivantes sont recommandées : définition plus précise de la portée à donner aux études d’évaluation; collaboration plus étroite avec les entités participant aux études; et définition plus précise des résultats, objectifs et critères de succès au stade de la planification des projets.
• de réunir et d’utiliser les données relatives aux coûts. Les données relatives aux coûts sont nécessaires mais non disponibles dans les domaines suivants : techniques de forage et d’entretien des puits; techniques d’assainissement et promotion de ce dernier; et approches retenues pour modifier les comportements. Il est sans doute trop tard pour évaluer les décisions passées, mais les données rassemblées aujourd’hui et à l’avenir peuvent être d’un grand secours pour le programme d’AEAM de l’UNICEF réalisé en Inde et dans d’autres pays.
• de réaliser des études ciblées pour combler les lacunes au niveau de l’information et d’utiliser les résultats pour améliorer ses programmes. Il ressort de la présente

Learning from Experience
8
évaluation qu’il convient d’approfondir la réflexion dans les domaines suivants : analyses du rapport coût-efficacité des techniques d’entretien des puits; évaluation (à mener en coopération avec le Bureau indien de la normalisation) de la qualification et des normes des fabricants de pompes à main; pré-tests des messages d’IEC; et analyses du rapport coût-efficacité des ACC, de la commercialisation parallèle et des services gérés par les collectivités.
• de défendre et de préserver ses acquis et la réputation bien méritée qu’il a depuis longtemps en veillant à ce que ses programmes demeurent d’excellente qualité. C’est le sérieux de son travail depuis plus de 30 ans qui a valu à l’UNICEF cette réputation. À mesure qu’il met un terme à certaines de ses activités, il doit le faire selon des modalités qui encouragent d’autres entités à continuer de fournir à la population des services d’AEAM de bonne qualité. En œuvrant en collaboration étroite avec ses partenaires et en élaborant et essayant des approches nouvelles, l’UNICEF peut conserver ses acquis et continuer de justifier sa réputation en fournissant un appui aux services d’AEAM.
Leçons à retenir Indépendamment des recommandations spécifiques ci-dessus, l’équipe d’évaluation a dégagé des enseignements qui s’appliquent d’une façon plus générale aux programmes de l’UNICEF.
• Les engagements à long terme et le travail d’équipe donnent des résultats. Le personnel de l’UNICEF, les partenaires et l’équipe d’évaluation sont unanimes à considérer qu’une collaboration de plus de 30 ans avec le GI ont valu à l’UNICEF la confiance des hauts fonctionnaires et lui permettent de jouir d’une bonne crédibilité à l’échelle de la nation, des États et des districts. L’UNICEF jouit donc d’un énorme avantage comparatif.
• Un organisme extérieur comme l’UNICEF a les mains plus libres qu’un gouvernement pour tester des approches nouvelles. Cette liberté relative autorise à penser que l’UNICEF peut jouer dans maints secteurs un rôle important en tant qu’organisation pouvant formuler et tester des approches nouvelles.
• Une mise à l’échelle trop rapide a des conséquences néfastes. Il est tentant de mettre à l’échelle des projets pilotes dont les résultats semblent concluants. Toutefois, dans une perspective à long terme, il vaut mieux avancer à pas comptés afin de se convaincre, en mettant en œuvre une approche systématique de mise à l’échelle progressive, qu’une stratégie prometteuse se prête bel et bien à une reproduction sur une grande échelle.
• Les arrangements institutionnels pris aux niveaux des districts et des communautés peuvent faciliter ou entraver l’application des décisions des instances centrales. Il est important de disposer d’un plan directeur pour avancer dans le secteur de l’AEAM, parmi bien d’autres. Cela dit, la possibilité de voir une politique mise correctement en œuvre dépend des arrangements pris sur le terrain.
• Il importe de planifier avec rigueur une perspective tenant compte de la problématique hommes-femmes et de la pauvreté et d’en suivre systématiquement la mise en œuvre. Même avec les meilleures intentions du monde, l’incorporation d’une telle perspective dans la participation, l’éducation et la formation ne se fera qu’en lui consacrant une attention constante et systématique.
• Le personnel chargé des programmes doit faire preuve de réalisme en ce qui concerne le volume de travail dont il peut se charger sans sacrifier l’efficacité. Avec

Chapter 1: Introduction
9
de nombreuses tâches urgentes à remplir, le personnel, confronté à un très fort volume de travail, éprouve souvent des difficultés à réduire une activité ou y mettre un terme. Cela étant, il doit bien comprendre qu’en menant trop de tâches de front, il ne peut pas garantir la qualité du travail accompli, et le programme d’ensemble peut s’en ressentir.
• Les données relatives aux coûts sont nécessaires à la réalisation d’analyses plus utiles. Il est difficile de rassembler et de suivre ces informations relatives aux coûts, mais leur absence entrave la réalisation d’analyses du rapport coût-efficacité, lesquelles, surtout à une époque de ressources limitées et de plus grande responsabilité, sont indispensables à la prise de décisions.

Learning from Experience
10
Resumen Ejecutivo El UNICEF considera los servicios de agua y saneamiento cruciales en su mandato para promover la supervivencia, la protección y el desarrollo del niño. El programa de agua y saneamiento ambiental en la India no sólo es el que más tiempo lleva en aplicación sino también el programa de agua y saneamiento ambiental más importante de los que el UNICEF apoya en todo el mundo. El respaldo del UNICEF a las actividades del Gobierno de la India, dirigidas a mejorar la cobertura del abastecimiento de agua, comenzó a mediados del decenio de 1960 como respuesta a las situaciones de emergencia ocasionadas por la sequía. El UNICEF comenzó a apoyar las actividades en materia de saneamiento a principios del decenio de 1980.
Aunque el monto del apoyo financiero del UNICEF en relación con el total del gasto público es pequeño, el UNICEF ha desempeñado una función importante y catalizadora a la hora de crear, probar y promover cambios tecnológicos e institucionales fundamentales, que han influido en las políticas y prioridades de inversión del gobierno dirigidas a ampliar los servicios de agua y saneamiento entre la población india. Estas consistieron en inversiones públicas a gran escala para el abastecimiento de agua y saneamiento en el ámbito rural, en la adopción de nuevas técnicas de perforación, en contribuciones para la ejecución de un acertado programa rural de abastecimiento de agua basado en bombas manuales y en el logro de aumentos exponenciales en la cobertura del abastecimiento de agua.
Sobre esta evaluación
A fin de extraer lecciones de esta rica experiencia y obtener orientaciones para futuras actividades, el UNICEF encargó una evaluación externa del programa de agua y saneamiento ambiental en la India. La evaluación fue llevada a cabo a finales de 1988 y 1999, y recibió financiación del Departamento de Desarrollo Internacional (Reino Unido), del Ministerio de Relaciones Exteriores de los Países Bajos, del Organismo de Desarrollo Internacional de Suecia, de la oficina del UNICEF en la India y de la División de Planificación, Políticas y Evaluación del UNICEF. La División ha gestionado esta evaluación como parte de una evaluación temática multinacional dirigida a extraer lecciones que puedan ser de aplicación mundial.
El equipo de cinco miembros, compuesto por expertos tanto indios como internacionales, realizó entrevistas exhaustivas a todos los niveles, llevó a cabo visitas sobre el terreno, elaboró una encuesta por correo dirigida a aliados y personal del UNICEF y revisó un sinfín de documentos. Cada miembro se ocupó de asuntos relacionados con su esfera de conocimiento especializado, pero también se unieron para examinar cuestiones interdisciplinarias, como los aspectos sociales de la perforación de pozos y el desarrollo de bombas manuales. Dos expertos locales apoyaron la evaluación mediante un examen informático de la bibliografía

Chapter 1: Introduction
11
sobre agua y saneamiento ambiental existente en el ámbito de la India. También contribuyó a esta evaluación otra evaluación que contó con la participación de los beneficiarios sobre las repercusiones de los servicios de agua y saneamiento ambiental, realizada en Rajastán y Tamil Nadu por un instituto de la India.
En consultas con la oficina del UNICEF en la India, la División de Planificación, Políticas y Evaluación constituyó un grupo asesor nacional para apoyar las tareas del equipo. El grupo asesor estuvo presidido por el director de la Misión Nacional sobre el Agua Potable Rajiv Gandhi e incluyó también representantes de Panchayati Raj, organizaciones no gubernamentales y una institución investigadora de la India. Los resultados preliminares de la evaluación fueron presentados en un curso práctico celebrado en Nueva Delhi en abril de 1999, al que asistieron numerosos participantes que desarrollan tareas relacionadas y están interesados en el sector del agua y el saneamiento.
Al examinar el programa sobre agua y saneamiento ambiental del UNICEF deberán tenerse en cuenta tres factores. En primer lugar, considerando la amplitud del programa, el hecho de que se haya aplicado durante un período de 30 años y la necesidad de estudiar el programa sobre agua y saneamiento ambiental del UNICEF de abajo a arriba, puede que el equipo no haya calibrado plenamente la importancia relativa de algunas cuestiones, al menos con la misma perspectiva de quienes tienen más dilatada experiencia en el sector del agua y el saneamiento ambiental en la India. En segundo lugar, fue especialmente problemático el amplio marco temporal, debido a la inevitable pérdida causada por la “limpieza periódica” de viejos archivos o al hecho de que, desde el principio, puede que cierta información no fuera recopilada, como los datos relativos a los costos. Por último, es el Gobierno de la India y los departamentos de ingeniería aplicada a la salud pública en el ámbito estatal u organizaciones equivalentes quienes ejecutan la mayoría de las actividades de agua y saneamiento ambiental, y no el UNICEF propiamente dicho. Ello debe tenerse en cuenta a la hora de evaluar hasta qué punto el UNICEF puede haber influido de verdad en las actividades sobre el terreno.
Resultados fundamentales
Abastecimiento de agua
Teniendo en cuenta que el abastecimiento de agua tiene un historial más prolongado (en relación con el saneamiento y la promoción de la higiene) y que el Gobierno de la India siempre hizo hincapié en la cobertura del abastecimiento de agua frente al saneamiento, el equipo de evaluación descubrió que muchos de los éxitos en materia de agua y saneamiento ambiental a largo plazo más notables del UNICEF se referían sobre todo al abastecimiento de agua en el

Learning from Experience
12
ámbito rural. No obstante, queda todavía mucho por hacer si se quiere garantizar una calidad sostenida en la construcción y rehabilitación de pozos perforados y en la fabricación de bombas manuales. La gestión de una combinación de suministros mediante una serie de mecanismos institucionales en el ámbito comunitario, así como una mejor gestión de los recursos hídricos y de la calidad del agua, siguen planteando nuevas problemáticas.
• La población a la que llega el abastecimiento de agua ha aumentado de forma muy importante durante los últimos 30 años, hasta situarse en el 95% de la población de la India. No obstante, el equilibrio entre los logros conseguidos en cuanto a cobertura y los logrados en calidad es precario. Considerando la magnitud y la difusión del programa de abastecimiento de agua así como el hecho de que su ejecución haya estado centrada en el abastecimiento, es inevitable que exista un cierto compromiso entre la cantidad y los requisitos de calidad que exigen las prácticas adecuadas de construcción. Reconociendo la dificultad que supone proporcionar una supervisión eficaz a un programa tan amplio, el apoyo del UNICEF para el desarrollo y la adopción de procedimientos estandarizados de diseño y ejecución de pozos perforados ha ayudado a lograr un mínimo de calidad aceptable. En cuanto a la garantía de calidad en la fabricación de bombas manuales, el cambio de responsabilidad ha hecho que el cumplimiento de los procedimientos de garantía de calidad se haya relajado, en perjuicio de la calidad de las bombas manuales y los repuestos.
• Entre los éxitos del UNICEF se cuentan sus contribuciones en materia de perforación y en la fabricación de bombas manuales, que se debieron a su inquebrantable compromiso con la calidad a largo plazo. El equipo de evaluación consideró que la elección de la tecnología y los enfoques era apropiada y eficaz en cuanto a los costos, aunque una cierta falta de documentación impidió al equipo verificar con rigor este último punto. Los sistemas de información de gestión pueden proporcionar datos útiles sobre viabilidad técnica y financiera de diversas opciones de abastecimiento de agua, pero el UNICEF no los ha utilizado para este fin.
• Los recursos hídricos subterráneos de la India están en peligro, pero la función más adecuada que puede desempeñar el UNICEF en su defensa sigue sin estar definida. El UNICEF puede, desde luego, desempeñar su función de promotor de derechos, pero debe ser realista en cuanto a su capacidad técnica y, a cambio, asociarse con otros grupos que cuenten con mayores conocimientos técnicos en esta compleja esfera.
• La gestión del abastecimiento de agua de base comunitaria puede suponer un alivio para los enormes gastos públicos de funcionamiento y mantenimiento, pero deben hacerse todavía muchos trabajos y evaluaciones de carácter experimental antes de que ese objetivo sea una realidad.

Chapter 1: Introduction
13
Saneamiento ambiental
Con un historial que se remonta tan sólo al decenio de 1980, el saneamiento ambiental no ha arrojado los mismos resultados que la cobertura en el abastecimiento de agua. Sólo alrededor del 26% de la población total (urbana y rural) tienen lo que el Gobierno de la India considera una cobertura adecuada.
• El UNICEF ha adoptado una función rectora al abandonar un criterio meramente técnico con relación al saneamiento y adoptar un “conjunto” de servicios que combina la construcción de letrinas con actividades en materia de higiene y salud, y descartar los subsidios plenos para la construcción a cambio de subsidios parciales basados en la demanda.
• Durante los últimos 15 o 20 años, en el ámbito del saneamiento se han realizado diversas actividades que han demostrado no ser sostenibles a largo plazo, como la letrina de sifón provista de pozos gemelos, demasiada costosa, que el UNICEF y otros promovían a finales del decenio de 1980. El UNICEF es digno de elogio por haber tenido el valor de experimentar y por la visión de futuro que ha demostrado al considerar que la experimentación era necesaria Tanto dentro del UNICEF como en el Gobierno de la India se dio por seguro demasiado rápidamente el “éxito” de algunos enfoques, porque se albergaba la esperanza de encontrar una estrategia que pudiera aplicarse gradualmente en otros planos, de la misma forma que se había hecho con respecto al abastecimiento de agua.
Aspectos sociales de los servicios de agua y saneamiento
Desde el primer momento, el UNICEF se dio cuenta de que las mejoras tecnológicas debían combinarse plenamente con la participación del usuario si se quería que los sistemas fueran plenamente utilizables y sostenibles. No obstante, todavía no se ha logrado modificar el enfoque adoptando otro distinto, basado en los sistemas, que permita a las comunidades gestionar y sostener sus propios programas de servicios de agua, saneamiento e higiene sin contar con el apoyo, mínimo o continuo, del gobierno.
• Las actividades que se llevan a cabo en la actualidad, inclusive los materiales de información, educación y comunicación y los contactos interpersonales, son en general satisfactorias. No obstante, el UNICEF podría utilizar mejor sus recursos para experimentar previamente sus materiales de información, educación y comunicación y afinar sus mensajes, puesto que los departamentos gubernamentales locales, las organizaciones no gubernamentales y el sector privado tienen capacidad para producirlos.
Learning from Experience
14
• Aunque el UNICEF reconoce que el género es un factor en el abastecimiento de agua y saneamiento, rara vez se diseñan y ejecutan estrategias genuinamente sensibles con respecto del género.
• Otros enfoques —como las comunicaciones en materia de salud pública, la gestión comunitaria y la Acción Comunitaria Convergente— pueden ser medios más eficaces de conseguir el cambio, pero el UNICEF no ha experimentado suficientemente estos nuevos enfoques en las actividades en materia de agua y saneamiento ambiental en la India.
Eficacia en función de los costos
Aunque el UNICEF, a lo largo de los años, ha tenido presentes los costos, la eficacia en función de los costos no ha sido un factor que se haya tenido en cuenta de forma sistemática en la adopción de decisiones. Además, la falta de documentación hace que la evaluación rigurosa de la eficacia en función de los costos sea imposible.
• Utilizando los datos de los que se dispone en la actividad sobre los costos per cápita y por metro cúbico de las bombas manuales y las bombas eléctricas en las perforaciones, el equipo consideró que, en comunidades de menos de 4.500 habitantes, las bombas manuales deberían ser las más eficaces en función de los costos, atendiendo a un criterio per cápita.
• Además, las evaluaciones más cualificadas generalmente apoyan la opinión de que las decisiones fundamentales en cuanto a la selección de la tecnología de abastecimiento de agua parecen haber sido las más adecuadas.

Chapter 1: Introduction
15
Repercusiones sobre las mujeres, los hombres y los niños del medio rural
A fin de tratar de separar la repercusión directa de las actividades del UNICEF en materia de agua y saneamiento, frente a la repercusión indirecta sustantiva lograda a través de su colaboración con el Gobierno de la India, el equipo de evaluación pidió la opinión de los usuarios rurales. Estos consideraron que había habido algunas mejoras en los distritos apoyados por el UNICEF. Como las actividades pioneras del UNICEF fueron invariablemente adoptadas por el Gobierno de la India, las diferencias entre los dos tipos de distritos puede que hayan sido mayores al principio que con el paso del tiempo.
• Los pueblos que participaron en actividades del UNICEF informaron que había un mayor uso de agua y que la higiene era mejor que en los pueblos que disponían tan sólo de servicios del Gobierno de la India.
• Las mujeres de los distritos que contaron con el apoyo del UNICEF demostraron tener un mayor conocimiento de las técnicas de rehidratación oral para combatir las enfermedades diarreicas.
• En pueblos que participaron en actividades del UNICEF se observaron algunas mejoras en la salud general y en las condiciones sociales. Las mejoras consistieron en una mejor educación, con más niñas escolarizadas; mejores instalaciones de atención de la salud y una menor restricción de las condiciones de vida de la mujer en comunidades menos conservadoras.
Organización y gestión del UNICEF
La eficacia del UNICEF en sus actividades en materia de agua y saneamiento depende, en gran parte, de su organización y gestión.
• La estructura descentralizada de la oficina del UNICEF en la India y la dedicación de su personal son impresionantes. No obstante, la mezcla de personal con diferente grado de cualificación (especialmente teniendo en cuenta la necesidad de concentrarse en cuestiones de comportamiento e institucionales) y la carga de trabajo que recae sobre el personal son asuntos que preocupan.

Learning from Experience
16
• La práctica, en varias oficinas sobre el terreno, de “compartir” profesionales de programación informática entre los sectores (por ejemplo, en agua y saneamiento ambiental) puede haberse traducido en una insuficiente atención a las complejidades sociales que entraña el agua y el saneamiento ambiental.
• Si bien los gastos reales son difíciles de rastrear, el presupuesto para agua y saneamiento ambiental asignado a programas informáticos (aproximadamente el 10% del total) parece escaso para una organización que asevera que está modificando su enfoque hacia los aspectos sociales de sus políticas y estrategias.
• No se han elaborado los estudios sobre el terreno que permitan comparar enfoques o evaluar las repercusiones de forma sistemática. Ejemplos de cómo se podría aumentar la utilización de esos estudios podrían incluir la formulación de un conjunto de criterios comunes con los que medir los resultados, centrándose en las comparaciones más significativas, y ciñéndose más a los análisis de datos y menos a la presentación de los mismos. Un mayor uso de métodos de investigación participativos podría también arrojar una visión más completa de las conductas locales en materia de agua y saneamiento ambiental y de los efectos que los programas del UNICEF y del Gobierno de la India tienen en esas conductas.
Asociaciones
• El personal, los aliados y el equipo de evaluación del UNICEF están de acuerdo en que la dilatada asociación del UNICEF con el Gobierno de la India durante los últimos treinta años ha mejorado sobremanera su acceso y credibilidad. La duración del compromiso, así como la modalidad de dicha colaboración, contribuyen a la eficacia de la relación.
• Los aliados consideran el apoyo institucional, especialmente la capacitación y la puesta en común de la información, la mayor contribución del UNICEF a su propia capacidad.
Direcciones futuras
¿Cómo debería el UNICEF centrar sus actividades futuras en materia de agua y saneamiento ambiental y por qué mecanismos? Hubo un acuerdo generalizado entre los aliados, el personal y el equipo de evaluación de que el UNICEF debería centrarse en menos esferas temáticas, en lugar de abordar demasiados ámbitos de manera poco profunda.

Chapter 1: Introduction
17
• Todos los aliados consultados consideraron que la salud y la higiene son las esferas temáticas más importantes para el programa en materia de agua y saneamiento ambiental. El abastecimiento de agua y el saneamiento rurales se consideraron también importantes, si bien esta opinión dependió de los antecedentes del aliado en cuestión. La mayoría de los aliados consideraron que el UNICEF no debería conceder prioridad absoluta a la mera construcción de letrinas, al control de la calidad del agua y a los servicios urbanos.
• El personal consultado fue de la opinión de que la higiene y el saneamiento son dos esferas que corresponden mejor a las actividades del UNICEF con miras al futuro. Están menos inclinados que los aliados a considerar el abastecimiento de agua rural una prioridad absoluta y tienden más a pensar que los servicios urbanos son una esfera más propia del UNICEF.
• Los aliados y el personal coincidieron en que los dos mecanismos fundamentales que el UNICEF debería utilizar para apoyar estas esferas son el desarrollo de nuevos enfoques y la creación de capacidad mediante la capacitación y otras actividades. Los aliados se referían a la financiación directa; el personal citaba la promoción de derechos con mayor frecuencia. Muy pocos, en ninguno de los dos grupos, apoyaban la ejecución directa como la actividad más apropiada del UNICEF en materia de agua y saneamiento ambiental.
Recomendaciones
Los resultados de la evaluación aconsejaron al equipo recomendar que el UNICEF:
• centre sus actividades en esferas en las que tiene una ventaja comparativa, como el saneamiento y la promoción de la higiene. Ello supone que el UNICEF debería dejar la dirección de algunas esferas importantes, como la supervisión de la calidad del agua y los servicios urbanos en materia de agua y saneamiento ambiental, a otras organizaciones y, a cambio, contribuir mediante acuerdos de colaboración y asociación.
• reduzca sus tareas con relación al abastecimiento de agua en la esfera rural. El UNICEF todavía puede desempeñar una función útil en relación con el abastecimiento de agua en el plano rural, concentrándose en prioridades relacionadas con el acceso universal sostenido y fiable, el uso de agua segura para el consumo y la disponibilidad de suficiente agua para la higiene. El UNICEF podría desarrollar una estrategia para la gestión comunitaria integrada de un conjunto cambiante de tipos de abastecimiento de agua y niveles de servicios. Otra esfera de prioridad que queda es garantizar una calidad continua en la construcción de pozos y la fabricación de bombas manuales. No obstante, habiendo

Learning from Experience
18
aumentado notablemente la capacidad del Gobierno de la India durante los últimos decenios, el UNICEF debería limitar su función global en relación con el abastecimiento de agua en el ámbito rural y liberar recursos.
• convierta en prioridades el saneamiento y la higiene. El UNICEF debe asignar recursos suficientes para apoyar su compromiso declarado de aumentar sus actividades en materia de saneamiento e higiene. Debería continuar apoyando opciones de letrinas más asequibles y otros enfoques de carácter experimental.
• refuerce sus acuerdos de asociación trabajando con menos aliados, si bien más estrechamente. Si el UNICEF trabaja en menos cuestiones, lo hará con un conjunto menor de aliados. Esto podrá quizás crear relaciones más fuertes.
• modifique su sistema de dotación de personal y de desarrollo del personal para asegurarse de que se abordan adecuadamente los aspectos sociales e institucionales relacionados con el agua y saneamiento ambiental. El UNICEF debe considerar si el personal tiene los conocimientos técnicos apropiados para hacer frente a estos nuevos desafíos y si dicho personal no debe soportar una carga de trabajo excesiva, lo que puede poner en peligro la calidad.
• haga frente a los problemas derivados de la descentralización, que ofrece nuevas oportunidades de servicios gestionados en el ámbito comunitario. El Gobierno de la India y los organismos de apoyo externo deben desarrollar directrices y marcos generales en materia de agua y saneamiento ambiental y acordar objetivos e indicadores comunes en enfoques que de otra forma serían específicos en el ámbito local, y después reunirse con carácter sistemático para comparar los progresos y los resultados. El UNICEF puede gozar de una situación ventajosa para desarrollar y facilitar dicha asociación.
• mejore la supervisión y evaluación de proyectos y estrategias alternativas. Entre las mejoras recomendadas están una especificación más clara de los estudios de evaluación; una mayor asociación con quienes participan en los estudios, y la formulación, cuando se planifican los proyectos, de unos resultados, objetivos y criterios para medir el éxito más claros.
• recopile y utilice datos sobre costos. Algunas de las esferas en las que se necesitan datos sobre costos, pero estos no existen, son la tecnología de perforación y mejora de pozos, la tecnología y la promoción del saneamiento y enfoques que favorezcan el cambio conductivo. Puede que sea demasiado tarde para evaluar decisiones del pasado, pero los datos recopilados ahora y en el futuro pueden ayudar enormemente al programa sobre agua y saneamiento ambiental del UNICEF en la India y en otros países.
• emprenda estudios centrados que permitan llenar algunos vacíos informativos y utilizar sus resultados para mejorar los programas. Según esta evaluación, entre los

Chapter 1: Introduction
19
temas en los que se debe profundizar el estudio están los análisis de los costos de las técnicas de mejora de pozos; la evaluación (junto con la Oficina de Normativas de Calidad de la India) de la cualificación y normativas de calidad de los fabricantes de bombas manuales; la experimentación previa de los mensajes sobre información, educación y comunicación y los análisis de eficacia en función de los costos de la acción comunitaria convergente, la comercialización social y los servicios gestionados en el ámbito de la comunidad.
• proteger y preservar su legado y su reputación, tan dilatados y merecidos, asegurando que la calidad de su programa sigue siendo excelente. El UNICEF se ha ganado su reputación trabajando de firme a lo largo de más de treinta años. Al retirarse de algunas de sus actividades, debe hacerlo de forma que aliente a otros a seguir prestando a la población servicios en la esfera del agua y el saneamiento ambiental. Trabajando estrechamente con aliados y desarrollando y experimentando nuevos enfoques, el UNICEF puede mantener sus logros y conservar su legado y reputación, ganados con esfuerzo, en relación con la prestación de servicios de agua y saneamiento ambiental.
Lecciones aprendidas
Además de las recomendaciones específicas mencionadas supra, el equipo de evaluación hizo acopio de lecciones que pueden aplicarse de forma más general a los programas del UNICEF.
• El compromiso y la asociación de largo plazo dan resultados. El personal del UNICEF, los aliados y el equipo de evaluación estuvieron de acuerdo en que el UNICEF se ha ganado la confianza y la fe de los funcionarios superiores y la credibilidad en los planos nacional, estatal y de distrito en sus relaciones con el Gobierno de la India a lo largo de más de treinta años. Esto otorga al UNICEF una tremenda ventaja comparativa.
• Un organismo externo como el UNICEF tiene mayor libertad que un gobierno para experimentar nuevos enfoques. Esta libertad relativa parece indicar que el UNICEF tiene una función importante en muchos sectores, en su calidad de organización que puede preparar y experimentar nuevos enfoques.
• Aplicar los programas a gran escala excesivamente rápido tiene repercusiones adversas. Ampliar sobre la base de proyectos que parecen exitosos es tentador. Sin embargo, a la larga, es mejor moverse despacio para averiguar, mediante un enfoque sistemático que se vaya ampliando de forma gradual, si una estrategia prometedora puede realmente reproducirse a una escala mayor.
• Los acuerdos institucionales a escala de distrito y comunitario pueden ayudar u obstaculizar la aplicación de decisiones adoptadas de forma centralizada. Para

Learning from Experience
20
avanzar la esfera del agua y el saneamiento ambiental, y en otros muchos sectores, es importante disponer de un marco político nacional favorable. No obstante, lo que sucede sobre el terreno determinará el grado de probabilidad de que una política se aplique de forma exitosa.
• Es necesario planear de forma consciente una perspectiva de género y un enfoque relativo a la pobreza, y supervisar su ejecución sistemática. Incluso con las mejores intenciones, la incorporación de una perspectiva semejante en la participación, la educación y la capacitación no tendrá lugar si no se presta una atención deliberada y continua.
• El personal del programa debe ser realista sobre la cantidad de trabajo que puede asumir sin perder eficacia. Con muchas tareas apremiantes por delante, el personal dedicado a menudo debe arrimar el hombro para sacar adelante grandes cantidades de trabajo y luego resultarle difícil reducir o terminar una actividad. No obstante, el personal debe asumir que si tiene mucho trabajo por hacer, es muy posible que no consiga seguir sacándolo adelante con un buen nivel de calidad, lo que repercutirá en la totalidad del programa.
• Se necesidad datos sobre costos para realizar análisis más eficaces. Es difícil recopilar y rastrear esta información sobre costos. Sin embargo, la ausencia de dichos datos dificulta al análisis sobre la eficacia en función de los costos, necesario para la elaboración de políticas, especialmente en una época en la que los recursos son limitados y se exige una mayor rendición de cuentas.

Chapter 1: Introduction
21
Chapter 1: Introduction
Why Evaluate the UNICEF WES Programme in India? UNICEF considers water and environmental sanitation (WES) crucial to its mandate to promote the survival, protection and development of children. Over the years, UNICEF has made water and sanitation one of its largest programme investments. UNICEF support to water and sanitation started in India in the mid-1960s in response to drought emergencies. Since then, UNICEF has assisted many governments to move towards universal access to safe water supply and sanitation services as a basic right, in line with the goals of the World Summit for Children. It has also promoted the behavioural changes essential to realising the full benefits from such services, especially for those most in need.
India has UNICEF’s longest-running and one of its most prominent WES programmes. Drinking water supply and more recently environmental sanitation have remained high on the political agenda of successive Indian governments, in spite of the changes in political affiliation at the helm. Although UNICEF funding represents only about 1 per cent of the government’s total WES budget, UNICEF impact has been considerable. For example, UNICEF played a key role in the development of the India Mark II handpump, which became widely adopted throughout India and exported to other countries.
In commissioning this evaluation (see Annex 1: Terms of Reference), UNICEF wanted to glean lessons from its India WES programme experience that would benefit both the India country programme and UNICEF global work in the sector. This evaluation of the UNICEF WES programme in India is part of a multi-country thematic evaluation to draw lessons for global application. It was carried out in late 1998 and 1999 and was funded by the Department for International Development (DFID, UK); Netherlands Ministry of Foreign Affairs; Swedish International Development Cooperation Agency (Sida); UNICEF-India; and the UNICEF Division of Evaluation, Policy and Planning (EPP).
The evaluation had the following specific objectives:
• examine UNICEF’s role over time, identifying lessons learned from each phase of the national WES programme;
• assess the current status of the programme: its strengths, weaknesses, achievements, failures and constraints;
• identify potential areas for future UNICEF contributions in India; and
• share lessons from India with other countries.

Learning from Experience
22
Key Issues In order to meet the objectives of the evaluation, the Terms of Reference specified that the evaluation team examine the following key issues:
• UNICEF’s influence on policy, planning, programme and priorities for the national water and sanitation sector: Have UNICEF’s advocacy, pilot projects, and research and development (R&D) efforts affected the GOI’s WES programmes over the years at the national and state levels? If so, how much? How did UNICEF's credibility develop in spite of its small financial contribution? What would happen if UNICEF/India withdraws its support from the water and sanitation sector?
• Operational linkages with other sectoral programmes: How much and how effectively have linkages been built between WES programmes and other sectoral programmes, especially health, education, environment, and nutrition?
• Technology choice and its appropriateness and introduction strategy: Was the choice of technology (e.g., handpumps, drilling rigs, hydrofracturing and tractor-mounted compressors) appropriate in the local context? Have innovations improved the quality of services as perceived by the users? Was the standardisation of technology, including rigs and handpumps, appropriate in the Indian context?
• Cost-effectiveness: How cost effective have programme interventions been?
• Cost recovery and cost sharing: Who pays for WES services? On what basis are those decisions made? To what degree do the cost recovery and sharing structures work?
• Monitoring systems: How have WES programmes been monitored? How has UNICEF’s input been monitored? Has monitoring and evaluation (M&E) information been used in a timely fashion and for what purposes?
• Stakeholder analysis: Who have been key players in India’s WES programme over the years? What have been the roles of the GOI, state governments, donors, UNICEF, private sector, international and local NGOs, and communities?
• Funding patterns: How has the size and patterns of UNICEF’s financial input changed over the years? To what extent has UNICEF’s work attracted new funding?
• Impact: What has been the impact, including benefits, of UNICEF’s assistance? Who has benefited from the programmes, how, and by how much?
• Sustainability: Are national WES programmes sustainable in the areas of technology, systems, management capacity and ownership given the ever-increasing demand for both quantity and quality of services? Are programmes financially and environmentally sustainable? Was national capacity built?
• UNICEF management: How has the number and background of UNICEF staff changed over time? How well has staffing reflected the changing requirements of strategy and policy (e.g., shift from hardware to software, and towards decentralisation)?
• UNICEF’s future contribution: In what direction does UNICEF need to evolve in its policy and strategies in assisting the India WES programme? What should be new directions for future contributions, if any, of UNICEF in the sector?
Methodology To meet the objectives of the evaluation, six complementary methodologies were used:

Chapter 1: Introduction
23
1. Key informant interviews to gain more in-depth knowledge. The team interviewed current and retired government and UNICEF staff, representatives of NGOs and private entrepreneurs.
2. Field visits to observe current UNICEF work and discuss past and present activities with UNICEF staff, partners and users. The evaluation team collectively visited sites in eight states in three weeks.
3. Participatory user assessment to understand how rural users viewed the benefits and shortcomings of WES services. The assessment took place in Rajasthan and Tamil Nadu, which have a long and extensive history with UNICEF programmes and represent very different physical and socio-economic conditions. The Socio-Economic Unit Foundation, an independent institute in Kerala, conducted the assessment by comparing villages that had participated in UNICEF programmes with those that had only received GOI services. Village women, men and school children took active roles in the assessment.
4. Mail survey to learn the views of UNICEF partners and staff who could not be interviewed in person because of time constraints. To ensure greater objectivity, the Rajiv Gandhi National Drinking Water Mission (RGNDWM) distributed the questionnaires, and replies were anonymous. Seventy-four of 160 people responded to the survey.
5. Desktop review, conducted by two national consultants and an assistant, to gather extensive background information on WES programmes in the Indian context. They reviewed more than 400 UNICEF and non-UNICEF documents.
6. Document review, conducted by each member of the team to learn about issues relevant to his or her area of expertise. For example, the team reviewed a large number of UNICEF field studies; information, education and communication (IEC) materials; and UNICEF internal documents and monitoring reports.
The five-member evaluation team consisted of experts in the areas of handpump technology and community management; economics, finance and resource management; hydrogeology, drilling and groundwater resources; sanitation and public health; and social aspects of WES. Team members were carefully selected for their understanding of specific subject areas and their independence from the UNICEF-India programme.
To support the evaluation effort, UNICEF formed a national advisory group. The group consisted of representatives from the RGNDWM (who also chaired the group), Panchayati Raj, donor organisations, other UN agencies, NGOs and an Indian research organisation. The group contributed its expertise at all stages of the evaluation: from reviewing the Terms of Reference to providing valuable feedback on the preliminary and final results. Just as important, by being involved at these critical stages, the group increased its stake in the findings and how they might be used to improve WES programmes.
In addition to input from the national advisory group, a dissemination workshop was held in Delhi in April 1999 to present preliminary findings with a wide range of active and interested participants from the Indian water and sanitation sector.
Three factors should be kept in mind in reviewing this evaluation of the UNICEF WES programme. First, given the size of the programme, the 30-year time scale, and the need to learn about the UNICEF WES programme from the ground up, the team may not have fully appreciated the relative importance of some issues as perceived by those with longer experience in India’s WES sector. Second, the long time frame was particularly problematic, given the inevitable loss to “housecleaning” of old files or the fact that information, such as cost

Learning from Experience
24
data, may never have been collected in the first place. Finally, the GOI and the state PHEDs or equivalent organisations implement most WES activities, rather than UNICEF itself. This must be appreciated in evaluating the real scope for UNICEF to influence activities at the site level.
Organisation of the Report This report, Learning from Experience: Evaluation of the Water and Environmental Sanitation Programme in India, 1966-1998, summarises the team’s findings and is supplemented by comments from the national advisory group and participants at the April 1999 workshop. The report is divided into three parts:
1. Background. Chapters 1 and 2 establish the context of the evaluation and of UNICEF work in the sector. Annexes 1 through 3 provide more information about the evaluation itself, including the tools developed and used by the team, and Annex 4 contains the report from the desktop review.
2. Findings. Chapter 3 describes and evaluates rural water supply activities that UNICEF has undertaken in support of the GOI WES programme; Chapter 4, sanitation; and Chapter 5, hygiene promotion and other social aspects of WES services. These three chapters examine the content of UNICEF work over the past 30 years. Readers seeking more detailed information can also refer to Annexes 5 and 6 for water-related issues, Annex 7 for sanitation, and Annex 8 through 10 for IEC and other social aspects.
The evaluation then examines the effectiveness and impact of these UNICEF WES activities. Chapter 6 looks at cost-effectiveness by comparing handpumps and powerpumps. Chapter 7 highlights an assessment of UNICEF impact on rural women, men and children. Chapter 8 addresses UNICEF organisation and management, such as personnel and budget issues, while Chapter 9 discusses partnerships. Annexes 11 through 13 provide greater detail on the cost-effectiveness analysis, the impact assessment and UNICEF expenditures.
3. Conclusions and Next Steps. The views of partners and staff about future UNICEF WES directions are reflected in Chapter 10. Chapters 11 and 12 summarise the main findings of the evaluation team, both in looking at the past and, perhaps most importantly, in looking at how UNICEF may best continue and enhance its tradition of outstanding service to the people of India through its contributions to the WES sector.

25
Chapter 2: The Context of Water and Sanitation in India
Introduction UNICEF involvement in the WES sector can best be understood in relation to three key points in Indian development over the last 50 years:
India’s tremendous achievements and the enormous potential for material improvement these achievements demonstrate. Both per capita income and life expectancy have doubled since Independence in 1947.
The enormity of the task ahead in achieving a decent life for all. Of greatest relevance to this evaluation, one in six people in the rural areas still does not have what the GOI considers an acceptable water supply (“full coverage”), and combined rural and urban sanitation coverage only reaches 26 per cent of the population. Diarrhoea and other water and sanitation-related diseases still account for nearly 400,000 child deaths in India annually.
Large differences in life expectancy, literacy and other measures of well-being between the advantaged and disadvantaged (geographically and socially). District literacy rates range from more than 90 per cent to 10 per cent. Mortality among Scheduled Castes is one-third higher than among the rest of the population.
These points are critical to understanding the past, present and future of UNICEF activity in WES. They factor into progress made in water supply and in sanitation, as summarised below. Annex 4 provides more detailed background, while other annexes (particularly those on water supply, handpump development and sanitation) round out the picture.
Water Supply in India
India’s Progress in Water Supply Water supply in India has improved remarkably over the last 30 years. Latest estimates suggest that, by 1997, 87 per cent of the country’s rural population and 85 per cent of its urban population had “full coverage” of safe drinking water, defined, in non-hilly and non-desert areas, as access to at least 40 litres per capita per day (lpcd), 250 users per spot source, within 1.6 kilometers or less. Nearly 95 per cent of the rural population had at least one village-level source of water. Expansion was particularly rapid during the Water Decade of the 1980s, when coverage increased from 31 per cent in 1980 to 78 per cent in 1991. While interpretation of these statistics is complicated by the variation in norms and definitions over the period, progress has been evident to all observers.
Much remains to be done. A gap remains between access to protected sources (approximately 95 per cent) and actual use of water from protected sources, estimated to be closer to 70 per cent. In addition, serious problems of water quality, contamination and declining water tables confront the country. Problems of water depletion are particularly serious in Gujarat, Rajasthan, Uttar Pradesh, Andhra Pradesh and Madhya Pradesh.

Learning from Experience
26
Evolution of the National Water Sector Three distinct phases mark the evolution of India’s drinking water policy since Independence.
1947–1980: Despite formal recognition of the importance of universal access to water and sanitation, the government provided little financial support until the 1966–1968 drought period in several states. Responsibility for water and sanitation shifted to the Ministry of Works and Housing during the Fourth Five Year Plan (1969–1974), and a centrally funded scheme for accelerated rural water supply was developed in 1972–1977. This programme, which continued into the Fifth Five Year Plan, gave 100 per cent assistance to States and Union Territories to extend water supply to acute problem villages, with preference to Scheduled Castes/Scheduled Tribes (SC/ST).
1980–1986: Serious planning for an expanded attack on the problem of water and sanitation took place, triggered partly by the increased global attention to the role of water and sanitation in health.
1986–onwards: Since 1985, the RGNDWM (formerly NDWM) has co-ordinated increased activity. The directness of this support and relative freedom from bureaucratic constraint are frequently cited as reasons behind the RGNDWM’s success in improving coverage and eradicating guinea worm.
Table 2.1 reflects the steadily rising financial allocations and commitment from the GOI to the sector from 1951 through 1986. Table 2.2 shows the near doubling in per capita expenditure since the advent of the RGNDWM. While these statistics refer to both water and sanitation, the overwhelming majority of funds have been allocated to water supply.

Chapter 2: Water and Sanitation in the Indian Context
27
Table 2.1: Plan Allocations to Water and Sanitation, 1951–1985 in Indian Rupees (Rs.)
Development Plan Total Budget Water Supply and Sanitation Sector
Years Rs. in billions Rs. in billions % of total
First 1951-56 23.5 0.4 1.78
Second 1956-61 48.0 0.9 1.89
Third 1961-66 85.7 1.0 1.23
Annual 1966-69 66.2 1.0 1.55
Fourth 1969-74 157.8 4.6 2.91
Fifth 1974-79 394.6 10.9 2.77
Annual 1979-80 121.7 3.8 3.18
Sixth 1980-85 975.0 39.0 4.01
Source: GOI Plan Documents
Table 2.2: Per Capita Public Expenditure, 1975-1992, in Indian Rupees
Public health Education Water and Sanitation
Years Rs. In billions Rs. In billions Rs. In Billions
1975-76 12.77 23.0 2.38
1980-81 21.94 46.1 5.60
1985-86 48.75 93.3 12.51
1991-92 58.99 207.9 20.35
Source: CMIE
Sanitation in India
India’s Progress in Sanitation Issues Unlike the longer and steadier evolution of drinking water supply strategy, development of sanitation policy occurred in fits and starts, covering a wide set of issues over a few years. As elsewhere in the world, progress in sanitation coverage has been much slower than that of water supply, particularly in rural areas, reflecting the variation in demand. Until recently, the emphasis in India was on subsidised latrine construction, but overall sanitation conditions did not greatly improve. In recent years, there has been a move toward a more complex package of services, including efforts to generate demand, link sanitation and health issues, and develop latrines that can be built locally and at a low cost. There has also been far greater involvement

Learning from Experience
28
of the NGO sector, rather than relying on the government agencies responsible for drinking water supply.
Evolution of the National Sanitation Sector Five phases mark the evolution of India’s sanitation sector since the early 1980s.
Early 1980s: In 1983, The World Bank formed a Technical Advisory Group (TAG), with its members and funds also drawn from the GOI, UNICEF and UNDP. The TAG supported a variety of sanitation studies and demonstration projects and finally recommended a single specific design of the twin-pit pour flush (TPPF) latrine to replace the single-pit service latrine in urban areas.
1985-1986: Sanitation became a distinct priority when the GOI launched the Centrally Sponsored Rural Sanitation Programme (CRSP) in 1985. Through this programme, it allocated funds and prepared guidelines for a sanitation programme exclusively focused on rural areas, with a target of 1 million fully subsidised latrines for SC/ST households under a wider rural housing programme. In 1986, the TAG completed its work and recommended adoption of locally built TPPF latrines as the most cost-effective option for both rural and urban areas. The GOI and the RCRSP accepted this recommendation as the standardised design to be adopted across the country.
1986–1990: In 1986, the GOI approached UNICEF for funding support and to become full-fledged partners in the RCRSP. UNICEF launched a series of area-based micro projects in rural sanitation in 1986–1987, as an instrument of advocacy and to directly learn from the field. In 1987, the rural sanitation programme was formally included in the state sector under the minimum needs programme, and the emphasis was on increasing coverage through full subsidies. Once the results of the pilot area-based projects began to emerge, informal dialogues continued between UNICEF and GOI about alternative approaches.
1990–1995: In 1990-1991, the government revised its RCRSP guidelines. Its target of 25 per cent latrine coverage of all rural households was found to be unrealistic as government data showed coverage at only 3 per cent, although the 1991 census revealed 9.5 per cent toilet coverage in rural households. A 1992 national-level seminar played a critical role in influencing GOI policy away from full reliance on the TPPF design and toward an approach, that combined more hardware options with education and health linkages. The budgetary allocation for sanitation continued to be small in relation to water: India’s Eighth Five Year Plan allocated Rs. 6,743 million (approximately US $400 million) for sanitation compared to Rs. 108,700 million (approximately US $6,400 million) for drinking water supply. Nonetheless, sanitation found its own identity in the state governments’ plans, policy announcements and political governance agendas.
1995 and onward: Between 1995 and 1997, the GOI had no Five Year Plan, but an annual planning exercise and government budgetary allocations were made in sanitation programmes. In 1996, the GOI issued a guideline on a range of sanitary toilet designs, ranging in cost from US$10 to $100. The guideline also gives information on sanitation upgrading, encouraging households to start with a simple, cheaper toilet design that can be upgraded later. No major policy changes either in the RCRSP approach or guidelines have been made since then, although involvement by NGOs in the RCRSP has increased as the government has recognised its role in community mobilisation and in promoting demand for sanitation services.

29
Chapter 3: Water
Introduction UNICEF first became involved in India’s water sector when it provided drilling rigs to bore through hardrock to reach groundwater during the 1966 drought that affected Bihar and several other states. Since then, the UNICEF-India WES programme has worked with governments at all levels and with the private sector on drilling, borehole rejuvenation, groundwater sustainability issues, handpump and powerpump schemes, and operations and maintenance.
This chapter provides a brief summary of UNICEF activity and the findings of the evaluation team. Annex 5 includes more detail about borehole drilling and rejuvenation and about other groundwater issues, and Annex 6 discusses handpump development.
Ignoring the complexities of detailed geology, India can be divided into three principal hydrogeological zones for the purposes of this evaluation:
• hardrock areas of peninsula India, which make up some 82 per cent of the land area;
• alluvial tracts of the Indo-Gangetic plain; and
• coarse, bouldery sediments of the Himalayan mountain front.
These three distinctive geological settings determine the occurrence and movement of groundwater, and thus the approach to the design and construction of boreholes and method of drilling used. Most land in India lies within the hardrock areas. Where groundwater levels are shallow, hardrock aquifers can be exploited by dug wells, which are widely used as traditional sources in India. However, water tables are often beyond the depth of simple dug wells, and groundwater is often drawn from restricted fractured zones in the deeper, unweathered rock, attainable only by drilling. Further, supplies that are safer bacteriologically and more reliable during drought conditions are provided by drilled boreholes. All three of the geological environments listed above lend themselves to drilling for groundwater, although the borehole design and drilling method vary significantly. Thus, drilled boreholes with handpumps were identified by UNICEF as the best technical and economical option for rural water supplies from a very early stage.
Borehole Drilling
UNICEF Drilling Activities Because drilling is required in so much of the country, the UNICEF WES programme devoted much of its efforts in its first 20 years to the introduction of new down-the-hole (DTH) drilling technology, adaptation of this technology to local conditions, and the promotion and support of local manufacture of suitable rigs. UNICEF accompanied its massive investment in rigs with efforts to train drillers in state organisations, observe rig performance and provide geophysical equipment to increase the chances of encountering water.

Learning from Experience
30
UNICEF interest in bringing DTH drilling to India dates from the 1966-1967 Bihar drought. In response to a direct request from the GOI, nine DTH rigs were airfreighted from the United Kingdom and deployed immediately to stricken villages. Inspired by this success, UNICEF offered to increase its support to maintain the impetus, and 149 rigs had been procured by 1976.
With much better demographic information, the number of villages recorded as requiring water supplies became much larger, and the pressure for coverage grew, spurred on by the coming of the United Nations Water and Sanitation Decade. Greatly increased drilling productivity was required, but many of the so-called “problem” villages were in places where both drilling conditions and vehicle access were difficult. The trial introduction by UNICEF in 1978 of hydraulically powered rigs quickly showed that they were not too sophisticated in terms of operations and maintenance for Indian conditions. First the PHEDs, and then the private sector, embraced the new generation of DTH rigs, which laid the technological foundation for the 1980s expansion of coverage referred to in Chapter 2.
Once borehole construction technology had been successfully introduced and adopted, UNICEF attention turned to sustainability. The drilling-relevant objectives of the UNICEF WES programme during the 1980s and 1990s included:
• improvement of drilling logistics to increase production and reduce lost time;
• training to improve borehole construction;
• service training and spares control to improve rig productivity;
• adaptation of the rigs to reduce costs and improve mobility and access; and
• encouragement of local manufacture to reduce costs and enable programme sustainability.
These are described in detail in Annex 5, with only two important examples given here. First, a key feature of UNICEF support that promoted the sustainability of the borehole sources was the development with the GOI of norms to ensure adequate minimum depths drilling and casing. Data from the rig monitoring systems indicate that these have been widely followed. Second, the advice of UNICEF drilling staff to state implementing agencies and rig manufacturers led to the general adoption of 100 mm rather than 150 mm drilling rig technology as the norm for handpump boreholes. While there always remained a small niche in the programme for the larger rigs, the strong appreciation by UNICEF drillers of India’s hydrogeological conditions allowed the adoption of a “horses for courses” approach, which greatly helped to keep down drilling costs without compromising productivity. Drilling costs of hardrock, handpump boreholes of Rs. 200 to 250 per month, and overall borehole costs (with handpump) of Rs. 30,000 to Rs. 40,000 are probably the lowest of any government-implemented programme in the world.

Chapter 3: Water
31
Findings about UNICEF Drilling Activity The introduction, promotion and support of technology for borehole construction, development and rejuvenation have been a major component of UNICEF support to India’s WES programmes. The evaluation team, therefore, assessed the appropriateness and effectiveness of these technologies in some detail although, as described in Annex 5, contemporary documentation about important programme and procurement decisions is either lost or did not exist.
Box 3.1: Advantages of Promoting Local Manufacture
Once the technical feasibility of using hydraulic rigs in India was established, UNICEF encouraged local manufacture of rigs for two reasons. First, programme experience led to such significant adaptations as a two-truck arrangement, which increased access to remote villages. Second, local manufacture by several companies avoided the danger of a monopoly. However, one unintended consequence was that numerous “cottage”-style firms manufactured cheaper but less robust rigs in the late 1980s and early 1990s. Many of the rigs (and the firms) lasted only a few years.
In total, UNICEF supplied 330 drilling rigs to India’s rural water supply programme, at a total capital cost, at the time of purchase, of some $33 million. On the way, important technology choices were made to improve the capacity of the programme to meet expanding and changing requirements (for example, the move from pneumatic to hydraulic hammer rigs). Despite reservations expressed from time to time, it appears from the detailed appraisal of this evaluation described in greater detail in Annex 5, that drilling technology choices were appropriate at the time they were made.
UNICEF-supported rigs have achieved an average output of five to eight boreholes per month over a wide geographic area, and consistently over time. (See Table 5.2 in Annex 5.) This translates to a regular and continuing annual contribution by UNICEF-supplied rigs of some ten thousand rural water supply boreholes to the national programme. This achievement is a tribute to the long-term commitment of UNICEF in terms of training and other driller support, and the provision of spare parts and service agreements. Over the years, UNICEF consistently maintained a policy of supporting UNICEF-supplied rigs for a period of ten years, far longer than any other externally funded project. During the period 1995 through 1998, UNICEF phased out support for service training and the manufacturers’ service agreements, with the intention that state agencies would take them on. The failure of the states to do so has caused concern among suppliers, which they expressed to the evaluation team. The long and productive lives of the rigs also reflect the appropriateness of the technical specifications and choice, as they have been demonstrated to be robust and reliable under Indian conditions. This was strikingly illustrated during the team visit to Rajasthan, where a UNICEF rig was seen drilling its 1411th borehole! This picture of long and productive lives in which each UNICEF rig has drilled hundreds of boreholes compares very favourably with other donor-supported programmes in

Learning from Experience
32
India and even more so with other programmes elsewhere in the world. Improved training, logistical support, spare parts provision and better road access have helped to increase productivity, but this increase has been offset by the need in later years to reach more remote locations and to deal with villages where finding adequate groundwater is more problematic.
As early as the mid-1970s, recommendations were made to use management information systems (MIS) in support of better decision-making to reduce overall costs and promote cost-effectiveness. This logic was, however, implicit and the team found no documentary evidence that cost-effectiveness was given explicit or detailed consideration at the time. In fact, over the years, UNICEF has emphasised the need for monitoring systems within its drilling programme. The original objectives were to track the deployment and usage of UNICEF-supplied equipment and spares. These objectives were largely achieved, but the more ambitious aim of turning the assembled data into full-fledged MIS has not been realised. Significant variability exists between states in their uptake and use of the monitoring systems. The support of management decisions with information on costs and quality control has not been introduced, and these data are not used for the assessment of technical and economic feasibility.
With UNICEF’s declining support to the drilling programme, further development of rig MIS is probably not justified. Different considerations apply, however, to monitoring borehole rejuvenation, as described in the next section. More detailed technical and cost data are required to enable UNICEF to undertake comprehensive evaluations to support its advice to the GOI and state governments about these technologies. MIS enhancement would provide essential data for such analysis.
Notwithstanding these concerns, UNICEF has played a significant role in extending water supply coverage through its contributions to the drilling aspects of India’s rural water programme. The partnerships between UNICEF and government agencies to extend coverage have spanned 30 years. The evaluation team found that this long-term partnership helps explain the overall success of UNICEF’s involvement in the sector.
Borehole Rejuvenation
UNICEF Rejuvenation Activities Some wells drilled in the hydrogeologically difficult terrain of India inevitably have inadequate or marginal yields. Moreover, well yields tend to reduce over the years as a result of silting of the well and/or clogging of the fractures due to encrustation and weathering. UNICEF has therefore supported the development and testing of “rejuvenation” techniques to increase the discharge from some of these boreholes. UNICEF has invested in two such techniques: hydrofracturing to increase the local aquifer yield to the well and tractor-mounted compressors (TMCs) to clean boreholes.
UNICEF imported its first hydrofracturing units to India in 1989, using GOI funds. The initial uptake and success was variable, due to poor technique, handling, mechanical problems and lack of interest, but UNICEF promoted hydrofracturing through training courses and field demonstrations. To date, the national fleet consists of 40 hydrofracturing units from four suppliers.
TMCs rejuvenate boreholes by cleaning and re-developing them. The approach can be used effectively for lined boreholes in sedimentary formations as well as in hardrock areas. Mounting

Chapter 3: Water
33
the compressor on a tractor aids mobility and access. UNICEF introduced the TMC units in 1991. To date, 37 have been introduced at a total value of some US$485,000.
Findings about UNICEF Hydrofracturing Activity The evaluation team confirmed that the performance of the imported hydrofracturing units has varied from negligible to high, depending on such factors as the competence and enthusiasm for the technique in different states and different rock types. Moreover, in some instances, rejuvenation techniques are completing or fixing work that should have been done correctly during initial drilling.
Box 3.2: Potential and Pitfalls
During field visits to see hydrofracturing units in Tamil Nadu, Rajasthan and Maharashtra, the evaluation team made the following observations.
At the Tamil Nadu site, field procedures appeared to be well carried out under the direction of a competent assistant hydrogeologist, but the interpretation of yield data was dubious. Although hydrofracturing improved the yield, the implementation of the technique appeared far from ideal. The visit to a Rajasthan site demonstrated the technique's true potential: a worse than marginal borehole was improved to provide an adequate discharge for a handpump in a village with little prospect of alternative supply. In Maharashtra, a community with three boreholes drilled in 1992 was visited. While data from one of the three sites clearly demonstrated the benefits of the technique, the second borehole was found by the hydrofracturing crew to be high-yielding, which suggested unnecessary deployment and hence expenditure, and emphasised the need for careful selection of sites at the village level.
These observations confirm both the potential of the technique and the care with which it must be applied.
Although hydrofracturing seems both technically and economically feasible, it has been taken up rather slowly by some state organisations, and not at all by the private sector. There are potentially 200,000 marginal boreholes suitable for its application. The RGNDWM agreed with this estimate by the evaluation team, although whether this potential can be realised remains to be seen. The Ninth Plan estimates that 50 more units could be required and makes budget provision for them. The lack of an authoritative and detailed evaluation by UNICEF of the technical feasibility and cost-effectiveness of hydrofracturing may be constraining its uptake. While some partial reporting of experiences by the respective state organisations has occurred for Maharashtra and Uttar Pradesh, UNICEF has performed no overall evaluation of the programme. To support such a badly needed evaluation effectively, the monitoring system for hydrofracturing must be more comprehensive than that in use for drilling.
Findings about UNICEF TMC Activity As with the hydrofracturing units, the effectiveness of TMCs has varied widely, based on review of past experiences and field observations. Units in Rajasthan, Orissa and Andhra Pradesh have performed well, while progress in Madhya Pradesh is limited and the Maharashtra units

Learning from Experience
34
were returned unused by the State implementing agency. UNICEF field offices should have made greater efforts to deploy the units where they would have been most effective and followed up with more vigour where they were not being used.
A range of estimates exists about TMC costs. A 1996 estimate, based on completing 200 boreholes per year and taking account of depreciation, crew, moving and repairs, is Rs. 1,950 (approximately US $56) per borehole. Data from Orissa for 390 boreholes rejuvenated between December 1993 and December 1995 by four units (approximately 50 boreholes per year) suggest average costs of some Rs. 2,200 (approximately US $73) per borehole. Costs quoted separately to two members of the evaluation team in Rajasthan were Rs. 3,000 to Rs. 4,000 (approximately US $86–$114) and Rs. 7,500 (approximately US $214) respectively, for 80 per cent “success”, but these appear inconsistent and too high.
The TMC method may be appropriate and cost-effective in the right hydrogeological environment. As this is often likely to include shallower boreholes in sedimentary formations, the technique may be complementary to hydrofracturing. UNICEF has not, however, carried out a comprehensive analysis of the total potential or cost-effectiveness of this method, even though units have been regularly provided since 1991. The evaluation team cannot confidently advocate TMC use from the information available. In particular, criteria for selection of sites for rejuvenation by airlift pumping and criteria for evaluating success, including comparison of yields pre- and post-airlifting, need to be established.
The present cleaning operation seems an unsatisfactory compromise. If TMC rejuvenation is meant to be really cheap, rapid, and fairly frequent, it could perhaps be done with an old tractor and smaller compressor. Then, in contrast to hydrofracturing, the capital investment would be very low and perhaps attractive to small, local contractors. On the other hand, if a more comprehensive borehole rehabilitation through TMC is intended, it needs to be undertaken more professionally, with proper selection criteria and recording of results.
Groundwater Supply Sustainability Many technical and social issues influence the sustainability or long-term viability of water supplies. The institutional issues of system management are considered later in this chapter. This section briefly discusses technical threats to sustainability, and UNICEF’s potential role in alleviating these threats through support for better siting, construction practise and other technical options.
Water Quantity Can UNICEF-assisted rural boreholes continue to discharge adequate quantities of water for the future? While local hydrogeology is complex, two practical construction questions and one major policy issue must be considered:
Are wells deep enough to withstand seasonal and annual variations in groundwater table?
Are wells sufficiently cleaned and developed at construction to maximise and maintain inflow?
How can UNICEF be most effective in helping to ensure that overall water resource policy in India reflects a sustainable balance between agricultural and domestic needs?

Chapter 3: Water
35
Well depth
The balance between well depth and cost is a common challenge to groundwater supply agencies throughout the world. Deeper wells are more secure against seasonal or annual variations in groundwater table, but cost more to construct.
UNICEF and GOI worked together to develop drilling norms, including a minimum depth of 60m for handpump supplies. The evaluation team’s review of data and experience in India suggest this is adequate except in areas of rapid and severe drawdown. At some individual sites, shallower depths may have been sufficient, but the norm has helped to ensure adequate depth in large-scale routine construction programmes.
Where higher yields are required for motor pumps, and where heavy agricultural abstractions have produced falling water levels, siting geologists appear to recommend much greater depths. Where drilling is cheap and fast, the extra cost of drilling somewhat deeper “to be sure” is not very great for an individual well, but the cost of consistent, excessively deep drilling could add up over a large programme. Although the evaluation team encountered some examples of excessively deep boreholes in its field visits, these had been drilled by private contractors and not by GOI or UNICEF rigs. In the more complete review presented in Annex 5, the team examined records of boreholes drilled throughout the evolution of the drilling programme, and saw no overall trend towards average depths greater than 60m by either GOI or UNICEF rigs. It was not possible to extend this review to contractors’ rigs, as their data were not collected by the RGNDWM.
Well cleaning, development and testing
Sound borehole construction calls for adequate cleaning, development and testing. Private contractors are not paid for such operations. This means that there is negligible on-site supervision by either state or private drilling crews and that shortcuts in borehole completion are likely. If inadequate borehole cleaning is indeed widespread, it is not surprising that rejuvenation has such a high apparent success rate. In many cases, it may be completing the task of cleaning that should have been done at the time of drilling!
Following cleaning and development, borehole yield must be measured to ascertain its adequacy for the proposed pump capacity. For handpumps, UNICEF and the GOI established the norm of 12.5 l/min during the 1980s, and states follow this or something very close to it. As with cleaning, the team’s field visits raised concerns about a lack of incentives and supervision to ensure that yields are properly measured. These concerns about the effects of poor construction on yield sustainability are also reflected in water quality issues, as described shortly.
Policy issues
Rural water supply is not a cause of groundwater depletion, but it is certainly affected by the problem. Thus, while UNICEF is not “responsible” for dropping water tables, it has begun to consider the consequences of groundwater depletion in its field work and advocacy. UNICEF recently collaborated with the World Wide Fund for Nature on a report highlighting the need for improved conservation and management of freshwater resources. It has not, however, been visibly involved in the public policy debate about controlling excessive agricultural use as a key management issue for groundwater resources. For UNICEF, advocacy on behalf of the rural

Learning from Experience
36
domestic water user, backed up by strategic alliances and partnerships with those who can provide sound technical understanding, is likely to be the way forward.
UNICEF has been involved in exploration of technical options for water conservation and groundwater recharge. Review by the team of some of this work in Tamil Nadu, described in Annex 5, raises serious questions about the quality of some of these studies, and about UNICEF’s capacity to manage such studies in general. The ideas behind the studies are worthy of exploration, but UNICEF needs to be more realistic about its capacity to design and manage such work. This concern is a generic one expressed by team members reviewing research and pilot programmes funded by UNICEF.
Water Quality The choice of site and the construction of a proper sanitary seal determine whether a borehole source meets its objectives in terms of bacteriological quality. While general siting is a function of geology and user requirements, the precise location on the ground should reflect consideration of local pollution sources and pathways. For example, drillers should avoid siting a borehole in flat, low-lying areas that encourage surplus water to stand around the pump.
In a 1986 handpump survey, waterlogging around pumps was reported at 44 per cent of the sites. Subsequent, albeit limited, monitoring by UNICEF confirmed widespread bacteriological contamination. During the present evaluation, visual impressions of an admittedly biased “roadside” sample of handpump sites confirmed that siting remains a common problem. Many are sited—for user convenience, easy (lazy) access by drilling rigs or to be on public land—in the strip of ground between houses and the road. Although UNICEF has given guidance on this in its training, good practise is by no means universally followed in the field.
Reliable sanitary sealing could keep away much of this pollution. UNICEF has long recognised the need for such sanitary sealing, advocated it, considered various designs of seal and held training courses specifically on the issue. Field visits and discussions made it clear, however, that almost all handpump boreholes are completed without proper sanitary seals in the programme at large. The principal reasons for this shortcoming appear to be time and money. When drilling is so rapid (boreholes may be completed in less than a day), the additional time and hence cost for sanitary sealing is not attractive to the contractor. The lack of sanitary sealing was highlighted in discussions at the Central Ground Water Board (CGWB) drilling conference in January 1999, attended by a member of this evaluation team. One way to improve the sanitary situation is to construct more substantial handpump aprons, and the UNICEF field office in Hyderabad has been piloting this approach in a small way. Improved public education of local governments and village communities within the new social and administrative framework could enable them to monitor the performance of drillers and installation teams more effectively.
Chemical quality constraints on the potability of groundwater were identified in India many years ago. They include, in different parts of the country, high fluoride concentrations, arsenic, salinity, nitrate and excess iron. The RGNDWM has recognised these problems by developing four sub-missions on control of brackishness, fluoride, and arsenic, and on removal of excess iron.
UNICEF has supported the GOI in some of its efforts to improve water quality. For example, to control fluoride, which affects more that 1 million people with serious skeletal fluorosis and an estimated 20 to 60 million with dental fluorosis, this support has included:

Chapter 3: Water
37
• development and testing of small-scale fluoride removal plants;
• support (with WHO) for a national workshop on monitoring and surveillance in 1997;
• R&D of simple water quality monitoring kits;
• introduction of domestic defluoridation (discussed as a case study in community mobilisation in Annex 9); and
• research on methods of augmenting groundwater recharge to help reduce fluoride concentrations.
Incomplete and somewhat anecdotal evidence suggests that heavy groundwater abstraction has worsened the fluoride situation in some areas. This calls for a systematic and thorough evaluation of the hydrogeochemistry of fluoride in various geological environments, including spatial and depth distribution. Further studies are necessary to address the occurrence and distribution of high-fluoride groundwaters, the potential for and experience with methods of enhancing recharge to alleviate the problem, and the scope for locating alternative groundwater supplies.
UNICEF’s contribution to eradicate guinea worm disease serves as example of the link between a water quality issue and the role of the community. UNICEF, Sida, and the GOI collaborated on the Sanitation, Water and Community Health (SWACH) project in Rajasthan, which encompassed both technological and hygiene components to eradicate guinea worm in India in about a decade. Annex 9 provides more information about the SWACH project.
Conclusions about UNICEF’s Role in Groundwater Supply Sustainability UNICEF’s strong national advocacy regarding technical aspects of programme implementation in rural water supplies has been backed up by advice, site visits and training courses. However, the quality of workmanship and effectiveness of supervision of both government and private crews at the state and site levels determine how good the final “product” will be. With a programme of this size and spread, some trade-off is inevitable between the quantity requirements of coverage targets and the quality requirements of sound construction practise. This evaluation has tried, therefore, to probe the balance between these conflicting requirements. In so doing, it is important to be reminded that the rural water supply programme is a GOI activity. The state PHEDs or equivalent organisations are the implementing agencies, rather than UNICEF itself, and this must be appreciated in evaluating the real scope for UNICEF to influence activities at the site level.
Nevertheless, as a long-term and substantial supporter of the programme, UNICEF should have been able to describe and quantify the trade-off between coverage and the quality of the product. This would be done by answering the questions: what proportions of the boreholes are compromised to what extent, and what are the financial and health impacts? If most boreholes provide sustainable supplies of good quality water for a reasonable operating life of 20 to 25 years, then a reasonable balance is maintained. If many provide poor water quality and last only a few years, then the balance has slipped too far. Given that up to 80 per cent of boreholes are now constructed by private contractors, and the albeit limited impression of construction shortcomings gained during the team’s field visits, the questions above are certainly worthy of further probing.
The ability of the more than 3 million rural water supply boreholes to meet the programme objective of supplying safe water on a continuous and sustained basis depends on many

Learning from Experience
38
factors. A programme of this size could only be completed in a reasonable time span if the technical specifications were greatly simplified so that the main steps in the construction process were relatively standardised and routine. There is almost no scope for the kind of decision-making on site by hydrogeologists and drilling engineers that characterises programmes in which a relatively few, but individually very high value, boreholes are constructed as sources. In the present programme, individual boreholes could clearly be sub-standard and reduce the value of the investment. The key to success is first to establish and then to implement appropriate routine operations so that most of the individually cheap boreholes are soundly sited and built.
Handpump Development and Manufacture
UNICEF Involvement The cast-iron handpumps available during the UNICEF 1967 drought-relief effort had a very high failure rate. They were designed for individual family use and could not withstand the much heavier requirements of almost continuous operation for more than 10 hours a day. A number of NGOs began trying to develop a sturdy, low-cost, easy-to-manufacture pump.
The Sholapur pump, designed by a Swedish engineer, came closest and was the point of departure for development of the India Mark II (MKII) handpump. In 1975, UNICEF purchased 6,500 Sholapur “conversion heads” and provided them to various state governments. They replaced the multi-pivot handle cast-iron handpump heads to operate the older pump cylinders and rods already installed. The successful outcome of this hybridisation changed the GOI’s attitude toward handpump development.
The MKII handpump was developed at very little cost to UNICEF. It did not pay for engineering inputs, but instead contributed manpower and commitment. UNICEF staff visited manufacturers monthly and joined in an intense exchange of views with the designers and manufacturers. UNICEF was not just technically interested; the partners knew that UNICEF would purchase the products that evolved from these R&D efforts, a commitment of utmost importance. UNICEF also had the technical and financial capability to put the products into the field quickly for testing and could monitor the pumps in large field-tests.
The India MKII design was established by the end of 1977 when UNICEF purchased 1000 pumps for large-scale field-testing. The GOI and a number of state governments accepted the design, and demand rose. UNICEF helped to identify and support new manufacturers. It actively encouraged the private sector because it realised that the traditional NGOs could not produce the quantity required. To establish mass production, UNICEF focused on established companies. This decision achieved quick, tangible results.
UNICEF engaged an independent inspection agency, Crown Agents, to inspect the technical and financial capability of companies that had applied to become India MKII manufacturers. Upon identification of potential manufacturers, UNICEF placed trial purchase orders with them, and UNICEF and the inspection agency then provided technical assistance. Within a few years, the handpump programme expanded phenomenally. By 1984, more than 600,000 handpumps had been installed, and UNICEF had expanded its list of approved manufacturers of the India MKII to 36 firms with a combined production capacity of over 200,000 units/year. By 1998, some 3 million India MKII handpumps provided water to India’s rural and urban population.

Chapter 3: Water
39
Findings about UNICEF Handpump Involvement
UNICEF’s strict commitment to quality has been a key factor to the success of both domestic and export handpump sales. UNICEF support for independent pre-delivery inspections of all handpumps purchased for GOI use has:
• created awareness among implementing agencies of the need to procure high-quality handpumps and spare parts;
• monitored the manufacturers’ consistency in quality control on a continuous basis; and
• monitored the effectiveness of the quality control mechanism through consignee end inspections.
In the 1970s, UNICEF entered into a long-standing partnership with the Indian Standards Institution (ISI, later named Bureau of Indian Standards, BIS) to develop handpump standards. In 1993, BIS took over responsibility for licensing of manufacturers and batch inspection of handpumps. By the end of 1998, UNICEF stopped supporting spare parts inspections. Instead, the BIS issues self-inspection licences to manufacturers: in other words, these parts are no longer subject to third party inspection.
Box 3.3: Quality and Cost
Many manufacturers stopped selling MKII pumps to state governments because they felt that the push to lower costs has compromised quality. Instead, they said that they are focusing on the export market. The trade-off between quality and cost, as well as between quality and coverage, is a delicate balance for UNICEF, the GOI and others involved in WES efforts.
Many manufacturers feel that UNICEF’s withdrawal from inspection and quality control has been a clear step backwards. They complain that BIS has neither the capacity nor the internal management capability to ensure factual unbiased inspection as the independent agencies did. However, UNICEF had supported this function for 17 years, and felt that the responsibility should devolve to the appropriate government bodies. This development could pose a threat to India’s handpump programme. The evaluation team recommends that UNICEF and BIS carry out a joint evaluation of manufacturers’ qualifications and standards.
It is noteworthy that the Indian private sector was and still is willing to contribute towards a product that is in the public domain; whoever works with UNICEF does not have the exclusive right to capitalise on the inventions made during the co-operation. Handpump R&D was based on the mutual understanding that if the product proved a success, the GOI would take it up on a large scale and manufacturers would then have a chance to recover their development costs. During this evaluation, however, manufacturers visited by the team expressed their doubts about whether this faith and trust still hold. As one example, the manufacturer that led the development of the 50 mm cylinder paid for the prototype components and the engineering. Once the design was established , UNICEF, through the procurement process, went out to competitive tender for the pumps required for field testing. During the evaluation, the company expressed a sense of dissatisfaction because of its earlier investment.

Learning from Experience
40
Further Developments: the India MKIII During the 1980s, the UNDP/World Bank water and sanitation programme (now WSP) initiated the development of the next handpump model, the India MKIII pump. UNICEF supported and followed this development and became involved in large-scale field testing. The Coimbatore Project in Tamil Nadu showed that although capital costs for the MKIII were higher, maintenance costs and time requirements were much lower (see Annex 6). These advantages contributed to a shift in government thinking about a greater role for communities in handpump operation and maintenance (O&M). Although the potential of the MKIII has not translated into much change on the community level, it has been a useful tool for the advocacy of community-based handpump maintenance.
Another factor limiting more widespread use of the MKIII was a parallel R&D effort to improve the reliability of the MKII, which yielded significant results. The introduction of nitrile rubber piston seals extended the life of the below-ground components by more than a factor two. Therefore, the frequency of O&M interventions on the MKII could be reduced.
Piped Water Supply The growing demand for an installation of piped water supply has benefits as well as potentially negative effects on the well-being of the poorest and for public health. For the better-off who can afford house connections, it brings water within the home. They are also better able to cope with irregular delivery by installing private water tanks. The higher water consumption for personal and domestic hygiene resulting from piped water supplies is one of the main contributors to better health. It also saves women in these households considerable time and reduces the hard labour of women and children, especially girls, of carrying domestic water home. However, the usually unmetered connection and the flat tariff for piped water also stimulate over-consumption, including use of water for income-generation purposes from irrigation, livestock production, informal enterprises, and sale of water to the poor.
Without accounting for other differential effects, piped water supplies exacerbate the division between rich and poor. The evaluation team’s field study in Tamil Nadu showed that in villages with piped water supply, poor families and especially women and children depended on irregularly functioning public taps from which water still must be carried home. The alternative source was handpumps, but their maintenance as a secondary source was less well taken care of than when they were the primary source of village water, as in Rajasthan.
More experimentation with shared used and managed family and neighbourhood taps and appropriate payment systems for connection costs and tariffs are thus needed. In doing so, it is worthwhile to start with reviewing the experiences and insights on sharing and financing in India and in other countries. This helps build on lessons already learned and replaces the “reinvention of the wheel” by adjusting to what people in India want to and can do.
The experiment with responding to user demands in Uttar Pradesh visited by one member of the evaluation team showed that a demand-based approach has potential in India. However, it also showed that there is an inequity effect. In North India, villagers opted for piped systems, rather than wells and handpumps, when given the choice. Although the households contributed 10 per cent to the capital costs of either system, the government-financed share of a piped system with private connections costs much more than the government-financed share to install handpumps. This means that with the same amount of public funds, fewer villagers are served with a higher service level. An apparent strategy may be a higher and equitable user

Chapter 3: Water
41
contribution than the standard 10 per cent co-financing of construction costs when villagers choose a piped system. Projects that involve men and women in households, councils and state water agencies are also useful so that private connections with piped water supply do not worsen the current problems with drainage of waste water.
Management of Rural Water Supply Rural water supply coverage increased from 31 per cent to nearly 90 per cent in less than two decades. With this growth, maintenance costs rose rapidly as well. If the three-tier system described below were applied, the present annual cost to the government for the maintenance of 3 million boreholes with handpumps would be approximately Rs. 4,000 million (approximately US $100 million). An additional 200,000 to 300,000 piped water systems add another Rs. 2,000 million (approximately US $50 million) to the national maintenance cost. It is no wonder that the RGNDWM wants to set up an effective cost-sharing arrangement.
The National Conference on Deepwell Handpumps held at Madurai in 1979 recommended a three-tier system handpump maintenance with: 1) a village caretaker, 2) a block-level mechanic to look after 100 pumps, and 3) a mobile repair team at district level for every 1000 pumps. The village caretaker would work on an unpaid basis and interact with villagers to keep pump surroundings clean, do preventive maintenance, report breakdowns, and promote handpump water as “safe”. Most village caretakers soon gave up these responsibilities, so that only the two upper tiers were effectively established.
Under the current implementation of this system, a wide variation exists in which operations and maintenance (O&M) of different types of externally introduced water supplies (handpumps and piped systems) are maintained. In most states, the technical departments (PHED, PRED, TWAD) are responsible for installations and major technical repairs and the Panchayats are responsible for O&M. Indigenous sources should be, but are not always, maintained by the community councils. This arrangement leaves much scope for confusion. In practise, the three-tier system has been replaced by a one-tier system in which mobile teams carry the main burden. They react to reported breakdowns and have some limited scope to carry out preventive maintenance. The complicated institutional setting of handpump O&M, with unclear relations between Panchayats and technical departments, is relatively expensive and also lacks responsiveness. Often, much time passes between breakdown and the arrival of the repair unit.
Community-based management is clearly included in RGNDWM policy, but the high-level policy has not yet filtered down to the ground. The political will in many states is lacking. Water is still a sensitive issue and helps to gain votes, so politicians are reluctant to support cost-sharing. Community-based handpump management (CBHM) projects have not led to a lowering of costs. Because the technical departments cannot be restructured immediately and are still responsible for spare parts supply, cost on their side remain significant. Meanwhile, the communities have to pay for parts and repairs, including less apparent economic costs. (A woman who repairs a pump might not send an invoice, but the economic cost for her service is still there.)
The fact that capacities in technical departments are usually dissolved faster than the capacity is built up within the communities to cope with problems leads to a transition stage in which standards are not yet up to mark. Further, in the places where the roles and responsibilities (piped versus handpump systems) are not clearly defined, repairs are normally deferred until complete breakdowns, or until the government steps in, as in Rajasthan.

Learning from Experience
42
Why have the results been so mixed? Community-based management is not a problem of technology. Rural India manages to keep 15 million irrigation wells operational, and these require a higher level of skill and management ability than handpumps. Rather, it would appear that institutional aspects are the cause.
In principle, India has been moving toward ideal institutional arrangements for decentralised management under the Panchayati Raj system. Local Panchayats now have directly elected representatives, of whom at least one-third are women. The Panchayats may raise funds and have the authority to make their own decisions. Decentralised management has the potential to work, but it requires a holistic approach for its introduction (not separating between handpumps and piped systems, as well as establishing spare-part supply chains, using private sector mechanics, and the like) and capacity-building at all levels.
Some CBHM projects have worked through NGOs and some have established separate water and sanitation (WATSAN) groups and did not work directly with the Gram Panchayats. Gram Panchayats, as relatively new institutions, have not yet always developed the capacity to assume full responsibility in CBHM. The evaluation team feels that the potential of CBHM has not yet been fully explored, and the projects already executed did not pay close enough attention to the institutional aspects, at all levels. Now that India is moving towards decentralisation (Ninth Five Year Plan) it is essential to develop well-designed CBHM pilot projects. To be meaningful, they must include all aspects of the required change in water management responsibilities, such as legal ownership, technical back-up, financing and equity in gender and poverty aspects. A gender and poverty perspective prevents poor women from being asked to work for free and without a say in water management decisions.
Findings about Management of Rural Water Supply Under the three-tier norms, the annual cost of the maintenance system (including capital depreciation) would be Rs. 1,300/pump/annum (US $31) or less than Rs. 7 per user. In reality, the repair service is not carried out as envisioned. A mobile team can realistically be expected to service approximately 500 pumps per year. The lack of maintenance personnel and transport means that the repair services cannot in practise be carried out to the anticipated level planned. This is also documented by the relatively long response time between the reporting of a breakdown and its actual repair.
The presently reported results of handpump performance vary from 98 per cent (Tamil Nadu) operational at any one time to about 60 per cent (Rajasthan). The Tamil Nadu statistics are based on figures from the complaints received, while Rajasthan estimates figures from the pumps repaired during its repair campaign at the beginning of summer. These figures are likely to be in error. A more realistic assessment would be a range between approximately 60 per cent operational in Tamil Nadu to approximately 80 per cent functioning in Andhra Pradesh and Rajasthan. The figures reflect the dependence on handpumps in the various states. Tamil Nadu has a piped system in virtually every village and handpumps are only used as a secondary source of water supply. In contrast, Rajasthan and Andhra Pradesh are much more dependent on handpumps, and therefore more likely to achieve better handpump repairs. Other factors that may affect handpump performance and repairs include the location of the community (more handpump-dependent areas may be more remote and difficult to reach for repair) and the relative comprehensiveness and accountability to users of the water management system.
The satisfactory rates of handpump performance can be attributed to several factors: the catchment population norms set for handpumps (200 people/pump) are sensible; the India MKII

Chapter 3: Water
43
and India MKIII are good pumps; the level of competence and commitment within PHEDs is high; and the political will to provide water to the rural population is strong. UNICEF involvement has definitely had a positive impact on at least the first three of these factors.
Despite belief to the contrary, a community-based approach does not provide a total cost reduction. Computations, shown in Annex 6, indicate that the cost per handpump for O&M will remain about the same under CBHM. The main financial difference between the two systems lies in who pays the costs. In contrast to the centralised system, where all financial resources come from the governments, CBHM may introduce effective cost-sharing arrangements, so that those who benefit are those who pay. Such an arrangement could help to make CBHM more responsive and thus would provide better service for the same cost. While this sounds reasonable, the evaluation team is concerned that much sound pilot work and evaluation of the institutional arrangements remain to be done before this goal can be achieved.


45
Chapter 4: Environmental Sanitation
Introduction Concern about sanitation coverage is recent relative to water supply, stemming from the early 1980s. From the beginning of its work in environmental sanitation in India, UNICEF focused on:
• supporting a major partnership in defining technological options;
• piloting various approaches to sanitation; and
• advocating the importance of sanitation as an issue.
This chapter provides an overview of the UNICEF WES programme’s role in increasing sanitation services in India. Annex 7 provides a more detailed account.
The Search for Solutions UNICEF first became involved in sanitation projects in 1982, when it initiated a rural sanitation programme with three NGOs in West Bengal. Prior to this, sanitation was part of the hygiene component of health education programmes. The “formalisation” of sanitation in the West Bengal programme could be criticised in current terms as it actually delinked sanitation from the health issue for the first time and looked at it as a separate “problem”.
In 1983, UNICEF-India appointed sanitation project officers in two of its field offices and launched pilot district-level projects in Andhra Pradesh, Madhya Pradesh and Maharashtra that focused on hygiene education and school sanitation, the then so-called “software” approaches. In this early period, UNICEF did not focus on sanitation hardware or technology.
By the mid-1980s, success of the water supply programme (both in drilling and the development of the MK II handpump) made the idea of a “Model T” of sanitation very attractive to government staff and others facing the massive problems of rural and peri-urban sanitation in India. The challenge seemed to be to develop a suitable standard low-cost design of latrine using small quantities of water but that eliminated some of the least attractive aspects of service latrines, including the daily transport of fresh human wastes by “scavengers”.
UNICEF was the major funder of the influential TAG study The Feasibility Study Based on Demonstration Schemes for Sanitary Latrines in Rural India. This study recommended the TPPF latrine as the most cost-effective design. The TAG adopted an approach that latrines should be provided free to beneficiaries. Issues of use and demand did not factor into the recommendation. The TAG completed its work in 1986, and the RCRSP accepted the recommendation, a decision which has had major repercussions ever since. UNICEF itself was well aware of many of the limitations of a purely technical fix. It stressed the need for health education to achieve health benefits, and worked on a variety of software strategies in addition to latrine construction.
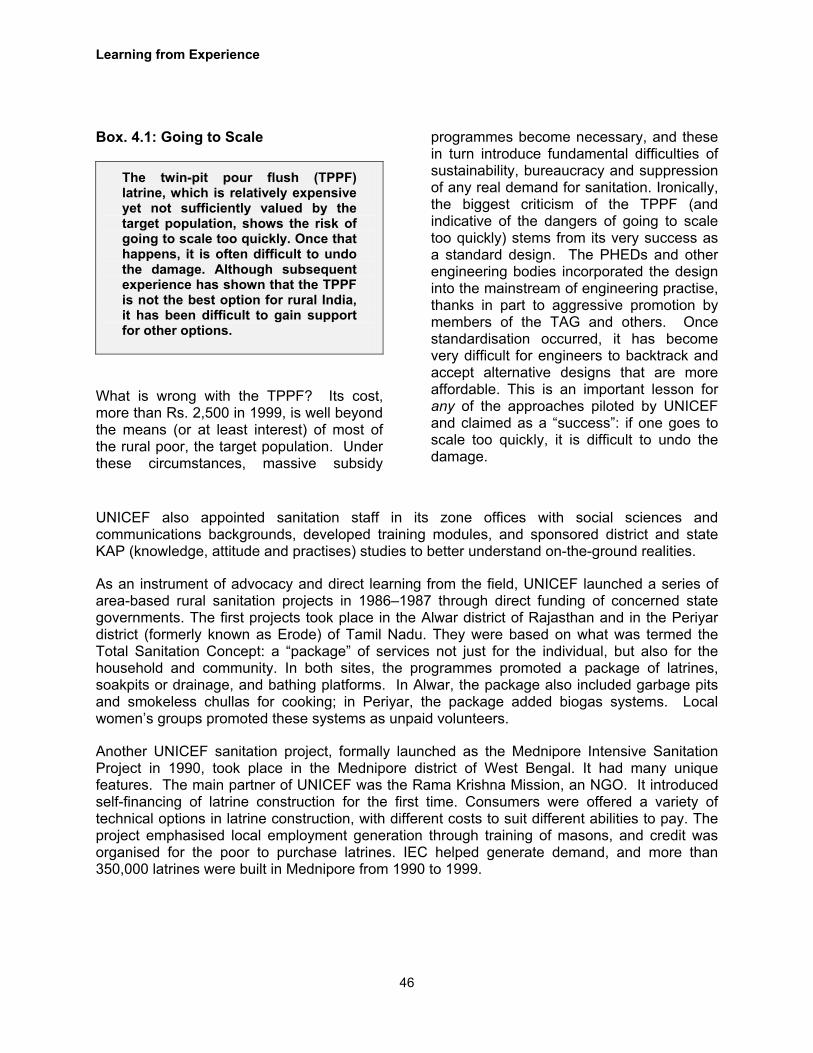
Learning from Experience
46
Box. 4.1: Going to Scale
The twin-pit pour flush (TPPF) latrine, which is relatively expensive yet not sufficiently valued by the target population, shows the risk of going to scale too quickly. Once that happens, it is often difficult to undo the damage. Although subsequent experience has shown that the TPPF is not the best option for rural India, it has been difficult to gain support for other options.
What is wrong with the TPPF? Its cost, more than Rs. 2,500 in 1999, is well beyond the means (or at least interest) of most of the rural poor, the target population. Under these circumstances, massive subsidy
programmes become necessary, and these in turn introduce fundamental difficulties of sustainability, bureaucracy and suppression of any real demand for sanitation. Ironically, the biggest criticism of the TPPF (and indicative of the dangers of going to scale too quickly) stems from its very success as a standard design. The PHEDs and other engineering bodies incorporated the design into the mainstream of engineering practise, thanks in part to aggressive promotion by members of the TAG and others. Once standardisation occurred, it has become very difficult for engineers to backtrack and accept alternative designs that are more affordable. This is an important lesson for any of the approaches piloted by UNICEF and claimed as a “success”: if one goes to scale too quickly, it is difficult to undo the damage.
UNICEF also appointed sanitation staff in its zone offices with social sciences and communications backgrounds, developed training modules, and sponsored district and state KAP (knowledge, attitude and practises) studies to better understand on-the-ground realities.
As an instrument of advocacy and direct learning from the field, UNICEF launched a series of area-based rural sanitation projects in 1986–1987 through direct funding of concerned state governments. The first projects took place in the Alwar district of Rajasthan and in the Periyar district (formerly known as Erode) of Tamil Nadu. They were based on what was termed the Total Sanitation Concept: a “package” of services not just for the individual, but also for the household and community. In both sites, the programmes promoted a package of latrines, soakpits or drainage, and bathing platforms. In Alwar, the package also included garbage pits and smokeless chullas for cooking; in Periyar, the package added biogas systems. Local women’s groups promoted these systems as unpaid volunteers.
Another UNICEF sanitation project, formally launched as the Mednipore Intensive Sanitation Project in 1990, took place in the Mednipore district of West Bengal. It had many unique features. The main partner of UNICEF was the Rama Krishna Mission, an NGO. It introduced self-financing of latrine construction for the first time. Consumers were offered a variety of technical options in latrine construction, with different costs to suit different abilities to pay. The project emphasised local employment generation through training of masons, and credit was organised for the poor to purchase latrines. IEC helped generate demand, and more than 350,000 latrines were built in Mednipore from 1990 to 1999.

Chapter 4: Sanitation
47
Findings about UNICEF’s Sanitation Efforts During this evaluation, team members visited Alwar and Periyar sites where the Total Sanitation Concept projects took place. Many facilities were constructed, and some of the provided facilities (e.g., latrines) were and are used. The latrines were the standard TPPF models, and were heavily subsidised or free. While the women’s organisations may have flourished and moved on to other issues, there is little evidence at either site of any ongoing activity along the original lines of the projects or if the work empowered women in any other ways. There is also no evidence of any “takeoff” through copycat activities to promote sanitation outside the originally chosen families.
UNICEF still continues water and sanitation activities in these districts, but the Total Sanitation Concept is not visible. In Periyar, for example, it is now remembered very much as a government-funded construction scheme, and the Total Sanitation Concept is now replaced by local implementation of CDD-WATSAN (see section below), which links sanitation and control of diarrhoeal diseases. In hindsight, it is likely that “Total Sanitation” is too complex to promote, and the shift by UNICEF to the more sharply focused CDD-WATSAN approach is entirely appropriate.
For UNICEF, however, the projects were critical in developing sanitation as a mandate and work domain within the organisation. They were also effective advocacy tools to influence the state governments where such projects were being implemented. This was possible both because of the projects’ visibility, and because of their organisational structure right up to the state level, thus involving the state government system. As the results of these pilot area-based projects emerged, and as informal dialogues between UNICEF and GOI continued, the GOI focus on fully subsidised latrines and coverage began to change.
The Mednipore experience has been extensively evaluated and documented (see Annex 7). A brief field visit to Mednipore during this evaluation suggested the following:
• The programme has been successful. Random spot checks confirmed not only that latrines had been built, but that they are currently used and well-maintained. The generation of local employment is visible, and many people have a stake in the programme’s success. The Gram Panchayat is actively involved in the programme, and the “promotion” of latrines occasionally resorts to peer and local government pressure on community members.
• The most practical outcome of the “range of technical options” is the offer of sanitation options at one-tenth the cost of a TPPF. At present, so little of the business is at the “high end” that it appears that “product range” is less important than “cost reduction”. The issue of cost is more important than the issue of subsidy. Most of the latrines being built during the field visit benefited from a 50 per cent subsidy. In government circles, a 50 per cent subsidy of Rs. 200 (approximately US $5) is much easier to accept than a 50 per cent subsidy of a Rs. 2,500 standard latrine (approximately US $55)! Many factors are unique to the situation in West Bengal, not least the extensive network and deep roots of UNICEF’s principal partner, the Rama Krishna Mission. Other relevant factors are the high population density and the reduction of private places for defecation, high literacy rates, and strong community organisation and commitment of the Panchayati Raj institutions in West Bengal.
UNICEF has played an advocacy role in establishing sanitation policy. It had a substantial influence on the National Seminar on Rural Sanitation (in support of the Eighth Five Year Plan) in September 1992. The Seminar was a critical event that influenced the policy perspective of the sanitation “sector” within the government. UNICEF advocated such policies as a move to a

Learning from Experience
48
package approach (including hygiene, drainage, and clean water), a range of technology options, and a move from full to partial subsidisation.
The seminar, combined with the launching of the GOI’s Eighth Five Year Plan, led to a comprehensive revision of the operational guidelines of the RCRSP in 1993. The fundamentally new approach reduced subsidies, included a strong IEC approach and emphasised community participation.
Rural Sanitary Marts (RSMs) The RSM concept was first demonstrated in the field by a rural technical institute, the Institute of Education and Rural Technology in the Allahabad district of Uttar Pradesh. An RSM is a “one-stop” retail outlet that sells sanitation construction materials and hygiene products, advises interested households on the different types of latrines and other sanitary facilities, and maintains a list of trained masons.
UNICEF involvement with RSMs began in 1990. It underwrote the low capital costs to establish them, and offered some technical support in the first two years.
The RSM is an intuitively attractive idea to those who promote sanitation, as it encourages revenue generation and should thus require less subsidy. Thus, even before the Uttar Pradesh demonstration project had become fully commercially viable, the RSM idea was quickly diffused and replicated. This meant there was no time to go through the full learning cycle, which would have allowed more practical and focused development. Progress was in fact slow. In 1994, there were only about 100 RSMs, which had established 17,000 sanitary latrines in different states. In 1999, there were 658 RSMs established in different states by UNICEF, either as part of integrated sanitation projects or as stand-alones.
During the present evaluation, field visits in Periyar and Alwar to RSM sites suggested that the concept was not as successful in practise as many had hoped. Some RSMs in these areas had gone out of business, while those still active were either in deficit or barely breaking even. One of the more successful ones claimed its success was attributable to being slightly cheaper than the private sector, which belies the idea of a gap in the market.
CDD-WATSAN In the early 1990s, UNICEF began to apply the Control of Diarrhoeal Diseases-Water and Sanitation (CDD-WATSAN) strategy, with Sida support, in one district of 15 large states. The strategy tried to integrate the lost link between water and sanitation hardware and specific health issues – in this case diarrhoea. CDD-WATSAN integrates water, sanitation and diarrhoeal disease control through projects that stress not only the supply of water and sanitation facilities and health education, but also improved diarrhoeal case management at home, supported by community ORS depots and public health facilities.
At the sites visited during this evaluation, substantial efforts were made to collect statistics through the public health system. This approach is especially significant for UNICEF as an example of sector convergence.
It is perhaps not surprising that the relative emphasis on the basic components of CDD- WATSAN varies from place to place. In Periyar, the organisation of the CDD efforts was most

Chapter 4: Sanitation
49
impressive, while work on sanitation facilities appeared at a virtual standstill. In Alwar, the hardware efforts, promotion and installation of sanitation facilities were making reasonable progress, but the CDD component was less evident within the public health system. This may reflect local interests: in Periyar, the nodal officer was a medical officer; in Alwar, the most interested government bodies are in rural development.
The use of the data that are collected at local health centres and sub-centres is not straightforward, and should be viewed with caution. In Alwar, for example, the local NGO noted with pride a “decrease” in diarrhoea as a result of the project. In fact, this could just as easily be explained by the fact that a baseline was measured in the summer (a likely time of high diarrhoeal incidence), while the “after” project data were collected in a different season with less diarrhoea.
Experimentation and Going to Scale Many observers believe that the key to the solution of India’s sanitation challenges lies in the exploration of low-cost, fast-diffusing alternatives on the supply side and sustainable, self-financed, promotional techniques and institutions on the demand side. UNICEF, while an important contributor to possible solutions, is only one of the actors (especially through its area-focused projects). Other actors include selected NGOs, donors and government officials at different levels.
Sanitation is filled with “success stories” that work well in one place and not another, so caution about the feasibility of going to scale—for example, outside West Bengal with the Mednipore approach—is in order.
True experiments in sanitation should not always succeed. Promising avenues may turn out to be dead ends, but the only way to know is to try them. Like the TPPF, it is not surprising or shameful that the Total Sanitation Concept did not emerge as a “magic bullet” for sustainable hardware dissemination. An important lesson must be drawn however, by both UNICEF and the GOI about how easily pilot experimentation can be promoted as “successful” in an effort to meet the requirements of going to scale. The RSM, the TPPF and the Total Sanitation Concept projects reflect the risks of valid experimentation in a climate that demands “success stories” and “going to scale”. They demonstrate the need for rigorous external examination of such experimentation, after the passage of a decent interval of time. Such evaluations would allow UNICEF and partners to learn real lessons and avoid the waste of scarce resources before going to scale within UNICEF programme and, later, within the GOI.


51
Chapter 5: Social Aspects of WES Services
Introduction The priorities of the WES programme have evolved with new challenges. In the 1960s and 1970s, the physical provision of basic water supply in rural areas was the first priority; in the 1980s, the issues of sanitation and its marketing emerged. More recently, hygiene and community management have come to the fore as critical issues in sustainable improvements in people’s lives. Gender perspectives, while still not often operationalised, have been found to be critical to the success of projects in WES, as in other sectors. In promoting behavioural change, the emphasis in WES programmes is on IEC. New approaches, such as public health communication (also known as social marketing) and community-managed change, are not yet playing a large role. This chapter reviews how the UNICEF-WES programme plans for and implements these aspects of its services. Readers may also refer to Annexes 8 through 10 for more details.
UNICEF’s Recognition of the Need for a User Perspective UNICEF staff have been long aware of the need for changes in individual, family, institutional and social behaviour for lasting improvements in health and well-being, but only relatively recently has this need been reflected in programme design. Approaches to promote these changes are varied, and have had various names in different places or times: what started off as community participation evolved into awareness raising; social mobilisation; IEC; and, more recently, “software” (in contrast to the “hardware” of pipes and pumps). UNICEF’s involvement in these social aspects of water and sanitation over the last 30 years has been both relevant and timely, but the transition to an effective balance between and integration of technical and social aspects has been neither systematic nor complete.
UNICEF began the transition from exclusive reliance on technological solutions earlier than most multilateral and bilateral agencies. UNICEF guidelines from 1987 on community participation and health education stated: “…the provision of safe drinking water to the community [is] a very complex task.…This ... involves not only the change of existing facilities, but also the network of behaviour and beliefs which has developed around the ownership and use of water and which involves every person. This is a long and complicated process; however, the start should be made”.
UNICEF’s collaboration with the GOI and with the Sida on the eradication of guinea worm, a water-borne disease, is an example of the role of community-based efforts in WES. Through the Sanitation, Water and Community Health (SWACH) project, described more fully in Annex 9, health promoters in Rajasthan, the state most affected by guinea worm disease, promoted safe water use and hygiene, while “scouts” traced new patients. The project organised village contact drives, showed women how to filter water, installed new handpumps and wells, and undertook other activities. The debilitating disease was effectively eliminated.
Historically, social processes and their results related to water supply, sanitation and decentralised development have been labelled community participation, health/hygiene education (or promotion) and community management. UNICEF currently uses somewhat

Learning from Experience
52
different terms and concepts in different settings: “communication and social mobilisation” when applied to sanitation and hygiene and “Convergent Community Action (CCA)” for improving the response and service provision from social service departments and communities. Communication and social mobilisation has existed as a programme for some 15 years. CCA is quite new—its strategy paper was published in 1997—and it is still in the development stage. Hence more is known, and written here, about the communications approach, although the CCA approach is also discussed.
The current UNICEF WES programme uses a combined strategy of mass information, through printed materials and mass media, and personal contacts, through community mobilisers, to promote safe use of water and better sanitation and personal hygiene. There is a strong emphasis on the production and distribution of printed and audio-visual materials, as part of the IEC process. More recent thinking has looked to social marketing, community management and CCA.
Community Participation Community participation made its first limited appearance in WES after it was noted that well drilling stopped as soon as water was found. As a result, wells drilled during the monsoon fell dry when summer came and the water table dropped. The programme thus set minimum standards for well depth, casing depth and yield, and introduced a well completion certificate. A Sarpanch (the politically elected village head) signed the village’s certificate that attested to the number of drill pipes used in well construction. This established an early system of accountability by the implementers to the stakeholders. It worked well when the Sarpanch had the users’ interests at heart, but was not universally effective.
Later on, well siting involved consultations with a larger group of villagers, usually men. However, consultations were never required, and depended largely on the individual engineer. An evaluation in 1984 found that in 80 per cent of the sampled cases, the selected site was acceptable to users; in 20 per cent, it was not. Whether this had any links with social processes is not clear: the study looked only at results and did not link the findings with information on whether consultations took place and with whom.
Handpump development has brought new problems of maintenance and repair, as described in Chapter 3, as well as efforts to seek ways for communities to take on more of the O&M. UNICEF has supported the development of community-based handpump maintenance. The work has been researched and documented in over twenty reports. There is, however, no clear and comprehensive definition of user participation in the whole project cycle. The focus has always been on maintenance and repairs, rather than on a systematic approach to jointly plan, design and operate a community-managed water system. In Tamil Nadu, for example, the team saw that community water systems include other locally present water sources and distribution systems, including traditional systems and, where relevant, piped supplies. A comprehensive strategy for community involvement in water management still remains to be developed. The present approach does not yet span issues of technology choice, site selection, local maintenance, and management and financial planning with women and men. It also does not yet address implementation with equitable distribution of benefits and burdens to all or monitoring of effectiveness and impacts of processes and results. To achieve UNICEF’s objectives, the strategy must also incorporate both a gender and poverty perspective. Attempts have been made to incorporate this perspective, but have not led to a clearly formulated and systematically applied strategy that reflects UNICEF’s objectives.

Chapter 5: Social Aspects of WES Services
53
Gender Perspective in Water and SanitationGender perspectives are critical in defining the problem to be solved, and the approach to its solution. The evolution of WES participation strategies implicitly recognises the need for a gender perspective, but this recognition has not translated into much change.
In operational terms, women have been involved in voluntary maintenance and repair of handpumps, if not in decision-making and management. In a limited number of examples, women’s role in water supply has since widened to include that of village or area handpump mechanic. Providing women with training and local handpump maintenance and repair positions reduced a previous problem that when a new water system came in, all training and jobs went exclusively to men. It has also ensured that women—with their traditional roles in water, their greater personal interest in a reliable water supply, and their daily visits to pumps and taps— have direct opportunities to influence the quality of the service.
Yet, the WES programme must start to address gender issues in terms of the sharing of burdens and benefits between women and men. In the terms of the Gender Issues Network of the Water Supply and Sanitation Collaborative Council, a gender approach looks at the balance between women and men by asking such questions as —
• Who has access to information? Men, women or both?
• Who does physical work? Men, women or both?
• Who makes decisions? Men, women or both?
• Who gets benefits: water, training, jobs? Men, women or both?
• Who controls benefits: services, income, and training? Men, women or both?
Box 5.1: Making WES Services Gender Sensitive
These questions were used in a UNICEF training session to make WES services more responsive to the needs of women and men:
• Does the project lead to improving access to safe drinking water and sanitation?
• Do women have a say in planning, implementation and management of water resources?
• Have training programmes included time for women to analyse their position in society, the burden associated with water, and its implications for education of girls?
• Is the community aware of the injustice of the burden?
• Have they encouraged their sons to share responsibility with their daughters?
• Have men shown some responsibility?
• Is the technology “woman friendly”?
• Can women maintain water systems?
• Are there any sustainable mechanisms/organizations to maintain the system once the project is over?
• Is the community involved in planning and implementation?
• Has the project explored the potential of using the intervention as an opportunity for gender-sensitisation of service providers and the community?
Source: UNICEF-WESS training presentation, Rajasthan

Learning from Experience
54
• Who has access to information? Men, women or both?
• Who does physical work? Men, women or both?
• Who makes decisions? Men, women or both?
• Who gets benefits: water, training, jobs? Men, women or both?
• Who controls benefits: services, income, and training? Men, women or both?
The evaluation team found that this conceptual side of gender issues, rather than the simple participation of women, has yet to gain ground. Expertise on gender and natural resources management is available in some field offices and some WES staff have started to demand this input (see Box 5.1). However, the workload of these specialists in their own programmes is high, and training in operationalising a gender approach in WES projects has not been followed up by field visits to help apply these concepts on the ground. It is thus not known if the guidelines presented in training are followed in practise. Even where both women’s participation and a gender approach are practised, it is not yet consistently implemented, as is illustrated by two examples:
In Tamil Nadu, UNICEF and the State Water and Drainage Board (TWAD) have jointly undertaken an R&D project to modify traditional water use. Although the villages are meant to manage the new systems, they have not been involved in the local selection, planning and management of the project. Rather than assessing demand for these improvements among the communities, the “target” villages were selected by outsiders, and villagers were paid for work they would normally undertake themselves. The State UNICEF officer in charge of health and community has expressed reservations about these arrangements, as they are neither demand-responsive, nor reflect a gender-sensitive understanding of community participation.
In Rajasthan, a fluoride control pilot project involved the training of female handpump mechanics. The training recognised women as principal water managers and gave them more equal access to new technological knowledge and paid jobs. Yet, in the same area, men have taken on the paid job of testing the drinking water for fluoride contents after (unpaid) home treatment by women. While women have learned new water treatment skills, the management and control of that skill has passed back from women to men.
Finally, in Tamil Nadu, a meeting took place with some 25 women and members of the evaluation team. The women have maintained the handpumps in their villages for the last six years, primarily changing washers and preventing rust formation. The work is voluntary and depends on when the women are available, as the lifting of the pump rods has to be done by a group of seven. Calculations based on changing washers twice a year (although three or four times may be necessary, depending on the intensity of use) showed that the group may spend five to six working days on preventive maintenance per year. Male leadership does not consider this work should be paid for, as the project was set up to have voluntary maintenance by women. Some men even expect the women to pay for the washers. Men perform other tasks in community water supply and sanitation, such as operations of the piped water supply and solid waste removal, for which they are paid. The women believed that if their work were done by men, it would be paid work.

Chapter 5: Social Aspects of WES Services
55
Strategies and Activities for Behavioural Change
Information, Education and Communication (IEC) In UNICEF’s WES programme, the production and diffusion of educational material is very visible, although it is difficult to determine its share of the budget. Currently available IEC materials include some 200 booklets, pamphlets, posters, videos, manuals and other materials, all produced and disseminated in large quantities. Three-quarters are visual or audio-visual, and one-quarter is written. Most is for use at the community level.
The evaluation team analysed the materials in terms of language used, message development, and local production (presented more fully in Annex 8).
Languages used
The evaluation showed that 18 per cent of the IEC materials are in English, 48 per cent in both Hindi and English, and 34 per cent are also available in a local language. Thus, the complaint by a few respondents and interviewees that the programme has too many documents in English is not corroborated by the above data. It is true, however, that the more extensive material is generally in Hindi and English. Guidebooks and training manuals are predominantly published in English and therefore can only be used by English-speaking staff. Many of the videos, however, are training videos, and these are either bilingual (16) or in Hindi (12).
Message development
The greatest focus in the materials is on health and hygiene (52 materials, 25 per cent of the total). Water and sanitation technologies come next, with 18 per cent and 12 per cent respectively. Community participation and the use of participatory tools and techniques are under-represented in the WES collection or in the villages visited, with the exception of handpump maintenance by women mechanics. Relatively few WES IEC materials focus on standard health knowledge, which by now has much increased in India; the emphasis is rightly on improving conditions and practises. Yet motivational factors other than health, such as status and privacy for wives and daughters, are hardly reflected, although these are known to be major reasons why both women and men in India and elsewhere support sanitation.
UNICEF materials promote seven broad areas of sanitation and hygiene: safe disposal of human excreta, adequate personal hygiene, safe handling of drinking water, safe disposal of waste water, safe disposal of solid waste, good home sanitation and food hygiene, and a clean public environment. The evaluation found, however, that these categories are so broad and general, each state or district programme can pick its own emphasis and include its own idiosyncrasies. It then becomes very difficult to compare results and effects against costs. Nor are all subject areas equally important for an impact on health. Given the UNICEF special mandate to focus on children, a priority focus on the most important risk factors (safe disposal of child stools and appropriate handwashing) and the measurable reduction of these risks would be more cost-efficient and effective than trying to improve too many unsanitary conditions and practises at the same time.

Learning from Experience
56
UNICEF and government staffs are largely responsible for the choice of themes and the formulation of messages, rather than community members themselves. As a result, choices are imposed from above rather than based on community analysis, although there are exceptions. (For example, local villagers in Dungapur, Rajasthan, developed the wall slogans shown in Box 5.2.) Messages are also the same for all population groups. In practise, the habits and living conditions, and the possibilities to influence and improve these conditions and practises, are not the same for all. Important differences exist between groups with different socio-cultural (religious, ethnic, gender) and economic conditions. These are sensitive issues and the UNICEF tendency has been to avoid the tailoring of message content to the respective user groups.
Box 5.2: Locally Developed Wall Slogans in Villages in Dungapur
• Clean water and clean air will prevent 100 diseases
• We shall go house to house and we shall get rid of guinea worms
• Inform about guinea worm patients before rupture of the blister and get Rs. 500
• Use iodised salt and prevent mental retardation
• It is your responsibility to keep mothers and children healthy
• Use waste water in your kitchen garden
Local production
Although the evaluation team did not analyse materials produced by UNICEF field offices together with their state and district level partners, the impression from the team’s fieldwork is that participation of service staff in the design and production have increased, along with adaptation to local conditions. While local participation in design has increased, local cost sharing has not. After many years, UNICEF still finances 100 per cent of the initial cost of IEC materials, although the GOI and NGOs have funded large-scale re-printing of the same or modified forms of some materials. A gradual increase in cost sharing for educational materials would encourage districts and states to plan and budget for them. UNICEF could then shift its support to the pre-testing of materials and messages that focus on behaviour change, and to evaluating programmes that use these materials on their cost-effectiveness. These are more urgent priorities that make better use of UNICEF’s comparative advantage and resources, now that local production capacity is established. At present, pre-testing is done in only some cases, yet authorities in the field view it as an essential pre-requisite for effective material development.
The evaluation team could not assess to what extent training documents and videos have been effectively used in the field. The team did, however, make efforts to assess whether promotion materials were available at the community level. The emerging picture was rather variable. In Periyar, Tamil Nadu, and in the some areas visited in Rajasthan, health workers and village animators generally had some IEC materials on water and environmental sanitation. Often these had been supplied years ago, and, after much apparent use, were still treasured and cared for. Elsewhere, in Alwar in Rajasthan, the material was hardly visible in primary health centres and subcentres. The visited angawadis (nursery schools) in Periyar and other parts of Tamil Nadu had none and would benefit greatly from access to materials of the learning-by-playing type.

Chapter 5: Social Aspects of WES Services
57
Gender is a cross-cutting issue, and it was not possible to go through all the materials to see to what extent gender issues are incorporated. In the reviewed materials on health and hygiene, however, men’s roles were mainly absent or confirmed existing gender stereotypes. The emphasis was on women’s work in health and hygiene. Culturally women are often limited in the degree to which they can change male hygiene behaviours. It would therefore help if UNICEF education materials and programmes also addresses men’s roles in personal and community hygiene and helped women and men analyse and appreciate gender relations.
Person-to-Person Contacts Mass media do not change health practises; motivators do. Mass campaigns, involving media and village contact drives and camps, are therefore backed up by person-to-person contacts. WES projects can engage, train and equip local motivators to visit families and promote the adoption of improved sanitation and hygiene. The many UNICEF evaluations (a sample of which are reviewed in Annex 8) that have been carried out have generally indicated some change for the better, but they have not assessed the longevity of the changes, with what inputs, or at what cost.
At the same time personal visits are very labour-intensive and results can be slow. Several evaluation reports in the mid-1990s, for example, indicate that three or four visits were required for every adopted latrine. Slow results are especially common where local conditions do not foster a demand for improvements for reasons unrelated to health, such as privacy and status.
There are other disadvantages besides slow results. Most promoters are only taken on as temporary staff and are laid off at the end of a project. The government fears that otherwise they will become permanent members of the government payroll. While such concerns are understandable from an administrative point of view, valuable resources and training investments are lost. Moreover, the approach fails to build capacity in a community to assess and manage its own environmental sanitation and hygiene conditions.
Alternative Approaches: Social Marketing and Community Management UNICEF has used this combination of mass media for awareness raising and personal contacts for behaviour change for many years and has not planned for any changes. Yet re-examination would be useful, since two more recent developments show promise of equal or better results at a lower cost: public health communications, also referred to as social marketing, and community management of hygiene and sanitation improvements. Social marketing adapts marketing techniques to focus on a few key behaviours of a target audience that can be measurably changed. If involved, an external agency usually takes on an active role in the design, implementation and monitoring of the intervention. In the community management approach, a local organisation (e.g., a village water and sanitation committee, a health committee or local neighbourhood group) begins with an assessment of the problems of environmental sanitation, water use and hygiene. They then plan, implement, manage and monitor selected priority improvements using mainly local resources. An external agency acts only as a facilitator and trainer.
It would be worthwhile to try out these alternative strategies in the near future and compare them with the current approach in terms of costs and results. Public health communications would be particularly useful to test as part of, or linked to, GOI’s upcoming campaign promoting sanitation and hygiene in almost 60 of the country’s sector reform districts. UNICEF has been

Learning from Experience
58
closely involved in the development of this programme and will continue its involvement during implementation. The use of the most cost-effective approach is therefore very important.
Convergent Community Action (CCA) CCA is based on the philosophy that local conditions in need of improvement are not compartmentalised but interact and influence one another. For example, gender relations and concepts affect the position of women and girls, which affect girls’ access to education. Access to education in turn is constrained by the time available to women and girls for schooling, which depends upon (among other things) the presence of a good reliable water source near the home. Similarly, a school in the local community and the availability of sanitation in it has a bearing on continued school attendance, especially by girls reaching puberty. More education for women and girls has a positive influence on the size of the family, the adoption of sanitation and hygiene practises, and thus upon better family health. Hence action to achieve these improvements needs to be convergent and mutually strengthening.
In the field, CCA appears to have progressed better in making women aware of their rights vis-à-vis government services than in increasing the capacity of villagers to manage related local services. This part of the strategy is not sufficiently clearly conceptualised. Overall, the approach is too new for the evaluation team to assess its effectiveness. While promising, CCA needs the experience of further testing.

59
Chapter 6: Cost-Effectiveness Issues
Introduction The Terms of Reference of this evaluation call attention to the issue of cost-effectiveness: How cost-effective have programme interventions been in the areas of drilling rig development and operation, handpump development and maintenance, sanitation programmes and hygiene promotion?
Rigorous quantitative answers to many of these questions are not possible, because of both methodological complexity and insufficient data. The major methodological issue arises from the very definition of cost-effectiveness: the comparison of relative costs of different options to achieve the same result. The overriding principle must be one of comparing “like with like”, yet many of the most interesting comparisons are in fact between options that are not directly comparable. This is particularly true where one of the options has been tried and tested on a large scale while the other is hypothetical—such as “surface water vs. groundwater” for rural water supply—or when different levels of service are provided.
The issue of insufficient data is straightforward: the historical data on comparable costs and options required for rigorous cost-effectiveness analysis of UNICEF WES programme support are simply not available. Sufficient data and experience are available for a more qualitative assessment of various technological decisions made, which are reflected throughout this report. Such assessments generally support the contention that fundamental decisions about water supply technology selection (e.g., drilling and handpump design and standardisation) appear to have been quite sound. More recent initiatives in water supply technology (e.g., hydrofracturing and TMCs) are certainly plausible, but need further evaluation.
The team concluded that while the UNICEF WES staff clearly bore costs in mind over the years, there is no evidence of formal cost-effectiveness analysis as part of the regular planning process. In the 1990s, UNICEF employed local consultants to develop a computer programme named WESCOST for cost analysis of drilling rigs, handpumps, and village water supply, but, like similar tools developed in other organisations, it was not widely used. UNICEF is not alone in its apparent reluctance to employ rigorous cost-effectiveness analysis; in the team’s experience, most external support agencies (ESAs) consider costs at various stages of the project cycle, but without employing a rigorous methodology of cost-effectiveness appraisal.
This chapter uses the data at hand to focus on cost-effectiveness in comparing handpumps versus powerpumps. Annex 11 also explores economies of scale in borehole construction and the feasibility of cross-subsidy to ensure improved access to water supply for the poor as a result of the emergence of “mixed” powerpump/handpump systems. A further point of interest: a borehole in Africa costs from $6,000 to $20,000, depending on location and conditions. A similar borehole in India costs $1,000. If a borehole cost even $3,000 (still much less than elsewhere), the investment in India would have been $9 billion instead of $3 billion, and coverage would be far less. Reasons for the low cost are: 1) the magnitude of the program me and its economies of scale; 2) concentration on numbers and service delivery; 3) sensible specifications and standardisation; and 4) high level of competence in the GOI and the private sector.

Learning from Experience
60
Comparison between Handpump and Powerpump Schemes Powerpump schemes have emerged in recent years as a common solution to water supply problems of rural communities. Powerpumps appeal to planners and community leaders because, unlike handpump schemes, they allow for individual house connections where finances and groundwater availability permit. This has implications for financial sustainability, as experience in India and elsewhere has shown that it is easier to collect fees for water supplied directly to the home than from public standposts. Some of these choices are explored in the next section, after a comparison of relative costs.
Cost per Capita If the “number of people served with water supply” is considered as the “output” on which different approaches are to be compared, then the comparison between powerpump and handpump schemes depends critically upon the population served. The per capita costs of handpump options vary inversely with the population that is assumed to be served by each handpump. Once this “population served/handpump” is fixed, however, supply costs increase linearly with population, and per capita costs remain fixed. In other words, if each handpump is assumed to serve 125 persons, it costs 10 times as much to serve a community of 1250 with 10 handpumps as it does to serve a community of 125 people with one handpump. In determining per capita costs from handpumps, the most significant question is how many people are served per handpump.
Powerpump schemes, by contrast, show economies of scale; per capita costs decrease substantially with increased community size. Powerpump schemes involve significant fixed costs that are shared over the served population; as the served population increases, the per capita cost is lowered.
Figure 6.1 demonstrates the variation in per capita cost with community size for both powerpumps and handpumps. On the basis of per capita cost, handpump schemes cover more people at lower cost than powerpump schemes for communities with fewer than 4,500 people.
Such a comparison does not reflect any difference in the levels of service provided to consumers. Here the team found substantial differences between the potential of powerpump schemes to deliver better service and their actual performance under current institutional and financial arrangements.

Chapter 6: Cost-Effectiveness
61
0
50
100
150
200
1000 1500 2500 3500 4500
No. of persons in Village
Annual cost
Rs./Capita
250 persons per Handpump125 persons per HandpumpPowerpump
Figure 6.1: Annual Cost/Capita of Handpumps and Powerpumps
Cost per Cubic Metre It is also revealing to consider cost-effectiveness in terms of cost per cubic metre rather than cost per capita (Figure 6.2). This, too, shows that powerpumps demonstrate substantial economies of scale, while increased demand for capacity from handpump systems are practically met through a linear increase in the number of handpumps. The major difference between Figures 6.1 and 6.2 is the population size at which powerpump schemes become competitive with handpump schemes is lower. This is because water consumption from the powerpump scheme is higher, under the assumption that approximately 40 per cent of the users have house connections and are thus consuming 50 lpcd. To the extent that powerpump schemes increase consumption through the provision of house connections, they are also likely to achieve higher health benefits.
Although a cost per cubic metre comparison is more favourable to powerpump schemes, it is still clear that handpumps are more cost-effective for smaller communities. Indeed, if one assumes a population per handpump of 250, powerpumps only become competitive on a per cubic metre basis in communities with populations greater than 4,000.
This discussion illustrates the methodological difficulties of cost-effectiveness analysis for alternatives that provide different levels of service. From the point of view of a focus upon the poor, however, it can be argued that per capita cost is more relevant than other indicators that reflect higher levels of service enjoyed by some, but not all.

Learning from Experience
62
Figure 6.2: Cost/Cubic Metre of Handpumps and Powerpumps
0.0
2.0
4.0
6.0
8.0
10.0
12.0
1000 1500 2500 3500 4500
No. of Persons in Village
Rs/ CubicMetre
250 persons per Handpump125 persons per HandpumpPowerpumps
Economics for a Balanced Alternative In reality, field visits clearly established that communities do not choose between handpumps and powerpumps. Communities with powerpump installations still have handpumps, and not just for historical reasons. In some cases, handpumps serve as a backup when the more complex powerpump schemes need repairs; in others, the distribution pipes of the powerpump scheme do not reach certain portions of the community because they are remote or disadvantaged.
Effective cost recovery from house connections in powerpump schemes is not yet a reality in most of India. Its implementation can result in a substantial improvement in the reliability and long-term viability of the water supply, of direct benefit to those who are connected. Of equal importance, such cost recovery may permit cross-subsidy of public waterpoints by people fortunate enough to afford individual house connections.
The water supply sector in India is moving towards effective cost recovery from domestic connections. While such cost recovery offers much promise in promoting financial sustainability, better and more reliable performance, and increased social equity, two important conclusions of relevance to this evaluation emerge:
UNICEF’s past focus upon handpump technology (as opposed to powerpump schemes) has been entirely appropriate in ensuring the provision of service to those most in need in a cost-effective manner.
Given that water supply in the future will involve a mixture of handpumps and powerpumps, UNICEF’s work in rural water supply may be most helpful in supporting the government’s efforts to address the issues of technical, financial and institutional sustainability under Panchayati Raj. Like cost recovery, decentralisation offers great promise, but local institutions need support in turning the promise into reality. There are many ways in which both increased cost recovery and increased decentralisation can distort the priorities with which the most urgent and basic needs of the poor are met.

63
Chapter 7: UNICEF Impact on Rural Women, Men and Children
Introduction A thorough impact study of the UNICEF WES programme in India would need to cover a wide range of physical, social, cultural and economic conditions to begin to approach some kind of meaningful representation of the whole. In any event, without a clear baseline and distinction between UNICEF and GOI policies and programmes, establishing overall UNICEF impact on WES in India would be extremely difficult. Such an assessment was not possible within the timeframe and resources of the present evaluation.
Instead, the evaluation team looked at the impact of UNICEF on its primary stakeholders: rural women, men and children. The findings summarised below should be taken only as an indication of the kinds of effect that the UNICEF programmes may have achieved on the ground, particularly as distinct from the GOI programmes by themselves. What follows, and what is shown more fully in Annex 12: Participatory User Assessment, does not take account of major, but indirect, impacts where UNICEF pioneered approaches that were adopted by the GOI, such as UNICEF influence on such solutions as borehole drilling and the India MKII handpumps. Also making the effort to differentiate between UNICEF and non-UNICEF districts more difficult is the fact that the GOI adopted many of the successful approaches that UNICEF pioneered, thus narrowing the differences between the two types of districts.
This chapter summarises the participatory user assessment conducted by the independent Socio-Economic Unit Foundation under the evaluation team’s supervision in Tamil Nadu and Rajasthan. The assessment covered 18 communities located in two districts in the two states. In each state, one district was chosen where UNICEF has long been active in WES and one comparable district was chosen in the same vicinity where only the GOI has carried out WES programmes. Women, men and school children joined the study team to assess the impacts of the UNICEF programme on water supply, sanitation, hygiene, diarrhoeal disease control and their lives in general.
Summary of Impact The results of this assessment suggest that UNICEF has made a modest start in influencing the sanitation and hygiene practises of its primary stakeholders. Men and women in the villages reported that, compared to the past, water supply has improved. This has led to more water use and better personal and domestic hygiene. Other, more general improvements in the 30 years of the UNICEF programme are:
• better education, including for girls;
• better health care facilities in some places;
• a less restricted life for women, although not in more conservative communities that also have strong caste restrictions.
The extent to which all these changes are inter-related is, of course, difficult to establish; it is important to note, however, that the people themselves view these changes as linked.

Learning from Experience
64
The assessment also shows a very slight but consistently better situation in excreta disposal and some signs of better handwashing in communities assisted by UNICEF’s CDD-WATSAN programme. Mothers in some villages practise traditional methods of safer disposal of infants’ stools, but these are not promoted by the programme. Practises of women have been addressed more directly and relatively more effectively than those of children and men. Promotion of hygiene has not yet made the shift from transferring theoretical understanding to helping women and men identify their own risky conditions and practises and making measurable self-improvements.
Promotion of ORT has been practical, quite successful, and one of the strongest features distinguishing communities assisted by UNICEF. Most women say they know the method, have easy access to it and use it when their children have diarrhoea; they say it has drastically reduced diarrhoeas. (In fact, from a medical perspective, ORT reduces the dehydration from the diarrhoea and its often fatal consequences, but does not actually reduce the transmission of the disease.) They can also effectively demonstrate preparation of oral rehydration salts.
Both the UNICEF and non-UNICEF school sanitation programmes visited did not appear successful. Success in school latrine programmes requires a number of conditions: the programmes should be demand-based, with schools and parents contributing; the ratio of facilities to girl and boy students are adequate; and the school (teachers and students) accept responsibility for the management of use and maintenance. These conditions were not present in the school programmes evaluated in both Rajasthan and Tamil Nadu.
Specific Findings
Drinking Water Supply In the eight villages visited in Rajasthan, drinking water conditions were much the same, whether or not UNICEF had been involved. Rather than indicating a lack of impact of UNICEF, this demonstrates the extent to which the GOI has taken up the approach that UNICEF helped develop, so that initial differences may have disappeared over time. At the same time, this constitutes a challenge for UNICEF, in that it may be difficult to show the impact that UNICEF has had.
Access to water via handpumps is generally good in all communities, although in several instances less so for people in isolated hamlets with little political clout. Women and men said that men make the major decisions about water systems, such as where to locate handpumps or taps. In one UNICEF-supported area, women are starting to demand a voice in where to locate water points. Villages with a UNICEF CDD-WATSAN project in place report that the functionality of water supplies are good. In addition, an NGO engaged by UNICEF to work in these communities has started to form village water committees and train community mechanics and caretakers. These positions often go to women, which gives them access to technical skills and administrative control over their drinking water supply (provided the water committees are effectively linked to the Panchayats). However, they are voluntary positions and may keep women from work that is directly compensated.
All study villages in Tamil Nadu have piped water supplies, handpumps, and often a well or other traditional source. However, the quality of the installation and of the service are better in the district with a UNICEF programme. Yet, the women and men who took part in the assessment sessions in Tamil Nadu were poorly informed about CDD-WATSAN, handpump

Chapter 7: UNICEF Impact on Rural Women, Men and Children
65
maintenance and other projects in their community. They said that government officials and political leaders make major decisions on services, choice of technology and location of facilities without consulting community members of either sex.
Sanitation Although generally still poor, the disposal of human excreta is slightly better in UNICEF-assisted CDD-WATSAN districts in Rajasthan. Some latrines are in use, and women reported that children and adults are using them. In the district without the CDD-WATSAN programme, progress is less visible. Three villages have no latrines. In another village, about 80 per cent of the households have latrines installed under the RCRSP, but villagers said they were afraid the latrine pits would fill up and do not use the latrines.
Tamil Nadu shows a similar lack of progress in the safe disposal of human excreta, with slightly better progress in the UNICEF-supported district. In two communities, 50 per cent or more of the families have a latrine, although usage is low. Several of the Panchayats in the CDD-WATSAN area have taken initiatives to improve public sanitation, such as provisions for drainage and collection of solid waste from households.
Hygiene Women in the UNICEF-assisted district in Rajasthan said they use about 30 to 50 pots of water per day. With an average household size of six, this works out to water consumption of up to 50 lcpd. Women in the UNICEF-assisted district also exhibited slightly better handwashing practises than in the non-UNICEF district. Knowledge about the need to wash hands after defecation and before eating is high, but in the limited time available, the assessment could not determine how often this actually takes place. However, the fact that the presence of ash and soap was readily demonstrated indicated that better behaviours are to some extent practised. Practises of children and practises and responsibilities of men in hygiene were unclear.
In Tamil Nadu, the UNICEF-assisted district also has higher water consumption than the non-assisted district. But risky handling of water continues in both districts. Women’s and men’s knowledge about hygiene is high, but this knowledge is not acted upon in either the UNICEF or non-UNICEF area.
School Sanitation In Rajasthan, the team visited three schools under the UNICEF school sanitation programme and one not under the programme. In the three UNICEF-supported schools, male and female teachers had received training in sanitation and hygiene. In one school, demand for latrines was high, and the school had contributed to the cost of installation. The facility was used, although there was only one latrine and one urinal for the students and teachers. In another school, there was no demand for a latrine and no local contribution. The latrine is neither functional nor used.
In Tamil Nadu, the team also visited schools with and without UNICEF sanitation support. In only one of the UNICEF-supported schools was there much indication of use of sanitation facilities. This school has a School Health Club and the community paid for several water filters used in the classrooms.

Learning from Experience
66
In both Rajasthan and Tamil Nadu, promotion of handwashing practises are promoted as part of the UNICEF school sanitation programme. Using individual pocket voting techniques, the reported use of handwashing with soap in schools in Rajasthan is 20 to 30 per cent for boys and 30 to 40 percent for girls. In Tamil Nadu, results differ greatly by school (ranging from 23 to 97 percent on the use of soap), but are consistently better for girls than boys.
Oral Rehydration Therapy (ORT) An assessment of oral rehydration therapy to control diarrhoeal diseases showed the greatest and most consistent difference between the communities with and without UNICEF support. Mothers in the UNICEF-supported districts in both Rajasthan and Tamil Nadu know about and use oral rehydration salts (ORS), as shown in Table 7.1.
Table 7.1: Understanding and Use of ORS (both home made and by package)
UNICEF-supported district Other district
Women’s sessions Village 1
Village2 Village3 Village4 Village1 Village2 Village3 Village4
Rajasthan
Knowledge
Access1
Skills
Use
+++
+++
+++
+++
+++
-
+
-
+++
+++
+++
+++
+++
+++
+++
-
-
-
-
-
+
-
-
-
+
-
-
-
-
-
-
-
Tamil Nadu
Knowledge
Access
Skills
Use
N/A
+++
+++
+++
+++
+++
+++2
+++
+++
+++
+++
+++
+
+++
no info
+++
+++
no info
+++
N/A N/A
+++ = general + some - none N/A Not assessed 1To ingredients or packages 2Ready made packages only, from health dept.
Changes over Time Using life cycle analysis in which participants look back over one generation, women and men in the UNICEF-supported district in Rajasthan agree that the greatest change they see is that access to water and the health of children have improved. In discussing these changes, the Integrated Child Development Services facilities are perceived to benefit children and mothers. Residents also value their ORT knowledge and skills. According to the women in CDD-WATSAN villages, diarrhoeas are less common and their frequency in the summer and monsoon seasons has been reduced. Home hygiene and food hygiene have improved, but not sanitation and drainage. Water access is poor in some places, and water availability and sometimes quality are inadequate, especially when handpumps break down. In non-UNICEF-supported villages, the two changes over time most commonly mentioned were improved water supply and reduced family size as a results of the GOI’s family welfare programme.

Chapter 7: UNICEF Impact on Rural Women, Men and Children
67
In Tamil Nadu, women and men also mentioned improved water supply as a change from the previous generation. In communities where sanitation has improved, the people view this as a step forward, although irregular water service remains a constraint. The standard of living has also improved. In some communities, more girls attend school than in the past (in one village, all girls now attend), and women attend meetings and social activities more frequently. Women also said they felt more able to stand up against social evils. Although most working women still work as daily wage labour, younger women are seeking more secure jobs. However, in more conservative communities, these changes were not the case.


69
Chapter 8: UNICEF Organisation and Management
Introduction A deep question that cuts across all management and organisation is that of organisational identity. What is the UNICEF WES programme: what is its purpose and mandate, and how should UNICEF work to achieve them? The problem of organisational identity is complicated, as it is for many bilateral agencies and multilateral external support agencies (ESAs), by the fact that UNICEF raises funds and implements its programmes through partners.
In questionnaire surveys, UNICEF partners and staff told the evaluation team that key aspects of UNICEF identity and uniqueness included:
• its focus on the needs of children and women;
• its role as a catalyst and innovator, taking the risks in new approaches that government partners are unable to take;
• its widespread structure (e.g., its field offices);
• its organisation;
• its focus on community-based action and partnership; and
• its long-term commitment to the problems of water and sanitation.
While such classifications are necessarily abstract and broad, they nevertheless set a stage for discussion of the organisation’s structure and function. This chapter examines the UNICEF structure as it relates to effectiveness in water and sanitation, as well as the relationship of the UNICEF-WES staff with their many partners.
UNICEF Structure and Function
Decentralisation UNICEF as a whole is a highly decentralised organisation. Just as UNICEF HQ is not seen to “interfere” in the implementation of country programmes, the Delhi office has strongly devolved programme responsibilities to its field offices. Relations between UNICEF HQ and Delhi-WESS, as between Delhi-WESS and the field offices, seem cordial. Communication flows both ways; indeed, many of the principles identified in the international policy guidelines on water and sanitation published by UNICEF HQ have emerged from the Indian experience. This devolution of both responsibility and authority is reflected in WES, where the Delhi-based staff advise field offices on programme implementation when invited to do so, but do not “lead” the development or implementation of field office programmes.
The evaluation team strongly supports the principle of devolution of responsibility to competent staff close to the field. Arguments in favour of decentralisation include the ability to consider local realities in programme management, greater efficiency and greater responsiveness. Two reasons frequently used to justify tightly centralised organisations are greater coherence of

Learning from Experience
70
policy and practise, and a shortage of appropriate resources that must be shared across the organisation. The first reason does not appear to be a major issue in WES practise for UNICEF: given the vast scale of the Indian subcontinent, involved staff are not surprised that different states have different policies that require UNICEF field offices to adapt general strategies to local conditions. In terms of the second reason, the chief role of the Delhi staff is to serve as a “specialised resource” available to the field offices in the development of projects or the resolution of problems. The evaluation team was impressed with the calibre of Delhi-based staff in their respective fields. A question arose, however, over the mix of WES skills available to field offices from the Delhi-WESS, discussed below under Personnel Issues.
WES in the UNICEF Field Offices WES is only a part of each UNICEF field office’s activities. The field office’s first obligation is the coherence of its overall programme, and WES must be integrated within it. Staff working on WES are accountable to their field office first and foremost, and are encouraged to view Delhi-WESS as a resource, not a taskmaster.
While the evaluation team supports the principle and practise of decentralisation, visits to field offices raised questions about the high demands on staff. A professional working in technical aspects is generally matched with a professional in social aspects in field office WES activities. In some offices, several sectors (e.g., health or education) share one social specialist. On the one hand, the sharing of social experts can strengthen intersectoral convergence; on the other hand, it is easy to underestimate, and pay insufficient attention to, WES social complexities and sector-specific complexities.
WES field office staff face very complex challenges and are responsible for relatively large budgets. Problems may be difficult for staff to manage effectively, given their limited numbers, background and experience. Few technical professionals are conversant with both water supply and sanitation and in both urban and rural areas, since each involves distinct technical issues. Yet UNICEF technical consultants or staff are often called upon to address all four issues, in addition to complex issues of financial and institutional sustainability. Social aspects of water, sanitation and hygiene are similarly complex, and require specialist expertise and experience. Finally, the roles of both technical and social specialists are further complicated, like that of the whole organisation, when they work through partners who all have distinct agendas.
Four values of critical importance to UNICEF need to be carefully balanced, as they are sometimes complementary and sometimes in conflict:
• stability and continuity of employment, to maximise benefits of experience and learning;
• convergence between development themes, to ensure coherence of policy and practise;
• professional technical competence, to ensure value for money; and
• balance, in terms of numerical and gender representation
Balancing these four values in field office staffing, where the need for integration is most acutely felt, is difficult.
No clear policy process guides which activities are taken up with what intensity and by which mechanisms. The process by which WES prepares its contribution to Master Plan of Operations (MPO) is unclear. Many activities are started and few are ever stopped; there is rarely an

Chapter 8: UNICEF Organisation and Management
71
explicit “exit” strategy. The “need” to undertake activities also appears to outweigh consideration of the WES programme’s capacity to perform the task well. Better focus, based on a clear policy, may well give better results, since priorities are essential in an organisation with limited resources. The evaluation team endorses the decision of UNICEF-WESS to study the needs for human resource development (HRD) across the Indian WES programme.
Budgets and Trends
Overall budgets There are historical reasons why useful data on budgets and expenditures on WES activities are not straightforward to collect. The need for budgets broken down by activity is well-recognised, and is reflected in the current effort to introduce programme management information systems (PROMS) in the Indian programme. One crude guide to intentions is shown in Figure 8.1 by the growth in budgets from 1975 to 1995, from various UNICEF planning documents. This does not reflect vicissitudes in actual donor contributions to WES (Supplementary Funds), or the ability to spend whatever budget was eventually allocated.
Figure 8.1: UNICEF Annual Budgets for the WES Programme in India
0.0
2.0
4.0
6.0
8.0
10.0
12.0
1975 1980 1985 1991 1995
Year
Mill
ion
US
$
Budget composition Similarly, a sense of the shift from water to “water and environmental sanitation” can be seen in a comparison of the 1985 and 1995 budgets in Figure 8.2. Even with the increased emphasis on sanitation during the 1980s and 1990s, water supply still dominates in budgetary planning, especially considering that guinea worm control (14 per cent of the total budget in 1995) is largely a water supply and health promotion effort, with little requirement for expenditures in sanitation.

72
Figure 8.2: Comparison of Budgetary Breakdowns, 1985 and 1995
As with sanitation, the budgets for mass communication and social mobilisation seem relatively small in comparison with water supply hardware. The first time a budget line for mass communication is mentioned is in 1985. The initial allocation to communication and social mobilisation in the 1985-89 UNICEF WES plan was less than 4 per cent. From 1991 onwards, it has averaged around 10 per cent. While this is a normal percentage within a general construction programme, it seems low for an organisation that states that it is shifting more towards social aspects in its policy and strategies. How much is actually spent is not clear as data on expenditure were not readily available.
Personnel Issues
Current composition Given the above budget data, it is not surprising that the WES staff profile over the last 30 years has a strong technical flavour. Figure 8.3 shows the composition over time of WES staff as defined by their professional training, and does not necessarily reflect what staff do now. Nevertheless, there are limits to the extent to which engineers can become social scientists, and vice versa.
As reflected in the budgets, staffing inputs related to social aspects in the sector are low. In human resources, only one staff member is assigned to community participation and hygiene promotion, including communication, social mobilisation, and training (for behavioural change). At the time of this evaluation, the position was vacant. WESS has no special designation for community participation and management of local water services and sanitation and hygiene programmes. In terms of staff composition, the section has usually had only one or two social
1995 Annual Budget
IEC/social mobilization
9%Environmenta
l sanitation22%
Guineaw orm control14%
Water Systems
(drilling, hps)38%
R&D evaluation
2%MIS5%
Proj. Support(staf f
salaries/transport)
26%
1985 Annual Budget
IEC/social mobilization
1%
Proj. Support(staff salaries/
transport)26%
R&D evaluation
2%
Water Systems
(drilling, hps)38%
Capacity building
5%
Environmental sanitation
8%

Chapter 8: UNICEF Organisation and Management
73
specialists available. This cannot be simply ascribed to ignorance of the need for such expertise, but rather with the bureaucratic difficulties in changing staff skills and composition, and the changing philosophy on type of staff within the organisation.
In addition there is a particularly strong male bias: the one female professional was transferred out in 1998. (The current situation may be different.) The evaluation team is concerned about the practical difficulties of effective and responsible “outsourcing” for both technical and social-related skills, and the practical limitations of sharing in-house resources with other departments; there is no substitute for in-house expertise in managing outside technical resources. There did not appear to be any experienced backup in Delhi for field office staff in issues of sanitation and hygiene promotion at the time of the evaluation.
Figure 8.3: WES Staff Composition
0%
20%
40%
60%
80%
100%
1970 1975 1980 1985 1990 1995 CurrentYear
Perc
enta
ge o
f sta
ff
Unknown
Others(CommerceEducation/etc.)
S.Scientists
Geologist /Drillers/Engs
Increasing Skills and Balance in WES A number of HRD issues relate to the number, mix and calibre of staff working in UNICEF in general, and in WES in particular. These issues are particularly pressing on the hygiene promotion and participation side, and include the following:
A general UNICEF rule that only 25 per cent of the general funds may be used for its own staff costs. Such a rule does not reflect that a shift from hardware to software is likely to increase staff costs, since the “investments” are staff facilitation and support and not pipes and pumps. The rule may also encourage subcontracting to sometimes less competent organisations.

Learning from Experience
74
A philosophy of sharing social expertise among sectors. UNICEF has social specialists in other sectors who are expected to assist in water and hygiene, especially in the light of the convergence concept. In practise, they have a heavy workload and co-operation is not systematic and structured.
Difficulties in replacing staff whose competence no longer fits the changing requirements of the sector. These difficulties appear to be more cultural than contractual, but are nevertheless very real. More than one staff member candidly implied that the ability to match skills to requirements was hindered by an organisational culture that emphasises job security.
Staff development without much structural support. UNICEF staff development needs have been recently assessed across the region, and a plan and procedures for its support were developed. While improvement in general “effectiveness” and management is strongly encouraged, the high premium on transferable generalist skills actually works against commitment to deepening professional skills in a given area.
Two strategies are frequently cited to reduce the constraint of limited social science staff within the water sector: convergence between UNICEF sectors and partnerships with other organisations with social science expertise. As UNICEF is often involved in related sectors in the same geographical areas, convergence within UNICEF is a logical step to make better use of the available social science expertise. Such a strategy, however, still requires the availability of enough of that expertise. Workloads and schedules must also allow joint activities between sectors among the field staff, as well as joint planning of programmes with communities and their support services with a clear and concrete objectives. Such practises are beginning to develop, with much expected to be learned in one or two concrete attempts at convergence, such as education and WES, or health and WES.
The UNICEF WES policy of pairing staff with technical and social expertise in field offices has varying degrees of success. There are difficulties in filling many posts with the right combination of experience and openness to new approaches. This difficulty is exacerbated by the nature of employment practise within UNICEF, which appears at times to bend over backwards to keep on existing staff rather than recruit external staff whose skills and temperament are more appropriate to the job. Evaluation team members were concerned about the magnitude and complexity of activities of relatively “junior” field staff and saw significant risks for the organisation in the overload of the limited capacity and experience of field officers.
Internal Mechanisms for Understanding Performance Many organisations attempt to improve through understanding past performance. There have been many studies of UNICEF WES projects. The evaluation team collected some 315 such documents, of which 159 were field studies. The team randomly selected and reviewed 39 studies to determine whether and how the WES programme assesses the effects of its projects.
UNICEF has commissioned many small evaluation studies, but these do not reflect systematic assessment of the performance or impact of rural water supply, sanitation and hygiene. There are few, if any, reliable statistics on the access, availability and use of water from various sources under different socio-economic conditions; the number of water sources actually functioning; the output of water actually available from these sources; water quality (both actual and perceived by users); and the use of different volumes of water for drinking, cooking,

Chapter 8: UNICEF Organisation and Management
75
personal hygiene, hand washing, etc. There have also been few systematic efforts, either by UNICEF or by the government, to evaluate the impact of rural water supply or sanitation upon earning opportunities, public health and infant or child mortality/morbidity.
Box 8.1: Seeking Common Indicators
UNICEF studies could test for results on common indicators, which would make the results more useful. In rural sanitation, for example, there is a broad consensus that evidence of results should include data on:
• the quality of installation, use and maintenance of sanitation facilities;
• the practice of disposal of infants’ excreta;
• the adoption of hand-washing practices;
• the breakdown of ownership and use by socio-economic sections, gender and age;
• data on costs; and
• observations on the longer term sustainability of the approach.
Many projects share common objectives and could test for results on common indicators, although actors, strategies and activities would naturally differ locally. While many of the reviewed evaluations looked at some common indicators, there is no systematic set of criteria for evaluation. Agreeing on the common elements and the ways to measure them will make future studies more comparable and give a better indication of what works best where and at what cost. At present, this is not the case, and cost data—apart from some direct costs, such as for various types of latrines—are almost always inadequate. In the promotion of low-cost sanitation, the cost of the promotion itself can be at least as significant as the cost of the hardware, yet these costs are rarely worked out explicitly.
Study quality can also improve in other respects. Many studies have a gender-specific sample, but then do not report data separately for women and men. Comparisons are often geographic and administrative, such as between districts at various locations in a state, without explanations or hypotheses as to why certain districts do better or worse than others do. Comparisons between high, middle and low classes are far less common, yet these data are more useful than a comparison of performance by administrative location. The balance between data presentation and data analysis is always in favour of the former, with statistics given in great and at times excessive detail with little analysis.
The favoured and indeed only method in which the studies assess the changes in conditions and practises is through KAP (knowledge, attitudes and practises) surveys. This method has a number of disadvantages. It is judgmental, as it measures what the project or researcher thinks the people should know, believe and do; when people do not give the intended answers, they are judged ignorant or “non-adopters”. Local insights and alternative practises that may be as valuable for reducing disease transmission risks are not included in these surveys. Since both inputs and measurement of results would benefit from a better and more systematic use of participatory tools and techniques, capacity-building in this subject field would be very relevant.

Learning from Experience
76
The evaluation team’s review established that some field studies were much better than others. The notably higher quality in one UNICEF-commissioned study (V.S. Chahan 1998) appears to stem from several factors:
• selection of a consultant on the merit of previous good quality work;
• detailed and carefully developed terms of reference;
• WES guidance in the information collection process; and
• critical review of the results.
During the analysis, the team attempted to assess which approaches achieved which results. This turned out to be impossible, because very few of the studies described both inputs (i.e., the approaches, actors, activities, funds) and results. At present, field studies are carried out as separate and disassociated activities, without much thinking as to what is measured, how, and why. While many of these studies provide invaluable background, they are inadequate to serve as the basis for impact assessment. This failure points to an important deficit in project management that UNICEF must consider. If the UNICEF WES programme is to remain credible to its partners and supporters, greater effort must go to increasing the quality of its understanding of its performance.

77
Chapter 9: Partnerships
Introduction Partners and partnerships are crucial to UNICEF’s work in the WES field. UNICEF’s original partners in WES consisted largely of PHEDs, as well as a few entrepreneurs and NGOs for technical aspects, procurement and quality control of rigs and handpumps. Since then, the shift in focus has seen a proliferation of work with more socially oriented government departments and NGOs. UNICEF’s partners also include the private sector, research groups and individual WES experts. This chapter discusses the nature of UNICEF’s relationships with its partners and how it has contributed to their capacity. In addition, it examines the perceptions that UNICEF staff and partners hold of the partnerships and where they feel improvements can be made.
Duration and Style Partnership has come to mean many things in development, from ESAs supporting but not being directly involved in the work of others to their shaping a shared agenda of needs and interventions. UNICEF has many different types of partnerships. Its strongest WES partnership is with the GOI, where the relationship goes beyond these commonly accepted standards of partnership in two important ways: the duration of the commitment and its style. A number of responses in questionnaires, interviews and workshops reflect the belief that UNICEF has been a “true” friend in WES activities by working with the government continuously over the last 30 years. Almost all respondents reported that this has greatly enhanced UNICEF access and the credibility of its support and advice.
The style of UNICEF assistance has also contributed to credibility and access. UNICEF MPOs have always been closely identified with the corresponding GOI planning documents. UNICEF has identified components of these documents to support, rather than focus on differences with current national or state practise. Although some ESAs believe they can best support progressive elements within the government through strong public challenges to ineffective policy and practise, the UNICEF style appears to have been a more diplomatic one behind the scenes. Such a style is difficult for an evaluation team to assess. (For example, would government policy have changed anyway or because UNICEF lobbied discreetly in the wings?) However, the team saw little evidence that UNICEF could have achieved its objectives more effectively through more aggressive confrontation on issues of disagreement.
UNICEF Contributions to Partners’ Capacity
Has the UNICEF effort in WES made any difference in the work of its WES partners? The responses from the partner survey indicate that most (46 per cent) perceived UNICEF contributions lie in the institutional support sphere, 32 per cent in technical aspects, 17 per cent in community and health aspects, and 6 per cent in UNICEF administration and organisational culture.

Learning from Experience
78
All partner groups mentioned training and information as the most important contributions from the WES programme to their work. These two categories account for 40 percent of the answers relating to institutional support. Support to project formulation and monitoring and widening people’s horizons were other frequent answers. Under technical support, training to technical staff and access to new and cost-effective technologies were the largest categories (both 25 per cent).
For community and health aspects, the answers were more diverse. Mentioned most are the focus on children’s health, building community awareness, developing operation and maintenance and developing sanitation, each accounting for about 16 per cent of the answers in this group.
Ethics and moral support were mentioned as the two most valued assets of UNICEF administration and organisational culture.
Partners’ Perceptions of UNICEF The strongest UNICEF partnership has been with government departments. Partnerships with NGOs, while fruitful for both, have not been as close. At the April 1999 dissemination workshop on the present evaluation, some NGOs said they felt they were merely “hired” to do the work UNICEF wanted rather than entering into true partnership. One partner noted that “implementation of [pilot projects] was excellent. Follow up has not been so impressive. Using an NGO only for implementing a pilot project does not help. Continued [NGO] involvement in follow-up will be useful.”
The questionnaire survey of partners produced a long list of areas and aspects where respondents thought the UNICEF WES programme can improve. Of the 295 suggestions given, 12 per cent deal with sanitation, 14 per cent with health and hygiene, 30 per cent with water supply and 45 per cent with institutional aspects. (See Table 9.1.) In qualitative terms, one respondent suggested that “in rural sanitation, monitoring can be more effective. Reports should be made more result oriented and evaluations should be more specific in concrete terms.”
The partners also commented on the administrative strengths and weaknesses that influence the impact of UNICEF work. The 60 partners that answered this question (out of a total of 74) together mentioned 156 administrative strengths. Prompt response and feedback (23 per cent), good management (19 per cent) and timely payments (18 per cent) topped the list.
Half of the respondents (37 out of 74) together listed 62 administrative weaknesses. For example, one partner felt that planning, reporting and accounting would be more efficient on a semi-annual, rather than a quarterly, basis. Thirty others said that they had noted no weaknesses and seven gave no reply. Although no one set of weaknesses was expressed by a majority, some respondents identified staff shortages, over-dependency on the Government and other partners, and too much bureaucracy (although others felt that a UNICEF strength was its relatively low level of bureaucracy).

Chapter 9: Partnerships
79
Table 9.1: Areas Where UNICEF Can Improve: Suggestions from Partners
Suggestions by Category No.SANITATION (11% of total 295 suggestions)
Include urban areas Target latrine subsidies – more subsidy: 2, less subsidy:4 Strengthen alternative delivery system, incl. motivators More attention to IEC, scope of components Better monitoring and evaluation, incl. of the strategy Other, not clusterable suggestions
32766634
HYGIENE PROMOTION (14%) More/better support to hygiene promotion A greater focus on schools, incl. Curriculum development More/more specific IEC drives/demonstration projects; use electronic media More publications in other languages than English and Hindi More co-operation and interaction with others Other, not clusterable suggestions
4219
96224
WATER SUPPLY (30%) Increase focus on participation/community management, O&M, cost sharing, gender More new technologies based on geohydrological conditions and no frequent change Support to water resources management, incl. recharge, watershed management, forestation Develop water quality control, incl. community-based monitoring Continue support to supply of equipment and spares, incl. recycling Preserve monitoring and quality control of drilling Other, not clusterable suggestions
8727201311
754
INSTITUTIONAL DEVELOPMENT (45%) Better project planning and monitoring: - Proper selection of implementing organisations, esp. NGOs; informing and involving NGOs in planning; planning for 3 years on a local base; working longer with satisfying NGOs -Improve reporting and reviews, with more regular field visits, more field staff, yearly evaluations with feedback to NGOs and periodic review meetings/fora with GOI and NGOs, half-yearly reports, and a longer follow-up of pilot projects -More independent monitoring, involving NGOs and external experts rather than government -Better MIS and field based data management More and better training: -More effective methods, materials, external trainers, tailored subjects -More with DPHE, other departments, more levels, incl. Villagers -More frequent, longer, timely training, better attendance Good policy context: -Commitment from centre before approaching state; better interaction and co-ordination between agencies, esp. bilaterals, and continuity in policies Promote sustainability aspects in sector -Less implementation by government; stronger policy commitment, but with more/ balanced attention to the needy Improved funding: -Funding to PHEDs continued and direct to NGOs; same policy for both Better documentation and literature: -Better quality literature designed for use, wider distribution and more attention to pollution control, defluoridation; access to international journals Support to improve logistics -Interlinked government stores, back up for community O&M
134
24
23
11
3
139
10
14
9
7
6
5TOTAL 295

Learning from Experience
80
UNICEF Staff Perspectives of Partnerships In its fieldwork, UNICEF has built long-term partnerships with only a few organisations; in most cases, the partnerships are short-lived and project-specific. As observed by some of the partners themselves, such relationships can consequently be more like those between a funder and a contractor, or a client and consultant, than between true partners. Nor is there strong co-operation between organisations that work on the same subject in different parts of the country. When questioned, UNICEF staff mentioned the proliferation of small organisations as the main weakness among NGOs, followed by differences in direction and capacities, accountability, and recognition of/from government.
Asked for suggestions about how UNICEF can improve its work with NGOs, staff most frequently mentioned developing their competence (39 per cent) and helping to build networks (30 per cent). Other suggestions included direct contracting of NGOs without requiring their government certification and using longer contracts with those that perform well (19 per cent) and better information on and streamlining of procedures (13 per cent).
As UNICEF starts to help build NGO networks and to work longer with those that perform well, it will be easier to formulate and define objectives, strategies and inputs as partners in a decentralised but common programme. Fewer partners and closer co-operation will make outsourcing more effective, and reduce the constraints upon skilled staff within UNICEF itself (although these constraints should also be reduced). A closer working relationship and a shared focus within a decentralised programme may also make it easier to define common indicators for monitoring and evaluation of results and impacts, which can be used to enhance the effectiveness of the programme.
Co-operation among Partners Because the financial contribution of UNICEF and other ESAs to the overall WES support is relatively small, the quality of the contribution is essential. Both the GOI and ESAs — including UNICEF—believe that ESAs contribute most through developing and testing new approaches and helping to build capacity. However, the co-operation among ESAs in carrying out these activities is low. Co-operation in practise often means presenting information about each group’s activities at informal and ad hoc meetings, but then ESAs going on in separate ways. Projects that test different approaches in different areas are not implemented under a broader common framework, although they may have common objectives and functions. The impact is therefore limited and localised and does not have the optimal benefits for the country as a whole. The team identified one case where an ESA supported GOI-UNICEF programmes and its own bilateral programmes without a single meeting between the two in three years, despite their common issues. In another case, an evaluation team for one ESA visited the same districts where work had been funded and evaluated by another ESA without reference to the previous work.

81
Chapter 10: Future Directions for the UNICEF WES Programme in India
Introduction How should UNICEF focus its WES programme in the coming years? This question lies at the heart of how UNICEF can most effectively use its resources. The directions for UNICEF’s future work in India are set through institutionalised consultations between UNICEF and the GOI. They are based on the outcome of UNICEF’s situation analysis of children and women and the experiences and results of its ongoing programmes.
Because UNICEF works closely with partners in and outside government, learning the views of these partners, as well as WES staff, was requested in the Terms of Reference and was an important part of this evaluation. It was done through a mail survey to those partners in the GOI, NGOs, and private sector with whom the UNICEF WES programme closely co-operates, as well as with staff. The purpose was for respondents to state, anonymously if they wished, what they think about UNICEF, its present work and future directions. Staff were also asked in the questionnaire about which issues to drop if priorities had to be made.
Partners, staff and the evaluation team share many perceptions about UNICEF’s future directions. All three groups generally agree, for example, that UNICEF’s long history in the India WES programme has resulted in particular strengths in rural water supply coverage, sanitation and hygiene. The three groups agree, as well, that UNICEF can best use this comparative advantage by concentrating on fewer subject areas, particularly in the areas of sanitation and hygiene. In addition, the three groups generally agree that the way that UNICEF can contribute to progress in these areas is through development of new approaches and through training and other capacity-building activities.
Partners’ Perceptions of Future Directions The evaluation team asked partners—including those in government departments, NGOs, and private firms—to rank possible activities that UNICEF could undertake. Figure 10.1 summarises what these different groups of partners believe are most relevant areas for the UNICEF WES programme.

Learning from Experience
82
Figure 10.1: Most Relevant Areas for UNICEF by Partner
Though engineers still rate community-based water supply as very important, they see health
and hygiene as the currently most important subject area for the WES programme. This opinion is even stronger in the other government departments that deal with local government, women, children and health. Sanitation in its wider sense (not only household latrines) also scores high, but generally lower than health/hygiene and water. The exceptions are the centres involved in sector studies and support, which give equal relevance to sanitation and health/hygiene. Development of new technologies is appreciated by all partners and should continue. All types of partners find training and capacity-building an area where support now and in future is very relevant.
Thinking about women and children in India and the best use of UNICEF’s limited resources, partners consider subject areas such as pure latrine construction, water quality control and urban sanitation, and water supply as areas that should not get first priority. Except for NGOs, most say the same about the protection of water resources. A few partners even say that the programme should not deal with some of these subjects at all (see Figure 10.2).
0%
25%
50%
75%
100%
Health
& H
ygien
e
Training/C
ap. B
uild
Dev new
tech
nologies
Rural w
ater s
upply
Total San
conce
pt
Protec
ting so
urce
School S
an
Urban
WS fo
r poor
Latrine c
onstructi
on
Montoring W
Q
Urban
San fo
r poor
Activities
Perc
ent "
Very
impo
rtan
t"
EngineersOther DepartmentsNGOsEntrepreneursOthers

Chapter 10: Future Directions
83
Figure 10.2: Activities That Should Not Be Done by UNICEF, by Type of Partner and Frequency
UNICEF Staff Perceptions UNICEF staff members have many areas of agreement with partners about the most and least relevant areas for the UNICEF WES programme, but also diverge in some aspects. All agree that water quality monitoring and water and sanitation services for the urban poor are now of lower relevance. (See Table 10.1). All give higher ranking to sanitation and to health and hygiene.
Staff differs somewhat from partners in their views of some areas. They give a higher relevance to school sanitation (60 per cent of staff rate this as “very important”, compared with 43 per cent of partners) and lower relevance to water supply (31 percent of staff rate this as “very important”, compared with 66 per cent of partners). In addition, staff gives lower relevance to the development of new technologies (29 per cent of staff rate this as “very important”, compared with 58 percent of partners. Staff also gives a somewhat lower ranking to training of others (44 per cent of staff rank this as “very important” compared with 53 per cent of partners). Although not shown in this table, further analysis showed that male staff give lower relevance to training than female staff. Female staff score health and hygiene, school sanitation, sanitation for the urban poor, and training equally high.
0%
5%
10%
15%
20%
25%
Urban
San fo
r poor
Montoring W
Q
Latrine c
onstructi
on
Urban
WS fo
r poor
Rural w
ater s
upply
Protec
ting w
ater s
ources
Perc
ent o
f "sh
ould
NO
T" re
spon
ses
EngineersOther DepartmentsNGOsEntrepreneursOthers

Learning from Experience
84
Table 10.1: Relative Relevance of WES Activities by Partners and Staff
Partners(in percentages)
Staff (in percentages)
Activity
Very Imp.
Important Total Very Imp.
Important Total
Health and Hygiene 73 22 95 67 7 73
Total Sanitation 54 38 92 58 16 73
School Sanitation 43 41 84 60 13 73
Rural Water Supply 66 19 85 31 29 60
Training and Capacity Bldg 53 27 80 44 22 67
Protection of Water Sources 44 34 78 44 24 69
Dev. of New Technologies 58 18 76 29 31 60
Latrine Construction 28 44 72 20 24 44
Monitoring Water Qual 25 41 66 40 27 67
Sanitation Urban Poor 23 41 63 40 27 67
Water Urban Poor 20 37 57 24 29 53
UNICEF has many mechanisms available to support these areas, from funding other groups’ activities to its own direct implementation. The question of which mechanisms to use in the future is also important. Both groups believe that UNICEF has an important role to play in the development of new approaches and in training, and a very small role in direct implementation. Staff places more emphasis on advocacy. (Although the absolute number of partners who feel that advocacy is a key mechanism is higher than the staff figure, it is important to note that the total number of partner respondents is almost double the number of staff respondents.) Responses from partners and staff are summarised in Table 10.2.
Table 10.2: Key Mechanisms for WES by Partners and Staff
Mechanisms Partners (in numbers)
Staff (in numbers)
Development of New Approaches 51 28
Workshops and Training 52 24
Advocacy 31 29
Direct Implementation 4 3
Funding 43 15
TOTAL # OF RESPONDENTS 74 35
Chapter 10: Future Directions
85
Evaluation Team’s Perceptions The evaluation team concurs with partners and staff that UNICEF needs to focus on the areas in which it has a comparative advantage, such as in sanitation and hygiene, and scale back in other areas, such as water quality monitoring and urban services. Developing and testing approaches on holistic community management of water sources may be an important future direction for UNICEF, as may advocacy in collaboration with NGOs, the Go and the media. A fuller sense of the team’s perceptions on future directions are presented as the recommendations in Chapter 12.


87
Chapter 11: Conclusions This chapter compiles the evaluation team’s conclusions contained throughout this report and forms the basis for the recommendations and lessons learned presented in Chapter 12.
Water Supply 1. UNICEF’s contribution to the development and effective promotion of India Mark II
handpumps and drilled wells has greatly benefited the rural population of India. By 1999, approximately 3 million community handpumps were serving up to 500 million people, extending improved water supply to 95 per cent of the population. These achievements result from effective partnership among NGOs (who originally pioneered these technologies), UNICEF, the private sector and government. The UNICEF initiative to promote DTH drilling in hard rock areas was a sound one and has been well-justified by its widespread adoption and by the overall coverage of rural water supplies achieved.
2. The choice of technology and the approaches promoted by UNICEF have been, as far as the evaluation team could gauge, cost effective. Little or no evidence remains of formal cost-effectiveness analyses performed at the time of key decisions, and the effectiveness of other options not taken to scale is nearly impossible to assess to the satisfaction of both economists and engineers. Nevertheless, India provides safe water to its rural population at a life-cycle (present-value) cost of Rs. 190 per capita, which is very low compared with costs elsewhere in the world.
3. The emphasis on targets, norms and coverage has inevitably reduced the quality of borehole construction. There is, in effect, a balance and trade-off in which a measure of compromise in quality of workmanship can be accepted in return for the massive achievements in coverage of improved rural water supplies. The balance may have tipped too far in favour of coverage, and the quality of borehole construction for rural water supplies appears to be close to the minimum acceptable standard.
4. While there is some evidence for success of the hydrofracturing technique of borehole rejuvenation, uptake has been slow, and further evaluation is needed. Data suggest that hydrofracturing improves borehole yields, confirmed in the team’s field visits. Nevertheless, the technique has not been widely taken up as states have purchased very few of their own units. UNICEF may still have a role to play in producing a comprehensive evaluation of the method (on which GSDA has made a good start) and encouraging and disseminating the method even more widely and actively. Also needed is a systematic evaluation of the tractor-mounted compressor, the other major rejuvenation technology that UNICEF promotes.
5. The full potential and promise of drilling MIS have not been realised. Monitoring systems and associated computer software for spare parts, rigs and plant for borehole rejuvenation have been developed by UNICEF and the government. Turning data into full-fledged management information systems (MIS) has not been fully realised, with significant variability in uptake and usage among states. More detailed technical and cost data are required so that UNICEF can support its advice to the government, and MIS enhancement would provide essential data for such analysis.

Learning from Experience
88
6. In its work on handpump production, UNICEF succeeded in maintaining the essential focus on quality. Thanks to this support, India achieved cost-effective mass production of handpumps while maintaining satisfactory quality standards. In recent years UNICEF has transferred the responsibility for pump quality assurance to Indian institutions. As in drilling, market forces have shifted the focus towards low cost, sometimes with a serious compromise of quality. The team found clear evidence that the quality standards are slipping.
7. India’s groundwater resources are endangered, but the most appropriate role of UNICEF in their defence is unclear. UNICEF has rightly articulated its concern about the impact of uncontrolled irrigation abstraction on rural domestic supplies. However, UNICEF does not traditionally have experience and expertise in the complex field of groundwater resources management. It therefore needs to augment its valuable advocacy role as a trusted voice to national and state governments with soundly based technical information and advice, perhaps through new partnerships.
8. While UNICEF has, with others, pioneered new approaches to maintenance of rural water supply, much work remains to be done. It costs approximately Rs. 4,000 million per year to maintain 3 million handpumps and Rs. 2,000 million to maintain piped systems. The burden on the government is very high and may not be sustained for much longer. UNICEF has supported community-based management, but these efforts have not achieved real change in the field. A comprehensive system for managing and financing water supply maintenance with a clear gender and poverty focus remains to be established.
9. Institutional arrangements for rural water supply management are, in practise, unclear. In a number of states, handpump supplies are being increasingly replaced or supplemented by small and larger-scale piped groundwater systems with both house connections and standpipes. The mixture of pumped schemes with handpump systems can lead to conflicting or overlapping management responsibilities, and inefficient duplication of support strategies.
10. Even with the emergence of powerpump schemes, handpumps still have a role to play, but the lower dependence on them means that less priority is given to their maintenance and timely repairs. In a situation of intermittent electricity supply and seasonal water shortages, it is essential to maintain handpumps as one component of a mix of community systems that include several sources.
Environmental Sanitation 1. UNICEF has been a leader in both advocacy and experimentation for rural sanitation
in India. UNICEF began its efforts in concert with the GOI as the government turned its attention to this critical area.
2. UNICEF has worked hard to establish rural excreta management as part of a broader concept of environmental sanitation. However, while facilities built under pilot studies have been used to greater or lesser degrees, they have not been sustainable outside a programme of heavy subsidy.
3. UNICEF, with others, has pioneered a number of “demand-responsive” approaches to sanitation, with varied results. RSMs, first pioneered in Uttar Pradesh, have had, at best,

Chapter 11: Conclusions
89
mixed success. In contrast, the demand mobilisation programme in Mednipore, West Bengal, has been extremely successful both in generating demand for sanitation and in tailoring the sanitation “product” to what people need and want.
4. UNICEF’s pioneering efforts in rural sanitation in India inevitably experienced some experimental disappointments. UNICEF is to be commended for not only the courage to experiment, but also the wisdom to see the need for experimentation. It appears to the evaluation team, however, that the “success” of some of these approaches was seized too quickly both within UNICEF and the GOI, in hopes of devising a strategy that could be scaled up in the same way as rural water supply had been.
5. UNICEF’s work in rural sanitation is broadly recognised, but its work in the urban sector has been very limited. While UNICEF has also been involved in some urban sanitation projects, these have not been on the same scale as the efforts in rural sanitation, and are inevitably more complex in terms of local government politics, issues of land tenure and interaction with municipal services.
Social Aspects of WES Services 1. While UNICEF policy shifted from hardware to a mix of hardware, social mobilisation
and hygiene promotion many years ago, the shift is far from complete in practise. UNICEF was relatively early in making this shift in India, and the shift has been recognised and supported by its partners. However, there is no clear and comprehensive definition of user participation, which includes issues of gender and socio-economically disadvantaged groups, in the whole project cycle. To date, for example, the focus has been on the transfer of skills and responsibility for handpump maintenance and repair, without considering such issues as compensation, cost recovery, the maintenance of pumped schemes and the social and economic context into which such services must fit.
2. Women’s participation in WES may be greater, but not always fairer, than in the past. Handpump maintenance, for example, has given women technical training and some control over the functioning of the domestic water supply. Yet, these gains are achieved at the cost of women’s time to perform this voluntary work, work for which men could expect to be paid. An equitable division of contributions and benefits between women and men has yet to be achieved, both conceptually and in practise.
3. UNICEF is well known in the Indian WES sector for the large amount and variety of its IEC materials. The emphasis is quite rightly on better conditions and practises in sanitation and personal and domestic hygiene. However, the materials do not address motivational factors other than health. The materials also do not promote other behaviour changes that do not directly affect health, but contribute to the viability of the system, such as community management and cost-sharing. Important questions of gender are also poorly represented in the materials and methods.
4. Promotion methods concentrate on mass media campaigns and person-to-person contacts. While these two methods can be effective, UNICEF has not tried social marketing, community management, and other approaches that may be more cost-effective. In addition, studies on effectiveness of social approaches are of the conventional KAP type, vary in quality, seldom differentiate for gender and poverty, and have little or no information on approaches and costs. Studies that examine results vs. approaches and costs using

Learning from Experience
90
agreed indicators and means of verification for measuring outcomes may give better guidance for programme management.
5. Convergent Community Action is a promising approach to maximise the benefits from improved provision of related services. However, CCA needs further testing in WES. Within UNICEF, CCA is now applied to maximise convergence between many forms of local development: health, education, economic development, and human rights. In the field, CCA appears to have progressed better in making women aware of their rights vis-à-vis government services than in increasing the capacity of villagers to manage local services. This part of the strategy is not sufficiently clearly conceptualised.
Cost-Effectiveness 1. Although UNICEF clearly bore costs in mind over the years, methodological
complexity and insufficient documentation makes rigorous retrospective cost-effectiveness appraisal impossible by this evaluation team. In terms of methodological issues, the need to compare “like with like” means that some of the more useful comparisons cannot be made, such as between an option that has been tried and one that has not. Further, historical data on comparable costs and options are not available.
2. There has not been explicit consideration of cost-effectiveness or cost reduction in UNICEF activities and programs. It is therefore difficult to know how costs affect decision-making, and to reassure donors and partners of the sound economics underlying many of UNICEF’s achievements. Such assessments would be valuable for strategic and programme planning. The increased use of the logical framework methodology within the WES section is a welcome step in the right direction.
3. Using the data available on the costs per capita and per cubic metre of water delivered by handpumps and powerpumps, handpumps are more cost-effective on a per capita basis for communities with fewer than 4,500 people.
4. In addition, more qualitative assessments generally support the contention that fundamental decisions about water supply technology selection have been sound.
Impact on Users 1. UNICEF has made a start on improving the sanitation and hygiene practises of the
“primary stakeholders”, the villagers themselves. Men and women in the villages assessed reported that, compared to the past, the water supply situation has improved. In particular, this has led to more water use and better personal and domestic hygiene. Other improvements they cited about the UNICEF programme include: better education; better health care facilities in some places; and a less restricted life for women in many less conservative communities. The nature of GOI-UNICEF co-operation, however, makes it hard to distinguish between original UNICEF contributions and GOI upscaling of these contributions.
2. Many communities are shifting to piped water systems, rather than relying on handpumps. Piped supplies may not always be a significant improvement if installed and managed under present procedures and institutional arrangements. Community participation in O&M remains low under both piped water and handpump supply systems.

Chapter 11: Conclusions
91
3. Small but significant differences exist between districts with and without UNICEF WES support. CDD-WATSAN communities are slightly better in excreta disposal than communities not assisted by UNICEF and show some signs of better handwashing. Practises of women have been addressed more often and more effectively than those of children and men. Promotion of ORT has been practical and quite successful in UNICEF-assisted districts.
4. School sanitation efforts are only successful where they are demand-based. Necessary conditions appear to be that both schools and parents contribute, the number of facilities for both girls and boys are adequate and the school itself (through teachers and the school health club) manages facility use and maintenance. In general, the UNICEF-supported school sanitation programme has not been very successful in the areas studied.
5. Both women and men mention improvements in rural water supply as the greatest achievement they have seen during this generation. Better access to education, including for girls, was also prominent in their life cycle analysis. The degree to which changes in women’s status over time was viewed as an achievement depended on the community, with more progressive communities seeing this an improvement.
UNICEF Organisation and Management 1. UNICEF is strongly decentralised, with a commitment to the principle of ensuring that
competent staff closest to the work are free to manage in light of the conditions and constraints that they know best. This principle is applied in cordial relations between the Delhi-WESS and the field offices, and also between UNICEF New York and the Delhi-WESS. The trade-offs involved between strongly centralised and strongly decentralised organisations are well-known; some of the difficulties faced by UNICEF-WES in focusing its work stem from the staff’s diverse portfolio of projects.
2. The budget allocated to social aspects (approximately 10 per cent of the total UNICEF WES budget) does not seem sufficient. This is especially true given UNICEF’s stated goal to focus more on these aspects of WES services. In addition, the general rule that only 25 per cent of general funds be used for staff costs impedes investment in capacity, since staff facilitation and support, rather than pumps and pipes, are the primary investments to improve the social aspects of WES services.
3. The shift from a technology-only approach to a team approach that encompasses both technical and social aspects requires high-calibre staff. This requires the recruitment and development of professionals from different backgrounds who can understand both the language and concerns of other disciplines. The UNICEF WES policy of pairing staff in field offices has varying degrees of success. There are difficulties in filling many posts with the right combination of experience and openness to new approaches. An organisational structure that emphasises job security also can make finding the right people to take on new challenges difficult.
4. The staff profile in the Delhi WES section is also of concern, given the increased emphasis on behavioural and organisational aspects. The evaluation team is concerned about the practical difficulties of effective and responsible “outsourcing” for both technical and software skills, and the practical limitations of sharing in-house resources with other

Learning from Experience
92
departments. There does not appear to be any experienced backup in Delhi for field office staff in issues of sanitation and hygiene promotion.
5. No clear policy process guides which activities are taken up with what intensity and by which mechanisms. Many activities are started and few are ever stopped; there is rarely an explicit “exit” strategy. The “need” to undertake activities also appears to outweigh consideration of the WES programme’s capacity to perform the task well.
Partnerships 1. UNICEF is recognised and valued by its donors for its influence with the Government
of India. ESAs value the access to senior GOI officials by UNICEF-WES staff and realise that it has been earned through a long commitment at national, state and district levels.
2. UNICEF’s programmes are closely co-ordinated with the plans and policies of the GOI, and this policy of long-standing partnership has been effective. UNICEF views itself as a partner of the GOI, and its efforts to synchronise both the timing and the objectives of its MPOs with GOI Plans reflect this view. The evaluation team believes that UNICEF’s supportive approach has on the whole been appropriate, and has contributed to success.
3. Compared with GOI contributions, the financial support from ESAs to water and sanitation in India is tiny. To make best use of this relatively small amount of support, the GOI and the ESAs—including UNICEF—believe that ESAs contribute most effectively through (1) developing and testing new approaches and (2) helping to build capacity for use of approaches that have been proven. However, co-operation among the ESAs in these functions is low.
Future Directions 1. UNICEF partners and staff agree that the WES programme should focus more on
sanitation and hygiene and not try to tackle all WES subject areas. There was consensus on most of these areas, although partners saw new technologies and rural water supply as a higher priority than did staff, while UNICEF staff viewed school sanitation as a higher priority than did partners.
2. To achieve progress in these areas, UNICEF partners and staff agree that UNICEF can make its greatest contributions through helping to develop new approaches and through training. Partners also supported funding as important, and staff supported advocacy. Very few partners and staff felt that UNICEF should be involved in direct implementation.

93
Chapter 12: Recommendations and Lessons Learned
Recommendations UNICEF requested that the evaluation team suggest future directions for its WES programme in India. In this vein, the team makes the following 10 recommendations.
1. UNICEF must focus its WES efforts on fewer subject fields. In less-served areas, it makes sense to help build capacity to expand proven approaches, as currently planned. Elsewhere, it means consolidating the achievements in water supply and achieving the same success in sanitation and hygiene, perhaps through exploration of convergent approaches with education and health. Other areas, such as water quality monitoring, water supply and sanitation to the urban poor, and water resources management, cannot be pursued to the same depth. A remarkable consensus among partners, staff and evaluation team members emerged that all these are important, but UNICEF does not have a comparative advantage in them. Instead, UNICEF can most effectively contribute in these areas through collaboration with others. UNICEF should thus establish strategic partnerships with those organisations and jointly plan strategy, activities and intended outcomes.
2. In rural water supply, UNICEF should complete its work in hand and free up some resources to pioneer in other fields. UNICEF needs to define and circumscribe its job in rural water supply, and resist the temptation to accept all responsibilities.
While scaling back, UNICEF should help develop strategies for integrated management of community-level water resources and support pilot projects on the basis of local demand, in districts and communities ready to commit their own resources. CCA should be encouraged in four closely related sectors: water supply and sanitation, health, environment, and decentralised management/good governance. A jointly developed comprehensive strategy for community management is needed that includes a gender and poverty focus and attention to child rights. Maintaining the quality standards of borehole construction and handpump manufacture after UNICEF’s withdrawal from these activities is essential to safe guard the achieved results.
3. UNICEF should make sanitation and hygiene its new major WES focus. Although an evident goal in the most recent MPOs, resources need to follow these ambitions more closely. UNICEF must continue to support the spread of affordable latrine options and other approaches. To some extent, UNICEF bears a special responsibility to follow through on this, as it played a significant role in the standardisation of the TPPF as part of the GOI rush to go to scale.
4. UNICEF should strengthen its partnerships through focus on fewer, closer partners. When UNICEF focuses on fewer issues, it becomes feasible to work with a smaller set of partners in the medium term in planning, jointly reviewing progress, sharing peer reviews and investing in capacity-building. The advantages of strengthening a smaller group of partners have to be weighed carefully against the risk of making partners too dependent on

Learning from Experience
94
UNICEF. Agreeing on clear performance criteria and linking these to external evaluations may ensure that rigour is maintained in the partnership.
5. UNICEF needs to change its staffing and staff development system. More expertise is needed in the social and institutional aspects of water supply, sanitation and hygiene. This requires both new staff and training of existing staff. Staff development is needed not only in management skills, but also in the promotion of sanitation and hygiene, measurement of behavioural change, and participatory methods and techniques. UNICEF can play an important developmental role in the use of such techniques in India, but this requires a longer and more structured input and the measurement of effectiveness in terms of outcomes, not just outputs, against costs. A better balance of male and female staff is also part of the development of a gender strategy.
6. UNICEF, together with its partners, must address the challenge of decentralised management of WES. The Panchayati Raj system offers new opportunities for community-based management, but the potential has not yet been realised. ESAs and the GOI may arrive at a commonly agreed framework that defines general objectives, indicators and means of verification for progress in the sector without specifying uniform approaches and activities. GOI and ESAs could then meet regularly to compare progress and results in the light of the framework. UNICEF may be in a prime position to develop and facilitate such a partnership because of its field presence in the whole of India, its long and significant contribution to the water sector and its close ties with GOI.
7. UNICEF must improve its monitoring and evaluation of projects and alternative strategies. This can be done through tighter specification of project evaluation studies, closer partnership with those involved in the studies, and definition of clearer outcomes, objectives, and criteria for success when the projects are planned. UNICEF should also consider, as it has in the case of this evaluation, the benefits of fresh insight and experience from outside India for periodic peer review. The selection of suitable indicators for monitoring and evaluation is not always straightforward; the use of diarrhoeal disease rates in current WATSAN strategy, for example, is fraught with epidemiological difficulty. Nevertheless, a common set of indicators that lie somewhere between hardware outputs and a desired health outcome would be a high priority for realistic determination of programme effectiveness. This is a fundamental concern for the sector in India, and not just UNICEF.
8. UNICEF should collect and use cost data. Areas where cost data are needed but lacking include borehole drilling and rejuvenation technology, sanitation technology and promotion options, and software approaches. It may be too late to evaluate past decisions but the data collected now and in the future can greatly assist the UNICEF WES programme in India and in other countries.
9. UNICEF should undertake focused studies to fill some information gaps and use the results to improve its programmes. Recommended studies identified in this report include cost-effectiveness analysis of borehole rejuvenation techniques and a joint evaluation with BIS on manufacturers’ qualifications to ensure handpump quality and standards. UNICEF should play a role in the pre-testing IEC materials and in testing the effectiveness of social marketing, community management and CCA approaches.
10. UNICEF must protect and preserve its long-standing, well-deserved legacy. WES activities have played a leading role in establishing the reputation of UNICEF in India and

95
have greatly enhanced its reputation abroad. But reputations can be broken more quickly than they are built. UNICEF-India developed its expertise in WES over a period of more than 30 years. It can preserve this national and global legacy and reputation by developing and testing strategies with its partners in India to sustain these achievements beyond UNICEF’s support. All individual activities must come to an end sometime, but the way in which UNICEF completes them must do justice to what has been achieved.
Lessons Learned In addition to its sector-oriented conclusions and recommendations, the evaluation team gathered lessons that can be more generally applied to UNICEF programmes.
• Long-term commitment and partnership produce results. The UNICEF WES programme maintained its support for 30 years, co-ordinating its activities closely with GOI priorities. The depth of this support has been well-appreciated by UNICEF staff and partners and contributes to UNICEF’s ability to get things done in WES. UNICEF staff, partners and the evaluation team concur that UNICEF has earned the trust and confidence of senior-level officials and credibility at the national, state and district levels through its 30-year-plus relationship with the GOI. This gives UNICEF a tremendous comparative advantage.
• An external agency such as UNICEF has greater freedom to test new approaches than a government. This relative freedom suggests an important role for UNICEF in many sectors as an organisation that can develop and test new approaches.
• Going to scale too quickly has adverse repercussions. It is tempting to expand on pilot projects that seem successful. However, in the long run, it is better to move slowly to ensure that a promising pilot approach is indeed replicable on a larger scale.
• Institutional arrangements on the district and community levels can help or hinder the implementation of decisions made more centrally. A supporting national policy framework is important to move ahead in many sectors. However, what is taking place on the ground will determine the likelihood that this policy is operationalised in a meaningful way.
• A gender and poverty perspective must be consciously planned for and its systematic implementation monitored. Even with the best of intentions, incorporating such a perspective in participation, education and training will not happen without ongoing and deliberate attention.
• Programme staff and management need to be realistic about how much work they can take on and still be effective. With many pressing social problems to be solved, committed staff often shoulder large workloads and cannot scale back or end an activity. However, with too many priorities, the programme cannot maintain high-quality work and the overall programme suffers.
• Cost data are needed for more effective analyses. It is difficult to collect and keep track of this information with the many other demands placed on staff. However, the lack of such data impedes cost-effectiveness analysis, which, especially in an era of limited resources and greater accountability, is necessary for effective decision-making.

Learning from Experience
96
In summary, ensuring quality and appropriateness of work are the central management issues for the UNICEF WES programme in India, and perhaps more broadly for its work elsewhere. UNICEF has contributed most where it has followed through on specific issues over time. The contributions in drilling and handpump manufacture resulted from commitment by high-calibre professionals over the long haul. Partners, funders and UNICEF staff all agree that UNICEF’s role is to develop and test new ideas and approaches for possible broader application. Yet just as there is a “multiplier” of success when good ideas go to scale, there is a “multiplier” of failure when poorly developed ideas go to scale. A basic trade-off exists between quantity and quality of work, and this trade-off is difficult when considering needs as great as India’s.
UNICEF has achieved extraordinary, world class results on specific WES issues in India when it has followed through on quality over time. The quality of work done by UNICEF as a sector “test pilot” is not, however, negotiable; it must be exceptional to ensure that approaches are sound before they are brought to scale. The evaluation team’s recommendations are aimed at ensuring that UNICEF works most effectively by continuing its high quality work in a limited number of priority areas.

97

Page 1 of Annex 1
Annex 1: Terms of Reference
I. Introduction
Water and sanitation are crucial to the UNICEF mandate to promote the survival, protection and development of children. Over the years UNICEF support for water and sanitation has enjoyed one of the largest investments of all UNICEF programmes. UNICEF support to water and sanitation started in the late 1960s, as a response to drought emergencies in India. Since then, UNICEF has assisted many government programmes to move towards universal access to safe water supply and sanitation services as a basic right, in line with the goals of the World Summit for Children (WSC). It has also promoted the behavioural changes essential to realising the full benefits from such services, especially for those most in need.
In this context, UNICEF is planning a multi-country thematic evaluation of its contribution to water and sanitation programmes to draw lessons for global application. This global evaluation will provide a better understanding of what UNICEF has done, and will help establish UNICEF's future directions for the water and sanitation programme. The evaluation will examine several key issues, including cost-effectiveness and sustainability. The outcome of the evaluation will be useful for setting global water and sanitation policies and to further refine UNICEF's water and sanitation strategies. This thematic evaluation will include the full range of programming contexts. The India evaluation will be one case among several country experiences.
A. The India water and sanitation programme
India has the longest-running, and one of the most prominent, water and sanitation programmes. Drinking water supply and more recently environmental sanitation have been high on the political agenda of successive Indian governments, in spite of the changes in political affiliation at the helm.
Although India has highly qualified technical human resources, it has always been receptive to new and innovative ideas from outside. This has allowed the contributions of external agencies, such as UNICEF. UNICEF’s role in the programme began in response to an emergency and expanded gradually. Even now, its annual contribution is about only one per cent of the total government water and sanitation programme budget. Yet, the UNICEF contribution is believed to have had considerable impact, to the point where the programme serves as a model for other countries.
Over the past thirty years, the Indian water and sanitation programmes have gone through major programmatic shifts. For example, in rural water supply, the focus has gone through several stages: from (i) the initial reliance on hard-rock drilling in the late 60's in response to the drought emergency; (ii) to the development and introduction of the India MK II handpump in the early 70's, replacing a malfunctioning, hard-to-maintain pump with a sturdy village handpump; (iii) to the introduction of hydraulic drill rigs in the late 70's to tap deeper aquifers, improve quality of well construction, and accelerate the pace of the programme; and (iv) to the introduction of the more easily manageable India MK III hand pump in the early 1990's. In the sanitation area, the initial focus was on latrine construction in the mid 70's, which evolved to include personal-hygiene education in early 90's, and which added a special emphasis on urban areas by the late 1990s.

Page 2 of Annex 1
B. The rationale for the India water and sanitation evaluation
The evaluation of the UNICEF's water and sanitation programmes in India is planned because:
1. The India programme is rich in instruction and clearly merits an in-depth evaluation as an important lesson. It has unique features, such as the nature of the participatory relationship with governments (central and state), the degree of private sector involvement, the complexity of the process of policy development, the governance and public financing system, and the level of local capacity;
2. The national water and sanitation strategy has made a gradual shift from hardware-oriented rural water supply to more complex issues of water quality, sustainability, management of fresh water resources, environmental sanitation and hygiene, and urban coverage. It is important and timely to learn more about how to implement these new strategies more cost effectively and sustainably;
3. UNICEF has established its niche in the national water and sanitation programmes as a key partner in initiating innovative approaches, strategies and technologies for eventual inclusion in national sector policy. It is, therefore, critical to assess both the achievements and the constraints, and to learn from this process. The magnitude and complexity of the India programme will provide rich examples;
4. Considerable resources have been invested in the programme, by the government of India (GOI) and UNICEF. The GOI budget has steadily grown as the programme has expanded. Although UNICEF's financial input has not increased, it has changed over time as the needs have evolved, shifting its focus from hardware to more technical inputs, such as training and monitoring. It is important to understand the conditions behind this evolution, as well as the impact of this shift;
5. India has the capacity to experiment in new programme areas. Other countries are not so blessed. It is therefore important that the India experience be shared as widely as possible so that others may benefit from the lessons learned in the India programme;
6. The India water and sanitation programme faces enormous challenges as it approaches the year 2000, not just to achieve the goals set at the 1990 WSC, but to surmount several challenges, such as: (i) ensuring community ownership of the management (including co-financing) process, which in turn will help secure the programme' sustainability; and (ii) keeping pace with the demand, driven by the ever-growing population and enhanced water supply norms;
7. Although numerous studies and evaluations -- both external and internal -- have been conducted over the years, they have focused on a single aspect at a certain time, have had a limited geographical focus, or have looked only at a particular donor-supported project. To date, no comprehensive, in-depth evaluation has been carried out.
C. The scope, focus, and main audiences of the evaluation
The scope of the evaluation will be comprehensive, covering the full 30-year experience. All major aspects of the programme -- technical, programmatic, managerial, financial, impact -- will be included.

Page 3 of Annex 1
The main focus of this evaluation is UNICEF's contribution to the India water and sanitation programme, not the Indian national water and sanitation programme itself. However, given the close relationship between UNICEF and the GOI in the water and sanitation sector, it is not feasible to look at the UNICEF work without looking at the India national water and sanitation programme as well, in terms of overall achievements and problems.
The main audiences for this evaluation are:
1. The India water and sanitation programme management (GOI: central and state, UNICEF/India, NGOs);
2. UNICEF HQ (Programme Division, Office of the Executive Director); and
3. Donor partners (especially the Dutch, DFID, Sida).
II. Objectives
The main objective of this evaluation is to learn lessons from the India Water and Sanitation Programme experience that will benefit both the India country programme and UNICEF's global work in the sector. The evaluation will review the experience gained in India in assisting the GOI in improving the water and sanitation situation. It will identify, to the extent possible, the lessons learned with respect to the programme's relevance, policy base, strategies, effectiveness, efficiency, community participation, capacity building, management, technology transfer, impact, and sustainability in order to make rational decisions for future use.
The evaluation has the following specific objectives:
• To examine UNICEF's role over time, identifying lessons learned from each phase of the national water and sanitation programmes;
• To assess the current status of the India water and sanitation programme of UNICEF: its strengths, weaknesses, achievements, failures, and constraints;
• To identify potential areas for future UNICEF contributions in India; and
• To share lessons from India with other countries.
III. Key issues
In order to meet the objectives of this evaluation, the following key issues will be examined:
UNICEF's influence on policy, planning, programme, and priorities for the national water and sanitation sector:
How and how much have UNICEF's advocacy, pilot projects, and research and development efforts affected GOI’s water and sanitation programmes over the years at the national and state levels? Has UNICEF played any important role in policy development and planning process, and changes in them? If so, what are they, and how did they do it? How did it adapt to the

Page 4 of Annex 1
changing situation, especially in relation to the Technology Mission? In what ways is UNICEF unique among donors? How did UNICEF's credibility develop in spite of its small financial contribution? What will happen if UNICEF/India withdraws its support from the water and sanitation sector?
Operational linkages with other sectoral programmes:
How much and how effectively have linkages been built between water and sanitation programmes and other sectoral programmes, especially health, education, environment, and nutrition? To what degree was convergence achieved?
Technology choice and its appropriateness and introduction strategy:
Was the choice of technology (e.g., handpumps, capacity of the drilling rigs, hydrofracturing) appropriate in the local context? What was the basis for choosing a particular technology? Were users involved in the decision-making process? Was adequate preparation made before the new technology was introduced? Have innovations improved the quality of services as perceived by the users? Was the standardisation of technology, including rigs and handpumps, appropriate in the Indian context?
Cost-effectiveness:
How cost effective have programme interventions been in the areas of drilling rig development and operation, handpump development and maintenance, sanitation programmes, including school sanitation, and hygiene promotion?
Cost recovery and cost sharing:
Who pays for water and sanitation services? On what basis are those decisions made? To what degree does it work?
Monitoring system:
How have the water and sanitation programmes been monitored? How has UNICEF's input been monitored? Has the monitoring and evaluation information been used on timely fashion?
Stakeholder analysis:
Who have been key players in India's water and sanitation programme over the years? What have been the roles of GOI, state governments, donors, UNICEF, private sector, international and local NGOs, and communities?
Funding patterns:
How has the size and patterns of UNICEF's financial input changed over the years? To what extent has UNICEF's work attracted new funding? Why do funding agencies come to UNICEF? To what extent have these donors influenced UNICEF's policies and programmes?

Page 5 of Annex 1
Impact:
What has been the impact, including benefits, of UNICEF's assistance, measured by both immediate and intermediate (proxy) variables, such as coverage, quality of services, and the time saved collecting water? Who has benefited from the programmes, how, and how much?
Sustainability:
Are national water and sanitation programmes sustainable in the areas of technology, systems, management capacity, and ownership given the ever-increasing demand for both quantity and quality of services? Are programmes financially and environmentally sustainable? Was national capacity built (e.g., via training, technology transfer, systems strengthening)?
UNICEF management:
How has the number and background of UNICEF staff changed over time? How well has it reflected the changing requirements of strategy and policy (e.g., shift from hardware to software, and towards decentralisation)?
UNICEF's future contribution:
In what direction does UNICEF need to evolve in its policy and strategies in assisting the India water and sanitation programme? What should be new directions for future contributions, if any, of UNICEF in the sector?
Please note that above issues are in general relevant for both water and sanitation. However, a time factor should be considered, which requires a different focus. The Indian sanitation programme has expanded only in the last ten years, while the water programme has been in existence for almost three decades. It is therefore more appropriate to assess the relevance and rationale than impact in the case of sanitation.
IV. Evaluation Methodology
This evaluation will rely on four complementary methodologies in order to cover both the breadth and depth of the experience: (1) a desktop review of existing documentation to gain a comprehensive overview of what is already known; (2) field visits to observe the drilling, hand pump maintenance, logistical control (including spare parts management), and sanitation-related activities; (3) key informant interviews for more in-depth knowledge; and (4) beneficiary assessments.
Stakeholders -- GOI, UNICEF, other donor agencies, and most importantly villagers -- will be appropriately involved in the key stages of the evaluation from planning to use of the results. Extensive consultation, especially during the planning period, is expected in order to secure agreement on the major questions, the development of protocols, selecting field sites, setting the criteria for evaluators, and finalising the TOR.
In addition, an advisory group will be formed at both global and country levels to receive technical and procedural input and support at key stages of the evaluation process.

Page 6 of Annex 1
A. Desktop review
Over the years, numerous evaluations and studies have been carried out, and donor reports prepared. This evaluation will examine all relevant documents, reports,
costing studies, donor reports, monitoring data, IEC materials and any other documentation available (central-, state- and district-level material). ICO will develop a list of all available documents for the review.
This first phase of the evaluation will cover all evaluation questions, including the context of the programme, programme preparation, implementation, management, and achievements and shortfalls. More specifically, the review will focus on the following four aspects:
• Review of sector development and related socio-economic and health aspects.
• Overview of specific sector aspects of GOI--both national and state-level-- water and sanitation programmes, 1968-98.
• Overview of UNICEF contributions to India's water and sanitation programmes.
• Overview of other donors' contributions.
The desk-top review will provide a good basis for identifying the knowledge gaps and improving the later data-collection mechanisms, including interview guides and checklists for field observation. A two-person team of local experts will carry out this review in collaboration with the evaluation team.
B. Field observations (technical)
The scope and design of the field study will depend on the outcome of the desk-top review. Field visits may include: well drilling, well rejuvenation and deepwell handpump sites; factory visits; visits to suppliers other than manufacturers of capital equipment; and sanitation-related facilities, including latrines and pen manufacturers. Naturally, resources do not permit this kind of analysis to be done in more than a few sites. The following factors will be considered, as appropriate, in selecting the sites:
• Level of UNICEF investment over time
• Major interventions
• Success and failure
• Coverage
• Water quality
• Geographical (hydrogeological) characteristics: desert, rainfall, etc.
• Social factors: minority, literacy level, community participation
• Economic: agriculture
• Technology choice: groundwater rejuvenation
• Changes in strategy over time
• Government vs. private initiation

Page 7 of Annex 1
• New partnership
• Donor involvement
• Reduction in water-borne disease
• Type of maintenance system
• Hygiene education
• State policy on subsidy, etc.
• Relationship to urban/small towns
Depending on the issues to be looked at through field visits, some preliminary field work may be conducted by a team of local consultants. Under the guidance of the global and national advisory groups, the evaluation team will develop detailed check lists for various field observations.
UNICEF state-level water and sanitation officers will need to play a key role in organising and facilitating the field visits.
C. Key informant interviews
Information from the field observation and the desktop review will be complemented by various interviews with selected stakeholders. They include: users of water and sanitation services and officials at the district and village levels, NGOs, donors, state and GOI engineers, and GOI and state policy makers. Relevant individuals, current and previous, will be interviewed. This will provide a much deeper understanding of the process in-country, and will allow some issues to be investigated in more detail. The evaluation team will develop various interview guides.
1. At the central and state levels
Selected key players -- policy makers, technical experts, donors, and programme managers --involved in the development and implementation of the water and sanitation programme, will be interviewed in person, individually or in group. They include to the degree possible: staff from UNICEF and government and relevant NGOs and private sector officials.
Interviews will be conducted across a broad spectrum of stakeholders, knowledgeable individuals, and influential actors in the sector and in the society as a whole, and will be drawn as appropriate from such groups as:
• Past and current government officials in water and sanitation programme and other related sectors
• Policy makers
• Women's groups
• NGOs involved in water and sanitation
• Training institutions
• Opinion leaders
• Research and development groups

Page 8 of Annex 1
• IEC and sanitation cell staff
• Past and current UNICEF staff members in the water and sanitation sector
• Media: writers, journalists, etc.
• Manufacturers: rig and hand pump
• Donors
2. At the district level
Site selection. Interviews with people from NGOs, government and other agencies will be carried out in selected sites. The sites will be chosen with consideration for the following criteria: geography, socio-economic level, efficacy of system, and coverage.
Interviewee selection: the interviewees will be selected based on the following:
• Past and current government officials in water and sanitation programme and other related sectors
• Policy makers
• Women's groups
• NGOs involved in water and sanitation
• Training institutions
• Opinion leaders
• IEC and sanitation cell staff
• Past and current UNICEF staff members in the water and sanitation sector
• Media: writers, journalists, etc.
3. At the village level
Interviewees will be selected to reflect the wide range of important stakeholders, such as:
• Water committee members
• Women's groups
• Panchayati Raj members
• Users and non-users
• Health workers
• Anganwadi workers
• Industrial and private household
• Water and sanitation committee members
• School children
• Teachers

Page 9 of Annex 1
D. Focus group discussions or mini-survey of users
Views from selected groups of users will be collected through focus group discussions. Categories and numbers of groups will be decided after the desktop review. The evaluation team will develop a detailed guide for the focus group discussions. This component of the evaluation will be carried out by a local team.
V. Expected Output
Based on the information collected using the above methodologies, the evaluation will produce the following:
1. A report from the desktop review, including a brief history of national programme development and UNICEF's changes in operational practice;
2. A final synthesis report, including an overview of the achievements, an analysis of the field observation, interviews, user and stakeholder assessments, lessons learned, recommendations; and
3. A set of shorter reports in various formats and lengths for a series of dissemination activities through diverse mechanisms, as required.
VI. Use of the Evaluation Results
1. Within UNICEF headquarters: to contribute to further development of a global water and sanitation strategy;
2. In India (both GOI and UNICEF/ICO): to help decision makers determine the suitability of the water and sanitation strategy and adjust, if appropriate, and to further improve programme implementation; and
3. For key donor agencies of the national water and sanitation programme: to help guide their future directions.
VII. Evaluation Team Composition
The broad range of issues to be evaluated requires an experienced team of evaluators with diverse technical knowledge and experience. A team of six consultants -- a mix of international and national -- will conduct this evaluation. This core team will be supplemented by a team of local consultants, as appropriate, to conduct the desk-top review and the preliminary field visits and interviews.
4. One team leader: for overall management and co-ordination, rural and urban environmental health and sanitation.

Page 10 of Annex 1
5. One groundwater resource specialist: for groundwater and environmental management, groundwater quality and drilling.
6. One mechanical and maintenance specialist: for hand pump design, fabrication and maintenance management.
7. One social scientist: for community participation, gender, behaviour change, communication, qualitative research.
8. One development economist: for cost and cost-effectiveness analysis of various technologies (both hardware and software) and interventions.
The team members should collectively have the following qualifications:
• Technical knowledge;
• Excellent analytical skills;
• Broad experience in WES-related issues in India;
• Good interview and analytical skills;
• Cultural and political sensitivity;
• Experience in evaluation involving extensive field work; and
• Excellent writing skills.
In addition, the team members should not have been involved in the India water and sanitation programmes.
In order to add to the quality and impact of its work, the team will be assisted by the National Advisory Group. This consists of small number of experts who are recognised for their insight, influence, and knowledge (either of the sector or of the development process in India), and who represent the broad spectrum of stakeholders in UNICEF's work. Their expected roles include:
• Offering strategic reviews and advice at critical stages of the evaluation;
• Offering appropriate perspectives on the history of UNICEF's partnerships with the GOI, NGOs, and bilateral and multilateral organisations;
• Sharing with the team their perspectives on future directions for UNICEF assistance in WES; and
• Advising the team on how best to promote effective use and dissemination of findings.
VIII. Estimated Cost of the Evaluation
The cost will jointly be paid by the Dutch, DFID, (SIDA), UNICEF/India and EPP.

Page 11 of Annex 1
IX. Timetable
April: Preparatory visit to Delhi
May: Preparation of the first draft TOR
June: Revision of the TOR based on discussions with WES colleagues in UNICEF (NY, India, and other field offices)
July: First Advisory Meeting in the Hague to discuss:
Draft TOR;
Framework for the desk-top review;
Composition and qualifications of the evaluation team; and members; and
Time frame of the evaluation.
Revision of the TOR, including time table and estimated
budget to share with key stakeholders
August: Final selection of team members
Receipt of comments from various stakeholders
Initiation of the desk-top review
October: Orientation and team building of the evaluation team members in Delhi to:
Be briefed by the UNICEF/ICO WESS team;
Review the preliminary results of the desk-top review;
Elicit key stakeholders' (esp. GOI’s) input;
Meet with National Advisory Group; and
Finalise the evaluation methodologies and tools.
Nov. - Dec.: Preparation of the field work by ICO/WESS
Finalisation of the desk-top review
User and stakeholder assessments
Jan. 1999: Field work and preliminary analysis

Page 12 of Annex 1
February: Team report writing (draft)
Second National Advisory Group meeting
End Feb.: Final report
Mid March: Dissemination workshops/seminars in India
X. Management of the Evaluation
The Division of EPP will have the overall responsibility for conducting the evaluation in order to ensure objectivity and a global perspective. Sawon Hong will be the co-ordinator. All communications should be addressed to her.
Sawon Hong, Senior Programme Officer, Evaluation
Division of Evaluation, Policy and Planning
UNICEF, New York.
Tel: (212) 824-6719
Fax: (212) 824-6492
E-mail: [email protected]
This evaluation will be guided by the Global Steering Committee. Their expected roles include:
• Provide independent peer reviews at various stages of the evaluation implementation;
• Provide the global perspectives;
• Reflect UNICEF's global concerns;
• Advise and comment, as appropriate;
• Help select countries to be included in the global evaluation;
• Ensure the independence of the evaluation teams; and
• Provide advocacy with various global stakeholders, including governments, UNICEF, donors, research community, and NGOs.
References
Black, Maggie. 1990. From Handpumps to Health, UNICEF: New York
Ghosh, Gourishankar, et al. 1995. Water Supply in Rural India (Policy and Programme), Ashish Publishing House: Delhi
Indian Institute of Mass Communication. 1998. Water and Sanitation: A Baseline Survey, New Delhi
Mudgal, Arun Kumar. 1997. India Handpump Revolution: Challenge and Change, HTN Working Paper: WP 01/97, SKAT

Page 13 of Annex 1
Social and Rural Research Institute. CDD WATSAN Study: An all India report on the study carried out in 15 districts, Indian Market Research Bureau: New Delhi
Talbot, Rupert. 1987. UNICEF Assistance to the Rural Water Supply Programme in India 1967 to 1989: A Synopsis (Mimeo)
UNICEF (India). India: Sanitation and Hygiene: Moving towards the 21st Century, A Report for the Global Environmental Sanitation Initiative (GESI) Workshop on 1998 Environmental Sanitation, 10-13 June, New York
UNICEF. n.d. WATSAN India 2000, UNICEF India: New Delhi
WELL. 1997. Joint Evaluation of UNICEF-Assisted Projects in the Water and Sanitation Sector, India (for DFID)
World Bank.1996. An Evaluation of the UNDP-World Bank Water and Sanitation Program, Report of an Independent Team, World Bank: Washington, D.C.
To be prepared are:
1. A framework for the desktop review.
2. Interview guides for central-level (central and state) officials: government, UNICEF, donors, NGOs, private sector manufacturers,
3. Interview guides for district-level and Panchayati Raj officials: government, water technical staff, sanitation technical staff
4. Interview guides for community-level information gathering: water committee members, women, teachers, students
5. Check lists for field observation of: drilling sites, hand pump sites, spare-part storage,
For these guides and checklists, water and sanitation will be differentiated.

Annex 2: Tools Used in This Evaluation
The following tools developed and used in the evaluation are included in Annex 2. They are:
1. Questions Related to Handpumps
2. Questions Related to Health, Hygiene and Sanitation
3. Questions Related to Social Aspects
4. Questions Related to Community Participation in Planning, Maintenance, Management and Monitoring of Handpump Services
5. Questions Related to Management Issues
6. UNICEF Partner Evaluation Questionnaire
7. Evaluation Questionnaire for UNICEF Staff
8. Stakeholder Assessment
9. Participatory User Assessment

Page 2 of Annex 2
1. Questions Related to Handpumps
Data source: Collected by:
Data UNICEF’s Role
History
The role of UNICEF in the development of India MKII
India’s Industrial development 1975 to 1999
Planning and Implementation
Who decides where and when pumps are to be installed? And how are allocations made?
Who selects districts/villages?
The Procurement system for new investments
Who buys Handpumps? And how is this done? What is the planning cycle?
What is the quality control Procedure?
Are records kept and accessible?
Are Installation inspections made and records kept?
Maintenance
What type of system is used? (decentralised, centralised, 3-tier, etc) Who is responsible for the repairs?
Who is responsible for the day to day maintenance?
Cleaning, greasing, etc.
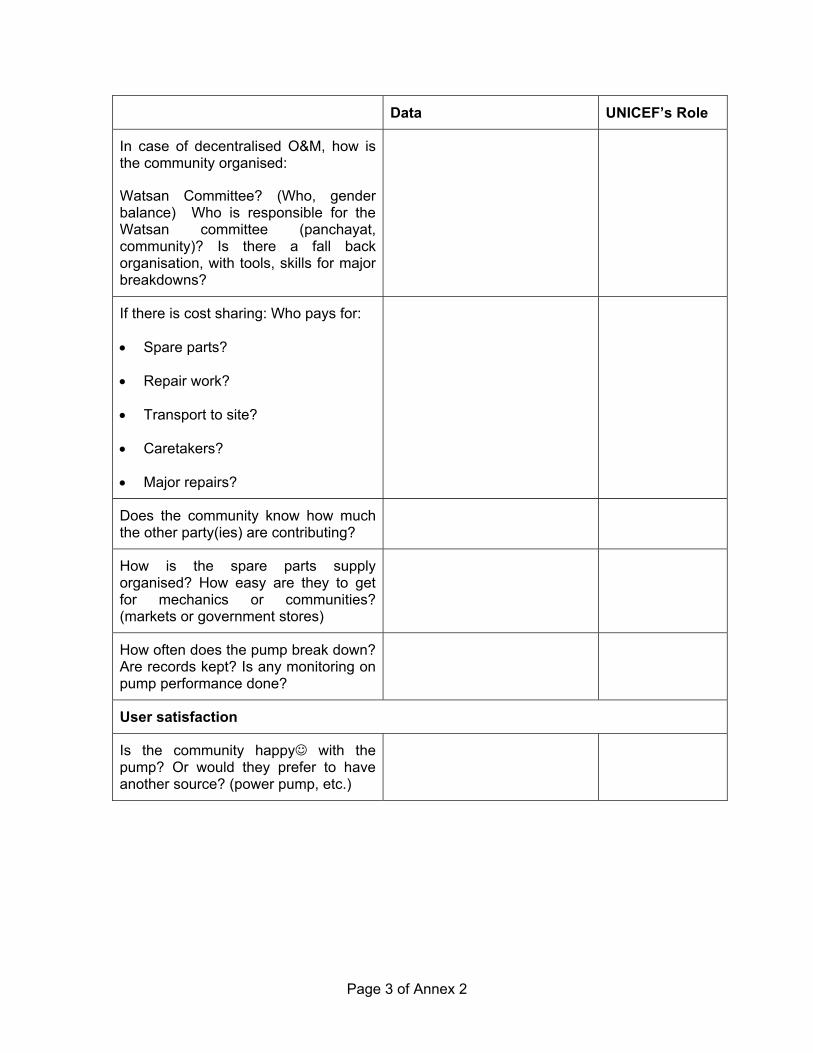
Page 3 of Annex 2
Data UNICEF’s Role
In case of decentralised O&M, how is the community organised:
Watsan Committee? (Who, gender balance) Who is responsible for the Watsan committee (panchayat, community)? Is there a fall back organisation, with tools, skills for major breakdowns?
If there is cost sharing: Who pays for:
• Spare parts?
• Repair work?
• Transport to site?
• Caretakers?
• Major repairs?
Does the community know how much the other party(ies) are contributing?
How is the spare parts supply organised? How easy are they to get for mechanics or communities? (markets or government stores)
How often does the pump break down? Are records kept? Is any monitoring on pump performance done?
User satisfaction
Is the community happy☺ with the pump? Or would they prefer to have another source? (power pump, etc.)

Page 4 of Annex 2
Data UNICEF’s Role
Monitoring
Does a database on existing HP sources exist?
- with installation records
- with borehole data
- HP performance
Are data analysed?

Page 5 of Annex 2
2. Questions Related to Health, Hygiene and Sanitation
Data source: Collected by:
Access and Use
How are HPs/taps spread
over the community? Can everyone easily use?
What sources do people use for drinking and cooking in the summer?
And during monsoon?
If not all use HPs/Taps, why not?
Hygiene Education
Is any health/hygiene education given in the cty?
By whom? And to whom?
(mothers, children, fathers?)
What is the education on?
Can you recall any messages?
What methods are used for hygiene education?
Is any educational material used? What kind?
Does the community partcipate in the program?
How?
Has the hygiene and health situation in the cty changed?

Page 6 of Annex 2
Sanitation
Is anything done to improve sanitation in the village? what?
Where do the villagers go for defecation?
Where do young children defecate? What happens to the stools of babies and infants?
(In case of sanitation program): Who takes part in the program? What do the people contribute?
Has the environmental situation in the village changed?

Page 7 of Annex 2
3. Questions Related to Social Aspects
Activities and Approaches in Social Aspects
Community Participation in water supply
Community participation in general
• When was community participation first mentioned in UNICEF documents - objectives, policies, strategies etc.
• What was understood by it?
• What activities related to CP were undertaken in the field - detailing when, where and who participated in what, how and with what results and effects - short as well as longer term ?
• Who were the implementing agency or agencies/partners for the activities?
• What were the roles of UNICEF staff?
• What methods, techniques and materials have been used in implementing CP?
• Have the concept and strategy/ies of CP changed over time?
• What institutionalisation strategies, if any, has UNICEF developed to integrate participatory approaches into rural water supply programmes?
• Have UNICEF experiences/lessons contributed to the formulation or adjustments of (a) central RWS policies; (b) state RWS policies (if so, where); (c) state implementation procedures; (d) UNICEF/central/state level training programmes; and (e) Indian sector education programmes?
Involvement of marginal groups (women, poor); gender approaches
• When/where are issues of poverty, women’s participation/gender mentioned for the first time in documents related to UNICEF programmes and projects;
• Have the concepts and approaches changed over time - if yes, how?
• How are gender and gender approaches defined today?
• Where and how are WID/poverty/gender approaches operationalized in participatory rural water supplies (Women in Handpump Maintenance is one set of examples, but other examples may be present, from participation of women and SC/ST in site selection and other decision-making/management issues; training and information geared towards interests and responsibilities of (poor) women and men in conventional and new roles; separate data collection on women and men in various types of studies, girls/boys in school sanitation etc.)

Page 8 of Annex 2
IEC, Hygiene education • When were IEC, hygiene education introduced as concepts, strategies?
• When did the first programmes/activities appear on the ground?
• Who were implementers/partners in the programme(s)/activities
• What methods, techniques, materials were used
• Changes over time in approaches, materials, subject focus areas?
• Who were targeted? Who were not included?
• Did those targeted take part in planning, implementation, management, monitoring & evaluation?
• What were the implications, results for those targeted - positive & negative
• Were changes in hygiene monitored/evaluated? How?
• Current approaches to IEC, hygiene promotion?
• Gender and poverty aspects in UNICEF IEC and Hygiene education activities
Sanitation: Approaches, lessons and diffusion • When did UNICEF take up sanitation and in what form (practice, theory or
both) What elements (domestic, school, public)
• Where was sanitation taken up practically, how, with what activities and with whom?
• Where were the UNICEF programmes conventional and where were new approaches tried? With whom?
• What were UNICEF’s conclusions on the importance, strategies and principles of sanitation and when were the respective conclusions drawn? (for evaluating the effectiveness see below)
• With whom did UNICEF share the insights? Was there a particular strategy to approach specific actors, address specific issues? What programmes (of Government and NGOs) were influenced by UNICEF strategies (and vice-versa)?
• What is current situation of sanitation approaches in the states as compared to the lessons learned by UNICEF? In what states were lessons exchanged and which ones have adjusted approach (maybe not only because of the exchange but possible influenced by the communication/collaboration) (matrix overview?)

Page 9 of Annex 2
Effectiveness of programmes over time and roles of UNICEF
Handpumps
IM-II:
• Progress in coverage in terms of design populations: Number of people served taking the then prevailing design criteria as a base (How many people were getting served over time if people act according to design assumptions). Contributions from UNICEF in design population coverage
• Functioning data: Breakdown frequency and duration data over time, and influencing factors (steps taken to improve functioning). Influence of functioning on actual use (How many people could actually use the systems at a given time); Quality of data. Functions of UNICEF in a) assessing b) improving functioning
• Actual use estimates: of the pumps functioning at any time, how many can be considered to be actually used, taking into account situations on cut-off distances, competing sources in dry and wet season, perceived water quality criteria and sharing between scheduled and non-scheduled castes/tribes)
• Efforts made to improve actual use habits
• Data on actual use, for as far as available. Quality of collected data.
• Functions and activities of UNICEF in assessing and improving actual water use habits.
IM-III:
• Cost and effectiveness (in terms of capital and recurrent costs) of IM-III vs. IM-II under the for the particular pump most appropriate maintenance system.
• Taking an imaginary sample of the two pump types and their M&R systems, how long would it take to break even on total costs? How much lifetime left for each pump?
• Institutional implications (deployment/retraining of Government personnel vs. employment of women and youths in communities
• Rate of installation/conversion of IM-II to IM-III
Sanitation • Minimum WSS package for public health impact
• Increase in coverage of household latrines as one element of the package
• Estimated expenditure at given direct subsidy rate
• Data on actual use and maintenance of latrines, over time. Amount and quality of data (on how many latrines no information available on whether they are actually used and maintained?)
• Amounts of funds available for demand raising and capacity building for production, installation, hygiene promotion, monitoring and evaluation of private

Page 10 of Annex 2
latrines and installation, upkeep and use of public sanitation (in schools and elsewhere) if direct subsidies had been limited to poorest ..% and lower cost model
• Activities of UNICEF to introduce and test elements of a different sanitation strategy.
IEC and Hygiene education • Any data on effectiveness of IEC and/or hygiene education programmes on
people’s adoption of better water use, sanitation and hygiene practices, whether through stand-alone programmes or as part of a participatory water or sanitation programme?
• Any information on costs of these programmes?
• Replication/scaling up of approach(es)?
Water Resources • Sustainability of groundwater and surface water as freshwater sources for
domestic use
• Implications for effectiveness of GOI-UNICEF programme
• Functions and activities of UNICEF - as compared to other stakeholders- in problem assessment and problem reduction.
General Strategy: Addressing Critical Issues. Testing, Sustaining and Scaling-up New Approaches
• Overview of all issues taken up as pilot/demonstration projects, in single sites
• Idem, in multiple sites
• Pilot projects that resulted in policy guidelines/guideline adjustments directly after the testing
• Effects of policy changes on state-level implementation
• Use, by UNICEF, and effectiveness of other methods than pilot projects to advocate changes
• Data on sustainability of approaches and results after piloting (Tracing study)
• Roles of UNICEF in capacity building and quality preservation for wider application of proven strategies (Done in well drilling, but not in any other programmes?) .
• General effectiveness of the S curve pilot project approach for changes in policies and policy implementation. Can the effectiveness be improved -if this turns out to be necessary? Is the S curve the best/only UNICEF strategy for the future?
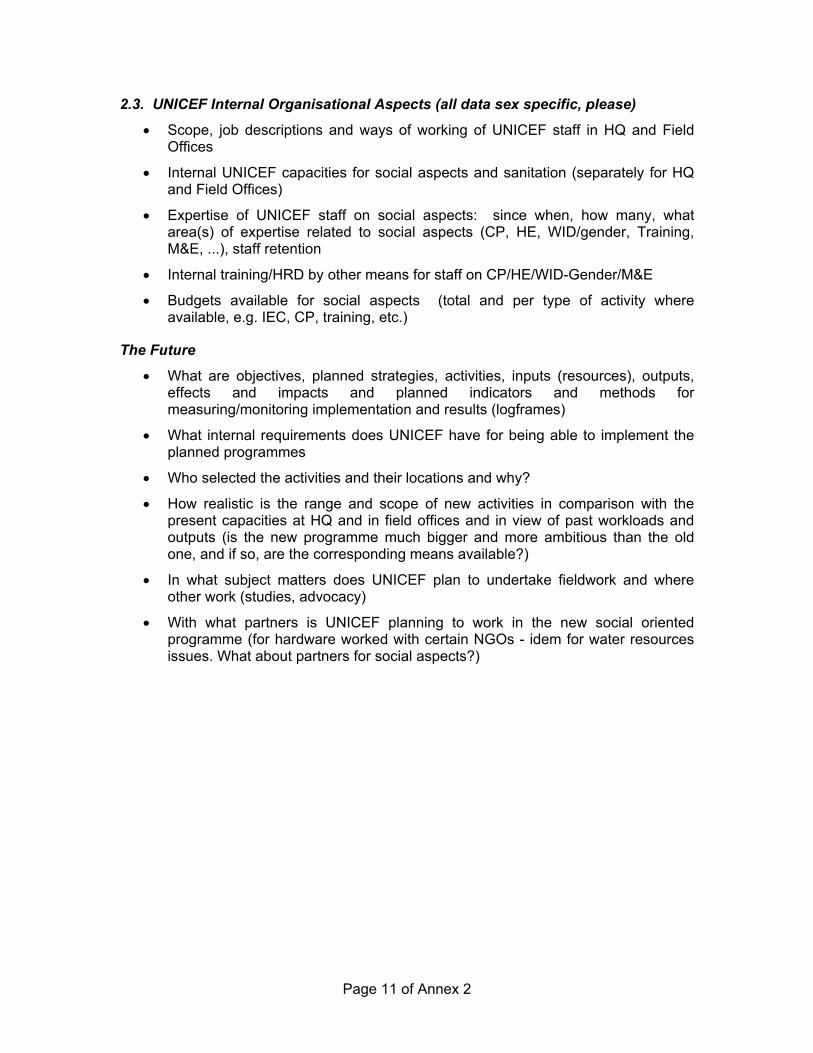
Page 11 of Annex 2
2.3. UNICEF Internal Organisational Aspects (all data sex specific, please)
• Scope, job descriptions and ways of working of UNICEF staff in HQ and Field Offices
• Internal UNICEF capacities for social aspects and sanitation (separately for HQ and Field Offices)
• Expertise of UNICEF staff on social aspects: since when, how many, what area(s) of expertise related to social aspects (CP, HE, WID/gender, Training, M&E, ...), staff retention
• Internal training/HRD by other means for staff on CP/HE/WID-Gender/M&E
• Budgets available for social aspects (total and per type of activity where available, e.g. IEC, CP, training, etc.)
The Future
• What are objectives, planned strategies, activities, inputs (resources), outputs, effects and impacts and planned indicators and methods for measuring/monitoring implementation and results (logframes)
• What internal requirements does UNICEF have for being able to implement the planned programmes
• Who selected the activities and their locations and why?
• How realistic is the range and scope of new activities in comparison with the present capacities at HQ and in field offices and in view of past workloads and outputs (is the new programme much bigger and more ambitious than the old one, and if so, are the corresponding means available?)
• In what subject matters does UNICEF plan to undertake fieldwork and where other work (studies, advocacy)
• With what partners is UNICEF planning to work in the new social oriented programme (for hardware worked with certain NGOs - idem for water resources issues. What about partners for social aspects?)

Page 12 of Annex 2
4. Questions Related to Community Participation in Planning, Maintenance and Monitoring of Handpump Services
Planning
• In what planning decisions does the community participate?
• Site selection/choice of type of well/type of lifting device/type of O&M system/selection of caretakers/mechanics (M/F)/type of local management system/selection of functionaries (M/F)/ type of local financing system/level of tariffs
• Who participates in what decisions? (get an idea if it is elite only/men only/ or common women & men)
• Who are served/not served by the HP wells? (Distribution over country, unserved areas)
• What is the current service level and is it maintained over time (population growth)
• Are those served using only handpumps the year round for drinking and food management issues
Maintenance
• Who maintains/manages the handpumps? Who is responsible for what (M/F)? How much work is involved? Is it compensated? Who benefits from training, functions, jobs: men, women, elite or common people?
• How well are the handpumps maintained and managed? Strengths and weaknesses/major problems - technically/ administratively/ financially/ environmentally?
• What is the replacement history for wells/handpumps? Who finances replacements?
Performance Monitoring
• Project level
• Clear project objectives (short term objectives and for R&D projects it should also be longer term).
• Measurable monitoring indicators
• Do they monitor and act upon it
• Frequency of visits
• How do they relate to the regions and is this satisfactory
• How is monitoring done of the inputs and outputs
• Is anything monitored? What aspects? By whom? Records kept? Data used? By whom & resulting in what action?

Page 13 of Annex 2
5. Questions Related to Management Issues
Cost distribution patterns
• Cost distribution per year (pie chart) showing the different key issues: staff cost (distinguishing between programme staff and administrative staff, office cost, travel, hardware, consultants, funding of partner operations. This could be established for the whole period, and in the final report shown for key episodes: central office, decentralisation, software orientation etc.
• Cost pattern over the years (bar graphs). Again I would ask them for the whole period and only thereafter select key items which you would like to relate to other issues such as inputs in terms of UNICEF money and external money, outputs in terms of number of thematic issues, number of states
• Distribution of funds over key themes: water, sanitation, IEC etc.
• Distribution of funds between implementation and innovation (pilot projects)
Staff Management
• Staff distribution over the years (see also1.1), making a gender differentiation and covering background (hardware/software/management)
• Length of contract
• Performance indicators and incentives (related to UNICEF objectives and key issues e.g., they consider partnership their main trust, is this reflected)
• Use of consultants (selection criteria, performance review, and consultant's data bank?)
State and Regional offices
• UNICEF went from central to regional and then to state why did they regionalize (management or influence). Can it be shown that opening up an office in a State resulted in better linkages and better contacts, but also better outputs. Are the regional offices just new offices with general tasks (as they seem to have; eg an extra management layer that is not content oriented). So what do the managers do for WES; towards the future it may be different if integration becomes more important)
• What support is provided by the state offices
• How is monitoring done of the inputs and outputs
• Have these offices state level objectives for example for integration
• Frequency of visits
• An interesting management question is if the procedures for internal projects are more/less time consuming then the external projects
• To what extent UNICEF is reflected in the reports of government
• Results of pilot projects (defluoridation)
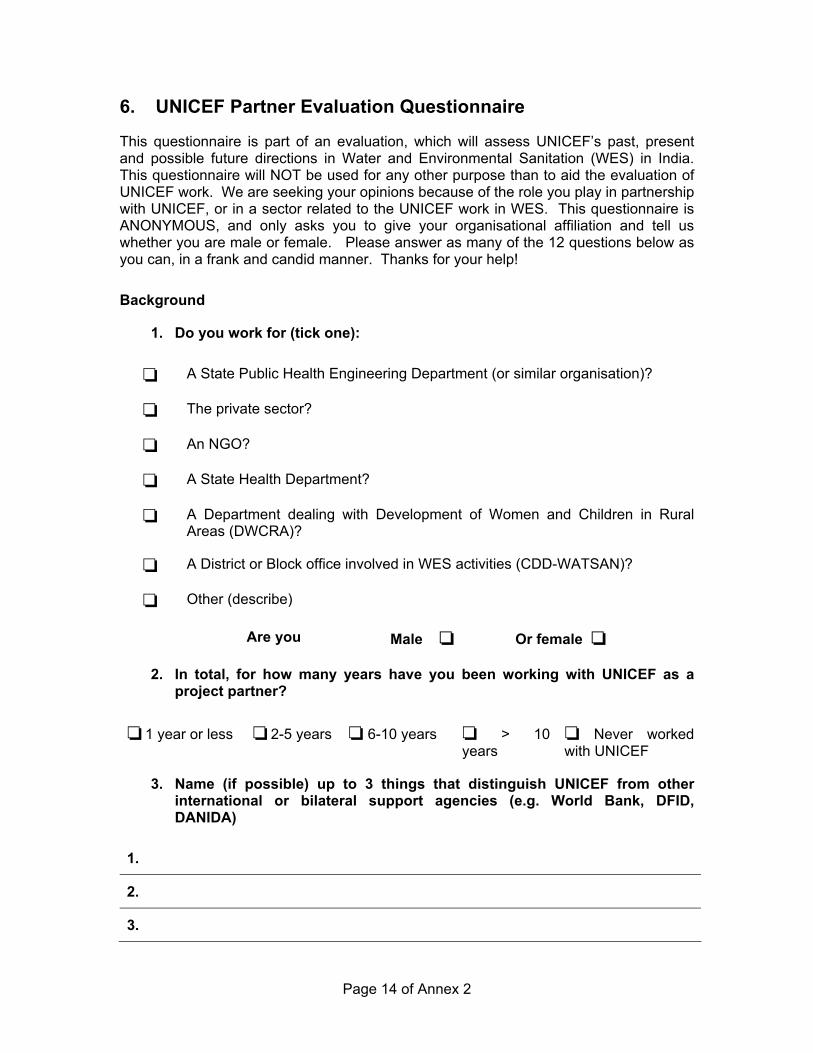
Page 14 of Annex 2
6. UNICEF Partner Evaluation Questionnaire
This questionnaire is part of an evaluation, which will assess UNICEF’s past, present and possible future directions in Water and Environmental Sanitation (WES) in India. This questionnaire will NOT be used for any other purpose than to aid the evaluation of UNICEF work. We are seeking your opinions because of the role you play in partnership with UNICEF, or in a sector related to the UNICEF work in WES. This questionnaire is ANONYMOUS, and only asks you to give your organisational affiliation and tell us whether you are male or female. Please answer as many of the 12 questions below as you can, in a frank and candid manner. Thanks for your help!
Background
1. Do you work for (tick one):
❏ A State Public Health Engineering Department (or similar organisation)?
❏ The private sector?
❏ An NGO?
❏ A State Health Department?
❏ A Department dealing with Development of Women and Children in Rural Areas (DWCRA)?
❏ A District or Block office involved in WES activities (CDD-WATSAN)?
❏ Other (describe)
Are you Male ❏ Or female ❏
2. In total, for how many years have you been working with UNICEF as a project partner?
❏ 1 year or less ❏ 2-5 years ❏ 6-10 years ❏ > 10 years
❏ Never worked with UNICEF
3. Name (if possible) up to 3 things that distinguish UNICEF from other international or bilateral support agencies (e.g. World Bank, DFID, DANIDA)
1.
2.
3.

Page 15 of Annex 2
4. Thinking about women and children in India, and the best use of UNICEF’s limited resources, please indicate how important you think it is that UNICEF contributes to the activities listed below. Please tick ONE box in each row, and add any other WES activities about which you feel strongly at the end:
Very Important
Important Not so Important
Should NOT be done by UNICEF
Rural water supply
Hygiene/health education
Total sanitation concept
Protecting water resource quality and quantity
School sanitation and hygiene
Latrine construction
Training and capacity building for WES
Monitoring water quality
Urban water supply for poor
Urban sanitation for poor
Developing new technologies
Other activities? describe below:

Page 16 of Annex 2
5. How can UNICEF best support the above activities?
❏ Development of new approaches ❏ Workshops & training
❏ Advocacy ❏ Doing the Work themselves
❏ Funding others to do the work
❏ Other (please specify)
6. UNICEF has worked to introduce policy changes in WES at central level and in the states. In your opinion, has UNICEF had influence on the following specific policy questions? And, if so, how much at each level?
Please give scores below, and add any items which you think should be included in the list. [ 3 = very influential, 2 = influential, 1 = not so influential, 0 = don't know, or X = not applicable (policy is unchanged).]
Policy questions At Central level
At State Level
Consideration of boreholes and hand pumps as major technology choices for water supply
Decentralised maintenance and management of WES
Cost recovery for O&M of water systems
Integrated water resource management
Enhanced women's participation
Pour-flush latrines as major technology choice
Wider choice of latrine types
Reduction of subsidies on household latrines
Increased user participation in WES projects
Inclusion of hygiene promotion in WES projects

Page 17 of Annex 2
7. UNICEF has used different mechanisms to support policy changes in, and improve field implementation of, WES. How effective have these mechanisms been?
[ 3 = very effective, 2 = somewhat effective, 1 = not effective, 0 = don't know, X = not applicable (UNICEF did not use this mechanism) ]
Effective in influencing
policy
Effective in improving implementation
Publishing strategy papers
organising conferences
organising workshops
training
supplying materials & equip
funding your work
supplying information
supplying educational material
promoting private sector in project implementation
advising govt. and staff
developing new strategies
encouraging standardisation

Page 18 of Annex 2
8. Now we would like to ask you about your experiences in co-operating with UNICEF in your own programmes and projects. When you think of the content of your work, has UNICEF in any way helped do your work better? List up to three aspects:
1.
2.
3.
9. Are there any areas in the content of your programme where UNICEF could have done better, or could have supported the programme more effectively?
Aspects that could be better How? (Your recommendation)
10. Apart from co-operation in the content of your programme and project work, there are also administrative aspects of the co-operation with UNICEF; these include contracting, payment, reporting, answering letters or requests, etc. Can you mention any administrative strengths of UNICEF that you have experienced?
1.
2.
3.

Page 19 of Annex 2
11. Are there any administrative weaknesses in your co-operation with UNICEF?
1.
2.
3.
12. Is there anything else you would like to add or clarify about UNICEF’s work in the Water and Environmental Sanitation sector? If so, we would be grateful for any additional thoughts you may wish to share.
Thank you for taking the time to answer this questionnaire! We will use these results in evaluating the UNICEF programme and will share the results of this questionnaire with all who took part.

Page 20 of Annex 2
7. Evaluation Questionnaire for UNICEF Staff
This questionnaire is part of an evaluation that will assess UNICEF’s past, present and possible future directions in Water and Environmental Sanitation (WES) in India. This questionnaire will NOT be used for any other purpose than to aid the evaluation of UNICEF work. We are seeking your opinions because of the role you play in UNICEF. This questionnaire is, however, ANONYMOUS so please be as frank and candid as you can. Please answer as many of the following 14 questions as you can.
13. Background
Do you work on UNICEF Do you work in
❏ Water Projects ❏ UNICEF Delhi Office
❏ Health Projects ❏ UNICEF State Office
❏ Education Projects
❏ Are you ex-UNICEF WES Staff?
Are you Male ❏ Or female ❏
14. In total, how many years have you worked in UNICEF?
❏ 1 year or less ❏ 2-5 years ❏ 6-10 years ❏ > 10 years
15. Name (if possible) up to 3 things that distinguish UNICEF from other international or bilateral support agencies (e.g. World Bank, DFID, DANIDA)
1.
2.
3.

Page 21 of Annex 2
16. Thinking about women and children in India, and the best use of UNICEF’s limited resources, please indicate how important you think it is that UNICEF contributes to the activities listed below. Please tick ONE box in each row, and add any other WES activities about which you feel strongly at the end:
Very Important
Important Not so Important
Should NOT be done by UNICEF
Rural water supply
Hygiene/health education
Total sanitation concept
Protecting water resource quality and quantity
School sanitation and hygiene
Latrine construction
Training and capacity building for WES
Monitoring water quality
Urban water supply for poor
Urban sanitation for poor
Developing new technologies
Other activities? describe below:

Page 22 of Annex 2
17. How can UNICEF best support the above activities?
❏ Development of new approaches ❏ Workshops & training
❏ Advocacy ❏ Doing the Work themselves
❏ Funding others to do the work
❏ Other (please specify)
18. UNICEF has worked to introduce policy changes in WES at central level and in the states. In your opinion, has UNICEF had influence on the following specific policy questions? And, if so, how much at each level?
Please give scores below, and add any items which you think should be included in the list. [ 3 = very influential, 2 = influential, 1 = not so influential, 0 = don't know, or X = not applicable (policy is unchanged).]
Policy questions At Central level
At State Level
Consideration of boreholes and hand pumps as major technology choices for water supply
Decentralised maintenance and management of WES
Cost recovery for O&M of water systems
Integrated water resource management
Enhanced women's participation
Pour-flush latrines as major technology choice
Wider choice of latrine types
Reduction of subsidies on household latrines
Increased user participation in WES projects
Inclusion of hygiene promotion in WES projects

Page 23 of Annex 2
19. UNICEF has used different mechanisms to support policy changes in, and improve field implementation of, WES. How effective have these mechanisms been?
[ 3 = very effective, 2 = somewhat effective, 1 = not effective, 0 = don't know, X = not applicable (UNICEF did not use this mechanism) ]
Effective in influencing
policy
Effective in improving
implementation
Publishing strategy papers
organising conferences
organising workshops
training
supplying materials & equip
funding your work
supplying information
supplying educational material
promoting private sector in project implementation
Advising govt. and staff
Developing new strategies
Encouraging standardisation

Page 24 of Annex 2
20. Now we would like to ask you about your experiences in working with the various partners of UNICEF. Can you mention any strengths of working with these partners?
(If you have not worked with this type of partner please write "not applicable". If you have worked with this type of partner, but cannot think of any strengths, please write "no strengths".) List up to three aspects for each:
Partner Strengths of Co-operation
1.
2.
GOI
3.
1.
2.
NGOs
3.
1.
2.
Private Sector*
3.
* e.g. contractors, manufacturers, equipment suppliers, consultants

Page 25 of Annex 2
21. Have you experienced any weakness or problems in working with any of these partners?
(If you have not worked with this type of partner please write "not applicable". If you have worked with this type of partner, but cannot think of any strengths, please write "no strengths".) List up to three aspects for each:
Partner Weakness with partner
1.
2.
GOI
3.
1.
2.
NGOs
3.
1.
2.
Private Sector
3.

Page 26 of Annex 2
22. Are there any aspects of the content (as opposed to management or administration) of your work with these partners where UNICEF could have done better, or could have offered better support?
(If you have not worked with this type of partner please write "not applicable". If you have worked with this type of partner, but cannot think of any strengths, please write "no strengths".) List up to three aspects for each:
Partner Room for improvement in UNICEF
1.
2.
GOI
3.
1.
2.
NGOs
3.
1.
2.
Private Sector
3.
23. Apart from the content of programmes and projects, there are also administrative aspects of the Co-operation, in contracting, payment, reporting, answering letters or requests, etc. Can you mention any administrative strengths of UNICEF’s work with your partners?
1.
2.
3.

Page 27 of Annex 2
24. Are there any administrative weaknesses in UNICEF's work with partners that need attention?
1.
2.
3.
25. How do you find relations between the UNICEF Delhi office and the Field Offices? List up to three things that work well, and three things that need improvement.
Work well Need improvement
1.
1.
2.
2.
3.
3.
26. Is there anything else you would like to add or clarify about UNICEF’s work in the Water and Environmental Sanitation sector? If so, we would be grateful for any additional thoughts you may wish to share.

Page 28 of Annex 2
8. Stakeholders Assessment
1. Objectives.
The objectives of the stakeholder assessment are to learn, in a structured manner and through participatory tools and techniques, how the various stakeholders view the work and impacts of the UNICEF WES sector in India and where UNICEF can make improvements.
2. Focus areas.
Focus areas for the stakeholders' assessment of their relationships with the UNICEF WES sector were taken from the Terms of Reference for the Evaluation. They include Co-operation, Partnership (define difference), with donors, technical and social government departments at central and state levels (Water Supply and Sanitation, Health, Panchayati Raj, Dept. of Women and Children, NGOs working in the sector, the industrial private sector and related programmes in UNICEF); Relevance of UNICEF work as perceived by type of partners and levels; Funding; Working Relations for contents and administrative and organisational aspects; ; Influence (from UNICEF on partners and Partners on UNICEF) between UNICEF and Partners and Partner Satisfaction; Donor Support.
3. Indicators, techniques and tools.
The challenge the team set itself was to formulate objectively measurable indicators for participatory assessment not only at the community but also at the institutional level. The proposed indicators, methods and tools are given in the table below. The questionnaire survey through which much of the data will be collected will be anonymous and only distinguish type and level of organisation and gender of respondents to allow a meaningful analysis of the responses. In view of the considerable workload of many respondents questions will mainly be of the semi-structured type but with options for expansion or elaboration if so desired.
For other key aspects of the evaluation that cannot, or not only be assessed through the institutional and community assessments, such as costs, cost financing and cost effectiveness of various aspects, indicators and methods of measurement have been, or are being formulated separately.
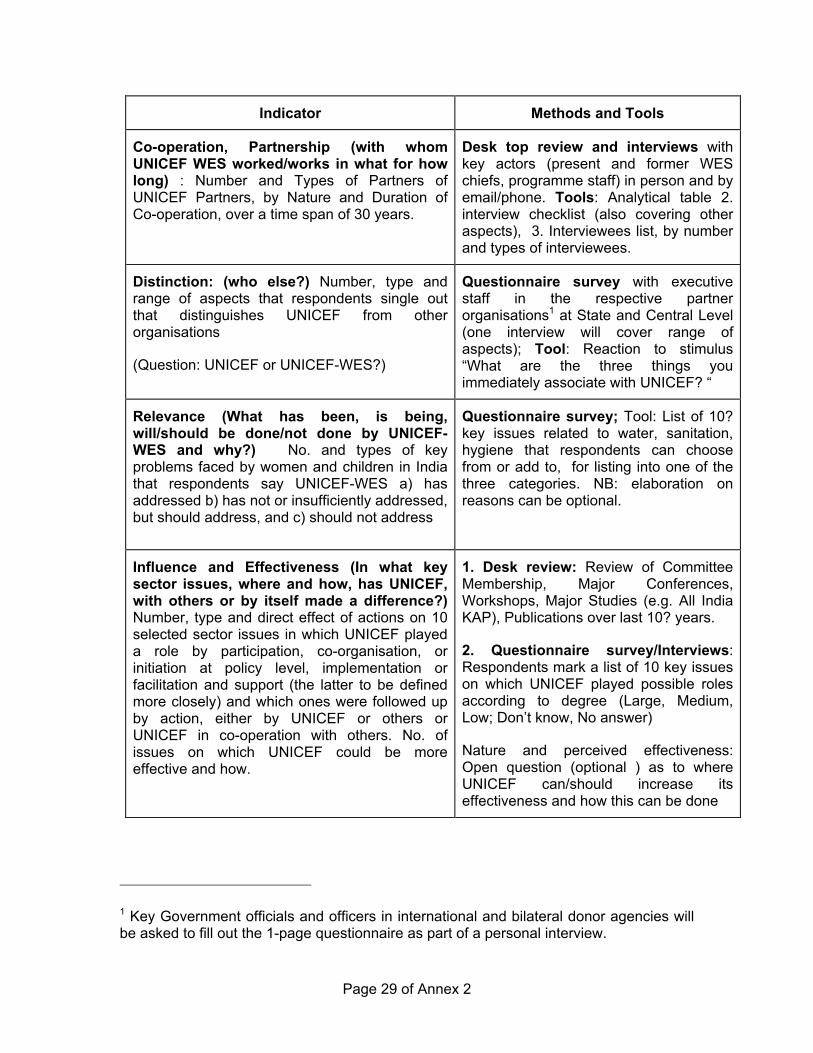
Page 29 of Annex 2
Indicator Methods and Tools
Co-operation, Partnership (with whom UNICEF WES worked/works in what for how long) : Number and Types of Partners of UNICEF Partners, by Nature and Duration of Co-operation, over a time span of 30 years.
Desk top review and interviews with key actors (present and former WES chiefs, programme staff) in person and by email/phone. Tools: Analytical table 2. interview checklist (also covering other aspects), 3. Interviewees list, by number and types of interviewees.
Distinction: (who else?) Number, type and range of aspects that respondents single out that distinguishes UNICEF from other organisations
(Question: UNICEF or UNICEF-WES?)
Questionnaire survey with executive staff in the respective partner organisations1 at State and Central Level (one interview will cover range of aspects); Tool: Reaction to stimulus “What are the three things you immediately associate with UNICEF? “
Relevance (What has been, is being, will/should be done/not done by UNICEF-WES and why?) No. and types of key problems faced by women and children in India that respondents say UNICEF-WES a) has addressed b) has not or insufficiently addressed, but should address, and c) should not address
Questionnaire survey; Tool: List of 10? key issues related to water, sanitation, hygiene that respondents can choose from or add to, for listing into one of the three categories. NB: elaboration on reasons can be optional.
Influence and Effectiveness (In what key sector issues, where and how, has UNICEF, with others or by itself made a difference?) Number, type and direct effect of actions on 10 selected sector issues in which UNICEF played a role by participation, co-organisation, or initiation at policy level, implementation or facilitation and support (the latter to be defined more closely) and which ones were followed up by action, either by UNICEF or others or UNICEF in co-operation with others. No. of issues on which UNICEF could be more effective and how.
1. Desk review: Review of Committee Membership, Major Conferences, Workshops, Major Studies (e.g. All India KAP), Publications over last 10? years.
2. Questionnaire survey/Interviews: Respondents mark a list of 10 key issues on which UNICEF played possible roles according to degree (Large, Medium, Low; Don’t know, No answer)
Nature and perceived effectiveness: Open question (optional ) as to where UNICEF can/should increase its effectiveness and how this can be done
1 Key Government officials and officers in international and bilateral donor agencies will be asked to fill out the 1-page questionnaire as part of a personal interview.

Page 30 of Annex 2
Indicator Methods and Tools
Appreciation (What characteristics of UNICEF-WES are appreciated most and least by the various groups?) Proportion of positive and negative reactions; Nature or responses
Questionnaire survey. Tool : Open lists for positive and negative statements. For interviews: cards
Strength and weaknesses of working relations (How well do the various parties work together in contents and organisationally. What is appreciated most and least?2 )
Percentage of strengths versus weaknesses for horizontal and vertical co-operation; nature of strengths and weaknesses
A separate addendum to the questionnaire for each category, asking respondents to list strengths and weaknesses of the co-operation with regard to:
a) programme contents and strategies, and
b) administrative and organisational aspects. Secondly asking each respondent to mark the aspect valued most (one) and least (one) with an asterisk. Question: how clear is the meaning of programme contents and strategies?
2 This indicator will be assessed separately and vice-versa for UNICEF WES Hq-Field office, UNICEF WES-GoI at Central and State level and UNICEF WES-UNICEF related Programmes at Hq and State level

Page 31 of Annex 2
9. Participatory Users Assessments
1. Aim. The aim of the participatory user assessments is to learn, in a general sense, from women, children and men in the communities how they (1) experience the UNICEF and GOI programme/projects on water, sanitation and hygiene and (2) view the impacts on their lives.
2. Focus. Together with the users a limited number of aspects will be assessed, using mainly participatory tools and techniques. For water supply these are (1) access, (2) sustainability (3) participation in planning and implementation and (4) community maintenance, management and financing. For sanitation: (1) latrine coverage (2) child excreta disposal and (3) school sanitation. For health and hygiene practices: (1) sources of water use (2) amounts of water use (3) handwashing by children, and (4) ORT. (Need to justify the selected subjects?)
3. Methods. For the testing the teams will use elements from the Participation Learning for Action (PLA) procedures developed under the Gender Initiative of UNDP-World Bank, the Collaborative Council and IRC and tools from the participatory hygiene assessment guidelines (please adjust - I did not have the exact title)of the London School of Hygiene and Tropical Medicine.
4. Indicators, techniques and tools. The table below gives the proposed indicators and tools/techniques for participatory assessment.
Indicators Techniques and Tools
Water sources: Easy access for all
Nearness of (a) any water sources for washing and bathing; and (b) safe water sources for drinking.
Social mapping of community clusters and their differential sources of water. Assessment of easy access to sources appropriate for their particular uses. Assessment of easy of access for poor.
Water supply: Service quality in terms of quantity, quality and reliability
Scoring using PLA tables and methods
Participation. Who has shared in information, decision making(on siting, quality control, maintenance, management etc.), in work, functions, training, benefits?
Scoring using gender segregated pocket voting and analysis from the PLA procedures
Wealth classification and benefit analysis from project process and impacts by male/female, rich/poor.

Page 32 of Annex 2
Indicators Techniques and Tools
Sustainability. Level of quality of community maintenance, administration and financing
Scoring using PLA tables and methods
Sanitation: Latrine coverage Review of village statistics
Child excreta disposal Three pile cards sorting and Focus Group Discussion with mothers and fathers based on .....
School sanitation
Handwashing by children
Testing of demonstrated understanding of correct handwashing practices. Focus group discussion on young siblings learning of hygiene practices. Observation of school sanitation and handwashing provisions using checklist.
Sources and uses of water, seasonal variation
Pocket voting on water source use by purpose and season, by women and men
Amounts of water used per capita per day
Rough estimate, FGD
ORT Open question, FGD
Perceived change in WES, Community Management, Gender
Analysis of Change, by gender and class and Indicative Actor/Factor Assessment
(To which interventions are noted changes ascribed, e.g. certain programmes, decentralisation through PR etc.?)
5. Procedures and participants. In the communities, the team will first contact the local authorities, introduce and get permission and collect local data using a checklist on key features most relevant for the study. (Checklist will be compiled as part of the study preparations and will include such aspect as basic geographic, demographic data, distance to health facilities, sanitation coverage, etc.). Subsequently the team will visit the schools and do the PLA with one school class per institution. At later times convenient to the householders, incl. women, one team member will do the remaining PLA activities in the/a poor section of the community, and one in the/a better off section. Participants will be women and men (mothers and fathers). A detailed procedure and adjustment of the PLA tools to the specific requirements of the study will be part of the work preparation.
6. Locations. The PLA assessment will be carried out in 2 clusters in 2 states. One state will be a hard rock area, the other one without hardrock and plenty of water. One state will be in the North, one in the South. Within the states, one cluster will be in a district where several UNICEF supported projects have been carried out concurrently

Page 33 of Annex 2
(HP construction and maintenance, sanitation, school sanitation, sanitary marts, CDD/WATSAN). The other cluster will be in a district where regular government water (handpump) and sanitation programmes have been implemented. Where possible one of the three communities will be low-income urban. More detailed selection criteria, e.g. on length and types of interventions, presence/absence of strong Panchayats, location inblocks with baseline data, etc. will have to be set. Proposed procedure: UNICEF will provide before 19 November to the responsible evaluation team member and the NGO for the two states selected for the field visits by the evaluation team a list of the districts where UNICEF related activities have and have not taken place, listing names of all blocks where UNICEF associated activities have taken place, plus types of activities, duration and partners involved. The Consultant with support from the responsible evaluation team member will then draw a random sample for the user assessments.
7. Consultants, Timing and Output. The PLA will be implemented by an NGO with experience in the use of the two methodologies and able to work in the selected states, if necessary by teaming up with local resources. The assessment will be fully independent - the team will not present the association with UNICEF and the evaluation. As a presentation to the officials is necessary it is proposed that the study will be implemented under the auspices of the RGNDWM. The PLA will be carried out in November-December 1998. The PLA team will deliver a report with quantitative and qualitative data and their analysis before 1 January 1999.

Page 1 of Annex 3
Annex 3: List of Persons Interviewed
1. Interviews in person
Organisation Name - Designation
UNDP/World Bank Water and Sanitation Program
Ms. Rekha Dayal, Program Advisor
Ms. Barbara Evans, Program Officer
Mr. Minnatullah, Program Officer
DFID, New Delhi Mr. Nigel RP Kirby, Engineering Advisor
Unicef Tamil Nadu and Kerala Ms. Isabell Austine, State Representative
Mr. Sundarraman, WES Consultant
Unicef West Bengal Ms. Dorothy Rozga, State Representative
Ingersoll Rand, Bangalore Mr. B. Sinha Roy, Marketing Manager
Mr. H. K. Ramprasad, Manager, product Engineering
Mr. G. Kalyanasum, Training Manager
Crown Agents, Bangalore Mr. T. R. Vasuvedan, Regional Controller
Karnataka Water Pumps Ltd., Bangalore
Mr. D.R. Shankaranarayana Gupta, Technical Director
Mr. B. Sreenivasulu Gupta, Manager Export
Mr. Subramanyam Setty, Managing Director
Ex-Richardson and Cruddas Mr. H. V. Krishna Swamy, retired General Manager
Mr. T. K. Kannan, retired Chairman
Ex-Crown Agents Mr. N. S. Prasad, Quality Consultant
Rural Development Department Tamil Nadu
Dr. Ramesh Chandra Panda, Special Commissioner and Secretary
Directorate of Rural Development, Tamil Nadu
Mr. K. Shanmugam, director of Rural Development

Page 2 of Annex 3
Panchayati Raj Engineering Department, Hyderabad
Mr. M. V. Swami, Joint Director
Mr. Rajasekhar Reddy, Dy. Exec. Engineer, Rural Water Supply
UNICEF, Hyderabad Mr. D. P. Vaish, Programme Officer
Meera & Ceiko, Hyderabad Mr. Mahesh Desai, General Manager
Rig Operator, Hyderabad Mr. Gowandas Reddy,
KLR Rigs Company, Hyderabad Mr. D. Lakshman, General Manager
Mr. B. Venkatesan
Collector Office Coimbatore Mr. G. Santhanam, Collector
Mr. S. Vijayakumar, Additional Collector Dev.
Ms. Nirmala Ramanathan, Personal Assistant to the Collector (Development)
TWAD Board, Coimbatore Mr. M. Natarajan, Executive Engineer (mechanical)
Mr. P. K. Gopalaksishan, Executive Engineer (supply Division)
Madukkarai Block Mr. T.R. Gangaraj, Block Development Officer
UNICEF, Jaipur Ms. Sumita Ganguly, State Representative
Ms. Shikka Wadhwa, Proj. Officer Communications
Mr. R. C. Bhatnagar, Proj. Officer WES
Mr. S. N. Singh, Assist. Proj. Officer ES
Mr. R. C. Agrawal, Consultant
Dept of Rural Development & Panchayati Raj, Rajasthan
Mr. O. P. Bihari, Dev. Commissioner & Principal Secretary
Mr. Ashish Bahuguna, Secretary Rural Development
Mr. Damoder Sharma, Director Rural Development
Mr. V. K. Soral, Addl. Chief Town Planning
Mr. Ramesh Bhardwat, Exec. Engineer Rural Development Dept.
PHED, Rajasthan Jaipur Mr. Prabhat Dayal, Special Secretary
Mr. S. K. Kulshreshth, Chief Engineer Rural

Page 3 of Annex 3
Mr. Satish Chandra Mathur, Addl. Chief Engineer
Mr. B. P. Acharya, Executive Engineer
Revenue Dept. Jaipur Ms. K. Bhatnagar, Secretary (former Secr. PHED)
Zila Parishad Ajmer, Rajasthan Mr. Sunil Kumar Jha, Chief Executive Officer
Mr. Mohan Lal Mittal, Project Officer J.C
Mr. Sardar Chand Sacheti, Project Officer (RSP)
PHED, Jaipur Mr. B. M. Jat, Asst. Engineer
Mr. K. P. Sharma, Exec. Engineer
Mr. A. P. Sharma, Jun. Engineer
PHED, Alwar Mr. R. C. Goyal, Superintending Engineer
Mr. R. P. Mathur, Executive Engineer
Swajal PMU, Dehra Dun Mr. R. P. Tomar, Project Manager
Mr. E. Arun Dobhal, Dy. Project Manager
WDO, Women’s Development Organisation, Support. Org.
Dr (Ms) K.K. Sharma, Teamleader
Swajal PMU, Uttarkashi Mr. D. R. Joshi, Project Manager
Mr. V. N. Uniyal, Dy. Project Manager
S.B.M.A. Uttarkahshi, Support Org. Mr. Anand Bhatt, Team Leader
Village Water and Sanitation Committee, Uttarkashi
Mr. Jabor Singh Rana, Chairman Sadang Village
Mr. Hukam Singh Rana, Chairman Sada Village
Mr. Etuweji Lal, Chairman Didsari Village
Inalsa, Limited, New Delhi Mr. Krishan Kalra, Director
Mr. Suresh Sharma, General Manager
Mr. Naresh Metha, DY. General Manager Export
Bureau of Indian Standards Mr. C. D. Bhumkar, Director
Mr. D. K. Mathur, Addl. Director

Page 4 of Annex 3
Ajay Ind. New Delhi Mr. D. J. Jain, Director
Col. Verma
ETC India, Netherlands Assisted Projects Office, Hyderabad
Mr. Raj Kumar Daw, Technical Programme Coordinator
2. Interviewed by e-mail (questionnaire):
UNICEF Office, New York
Mr. Greg Keast, Evaluation
UNICEF – elsewhere
Mr. Mansoor Ali – UNICEF Nigeria
Mr. Philip Wan – UNICEF Myammar
Mr. M. Akhter – UNICEF Bangladesh
Mr. V. Alkari
Mr. Colin Glennie – UNICEF Sri Lanka
Ex-UNICEF
Mr. Martin Beyer, ex Chief WES
Ms. T.V. Luong, ex Sanitation Officer
Mr. John Skoda
UNICEF-New Delhi
Mr. Allan Court, Country Representative, UNICEF
Ms. Razia Ismail, Deputy Director, Programmes
Mr. Peter Delahaye, Deputy Director of Operations, UNICEF-New Delhi

Page 5 of Annex 3
Mr. Ruper Talbot, Chief Water & Environmental Sanitation Sector, UNICEF-New Delhi
Ms. Anu Dixit, Communication/Social Mobilisation Officer
Dr. Anan, School Sanitation Advisor, UNICEF-New Delhi
Mr. B.B. Samanta, former Sanitation Officer, UNICEF-New Delhi (Now with UNICEF-Iraq)
Mr. Henk van Norden, Water Coordinator, UNICEF-New Delhi
Mr. L.N. Balaji, Chief Planning, UNICEF-New Delhi
Dr. Richard H. Young, Chief, Programme Development and Processes, UNICEF-New Delhi
Dr. K. Suresh, Project Officer (Epidemiology), UNICEF-New Delhi
Mr. Arun Kumar Mudgal, project Officer WES, UNICEF-New Delhi
Mr. Dipak Roy, Project Officer, Water & Environmental Sanitation, UNICEF-New Delhi
Ms. Chetana Kohli, PO Literacy and Media, UNICEF-New Delhi
Mr. Arun Mudgerikar, Programme Officer (MIS), UNICEF F.O., Ghandinagar, Gujarat
(RG)NDWM
Mr. Ajit Singh, In-charge training programme for well drillers (retired), formerly with RGNDWM and UNICEF
Mr. Sanjay Mitra, Director (Monitoring), RGNDWM
Mr. Nayak,
Mr. P.K. Sivanandan, Principal Secretary, Rural Development & Scheduled Castes/ Scheduled Tribes, Trivandum, Kerala and former Director RGNDWM
ESAs
Mr. C.D.L. Brands, Water and Sanitation Coordinator, Neda
Mr. Avinash Zutschi, Programme Officer, Neda
Mr. Ramesh C. Mukalla, Programme Officer, Sida
Mr. Raj Kumar, Netherlands Assisted Project Office, Hyderabad

Page 6 of Annex 3
Mr. Jitsuo Takasugi, Resident representative JICA
Mr. Toshiaki Tanaka, Dty Resident Representative JICA
Mr. K. Minnatulah, Programme Officer, Water and Sanitation Program, World Bank
Tamil Nadu
Ms. Jaya Gokulamani, Assistant Project Officer, UNICEF Field Office, Chennai
Mr. Sundaraman, Consultant Water, UNICEF Field Office, Chennai
Mr. Swavan Singh, Managing Director Tamil Nadu Slum Clearance Board
Mr. S.A. Jaganadhan, Community Development Wing, Tamil Nadu Slum Clearance Board
Ms. K.N. Vijayanthi, Community Development Officer, Tamil Nadu Slum Clearance Board
Mr. Ramesh Chandra Panda, Secretary, Dept. of Rural Development, Chennai
Mr. K. Shanmugam, Director Dept. of Rural Development, Chennai
Mr. V.M. Karimullah Sheriff, Ass. Director, Dept. of Rural Development, Chennai
Ms. B.Seethalakshmi, Deputy Block Development Officer (Water Supply), Dept. of Rural Development, Chennai
Mr. J. Sampath, Project Officer, Dept. of Rural Development, Erode District
Ms. T. Savithiri, Superintendent, District Project Nutrition Office, Erode
Ms. M. Ginanaguru, District Project Nutrition Officer, District Project Nutrition Office, Erode
Ms. R. Latna, Community Nutrition Instructress (Reserve), District Project Nutrition Office, Erode
Ms. K.K. Vasmitty, Panchayat President, Kongar Pallayam
Mr. T.T. Uttammaraj, Block Development Officer, T.N. Pallayam
Ms. P.R. Ramila, Extension Officer, Social Welfare Dept. T.N. Pallayam
Ms. A.K. Pushpavathi, Lady Mechanic, Erode

Page 7 of Annex 3
Rajasthan
Ms. Sumita Ganguly, Chief Field Office, UNICEF Jaipur
Dr. R.C. Bhatnagar, Senior Project Officer, Water Supply and Sanitation, UNICEF, Jaipur
Mr. S.N. Singh, Ass. Project Officer, Water Supply and Sanitation, UNICEF, Jaipur
Mr. Ahmed Salman, ??, Convergent Community Action, UNICEF, Jaipur
Ms. Shikha Wadhwa, Focal Point Advocacy Child Rights/IEC/Advocacy, Social Mobilisation and PR, UNICEF, Jaipur
Mr. S. Joshi, Programme Officer Health & Nutrition, UNICEF, Jaipur
Mr. O.P. Bihari, Development Commissioner & Principal Secretary, Gvt of Rajathan, Jaipur
Mr. Ashish Bahuguna, Secretary Rural Development & Panchayati Raj Dept., Jaipur
Mr. T. Srinivasan, Secretary, Special Schemes, Gvt of Rajathan, Jaipur
Mr. Damodar Lal Sharma, Director Rural Develoment Dept., Jaipur
Mr. Prabhat Dayal, Special Secretary, PHED
Mr. P.K. Gupta, Chief Engineer
Mr. V.K. Soral, Additional Chief Town Planner, Rural Develoment Dept., Jaipur
Mr. Rajesh Bhardwaj, Executive Engineer, Rural Develoment Dept., Jaipur
Mr. Acharya, Drilling Engineer,PHED, Jaipur
Mr. Surathur, Additional Chief Engineer, Rural Schemes, PHED, Jaipur
Mr. Prakash, Nodal Officer HRD & Director IEC cell, PHED, Jaipur
Mrs. Krishna Bhatnagar, Former Secretary, PHED

Page 8 of Annex 3
Udaipur
Ms. Manjari Bhanti, Director, District Women Development Agency
Dr. (Ms) Prerana Vaish, Secretary, SARITA
Mr. Akhil Arora, Director, SWACH
Ms. Alka Srimali, Assistant Director, SWACH
Mr. Surendra Singh, Driver/Interpreter
N.B. The list may not be complete. We extend our apologies to those resource persons who may not have been mentioned due to oversight.

Page 1 of Annex 4
Annex 4: Desktop Review
1. The Background of Human Development in India
India's human development record since Independence in 1947 remains mixed. Significant gains have been achieved in some fields, but there are serious shortfalls in other areas. From a human development perspective, there is still much scope for improvement.
A. Achievements and shortfalls
Between 1951 and 1995, per capita income more than doubled, food grain production increased fourfold, and the index of industrial production went up 14 times. The country has achieved near self-sufficiency in food grain production, has built up a good food grain reserve, and famines have been virtually eliminated. Life expectancy nearly doubled to 61 years and infant mortality was halved to 74 deaths per 1,000 live births during 1951-94. Literacy more than doubled during 1961-91, and India successfully established an impressive system of higher education.
Yet some 36% of India's population lives in income poverty - defined in terms of access to minimum calories needed for a decent living. And, despite the decline in income poverty from 55% in 1973-74 to 36% in 1993-94, the absolute number of people who are income poor has been increasing due to the growth in population. Between 1951-94, the number of income poor has doubled - from 170 million in 1951 to an estimated 340 million in 1994 as population has increased nearly three-fold. In a similar vein, gender gaps have been narrowing in a variety of spheres; India, however, remains one of the few countries where there are fewer women than men - 929 females per 1000 males - a reflection of systematic deprivation and strong anti-female bias that pervades society even today.
Poverty in India manifests itself in many other ways. Some 53% of children under four - some 60 million - remain malnourished. Close to 2.2 million infants die each year. Most of these deaths are avoidable. Nearly 350 million people 7 years and older are illiterate. And for females seven years and older, the proportion is 61%. Less than two-thirds of children reach Grade V of primary schooling, and of those completing Grade V, many cannot even read or write a simple sentence. Despite the government's claim that some 87% of the population have access to safe drinking water, safety and adequacy remain serious concerns. Sanitation coverage remains woefully inadequate. The country is confronted with rapidly declining water tables, deteriorating quality and increasing contamination.
B. Disparities and differentials
India has also emerged as a country of striking disparities. Certain states and districts of India report levels of social advancement that are similar to leading industrialised countries. Other parts of India report achievement levels that are worse than the average of the poorest countries in the world. Kerala, for instance, reports an Infant Mortality Rate of 13/1000 live births, whereas the figure for Madhya Pradesh is 97/1000 live births. Eight districts of Kerala with a combined population of some 15 million, reported in 1991 literacy

Page 2 of Annex 4
rates of 90% or more in the population seven years and older. At the other extreme is Jhabua district in Madhya Pradesh, which reports a literacy rate of 19%. In 6 other districts, where close to 11 million live, three out of four people cannot read and write.
Women fare worse than men on most human development indicators. Whereas typically life expectancy at birth for women exceeds that of men by 5 years, in the case of India, the differential was less than a year during 1989-93. In four states - Bihar, Madhya Pradesh, Orissa and Uttar Pradesh which account for nearly 30% of the country's population - life expectancy at birth for women was lower than that of men. A woman's life expectancy at birth in Uttar Pradesh (54 years) is around 20 years less than the life expectancy at birth for women in Kerala (74 years). In sharp contrast to the industrial world where there are, on average, 1,040 women for every 1000 men, the ratio is less than 900 in Haryana, Punjab and Uttar Pradesh. In 8 districts of India, there are fewer than 865 girls per 1000 boys in the age group of 0-6 years. Such systematic discrimination against girls and women is also reflected in the strikingly lower levels of literacy (39%) among women than among men (64%).
Even though caste barriers are breaking down, there is still social stigma associated with lower castes who face various forms of discrimination including the practice if untouchability. One out of four Indians belongs to communities classified as Scheduled Castes and Scheduled Tribes. Levels of social achievements among these communities remain strikingly lower than the rest of society. The National Family Health Survey (1992-93), for instance, estimated the-under-five mortality rate among Scheduled Castes to be 149 - almost 33% higher than the rate in the rest of the population. In 1991, only 24% of Scheduled Caste women and 18% of Scheduled Tribe women were literate. The literacy rate among rural women belonging to Scheduled Tribes is as low as 4% in Rajasthan and 9% in Andhra Pradesh.
Finally, there is a significant division between urban and rural services and opportunities. For example, whereas the life expectancy at birth for a person born in urban India was 64.9 years during 1989-93, it was only 59.4 years in rural India. Similarly, the literacy rate in urban areas (73%) is significantly lower than that in rural areas (45%). Three-fourths of the income poor live in rural areas. Income poverty rate in urban areas (30%) is lower than that prevailing in rural areas (39%). It is not however apparent that the problems of water availability, access and quality are in any way less in urban areas than in rural areas. With more than a third of the urban population residing in slums, problems of urban water and environmental sanitation are indeed serious.
These trends and differentials are also reflected in water supply and sanitation coverage.
2. Water Supply in the Indian Context
A. India's achievements in water supply
The last thirty years have been a period of remarkable achievement in the improvement of water supply in India. While the basic statistics speak for themselves, their interpretation is complicated by the variation in norms and definitions over the period of interest.

Page 3 of Annex 4
Latest estimates for India suggest that by 1997, 87% of the country's rural population and 85% of its urban population had access to safe drinking water. Nearly 95% of rural population had at least one source of water in the village. Expansion has been particularly rapid during the water decade when coverage went up from 31% to 56% in 1985, 74% in 1989-90 to 78% in 1991 and up to 80% in 1995.
Norms for defining access (followed since 1985) are the following:
• 40 litres per capita daily for human beings and additional 30 litres per capita per day for cattle in arid zones
• 30 litres per capita in desert districts
• one handpump for every 250 persons
• water source within 1.6 kilometres in the plains; and within 100 metres elevation in the hills
Figure 1: Population covered with drinking water
Safety norms also require that water should be free from biological and chemical contamination.
Prior to 1985, the practice was to identify "problem villages." In the early 1970s, for instance, GOI defined "problem villages" as:
• Villages where water is not available within a depth of 50 feet or within a distance of 1.6 kilometres
• Villages which are endemic to cholera
• Villages with problems of guineaworm infection
• Villages where water is unsafe due to the presence of excessive chloride, fluoride or iron.
40
50
60
70
80
90
100
1985 1990 1995
%
RuralUrban

Page 4 of Annex 4
A survey in 1972 classified 183,000 out of India's 575,658 villages (32%) as "problem villages." However, a subsequent study in 1980 estimated the proportion to be 40%.1
Comparison with other countries
India's achievements appear impressive in the global context. Data suggest that not only has India done better in water supply than Sub-Saharan Africa, but also that India's performance is better than other more opulent regions of the world including South East Asia (See Table 1).
Table 1: Access to safe water: India and select regions of the world
% of population without access to safe water 1990-96
INDIA 19
Latin America and the Caribbean 23
East Asia 32
South East Asia and Pacific 35
Sub-Saharan Africa 48
Source: Human Development Report 1998
Water supply alone does not predict health status. For instance, according to the 1998 edition of the State of the World’s Children, only 46 countries in the world that reported higher water coverage than India whereas 143 countries reported lower infant mortality rates than India. A similar picture emerges when we look at South Asia. Most recent data on access to safe drinking water suggest that Bangladesh has done "best' in terms of coverage with 97% of its population having access to safe water. The "worst" performer is Sri Lanka where 43% of the population does not have access to safe water. Even though India has done far better than Sri Lanka (only 13% of India's population does not have access to safe drinking water), Sri Lanka reports an infant mortality rate of 17 as against India's 73. Again, both Sri Lanka and Maldives do much better on human development than does India.
National achievements also mask the magnitude of the “unfinished agenda,” and areas where performance falls short of the norm:
• These statistics imply that 125 million Indians still do not enjoy adequate access to safe water.
1 The main reasons for the increase were cited as the incompleteness of the earlier survey and the impact of a continuous series of droughts.

Page 5 of Annex 4
• India’s unserved population accounts for 13% of the global total and 43% of the regional total.
• In 1994, “fully covered” habitations with access to safe water accounted for only 49%. Another 46% were only “partially covered.”2
• Some 32 million habitations had not been covered by way of access to safe water.
Some other statistics, the interpretation of which is more difficult3, include:
• The average per capita availability of drinking water was 27 litres as against the norm of 40 litres.
• Only half the rural population had access to 40 litres of water per capita daily.
• On average, 350-380 persons used a handpump against the norm of 250.
• Open dug-wells continued to be the primary source of drinking water for nearly 40% of the rural population in many states.
A new service criterion is proposed that a water source should:
• Serve a maximum of only 150 people,
• Be within a maximum distance of 1 kilometre in the plains or 50 metres elevation in hilly terrain, and
• Supply the same amount of water each day (40 litres per person per day). If this new norm is accepted, then India’s coverage will appear less satisfactory than it does now.
Water quality also remains a serious problem:
• 1086 habitations (312 in West Bengal) have been identified as being contaminated with arsenic;
2 The Habitation Survey of 1991-93 also introduced a three-fold classification of villages and habitations. A "fully covered" village or habitation is one where the entire population receives water supply at the rate of 40 lpcd. Thus, if a village or habitation had at least one source of adequate yield per 250 population, it will be taken as "fully covered." A village is treated as "partially covered" if the level of water supply is less than 40 lpcd. Normally this is reckoned by calculating the number of persons served by a spot source. That is, a village or habitation is partially covered if its population does not have at least one source of adequate yield for every 250 persons of its population. In case water is not available for part of the year such as summer, it is treated as "partially covered." The third category consisted of villages that were "not covered."
3 By and large, piped water is assumed to be “safe” whereas water from open wells is not. Private handpumps and tubewells are left out and only those installed by government are counted. Little if any adjustment is made for handpumps that are broken or tubewells that have dried up.

Page 6 of Annex 4
• 27,845 habitations are affected with excess fluoride (in excess of 1.5 mg/litre) affecting 25 million people
• 55,379 habitations are affected by excessive brackish water problems
• 58,325 habitations are faced with the problem of excess iron (more than 1 mg/litre)
While iron and salt in the water are not direct threats to health, they can make contaminated water sources more attractive to consumers who wish to avoid unpleasant taste and stained clothes.
Serious problems of water quality, contamination and declining water tables confront the country. Problems of water depletion are particularly serious in Gujarat, Rajasthan, Uttar Pradesh, Andhra Pradesh and Madhya Pradesh.
Current situation
If we accept the present definition and estimates of coverage, then the goal of ensuring universal access to safe drinking water in the next 5 years is indeed within India's reach. Even then, the achievement masks the grave crisis facing India. Major problems discussed in both government and non-governmental documents include the following:
• Contaminated water and unhygienic sanitation continue to cause diarrhoea and ill-health which accounts for nearly 400,000 child deaths in India annually.
• A heavy burden of drudgery is still imposed on women and young girls having to walk long distances to obtain safe water for household use. The perceived duty of girls within the family to fetch water, and perform other household chores, is another factor contributing to the denial of education for girls.
• Low awareness about the importance of hygienic practices actively contributes to nullifying the advantages of access to safe water.
• Water quality problems are becoming increasingly acute. At least 10% of the population has excess levels of fluoride, arsenic, iron or salinity in their sources of drinking water.
• Some borewells, long promoted as safe sources of water, are found to be fecally polluted because of poor well construction and dirty well surroundings.
• Sustainability of millions of water supply systems is under threat from falling water tables, caused by intensive over-exploitation of fresh water for irrigation and industry and the absence of a clear policy framework for competing uses of water.
• The fresh water resource is increasingly threatened by indiscriminate pollution of surface as well as ground water.
• The continued neglect of the environment in urban slums poses serious risks to child health and even survival.

Page 7 of Annex 4
• An aging water supply system means that public water supplies are often irregular or out of order for long periods. A recent Government study revealed, for instance, that 23% of handpumps, 14% of mini-piped schemes and 44% of larger piped water supply schemes were not functioning due to breakdown and poor maintenance.
• Low community consciousness and involvement remain factors that impede rapid progress.
Clearly much needs to be done to improve the child's environment.
Disparities in coverage
Published data on drinking water supply suggest that there is very little gap in coverage between rural (87%) and urban areas (85%). In general, the levels of development in urban areas, where 24% of India's population resides, have always been better in many respects than those found in rural areas.
It is difficult to get data on differential access across communities. Access to water remains a problem for people residing in arid zones or mountainous regions. Access to water in India is influenced not only by physical factors, but also by income, class and caste. People belonging to higher castes still prevent those belonging to lower castes from using the same well or hand-pump.
Some 52% of the population that fall in the category of “not covered” are from 4 states: Punjab (17%), Uttar Pradesh (16%), Assam (10%), and Madhya Pradesh (9%). One reason why Punjab reports such a high proportion is that private tubewells and handpumps are typically excluded from “coverage” statistics. Among the major states, Maharashtra, Gujarat, Himachal Pradesh, J&K, Tamil Nadu and Haryana together account for some 5% of total “not covered” population.
B. Evolution of the national water sector
The importance of ensuring universal access to safe drinking water was recognized even before Independence. Successive five year plans reiterated the need to achieve this goal within a reasonable time frame. However, like with most other commitments, the goal remains unfulfilled. On the other hand, the over-emphasis on physical coverage has led to the neglect of other serious concerns - of water quality, declining water tables, and increasing contamination.
Three distinct phases can be identified in the evolution of India's drinking water policy since Independence in 1947.
1947-1980: There was general neglect of the water sector despite recognition and repeated reiteration of the importance of ensuring universal access to safe drinking water and environmental sanitation.

Page 8 of Annex 4
1980-85: This was a five-year period of serious planning between 1980-85. Activity was triggered off partly by the commitments made by India at several international conferences including the 1978 Alma Ata conference. Action was also spurred by the launching of the International Drinking Water Decade in 1980.
1985-onwards: This has been a period of increasing action due largely to the setting up of the Rajiv Gandhi Drinking Water Mission in 1985.
1947-1980:
Even before India's independence, in 1943, the Health Survey and Development Committee (known as the Bhore Committee) appointed by Government of India drew attention to the importance of ensuring safe water and proper sanitation in its Report submitted in 1946. Soon after Independence, the Environmental Hygiene Committee (1948-49) constituted by GOI recommended the preparation of a comprehensive plan to provide water supply and sanitation facilities to 90% of the population within a 40 years period.
The First Five Year Plan (1951-56) regarded provision of safe drinking water as a basic requirement deserving the highest priority. Adoption of measures with regard to hygiene collection and disposal of community waste was considered essential. During the initial 3 years, the responsibility for providing drinking water and sanitation was left to the States. The Central government had made only a provision for local development loans to assist local authorities in providing drinking water; the focus was mainly on urban areas. In 1954, GOI formulated a water supply and sanitation programme - as part of the Ministry of Health. There was no provision for rural sanitation in the budget. PHEDs were set up, but made little progress due to shortage of resources.
During the Second Five Year Plan (1956-61), the programme continued to be implemented through the national extension and community development programme. In 1960, yet another Committee (Simon Committee) was set up to critically review progress and to assess future requirements.
The Third Plan (1961-66) listed providing of drinking water to most villages as one of its immediate objectives. Rural water supply schemes were taken up under the programmes of community development, local development works and welfare of backward classes. These were supplemented by the National Water Supply and Sanitation Programme of the Ministry of Health. The latter was to cover those villages where the tapping of water resources required a measure of technical skill. In 1964-65, it was estimated that two-thirds of the rural population lived in areas where it was relatively easy to provide drinking water from local sources like wells. The remaining one-third lived in villages that suffered from water scarcity and where engineering skills, extra financial outlays, and time consuming works would be called for. These villages were categorized as follows:

Page 9 of Annex 4
• Scarcity and difficult villages: those without an assured source of drinking water within a reasonable distance of 1.6 kms.
• Health-problem villages:
• Those endemic to diseases like cholera, guineaworm, etc; and
• Those where the available water has excess of salinity, iron, fluoride or other toxic elements.
However, progress was slow. Construction and renovation of wells and installation of handpumps also lagged behind.
Between 1966-68, India faced serious drought conditions that drew increasing attention to the problems of water scarcity and availability. It was also the period when UNICEF involvement began - in response to the drought in Eastern India (discussed below).
As a result, some changes were made during the Fourth Five Year Plan (1969-74). In 1973, water and sanitation was transferred from the Ministry of Health to the Ministry of Works and Housing. Provision of rural sanitation especially in schools was considered critical - but no financial provision made. A mid-term appraisal of the Fourth Plan led to the start of a central scheme for accelerated rural water supply in 1972-73. Under the scheme, 100% assistance was given to States and Union Territories for extending water supply to acute problem villages. The Plan also sought to give also preference to tribal, Harijan and backward classes. The Fifth Five Year Plan (1974-79) continued to follow the same approach, and aspired to ensure coverage of all villages as part of National programme on Minimum Needs.
1981-85:
Apart from a growing realization that urgent action was needed, India's decision to plan a comprehensive drinking water policy was also triggered off by commitments made at a number of international conferences. The Human Settlements Conference in Vancouver in 1976 had passed a resolution that clean water should be provided to all the world's people by 1990. In 1977, the United Nations Water Conference in Argentina urged the participants to draw up an action plan to ensure universal access to safe drinking water during the International Drinking Water and Sanitation Decade (1981-90). The goal of ensuring universal access was again reaffirmed in Alma Ata at the "Health for All by the year 2000" Conference in 1978.
As an active participant and signatory to these commitments, India launched the International Drinking Water and Sanitation Decade (IDWSSD) in 1981. Its aim was to provide adequate drinking water facilities for the entire population; and to provide sanitation facilities to 80% of the urban population and to at least 25% of the rural population by the year 1990.
The launch of the IDWSSD coincided with the Sixth Five Year Plan (1980-85). The objective was to ensure that all three categories of problem villages (40% of all villages) had at least one source of drinking water. The Plan also recognised the need to pay greater attention to large-population villages (with several habitations) and to settlements populated by communities belonging to Scheduled Castes and Scheduled Tribes.

Page 10 of Annex 4
Some of the added importance given to water and sanitation is reflected in the increasing financial allocations to the sector (Table 2).
Table 2: Plan allocations to water and sanitation
Total Plan Water Supply and Sanitation Sector
Development Plan
Rs. Billion Rs. Billion
% of Total
First (1951-56) 23.5 0.4 1.78
Second (1956-61) 48.0 0.9 1.89
Third (1961-66) 85.7 1.0 1.23
Annual (1966-69) 66.2 1.0 1.55
Fourth 1969-74) 157.8 4.6 2.91
Fifth (1974-79) 394.6 10.9 2.77
Annual (1979-80) 121.7 3.8 3.18
Sixth (1980-85) 975.0 39.0 4.01
Source: GOI Plan Documents
1985 onwards
The establishment of the National Drinking Water Mission in 1986 - in the middle of the International Drinking Water and Sanitation Decade - marked a major milestone in the evolution of India's water sector. The Mission has since been renamed the Rajiv Gandhi National Drinking Water Mission (RGNDWM) has pushed for ensuring universal access to safe drinking water. The goals of the Mission are to:
• cover all no source problem habitations
• supply 40 litres per capita per day for humans and an additional 30 litres per capita per day for cattle in arid zones
• evolve cost-effective technology for problem solving
• adopt conservation measures for sustained water supply
• improve performance and cost-effectiveness of on-going programmes
• create awareness on use of safe drinking water by promoting community participation
The Rajiv Gandhi Mission, fully funded by Government of India, set up 55 mini-missions to work in 51 districts across 24 states apart from covering the entire states of Goa, Lakshadweep, Pondicherry, and the Andaman and Nicobar Islands.

Page 11 of Annex 4
The Rajiv Gandhi Mission also set up 5 sub-missions:
• Sub-mission on control of fluorosis
• Sub-mission on control of brackishness
• Sub-mission on control of guineaworm
• Sub-mission on removal of excess iron
• Sub-mission on water conservation and recharging of ground water
There has been an increase in the allocations to the WATSAN sector since 1985 (see Table 3).
Table 3: Plan outlays on WATSAN: 1985-95
Period Total Plan Outlay (Rs. Billion)
Seventh Plan 1985-90 1797.42
Annual Plans 1990-92 1366.17
Eighth Plan 1992-97 4334.84
Source: GOI Plan Documents
Nevertheless, there has not been any marked change in the relative importance of the WATSAN sector vis-a-vis health and education (Table 4).
Table 4: Per capita public expenditures in Rupees
Public health Education WATSAN
1975-76 12.77 23.0 2.38
1980-81 21.94 46.1 5.60
1985-86 48.75 93.3 12.51
1991-92 58.99 207.9 20.35
Source: CMIE

Page 12 of Annex 4
In 1994, an Expert Committee reviewed progress made by the RGNDWM and highlighted the following:
• Physical coverage had been impressive
• Guineaworm eradication is almost complete
• Mission mode was strategically well conceived but not implemented effectively
• For effective delivery, infrastructure needs strengthening both at the centre and the states
• Adequate attention to impart skills to sue new technologies in sub-missions not taken
• Human resources development, research and development, information, education and communication, monitoring and evaluation remained neglected
• Operations and maintenance of water supply remains poor
• Issues of declining water tables due to competing sectoral demands especially agriculture were not adequately addresses
In 1996, India re-affirmed its commitment to the water sector. The United Front Government announced the Common Minimum Programme (CMP) which among other things, consisted of the universal provisioning of seven basic services. These included:
(1) Safe drinking water;
(2) Availability of primary health service facilities;
(3) Universalisation of primary education;
(4) Provision of public housing assistance to all shelterless poor families;
(5) Nutritional support to children;
(6) Connectivity of all villages and habitations by roads; and
(7) Public distribution system targeted to the poor.
The CMP went on to clarify that even though "drinking water, primary healthcare and housing are subjects which fall under the purview of the State governments, the Central government also bears a responsibility to ensure that these basic human needs of every citizen are satisfied." Special plans were to be drawn up during the Ninth Plan period to ensure that every habitation has access to potable drinking water.
Government of India's Economic Survey 1997-98 notes that due to rapid urbanisation and industrialisation, the challenge of providing basic amenities is mounting. It points to the Accelerated Urban Water Supply Programme that seeks to provide safe and adequate drinking water supply facilities to the entire population of towns having less than 20,000 (as per 1991 Census) in the country. As on 31-12-1997, water supply schemes had been approved for 254 towns in the different states - some 12% of the total number of towns with population exceeding 20,000.
The approach paper to the Ninth Plan notes that past investments had ensured that 82% of the rural population ahs access to safe drinking water supply facilities in rural areas, and in urban areas, the accessibility was around 85%. However, the access in most of

Page 13 of Annex 4
the cities and towns in still inadequate, particularly in slums inhabited by the poorer sections of society. In so far as sanitation is concerned, around 50% of the population us covered in urban areas, and around 20% in rural areas.
The Ninth Plan Approach Paper asserts that efforts will be made to provide access to safe drinking water facility to the entire population is urban and rural areas during the next 5 years.
An analysis of financial allocations and expenditures in 17 of the most-populous States reveals that:
• In 1995-96, Rajasthan incurred 6.1% of total expenditures on the WATSAN sector. The lowest was by Punjab (1%).
• In all the major states of India, water and sanitation receive a far smaller allocation of funds than do health and education
• Between 1990-91 and 1995-96, the expenditure on WATSAN as a proportion of total expenditures declined in 10 out of the 17 states.
C. UNICEF’s co-operation with national water supply programmes
Historical evolution
This section traces the expansion of UNICEF involvement in India's water sector. It also discusses some aspects regarding the role of UNICEF and the nature of its assistance.
1966-85
The first two decades of UNICEF support to India's drinking water programme were concentrated principally on hardware and technology issues - import of rigs, development of handpumps, and better maintenance systems. Efforts were also made to improve people's awareness through better education, and promote community participation. However, these remained subsidiary objectives.
UNICEF entered India's water sector in 1966-67 in response to the severe drought in Bihar and Uttar Pradesh. UNICEF support began with the import of drilling rigs in order to address the emergency situation. In 1969, GOI approached UNICEF to help provide water to “problem villages". UNICEF responded by extending assistance for promoting hard rock drilling and offered to import appropriate rigs into India. By 1970, India had the largest UNICEF supported water supply programme in the world.
From the beginning, involvement with the WATSAN sector has been justified on several grounds. First, ensuring drinking water is critical for improving the quality of life. Second, easy access to safe water greatly reduces drudgery and saves time for women. Third, there are extremely strong health linkages; and provisioning of safe water is critical for reducing child morbidity and mortality.

Page 14 of Annex 4
The 1974-79 MPO, for instance, listed the following as objectives:
General objectives:
• To reduce the incidence of water-borne diseases through the provision of potable water in sufficient quantities for drinking, personal hygiene and other domestic purposes.
• Wherever practical, surplus and waste water may be used for simple irrigation schemes to improve both the general health level and the socioeconomic conditions of the people
• To augment the Central Public Health and Environmental Engineering Organization (CPHEEO) in order to ensure adequate implementation, expansion and follow-up of the programme. This will include the development of detailed plans of operations with individual states and the establishment of criteria to cover the planned expansion of the programme
• To demonstrate to local bodies, and to the population at large, the advantages of a comprehensive rural water supply and environmental sanitation programme, and to educate them in the relationships between water supply, environmental sanitation and health.
Specific objectives:
• To develop projects within the minimum needs programme and the MPO to ensure the continued availability of water for the purposes describes above;
• To derive the maximum synergistic benefits from coordinated services for children within the minimum needs package with geographical concentration, wherever possible, on other UNICEF-assisted programmes;
• To investigate and to study the technical and financial aspects of extensive water supply and environmental sanitation programmes in disadvatanged rural areas of the country by securing, recording and utilizing the relevant hydrogeological, engineering, economic and administrative data required for national execution of an overall comprehensive development plan.
The MPO document also listed the targets of the programme:
• To increase the number of holes per rig and provide for more efficient utilization of all the drilling rigs
• To make the bores already drilled more effective
• Drilling will remain an important aspect of the comprehensive water supply programmes. Drill rigs of a type unavailable in India will continue to be imported by UNICEF
• To support demonstration projects in various states to derive appropriate models of handpumps that would prove replicable in other states
• In collaboration with WHO and GOI, develop effective environmental sanitation projects that are viable.
• Training for drillers, maintenance staff and supervisory personnel

Page 15 of Annex 4
Main activities supported by UNICEF between 1974-80 included the following services:
• Training
• Drilling
• Handpump installation
• Health education
• Environmental sanitation
Major achievements between 1967-85 included the following:
• UNICEF supported improvements to the Sholapur pump, which became the famous India Mark II pump.
• UNICEF promoted the widespread use of the India Mark II handpump
• UNICEF helped the Bureau of Indian Standards to set specifications for the Mark II handpump.
• UNICEF worked closely with GOI to plan and introduce a three–tier system of pump maintenance.
• UNICEF supported the development of a smaller version of rigs.
• UNICEF worked towards the indigenisation of rig manufacture; and introduced hydrofracturing
• Between 1983-87, UNICEF helped to design the Mark III pump (VLOM model).
The principal focus remained on drilling technology and hand-pump development and maintenance. Concerns relating to community participation, water quality or water depletion, need for examining local water harvesting techniques and environmental sustainability assumed a secondary priority. It is only towards the late 1980s that UNICEF began to emphasise the importance of community management and the involvement of women in the water programmes.
Post 1985:
Beginning with 1985, UNICEF has been far more conscious of the critical importance of focusing on community participation and issues of water quality and availability. The brief review of the water sector in the 1985-90 MPO, for instance, begins with a comprehensive listing of the major problems:
• Inadequate linkages of rural water supply with other development projects
• Undue emphasis on reaching physical targets with more finances - need for community participation for safe use
• Lack of community participation
• Absence of complementary sanitation programme
• Norms do not address real issue of access to safe water
• Acute shortage of water for cattle ignored
• Maintenance of handpumps not paid adequate attention

Page 16 of Annex 4
• Need to set up norms for well drilling to regulate private drilling
• Neglect of urban water crisis - in slums, etc.
Areas of neglect are also clearly identified.
Table 5 : List of priorities for UNICEF co-operation:
Concepts Activities Inputs
Household level
Importance of influencing KAP of mothers and TBAs
Community involvement
Education
Link preventive and curative knowledge
Training of TBAs, and other functionaries
Production of AV materials
Resource persons
Access to services
Ensure reasonable access to water
Construction and maintenance of handpump tubewells
Gravity feed and rain water collections systems
Installation of pumps
Training of technicians and caretakers
Equipment like rigs, pipes and vehicles
Training
Environment Need for clean environment- external and within the house
KAP of school teachers, village level workers
Active community involvement to affect behaviour
Construction of waste disposal systems, garbage pits, sanitary latrines, soak pits, smokeless chulas
Training of TBAs, teachers, etc.
Ideas and methods, resource persons , Avs, materials, books, posters, building materials
UNICEF documents since 1985 have increasingly emphasised the shift away from hardware technology to concentrating on so-called "software" considerations. The latest MPO for 1998-2002 MPO, for instance, states:
In extending support to the country’s efforts to assure every child the right to safe water and a clean environment, UNICEF will adopt the following strategies:
• Promote education for behavioural change
• Improve quality and sustainability
• Enhance community participation

Page 17 of Annex 4
• Encourage innovation and scaling-up
• Promote intersectoral cooperation
The shift in emphasis from "hardware" to "software" is reflected to an extent in budgetary allocations by UNICEF. In the MPO for 1974-78, "supplies and equipment" accounted for 79% of UNICEF allocations. By 1991-95, this proportion had come down to 39%.4
Magnitude of UNICEF role5
Even though WATSAN accounts for a significant proportion of UNICEF allocations, financial contributions by UNICEF amount to a very insignificant part of total expenditures by Government.6 Table 6 below shows the total funds allocated (general plus supplementary resources) by UNICEF during the different MPOs:
Table 6: UNICEF financial allocations to WATSAN
Total allocations for the entire Country program
WATSAN allocations
During the period
US$ millions US$ million % of total
1974-79 65.9 13.75 20.9
1978-80 64.3 20.94 32.6
1981-83 171.3 50.54 29.5
1985-89 227.3 56.40 24.8
1991-95 465.0 78.00 16.8
1996-97 221.0 81.60 36.9
Note: The above Table shows allocations by UNICEF, and not actual expenditures.
Source: UNICEF MPOs
4 Two qualifications need to be noted. First, these figures are indicative. Second, it would be more appropriate to examine actual expenditures rather than planned allocations.
5 For a more elaborate discussion, see UNICEF in India - A Strategic Review by Sen (1995) and UNICEF and WATSAN by Development Associates (1995).
6 Back-of-the-envelope calculations suggest that UNICEF support amounts to less than 0.1 percent of total public expenditures on water and sanitation.

Page 18 of Annex 4
These financial resources have however been used by UNICEF in a number of creative ways. A review of the materials points to at least five areas where UNICEF has made distinct contributions. These are:
• Technology introduction
• Disease eradication
• Community participation and empowerment
• Economic sustainability
• Capacity building
In addition, UNICEF has also been able to influence national thinking and policy through sustained advocacy. However, secondary data does not permit us to comment on the extent of these contributions.
Features of UNICEF assistance
We discuss below and comment on five features of UNICEF co-operation with GOI.
Nature of objectives
The MPO 1974-79 is perhaps the clearest in terms of delineating UNICEF objectives from those of GOI. Over the years, however, there is a strong overlap between the objectives of UNICEF and that of GOI. For instance, the MPO for 1991-95 lists the following national objectives and states that UNICEF co-operation will be aimed towards assisting the National programme..." The overlapping of objectives becomes even more serious following the ratification of the CRC by GOI in 1992. India's goals for children also become UNICEF goals. This is reflected, for instance, in the MPO for 1996-97 that lists objectives thus:
"UNICEF's programme in this sector seeks to promote the rights of children by ensuring progress towards the WSC goals of:
• Universal access to safe water by 2000
• Universal access to sanitary means of excreta disposal by 2000; and
• Eradication of guineaworm disease"
These are in fact national goals.
Such an overlap of objectives makes it difficult to isolate UNICEF achievements from those of India's achievements.
Technology bias
The primary concentration of UNICEF assistance has been in technology. Starting with the import of rigs in 1967, UNICEF assistance has been biased towards hardware technology.

Page 19 of Annex 4
The MPO for 1974-79, for instance, states that UNICEF assistance to the programme may include, but will not be limited to:
• drilling equipment, air compressors, and related major components
• groundwater survey equipment and potable water laboratory kits
• equipment for training
• stipends for participants in training courses
• transport for equipment and staff
• workshop equipment for servicing and maintenance of drill rigs and pumps
• handpump development
• imported spare parts
There has been a gradual shift in emphasis in recent years especially since 1991, and more distinctly since 1995. But the move towards other areas such as community participation, women's involvement, etc. has been slow.
Nature of UNICEF responses
It appears that UNICEF India has always responded to the exigencies and demands of the situation. These have often been reactions rather than anticipated actions. For the first 18 years of its existence in India, UNICEF did little in the water sector. Entry into the water sector appears to have been quite accidental - in response to the drought situation in 1966-67. Again, in the initial years, UNICEF concentrated on supply of drilling equipment and it was only after the problem was identified with handpumps that a concerted effort was made to develop the India Mark II handpump. Similarly, the formulation of alternative maintenance systems was in response to a problem. Such responsive behaviour is good. But it is biased in favour of short-term problems that arise. Having a longer-term approach would enable UNICEF to anticipate and plan better interventions. For instance, had the problems of declining water tables and drying up of wells as a result of excessive drilling been anticipated, UNICEF could have advocated for appropriate legislation, pricing policies, etc.
Priority setting
UNICEF has been quite good at identifying problems. Several documents including the MPO and the situation analysis, as well as the outputs of research studies have enabled UNICEF to identify several critical issues and problems. For instance, MPOs have stressed the need to have drinking water in schools and health centres. Reference is often made to watershed management and environmental protection. But these have not become priority areas. Similarly, urban water supply has remained a neglected area even though UNICEF acknowledges its growing importance. To an extent, this may be the result of the proximity to government that makes independent priority setting difficult.

Page 20 of Annex 4
Cost consciousness
UNICEF has always emphasised the need to develop appropriate and low-cost technologies for India. References to viability, sustainability, replicability, affordability and capacity building feature prominently in all documents. The MPO 1981-83, for instance states:
"UNICEF will continue to support all efforts to ensure that appropriate technology for Indian conditions are used to increase performance and keep costs down, as was done, for example, in the development of the India Mark II deep-well hand-pump."
However, a review of the available documents does not offer insights into how such technologies were identified - by UNICEF and others. There are sporadic references to costs, but these are typically in the form of statements. For instance, the MPO 1985-89 (and this is by far the only MPO with such data) suggests:
• Cost to Government includes provision of an India Mark II pump and its installation plus maintenance cost of Rs.350 per month
• The total cost of a handpump tubewell is estimated at US$ 1400.
The basis for such calculations is not readily available. Detailed evaluation reports assessing alternative technologies and justifying particular choices are not available with UNICEF. Several questions come up. For instance, when should we revitalise an old well instead of digging a new one? Under what circumstances should hydrofracturing be undertaken? The answers to these questions relating to choice of technology may be obvious, but available materials do not include a detailed discussion of the economics of technology choices.
3. Sanitation in the Indian Context
A. Evolution of National Sanitation ‘Sector’: Early Eighties
Till the early eighties, sanitation was a neglected sector, within public policy debates in India. The Central Public Health and Environmental Engineering Organisation (CPEEO), under the Ministry of Works and Housing the designated implementing and policy making body respectively for drinking water supply and sanitation was primarily preoccupied with the provision of drinking water supply. However for the urban sector, a sanitation feasibility study, was sponsored by the UNDP, and executed by the World Bank in 1982. The study was to explore low cost technological options for the safe disposal of human excreta in sanitary latrines. The study addressed the problems of both health and the social issue of using scavengers for ‘service’ latrines. The study started looking at several existing options, particularly the two pit design introduced by a Lucknow based NGO, Planning Research Action Institute (PRAI), as early as the ninety sixties.
In 1982, UNICEF also got involved in sanitation projects for the first time. UNICEF initiated a collaboration with three NGOs in West Bengal, to start a rural sanitation programme. Its involvement prior to this, was of sanitation as a component of the health

Page 21 of Annex 4
education programme, which looked at sanitation as an issue of hygiene in ensuring children’s health. In a way, the ‘formalisation’ of sanitation in this early project delinked sanitation from the health issue for the first time and looked at it as a separate ‘sector’. This was followed in the same year by UNICEF initiating rural sanitation schemes in five blocks of Orissa as part of a flood alleviation programme that followed the floods in Orissa. However the focus in this project continued to be of sanitation as a component of community based information and education programme, with a strong involvement of the Public Health Department of Orissa. Based on a study of knowledge, attitudes and practices in the Orissa project area, UNICEF prepared a set of flash cards covering six sanitation topics and used them in the project area from 1983.7
In 1983, two Project Officers (Sanitation) were appointed in UNICEF to look after the sanitation projects exclusively. Pilot district-level projects were launched in Andhra Pradesh, Madhya Pradesh and Maharashtra in the same year. Interestingly the focus of all these projects were on hygiene education, and on angawadi and school sanitation (i.e. on software, children and linking sanitation directly to children’s health). There was no focus on hardware or technology.
In 1983, a Technical Advisory Group (TAG) was formed by the World Bank with members and funds drawn from the Government of India, UNICEF and UNDP. The Government of India/UNICEF/UNDP Project (Feasibility Study based on Demonstration Schemes for Sanitary Latrines in Rural India) commenced in June 1984 and was executed by the World Bank through the TAG. Through the TAG, a variety of other studies and demonstration projects in sanitation were also executed. This included the TAG Report on the Expert Group on Design Criteria of Pour Flush Waterseal Latrine completed in 1984. The study finally recommended a single specific design of the Twin Pit Pour Flush Latrine for wider adoption to replace the single-pit service latrine in urban areas.
The hardware development in latrine design essentially emerged from an urban need in the early years, as a replacement to the traditional single pit ‘service’ latrines used in the older townships and colonies of urban India.
B. 1985-1986: Initiation of GOI-UNICEF Collaboration
In 1985, several developments took place in India, to take sanitation to scale as an issue with an independent domain. The Government of India for the first time looked at the sanitation issue independently from both the issue of water supply and housing (as well as health to some extent). It shifted the nascent sanitation programme to the Department of Rural Development (the nodal department in charge of the rural water supply programme) from the Ministry of Works and Housing. This implied a three fold shift: from housing to rural development; from urban to rural areas; and from an exclusive state Government subject to a federal (central) government subject. This was partially influenced by the launching of the joint GOI/UNICEF/UNDP sponsored World Bank Project on Rural Sanitation feasibility launched in 1984. It was also partially influenced by the wider restructuring of the Government of India’s ministries brought
7 Philip Wan (1988), "Sanitation Programme in India (1982-88)" UNICEF New Delhi.

Page 22 of Annex 4
about by the new government headed by Rajiv Gandhi, which wanted a greater budgetary allocation for rural development.
In 1985, TAG commissioned an evaluation study cum survey on rural sanitation in seven states, which showed clearly for the first time that there did exist a strong demand for latrines even in the rural areas of India.
Under the new administrative structure, the Government of India launched the Centrally Sponsored Rural Sanitation programme (CSRSP). That is, it made specific budgetary allocations and prepared guidelines for a sanitation programme exclusively focussed on rural areas. Interestingly, it was a sub-component of what is termed in India the ‘rural employment programmes’; with a target of one million fully subsidised latrines for SC/ST households under the wider rural housing programme. In 1986, the TAG completed its task and it was disbanded. The recommendation to adopt the twin pit pour flush latrine as the most cost effective and the possibility of its construction by local masons were accepted by the Government of India and the CRSP as the standardised design to be adopted across the country.
TAG also produced the Terminal Report of “The Feasibility Study based on Demonstration Schemes for Sanitary Latrines in Rural India”.8 The project covered setting up of demonstration latrines in 3,600 villages in 13 states of India. The project was coordinated through the TAG (World Bank) through state implementing agencies nominated by the respective state governments. The project was largely funded by UNICEF. In fact it was the major funder, contributing Rs. 15.2 million for the construction of the demo latrines and Rs. 4.2 million in cash to GOI; UNDP contributed $ 65 thousand; while the state government's contributed Rs. 5.4 million. The Terminal Report also states that “UNICEF was closely involved in project activities and provided valuable assistance and advice. UNICEF Zonal officers, in particular, helped the State Governments in the selection of project villages and in the performance of activities like training, promotion and publicity; construction and monitoring” (Executive Summary, ibid.).
The TAG Terminal report, completed in July 1986, and which played a major role in influencing CRSP launched in 1985, brings out the following very clearly.
• It was the first formal involvement of the Government of India in seeing sanitation exclusively as a separate programme area.
• The focus of the sanitation programme was on developing, financing and scaling up rural latrine construction through developing a low cost technological option that could be standardised.
• UNICEF played an important role in the process, being the primary funder of the TAG exercise.
8 "Terminal Report of the Feasibility Study Based on Demonstration Schemes for Sanitary Latrines in Rural India", Technology Advisory Group (India), July 1986, World Bank.

Page 23 of Annex 4
• The TAG had discussions with three other bilateral donors after the Terminal Report (DANIDA, Netherlands Embassy and SIDA), who showed interest in exploring a package approach (water supply, sanitation and health education) to improve community health and the rural environment and not just sanitation. Nevertheless, the TAG but did not get directly involved in India’s sanitation programme because of its exclusive technological focus at that time.
• There was no emphasis on cost recovery or beneficiary contribution, or even use and maintenance of the latrines, as the committee felt that the GOI programme had adopted an approach of providing latrines free to the beneficiaries. The focus was on hardware construction costs primarily and improved delivery mechanisms such as local construction by masons.
Hence the Government of India’s desire to scale up the rural sanitation programme had the effect of, on the one hand bringing exclusive policy focus to sanitation but on the other shifting the focus of sanitation to looking at sanitation (latrine) hardware, low cost technology options in it, and designing effective delivery systems for the programme at the state and central level. The community, IEC, school sanitation experiments of UNICEF could not find any place in the newly launched CRSP. UNICEF was an important and the only international agency working in the sanitation sector and hence worked in close co-operation with the Government of India in developing the CRSP. However it could not influence the Government of India’s policy of focusing on latrine coverage as the key issue in sanitation, even though by this time it had started several micro or pilot projects, that had adopted more holistic approaches to sanitation than just latrine construction.
In 1986, after the closure of TAG and the adoption of CRSP, by the Government of India, the latter approached UNICEF for funding support and to become full-fledged partners in the CRSP. UNICEF extended comprehensive support to the GOI for CRSP for eight states. Within UNICEF, a substantial allocation of funds was made in the Plan of Operations for 1985-89 for rural sanitation, within the overall WES programme.9 Project Officers (Sanitation) were recruited in each of the six Zonal offices of UNICEF in 1985. Given that the focus of the CRSP was on subsidised latrine construction (which UNICEF lent funding support to), UNICEF felt the need to advocate other alternative approaches in sanitation. Obviously just funding support to GOI was proving to be an inadequate advocacy tool to bring in other concerns in sanitation beyond subsidised latrine construction. In 1986-87, UNICEF launched a series of area based micro projects in rural sanitation as an instrument of advocacy and to directly learn from the field through directly funding state governments over the next few years.
C. 1986-1990: Pilot Projects as an Advocacy Instrument
As direct funding by the GOI to the CRSP expanded through the establishment of the Rajiv Gandhi Mission for WES, UNICEF's funding support in the subsidised latrine construction decreased in relative terms and a mid review showed a surplus of funds within UNICEF. UNICEF also carried out an evaluation of its sanitation pilot projects
9 GOI-UNICEF MPO 1985-89

Page 24 of Annex 4
started in West Bengal and Orissa.10 To redefine the role of UNICEF vis-à-vis GOI, a workshop was held in July 1986, where UNICEF was asked to play complementary roles to GOI activities. Eight states were selected for intensive coverage comprising both hardware and software; while IEC support was extended by UNICEF to both the eight intensive states and other states.11
The appointments made by UNICEF in its Zonal offices for sanitation brought in people with social sciences and communications background in the WES section. In 1987 training modules for sanitation were developed by UNICEF based on the training modules developed by select NGOs implementing UNICEF sponsored area based sanitation projects (Ram Krishna mission and Women’s Welfare Centre in West Bengal; Asha Sadan in Haryana).12 A large number of district and state specific KAP studies were also sponsored by UNICEF to better understand the ground realities.13
Hence, by end 1986, UNICEF had collected some experiences and data from the field on what is involved and required in sanitation in rural India. Based partly on this and partly on the UNICEF-GOI workshop, UNICEF felt the need to initiate area based projects in rural sanitation in different states, which can adopt different approaches to sanitation.
The first area based project was adopted in Alwar district of Rajasthan. Sanitation was promoted as a package of facilities (latrine, soakpit, garbage pit, bathing platforms and smokeless chulas). Village level community motivators, mostly females, were used to promote the package. By 1990, the project had shown extremely positive results and was adopted in the State Government's sanitation programme for the entire state. It took much longer for the GOI to adopt this package approach in its CRSP programme.
The second area based project was adopted in Periyar district of Tamil Nadu, which focussed on rural household environments and sanitation (latrine, bathing platform, drainage, biogas). The women’s groups formed, under a centrally sponsored programme called DWCRA (also part funded by UNICEF), were actively involved in the project. School sanitation was also taken up in a big way with large-scale community mobilisation of funds.
Although UNICEF had been working on sanitation in Mednipore district of West Bengal since the mid eighties, the Mednipore Intensive Sanitation Project was formally launched only in 1990. The project had many unique features. The main partner of UNICEF and project implementing agency was an NGO - the Rama Krishna Mission. No subsidy -
10 Operations Research Group "Evaluation of Rural Sanitation Programme in Orissa and West Bengal," November 1986.
11 UNICEF-GOI "Report and Recommendations: Workshop on UNICEF Support to Sanitation Activities, July 1986.
12 UNICEF "Report and recommendations - Workshop on Training Syllabi on Promotion of Sanitation," December 1986.
13 J. S. Punjabi (1985), "Knowledge, attitudes and practices study of sanitation and hygiene in three villages of Indore district under UNICEF project," April.

Page 25 of Annex 4
self-financing of latrine construction was introduced for the first time. A variety of technical options in latrine construction having different costs to suit different abilities to pay was offered to the consumers.
Local employment generation through training of masons was emphasised. Credit was organised for the poor to purchase a latrine. Finally, IEC continued to be given emphasis as a demand generation instrument. The Mednipore experience has been extensively evaluated and documented8. Later, after 1990, similar area-based projects were started in Allahabad district of Uttar Pradesh to promote the concept of sanitary marts and in Mysore district of Karnataka for the “Nirmal Gram Yojna" (Clean Village Scheme) to create awareness among people to link sanitation, hygiene and health.
All these area-based projects in different locations of India enabled UNICEF to fund, assist, learn from and advocate a variety of alternative approaches in rural sanitation. They adopted an area-focused approach, which allowed for close monitoring and follow up. They experimented with NGOs as partners in sanitation. They broadened the technological choice/cost patterns available in latrine construction. They integrated sanitation as a package of services. They emphasised demand promotion and community participation through including IEC in the projects. They attempted cost recovery and a moving away from the full subsidy approach. For UNICEF, the projects were critical in developing sanitation as a mandate and work domain within UNICEF, as well as a field-tested advocacy tool.
The area projects were used as effective advocacy tools to influence, initially, the state governments in which each such project were being implemented. This was possible both because a demonstration project was available within the state and because the organisation structure built into each such project went right up to the state, involving the state government system.14 For example, the Mednipore Intensive sanitation project management structure is shown in Table 7.
There were however no major changes in the CRSP programme of the Government of India between 1986 and 1989. The only change was budgetary administration procedures. In 1987, the rural sanitation programme was formally included in the state sector under the minimum needs programme. However as the results of these pilot area based projects began emerging and informal dialogues continued between UNICEF and GOI, the exclusive focus on fully subsidised latrines and its coverage approach, adopted by GOI, began to change.
14 UNICEF (undated), "Sanitation: The Mednipore Story"

Page 26 of Annex 4
Table 7: Co-ordination Structure for Intensive Sanitation Programme
Mednipore District, West Bengal
State level Review Committee with Secretary, Rural Development Department as chairman.
Members :
• Deputy Secretary, Rural Development Department
• Secretary, Public Health Engineering Department
• Secretary, Health Department
• Director, Ramakrishna Mission Lokashiksha Parishad, Narendrapur
• Representative of UNICEF.
District Level Review Committee with Sabhadhipati, Zilla Parishad as Chairman of the Committee and the District Magistrate as Convener.
Members :
• District Panchayat Officer
• Executive Engineer, Public Health Engineering Department
• Member Zilla Parishad in Charge of Health Programme
• Representative of Ramakrishna Mission
• Representative of UNICEF
Block Level Committee – Consisting of President Panchayat Samiti, Block Development Officer, Panchayat Extension Officer, Sanitation Officer, representative of the Ramakrishna Mission and representatives of the cluster organisations representing the different Youth Clubs in the area.
Cluster Committee – It directly implements the programme consisting of 25 to 30 villages having about 15/20 youth club secretaries as members.
Panchayat Level Committee – The Pradhan of the Gram Panchayat, one member of the Panchayat in charge of health and sanitation, respective Secretaries of Youth clubs.
Youth Club Level Committee – Sub-committee with secretary of the club as the convener, concerned motivators. The ratio being one motivator per 200 families.
Source: Problems, Prospects and Strategies for Future, National Seminar on Rural Sanitation, 16-18 September 1992; New Delhi.

Page 27 of Annex 4
D. 1990-1995: Advocacy and Change in the Indian Sanitation Policy Framework
In 1990-91, some revisions in the government guidelines in the CRSP were initiated. The sanitation programme was no longer restricted only to the poor households as part of the antipoverty programme and subsidy norms were revised to 80 percent contribution by the Government and 20 percent by the beneficiary. The target set by the CRSP of 25 percent coverage of all rural households with latrines were found to be unrealistic as government data showed the coverage achievement to be only 3 percent.
In September 1992, a National Seminar on Rural Sanitation was organised in Delhi by the Ministry of Rural development, Government of India, to work out an appropriate strategy for rural sanitation for the Eighth Five Year Plan of the Government of India.15 The Seminar was a critical event that influenced the policy perspective for viewing the sanitation ‘sector’ within the government. The seminar was held in the backdrop of the Government of India's enhancement of the allocation of the Rural Sanitation Programme from Rs. 1,007.5 million in the Seventh Five Year Plan to Rs. 6,742.3 million in the coming Eight Five Year Plan. The seminar was well represented by UNICEF with virtually the whole WES section of UNICEF participating in it.
The seminar for the first time brought to the attention of policy makers the following coverage highlights.
• The government CRSP programme had enabled the construction of 2.26 million latrines in rural areas between 1985-86 and 1991-92, which improved sanitation coverage from 0.5 percent of households in 19980 to 2.73 percent of households in 1991-92.
• The 44th round of National Sample Survey (19988-89) revealed the total coverage of rural households by latrines to be 10.96 percent, showing that 8.23 percent of households went in for fully paid private latrines, procured from private sources.
The recommendations of the seminar essentially centred around broadening the concept of sanitation programmes from only the subsidised household latrine coverage model adopted by CRSP till then. The recommendations included the following:
• A greater focus on community participation (especially women) on the one hand and IEC component of sanitation on the other.
• Integration of sanitation programme with other national programmes like drinking water, ICDS, and health care programmes.
• Greater involvement of NGOs and people’s representative bodies like Panchayats in implementation of the programme.
• Lowering of subsidy limits. For poor households, their labour should be taken as their contribution.
15 Ministry of Rural Development (1992), "Proceedings of the National Seminar on Rural Sanitation (16-17 September 1992), GOI, New Delhi.

Page 28 of Annex 4
• Formation of a Sanitation Expert Group to develop appropriate guidelines for various technological cost options.
• The need to link sanitation to health indicators.
The seminar in addition to the representatives of the Government of India and UNICEF, had officials incharge of sanitation in different state governments, selected NGOs from each state and a few resource institutions. The seminar participants also visited the UNICEF sponsored Alwar Sanitation project.
By 1992, some of the results of the area based sanitation projects using different approaches to rural sanitation had started showing some results and UNICEF was able to formulate the specific advocacy messages to be taken up with both the state and Central governments. The issues UNICEF wanted to advocate included the following :
• To move from a fully subsidised programme to a partially subsidised approach.
• To move from sanitation being viewed as only a latrine construction programme to a ‘package approach’ including hygiene/drainage/clean water.
• To move from the single latrine design (twin pit pour flush latrine with superstructure) to a range of technology and cost options.
• To move from a fully constructed latrine to a lower cost latrine with the superstructure construction left to the beneficiary.
• To move from a hardware approach to focussing on IEC, mason training and other software approaches.
UNICEF, because of the demonstration effect of the area based projects, was till 1992, able to advocate some of the above shifts, much more successfully at the individual state level than the all India, standardised CRSP programme. Sanitation was one sector, where the movement of policy change came more from the states than the centre. In a majority of the other sectors the reverse had been true.
The national seminar however consolidated the advocacy efforts of UNICEF at the national level. The different state level officials who attended the Seminar and who had been associated with UNICEF’s area based projects, having built up some ‘ownership’ stakes in these projects, used the seminar to advocate many of the issues UNICEF was interested in advocating.
The national seminar, combined with the launching of the Government of India’s Eighth Five Year Plan, led to a comprehensive revision of the operational guidelines of the CRSP in 1993, which included a different approach to sanitation. The new approach reduced subsidies, included a strong IEC approach within rural sanitation and gave emphasis to community participation in the CRSP.
Between 1992 and 1994, UNICEF continued to extend financial support to the CRSP and financial and non-financial support (IEC material support for training) to all the major states having sanitation programmes. Explorations with alternative delivery systems for sanitation (such as the introduction of the market driven rural sanitary marts) continued with greater NGO involvement. UNICEF also began the CDD-WATSAN project, with SIDA support, in one district of every state, where the overall sanitation concepts were

Page 29 of Annex 4
integrated. The project tried to integrate the lost link that sanitation had with specific health issues – in this case diarrhoea.
On the government side, even though the budgetary allocation for sanitation continued to be small vis-à-vis water (Rs. 6,743 million for sanitation compared to Rs. 108,700 million for drinking water supply in India’s Eight Five Year Plan), sanitation found an identity of its own in the State Government’s plans, policy announcements and political governance agenda. In 1994, the Government of India appointed two expert committees on Sanitation, one on the Rural Sanitation Programme and the other on Technical Guidelines for sanitation. There was some concern within the Government that the sanitation coverage was increasing very slowly (18 percent in 1994) and there wee more than 100 million households in rural India without any sanitation facilities.
The Report of the Expert Committee on Rural Sanitation Programme was prepared by September 1994, under the Rajiv Gandhi National Drinking Water Mission. The expert committee had one committee member as representative from UNICEF amongst the fifteen members. The other members were largely drawn from well known NGOs working in the sanitation sector and some state representatives. The committee’s mandate covered, amongst other related themes, “rationalise, accelerate, and improve the quality and quantity of the implementation of rural sanitation programme; to evolve guidelines for mobilising voluntary organisations (NGOs) for promotion of the felt need for rural sanitation”. The Committee explicitly looked at NGO roles as an alternative delivery mechanism for the first time. Its formation was largely the outcome of the National Seminar in 1992 and afterwards, with the NGOs sustained lobbying efforts to play a bigger role in water and sanitation in India.
UNICEF’s role in the expert committee formation does not appear to be major, although mention is made in the preface, that “some beginning has been made to mobilise and involve voluntary organisations with CAPART assistance, with help of nodal agencies and with the help of external funding agencies (like World Bank, UNICEF)”.16
The Expert Committee on Rural Sanitation Programme in a short period of six months brought out a fairly comprehensive report covering different aspects of rural sanitation. Its salient recommendations covered largely the restructuring of the entire delivery system for rural sanitation through the setting up of a National and State Level Sanitation Board Structure. The report also looked at five model experiments in rural sanitation:
• The experiment in Mednipore district implemented by Rama Krishna Mission (NGO) (one of the area based projects supported by UNICEF);
• The Low Cost Sanitation Programme in Gujarat (partly supported by the World Bank);
• The software component of the rural sanitation programme in Uttar Pradesh implemented by the PSU Foundation (fully funded by the bilateral Dutch WATSAN project in U.P.);
• The Wardha pattern, implemented by three Gandhian Institutions of Wardha; and
16 Ministry of Rural areas and Employment (1994), "Report of the Expert Committee on Rural Sanitation programme", Rajiv Gandhi National Drinking Water Mission, September.

Page 30 of Annex 4
• The Periyar Intensive Sanitation programme in Tamil Nadu, a UNICEF-CRSP programme implemented by the Tamil Nadu State government (one of the area based projects of UNICEF).
The committee gave priority to NGO roles and successes for obvious reasons, but also brings together the ‘state of art’ in the sanitation sector in India at that point of time. Even though all the recommendations of the Committee were not accepted or implemented by the Government of India (particularly those concerned with reorganising the government delivery structure), many of the specific points were further incorporated in the government CRSP. The committee’s formation and report shows the perspective of policy advocacy by the NGO sector in sanitation.
The Committee on Technical Options in Sanitation was set up with direct assistance from UNICF and gave recommendations based on the various technological options available at that time. These were incorporated in the CRSP guidelines that were further revised.17
The constitution of the two expert committees shows that the Government of India as well as UNICEF valued UNICEF's role more in offering technological options to the sanitation sector than in areas such as NGO participation, community participation, and evolving alternative delivery mechanisms.
E. 1995 and Beyond
Between 1995 and 1997, there was no Five Year Plan formulated by the Government of India, largely because of a shortlived political government at the central level. However an annual planning exercise and government budgetary allocations were made in the sanitation programmes. No major policy changes either in the approach or guidelines were made. UNICEF also formulated a two year Master Plan of Operations (MPO) that was agreed upon by the Government of India. All the approaches to sanitation and changes therein were incorporated in this plan of operation.
In April 1997, another major National Workshop on “Women, Children and Sanitation” was organised jointly by the Department of Women and Child Development, Ministry of Human Resource development, in collaboration with UNICEF and Sulabh International Social Service Organisation (an NGO famous for construction of urban public latrine systems). The Seminar made a variety of recommendations that were largely of a very general nature and had which been already discussed in earlier forums. UNICEF for the first time talked of the ‘Right’s Perspective’ in sanitation as a part of its major shift from programming to a right’s perspective for women and children.
In 1998, MPO for UNICEF was formulated and agreed upon by UNICEF and Government of India for the period 1999-2002. In the Chapter now titled “Child's Environment: Sanitation, Hygiene and Water Supply”13 (Chapter 5). The document highlights the problem areas in sanitation such as the inadequacy in coverage and efficacy of bringing about behavioural changes in sanitation, the need to offer a range of
17 Ministry of Rural Areas and Employment (1994), "Report of the Expert Committee on Technical Guidelines for Sanitation", Rajiv Gandhi Drinking Water Mission, New Delhi.
Page 31 of Annex 4
technology – cost options for quick diffusion; the need to refocus on the urban environment. The main focus of the programmes visualised by UNICEF include a continued thrust on experimenting with approaches that could lead to quicker diffusion and replication of new models, technologies, IEC materials developed for sanitation; strengthening of alternative delivery systems; focussing on educational institutions for behavioural change; and a more integrated approach to health.
The total sanitation coverage achieved in 1997, in rural India is approximately 21 percent (in terms of households with access to latrines). At the present rate of growth in coverage, this would be 28 percent in 2000. If full coverage is to quickly be pushed through by fully subsidised latrine construction it would cost the public exchequer Rs. 270,000 million (compared to the current allocation of only 5 percent of the above). Yet, sanitation coverage is a must for better health for all sections of society. It is to address this dichotomy that low cost, fast diffusing alternatives need to be explored on the supply side and sustainable, self financed, demand generation through behavioural change takes place on the demand side. Strategies in sanitation would therefore have to focus on both these in the future. UNICEF, while being an important contributor to possible solutions in sanitation, is only one of the actors (especially through their area focused projects) and advocates, the others being selected NGOs, and enlightened officials within the government system at different levels.
Unlike the case of the development in drinking water supply, where it was more a sequence of single development spread over several years; in sanitation, developments were more bunched, covering a wide set of issues over a few years. The critical developments in technology choice, IEC materials and market led non-subsidised approach, all took place within a span of five years between 1989 and 1994. However, progress in coverage has been much slower, particularly in rural sanitation, compared to drinking water supply. This is primarily because the latter has a much stronger demand and felt need pattern, not involving any major change in behavioural patterns. There has been a far greater involvement of the NGO sector in the CRSP, as well as the experimental projects also. The participation in the two national seminars on sanitation and the expert committee set up in 1994 is an indicator of this. This is primarily because the government realised that to raise demand from communities, NGOs are required for community mobilisation. Also as the approach shifted from the subsidised latrine construction delivery to a more complex package of services, the state departments responsible for drinking water supply were not found so suitable and alternative institutional mechanisms were required.

Page 32 of Annex 4
Table 8: Major milestones in Water and Sanitation in India 1950-1998
1950-70
1951 • Water supply and sanitation added to national agenda (during First Plan)
1954 • National water supply and sanitation programme starts as part of health plan
1955-65 • Development and strengthening of state public health engineering departments
• Support to community development programme; focus on backward classes
1966 • Drought in North and East India: UNICEF responds by bringing in drilling rigs
1967 • Airlifting of Halco drilling rigs/hard rock drilling begins in India by UNICEF
1968 • Direct drilling of borewells by UNICEF staff in India
• State governments granted financial authority to sanction rural water supply schemes
1969 • GOI approaches UNICEF to help provide water to “problem villages” – UNICEF introduces hard rock drilling
• UNICEF offers support to GOI for water programme/250 rigs imported by UNICEF
1970-80
1971 • Drilling + Training of local engineers in maintenance and operations
1972 • Accelerated Rural Water Supply Programme (ARWSP) initiated by Centre to channel funds to states- aimed to concentrate on problem villages, tribal areas, backward classes
• UNICEF supports capacity building through technical training in drilling operations
1973 • GOI survey of problem villages
1974 • UNICEF does spot survey and discovers that only 25% of handpumps in Tamil Nadu and Maharshtra are working
• Problem of Cast Iron Handpump Maintenance - Sholapur Handpump identified
• UNICEF studies alternate handpumps made by NGOs and decides to adopt the Sholapur pump; modified to become the Mark II pump
• Advocacy in Fifth Five Year Plan (minimum needs programme) by UNICEF
1976 • A three-tier system of pump maintenance introduced

Page 33 of Annex 4
1977 • Prototype of Mark II developed
• AWRSP reinstated with clearly specified norms
• Indigenous production of drilling rigs begin
1978 • Training of village handpump caretaker scheme adopted in other states
1979 • Production of Mark II handpump by Richardson and Crudas
• UNICEF introduces new generation hydraulic rigs
1980-90
1980 • VI Plan emphasis corresponds to International Water Decade
• ISI issues specification for Mark II Handpump manufacture; UNICEF works to have specifications for Mark II set by Bureau of Indian Standards
1981 • Expansion of indigenous production base for Mark II
1982 • Strengthening of PHEDs at selected state level taken up by UNICEF
1983 • UNICEF helps to develop smaller version of rigs
• Arsenic found in some wells in West Bengal
• 36 manufacturers of Mark II certified/Mark II adopted country wide
• GOI's Master Plan for WATSAN released - full water supply coverage by 1991
• UNICEF survey finds that 80% of Mark II pumps working; but more due to sturdiness than effective maintenance
• Three-tier system of Mark II maintenance proves cumbersome
• Sanitation identified as a neglected area
1984 • Responsibility for rural water supply and sanitation shifted from Central Public Health and Environmental Engineering Organisation in Ministry of Urban Affairs and Employment to Department of Rural Development in Ministry of Agriculture
• Focus on longstanding problem of Guineaworm infection in tribal areas
1985 • Conception of SWACH project - 60 percent funding from UNICEF and 20 percent from Government of Rajasthan
• Rajiv Gandhi Water Mission set up
• Central Rural Sanitation Programme starts

Page 34 of Annex 4
1987 • Implementation and expansion of SWACH project/Sanitation programme launched
• Ministry of Water resource drafts a National Water Policy that emphasises (a) water resource management and highest priority to domestic water supply; (b) design standards for groundwater structures to protect groundwater sources; (c) water quality monitoring and mapping; (d) data management and evaluation
1988 • Total indigenisation of rig manufacture
• Joint pilot project of UNICEF-GOI-NGO in Mednipore of Sanitation project
• Technology choices in sanitation evolved
• UNICEF introduces hydrofracturing – in response to problem of dried up tubewells
• UNICEF helps to develop Mark III pump (VLOM model)
1990 onwards
1990 • VLOM pump, the Tara from Bangladesh adapted for use in India
• UNICEF emphasises community management; maintenance by women – the principal users
• District wide sanitation project launched in sanitation in Mednipore (West Bengal)
• Concept of Rural Sanitary Marts introduced in Uttar Pradesh
• Women's handpump maintenance programme introduced in Banda, U.P.
• Need for integrating health-sanitation-water realized
• Water quality of ground water emerges as problem
• 73rd and 74th Constitutional Amendments for decentralised governance
• National policy guiding rural water supply and sanitation spelt out in detail
• UNICEF identifies water quality as an issue of concern
• CDD-WATSAN pilot programme-one district in 15 states launched
1995 • UNICEF develops MIS for WATSAN
• UNICEF's last driller leaves
• UNICEF supports R&D on plastic risers
• UNICEF renews school sanitation effort

Page 35 of Annex 4
1996 • Water quality status reports commissioned in different states.
• Research project for water quality testing kits
• UNICEF starts Urban WES projects in selected urban slums in collaboration with NGOs and Municipalities
1997 • Sustainability of water resources identified as an area of work
• Exploration of alternative water supply systems that are environmentally sound
• UNICEF stops service training for rigs
• UNICEF stops subsidies for home toilets
• Tara Handpump standardised
1998 • UNICEF transfers quality control role transferred to BIS
References
Centre for Monitoring Indian Economy (1997), “Profile of States March 1997,” Economic Intelligence Service, New Delhi.
Government of India (1976), “Manual on Water Supply and Treatment,” New Delhi.
Government of India (1979), “Report of the National Conference on Deep-well Hand-pumps,” held in Madurai, New Delhi.
Government of India (1994), “Habitation Survey 1991-93”, New Delhi.
Government of India (1998), “Economic Survey 1997-98,” Ministry of Finance, Economic Division, New Delhi.
Ministry of Rural Development (1992), “Proceedings of the National Seminar on Rural Sanitation”, 16-17 September, New Delhi.
Ministry of Rural Areas and Employment (1994), “Report of the Expert Committee on Rural Sanitation programme,” Rajiv Gandhi Drinking Water Mission, September, New Delhi.
Ministry of Rural Development (1993), Centrally sponsored rural sanitation programme – general guidelines for implementation”, Rajiv Gandhi Drinking Water Mission, 1993.
Operations Research Group (1986), “Evaluation of Rural Sanitation Programme in Orissa and West Bengal,” November, Calcutta.
Philip Wan (1998), “Sanitation Programme in India (1982-88),” UNICEF, New Delhi.
Punjabi, J.S. (1985), “Knowledge, attitudes and practices study of sanitation and hygiene in three villages of Indore district under UNICEF project,” April.
Page 36 of Annex 4
Samantha, B.B. (1997), “Role of UNICEF in transfer of technology, Ph.D. dissertation, Berhampur University, Orissa.
Shiva Kumar, A.K. (1997), “Poverty and human development in India: Getting priorities right,” Occasional Paper No. 30, Human Development Report Office, UNDP, New York.
UNDP (1998), “Human Development Report 1998”, Oxford University Press, New Delhi.
UNICEF (1986), “Report and recommendations: Workshop on training syllabi on promotion of sanitation,” December New Delhi.
UNICEF (1995), “The Progress of Indian States,” UNICEF India Country Office Publication, New Delhi.
UNICEF (1997), “State of the World’s Children 1998”, Oxford University Press, New York.
UNICEF-GOI (1986), “Report and Recommendations: Workshop on UNICEF Support to Sanitation Activities,” July.
World Bank (1986), “Terminal Report of the Feasibility Study based on Demonstration Schemes for Sanitary Latrines in Rural India,” Technical Advisory Group (India), July.
World Bank (1998), “India - Water Resources Management Sector Review,” Urban Water Supply and Sanitation Report, Annex 6, New Delhi.


Annex 5: Providing and Sustaining Rural Water Supplies from Groundwater
1. Borehole Drilling
A. Introduction
For the first two thirds of the period under consideration by this evaluation, much of UNICEF’s efforts in the rural water sector were devoted to the introduction to India of new drilling technology, the continuing adaptation of this technology to local conditions and the promotion and support of local manufacture of suitable rigs. By the end of the 1980s, these substantial inputs had helped government to provide greatly increased coverage of improved groundwater supplies based mainly on boreholes and handpumps. Attention naturally began to turn to the sustainability of these supplies, and UNICEF support in the water programme began to include provision of equipment and training for improvement and rejuvenation of these supplies - the techniques of hydrofracturing and cleaning with compressed air. Technology introduction, promotion and support has been a major contribution to the success of UNICEF’s country programme, and the current evaluation team has, therefore, naturally wished to look at the appropriateness and effectiveness of this in some detail.
B. Hydrogeological Setting
India is a vast country. Although in detail the geology is complex, the country is characterised by and can be simplified into three principal zones for the purposes of this evaluation:
• the hard rock areas of peninsula India which make up some 82% of the land area,
• the alluvial tracts of the Indo-Gangetic plain and
• the coarse, bouldery sediments of the Himalayan mountain front.
These three distinctive geological settings govern the way in which groundwater occurs and moves, and the approach in each case to the siting, design and construction of boreholes, including the method of drilling to be employed, as discussed below. Smaller areas of alluvial sediments occur in the southern and eastern coastal regions of the country. The hard rock areas can be further divided into the basaltic regions of the Deccan Plateau and the Precambrian metamorphic rocks of granitic and gneissic types. Further, a general characteristic of the hard rock areas of India is that the less-consolidated, weathered overburden is generally thin, often only a few metres thick, compared to the general depth to groundwater. Apart from in relatively favourable locations where traditional dug wells have proved their worth, groundwater in the hard rock areas of India is conventionally drawn from restricted, fractured zones in the deeper, unweathered rock. This contrasts with the deliberate targeting of the shallow weathered zone or regolith, as is the case in many parts of Africa (Chilton & Foster, 1995) and also in Sri Lanka, where the relationship between groundwater level and weathering thickness may be quite different to that in India. A clear understanding of this overall hydrogeological classification is essential to understanding the evolution of groundwater development in India, the ways in which drilling technology has been developed and adapted to local conditions, and UNICEF’s role in this process.

Page 2 of Annex 5
C. Drilling in India- The Introduction of the DTH Technique
As in most parts of the world, the early drilling for groundwater was based on cable-tool percussion rigs. The technology is simple; a hardened steel drilling bit is raised and lowered on a steel cable, and crushes and mixes the rock formation, which is then removed with a bailer. These rigs are relatively simple and cheap to operate and maintain, and reasonably easy to manoeuvre into difficult places, mounted either on a truck or separate trailer. They are, however, not well suited to hard rocks, making very slow progress and rapidly wearing out the bits. The rate of penetration in hard basalts and gneisses may fall to less than one metre per day, and even today the production norm set for such rigs by the RGDWM is a mere 40 metres per month (m/m).
In the early to mid 1960s, a few NGOs were beginning to experiment with pneumatic rigs, in which the down-hole hammer drilling mechanism was powered by compressed air. The earliest in the field included missionaries such as the Rev. John Mcleod from Jalna in Maharashtra, who bought a Tiger rig from South Africa. Having waited a year to obtain permission to import it, he immediately demonstrated its success in finding water in the faulted and fractured basalts of Maharashtra. Over the next few years, the non-government sector was the focus of activity with the umbrella organisations AFPRO and AFARM taking leading roles.
During the Bihar drought of 1966 and 1967, GOI approached UNICEF and other organisations for urgent assistance in providing water to stricken villages. UNICEF was able to respond rapidly, initially by airfreighting nine Halco hammer rigs from the United Kingdom to India. These were deployed immediately on arrival, using geologists drawn from local universities to choose suitable drilling sites, and water was brought to 222 villages within two months (Black, 1994), enabling these communities to remain in place rather than having to be evacuated to refugee camps. A further seven rigs were procured by UNICEF to maintain the impetus of the programme. Although successful in meeting short-term requirements, the drought relief drilling naturally had some of the characteristics of such programmes and on later visits many of the boreholes constructed in this “crash” programme were found to be dry.
Inspired by the success of the drilling in Bihar, UNICEF offered GOI support to augment its capacity to deliver improved rural water supplies in other drought-prone, hard rock areas of the country. Martin Beyer, a consultant hydrogeologist who was at that time working for a Swedish drilling company, was requested to visit India in 1969 to assess the technical feasibility of a greatly increased level of support from UNICEF. His report was favourable and, from 1970 to 1974, UNICEF procured a total of 139 drilling rigs at a total capital investment of some US $5.9 million, of which 118 were delivered in 1973 alone (Timeline presentation). This support coincided with the GOI’s fourth Five Year Plan period.
This represents a dramatic injection of high-technology equipment into the national rural water programme, and it is a great pity that this key report on which the funding decision was based could not be traced. The massive investment in rigs was accompanied by significant effort from UNICEF staff to train drillers in the recipient state organisations and to observe the performance of the rigs, and by the provision of geophysical equipment to increase the chances of encountering adequate supplies of water. An appraisal of the use of geophysical equipment by Moller (1973) also contains brief comments on the drilling programme. Most of the early rigs had a capacity to drill at 100 to 110 mm diameter to 60 to 75 m. Of the early rigs, the Halco Tiger, Halco Minor, and Atlas Copco COP-4 were down-the-hole hammer rigs and the Atlas

Page 3 of Annex 5
Copco BBE-57 was a top hammer rig. The larger capacity rigs were Ingersoll-Rand TRUCM-3 down-the-hole hammer rigs (Moller, 1973).
State organisations such as the PHEDs also began to procure their own DTH rigs during the 1970s. The situation in 1976 is summarised in Table 1, by which time UNICEF had increased its fleet to 149. The table shows that the states were inclined to follow UNICEF in procuring a mix of machines to avoid dependence on a single supplier. Further, the rapid take-up of hammer drilling by the state organisations is a clear indication of both their commitment to the programme and the fact that the technique had been shown to be suitable and effective in Indian conditions.
Table 1: Drilling rigs operating in the Indian rural water supply programme, 1976
Atlas Copco Halco Ingersoll-Rand
Others
Total
UNICEF-supplied 85 35 14 15 149
State-supplied 38 68 33 0 139
Total 123 103 47 15 288
Sources: Beyer (1976) and Timeline presentation (1998)
Three reports prepared at this time were examined. Martin Beyer visited the India programme again in 1976. While this report (Beyer, 1976) represents clear and early identification of a number of key issues for the implementation of the borehole and handpump programme:- siting, drainage, handpump maintenance, groundwater quality, training and many others, it does not specifically discuss drilling issues in detail or recommend the purchase of rigs, and in fact appears to have coincided with a temporary lull in funding or a taking of stock following the massive rig influx of the immediately preceding years. In fact, the supply of drilling rigs was halted temporarily in 1974 because, following the results of the first handpump surveys, there was great concern about the lack of a robust and reliable pump with which to equip the completed boreholes (Timeline presentation, 1998).
Beyer (1976) estimated that UNICEF rigs had by then produced some 30,000 boreholes in the hard rock areas. Most were equipped with handpumps but, even at this early stage of the programme the need for a small proportion to be equipped with motor pumps was envisaged. The report commented on the anticipated requirement to extend UNICEF support for drilling into the mountain and hill tracts of the north, to the major alluvial plains of Bihar and West Bengal and to some of the “hydrogeologically difficult” areas of central-eastern India. These last mentioned were presumably the basaltic areas and the rain-shadow zones in the lee of the Western Ghats. The author suggested that heavy duty cable-tool percussion rigs could be required to deal with the bouldery formations of the Himalayan mountain valleys. He also commented on the high capacity (200 mm diameter to 200 m), high productivity but heavy weight (35 tons) and high cost (US $500,000) of the Chicago Pneumatic CP 7000 rig used on the Swedish, Evangelical Lutheran Church (ELC) Water Development Project, Betul. Common rigs of the time were the Atlas Copco COP-4 and Halco 625. The Halco Minor was already being manufactured within the country, and there was a suggestion that Ingersoll Rand might begin to build the TM-3 within 3-4 years. Interest in local manufacture thus clearly originated early in the programme, and UNICEF’s later encouragement helped a trend, which was already

Page 4 of Annex 5
there. A key concern, strongly expressed in the report (Beyer, 1976) was the need for training support to the state implementing agencies. In this respect, the author deplored the decrease from three drilling engineers dealing with rig commissioning and training to one in 1976, and supported the initiative of UNDP to develop a national drilling school.
This report (Beyer, 1976) also highlighted for the first time one of the major driving forces for the nature and scale of support by UNICEF to the drilling programme. From the time of independence, Government had the overall target of complete water supply coverage by 1985, but without clearly defined programmes to achieve this. In 1973 the Accelerated Rural Water Supply Programme (ARWSP) set out targets and defined “coverage” for the first time. In the following year, the Minimum Needs Programme (MNP) had the overall objective of providing 20 litres per person each day, and aimed to cover all scarcity areas with a total of 125,000 problem villages and hamlets by 1984. It was envisaged that autonomous water supply boards would be set up in each state as a mechanism of implementation. While national targets before, during and even since the Water Decade have been unrealistic, nevertheless the very strong push for coverage has been a dominant factor, the influence of which needs to be appreciated in looking back over UNICEF’s support to the rural water programme.
Also in 1975-76, WHO and UNICEF, together with GOI and state staff, carried out an evaluation of the rural water supply programme. The report (WHO/UNICEF, 1976) also made clear the early recognition following independence of the importance of water supply provision, but the low level of government funding and effort in the early years. Provision of safe water “within reach” of all villages was envisaged by the end of the fourth plan, but the 1972-73 Estimates Committee indicated that only 22,000 villages had been supplied in 18 years. By 1976, there were said to be 150,000 villages in total, of which 89,000 were “problem” villages and of these 36% were covered (WHO/UNICEF, 1976).
The report contains recommendations for many aspects of the rural water supply programme. In a lengthy comparison between states of drilling “success”, the report identified difficulties during drilling rather than problems of finding a suitable site as a major factor in the failure of deeper boreholes in Andhra Pradesh, Madhya Pradesh and Maharashtra. In the lattermost, up to 70% of boreholes deeper than 25 m had problems during drilling caused by jamming of rods, losing tools and poor flushing. While these figures seem somewhat pessimistic, the clear implication was that the limitations of pneumatic rigs in the more difficult hydrogeological terrains were becoming apparent. The report briefly discussed the special drilling requirements of the more difficult areas, and recommended that some rigs capable of drilling to 200 m should be made available. It also contains some statistics concerning rig outputs and unproductive time (Table 2) which it rightly questions as not being entirely consistent internally.
While the report stated that these figures could not be checked and might be open to question, they did reveal some useful information, which was discussed in the report. Firstly, there was a wide range in productivity and average borehole depth from state to state, which was presumably, in part at least, a function of geological conditions and depth to the water table. In many states, boreholes were apparently drilled to lesser depths than nowadays, ranging from 26 m in Andhra Pradesh to 51 m in Maharashtra. The 94 m in Karnataka (Table 2) is so different from the remainder that it must be considered as doubtful. It is not clear whether the shallow depths were partly due to constraints imposed by drilling capacity. The report appears to suggest depth was mostly related to hydrogeological conditions, and indeed it is likely that in this early stage of the rural water supply programme drilling was able to be directed at more favourable sites with shallower water tables than those which came later.

Page 5 of Annex 5
The norm for productivity at the time in the UNICEF Plan of Operations was 40 boreholes per year per rig which, following the data compilation summarised below, the 1976 WHO/UNICEF evaluation team considered to be too low. Table 2 shows higher rates of overall productivity, but also indicates that in extreme cases more than half of the available time was not productive for the reasons given. As the 1976 report says, however, there are inconsistencies within the data obtained. It is difficult in Gujarat, for example, to see how 240 days per year could be “lost”, but the output could still be double the prevailing norm.
Table 2: Summary of drilling productivity during the early 1970s
State Rigs total (UNICEF)
Average
bh/yr/rig
Average m/yr/rig
Average bh depth (m)
Days Lost
moving repairs others total
Andhra Pradesh
46 (22) 103 2656 26 63 72 58 193
Gujarat 37 (12) 83 3189 38 42 109 89 240
Rajasthan 16 (9) 95 3054 32 37 47 35 119
Karnataka 31 (14) 67 6324 94 89 (inc) 79 168
Madhya Pradesh
39 (24) 48 2267 47 21 54 136 175
Tamil Nadu 47 (17) 76 3106 41 33 20 51 140
Maharashtra 50 (17) 44 2235 51 42 70 78 190
Source: WHO/UNICEF (1976)
Further, it is not easy to reconcile for the widely dispersed and sparse population of Rajasthan an average of 95 boreholes completed per year, but only 37 days used in moving between these sites. This could only be achieved if the rigs were always deployed efficiently, such that successive sites for each rig were very close together. While rig scheduling to optimise movement and minimise travelling would presumably have been an objective of the state engineers, cutting the average almost down to one third of a day seems an unlikely achievement. Amongst the “other” reasons for lost time are varying degrees of difficulty of access during the monsoon season, lack of funding causing rigs to lie idle and, in Maharashtra, the insistence on 10% advance contribution from recipient communities also caused rig down time. It is interesting to note that in the pre-Water Decade period, rules concerning community contributions to the cost of rural water supplies were in force in many states.
In spite of queries over the accuracy of the data, the report provides an early example of the use by UNICEF of its rig performance information in support of management decision-making. The authors suggested that the situation could be improved by quicker spares procurement and distribution and better planning of coverage to reduce rig travelling time between sites. The need for better information systems related to rig deployment and spare parts provision was foreseen and specifically recommended, together with improved and expanded training and rig servicing programmes. Improved operations and better deployment of the rigs obviously imply reduced overall costs, and greater cost-effectiveness was therefore assumed. However, this

Page 6 of Annex 5
was implicit and there is no documentary evidence that cost-effectiveness was given explicit or detailed consideration at the time.
The third report (UNICEF/CPHEEO/WHO, 1979) contains little information on drilling, but identifies many of the issues within the rural water programme highlighted in the other reports- handpump provision and maintenance, groundwater quality, training, community participation, stores and spares and information systems.
D. Hydraulic Rigs - the New Generation
The next important step in the drilling programme was the introduction of hydraulically-powered hammer rigs. These were becoming the standard for hard rock drilling, especially in North America and Scandinavia but, until the late 1970s, had been considered too sophisticated for Indian conditions, because they would be difficult to operate, maintain and repair. This viewpoint was widely expressed at the time, including apparently by at least some of the manufacturers of the rigs in Table 1, who may have been partly motivated by an interest in continuing to supply more of the same models. Thus, the decision by UNICEF to test hydraulically-driven DTH rigs under the conditions of the Indian rural water supply programme was a major one, whose outcome could have been by no means certain at the time. It follows naturally that the present evaluation should be interested in how this decision was arrived at. However, any formal and detailed, contemporary technical documentation from the time is either lost or did not exist, rendering review of this important programme decision difficult. The first submission for the procurement of hydraulic rigs made in mid 1978 nevertheless contains some useful pointers, which are discussed below.
The bulk of the existing fleet of pneumatic rigs were the smaller-capacity models which had indeed proved suitable for drilling 100 to 110 mm diameter boreholes to 45 m and casing out overburden to depths of 12 m. The rigs had low torque (500-600 ft-lbs) rotary heads and low-capacity (3000 lbs) winch motors. Consequently, the so-called “old generation” rigs were found to have deficiencies in:
• dealing with thicker unconsolidated overburden and hence longer casing amounts
• in areas where there are large boulders
• in achieving adequate progress where the groundwater level was seasonally shallow
• in achieving sufficient depth when required to drill beyond 50 m
The last of the above highlights the principal technical limitation of the pneumatic rigs. Of the 350 cfm provided by the compressor, nearly half went to drive the rotary head and winch motors, leaving only 200 cfm for drilling, which as a consequence was considerably slowed at depth and often accompanied by difficulties of sticking tools. The importance of this limitation was highlighted by its contribution to the decrease in success with depth referred to in the WHO/UNICEF evaluation (1976). Further, the rigs had difficulty in reaching the less accessible villages, and could not provide slightly larger diameter boreholes where motor pump operation was envisaged either on completion or in the future.
Thus, set against the targets of the ARWSP and MNP in the national drive for coverage, and UNICEF’s own goals in the approaching IDWSSD, the overall rate of drilling progress needed to be improved and “problem” villages where the limitations listed above would occur had to be dealt with. In summary:

Page 7 of Annex 5
• By the time of the 1980-85 Plan, the number of problem villages had risen to 231,000, of which many were in areas of thick overburden and/or boulders
• Targets of 150 boreholes per year for each rig were required instead of the 50 to 75 achieved by the pneumatic rigs
• Local manufacturing capability could not meet these needs.
The initial submission envisaged two rig types, capable of drilling at 125 mm and also at 150 to 200 mm. The latter requirement could be met by Atlas Copco, and the relatively modest first submission was for one Rotamec 1300 and three B-80 rigs. None of the existing principal suppliers, Atlas Copco, Ingersoll-Rand or Halco had a suitable rig available at the time to meet the former, and therefore two small Hands-England A-60 rigs were ordered from the UK. The first hydraulic rig arrived in late 1978. The larger, well-established suppliers took up the challenge to provide comparable rigs, initially to varying degrees, as the advantages of the “new generation” rigs became readily apparent, and eventually UNICEF supplied 173 “new generation” rigs between 1980 and 1993, as shown in Table 3.
Table 3: UNICEF provision of hydraulic rigs, 1980-93
Manufacturer and Model 1980-86 1987-93
Atlas Copco B80
1300/1302
30/50
R50
19
11
4
14
-
-
-
19
Ingersoll Rand TH55
TH10
8
4
-
24
Killick Halco V596
V493
V494
Tiger 2
Tiger 3
30
7
-
-
-
-
-
4
4
10
Hands England A60
35
2
2
-
4
Chicago Pneumatic CP700 7 -
Totals 108 65
Source: UNICEF ICO (1999)

Page 8 of Annex 5
Hydraulic operation had a number of important advantages:
• it allowed the use of smaller compressors, with savings in both capital and operating costs
• the hydraulic top head drive provides higher torque at lower investment cost and higher feed pressures for rotary drilling through thicker overburden
• the increased feed and hoist capacities (for approximately the same energy consumption) mean the rigs operate under less stress, reducing maintenance and increasing operating life
• with compressors of 150 psi rating, greater penetration and submerged depths could be achieved
• greater flexibility in drilling diameters would be possible
• casing off of overburden with the special equipment provided would be easier, quicker and safer
• combination air hammer/rotary rigs with accessories to allow foam injection for flushing and special casing advancement techniques (ODEX) would enable drillers to cope with overburden up to 50 m thick, often containing boulders. Such conditions also required the higher torque rotary heads and greater air capacity than was available on the old generation rigs.
The first new generation rigs were put to work under a wide range of hydrogeological conditions in several states, and more rigs similar to both types in the initial submission referred to above were procured quickly over the next few years. Internal correspondence of the time highlights active debate between the UNICEF drilling engineers and between the ICO and Headquarters over the ‘big’ versus ‘small’ rig issue. As these terms have been used (and sometimes misused) rather loosely, it is worth defining them in the context of UNICEF’s support to the Indian rural water supply programme.
• Big rigs - early new generation rigs of the late 1970s and early 1980s, weighing 20-35 tons, mounted on large trucks, capable of 150-200 mm diameter drilling to 150 m or more. These were typically the Atlas Copco Rotamec 1302, the Chicago Pneumatic CP 700 and the Ingersoll Rand TH55.
• Small rigs - the 10-12 ton machines designed to drill mainly 125 mm diameter boreholes which were modified for the ‘two-truck’ arrangement described below. These included the Atlas Copco Rotamec 50, the Halco V493/4, the HE 35 from Hands England and the Ingersoll Rand TH10
Both types had their strong advocates, but in truth there was a place for both in the programme. There also remained a place in the bouldery formations of the northern foothills for cable tool drilling and in the sedimentary areas for simpler techniques such as manual drilling and calyx (Fouzdar, 1986; 1987). The big rigs were able to provide larger diameter boreholes for possible motor pump installation, and were able to cope with the heavy and bouldery overburden of the northern states. It was not, however, always a case of either one or the other. Often the difficult drilling conditions in the northern states suitable for the ‘big’ rigs went together with poor road access, favouring the ‘small’ rig and compromises were often required. As stated above, accessibility to more remote villages and improved overall output by better logistics (as opposed to by drilling rate alone) were becoming increasingly important considerations. Lightness and manoeuvrability were therefore critical. Further, from 1982 with the clear confirmation that the India Mark II was going to be a robust, reliable and cheap pump,

Page 9 of Annex 5
handpumps were identified as the principal supply delivery system for UNICEF support. As is normal practice, it is the borehole diameter and depth which initially guides rig specification. Having decided what is to go in the borehole, one works backwards to the rig requirements. Thus, for these two principal reasons, from 1982 to 1993 the smaller rigs rightly represented the main thrust of UNICEF support in the drilling programme. Distribution of new rigs obtained by UNICEF to the state implementing agencies requesting them took account of factors within the state such as:
• standardisation with existing rigs for ease of spares provision and training
• capabilities and previous performance with the rig
• development of a clear work plan for the new rig
• the types of pumps to be used – motor pumps for piped water projects as well as handpumps
• details of problem villages in terms of hydrogeology and access
Gradually through the early 1980s the guidelines for rig procurement continued to evolve, and in 1983, UNICEF staff set down clearly and comprehensively the technical and programme considerations in the selection of drilling equipment. These were developed following an analysis of the first three years of operation of the new hydraulic rigs. The principal conclusions of this analysis were (UNICEF, 1983):
• The new generation rigs were capable of producing nearly twice as many boreholes per year as the old generation rigs
• The single largest contributor to rig down-time was poor logistics management
• The average drilled depth (50 m) of boreholes with the new rigs was not excessively greater than that of the old generation rigs. They were still drilling well within their capacity, and the availability of greater rig power had resulted in more and better quality boreholes and greater casing depths rather than excess borehole depth
• The arrival of the new generation rig technology was quickly influencing local manufacturers, one of whom was already producing a hydraulically operated combination rig
The comparative performance of the two types of rig at the time is shown in Table 4, indicating general, but not universal improvement in productivity but wide variation between states.
Following this evaluation, UNICEF provided further rigs. The equipment selection criteria outlined below were drawn up, and detailed specifications were prepared accordingly. That these early principles have continued to guide UNICEF support to the drilling programme is clear.
In terms of costs and cost-effectiveness, the criteria suggest that these considerations were to be taken account of in terms of both:
• comparing drilled boreholes equipped with handpumps against other supply options and
• comparing different makes of equipment and after sales service and support.

Page 10 of Annex 5
Table 4: Performance comparison of pneumatic and hydraulic rigs, 1980-82
State Old Generation Rigs New Generation Rigs
No of rigs
Bh/m/rig Percent success
Lost Time (%)
No of rigs
Bh/m/rig Percent Success
Lost Time (%)
Andhra Pradesh 26 5.5 86 51 2-3 9.9 86 64
Bihar 7 5.2 85 17 3-4 9.9 95 30
Gujarat 12 4.1 69 8 1 19.6 77 0
Karnataka 14 3.4 85 20 0-2 3.4 81 27
Kerala - - - - 2 1.6 46 0
Madhya Pradesh 33 4.7 65 20 4-6 6.8 72 23
Maharashtra 17 2.5 75 42 2 8.1 45 0
Rajasthan 10 5.5 69 39 1-2 10.0 84 14
Tamil Nadu 16 1.6 87 55 2 no report
Uttar Pradesh 1 no report 4 6.2 76 19
West Bengal 3 no report 2-4 6.3 76 41
Overall 5139 4.1 74 25 22-31 7.6 71 18
Source: UNICEF (1983)
While this is indicative that cost effectiveness was a concern at programme level, in practice there is little evidence that such comparative studies were regularly undertaken. The earlier report by UNICEF/WHO/CPHEEO (1979) contained some state-by-state figures for the per capita costs of rural water supplies in the 1970s, in which “overall” schemes are compared with piped schemes. As might be expected, they vary greatly from state to state, which may reflect technical considerations. These figures are, however, somewhat problematic as some vary dramatically from year to year. For a number of the mountainous states, overall and piped schemes have exactly the same cost, so it could be assumed that all schemes are piped schemes, but there is no accompanying explanation. Finally, it is of course not clear what costs are actually included. For states in which handpumps can be assumed, per capita costs from 1971 to 1978 thus are quoted in the general range of Rs. 20 to Rs.60.

Page 11 of Annex 5
Table 5: Summary of Equipment Selection Criteria
Programme Objectives Boreholes to be located in rural areas for potable supplies, mainly though handpumps, to facilitate improvements in health for rural people.
Technical Specifications Based on programme needs, with borehole depths and diameters in different hydrogeological conditions being determined prior to preparation of detailed specifications.
Manoeuvrability 80% of rigs will be operated in small, rural villages, often difficult to reach. Rig weight and size is therefore an important concern.
Indigenisation Equipment procured to be in line with manufacturing plans of principal Indian suppliers to obtain more effective company support, allow GOI to purchase nationally for standardisation, and promote eventual phasing out of UNICEF rig provision.
Spare Parts Provision Reduce dependence on imported spares by standardisation on few machines and by mounting rigs on local trucks.
Company Back-up UNICEF-supplied equipment must be adequately supported by suppliers through service agreements, guidance to states in spare parts provision and training of crews in drilling and maintenance.
Cost Purchase of sophisticated rigs by UNICEF is justified only if these rigs produce boreholes so that per capita beneficiary costs compare favourably with alternative sources such as piped water schemes from surface sources or boreholes drilled by cable tool rigs.
UNICEF’s Role UNICEF’s policy is to thoroughly investigate new technologies and establish with GOI which can be operated and expanded to ensure success and sustainability of the technology in India.
Field Support UNICEF is essentially non-operational, but provides small numbers of specialised drilling engineers in the field to provide support in training, maintenance and logistics.
Monitoring and Evaluation Monitoring and evaluation of the performance of UNICEF-supplied equipment on technical and programmatic grounds is a continuing component of UNICEF activity. This is done to determine if the technology is appropriate to the programme and if the equipment provided is appropriate to the specific tasks. This would include comparative studies of the costs of different rig types.
Source: UNICEF (1983)
These overall criteria were then turned into specifications which would form the guidelines for rig procurement. The earliest documents for new generation rigs were rightly criticised for being so prescriptive as to appear targeted at particular suppliers, and were therefore broadened. In this sense, the India programme probably made an important contribution to overall UNICEF procurement procedures at a time when up to half of all of the waterwell drilling rigs sold elsewhere in the developing world were said to be bought by UNICEF (anon, 1983). As the

Page 12 of Annex 5
‘small rig’ requirement became more established, the procurement guidelines developed. Thus, a highly detailed, 13 page specification for the two-truck arrangement for procurement in 1984 and 1985 calls for a drilling capability of 120 m at 100 and 125 mm diameter using 100 mm hammers in hard rocks and 45 m at 200 mm diameter in overburden using air or foam flush rotary. This would be combined with a screw compressor of 150 to 175 psi and 400 to 500 cfm capacity. The approximate cost at the time was given as $80,000 for the basic rig, another $80,000 for the compressor, $30,000 for each of the two trucks. Including drilling accessories and spares, the total cost would be of the order of $250,000. Rig costs, taken from internal UNICEF tabulations, are given in Table 6.
Table 6: Comparative costs of ‘big’ and ‘small’ rigs, 1979-86
Year Make Model Trucks Dia/Depth (mm/m)
Weight (tonnes)
Unit Cost (US$)
Number
Big
1979-82 Atlas Copco B80 1 150-200/120 18.0 140,000 16
1979-82 Halco V596
V596P
1
2
100-125/120 22.0 139,000 28
1979 Atlas Copco R1300 1 150-200/180 22.0 145,800 1
1980 Atlas Copco R1302 1 150-200/180 22.0 228,600 11
1980-83 Chicago Pneumatic
CP700 1 150-200/450 32.0 340,000 7
1983 Ingersoll-Rand TH55 1 150-200/180 24.0 175,000 8
Small
1979 Hands England A-60 2 100-125/120 9.5 94,400 2
1983-85 Halco V493 2 100-125/120 10.5 120,000 7
1984-85 Ingersoll-Rand TH10 1 100-125/120 10.0 104,000 4
1985 Atlas Copco R33/50 1 100-125/120 11.5 81,500 4
1985 Atlas Copco R50 2 100-125/120 10.5 128,000 14
1985 Hands England HE/35 2 100-125/120 9.5 111,000 2
1986 Halco Tiger 2 1 100-125/90 8.6 94,000 4
Source: UNICEF

Page 13 of Annex 5
Fuel costs for the two rig types were also compared in 1986 (Table 7), making the rather optimistic assumption of 250 operating days per year at 12 hours per day, and an output of 120 boreholes per year. Diesel was then Rs. 3.64 per litre and there were Rs. 13 to the US dollar.
Table 7: Fuel consumption and costs for new generation rigs
Rig Type
Fuel Consumption
(l/hr) (l/yr)
Fuel Costs
(US $/yr) (US $/bh)
Big 35-60 105,000-180,000 29,500-50,500 245-420
Small 22-27 66,000-81,000 18,500-22,700 155-190
With the commitment to the supply and back-up of the newer, hydraulic rigs, support by UNICEF in the form of spares for the older generation rigs was discontinued from 1985. They continued to be operated by the state implementing agencies for many years. A survey during 1984 and 1985 by UNICEF drillers, state engineers and the suppliers assessed the condition of all 139 of the pneumatic rigs to recommend scrapping, cannibalising or reconditioning. Many had by then been operating for periods of between 10 and 18 years, and a combination of the original soundness of choice of technology and commitment to training had produced much more sustained performance than in Africa. Even by the mid 1990s, Singh (1996) stated that state agencies were still operating 256 “old generation” rigs of which 46 were more than 15 years old, 183 were between 10 and 15 years old and 27 were 5 to 10 years old. None had been purchased within the last five years, and he felt at the time that most of the remaining pneumatic rigs should be phased out over the following five years.
E. Adaptation and Encouragement of Local Manufacture
This period of continued expansion of the UNICEF fleet was accompanied by increasing deployment of highly qualified and experienced drillers and drilling engineers. Perhaps partly responding to the findings of the 1976 evaluation (WHO/UNICEF, 1976), the objectives of the WES programme (relevant to drilling) during the 1980s and 1990s included:
• improvement of the logistics of drilling to reduce lost time
• training to improve construction of the boreholes
• service training and spares control to improve rig productivity
• adaptation of the rigs to reduce costs and to improve mobility and access to difficult villages
• encouragement of local manufacture to reduce costs and enable programme sustainability
In developing specifications for the imported drilling rigs which were appropriate for local conditions, UNICEF had developed close relationships with its principal suppliers. In turn, through their commissioning visits and other contacts, the suppliers had become familiar with and sensitive to local requirements, and also presumably saw the expanding market within India and elsewhere. Importation of rigs and spares was made difficult by the national policy of

Page 14 of Annex 5
support to local industry, so it was natural that attention would turn to the scope for local manufacture.
The first important adaptation arising from the experience in the programme in India was the development of the two-truck arrangement. The earlier pneumatic rigs were built on large trucks with long wheelbase. Having the compressor on a separate truck reduced rig weight and wheelbase, and allowed them to reach more remote villages. Local Tata and Ashok Leyland trucks were used. Further modifications, in which UNICEF drilling engineers played an important part, included:
• the adoption of larger compressors - 150 psi in the early 1980s then 250 psi in the early 1990s,
• modifications to make the rigs smaller in overall size without compromising power and capacity,
• the use of short-wheelbase and eventually four-wheel drive vehicles.
Ingersoll-Rand, for example, collaborated with Tata to adapt the truck they were producing for the Indian Army as a rig carrier, and Halco put considerable effort into reducing the size of their rigs and developing the successful all-terrain Tiger II and Tiger III models. There was also considerable interest by UNICEF in the possible use of power take-off (PTO) from the prime mover to eliminate one engine, with consequent savings in capital, operational and maintenance costs, and this was introduced by Ingersoll Rand for the TH10.
The eventual outcome of the adaptation process was that the main contenders for the two-truck arrangement from the three principal suppliers- the Rotamec 50, the TH10 and the Halco 493/4 converged to a remarkable degree of technical standardisation. In each case, rig and compressor were mounted separately on Tata 1210 SA trucks specified and provided by UNICEF. Deutz hydraulic power pack engines were the same, and the drill strings were interchangeable. Each company designed its own hydraulic circuit, but with components bought in from specialist suppliers. Compressors were all of 450/475 cfm and 150/175 psi. Although higher pressure compressors were available, they were not specified due to their greater weight, higher capital and running costs and because of safety concerns. It was also considered that further productivity increases were more likely to be achieved by overall logistical improvements rather than faster drilling penetration rate. As a result, drilling capabilities and capital costs (Table 6) and operating costs (Table 7) of the three were very similar.
As in the case of procurement, a key objective of UNICEF in promoting local manufacture was to deal with a sufficient number of companies to avoid the danger of a monopoly situation arising. Thus, the three principal suppliers to the UNICEF programme all responded to the challenge to develop local production capacity. During the present evaluation, visits were made to Ingersoll Rand and Atlas Copco, and contact was made with ex-staff of Halco, who are no longer involved in rig manufacture locally.
Ingersoll Rand have a large plant in Bangalore. As a subsidiary and associated company of the parent in Texas, they have been active in India for 75 years, although water well drilling is a small component of their overall business. Although closely linked with the parent company, they have operated independently in both commercial and design senses, and have developed considerable design competence within the local company.

Page 15 of Annex 5
Ingersoll Rand first produced the TH10 model DTH rig in 1984 to compete within India against the Atlas Copco Rotamec 50, the Halco V493/4 and the Hands England 35 and 60 (Table 6), which were all slightly ahead of them into the market. The smaller TH5 was produced in prototype in 1989 and commercially from the early 1990s. They were thus not contemporaries (in terms of rig choice during the Water Decade) and were indeed designed for different purposes and market niches, as the following comparison shows.
The TH10 can theoretically drill to about 180 m with 3 ½ in drill pipe and a 4 in hammer or to 120 m with 4 ½ in drill pipe and 6 in hammer, but only if the compressor has sufficient capacity to lift water and cuttings from these depths. In practice, it was only expected to drill to 100 m and usually carried only this amount of drill pipe accordingly. The TH5 was intended to be mounted on a trailer or light commercial vehicle, and to be used for drilling relatively shallow boreholes in alluvium with a mud pump or in hard rock with a DTH. It has a theoretical depth rating of about 90 m, but again depending on compressor capacity. The pull back of the TH10 is 15000 lbs compared to the TH5’s 5000 lbs, and rotary head torques are 3000 ft/lbs and 700 ft/lbs for the TH10 and TH5 respectively. These major differences are reflected in the basic rig cost for the TH5 being half of the TH10. That the TH5 is a much lighter and less strong unit altogether was apparent from the one such rig which the evaluation saw being assembled by Ingersoll Rand for export to Nicaragua. Even if it had been available in the mid 1980s, it could not have coped with the drilling requirements in most states or competed with the alternatives being offered at that time by Atlas Copco and Halco. The TH5 would be suitable in hard rock areas where the weathered overburden was the target for shallower drilling, such as in sub-Saharan Africa where a great deal of experience was gained during the Water Decade. It may be that the smaller TH5 design arises partly from this Decade experience, whilst the earlier TH10 was aimed at deeper hard rock conditions, again a matter of “horses for courses”.
Ingersoll Rand told the evaluation that they had produced some 120 TH10s and 20 TH5s for sale within India. Because of their relative autonomy, the locally-designed rigs are considered in their global strategy to be the Ingersoll Rand product for developing countries, and these rigs do not duplicate models made elsewhere. Therefore, Ingersoll Rand has been able to export some 30 of the TH5s in particular at 6-10 units per year to countries in Latin America for UNICEF programmes under competitive tendering processes operated from UNICEF in Copenhagen. The company has also been involved in the supply of spare parts, the training of drillers and the operation of service contracts, for which UNICEF has discontinued its support since the end of 1998.
It is clear that Ingersoll Rand staff appreciated the close relationship that they had with UNICEF during the 1980s and early 1990s, initially in respect of drilling rigs and latterly with the development of hydrofracturing, and regret the subsequent loss of contact in more recent years. UNICEF were closely involved in defining drilling conditions and rig requirements to help facilitate the development of specifications for the TH10 rig, as they had been also with the similar rigs of Atlas Copco and Halco. The UNICEF drillers of the time reported their experiences from the field to the three main suppliers. It was interesting that Ingersoll Rand felt they had not fully recovered the cost of their investment in rig R & D, in spite of having developed an export market. This is perhaps surprising, as ultimately Ingersoll Rand were able to offer a lower cost unit than either Halco or Atlas Copco, as reflected in their sales figures to non-UNICEF customers. The lower cost results from the fact that Ingersoll Rand manufactured much more of their rigs’ components in India than either Halco or Atlas Copco, and also generally used a PTO to enable them to cut out one engine on the rig.

Page 16 of Annex 5
The second visit was to Atlas Copco in Pune. Their original activity, which continues to this day, was in the field of small-diameter (100 mm or less) blasting rigs for quarrying and open-cast mining, and the water well sector has been a small component of their business. They had been involved throughout the programme, initially importing rigs and then becoming involved in local manufacture in association with UNICEF. The India facility, however, has a very different relationship to its parent in Sweden and mode of operation than Ingersoll Rand. It is seen much more as a subsidiary and is less commercially and technically independent with, as a consequence, very little in-house engineering design capability. Atlas Copco at Pune have manufactured rigs which are produced elsewhere in the global company, and the factory supplies only to the Indian market. The company has not exported from India directly, but via the parent company in Sweden.
Local work started with the Aquadrill 441, which was imported until 1982 and then made locally until 1986, of which model 161 were sold in India to UNICEF and state governments. This was followed by importation from Sweden of the model B80 in response to the need for deeper drilling at larger diameter, and then by the Rotamec R50, which was capable of drilling at 110 to 160 mm diameter to 120 m. This was initially imported in the early 1980s and mounted on Tata trucks, including the use of short wheelbase and 4WD, as in the case of Ingersoll Rand. Recent activities in the water well sector have concentrated on promoting the use of hydraulic fracturing.
The third company originated as Killick-Nixon over 100 years ago, and its early experience in the drilling sector was in supplying small rigs and machinery to limestone quarries. The company took on the India agency agreements for the Halifax Tool Company (Halco) and English Drilling Equipment Company (Edeco). Their interest in the water sector sprang initially from the importation referred to earlier of one Tiger rig from South Africa in the mid 1960s. The success of this venture encouraged UNICEF to import 10 such machines. Killick-Halco was formed to provide a local company, primarily because of Indian trade restrictions at the time. The company began to manufacture locally, taking account as the other companies did of the need for all-terrain vehicles and reduced weight and size to improve access. Halco were in fact the quickest to respond to the need for a hydraulic rig, and soon had a suitable model, the 596, available. Eventually Killick and Halco parted company, and the former is now manufacturing quarrying rigs and accessories in a small way.
One consequence of the encouragement of the local private sector is that numerous “cottage” -style local manufacturers took up the challenge to produce DTH rigs to meet the rapidly expanding demand as private contractors were needed to meet the production targets of the accelerating programme. These small, often transient, workshops with low overheads were able to make copies of the locally-produced DTH rigs which were far cheaper but also less robust and of poorer build. Many of them purely fabricated the mast, frame, drive head, bought in the hydraulics and a locally-produced compressor and mounted this package on a suitable truck which was often purchased by the customer and delivered to the rig manufacturer. A few of these cottage manufacturers are said to have produced up to 60-80 rigs per year for private contractors in the late 1980s and early 1990s, but many lasted only a few years.
The largest of the truly local manufacturers, KLR, which hardly justifies the title of cottage industry and is clearly more well-founded, has produced 400 DTH rigs since 1994, and has a factory capacity to produce 15 rigs per month. Although business has declined somewhat, the company said that its present output of up to 80 rigs per year may represent 75% of the total national market for DTH rigs. The company is able to withstand the slump in the rig market over

Page 17 of Annex 5
the last 2 to 3 years because it has sales of up to Rs. 20 crore per year in accessories and spares.
F. Considerations of Drilling Depth
In considering depth of drilling in any groundwater development programme, it is important to appreciate the relationship between the type of pumping device to be employed and the hydrogeological conditions likely to be encountered. Thus, one objective in developing the India Mk II was to have a handpump capable of being routinely installed to depths of up to 45 m. This should not, however, be taken automatically to mean that drilling beyond 45 m is not required. Referring back to the beginning of this Annex, in the alluvial areas, thick, permeable unconsolidated and usually unconfined aquifers with shallow water tables can often support handpump yields from modest depths. Handpump installation to 20-25 m in boreholes of 30-45 m may be suitable, even allowing for seasonal fluctuations. Further, in alluvial aquifers the large storage capacity for accepting recharge from rainfall means the seasonal fluctuations in water levels may be relatively modest. In the shallowest such aquifers, for example in West Bengal, the very shallow Tara pump suffices.
On the other hand, in the hard rock areas productive groundwater may be restricted to a few fractures at varying depths, which are difficult to identify with geophysical methods or to confirm during drilling. Even if, as is often the case, the water level itself is relatively shallow, deeper drilling to locate an adequate number of productive fractures is usually required in hard rock areas. It is often the case that the hard rock aquifer is semi-confined under pressure if the overburden contains sufficient clay to make it a low permeability formation. In these conditions, which can usually be detected from the borehole records, the water level can rise significantly from the depth at which water is first struck. Taking a purely illustrative example, a borehole may be more or less dry until passing through the confining layer, encountering first water at say 50 m, from which the water under pressure rises to 25 m and sustains a yield sufficient for a handpump installed to 45 m depth. Stopping the drilling at 45 m would have produced a dry borehole and an apparent failure at the site. Further, the hard rock aquifers generally have low storage characteristics, and hence in drilling into them allowance has to be made for much greater seasonal and drought-induced water level variation. Thus it is important to set the drilling rig requirements for depth and diameter capacity in the context of the ranges of pump types (including the possible future use of motorised pumps) and the hydrogeological conditions. ‘Horses for courses’ should always guide rig specification.
One activity to which UNICEF contributed significantly during the 1980s was the establishment in consultation with GOI of “quality” norms for borehole drilling and productivity targets for rigs. Accepting that real quality control of implementation and workmanship in such a large and dispersed programme would be problematic, the norms were considered to provide simple and measurable indicators of likely sustainability of the groundwater supplies for handpumps. Thus, based on the accumulated experience of the programme, a minimum drilling depth of 50 m for hard rock areas was established in the early 1980s to take account of seasonal and drought fluctuations in regional water levels and large pumping drawdowns in boreholes of marginal yield. This was subsequently increased to 60 m following the 1987 drought. A minimum safe yield for handpump boreholes of 12.5 l/min was established. This was considered likely to provide at least some water even in drought conditions. A minimum casing depth of 6 m was recommended, based on the likely thickness of unconsolidated overburden, on the understanding that the casing would be taken deeper and grounded on unweathered, hard rock where the overburden was deeper. This provision was expected to prevent undue ingress

Page 18 of Annex 5
either of polluted surface water or of fine-grained material from the overburden, and hence contribute to sustainability in terms of groundwater quality and borehole and pump life respectively.
As the drilling programme has matured, several technical factors might be expected to produce a tendency towards deeper drilling:
• moving into areas of more difficult hydrogeology to serve the “problem” villages
• the actual or perceived need to drill deeper in areas of heavy groundwater usage and/or declining groundwater levels
• the desire to take account of possible future conversion to motor pumps
• the provision of larger and more powerful drilling rigs
Data relating to the drilling norms were incorporated into the rig monitoring system and therefore recent data from RIMS have been assessed (Table 8) to see whether there has been an overall increase in drilled depth. The table confirms that, as indicated in the Timeline presentation to the evaluation team, the UNICEF rig fleet consistently produces 10,000 or more boreholes per year, out of a probable national total of some 150,000. The average depth of drilling has remained close to and even a little below the minimum norm of 60 m. This means that, taking account of the fact that there are a proportion of deeper boreholes, some must be less than 60 m, presumably in the shallower aquifers of the sedimentary formations. There is some evidence from the Timeline presentation and from discussions during the field visits that drilling is deeper in areas of declining groundwater levels, such as in Coimbatore District of Tamil Nadu. Also, particularly in Tamil Nadu, deeper drilling is undertaken where motor pumps are intended immediately on completion or at some time in the future. Average drilling depths from RIMS data for Tamil Nadu are therefore summarised in Table 9, on a rig by rig basis.
Table 8: Summary of recent performance data for UNICEF rigs
1989 1990 1991 1992 1993 1994 1995 1996 1997 1998
UNICEF rigs 157 160 161 157 167 162 161 161 162 150
Total bores 12681 11512 11744 11547 10268 9537 10549 10128 10856 10157
Success (%) 86 85 87 86 86 87 84 87 80 86
Target (%) 65 50 55 51 44 44 50 48 54 66
Av depth (m) 53 57 57 57 60 60 58 62 53 56
Av casing (m) 14 15 15 15 20 17 15 15 13 15
Av bh/rig/m 8 6 7 6 6 5 6 6 7 8
Source: RIMS (1999)

Page 19 of Annex 5
Table 9: Average drilling depths in metres for UNICEF rigs in Tamil Nadu
Rig No Model 1989 1990 1991 1992 1993 1994 1995 1996 1997 1998
228 CP700 78 35 131 129 120 137 109 75 114 104
237 V596 81 86 95 120 117 71 48 55 na na
246 V596 64 58 57 61 57 52 48 50 44 (29)
250 V596 53 42 nd 86 48 52 51 61 na 48
292 R30/50 66 73 88 97 61 58 68 66 na na
312 ITH10 65 67 92 105 67 52 93 65 54 nd
314 TGR III 61 69 65 64 55 61 (29) 58 55 62
328 ITH10 58 60 55 54 45 62 61 61 60 na
343 ITH10 62 58 56 63 64 74 54 57 57 56
346 ITH10 Nd nd 62 71 65 62 65 65 73 76
State Average 65 61 80 86 70 69 67 61 - -
Note: nd = no drilling na = not available figures in brackets may be questionable
From these figures, it is clear that the high-capacity Chicago Pneumatic CP700 has been drilling consistently deeper boreholes than the other UNICEF rigs in the state, and is presumably deployed by the TWAD Board to areas or specific sites where deeper drilling is required. Further, rig 237 has, at least until 1993-94, drilled generally deeper boreholes. UNICEF ICO staff confirmed from RIMS data that these rigs have indeed been deployed in the western districts of Tamil Nadu, mainly Coimbatore, Salem, Dharmapuri and Erode which are within the rainshadow of the Western Ghats. The average depth to water in these districts is 30 to 40 m, but in some cases the shallower, weathered-rock aquifer zones have been heavily developed and now siting concentrates on locating fractures or lineaments to draw water from deeper aquifers. Therefore the average depths of boreholes constructed by these two rigs are greater. It is worth noting, however, that the care and scientific approach devoted to siting by the TWAD Board is reflected in the fact that success rates for these two rigs are consistently up to the 85-90% levels of the other UNICEF-supplied rigs in the state. Thus, although these make the overall state average for Tamil Nadu a little higher than the national figures given in Table 8, there is no evidence of an overall trend towards increased depths.

Page 20 of Annex 5
Moving back with time, the availability of data becomes more problematic. National data from 1985 onwards are included in Figure 1. Data for Tamil Nadu suggest that average drilling depths in the years from 1982 to 1988 were in the same range as in Table 9. It has not been possible, however, to cover the gap back to the data presented in Table 2, from which time there has clearly been a slight overall increase in average drilling depth. The earliest data on rig performance comes from October 1972, from which the overall average depth of 6800 boreholes drilled between 1968 and 1972 is shown in Figure 1. This relatively shallow average probably reflects concentration on easier areas or sites at this early stage of the programme, together with the depth limitation of the older pneumatic rigs referred to above. Comparative data for government rigs were obtained for the early 1990s from a consultant’s report to the RGDWM (Singh, 1996), and are also summarised in Figure 1.
Thus, the data presented here suggest that the excessive drilling depths commented on from the field visit to Tamil Nadu are not widespread for UNICEF or GOI rigs, which have, on average, kept close to recommended drilling norms (Figure 1). The ‘deviation reports’ for specific rigs and states, generated by RIMS, also confirm that the norms are followed closely. Limited, selective, deeper drilling in difficult areas and to provide scope for motor pumps does not distort the overall picture. Including (in their deployment by states) the use of UNICEF rigs to facilitate present or future motor pump installation should not be seen as at odds with the original goals of the UNICEF programme to support handpump provision. UNICEF is not directly responsible for the day-to-day deployment of the rigs, and state agencies are responding to the changing “mix” of supply options which, as highlighted in this evaluation, is the reality of the present situation. This is recognised by the UNICEF country programme, and “support for piped water supplies” was explicitly included in the 1991-95 MPO document, and was envisaged as a consideration in rig specification even earlier in the programme.
Figure 1: Average drilling depths for UNICEF and Government rigs
0
10
20
30
40
50
60
70
80
1965 1970 1975 1980 1985 1990 1995 2000
Ave
rage
dep
th (m
)
UNICEFGoI
depth norm
4 year mean
Overall, therefore, there is no evidence that boreholes have been drilled deeper than technically necessary by UNICEF or GOI rigs because they were over-specified. Deeper drilling may be more common for contractor’s rigs, and their capacity to do this is certainly a reflection of the

Page 21 of Annex 5
“copying” of specifications from the UNICEF-supported local manufacture. However, at the present time it is the contractual arrangements and lack of direct supervision which encourage drilling to as deep as 200 m. This probably cannot be justified hydrogeologically at many sites. Even if present, fractures are unlikely to be open extensively at such depths and, the geophysical equipment and field techniques employed are unlikely to penetrate far enough to identify them if they occurred. While it is not realistic to set a firm maximum drilling norm, nevertheless drilling beyond 120 m in hard rock areas is, in the view of the evaluation, rarely likely to be justified in terms of increased yield. Indeed, the UNICEF drilling programme recognised an ‘optimum economic drilling depth’ of 100 m beyond which it is generally not cost effective to continue in search of water-bearing fractures in hard crystalline rocks by equipping the rigs with sufficient drill pipe to reach this depth. Further, the air pressures provided did not facilitate or encourage drilling to greater depths.
Unfortunately comparable data for the private contractors’ rigs, which now produce some 80% of the boreholes in the national programme, are not available. A detailed comparative study should be undertaken of private and government rigs operating in the same areas and hydrogeological conditions, to assess the extent of excessive drilling by contractors and whether this is linked to the contractual arrangements, and the scope and justification for this to be reduced.
G. Productivity Issues in the Drilling Programme
Maintaining rig productivity has always been a prime consideration in the programme. The consultant’s report referred to above (Singh, 1996) quotes drilling “norms” or targets for hydraulically-operated DTH rigs as 12 boreholes or 720 m per month and for pneumatically-operated rigs as 9 boreholes or 540 m/month. It is clear, however, from the overall percentage achievement of targets given in Table 8 that these are rarely met in practice. Actual productivity varies widely from state to state (Table 10) and with time within a single state (Table 11), as would be expected.
Table 10: Summary of DTH rig performance, 1995
Achievement vs Targets State Working rigs
Average m/m/rig
Average bh/m/rig
Average depth (m)
boreholes (%) metres (%)
Andhra Pradesh 8 101 3 36 47 29
Bihar 74 283 6 45 92 69
Gujarat 32 272 6 46 86 66
Karnataka 60 918 13 72 127 154
Kerala 1 130 2 70 46 54
Madhya Pradesh
86 345 7 52 95 83
Maharashtra 36 442 7 60 108 108

Page 22 of Annex 5
Achievement vs Targets State Working rigs
Average m/m/rig
Average bh/m/rig
Average depth (m)
boreholes (%) metres (%)
Manipur 2 36 1 40 29 19
Orissa 6 265 5 53 68 60
Rajasthan 34 377 6 59 92 91
Tamil Nadu 35 329 5 61 76 78
Uttar Pradesh 17 298 9 35 124 72
West Bengal 18 352 8 42 117 81
Source: RGDWM: RMS
Table 11 summarises the position for some 400 state DTH rigs (i.e. not those provided by UNICEF) for a single year. Although not stated, productivity appears to be set against targets at that time of 7 boreholes and 420 m for most states, and 10 boreholes and 600 m for Karnataka. In these terms productivity is very good and, not surprisingly, is generally highest in the states with the strongest implementing agencies. Average borehole depth decreases in states with significant alluvial tracts such as West Bengal, Uttar Pradesh and Bihar, although these rigs are presumably not being used in the shallowest alluvium.
Table 11: Summary of annual productivity of UNICEF rigs in Tamil Nadu
Rig No Model 1989 1990 1991 1992 1993 1994 1995 1996 1997 1998
228 CP700 33 31 14 53 47 24 43 15 22 15
237 V596 60 56 58 34 39 28 58 35 na na
246 V596 44 72 39 44 49 7 15 39 11 35
250 V596 31 10 0 23 32 57 28 41 3 8
292 R30/50 100 81 53 45 59 56 31 17 na na
312 ITH10 82 54 60 45 47 13 36 23 9 0
314 TGR III 109 100 92 76 63 29 49 38 na 34
328 ITH10 108 104 70 81 82 8 107 66 17 na
343 ITH10 43 117 114 99 69 32 109 27 43 40
346 ITH10 - - 123 121 73 59 82 17 45 na
Totals 610 625 623 621 560 313 554 320 - -
Source: RIMS

Page 23 of Annex 5
Comparison of Table 11 with Table 9 for the same rigs and period indicates that, at first sight, rigs 228 and 237 which were drilling the deepest boreholes were naturally producing fewer completed boreholes. In fact, however, the closest correlation, again not surprisingly, is with age of rig, and the older CP700 and V596s, though still productive, are becoming less so. Considering that the CP700 was commissioned in 1981 and the V596s in 1981 and 1982, then their productivity remains impressive. However, the newer and better specified rigs are clearly more productive, and rig numbers 314 and 328 (Table 11) are highly mobile all-terrain models.
From Table 11, an annual output of 100 boreholes is rarely achievable, and the target of 12/month is probably unrealistic in state implementing agencies, although presumably achieved in the private sector. In the best years, the UNICEF rigs in Tamil Nadu have produced over 600 boreholes, but in poorer years productivity has declined to half this. There is indeed some evidence of decline in productivity in more recent years, although the data for 1997 and 1998 are probably incomplete and are also distorted by the diversion of at least three rigs to the construction of shallow trial boreholes. If this decline in productivity is associated with the change of implementing agency for handpump supplies from TWAD Board to the Department for Rural Development, then this is certainly a cause of concern.
RIMS allows the utilisation of rig time to be assessed against the theoretical time available. Thus Table 12 shows that the UNICEF rigs are in operation for a slightly higher percentage of the available time than the state rigs. Apparent discrepancies between Tables 8 and 12 for the average number of boreholes completed each month probably result from the former accounting productivity against the total number of rigs available in each state, and the latter using only the actual rig working time.
Table 12: Utilisation of available rig time, 1991-1995
1991 1992 1993 1994 1995
UNICEF GOI UNICEF GOI UNICEF GOI UNICEF GOI UNICEF GOI
Workable rigs 163 466 163 466 166 508 165 465 161 454
Working time % 77 65 77 65 62 56 61 52 66 59
Boreholes m/rig 6 5 5 5 8 6 8 7 8 7
Metres/m/rig 319 249 292 265 462 361 461 396 493 429
Source: Singh (1996)
The working time is expressed in the original tabulations as the rigs which actually worked during the period, which is the equivalent rig-years worked, although it is not clear precisely what components of non-productive time are included in the calculation. There is a small but consistent difference in productive time and output between UNICEF and government rigs. This is likely to reflect partly the provision by UNICEF of spare parts and support for the routine service contracts and driller training. During this period, UNICEF was providing spare parts support to the programme at an annual value of $0.8 to 1.0 million, down from earlier values of about $2 million. There is also some indication, as the consultant commented (Singh, 1996), that the operation of the rig monitoring system and the driller training were together producing a modest but consistent improvement over the period. This must be partly due to his own

Page 24 of Annex 5
considerable efforts in reviving and promoting rig monitoring within the RGDWM and in driller training.
A second example taken from the preparatory phase of the WESCOST costing study appears to show, presumably by somewhat different calculations from the same basic data, a greater difference in performance between rigs procured by UNICEF and the state governments. However, this also appears to imply a significant difference in average depth of drilling between the two, which would conflict with the more comprehensive data on depths presented above. Assumptions made in the calculations, perhaps by a non-technical member of the consultant’s team at the time, may explain the discrepancy.
Table 13: Summary of rig performance from WESCOST study
1991 1992 1993
UNICEF GOI UNICEF GOI UNICEF GOI
Working rigs 108 429 108 423 108 432
Working time % 74 72 65 68 64 66
Boreholes/m/rig 8.5 6.1 10/5 6.8 8.6 6.0
Metres/m/rig 458 273 608 307 515 270
Analysis by UNICEF in 1988 of 3000 rig months of available drilling time over 3 years (Timeline presentation, 1998), suggested that actual drilling time was 37% of the total, time lost to holidays and the monsoon was 16% and the remainder included maintenance and repairs, waiting for spares, training and moving. There is some, but not universal, correlation for the Tamil Nadu data in Table 11 between rig productivity and distance travelled; one might expect higher productivity where the rigs can be deployed to minimise travelling between sites, but this is not always possible.
Overall, although these percentages of rig downtime for various reasons appear in isolation to be large, they compare very favourably with rig utilisation and output in most other national programmes. In a UNICEF project in Sri Lanka in 1979-80, Atlas Copco B80 rigs produced 10-15 boreholes and 450-650 metres per month in broadly similar hydrogeological conditions, but with much closer supervision and better logistical support in a pilot project situation (Talbot, 1980). In the DANIDA-supported projects in the hard rock areas of Karnataka and Tamil Nadu, imported DTH rigs were achieving 55-100 boreholes per year between 1983 and 1990, also presumably with somewhat better supervision and logistical support than the routine state programmes. It is interesting to note, however, that the rigs selected were of the ‘big’ type as defined above (IR TH55, TH60 and Rotamec) but that average borehole depths in this programme appear to be 56 m in Karnataka and 82 m in Tamil Nadu (DANIDA, 1991) ie not very different from the UNICEF rigs in those states (Tables A5.8 and A5.9).
The DANIDA project mentioned above also imported several Knebel HY79 DTH drilling rigs in 1983 (DANIDA, 1991). These were expensive and highly sophisticated, with many electrical components and intended to be remotely controlled. They proved to be fragile and quite unsuitable for Indian conditions, and were converted to mechanical operation. Even so, lack of

Page 25 of Annex 5
service support in spares and training meant that few boreholes were drilled and the rigs were cannibalised and used only for cleaning boreholes (DANIDA, 1991). Thus output and reliability never matched the rigs supplied to UNICEF and others by Ingersoll Rand, Atlas Copco or Halco. Other imported rigs include a Norwegian rig larger than the Rotamec 1302 brought in by the Lutheran World Service, which proved completely unsuitable for the inaccessible villages of Orissa for which it was intended, and an Atlas Copco R10, the smallest version of the Rotamec family. The latter was provided by the Evangelical Lutheran Church to work in Gujarat, but this did not have the pull-down or lifting capacity to deal with difficult hydrogeolgical conditions. These experiences provide general support for the evaluation’s view that the ‘small’ UNICEF-supplied rigs were suitably specified for Indian conditions.
Figure 2: Summary of rig productivity over time
0102030405060708090
100
1970
1972
1974
1976
1978
1980
1982
1984
1986
1988
1990
1992
1994
1996
1998
bh/y
r/rig
Unicef
GoI
H. Summary statement
Thus, support to the drilling programme in India by UNICEF has been long-established and substantial. In total, UNICEF has supplied 330 drilling rigs to the rural water supply programme in India between 1967 and 1997, at a total capital cost (at the time of purchase) of some $33 million. On the way, important technology choices have been made, always with a view to improving the capacity of the programme to meet expanding and changing requirements. UNICEF was able to carry this through by its continuing commitment, expressed in the deployment of trained and experienced drilling engineers. Despite reservations that have been expressed from time to time, it appears from the detailed appraisal in the current evaluation that drilling technology choices were appropriate at the time they were made, although it is unfortunate that this cannot always be supported by contemporary documentation.
In particular, drilling rig capacity is not defined purely on depth rating and the diameter requirements associated with pump type, but also depends on hydrogeological conditions. Rig specification must include pull back (hoist) capacity, pulldown (feed), rotary head torque, and the pressure and volume of the compressor. It is customary to specify these somewhat in excess of the mean depth requirements anticipated, so that drillers (particularly those with variable levels of training and experience) have the extra capacity to cope with difficult drilling conditions such as boulders, and can extricate themselves if the drilling tools become stuck. This has been an important lesson learnt from the accumulated experience of UNICEF in India

Page 26 of Annex 5
and elsewhere. Some of the biggest rigs employed on the programme, the large and heavy Atlas Copco Rotamec 1302 rigs were in fact provided by SIDA and inherited by UNICEF.
Maintaining widely and consistently over time an average output of 5-8 boreholes per month for each rig is a tribute to the long-term commitment of UNICEF in terms of training and other driller support. It should be noted that the UNICEF-supplied rig visited by the evaluation in Rajasthan was drilling its 1411th borehole! The provision of spare parts and the service agreements with the suppliers were also an important contributory factor. These agreements were maintained until being terminated in 1998, with the intention that state agencies would take them on. That this has not actually happened was a matter of concern to the suppliers in their discussions with the evaluation team. The long and productive lives of the rigs also reflect the appropriateness of the technical specifications and technology choice at the time in the sense that they have been demonstrated to be robust and reliable under Indian conditions. The available data for productivity are summarised in Figure 2, although it is likely that not all are derived in exactly the same way. The four-year mean for 1968-72 covers a wide range from rig to rig and state to state, reflecting the ranges in competence of crews and implementing agencies, and accessibility and hydrogeological conditions. Improved training, logistical support, spare parts provision and better road access have helped to increase productivity, but this has been partly offset by the need in later years to reach more remote locations.
2. Borehole Rejuvenation – Hydrofacturing
A. Equipment Provision
Support by UNICEF for the development and testing of methods of borehole rejuvenation follows logically from the support for drilling. Successful and cost-effective methods for maintaining the useful life of boreholes would contribute significantly to the sustainability of the supply sources. Choosing sites in such hydrogeologically-difficult terrain is far from easy, and even the 10-20% of boreholes which are marginal or unsuccessful in meeting the modest target of 12.5 l/min for a handpump represent a large overall number in the Indian context. Given that more than 100,000 rural water supply boreholes are drilled every year, at a unit cost of some Rs. 20,000 (without handpumps), this may represent a lost investment of up to Rs. 30 crores. In practice some of the marginal boreholes have to be equipped if there is no alternative supply. If up to 3 million handpump boreholes have been drilled, a failure rate as low as 10 % against this target includes many thousands of boreholes drilled in rock types which may be suitable for hydrofracturing. If this technique can be shown to be successful and economic in the Indian context, the potential in the hard rock areas is such that a minimum estimate suggests there could be at least 200,000 marginal boreholes suitable for its application. This estimate by the evaluation team was agreed by the RGDWM as being reasonable.
The technology has been well-proven in the oil industry for several decades and more recently for water boreholes in hard rock areas in Scandinavia and north America. Its first, tentative use in India was by an NGO in the late 1970s and then in a World Bank project in Maharashtra. During the 1987 drought, government approached UNICEF for assistance with such equipment to improve marginal yields, and UNICEF imported its first hydrofracturing units to India in 1989, using GOI funds. Eight units were obtained from TGB in Sweden, and after significant importation delays were mounted on to local trucks and deployed in suitable states - Madhya Pradesh, Maharashtra, Gujarat and Rajasthan. The initial uptake and success was variable,

Page 27 of Annex 5
due to poor technique, handling, mechanical problems and lack of interest (Bonnell, 1990), but a series of training courses and field demonstrations were undertaken with UNICEF support in 1990 to promote their use.
The use of hydrofracturing continued through the early 1990s, with support and training provided by UNICEF drilling staff and by the service contracts from the suppliers. In some respects, the hydrofracturing activity by UNICEF has followed that of drilling, with the same local companies becoming interested in and being encouraged towards local manufacture. Thus, Ingersoll Rand and Atlas Copco were quick to embark on local assembly of an increasing proportion of the unit, with only the most sophisticated components such as the packers and high pressure pumps being imported. To date, the national fleet of hydrofracturing units is a total of 40, comprising 9 from Atlas Copco, 15 from Ingersoll Rand, 14 from TGB and 2 from Well-Tech.
B. Output and Effectiveness
The deployment and output of the hydrofracturing units are summarised in Table 13. The differences between the last two columns of the table arise because the yield norms for handpumps differ slightly from state to state and in some cases hydrofracturing was undertaken to attempt to improve borehole yields sufficiently so that a motorised pump could be installed, and in a few cases the yield was already adequate and hydrofracturing unnecessary.
Table 13: Summary of hydrofracturing output, 1989-1998
State HF units Total Bores
Successful Good for Handpump
Andhra Pradesh 3 508 416 446
Bihar 2 28 23 22
Gujarat 3 248 148 95
Karnataka 2 321 263 254
Maharashtra 10 5195 3372 3238
Madhya Pradesh 5 1050 682 416
Orissa 3 249 157 157
Rajasthan 3 732 529 536
Tamil Nadu 5 661 332 340
Uttar Pradesh 4 892 702 470
Total 40 9884 6624 5974
Source: UNICEF hydrofracturing monitoring (HMS)

Page 28 of Annex 5
The table cannot be interpreted directly to give productivity comparisons, because the units were commissioned at varying times during this period. However, it does provide a general indication of the degree of competence and enthusiasm for the technique, ranging from the negligible output in Bihar to high levels in several states. Clearly the low level of utilisation in Bihar is unsatisfactory and should have been investigated and resolved by UNICEF. If the hydrogeological conditions are unsuitable, which seems unlikely, then these units should be re-deployed to states where the demand greatly exceeds present capacity. The limitation in Bihar is likely to have been budgetary and management constraints rather than lack of suitable sites.
Defining success rate simply as “the percentage of sites at which an improvement in yield was obtained” does not provide an adequate measure of the suitability of the technique. Rather, the mean (average) and range of improvements in yield before and after its use are required. Because of the possibility of poor development at the time of construction, which has been referred to elsewhere in this report, it is likely that rejuvenation is firstly completing the work which should have been done during construction. More detailed reports on hydrofracturing have been made by the implementing agencies of Jal Nigam (Sharma et al, 1996) and GSDA (1998) for Uttar Pradesh and Maharashtra respectively, and detailed information was obtained during the field visits from the TWAD Board for Tamil Nadu and PHED in Rajasthan.
These allow the range of improvements to be examined. One example of district data provided by the TWAD Board (Table 14) allows the percentage improvement ranges to be compared for different rock types. These data suggest that significant yield improvements can be achieved for both charnockites (Ch) and gneisses (Gn), but that the most dramatic improvements are more likely to be obtained in the gneisses. Where the substantial improvements in yield shown in Table 14 are accompanied by significant pressure drops during hydrofracturing operations, then this can be confidently attributed to the success of the technique, and these pressure data are included in the proformas designed for the hydrofracturing monitoring system.
C. Observations on Field Visits
Field visits were made to see hydrofracturing units in Tamil Nadu, Rajasthan and Maharashtra. At Balamanallur in Coimbatore District of TN, hydrofracturing was being used in an attempt to increase the yield (40 l/min) of a new (November 1998) borehole to enable it to support a motor pump. The borehole was 200 m deep, with water level at 1.3 m (Table 15). Resistivity logging had been carried out of the top 100 m and, together with the simple geological information obtained at the time of drilling, had been used to select the packer settings. The borehole was tested with an electric submersible pump and generator carried by the unit, backwashed, fractured and re-tested the following day. Full details of the results were provided to the evaluation team. Field procedures appeared to be well carried out under the direction of a competent assistant hydrogeologist, although the interpretation of the yield results was queried with TWAD Board staff and subsequently the borehole was re-tested and the re-interpreted results forwarded to the evaluation team. Although hydrofracturing has improved the yield in this case, operating with a single packer placed in the upper part of a 200 m deep borehole is far from ideal. It must allow considerable scope for energy dissipation in the lower part of the hole, unless it has no fractures at all, in which case such deep drilling has been unnecessary.

Page 29 of Annex 5
Table 14: Yield improvements from hydrofracturing, Madurai District, Tamil Nadu
Yield ranges (l/min 1 to 10
Ch Gn
11 to 30
Ch Gn
31 to 50
Ch Gn
50
Ch Gn
Yield improvement:
0 - 50% 2 10
1 11 4 18 0 9
50 - 200% 2 4 2 13 1 12 1 3
200 - 300% 1 3 0 3 0 4 0 2
300 -400% 2 2 0 3 0 0 0 0
> 400% 0 6 0 5 0 1 0 0
Source: TWAD Board
In Rajasthan, the TGB unit visited at Chaursiy was close to Ajmer was commissioned by PHED in August 1994. Its productivity is summarised in Table 16. In this case the criterion for success is 10 l/min. From this table it is reasonable to assume an annual productivity per unit of 120 boreholes fractured, and from 1996 to 1998 there is some evidence of increasing productivity, perhaps as crew competence has been developed. The unit was at a borehole drilled in October 1998 which was practically dry (Table 15). Packer settings in Rajasthan were determined from the geological information only (i.e. without resistivity logging). At the deepest setting, the packer was slipping in the borehole, and work had to be curtailed because the water tanker was empty. The following day, hydrofracturing was completed at a total of five depth settings (Table 15), after which the borehole was tested to give a reliable yield of 10 l/min. In this case a worse than marginal borehole had been improved to provide an adequate discharge for a handpump in a village with little prospect of alternative supply.

Page 30 of Annex 5
Table 15: Summary of hydrofracturing observed on field visits
Balamanallur Coimbatore, TN
Chaursiywas, Ajmer, Rajasthan
Ambade, Bhor, Maharashtra
Depth (m) 200 60 60
Rest water level (m) 1.3 6 20
Reported yield (l/min) 47 neg neg
Pre-HF yield (l/min) 40 3 42
Pre-HF drawdown (m) 3.1 (60 min) Nd 2 (30 min)
Resistivity log yes No no
Packer settings (m) 45, 66, 83 21, 30, 39, 45, 48 na
Post-HF yield (l/min) 40 10 na
Post-HF drawdown (m) 2.8 (60 min) Na na
Increase in specific capacity (%)
11 Na na
Table 16: Productivity of the visited hydrofracturing unit, Rajasthan
Period Total boreholes Successful boreholes
1/95 to 3/95 25 21
4/95 to 3/96 123 79
4/96 to 3/97 132 92
4/97 to 3/98 142 91
4/98 to 12/98 70 60
Total 461 323
Source: PHED, Rajasthan

Page 31 of Annex 5
The third hydrofracturing unit visited was being operated by GSDA, Maharashtra (Table 15). The very dispersed habitations of Ambade village have three boreholes drilled in 1992. One close to the secondary school had its yield increased by hydrofracturing from 9 to 80 l/min in 1992, soon after completion. The second was chosen for the technique because it was said to be unreliable in the dry season, and the village had at times required supplying by 3 road tankers of water per day for up to 120 days per year. The borehole was, however, test pumped for the evaluation at high discharge with negligible drawdown (Table 15), suggesting that hydrofracturing was not required after all, somewhat to the embarrassment of the GSDA staff on site, and might indeed cause harm to the borehole. The explanation was offered that the private contractor may have measured the yield incorrectly at the time of construction, but that would not seem to agree with its subsequent dry-season unreliability. From the data provided for the site visit, the third borehole in the village was high-yielding at the time of construction, and confusion between sites may have led to the unit being sent to the wrong site within the village. This seems unlikely, as the villagers themselves would surely have directed the crew to the borehole in need of improvement. For whatever reason, this probably represents unnecessary deployment and hence expenditure, and emphasises the need for careful selection of sites which would most benefit from the hydrofracturing technique.
D. Uptake of the Technology - “Going to Scale”
The technique has been demonstrated to be technically feasible and its appropriate use can provide suitable quantities of water at about half of the cost of new boreholes (Annex 6). Nevertheless, it appears to have been taken up rather slowly by state organisations, and not at all by the private sector. This was of interest to the evaluation team. The potential for borehole improvement by hydrofracturing is recognised in the 9th plan. Each year some 125,000 handpump boreholes are constructed and about 20,000 of these are unsuccessful, of which 9,000 could be suitable for hydrofracturing. If these proportions are roughly extrapolated back over time, then if there are 2.5 to 3 million handpumps, these are installed on the 85% of drilled boreholes which were considered successful. If three quarters of the 15% failures are located in hard rock areas, then some 200,000 sites could be amenable to hydrofracturing. In fact this may be considered a minimum, because although Rajasthan, Maharashtra and others are using hydrofracturing to achieve handpump yields, Tamil Nadu is perhaps more generally using the technique to enhance handpump yields so that motor pumps can be installed to upgrade village supplies. This is likely to be an increasing trend elsewhere. The 9th plan estimates that 50 more units could be required and budget provision is made for their purchase. Further, the RGDWM was proposing a workshop in November 1999 to exchange experiences and to promote uptake of the technique.
The specific example of Rajasthan confirms this potential. In discussions there with PHED staff, it was explained that about 5000 handpump boreholes are completed in the state each year. Of these, some 500 are failures but suitable for hydrofracturing. The present capacity in the state of 3 units cannot keep pace with this work load, let alone tackle the backlog of an estimated 11,000 marginal or poor boreholes in the state which could be suitable for hydrofracturing to bring them up to reliable handpump yields. At least a doubling of capability is required, and a fleet of 6-8 units was considered desirable by state staff, who said that funding of capital purchases of this type was very difficult.
One factor which may have constrained uptake is the lack of an authoritative and detailed evaluation of the technical feasibility and cost effectiveness of the hydrofracturing technique by UNICEF. While it may be said that the lack of such a document did not discourage uptake of

Page 32 of Annex 5
drilling technology, nevertheless approaches, attitudes and requirements have changed and major investments need to be supported by careful financial and technical analysis. While some partial reporting of experiences has occurred for Maharashtra (GSDA, 1998) and Uttar Pradesh (Sharma et al, 1996) no overall evaluation of the programme has been performed by UNICEF. This is needed and, to assist in this task, therefore, the monitoring system for hydrofracturing must, as discussed elsewhere in this report, be more comprehensive in terms of both its data holding and its analysis and interpretation than that for the drilling.
3. Borehole Rejuvenation – Tractor Mounted Compressors
A. Equipment Provision
The use of compressed air to clean and re-develop boreholes is a widely used technique. Airlifting water essentially removes fine material infilling the hole and fines from the immediate surroundings of the borehole, including from the gravel pack if present, thus increasing the permeability of the near-borehole zone and hence improving the yield/drawdown characteristics. The approach is, therefore, different to that in hydrofracturing and it can be used to effect in lined boreholes in sedimentary formations as well as in hard rock areas. Mounting the compressor on a tractor assists with mobility and access to existing boreholes. The first units were introduced by UNICEF in 1991, and to date 37 units have been provided at a total value of some US $485,000.
B. Output and Effectiveness
As for the hydrofracturing units, the effectiveness of their usage has been widely variable. Two units commissioned in Rajasthan in July 1997 have performed well, rejuvenating about 75 boreholes by the end of 1997. From the report of Daw (1992), the units provided to Orissa were also well used. Two TMCs supplied to Madhya Pradesh were, on the other hand, reported to be little used, and four units provided to GSDA in Maharashtra were returned unused because the Director of GSDA felt they were likely to be of limited usefulness to him in the Deccan basalts, and because there were some technical difficulties with handling the hoses provided. UNICEF field offices should have made greater efforts to deploy the units to the states where they would have been most effective (in terms of hydrogeological conditions and institutional capacity), and should have followed up more vigorously where they were clearly not being well used.
Performance of the TMC units is now covered by the formal monitoring system developed by UNICEF and GOI. Proformas have been developed and data are being collected, but not apparently reviewed and interpreted by either UNICEF or the RGDWM. Furthermore, there has not been a thorough evaluation by UNICEF of the results obtained by the TMC units. General statistics appear to suggest that the method is successful, but the criteria for “success” and data related to these criteria are not readily available.
A 1992 report of trial rehabilitation of 50 problem boreholes in alluvial sediments in the Danida-assisted project in Orissa suggests that some 70% were fully or partially successful and, as more were done, three criteria of depth restoration, improved yield and improved chemistry were established. On this basis, 85% of 134 boreholes were classified as successful in terms of depth restoration, but yields remained low in 23% of them (Daw, 1992), and water quality problems persisted in 51%. The overall rehabilitation picture (depth, yield and quality) showed only 30% fully or partially successful. Thus, the airlift method was clearly effective in restoring

Page 33 of Annex 5
borehole depth by flushing out filled-up material. However, as the report admits, much of this may be an indication of inadequate development at the time of construction which, as has been discussed elsewhere in relation to drilling contracts and site supervision, is quite likely to be the case. While yield restoration or improvement might be expected from airlifting from boreholes in sediments, this technique might not have any impact on yields in really hard formations. Further, it is unclear why airlifting would be expected to widely improve groundwater quality, although it will clearly help remedy the situation with respect to bacterial growth and iron. Proper evaluation of the TMC method in relation to yield and groundwater chemistry requires knowledge of the aquifer material and chemical problem at each site.
C. Observations in the Field
The evaluation team visited two TMC units in Rajasthan. The unit operating in Alwar District had completed 101 boreholes from July 1997 to mid January 1999, of which 80 were classified as successful in terms of material removed to restore the original drilled depth and the yield, although no yield data were actually provided. From the records, this unit had been deployed largely on rather shallow boreholes (25-45 m depth range). Both units were operating in sedimentary formations on so-called “cavity wells”, in which a chamber beneath the casing pipe is flushed out during drilling. This may fill up with loose material after some time, because it is normally located in a coarse sand or gravel horizon, and the yield may decline. Flushing the cavity to restore yield can only be done if there is adequate minimum water yield from the well, otherwise a water tanker is required in addition to the TMC unit. Both crews appeared to be well trained and competent. However, no yield measurements were taken before or after (and are not asked for on the monitoring proforma); the compressor was merely operated until the discharge water was clear. At Alwar, the flushing could not be undertaken because no tanker was available.
D. Costs
A 1996 estimate of the cost of rejuvenation by TMC, based on completing 200 boreholes per year and taking account of depreciation, crew, moving and repairs is Rs. 1,950 per borehole. Data from Orissa for 390 boreholes rejuvenated between December 1993 and December 1995 by four units, i.e. more like 50 boreholes per year, suggest average costs of some Rs. 2,200 per borehole. Costs quoted separately to two members of the evaluation team in Rajasthan were Rs. 3,000-4,000 and Rs. 7,500 respectively, for 80% “success”, but these appear inconsistent and too high.
E. Future Scope
The method may therefore be appropriate and cost effective in the right hydrogeological environment. As this could be mainly shallower boreholes in sedimentary formations, it may be complementary to the hydrofracturing. UNICEF has not, however, carried out a comprehensive analysis of the total potential for or cost effectiveness of this method, even though units have been regularly provided since 1991. Their use, while apparently suitable, cannot be confidently advocated from the information available. In particular, criteria for selection of sites for rejuvenation by airlift pumping (TMC) and criteria for evaluating success, including comparison of yields pre- and post-airlifting need to be established.
In some ways the present operation is an unsatisfactory compromise. If it is to be a really cheap and rapid, once-in-few years cleaning approach for a few hundred rupees or a thousand

Page 34 of Annex 5
rupees, then perhaps it could be done with an old tractor and smaller compressor. In contrast to hydrofracturing, the capital investment would then be very low and might be attractive to small, local contractors. On the other hand, if it is to be a more comprehensive once-in-ten years borehole rehabilitation costing several thousand rupees and giving a further 10-20 years of borehole life, then it needs to be undertaken more professionally, with proper selection criteria and recording of results.
However, the compressors of 140 cfm and 100 psi which are currently used are the only size available in India that can be driven by a tractor PTO. These compressors are produced by several companies, as they are the size commonly used to operate jack hammers for roadworks and drilling shot holes for deepening irrigation wells. Further, experience to date suggests that 140 cfm is probably the minimum volume needed for effective flushing, and some states using the TMC units have requested more air volume. Both of the rehabilitation technologies tested by UNICEF clearly have a place in the programme, but further work is required to ensure each is used most effectively where it can provide the most benefit. Where new boreholes cost as little as they do in the Indian programme, rejuvenation activities and hence costs must be kept down accordingly. In UNICEF’s further assessment of these technologies, target costs which are one third of the new cost for hydrofracturing and one tenth of the cost for cleaning with the TMC units would seem to be required to justify their advocacy to the state implementing agencies.
4. Borehole Site Selection
A. Introduction
As described in section 1, 82% of the country is underlain by hard rock aquifers and much is arid or semi-arid, and it has always been apparent that location of suitable drilling sites in such terrain was problematic. Productive aquifer horizons are restricted and/or relatively deep, and hence difficult to locate with confidence from the ground surface. Even the modest yield of 12.5 l/min for handpumps cannot be achieved everywhere it is required, and higher yields for motor pumps are often not obtained. Where percentage success rates, in terms of handpump yield, fall as low as 75-80%, then considerable loss of investment is incurred, and efforts to improve success are clearly justified
B. Early Success Rates and the Need for Geophysics
The first substantial summary of percentage success rate comes from the 1976 evaluation report referred to earlier (WHO/UNICEF, 1976). Of 37,279 boreholes drilled, 7080 (19%) were classified as unsuccessful. The failure rate ranged from only 9-10% in Tamil Nadu to 35% in Maharashtra, and was also high in Gujarat. Further, in some states the rate of failures had decreased in some states between 1969 and 1975, was stable in some and had risen in others. This is not necessarily surprising, as any improvement in success from better techniques may be partly or completely offset by greater numbers of failures as the programme moves into more difficult areas. Data from this period are summarised in Table 17.
These data show that in the early stages of the programme drilling was generally shallower than it is now, with the majority of boreholes less than 38 m deep and very few deeper than 60 m. Only in Gujarat is there a strong indication that significant benefit was gained by deeper drilling. In Madhya Pradesh and Maharashtra the deeper boreholes were less successful, and this may

Page 35 of Annex 5
reflect the understandable desire to continue deeper at less promising locations where there are no easy alternatives and the chance may not readily come again.
The need for assistance with siting was recognised by UNICEF from a very early stage. Drilling engineers were familiar with the use of geophysical methods for borehole siting, and UNICEF was willing to bring in equipment right from the early stages of its involvement with the rural water supply programme (Moller, 1973). By the time of the 1976 evaluation (WHO/UNICEF, 1976), seven states had been provided with resistivity and magnetometer surveying equipment, and five with borehole logging and seismic equipment. Resistivity and magnetometer were being used but not extensively, and the other equipment hardly at all. Lack of training was identified as the main constraint, and recommendations were made to rectify this. The report of Beyer (1976) also recommended the provision of further geophysics equipment and training, and the TWAD Board was mentioned at that time as being very interested to receive support in siting. It also identified remote sensing as an area which should be pursued with the newly-established National Remote Sensing Agency in Hyderabad. The 1978 mission (UNICEF/CPHEEO, 1979) suggested that the prevailing failure rate of 20 to 30 % could be halved by the improved recording and use of existing borehole results and geophysical surveys.
Table 17: Success of borehole drilling from the early programme
State Depth 0-38 m Depth 38-61 m Depth > 61 m
Total % Successful Total % Successful Total % Successful
Andhra Pradesh 8584 91.5 704 78 78 60.5
Gujarat 1501 55.9 2559 73.5 13 85
Rajasthan 1514 80.2 182 73.4 117 76
Karnataka 2959 85.5 2081 85.2 527 84.6
Madhya Pradesh 1464 78.8 2398 88.1 611 63.2
Maharashtra 443 73.6 1074 65.2 370 52.7
Tamil Nadu 1326 88.2 1176 93.8 51 94
Total 17791 80 10174 81.1 1767 69.6
Source: WHO/UNICEF, 1976
C. Continuing Support in Siting
While UNICEF continued to support both provision of equipment and training in geophysical methods throughout the 1980s and 1990s, at unknown but presumably modest levels of expenditure compared to other components of the programme, there is little documentation of the experience gained. Links were maintained with the suppliers, with the National Geophysical Research Institute (NGRI) in Hyderabad, CGWB and the Geological Survey of India for training. The level of professional expertise and utilisation of equipment varied greatly from state to state, with probably the strongest organisations being the TWAD Board and GSDA. A study entitled “impact of the utilisation of geophysical equipment” was commissioned by UNICEF in 1997 is

Page 36 of Annex 5
the only detailed report on the subject. The report (Sabnavis, 1997) covers the period 1990 to 1997.
The consultant prepared a questionnaire for state implementing agencies, visited the offices in Uttar Pradesh, Gujarat, Tamil Nadu, Rajasthan and Andhra Pradesh, and went into the field with their geophysicists, hydrogeologists and engineers. The Terms of Reference required an assessment of the utilisation of the equipment in terms of amount and skill levels, and to report on the impact of the support provided by UNICEF. The equipment supplied between 1990 and 1997 is shown in Table 18 below, showing that most has gone to the hard rock states with large drilling programmes.
It was found both from the questionnaire and the field visits that utilisation levels varied from poor to very good (Table 19). The reasons for poor utilisation were lack of familiarity with the potential for the equipment and with its actual use, lack of maintenance facilities and absence of transport. The widespread citing of lack of maintenance is an indication that the service agreements between UNICEF and the suppliers must have been somewhat ineffective. UNICEF appears to have been paying for something it was not getting, but not adequately seeking to redress this.
Table 18: Geophysical equipment supplied by UNICEF, 1990-97
State SAS 300 Resistivity
mcOhm Resistivity
Spot logger Resistivity
Auto logger Resistivity
VLF -EM
Total
Andhra Pradesh
8 5 2 - 2 17
Bihar 1 - 1 - - 2
Gujarat 6 2 - 1 2 11
Karnataka 11 - 2 - 1 14
Kerala 1 - 1 - - 2
Madhya Pradesh
11 - 1 - - 12
Orissa 1 - - - - 1
Rajasthan 3 2 - 2 - 7
Uttar Pradesh 2 - - - 1 3
Tamil Nadu 19 5 10 1 3 37
West Bengal 1 - - - - 2
Maharashtra 2 3 - - 1 6
Jammu & - - - 1 - 1

Page 37 of Annex 5
State SAS 300 Resistivity
mcOhm Resistivity
Spot logger Resistivity
Auto logger Resistivity
VLF -EM
Total
Kashmir
Total 66 17 18 5 10 115
Source: Sabnavis, 1998
Table 19: Summary of geophysical equipment utilisation
State Average Sites/year/ instrument
Claimed Success %
Facilities %
Technology & Skill %
Field Data Quality %
Andhra Pradesh
72 93 70 70 70
Karnataka 288 88 50 60 60
Gujarat 79 85 80 60 70
Uttar Pradesh 58 85 20 50 40
Rajasthan 32 95 50 30 30
Tamil Nadu 360 97 90 80 60
Average 148 91 60 58 55
Source: Sabnavis, 1998
The report provides a reasonably clear picture of the utilisation of UNICEF-provided equipment, and makes useful recommendations for improving the situation. It does not, however, really meet the second part of its terms of reference. It purely takes the states’ estimates of “success”, without stating whether the criteria are the same in all cases, and without looking directly at any borehole data from RMS. All of the figures are very high (Table 19). Tamil Nadu, for example provided a figure of 97%, although it is clear from elsewhere in this evaluation report that the TWAD Board is often nowadays looking for motor pump yields. Against mixed criteria for success, 97% is unlikely to be achieved. It is not clear whether these success rates are overall or for sites at which geophysics was used, although the latter is presumably more likely.
In practice, it is not easy to evaluate rigorously the impact of the use of geophysics on borehole siting. This is because the “with geophysics” and “without geophysics” situation rarely exists together in comparable hydrogeological environments in the same programme, such that other factors can be eliminated or reduced. There is no true control in the scientific sense. The best that can be hoped for is a comparison between figures before and after a certain method was

Page 38 of Annex 5
employed, but other factors may obscure the comparison. The monitoring data in RMS are unable to help, as they do not record the method of siting. Thus while it is possible to see whether the success rate has changed over time, this cannot be related to siting techniques. The overall impression is that success rates have improved somewhat over the programme life, so the positive impact of better siting (including UNICEF support) and construction has probably countered the necessary negative impact on overall success rates from gradually moving into more and more difficult areas.
No borehole siting fieldwork was seen during the current evaluation. In Coimbatore District of Tamil Nadu, the private drillers contracted by the Collector’s office were engaging their own siting geophysicists from private companies and organisations other than TWAD Board. Discussions with one such person and a TWAD Board hydrogeologist revealed a dramatic and somewhat alarming difference in capability, with the former being far weaker in both basic understanding of geophysics and level of professional competence in the fieldwork and interpretation.
The desirability of community involvement in the programme has long been recognised – the WHO/UNICEF report of 1976 stated that “the picture regarding the people’s participation is dismal”. In terms of siting, the first stage was to consult the village Sarpanch, and now broader village meetings are intended. There are, however, no guidelines for state engineering staff on the level of communication and ways to ensure it, and anything that is done is probably on the initiative of individual engineers (Singh, personal communication). Training of state engineering staff probably consists of one lecture by an NGO representative. Broad experience in rural water supply provision indicates that proper community involvement takes time and, as for many other aspects of the drilling programme, it is likely that the race for coverage has severely curtailed community involvement in borehole site selection.
5. Resource and Source Sustainability
A. Introduction
In terms of the rural water supply programme, sustainability can be considered to have three separate components. These are:
• Sustainability of the water resource which provides the supply- a function of the available water, its recharge pattern and the factors which affect that, and the changing and often competing demands on this water, and its chemical quality.
• Sustainability of the sources themselves - this is a function of design, construction quality and maintenance, including the institutional, administrative and financial framework within which maintenance is undertaken.
• Sustainability of the programme - the ability of GOI and state governments to continue and build on the initiatives developed with UNICEF and other partners.
• Each of these has been considered in the main text of the report, and more detailed discussions are provided here. In reality, while the first two are usefully separated conceptually to avoid confusion of thought about sustainability issues, in the field they are often intimately entwined. For example, declining groundwater levels as a result of increased groundwater abstraction may cause declining borehole yields, intermittent supply and increased pumping costs for motor pumps and increased wear and tear on handpumps.

Page 39 of Annex 5
B. Sustainability of Groundwater Resources
The use of surface water and groundwater in India for irrigated agriculture has increased dramatically, driven from the 1960s and through the 1970s and 1980s by the desire for food self-sufficiency. That this goal has been attained is in itself a remarkable achievement for India. However, groundwater professionals have been aware for many years that the rapid expansion in groundwater usage could sooner or later become unsustainable in relation to the available resources. In India, as elsewhere, such rapid increase in groundwater usage produces declining groundwater levels and associated groundwater quality problems, particularly saline intrusion in coastal areas. UNICEF, with a major stake in safeguarding the large numbers of rural water supply sources which it has helped to create, has an interest in seeing that their sustainability is not unduly threatened, and this interest has been articulated within the WES programme for some years. The concern felt by UNICEF led in 1995 to the commissioning of a series of freshwater studies, and in 1998 to the publication within India of a major report setting the local insights obtained from these studies into the national regulatory and institutional context and providing a call to action for the future (Nigam et al, 1998).
The scale of the problem is reasonably well documented (CGWB, 1995; WB, 1998; Nigam et al, 1998), and a detailed description of the groundwater resource situation would be out of place in this review. Nevertheless, a few key facts can be used to establish the context for the non-specialist reader. India is very heavily dependent on groundwater, and it has been estimated (Nigam et al, 1998) that 80 to 90 per cent of domestic water supplies in rural areas and 50% of urban supplies are provided by groundwater. Further, about 50% of irrigation water demand is currently met by groundwater, and the growth in abstraction of groundwater for irrigation is illustrated by Table 20.
Table 20: Groundwater sources for irrigation
Source type 1950-51 1973-74 1990 1993-94
Dug wells 3,860,000 6,700,000 9,490,000 10,225,000
Shallow tubewells 3,000 1,140,000 4,750,000 5,044,000
Public tubewells 2,400 22,000 63,600 69,400
Diesel pumps 66,000 1,750,000 4,360,000 4,293,000
Electric pumps 21,000 2,460,000 8,220,000 10,276,000
Sources: Nigam et al, (1998) & RGDWM (unpublished)
Thus, some 15 million motorised pumps were in use for irrigation by 1994, and this may have risen to 17 million by the present day (Nigam et al, 1998). These are, however, not uniformly distributed within India; but are concentrated where soil conditions and socio-economic situation are most favourable for intensive irrigated agriculture and where hydrogeological conditions allow adequate groundwater to be obtained from relatively shallow depths. The states with highest numbers of irrigation wells thus include the alluvial areas of the Indo-Gangetic Plain

Page 40 of Annex 5
(Punjab, Haryana, Uttar Pradesh and Gujarat, and also several of the states of the hard-rock areas of peninsula India - Maharashtra, Madhya Pradesh, Karnataka and Tamil Nadu.
The Central Groundwater Board (CGWB) is the principal national government organisation with responsibility for assessment of the groundwater resource situation in the country. By extrapolating from detailed measurements at specific research sites, the CGWB has developed a simple approach to the estimation of national groundwater resources. This takes account of:
• recharge in the monsoon season by using rises in groundwater level combined with estimates of specific yield to calculate the additional recharge water reaching the water table.
• recharge in non-monsoon seasons by estimating canal seepage and losses by infiltration from irrigated land.
These broad estimates have indicated that the current level of total groundwater abstraction for all uses is some 32% of the total available, suggesting that there is potential for further development in many areas (CGWB, 1995). However, as stated above, the heaviest groundwater abstraction tends to be concentrated in the most favourable areas. Thus, in 1994, out of 7063 Blocks, Mandals and Taluks in the country, 249 were classified as overexploited, in which the groundwater abstraction already exceeded the available recharge. A further 179 were classified as “dark” or critical, in which the net abstraction would be in excess of 85% of available resource within 5 years, and a further 600 as “grey” or semi-critical, with projected abstractions in the range of 65-85% of the estimated available resource (CGWB, 1995). CGWB reviews and updates this assessment every three years, and is at the same time refining its methods of estimation and now beginning to validate the results at Block level against observed groundwater levels and carrying out further investigations to resolve anomalies.
The results of excessive groundwater withdrawal in declining groundwater levels have been widely observed and commented upon. Moench (1992) quoted declines between 1978 and 1990 of 4-8 m in some intensively developed districts of Gujarat, and 1-2 m/yr in the most intensively developed areas. During the field visits for this evaluation, time series data of groundwater levels showed declines of 10-25 m between 1980 and 1993 in parts of Coimbatore District in Tamil Nadu, which contrasted with stable levels where groundwater is less heavily developed. In the Deccan Basalt areas of Maharashtra, declines of up to 10 m in as many years of water levels (which are already 20-30 m below ground) in areas of groundwater irrigation compare with rises to within 2-5 m of the ground surface within well-established canal-commanded surface water irrigation areas. In the latter, excess infilitration from the relatively inefficient irrigation contributes significant additional recharge to maintain water levels close to the ground surface and in some areas results in waterlogging and the onset of soil salinisation.
Against this background, the concern of UNICEF to protect its investment in rural water supplies from the impact of uncontrolled groundwater abstraction is well-founded. While it is estimated that only 5% of current groundwater abstraction goes to meet domestic requirements (Nigam et al, 1998), and even full coverage to meet the handpump norms of 40 l/c/d represents only a small fraction of the available resource, the rapid and uncontrolled growth of irrigation based on groundwater represents a considerable threat to this investment. Capital investment in boreholes and motor pumps for irrigation has been heavily subsidised, and electricity for pumping ranges from being completely free in some states to a small, fixed charge according to the pump horsepower in others. Only the low borehole yields in many of the hard rock areas and the intermittent rural electricity supply prevent the situation from becoming even worse. An

Page 41 of Annex 5
illustration of the magnitude of the problem, confirming observations on the field visit to Maharashtra, is that 60% of abstracted groundwater is said to be used to irrigate the high-water-demand crop sugarcane on 3% of India’s land area (RGDWM, personal communication).
Improved management of groundwater to restore the balance between usage and resources can conceptually involve:
• actions to control abstraction in the most heavily developed areas and/or
• actions to conserve water resources and maintain or enhance recharge
While it was widely accepted during this evaluation at a professional level in national and state organisations that this situation cannot continue as it is, it was almost universally said that controlling groundwater abstraction is “too difficult politically”. India’s National Water Policy which was set out in 1987 (GOI, 1987) included a framework for restoring good management of water resources, but little progress has been made. Current common law legislation assigns property rights of surface water to the state, whereas rights to groundwater reside with the owner of the land above the aquifer. There is no limit to the amount which may be extracted, and there is considerable incentive to extract as much groundwater as possible before someone else does! In Maharashtra, the state enacted a Groundwater Law in 1993 which was intended to tackle this problem. Rules for controlling abstraction were promulgated in 1995, and considerable efforts have been made by GSDA to publicise these by posters and booklets in the Marathi language. However, only 12 of the 30 Districts in the state have ratified the law to date, and while irrigation pumping remains so heavily subsidised there is little prospect of controls being established.
C. Recharge Structures
As a result of the concerns about groundwater resources, there is currently great interest within India in the subject of augmenting groundwater recharge to assist in conserving and improving groundwater resource management and also from the groundwater quality point of view. Attention has been focused at national and state level on research efforts directed towards water conservation measures to increase recharge by a wide range of traditional and novel techniques, some of which were observed during the field visits. Further, this interest manifested itself in December 1998 in a national seminar on artificial recharge of groundwater, organised by the CGWB and co-sponsored by the World Bank Hydrology Project and the RGDWM. Interest embraces both new and traditional water harvesting and infiltration techniques and structures, and many research organisations and universities in India are engaged in studies in this field.
UNICEF has been supporting research by the TWAD Board in the Karaipottanar watershed in the Cauvery basin. Following a feasibility study (TWAD Board, 1997), a percolation pond was constructed in the Agrahara Valavanthi micro watershed in October 1997 and its influence on local groundwater levels and quality was evaluated (TWAD Board, 1998). From the rise in groundwater levels in the micro watershed, substantial additional volumes of recharge are estimated in the report, and the yields of defunct or marginal domestic supply boreholes have been enhanced. However, careful reading of the report of the influence of the percolation pond reveals queries over both methodology and data, which were conveyed during the visit to TWAD Board staff. Further, an improvement in quality due to dilution is claimed but only partially substantiated with data. Finally, the user community is not mentioned until the last sentence of the recommendations for further work, when it is suggested that “a meeting should

Page 42 of Annex 5
be held to identify a group for maintenance of the structure”. The study and report should have been reviewed more critically by ICO, and probably should not have been accepted in its present form by UNICEF as supporting agency. That is not to say that the idea itself is not worthwhile, but further evaluation of the influence of the pond through more monsoon seasons is required. One reason that longer-term observation is required is that silting up of recharge structures is likely to be a major constraint on their effectiveness.
Tamil Nadu is also active in the development of locally-enhanced recharge to improve the yields of irrigation wells. The evaluation team visited a check dam at Kallapuram in Coimbatore District which holds back rainwater to improve recharge to the benefit of 22 boreholes and wells. The cost of the 16 m masonry weir and 90 m long earth bund was Rs. 2.8 lakhs, of which Rs. 2.0 lakhs was for labour and the rest materials. Such schemes are being implemented by the Agricultural Department for the Collectorate.
In Maharashtra, the GSDA is active in researching the use of unconventional techniques to enhance the yields of potable supply sources in problematic locations in the Deccan basalts. The evaluation was shown the locations of such techniques at Ambade and Jambhali, south of Pune, At the former, blasting from shallow (9 m) boreholes in the streambed had been carried out in 1993 to create additional fractures up gradient of a large diameter well. This was now equipped with an electric submersible pump able to pump for several hours per day. Water is now collected from this well by tanker for two other villages in the dry season. The cost of the drilling and blasting was Rs. 28,000 or Rs. 17 per capita, and GSDA estimates an overall saving in government expenditure of Rs. 1.2 lakh annually. At Jambhali, a similar approach of drilling and blasting up gradient of a large diameter well was combined with sealing of down-gradient fractures by cement injection. The former cost Rs. 53,000 and the latter Rs. 24,000 or a total of Rs. 55 per person in 1993. The yield is now such that the total demand of 56,000 litres per day can be met from this well, and no tanker supply has been required since 1994; an annual saving of some Rs. 80,000. Even if these costs do not include the full amount required for investigation and site selection, the efforts by GSDA to develop unconventional techniques in the basalts appear justified. Careful site selection and feasibility assessment is required to confirm the favourable hydrogeology, geomorphology and terrain, as each such activity is unique and will only be successful where these conditions are suitable.
Promising results have been shown by some of these studies, but many have high costs, unresolved maintenance problems and need favourable local geomorphological and hydrogeological conditions to work effectively. At suitable locations, they clearly have improved the dry-season sustainability of individual sources or small groups of sources but they may not be replicable at the scale required.
UNICEF has recognised the need for tackling sustainability in its broadest sense. The second and third aspects listed at the beginning of this section have been taken into account throughout its support to the Indian rural water supply programme, and UNICEF has recently begun to tackle the water resources issue with its collaboration with WWF (Nigam et al, 1998). However, UNICEF does not have traditionally any comparative advantage in the field of groundwater resources management. It does have, as the evaluation mission was reminded on many occasions, the trust and mutual respect of its national and state partners, which allow its voice to be heard. For this voice to be backed up by soundly based technical information and advice, new partnerships both within the international and bilateral community of ESAs and within the national context are likely to be required. Even then, UNICEF may not be the most appropriate or effective organisation in advocating for action in the politically difficult area of groundwater management. On the other hand, in an era of increasing competition between agricultural,

Page 43 of Annex 5
industrial, municipal and rural domestic users of groundwater, who else will articulate the views and needs of the last mentioned if UNICEF does not?
D. Source Sustainability
UNICEF had for many years (and continues to have) strong advocacy at national level in respect of the technical aspects of programme implementation in rural water supplies, which has been backed up by advice, site visits and training courses. However, it is in the state implementing agencies and at individual site level that the quality of workmanship and effectiveness of supervision of both government and private crews determines how good the final “product” will be. The proof of the pudding is in the eating and, with a programme of this size and spread, it is clear, as discussed in the main report, that there has to be an element of “trade-off” between the need to meet coverage targets and the requirements of sound construction practice. The evaluation was concerned, therefore, to probe into the balance between these conflicting requirements. In so doing, it is important to remember that the rural water supply programme is a GOI activity. The state PHEDs or equivalent organisations are the implementing agencies, rather than UNICEF itself, and this must be appreciated in evaluating the real scope for UNICEF to influence activities at the site level.
Information related to the design and construction of borehole supplies was obtained from reports and training materials held in the ICO, from discussions with UNICEF staff at national and state level, from data held in the various rig monitoring systems, from GOI staff in the RGDWM and from the staff of state implementing organisations. First hand information was provided by the field visits to drilling rigs operated by both government crews and private contractors, to completed borehole sites and to an albeit limited extent by discussions with villagers.
The ability of the more than three million rural water supply boreholes to meet the programme objective of supplying safe water on a continuous and sustained basis depends on the many factors which are discussed in the main report. A programme of this size could only be completed in a reasonable timespan if the technical specifications were greatly simplified so that the main steps in the construction process were relatively standardised and routine. There is almost no scope for the kind of decision-making on site by hydrogeologists and drilling engineers that characterises programmes in which a relatively few, but individually very high value, boreholes are constructed as sources. In the present programme, individual boreholes could clearly be sub-standard and result in loss of investment, but the key to success is to establish and then implement the routine operations, such that overall most of the (individually cheap) boreholes are sound. However, a large number of cheap failures could cumulatively represent significant lost investment; it is a question of percentages. In the Indian programme, poor borehole design and construction could compromise this investment in several ways:
• The borehole may be too shallow in relation to yield and drawdown, and seasonal fluctuations or drought conditions
• Inadequate cleaning and development may allow fine material to enter the borehole and/or increase wear on the pump
• The borehole may be inadequately tested to determine whether it will support the intended pump
• The borehole may be inadequately sealed from the ingress of polluted water
• The precise siting may be poor in relation to local pollution sources and pathways.

Page 44 of Annex 5
E. Sustainability of Source Output
While resource sustainability is clearly a function of local and regional hydrogeological and climatic conditions, there are also sustainability issues linked to the type of abstraction source and its design. These components of sustainability are often confused. Thus, many rural water supply programmes, particularly those in which a component of the supply is provided from dug wells, suffer from the sources having inadequate depth for them to maintain yields throughout even a normal seasonal cycle, let alone one or more successive drought years. This is often a function of the increasing difficulty and cost of digging deeper, especially into harder rock formations. This constraint is more easily overcome where drilled boreholes are the selected option. The need for adequate depth is well entrenched in the Indian programme, perhaps because of the recurrent drought experience during its formative years. During the late 1970s to mid 1980s, the development by UNICEF with GOI of drilling norms resulted in the adoption of 60 m as the minimum depth for handpump boreholes in hard rock areas. The detailed discussion in section 1 of this annex suggests that this has been universally adopted and the RIMS and MIS data allow the managing engineers at state and district levels to identify, investigate and, if necessary, correct rigs which fail to achieve the borehole depth norm.
Where drilling is so cheap and fast then the cost impact of drilling somewhat deeper “to be sure” is not very great, but consideration needs to be given to the possibility of consistent and excessively deep drilling. Except in areas of rapid and severe drawdown of groundwater levels, this norm appears to provide an adequate margin of safety for handpump supplies. Where higher yields are required for motor pumps and in localities where heavy groundwater abstraction has produced high drawdowns, siting geologists appear to be recommending much greater depths and drillers are following and sometimes exceeding these. Thus, for example in the Coimbatore district of Tamil Nadu, where the problem of falling groundwater levels was recognised many years ago, geologists are currently often recommending to drill to 120 or 150 m. During the field visit to Coimbatore, a borehole being subjected to hydrofracturing to obtain an adequate yield for a motor pump had been drilled to 200 m in granitic gneisses, even though the static water level was at 1.3 m and there was no evidence of fracturing below 87 m. Pumping at 40 l/min after hydrofracturing drew the level down to only 18 m. Even allowing for the fact that seasonal fluctuations could, we were told, take the groundwater level down to 25-30 m, drilling to this depth at this site is difficult to justify.
Conversations throughout the field visits suggested that there was widespread inclination towards deeper drilling for a variety of reasons - “to be sure”, with a view to future installation of a motor pump, because of declining groundwater levels and competition for groundwater resources. The scope for excessive drilling is probably accentuated by the use of private contractors and the way in which they are employed and paid. The example of a private contract obtained in Tamil Nadu indicated that the contractor was paid only for drilling, at a rate per metre agreed for the contract. There was no payment for any of the other operations which are required to construct a borehole or for movement between sites. This appears to be the general form of the contracts. While the implications of this for the other operations are discussed below, there is clearly considerable financial incentive for contractors to drill fewer, deeper boreholes. In the admittedly relatively rare situations where the contractor (as opposed to the state) carries out or sub-contracts the siting, then there is scope for the driller to influence the geologist directly in favour of deep drilling. Where the state selects the sites and recommends the drilling depth, the influence would need to be more indirect, but the scope is nevertheless there. A private contractor’s rig visited only a few kilometres from the hydrofracturing site referred to above was observed drilling to 200 m.

Page 45 of Annex 5
Thus it seems likely that the minimum norm of 60 m is very helpful in this type of programme of routine construction in reducing the risk of borehole failure from poor yield/drawdown characteristics or large seasonal or periodic water level fluctuations. The widespread adoption of this norm also enables state implementing agencies to ensure that contractors drill to adequate depths, although in practice the contractual arrangements themselves strongly discourage shallow drilling. As described in detail in section 1 of this annex, there is no evidence for state rigs of excessive drilled depth. There is, however, for private rigs but as the 80% of boreholes constructed by contractors are not included in the rig monitoring systems, the overall scale is unknown. In most programmes, where the unit (per metre) drilling costs are much higher, this would be a greater cause for concern than it is in India.
Sound borehole construction also calls for adequate cleaning, development and testing. In DTH drilling in hard rocks, flushing of drill cuttings as drilling progresses and the extra flushing each time another rod is added is normally sufficient to keep the hole open and clean. In such hard formations, the requirement for borehole development is much less than in unconsolidated formations, in which a range of techniques may be required to remove the drilling fluid and fine material from the aquifer formation around the borehole and from the gravel pack. Nevertheless, a modest amount of flushing after drilling is required to remove drill cuttings from the hole itself and to clear the water-yielding fractures. The rig site visits provided an opportunity to see whether this was being done. At the private rig in Coimbatore referred to above, the “normal” routine (as described by the contractor’s representative) of 5 minutes flushing between rods and 30 minutes at total depth was just about followed. However, allowing for the fact that a good show was presumably put on for the benefit of the evaluation, it can be assumed that even this modest requirement is not always met, especially given the negligible degree of on-site supervision of either state or private drilling crews. The fact that private contractors are not paid at all for such operations must also mean that short cuts in borehole completion are likely. If inadequate borehole cleaning is indeed widespread, it is not surprising that rejuvenation has such a high percentage success rate; in many cases a component of this improvement may be completing the task of cleaning which should have been done at the time of drilling.
Following cleaning and development, the borehole yield must be measured to ascertain its adequacy for the proposed pump capacity. For handpumps, the norm of 12.5 l/min was established by UNICEF and GOI during the 1980s, and this or something very close to it is followed by the states. The “standard” approach to measuring yield is to use a 90o v-notch plate, a standard practice which, when done properly gives an accurate measurement of discharge rate. As observed on site, the small plate is placed close to the rig and roughly levelled within small bunds of mud and/or drill cuttings to catch the water expelled from the borehole by the compressor. The height of water passing over the notch gives, by a standard calculation (in practice from tables), the discharge rate. Even with such a small plate, and without the customary stilling tank, if it is vertical and level, and the measurement ruler is vertical, it can provide a sufficiently accurate estimate of discharge to determine suitability for a handpump; the drillers know what height they are looking for. This procedure was followed by the private contractor at the site mentioned above, but again allowance should probably made for the presence of the evaluation team members. At the state rig visited in Rajasthan, the driller reported that the v-notch plate was at home, he only used it for boreholes intended for motor pumps, and he estimated the yields of handpump boreholes visually based on experience. Again, given that contractors are not paid for time spent testing and the difficulty of field supervision, it is likely that the overall picture for both state and private rigs leaves much to be desired in respect of testing. Further, during the visit to Coimbatore, the evaluation team was informed that Tamil Nadu is proposing or actually introducing contracts in which the contractor will not be paid for unsuccessful boreholes. An unknown number of boreholes are,

Page 46 of Annex 5
therefore, probably passed as successful, and may constitute some of the so-called “seasonal” boreholes which cannot sustain adequate handpump yields through even a normal dry season.
F. Sustainability of Source Quality
The last two aspects of implementation listed above determine whether the borehole source meets its objectives in terms of bacteriological quality. The first of these relates to the choice of site. While the general siting criteria are a function of the geomorphology, hydrogeology and, hopefully user requirements, the precise position on the ground should take account of local pollution sources and pathways. Thus, flat, low-lying areas which encourage surplus water to stand around the pump or locations in hollows which collect local drainage should be avoided. Gently sloping ground normally promotes drainage. In the 1986 handpump survey, waterlogging around pumps was reported at 44% of sites. On the present visit, visual impressions of an admittedly biased “roadside” sample of handpump sites suggested that this remains a common problem. Many are sited, either for user convenience, easy (lazy) access by drilling rigs or to be on public land, in the strip of ground between the houses and the road. Where the roads already were, or subsequently have been surfaced and hence somewhat raised, this position can collect drainage which may be polluted from both highway and adjacent housing. Pumps were also seen sited close to drains and houses, and in the Rangareddy scheme it was common to see that new houses had been built within 2-3 m of some of the handpumps. Although general guidance has been given on these aspects by UNICEF in the training programme, it is by no means universally followed in the field.
Concerns about the potential for pollution from the ground surface around the borehole site lead naturally to consideration of the question of sanitary sealing. Reliable sanitary sealing could go a considerable way to keeping out such pollution. During the 1980s when the quality norms were being developed for drilling, a minimum casing depth of 6 m was recommended. The intention was that the surface casing would be taken down to a sufficient depth that it would completely penetrate the superficial overburden and seat in the top of the underlying hard rock. This has the dual purpose of preventing fine material from the overburden from moving into the borehole and providing an element of sanitary sealing to prevent the ingress of polluted surface water down the outside of the casing. If the overburden is deeper than 6 m, then surface casing should be taken down so that it sits half a metre into the hard rock. In general, it can be said that, from the rig monitoring records, the minimum norm of 6 m appears to be widely followed.
There is, however, usually an irregular annular space around the casing, and it is normal drilling practice to close this off with a sanitary seal, usually of bentonite clay or cement, and then the protection is completed with the handpump apron. UNICEF has long recognised the need for sanitary sealing, has advocated for it, given consideration to various designs of seal, and held training courses specifically on this issue. However it is clear from the field visits and discussions that in the programme at large, almost all handpump boreholes are completed without proper sanitary seals. The best that can be expected is that the driller may backfill the annular space with surface soil or clay or the fine drill cuttings.
The principal reason for this appears to be one of time. When drilling is so rapid, and boreholes may be completed in less than a day, the additional time and cost for sanitary sealing is not attractive. Interrupting progress to cement in the casing and wait for it to set before drilling on would slow down the whole construction programme. A conventional cement seal would take some hours to set adequately before drilling could continue. Non-drilling operations (and downtime costs) of this magnitude could have slowed the race for coverage, and it is not surprising that they were not adopted. UNICEF had, therefore, put some effort into developing

Page 47 of Annex 5
more rapid methods of sanitary sealing. The use of granular bentonite and locally-developed tools and methods for placing cement slurry could allow sealing to be done after drilling was completed, and the direct materials cost of the seals is generally less than Rs. 1,000 (Singh, personal communication). However, given the lack of rig supervision, seals are not routinely included in the state programmes, and a change in the contract specification would be needed for them to be included for boreholes constructed by private drillers. The lack of sanitary sealing was highlighted in discussions at the CGWB drilling conference in January 1999, attended by a member of this evaluation.
What are the implications of this lack of sealing? Given the concerns over siting expressed above, how much might these two issues compromise the bacteriological quality of the supplied water? Looking at hydrogeological factors, the hard rocks have generally low hydraulic conductivity which may restrict downward movement. Set against this, the fractures which provide the yields may also promote rapid infiltration of polluted water. Although the rocks themselves may be considered generally not highly vulnerable to surface pollution, it is the more rapid pathway around the borehole which is of concern. The relatively deep groundwater levels in many areas may help reduce the risk. Construction and maintenance of an adequate apron also helps significantly, and indeed in Andhra Pradesh the Hyderabad field office of UNICEF has been involved in a small study to develop and test larger aprons.
Overall, the situation may not be as bad as the lack of seals might suggest. However, achievement of coverage has been at the expense of the quality of the borehole supply source. The balance between coverage achieved and the possible loss of source sustainability for the reasons outlined above cannot, however, be quantified. If most of the 3 million rural water supply boreholes consistently supply high-quality water to meet the normal design life of 20 years, then sustainability has not been compromised. If poor construction practices were to reduce the life of a large proportion of the boreholes to only a few years, and the supplied water was of poor quality, then sustainability has not been achieved. The social, health and cost implications of the trade-off between coverage and construction standards should be comprehensively investigated by GOI and UNICEF.
6. Management Systems in the Water Programme
A. Introduction
The original desire to establish routine monitoring systems within the UNICEF programme was motivated by:
• a desire to track the deployment and productivity of the drilling rigs which had been supplied.
• a need to control and improve the procurement, stocking and deployment of spare parts for the drilling rigs.
That the former was a concern from very early in the programme is demonstrated by the WHO/UNICEF evaluation of the programme in 1976, in which data from about 37,000 boreholes was collected and summarised. The data were able to provide a picture of the numbers of boreholes, success rates, depths, annual productivity and also the amount of unproductive time and reasons for it, and a more detailed and thorough evaluation of the rural water supply programme was recommended and indeed outlined. Since then, a number of monitoring systems have been developed:

Page 48 of Annex 5
• Spare parts monitoring system
• Rig monitoring systems
• Kardex system for handpump O & M
B. Spare Parts Monitoring (SPMS)
This was started early in the programme in recognition of the need to manage the procurement and distribution of spares for rigs as, at that time, UNICEF was spending some $2,000,000 each year on spares for the drilling rigs. The system was established first in the UNICEF office and warehouses in Mumbai, and extended subsequently to the field offices. Requirements for spares were identified by government drilling crews and engineers in consultation with the staff of the rig manufacturers on their regular service visits. The operation in Mumbai was largely managed by UNICEF staff and, although UNICEF wanted to hand over the operation to government, suitable warehouses or staff could not be found. It was decided to distribute the spares to UNICEF field offices. Mechanisms were developed within SPMS to allow spares to be transferred between states but since UNICEF decided to withdraw spares support for rigs which were more than 10 years old, states have become less willing to transfer items which they may not then have to hand when they need them.
C. Rig Monitoring Systems (RMS and RIMS)
The first formal rig monitoring system (RMS) was introduced by UNICEF in 1987. The objective was to monitor the performance in the various states of the drilling rigs which UNICEF had provided. The rigs were given unique numbers identifying their make, type and age. A system of proformas was developed in which a small number of data items were recorded from the completion reports of each borehole: particularly total depth and casing length, and together with the distance travelled between sites, fuel consumed, hours of operation and rig downtime (and reasons for downtime) were used by the junior engineer responsible to compile monthly output reports for each rig. These were passed up the engineering department’s chain of command and eventually consolidated into monthly reports for all UNICEF rigs in the state. These were in turn compiled into national statistics. In the late 1980s this was extended to all government-operated rigs. It appears that RMS is now the GOI system and RIMS that of UNICEF, and they are not completely integrated.
D. Management Information Systems in WATSAN
Developing management information systems (MIS) was an essential component of the WATSAN strategy. Monitoring Cells were established or envisaged within the organisation in each state which was responsible for implementation of the rural water supply programme. Between 1987 and 1989, the rig monitoring (RMS) was extended in all states to government rigs and SPMS was computerised. In the period from 1990 to 1993, SPMS was converted to PC-based software and the state monitoring cells were extensively computerised, with UNICEF providing both computer hardware and software support and training. From 1994 to 1997, further orientation in MIS was given in ten states, with concentrated efforts to develop and implement systems being concentrated on Madhya Pradesh and Orissa. Monitoring systems were extended to hydrofracturing and the use of tractor mounted compressors.

Page 49 of Annex 5
E. Monitoring of HF and TMC
The technique of hydraulic fracturing to improve borehole yield was introduced to India by UNICEF in 1989. The technical aspects are discussed elsewhere. Performance of the units was initially monitored by UNICEF and state staff with the suppliers’ service engineers, and a formal, computerised system was established in 1994. As for drilling, proforma were developed which, in addition to location details and information from the time of drilling, record details of packer settings, durations and pressures, and details of the test pumping undertaken following hydrofracturing. Equivalent proforma are used for the tractor mounted compressors. However, both for HF and TMC, the established MIS systems have important limitations in supplying data for full technical evaluation of their suitability, as discussed both earlier in this annex and below.
F. The Current Situation
The systems as developed thus provide a reasonable way of recording the output of the government drilling and borehole rejuvenation programme. The usage of MIS was examined in several state agencies and UNICEF field offices and the ICO, but not very comprehensively in the short time available. In the TWAD Board office, the rig monitoring system was demonstrated and appeared to use a rather user-unfriendly database package. The operator was able to run a prepared demonstration, but was unable to make the system respond readily to specific queries. HF monitoring was also kept digitally, but appeared to be incomplete in terms of technical data from the test pumping, and also not easily interrogated and manipulated by the operator. The rig data appear to be routinely completed in the bare essentials and forwarded quarterly in digital form to UNICEF field offices, who merely act as ‘post-boxes’ and pass the information on to Delhi. It was not clear to the staff what happens to it then, and TWAD Board staff said they had no feedback from UNICEF. This limited “post-box” function was confirmed by the UNICEF field office in Chennai. In Hyderabad, computerised HF monitoring data were also seen in the hydrogeology section’s office suite, but these were incomplete in terms of their technical data because the master set were held by the engineering section.
The UNICEF ICO uses the RIMS data to compile the annual rig performance analyses on a national basis which were used in the discussion in section 1 of this annex, annual rig deviation reports (rig and state) and annual performance reports for each rig. On the GOI side, monthly and quarterly RMS records and annual reports for each state are forwarded to the RGDWM. These are used to classify the states into performance categories related to the proportion of time the rigs are actively deployed, achievement versus targets and drilling success rates. These are circulated to all states, and compiled (with many other things) into an annual review of the rural water supply and sanitation programme, which is tabled and discussed at Secretary level by the interested national government departments. States with below satisfactory performance are written to seeking explanations.
G. Contribution to Management Decisions
Management Information Systems are normally understood to be methods of assembling and analysing large volumes of data to assist management decision-making. Efforts were made by the evaluation team to identify and illustrate management decisions in the drilling programme which had been facilitated by the MIS developed by UNICEF and GOI. The clearest example was that RMS provides information from which GOI can identify those rigs which are consistently unproductive. These can then be looked at in more detail to see whether the

Page 50 of Annex 5
cause of the low productivity is the need of major repairs, and rigs which are beyond economic repair can be identified for replacement or rejuvenation. UNICEF has used the information to support its decision to withdraw spares support for rigs which it has provided and are now more than 10 years old., and to provide spares only for those younger rigs which are consistently productive.
However, RMS is unable to assist a number of other potential management objectives:
• it cannot be used to compare costs between states or over time as it has no cost data.
• it contains statistics on success rates, but does not include data on how sites were chosen, and so cannot be used to evaluate the impact of UNICEF hardware and training support in source location - by comparing states using different methods and evolution over time.
• it has little or no QA/QC capability in terms of workmanship and quality of construction. According to the time-line presentation, MIS in WATSAN should contain data with respect to sanitary seals, platform construction and drains, but these were not apparent in the states visited. They may apply only to certain focus states.
• it cannot be used to evaluate the impact of UNICEF driller training, ie by correlating higher productivity, better success rate, and better quality of borehole after training. This may in fact be unrealistic, as drillers are trained rather than rigs. If they stay with the one rig it could work, but in any case many other factors than the competence of the driller determine the performance of individual rigs.
Thus, considering the significant expenditure by UNICEF in support of monitoring and information systems, the incremental useful appears limited at best and even questionable. After all, basic statistical data concerning rig performance were available to the WHO/UNICEF mission in 1976 and, in reality, little more is provided today.
In looking to the short-term future, it is probably reasonable for UNICEF to be less concerned about the monitoring of rig performance, as it is no longer supporting service contracts, and the value of spare parts provision will continue to decline as the fleet of younger-than-ten-year rigs contracts. However, different considerations should apply to the techniques of rejuvenation, which are still being advocated by UNICEF, and are therefore at an earlier stage in their cycle of take up into the state programmes. The technical and financial scope for both techniques is summarised in the main text and described in more detail in this annex, and encouragement by UNICEF needs to be backed up by sound data on both technical and cost effectiveness. Monitoring of these rejuvenation techniques should, therefore, be viewed differently to RIMS, and the existing monitoring systems should be deployed effectively and strengthened further to embrace some of the additional information referred to in the sections describing the techniques.
References
Anon (1983) Are drilling tenders “rigged”? World Water, April and May 1983.
Anon (1996) Water resources management related to the Indo-dutch rural water supply and sanitation programme: An overview of problems and activities. Final Draft, February 1996.
Beyer M G (1976) The Indian Village Water Supply Programme: Situation, Observations and Recommendations. UNICEF.

Page 51 of Annex 5
Black (1994) The Children of the Nations: Chapter 12, The Handpump Cometh. UNICEF.
Bonnell F M (1990) Report on Hydrofracturing Seminars, Field Demonstrations and Fieldwork. UNICEF.
CGWB (1995) Groundwater Resources of India. Government of India.
Chilton P J and Foster S S D (1995) Hydrogeological characterisation and water-supply potential of basement aquifers in tropical Africa. Hydrogeol. J. 3 (1), 36-49.
DANIDA (1991) Evaluation Report: Drinking Water Projects in India. Denconsult, September 1991.
Daw R K (1992) Experiences from Rehabilitation of Drinking Water Tube Wells in Coastal Orissa. DANIDA.
Fouzdar D (1986) Water well drilling industry in India: versatility and impact of pneumatic drills in the crystalline rock terrains and future of slow drilling devices. Groundwater News, 1986.
Fouzdar D (1987) State of the art - groundwater technology in rural drinking water programmes. 13th Annual Convention and Seminar on Exploration Geophysics, Baroda, November, 1987.
Government of India (1987) National Water Policy. Ministry of Water Resources, New Delhi.
GSDA (1998) Hydrofracturing Technique for Rejuvenation of Borewells. Groundwater Surveys and Development Agency, Pune, Maharashtra.
KTH (19??) Twenty years in South India.
Moench M (1992) Debating the options: groundwater management in the face of scarcity, Gujarat, India. VIKSAT/Pacific Institute Collaborative Groundwater Project Report.
Moench M and Matzger H (1992) Groundwater availability for drinking in Gujarat: quantity, quality and health dimensions. VIKSAT Nehru Foundation for Development, Ahmedabad, India.
Moller A I (1973) Some remarks on groundwater conditions and use of geophysical instruments in hard rock areas based on findings from the WHO/UNICEF sponsored village water supply programme in India. UNICEF South Central Asia Region.
Nigam A, Gujja B, Bandyopadhyay J and Talbot R (1998) Fresh water for India’s children and nature. WWF/UNICEF.
Sabnavis M (1998) Impact study on utilisation of geophysical equipment for the period 1990-1997. Prepared for UNICEF India.
Sharma B, Yadav, C D S and Srivastava, D D (1996) Rejuvenation of borewells by hydrofracturing: an effort towards water sustainability. UNICEF project unit, UP Jal Nigam.
Singh A (1996) Report on Assignment in the RGDWM for the Year 1996.
Talbot R (1980) The groundwater pilot project, July 1979 to June 1980. UNICEF, Colombo.

Page 1 of Annex 6
Annex 6: The Handpump Story
1. Introduction
In the year 1967, UNICEF responded to the drought in Uttar Pradesh and Bihar by bringing eleven Halco drilling rigs into the country. This started the Indian handpump revolution. The arrival of these ‘down-the-hole’ (DTH) pneumatic drilling rigs initiated a programme that was to become the largest of its kind in the world, in terms of both area covered and people served. The Government of India has made the provision of clean, safe drinking water a cornerstone of its rural development programme. The rural water supply programme covers approximately 600,000 villages, serving almost three-quarters of India’s 900 million population. The impact of such coverage on the health and productivity is considerable.
This case study looks at the deepwell handpump development in India from the early 1970s to end 1990s and tries to critically review the implementation approaches in research and development, standardisation, capacity building, quality assurance and procurement. It also highlights the importance of proper technology selection, standardisation and quality control.
It analyses the complications maintaining such huge numbers of assets and how India tried to react to these challenges by the development of the India MKIII, a new variant of the India MKII, designed for easy maintenance and repair. The study offers an outlook towards new strategies of decentralisation and community management.
2. The India MKII Success Story
Emergence of a new Pump
In 1967, UNICEF imported pneumatically operated drill rigs to speed up the relief work in the drought affected areas in Bihar and Uttar Pradesh. Fitting handpumps onto these boreholes. The pumps were of the cast-iron ‘family’ pumps type used in American and European homesteads. These pumps were designed to meet family needs, rather than community pumps. Consequently the pumps were breaking down often under operating conditions in which they had to operate almost continuously for more than 10 hours a day. The War on Want Project, in Jalna designed a new pump. It was an all-steel handpump with a single pivot handle with a sealed ball bearing. The connecting rod was kept aligned and in a state of constant tension through a linked chain running over a quadrant. And the pump base was not connected to the casing pipe. Several hundreds of these Jalna pumps were produced over the next few years.
Several similar designs were taken up by various NGO’s. In 1970 Oscar Carlsson for the Sholapur Well Service designed an improved version with a better pivot design it featured a roller-chain operating over a quadrant. And a pedestal fitting over the borewell-casing pipe ensured a sanitary seal and the pump was set in concrete to eliminate movement.

Page 2 of Annex 6
Those NGO's were producing hundreds of Jalna, Jalwad and Sholapur pumps. Little co-ordination took place so that the pumps were invariably different from each other and even more serious, pump components of the same design were also not interchangeable. This made O&M rather difficult.
The Association of UNICEF
Water supply and environmental sanitation were important components of UNICEF's Integrated Country Programme. Since 1967, the agency's assistance to the water supply programme had largely taken the form of providing drill rigs for drilling boreholes in the hard rock areas of India. These boreholes were fitted with handpumps.
In 1974, UNICEF carried out a survey of handpumps fitted on bore-wells. The results were not encouraging, about 75% of the cast iron handpumps were inoperative. In the Bangalore workshop on handpumps in 1974, these unacceptable results were presented and UNICEF even considered stopping supporting the borehole programme because of the high failure rate.
Excerpt from a report by Ken McLeod, UNICEF 1977
“For the sake of this record, it is not necessary to detail the problems, existent, within the programme in 74, save to say, that the situation was bordering on disaster, and the drilling programme, UNICEF‘s prime responsibility, was in danger of being nullified, if a durable handpump could not be supplied….”
More by chance than by intention a partnership between two GOI organisations (MERADO and Richardson & Cruddas, both in Madras) and UNICEF started for the development of an improved handpump suitable to meet the requirements of rural India, the India MKII (there was never a MKI pump). UNICEF played a key role in bringing the various ideas together and acted as a co-ordinator and facilitator in the development work of the India MKII. MERADO provided design support, while Richardson & Cruddas were responsible for manufacturing the various prototypes. The partnership that evolved was quite unique as the Indian partners did invest considerable financial and manpower resources without ever entering into a contract with UNICEF. The Handpump Project was based on the mutual understanding that India needed an improved handpump and that all parties would work towards this goal. It was also clear, that once the research work was finished, the design would be made available in the public domain.
The Handpump Project focused on:
development of a sturdy and reliable community handpump that could work for a year without failure;
• large-scale local production in simply-equipped workshops at low cost (less than $200);
• the use of materials and components available in the country;
• reducing pumping effort to minimise the burden on women;

Page 3 of Annex 6
• demonstrating that a better-designed handpump, standardisation and quality control could facilitate a more effective maintenance system;
• Demonstrating that a more reliable supply of potable water could reduce the incidence of water-borne and water-related diseases.
The Sholapur pump remained the point of reference during development of the India MKII. In 1975, UNICEF purchased 6,500 Sholapur ‘conversion heads’ and provided them to various state governments. The ‘conversion heads’ (or top part of the Sholapur pump) replaced the multi-pivot handle of the cast iron handpump. The successful outcome of this hybridisation changed the Government's attitude to the handpump industry.
To achieve these various above objectives, the design team made the following design changes:
• increasing the pedestal diameter from 5" to 6" (125-150 mm) to accommodate the 5" casing;
• replacing the pipe handle with a solid bar, this counter-balanced the weight of the connecting rods;
• Replacing the two-part Sholapur design (head with water tank and pedestal) with a three-part modular design (head, water tank and pedestal).
Field-testing was carried out over the period 1976-1977 in Coimbatore district of Tamil Nadu State under the joint supervision of the Tamil Nadu Water Supply and Drainage Board (TWAD) and UNICEF. The combination of a deep SWL (around 40 metres) and a high handpump usage pattern made the district a stern testing-ground.
Another 1,000 pumps manufactured by Richardson & Cruddas were put on trial in various states in December 1977. The results were very encouraging; the pumps had a very low breakdown rate, were easy to operate and widely appreciated by communities and Government. With an extensive testing programme completed, it was now time to introduce the new pump in large numbers.
Large-scale production
The improved pump design found acceptance by the Government of India and a number of state governments. Demand started to rise. India needed to set up quickly a mass production capacity for handpumps. By 1978, Richardson & Cruddas manufactured about 600 India MKII per month.
UNICEF helped to identify and develop new manufacturers. It focussed on Co-operation with established companies to achieve a quick production base. This was done because it was realised that the traditional NGO’s could not provide the necessary production base for the numbers and the quality required. The choice to concentrate on the private producers was definitely a good one in order to achieve quick tangible results.
Crown Agents was engaged to carry out works inspection at potential manufacturers. These inspections served to verify the technical and financial capability of the companies

Page 4 of Annex 6
that had applied to become India MKII manufacturers. Once the competence was ensured, UNICEF placed trial purchase orders with these companies. UNICEF and the inspection agency provided technical assistance to manufacturers. Crown Agents supported the producers in setting up production processes and in the jig and fixture design. It was mandatory that a functional internal quality control management had to be established. This process enabled many of the private sector companies to improve their production and in-house quality control systems. They became qualified as UNICEF approved handpump suppliers.
The pragmatic policies pursued and promoted by UNICEF, on standardisation, local capacity building and quality assurance paid rich dividends and within a few years the handpump programme expanded phenomenally. The private sector's response to meet demand for handpumps was excellent. INALSA, Meera & Ceiko Pumps and Ajay Industrial Corporation soon became major players in the handpump industry, in India and abroad. The total production capacity reached over 100,000 units by 1982. By 1984, more than 600,000 handpumps had been installed and, in 1998, some 3 million India MKII handpumps provide water to the rural and urban population across India.
By 1984, UNICEF had awarded a license to manufacture to 36 manufacturers with an annual production capacity of over 200,000 units. All the qualified manufacturers had undergone rigorous works inspections for assessment of their capacity and capability to meet the stringent standards. Presently the Bureau of Indian Standards (BIS) has taken over the task of issuing production licenses. The number of qualified manufacturers has now reached 62. They have a total annual production capacity of over 300,000 handpumps.
Standardisation
A focus for the quality of the product was always in the forefront of UNICEF's involvement in the development of the India MKII. The problems of non-standardisation had become apparent during the prototype testing of the India Mark II. Many imitations, virtually all of a substandard quality, had appeared in the market. In 1976, UNICEF in concurrence with the Central Public Health and Environmental Engineering Organisation (CPHEEO) took a decision to formulate a national standard. The drawings and specifications of the handpumps were given to the Indian Standard Institution (ISI), now the Bureau of Indian Standards (BIS), so that it could formulate a national standard on the deepwell handpump. The National Conference on Deepwell Handpumps, sponsored by the CPHEEO and UNICEF, held in 1979 at Madurai, Tamil Nadu, endorsed the need for standardisation and strict quality control.
In 1980, the first ISI Specification for Deepwell Handpumps IS: 9301-1979 appeared. The process of national standards formulation was flexible enough to be responsive to the needs of the field. UNICEF, government and manufacturers continued to work on refinement of the technology through R&D and field-testing to improve reliability, durability and ease of maintenance. Any change in the standard was accepted only after it had proved its field worthiness. The ISI reviewed and modified the standard in 1982, 1984 and 1990. This was possible as UNICEF, government and manufacturers continued to work on refinement of the technology through R&D and field-testing to improve reliability, durability and ease of maintenance.

Page 5 of Annex 6
Figure 1: Savings due to Standardisation of India MKII Uttar Pradesh 1990-1998
The co-operation between UNICEF and the national Bureau of Standards created the necessary authority for the efforts by UNICEF to maintain the quality. The effect of standardisation and the private sector production of handpumps lead to a fierce competition that brought prices of pumps down considerably.
The India MKII in the export market
Although the India MKII was primarily designed for Indian rural conditions, it was soon found to be suitable for application abroad. The India MKII went on to conquer export markets. The local industry ventured also out into exports to many continents. Indian manufacturers successfully competed in international markets. Over the years they became to main suppliers to the African continent. The combination of a sturdy product, manufactured on a consistent basis in adequate quality at a competitive price opened the possibility that developing country manufacturers were capable of securing global tenders.
Local production of India MKII pumps started in various countries e.g. Germany, Italy, Mali, Togo, Nigeria, Uganda. Nigeria, Uganda, Ghana, Mali, Sudan included the India MKII pump into their standardisation programme.
-1,0002,0003,0004,0005,0006,0007,0008,0009,000
1,99
0
1,99
1
1,99
2
1,99
3
1,99
4
1,99
5
1,99
6
1,99
7
1,99
8
Year
Savi
ng in
Lak
s IN
R
Nos
of P
umps
(x10
0)
Saving per year Accumulated saving Nos of Pumps

Page 6 of Annex 6
Accomplishing Quality
A key factor to the success of both the domestic handpump programme and the export sales of Indian handpumps was UNICEF’s strict commitment to quality and an effective partnership with BIS. UNICEF realised that large scale manufacture of India MKII pumps in many different companies would have the great potential of bringing prices down due to competition. At the same time, it posed a serious threat to the product as well. To counteract this potential problem, UNICEF insisted on strict quality control of all pumps to ensure longevity and inter-changeability between pumps and parts produced by the various manufacturers. It arranged and paid for pre-delivery inspections of all handpumps purchased for GOI by independent inspection agencies (Crown Agents and SGS) for over fifteen years. The technical support provided to manufacturers was instrumental to:
• create the capacity to economically viable produce handpumps in India
• improve production techniques and to strengthen internal quality control systems
• create awareness among implementing agencies about the need for the procurement of prime quality handpumps and spare parts
• continuously monitor the manufacturer's consistency in quality control
• monitor through consignee end inspections the effectiveness of the quality control mechanism
In 1996, the full responsibility for quality control was transferred to the BIS. Recognising the need for continued quality, Government departments purchase only from the BIS approved manufacturers with pre-delivery inspection at the manufacturer's works by a BIS inspector. The state governments pay for the inspection cost, which is now included in the purchase price of the handpumps. By end of 1998, UNICEF has stopped supporting spare parts inspections. For the spare parts supplies the BIS issues self-inspection licences to manufacturers, i.e. those parts are not any longer subject to third party inspection.
Many manufacturers feel that UNICEF’s withdrawal from inspection and quality control has been a discernible step backwards. They complain that BIS has neither the capacity nor the internal management capability to ensure factual unbiased inspection in the same way as the international inspection agencies had.
Some of the reputable manufacturers (Inalsa) have stopped selling India MKII pumps to state governments because they feel that the prices were forced down at the cost of the quality to the extent that they would have had to cut corners and could not have maintained the minimal quality standard. Inalsa fears that all manufacturers are forced to lower the quality level and then try avoiding stringent inspection (which seems to be possible since BIS inspectors have taken over from the international agencies). The minimal profit margin is (according to Inalsa) not worth the effort. Inalsa has closed down 4 out of its 5 plants. They produce pumps only for export. Many other manufacturers confirmed the story. Their only motivation to stay in handpump business is the export market; they need the domestic market to provide the necessary mass for being able to successfully compete in export markets.

Page 7 of Annex 6
This development provides a threat to India’s handpumps programme. Three million India MKII of good quality are a tremendous asset, however three million India MKII of bad quality could be a colossal liability. UNICEF itself seems to follow the trend of buying at the cheapest source. It motivated manufacturers to invest in ISO 9000 total quality management. But now, after one of the manufacturers has achieved certification, UNICEF tenders do not recognise the accomplishment and he does not get any benefits out of it. It is recommended that UNICEF takes steps to carry out with BIS a joint evaluation of the manufacturers qualification. This should be done to review the process of vendor selection as well as to validate the present criteria of approval.
Government's Role
The Government of India (states governments and the RGNDWM in implementing the ARWSP and the MNP) played a crucial and decisive role in the accomplishment of the handpump programme strategy. The attached graph shows the significant GOI part in this programme to achieve coverage for the rural population. UNICEF support was catalytic in nature and shifted from the initial hardware demonstration towards mainly software inputs. The government's strong support to standardisation and quality control was crucial for the handpump programme in India to accomplish the tremendous task of providing safe water to most of the rural population.
The GOI has realised that the days of striving for numbers have ended. It is now essential to manage the assets that were built up over the last 20 years. To improve, expand and sustain the existing infrastructure will be another formidable task.
Figure 2: Handpumps in India
-
500,000
1,000,000
1,500,000
2,000,000
2,500,000
3,000,000
Year
1975
1977
1979
1981
1983
1985
1987
1989
1991
1993
1995
1997
Year
Nos
.
Total Pumps by UNICEF Total Pumps by GOI Total Pumps in Service

Page 8 of Annex 6
3. Technology Development for Change
Involving the Users
Community based O&M of handpumps had been under consideration in the very beginning of the India MKII development.
Ken McLeod wrote in 1997:
“New concepts are being developed overseas and we will submit them to field testing, as and when they become available. A concept shortly to be tested in our application is the cylinder that allows for the removal of the piston and foot valve without removal of the rising main…..This concept, if proved to be reasonably durable and by this we mean one year’s trouble-free operation, could bring village maintenance in sight.”
The VLOM-concept initially very centred around the development of so called VLOM handpumps. The development of the India MKIII pump falls into this era. The line of thinking was that easy to repair handpumps would automatically trigger community involvement. Only with time, it was realised that the VLOM-concept depends much less on the technology but much rather on the software and institutional aspects.
THE VLOM CONCEPT
The inter-regional Handpump Project (later named Water and Sanitation Program) initiated in 1981 by UNDP/World Bank in support of the international drinking water decade was the major promoter of the Village Level Operation and Management of Maintenance (VLOM) concept. It was seen as the most suitable approach to the maintenance problems.
Initially the Handpump Project aimed to develop a new generation of better handpumps. However, field trials indicated strongly that technology did not solve problems related to handpump breakdowns. Pumps were not repaired for many reasons, missing mechanics, missing tools and spare parts, non-availability of vehicles or lack of fuel.
A careful appraisal of the inter-linked obstacles surrounding handpump maintenance systems led to the conclusion that handpump technology had to be ‘user-friendly’, that the villagers, with a minimum of training, should be able to work as handpump mechanics. The design philosophy aimed at a pump that could be put back into service with little effort and minimal administrative overhead. In the beginning, the VLOM idea restricted itself to the hardware aspect, with the intention of developing pumps that were:
• manufactured locally, thus ensuring the availability of spare parts;
• maintainable by a village caretaker with minimal skills and a few light tools;
• sturdy under field conditions;
• cost effective.
These objectives contained within them the inherent need for organising an enabling environment within which the people and their pump could interact. The software element became prominent and very important. Community participation and management took on a sharp definition. The responsibility for O&M of the pumps was now at village level.

Page 9 of Annex 6
The India MKIII Development
The UNDP/World Bank's Handpump Project and UNICEF established a field-testing project near Coimbatore in Tamil Nadu. The objective of this project was to carry out improvements to the India MKII, in particular:
• to document the working life of the pump components, the maintenance cost and spare parts requirement;
• to identify and test potential improvements to reduce maintenance costs;
• to test experimental variations of handpump components;
• to recommend a field-proven design adoptions;
• to develop special tools for easy maintenance.
Development work to improve serviceability had to be carried out without adversely affecting the inter-changeability of the components, reflecting the large number of pumps already in the field.
In the India MKIII, an open top cylinder and 2½" galvanised iron riser pipe were fitted. The aboveground mechanism was modified to facilitate withdrawal of the extractable piston and foot valve without having to remove the rising main. The foot valve is placed in a conical receiver and a nitrile rubber O-ring provides sealing. A pushrod in the footvalve purges the column of water when the foot valve is lifted, thus retrieval becomes much easier.
The project developed and field-tested two handpump designs, the India MKII (modified) Deepwell Handpump and the India MKIII (VLOM) Deepwell Handpump. Approximately 80 pumps were tested and monitored under conditions of heavy use and deep SWL near Coimbatore over a period of 4½ years between 1983 and 1988. About 50 standard India MKII handpumps provided the baseline information.
The Rationale Behind the India MKIII Development
The Coimbatore Project made a wealth of data available, comparing India MKII and MKIII pumps. The data indicated that repairs to the India MKIII took 67 % less time than for the India MKII. Difficult repairs, which required a mobile team, were 86% less. The tools (weighing approximately 7 kg) were sufficient to perform 90% of all repairs. The costs for O&M depend on the following factors:
• the type of maintenance structure,
• the number of pumps a maintenance structure can look after,
• the number of interventions per year,
• the cost of parts replaced.

Page 10 of Annex 6
The fixed expenses for the maintenance structure could be reduced if a greater number of pumps would be serviced. It was estimated that a mobile team could service 290 India MKII pumps or 1,940 India MKIII pumps. The remaining repairs were expected to be carried out by a block mechanic, he could service 1,480 India MKII pumps or 600 India MKIII pumps. In the case of the India MKIII, the block level mechanic duties could be easily performed by a trained village handpump caretaker. In theory the maintenance cost of the India MKIII was calculated to be $ 23.50 per annum less than the India MKII. The reduction is mainly due to the cost of the mobile teams being reduced by 66%.
Further, community based O&M has the potential to shorten the downtime of the handpumps. A survey commissioned by UNICEF noted that the time taken to report a breakdown varied from 4 to 13 days. The time taken to put the pump back in operation varied from 7 to 44 days after the receipt of the report. Approximately 80-85% of the handpumps are operational at any time. That means in average a pump is out of service for approximately 50-70 days in a year. If users can repair their own pumps, the problem of long delays could be mitigated largely.
The capital costs of an India MKIII are 36.3% higher than that of the India MKII, excluding the cost of borewell and platform, mainly due to the bigger sized rising main, (from 32 mm to 65 mm). The initial costs are in India a very important consideration in the selection of equipment. Higher capital expenditure can be justified only if it can be offset by lower recurring maintenance costs and other advantages.
Changing Course
The arrival of the INDIA MKIII was probably essential to initiate the shift in government thinking. The India MKIII being easy to maintain at village level encouraged the philosophy that communities could take charge of their pumps. The convincing figures from the Coimbatore project indicated that the higher investment cost of the MKIII appeared to be justified. With UNICEF support, demonstration projects of Community Based Handpump Maintenance (CBHM) using MKIII were started in Bihar, Andhra Pradesh, Madhya Pradesh and Maharashtra. The projects mainly concentrated on the training of communities, particularly women, in performing the necessary repairs and (sometimes) inclusion of Gram Panchayats into the procurement of spare parts. However, the potential offered by the Panchayati Raj system to establish clear legal community ownership of the waterpoints with new roles for the technical departments/boards and the rural development departments was not explored. Spare parts still had to be obtained through the old government channels. The number of mobile teams per handpump did not change. The reliability of the pumps was not improved and cost for O&M did not come down. Thus for the communities and the government institutions the shift to CBHM changed little. Women who were not paid for their work often performed repairs.
In many CBHM project NGO’s were included. The use of NGO’s can be highly beneficial for the introduction of new concepts as they normally have a good rapport to the grass root level. It should however be avoided that NGO’s take over the role of the government and set up a parallel structure. In terms of sustainability an NGO depends on project funding and can therefore not be a permanent institution. Some CBHM projects show a distinct dislike to place the O&M within the Panchayat Raj Institutions (PRI), separate Watsan groups are set up. This might be due to the weakness (and sometimes reluctance to take over the responsibility) of the Gram Panchayats.

Page 11 of Annex 6
Because of CBHM not being part of a full institutional reform, the structures at PHEDs/boards and at the district/block level were not changed. Obviously the engineers see CBHM as a threat to their jobs. With the lack of a perspective within the departments the India MKIII never found a wide acceptance. The technical limitations (because of the weight of the rising main pipes the pump should not be used in installations deeper than 30m) further reduced the impact.
Has the MKIII been a step in the right direction?
UNICEF strongly advocated for the use of the India MKIII pump. But has this pump actually achieved its objectives. In terms of factual improvement of the reliability of the handpumps it was certainly a small step forward. Ease of maintenance is not a decisive factor for the O&M of handpumps. Village communities who can maintain their diesel/electric irrigation pumps are well capable of repairing a handpump, may it be MKII or MKIII. The will to keep it going is the deciding factor. And the fact that women can do as well as men (given the opportunity) does not need to be proven with a piece of technology.
On the other hand, sometimes a good idea needs a tangible piece of hardware to go with it. From this point of view, the India MKIII has probably been a very useful tool for the advocacy of community based maintenance at all levels.
The MKIII did not accomplish its goal:
“to stand in the village and invite, perhaps challenge, the community to participate, to maintain, to manage”.
It did however trigger off a different development:
“the GOI started to believe that alternatives to the established three-tier maintenance concept are feasible.”
From this point the real merit of the MKIII development is hidden in the diameter of the rising main. It opened a door and this opportunity should now be seized and fully a comprehensive maintenance concept should be developed.
Progress in handpump technology will have to go on. R&D will be important if it is geared towards meeting the demands of the changing conditions and environment.
The Swajal project is an example where many interesting aspects are included. The project design enables capacity-building within communities, works nearly entirely with and through NGO’s, taps private sector resources, but it does very little to strengthen Jal Nigam (the state body responsible for water).
The big question remains:
“What happens when the project ends?”

Page 12 of Annex 6
4. Maintaining the Assets
Maintenance
Relevance of Handpump Programme
By 1999, an estimated 3.0 million India MKII/III handpumps are installed in rural India, serving a population of approximately 500 million. The number of boreholes and handpumps represent an investment of approximately 15,000 crore INR (150 billion INR or US$ 40 billion). A study commissioned by UNICEF in 1985 found, on average, 87% of the pumps were working at any time. This figure stands in stark contrast to assessment in the 1970s when the breakdown rate was so high that only 25% of the pumps were working. The presently reported results of handpump performance vary from 98% (Tamil Nadu) operational at any time to about 60% (Rajasthan). These figures are most likely too optimistic. From the impression the evaluation team got during the field visits, it can be safely assumed that about ~60% (Tamil Nadu) to ~ 80% (Andrah Pradesh, Rajasthan) of the pumps are in working condition. The figures reflect the dependence on handpumps in the various states. TN has a piped system in virtually every village and handpumps are only used for emergencies. Rajasthan and AP are much more dependent on handpumps.
Progress in rural electrification allowed that in a number of states development of new infrastructures tries to provide a higher level of service through small and larger-scale piped systems. The handpump is increasingly a supplementary water supply system that is used as standby in case the pumped scheme fails. The relevance of the handpumps is in those states diminishing. The reduced reliance on functioning handpumps also lowers the importance given to maintenance and timely repairs.
It should however be noted that the rapid progress of the ARWSP and MNP increased the water supply coverage of rural communities within the last 18 years from 31% to nearly 90%. With this multiplying number of water points the cost to maintain them rose rapidly as well. Presently the cost to the government for the operation and maintenance of the 3 million boreholes with handpumps and 200,000 to 300,000 PWS are approximately 6,000 million rupees (600 crore). This represents about 15% of the total annual budget allocation. The burden on the government is very high and might not be sustained for much longer. In the new Guidelines for Implementation of Rural Water Supply Programme (1999) the RGNDWM plans to set up an effective cost sharing arrangement.
The designers of the India MKII had attempted to create a veritably robust machine. They had deliberately tried to reduce the frequency of maintenance interventions. The question of ease of repair was not an important design consideration. Thus, for all its simplicity of design and being rugged, the India MKII did not offer the user an opportunity of a 'hands-on’ approach to handpump maintenance. The India MKII designers had assumed that when necessary, competent professionals would be called in from the district headquarters or from the Public Health Engineering Department (PHED) to repair the pump.

Page 13 of Annex 6
The Three tier system
The National Conference on Deepwell Handpumps held at Madurai in 1979 was a significant landmark for handpump maintenance. It recommended the presently predominant three-tier maintenance system as a workable solution for handpump maintenance. It offers the users a rudimentary opportunity to participate in the responsibility for O&M. The system consists of:
1. the village caretaker,
2. a block-level mechanic who looks after 100 pumps, and
3. a mobile repair team at the district level for every 1,000 pumps.
The intention was for the handpump caretaker to work on a purely voluntary basis and to:
• interact with villagers on how to keep pump surroundings clean;
• attend to preventive maintenance;
• report breakdowns;
• promote handpump water as ‘safe’ water.
Practical experience
The three-tier maintenance system was adopted in nearly all states. It appears that in practice, only to the two tiers on top (i.e. the block-level mechanics and the district mobile maintenance teams) were effectively established. The system with the voluntary caretakers did never really work well; high dropout rates effected that soon many of the caretakers had given up their responsibility. This adversely affected the reporting of handpump failure to district/block level officials.
The complicated institutional setting with two agencies responsible for handpump O&M, (the technical departments/boards (PHED, PRED, TWAD) are responsible for the installations and the major technical repairs but the Panchayats are responsible for day to day O&M) does not help to make the situation more transparent. In reality, the three-tier system has been replaced by a one-tier system in which the mobile teams have to carry the main burden. They only can react to reported breakdowns and have no possibility to carry out preventive maintenance. The norms set for the three-tier system, (i.e. (a) one block-level mechanic for 100 pumps, (b) one mobile team for 1,000 pumps and (c) one hydrofracturing unit/compressor per 30,000 boreholes) are not sufficient to allow a fully comprehensive coverage of all pumps with mobile teams. A mobile team can in average attend to about 3 pumps per day. This would bring the theoretical total pump repairs to about 860 per annum. In reality the total number of repairs will be less due to various reasons (truck not available due to maintenance, idle time due non-availability of crew, truck being used for other purposes, etc.) The realistic number of pumps covered by a mobile team would be approximately 500. The lack of maintenance personnel and transport effects that the repair services can not be carried out to the level

Page 14 of Annex 6
as actually planned. Often, a long time expires between breakdown and the arrival of the repair unit.
Rajasthan adopted a one-tier’ approach, a system was practised in which village 'mistris’ (village level mechanics) were trained to attend to minor problems during the year. The mistris were initially self-employed and responsible to the Gram Panchayats. The government provided the tools, equipment and paid the mistris on a per job basis. After a court decision, they had to be hired as regular government employees. The system did not perform well. It has its own inherent problems and the mistris are often caught between their obligations to the Panchayats and the PHED. Because of inefficiency of the system, the PHED takes over these mistris just before the summer months as additional work force to their mobile team. The combined service force carries out a repair campaign during which all (or nearly all) pumps are serviced and made functional. This effects that most pumps are working, at least during the time when the rural communities depend mostly on handpumps.
Despite an institutional environment that is not conducive for effective O&M the pump performance figures are quite good. This can be attributed to the following factors:
• the norms set for handpumps (250 people) are sensible
• the India MKII is a good pump (in design and quality)
• the level of competence and commitment within PHED’s is high
• the political will to provide water to rural population is strong
However, the three-tier system is relatively expensive, and also lacks responsiveness, in terms of time and occasionally inclination.
Community Based Handpump Maintenance
Community based O&M is not a question of what skills or tools are required for repairs. Rural India manages to keep 15 million motorised irrigation wells operational. They need to be working in time and require a higher level of skill and management ability than handpumps. Therefore, the type of handpump being used is of secondary importance. Community based O&M is possible with MKII or MKIII pumps. (This does not mean that a pump, which is easier to repair, is not desirable.)
UNICEF’s involvement in CBHM has been concentrated on the development and promotion of VLOM handpumps (MKIII), the support to village mechanics training and to the advocacy role. UNICEF supported the national workshop of RGNDWM on community based O&M in 1997. Since then it has supported several state workshops on the same subject. These workshops provided a very useful platform to discuss the concept in a participatory manner with the state level government officials, to define the future role of the governmental structures and to formulate action plans for the transition. The mission realised the need for change. The main thrust of the ARWSP is not any longer on numbers and coverage but rather strives for quality of the systems. The mission included community based O&M in their Guidelines for Implementation of Rural Water Supply Programme (1999) as the way for the future. In the guidelines conditions

Page 15 of Annex 6
for community based O&M are set. The RGNDWM’s methodology for implementation includes that the communities need to:
• own the assets
• be involved at all stages in the planning, implementation/development and maintenance of the facilities
• be trained to do simple repairs
• know that the government will not maintain the assets
• have sufficient funds for maintenance
The implementation of these changes towards decentralisation through Panchayati Raj Institutions/local communities, water user committees, NGOs will be supported through special incentives to institutionalise community participation.
These changes are a step forward from the previous projects to introduce CBHM, which never comprehensively tackled the institutional aspects and therefore did not yet effect a change on the ground. India has theoretically the ideal institutional set-up for decentralisation of O&M. The PRI’s should be used for the management of O&M. Now that India is moving towards decentralisation (9th 5 year plan) it is essential that some well designed pilot projects are tried out, that include all aspects (change of institutions, legal ownership, technical back up, financing including cost sharing, etc.).

Page 52 of Annex 5
TWAD Board (1997) Feasibility study for locating artificial recharge structures in Agrahara Valavanthi micro watershed of Karaipottanar watershed. Prepared for UNICEF India.
TWAD Board (1998) Influence of percolation pond in Agrahara Valavanthi micro watershed. Report for UNICEF on the UNICEF-assisted water resources management project in Karaipottanar wateshed.
UNICEF (1983) A new approach in the selection and procurement of water well drilling equipment and accessories for the UNICEF-assisted rural water supply programme in India. UNICEF WESS, New Delhi, July 1983.
UNICEF WESS (1998) Timeline presentation to evaluation team, New Delhi, October 1998.
UNICEF/CPHEEO/WHO (1979) Report on rural drinking water survey mission, India 1978.
WHO/UNICEF (1976) Report of the Evaluation Team on the WHO/UNICEF Assisted Rural Water Supply Programme. UNICEF.
World Bank (1998) India – Water resources management sector review: groundwater management report. WB Rural Development Unit, South Asia Region with Government of India.


Page 1 of Annex 7
Annex 7: Sanitation This annex describes and evaluates UNICEF sanitation activities in more or less chronological fashion. Many experiments from the past continue into the present and perhaps the future; in considering whether or not to continue certain strategies or approaches it is important to understand the context in which they were originally developed.
1. UNICEF Sanitation in the Early Eighties
Chapter 2 in the main report described the relatively recent growth of concern in sanitation relative to water supply, stemming from the early 1980s. From its beginning, UNICEF's work in sanitation reflected attack on a number of fronts, namely:
support for a major partnership in defining technological options (TAG)
direct involvement in piloting various approaches to sanitation and
advocacy of the importance of sanitation as an issue.
In 1983, UNICEF offered major financial support for the formation of the Technical Advisory Group (TAG). The group was formed by the World Bank, but its members and funds were drawn from the Government of India, UNICEF and UNDP. In its focus and recommendations, TAG effectively defined the problem as a technological one, and played an important role in putting sanitation on the agenda among technical professionals in India.
UNICEF itself became involved in sanitation projects for the first time in 1982, when it initiated a rural sanitation programme with three NGOs in West Bengal. Prior to this, sanitation was part of the hygiene component of health education programmes. The ‘formalisation’ of sanitation in this early project could be criticised in current terms as it actually delinked sanitation from the health issue for the first time and looked at it as a separate ‘problem’. This contrasted with UNICEF's approach on other sanitation projects (e.g. in Orissa), which continued to focus upon hygiene. In the Orissa project, sanitation was a component of a community based information and education programme, with a strong involvement of the Public Health Department of Orissa.1
In 1983, two sanitation project officers were appointed in UNICEF to manage projects across India. Pilot district level projects were launched in Andhra Pradesh, Madhya Pradesh, and Maharashtra in the same year. In these projects UNICEF and its partners continued to focus on hygiene education, and on angawadi and school sanitation (i.e. on software, children and linking sanitation directly to children’s health). There was in this early period no focus on sanitation hardware or technology within UNICEF itself.
1 Philip Wan (1988), "Sanitation Programme in India (1982-88)" UNICEF New Delhi.

Page 2 of Annex 7
2. Initiation of GOI-UNICEF Collaboration (1985-1986)
The Government of India launched the Centrally Sponsored Rural Sanitation Programme (CRSP) in 1985 after transfer of sanitation responsibilities to the Department of Rural Development. As "coverage" and "engineering approaches" drove the national rural water supply programme, it is not surprising that they also drove the sanitation efforts managed, in many cases, by the same agencies of government. The success of the water supply programme (both in drilling and the development of the MK II handpump) made the idea of a "Model T" of sanitation very attractive to government staff and others facing the massive problems of rural and peri-urban sanitation in India. The challenge seemed to be to develop a suitable standard low-cost design of latrine which did not involve large quantities of wastewater, but which eliminated some of the least attractive aspects of pit latrines.
UNICEF was the major funder of the influential TAG Study “The Feasibility Study based on Demonstration Schemes for Sanitary Latrines in Rural India”.2 In this study, there was no emphasis on cost recovery or beneficiary contribution, or even use and maintenance of the latrines (as opposed to their construction). The committee felt that the GOI programme had already adopted an approach of providing latrines free to the beneficiaries, and the issue of use or demand did not appear to arise. Instead, the focus was on hardware construction costs and improved delivery mechanisms such as local construction by masons. The project established demonstration latrines in 3600 villages in 13 states of India. The TAG terminal report, completed in July 1986, recommended the twin pit pour flush latrine as the most cost effective design. This recommendation was accepted by the CRSP, a decision which has had major repercussions ever since.
UNICEF was thus a major funder of the development of the TPPF as the standard latrine design of the 80s, and its partnership with GOI in the CRSP meant that many were built with UNICEF funding. As noted elsewhere, UNICEF itself was well aware of many of the limitations of a purely technical fix; UNICEF stressed the need for health education to achieve health benefits, and worked on a variety of software strategies in addition to the technical construction of latrines.
What is wrong with the TPPF? The standard design, complete with brick superstructure, costs more than 2000 Rs, which is well beyond the means (or at least interest) of most of the target population of the rural poor. Under these circumstances, massive subsidy programmes became necessary, and these in turn introduce fundamental difficulties of sustainability, bureaucracy, and suppression of any real demand for sanitation. These shortcomings of the TPPF and "traditional" programmes are now widely recognised throughout the sector in India, although not always at local level.
Ironically, the biggest criticism of the TPPF (and indicative of the dangers of going to scale too quickly) stems from its very "success" as a standard design. The "dream" of a standard design accepted and approved by PHEDs and incorporated into the mainstream of engineering practice came true, thanks in part to aggressive promotion by members of TAG and other players. Once this standardisation occurred, it has become
2 Terminal Report of the Feasibility Study Based on Demonstration Schemes for Sanitary Latrines in Rural India, Technology Advisory Group (India), July 1986, World Bank.

Page 3 of Annex 7
very difficult for PHEDs to "backtrack" and accept alternative designs that are more affordable. This is an important lesson for any of the approaches piloted by UNICEF and claimed as a "success"; if one goes to scale too quickly, it is difficult to undo the damage.
UNICEF was the only international agency working in the sanitation sector and hence worked in close cooperation with the Government of India in developing the CRSP. However it could not influence the GOI policy of focusing on latrine coverage as the key issue in sanitation, even though by this time it had started several micro or pilot projects, that had adopted more holistic approaches to sanitation than just latrine construction. Thus the community, IEC, and school sanitation experiments of UNICEF in this period could not find any place in the newly launched CRSP.
3. Pilot Projects as an Advocacy Instrument (1986-1990)
In 1986, the GOI approached UNICEF for funding support and full-fledged partnership in the CRSP. UNICEF extended comprehensive support for CRSP in eight states. Within UNICEF, a substantial allocation of funds was made in the Plan of Operations for 1985-89 for rural sanitation, within the overall WES programme.3 In 1985, Project Officers (Sanitation) were recruited in each of the six Zonal offices of UNICEF. Given that the focus of the CRSP was on subsidised latrine construction, UNICEF felt the need to advocate alternative approaches in sanitation; simple support for the CRSP was understood to be insufficient to meet the challenge. As an instrument of advocacy and direct learning from the field, UNICEF launched a series of area based rural sanitation projects in 1986-87 through direct funding of concerned state governments.
As direct funding by the GOI to the CRSP expanded, UNICEF’s funding support in the subsidised latrine construction decreased in relative terms, and a mid-plan review showed a surplus of funds within UNICEF. UNICEF also carried out an evaluation of its earlier sanitation pilot projects started in West Bengal and Orissa.4 To redefine the role of UNICEF vis-a-vis GoI, a workshop was held in July 1986, where UNICEF was asked to complement GOI sanitation activities. Eight states were selected for intensive coverage comprising both hardware and software; while IEC support was extended by UNICEF more widely.5
The appointments made by UNICEF in its zonal offices for sanitation brought people into the WES section with social sciences and communications backgrounds. In 1987 training modules for sanitation were developed by UNICEF based on those developed by select NGOs implementing UNICEF sponsored area-based sanitation projects (Rama Krishna mission and Women’s Welfare Centre in West Bengal; Asha Sadan in
3 GOI-UNICEF MPO 1985-89
4 Operations Research Group "Evaluation of Rural Sanitation Programme in Orissa and West Bengal," November 1986.
5 UNICEF-GOI "Report and Recommendations: Workshop on UNICEF Support to Sanitation Activities, July 1986.

Page 4 of Annex 7
Haryana).6 A large number of district and state specific KAP studies were also sponsored by UNICEF to better understand the ground realities.7
A. Area-based projects
Hence, by the end of1986, UNICEF had gained experience and data from the field on what is involved and required in sanitation in rural India. Based partly on this and partly on the UNICEF-GOI workshop, UNICEF felt the need to initiate area-based projects in rural sanitation in different states, which could adopt different approaches to sanitation. These generally focussed on a "package" of services, and a commitment to Total Sanitation, not just of the individual, but of the household and community.
The first area based project was adopted in Alwar district of Rajasthan. By 1990, this approach was seen to have shown extremely positive results and was adopted in the state government's sanitation programme. A similar package was piloted by UNICEF in Periyar (Erode), Tamilnadu. In both sites, the programmes promoted a package of latrines, soakpits or drainage, and bathing platforms. In Alwar, the package also included garbage pits and smokeless chullas for cooking, while in Periyar, the package added biogas systems. These systems were promoted by locally organised women's groups.
During this evaluation study team members visited both sites. During these visits it became apparent that many facilities were constructed, and some of the provided facilities (e.g. latrines) were and are used, (although the smokeless chullahs were little in evidence.) The latrines on offer were the standard TPPF models, and were heavily subsidised or free. While the women's organisations may have flourished and moved on to other issues, there is little evidence at either site of any ongoing activity along the original lines of these projects. There is also no evidence or of any "takeoff" by copycat activities to promote sanitation outside the originally chosen families. UNICEF still continues water and sanitation activities in these districts, but the Total Sanitation Concept is not visible. For example, in Alwar district, a new water and sanitation program is being carried out under the "integrating" strategy of CDD-WATSAN; unfortunately, water supply improvements and sanitation improvements are provided to different groups. (This is particularly disturbing because UNICEF pioneered Total Sanitation in Alwar District over ten years ago!) The problem occurs because the household selection criteria of UNICEF's NGO partners and of the government for subsidy support are different. All partners are aware of the problem, but after ten years of apparently integrated theory, the practice lags far behind.
Similarly, in Erode, the sanitation work is now remembered very much as a government-funded construction scheme, and the Total Sanitation Concept is now replaced by the local implementation of CDD-WATSAN (see below). With hindsight, it is likely that "Total
6 UNICEF "Report and recommendations - Workshop on Training Syllabi on Promotion of Sanitation," December 1986.
7 J. S. Punjabi (1985), "Knowledge, attitudes and practices study of sanitation and hygiene in three villages of Indore district under UNICEF project," April.

Page 5 of Annex 7
Sanitation" is too complex to promote, and the shift by UNICEF to the more sharply focussed approach of CDD-WATSAN is entirely appropriate.
These and other area-based projects in different locations of India enabled UNICEF to fund, test, and advocate a variety of alternative approaches to rural sanitation. The area-based approach allowed for close monitoring and follow up, and permitted "experimentation" with NGOs as partners in sanitation. They broadened the technological choice/cost patterns available in latrine construction. They integrated sanitation as a package of services, and explored demand promotion and community participation. Some projects attempted cost recovery and a moving away from the full subsidy approach. For UNICEF, the projects were critical in developing sanitation as a mandate and work domain within the organisation. These projects were also effective advocacy tools to influence, in the first instance, the state governments where such projects were being implemented. This was possible both because of the visibility of these projects, and because the organisation structure built into each went right up to the state level, thus involving the state government system.8
There were however no major changes in the CRSP programme of the Government of India between 1986 and 1989. As the results of these pilot area-based projects emerged, and as informal dialogues between UNICEF and GOI continued, however, the exclusive GOI focus on fully subsidised latrines and coverage began to change.
4. More Experimentation, Advocacy and Change (1990-1995)
In 1990-91, some revisions in the government guidelines in the CRSP were initiated. The sanitation programme was no longer restricted only to the poor households as part of the antipoverty programme; subsidies were reduced to 80 percent from the Government and 20 percent from the beneficiary. The target set by the CRSP of 25 percent coverage of all rural households with latrines were found to be unrealistic as government data showed the coverage achievement to be only 3 percent.
These results and field observations made clear that further experimentation was required.
A. Mednipore
Although UNICEF had been working on sanitation in Mednipore district of West Bengal since the mid eighties, the Mednipore Intensive Sanitation Project was formally launched only in 1990. The project had many unique features. The main partner of UNICEF and project implementing agency was an NGO - the Rama Krishna Mission. In its origin, the project adopted a policy of no subsidy, so that self-financing of latrine construction was introduced for the first time. Consumers were offered a variety of technical options in latrine construction, with different costs to suit different abilities to pay. The project emphasised local employment generation through training of masons, and credit was organised for the poor to purchase a latrine. IEC continued to be given emphasis as a demand generation instrument. The Mednipore experience has been extensively
8 UNICEF (undated), "Sanitation: The Medinipur Story"

Page 6 of Annex 7
evaluated and documented8. As a result of these efforts over x,ooo latrines have been built in Mednipore. A very rapid field visit to Mednipore during this evaluation suggested the following:
• The most practical outcome of the "range of technical options" is the offer of sanitation options at one tenth the cost of the full-blown brick superstructure TPPF. At present, so little of the business is at the "high end" that it appears that "product range" is less important than "cost reduction".
• The issue of cost is also more important than the issue of subsidy. Most of the latrines being built during the field visit benefited from a 50% subsidy. In government circles a 50% subsidy of Rs. 280 is much easier to accept than a 50% subsidy of a Rs. 2,200 standard latrine!
• Above all, the visit suggested the success of the programme. Random spot checks confirmed not only that latrines had been built, but that they were being used and well-maintained. The generation of local employment is visible, and many people have a stake in the programme's success. The Gram Panchayat is actively involved, and the "promotion" of latrines occasionally resorts to peer and local government pressure on community members.
• Many factors are unique to the situation in West Bengal, not least the extensive network and deep roots of UNICEF's principal partner the Rama Krishna Mission. Other relevant factors are the high population density and the reduction of private places for defecation, high literacy rates, and strong community organisation.
• Later, after 1990, similar area based projects were started in Allahabad district of Uttar Pradesh to promote the concept of sanitary marts and in Mysore district of Karnataka for the “Nirmal Gram Yojna" (Clean Village Scheme) to create awareness among people to link sanitation, hygiene and health.
B. National advocacy
UNICEF had a substantial influence on the National Seminar on Rural Sanitation (in support of the Eighth Five Year Plan) in September 1992. The Seminar was a critical event that influenced the policy perspective of the sanitation ‘sector’ within the government. By 1992, some of the results of the area based sanitation projects described above were available and UNICEF was able to formulate the specific advocacy messages to be taken up with both the state and Central governments. The shifts UNICEF wanted to advocate included the following :
• from a fully subsidised programme to a partially subsidised approach.
• from sanitation being viewed as only a latrine construction programme to a ‘package approach’ including hygiene/drainage/clean water.
• from a single latrine design (twin pit pour flush latrine with superstructure) to a range of technology and cost options (as at Mednipore).
• from a fully constructed latrine to a lower cost latrine with the superstructure construction left to the beneficiary.
• from a hardware approach to focussing on IEC, mason training and other software approaches.

Page 7 of Annex 7
Before 1992, UNICEF was able to advocate some of the above shifts much more successfully at the individual state level through area-based projects than it could at the national level through the CRSP programme. Sanitation was one sector where policy change emerged from the states rather than the centre. In a majority of the other sectors the reverse had been true.
The 1992 seminar, however, consolidated the advocacy efforts of UNICEF at the national level. Many state level officials who attended the Seminar had been associated with UNICEF’s area based projects; having built up some ‘ownership’ of this work, they used the seminar to advocate many of the issues and approaches supported by UNICEF. The national seminar, combined with the launching of the Government of India’s Eighth Five Year Plan, led to a comprehensive revision of the operational guidelines of the CRSP in 1993. The fundamentally new approach reduced subsidies, included a strong IEC approach within rural sanitation and gave emphasis to community participation in the CRSP.
Between 1992 and 1994, UNICEF continued to extend financial support to the CRSP and financial and non-financial support (e.g. IEC material for training) to all the major states having sanitation programmes. Explorations with alternative delivery systems for sanitation (such as the introduction of the market driven rural sanitary marts) continued with greater NGO involvement.
C. Rural Sanitary Marts (RSM)
The RSM concept was first demonstrated in the field by a rural technical institute – the Institute of Education and Rural Technology (IERT) in Allahabad district of U.P. As noted by one of the UNICEF staff in charge of sanitation “RSM is a one stop retail outlet dealing with all materials needed for construction of various sanitary facilities. It is also expected to keep all items required for promoting sanitation as a package which includes domestic and personal hygiene. Besides stocking these materials, the RSM must serve as an advice centre for interested households on the different types of latrines and other sanitary facilities. The mart also maintains a list of trained masons to facilitate construction by households in its area of operations”.9
UNICEF's involvement with RSMs began in 1990. The idea behind the RSM was the belief that there was a "gap in the market" for low-cost sanitation; after an initial startup, the enterprise could become self-sustaining with its offer of appropriate low-cost technology and demand generation. UNICEF's role was thus one of "priming the pump" by underwriting the low capital costs to establish the RSM, and to offer some technical support in the first two years to get it going.
The RSM is an intuitively attractive idea to those who promote sanitation, as it encourages revenue generation and should thus require less subsidy. Thus, even before the U.P. demonstration project had become fully commercially viable, the RSM idea was quickly diffused and replicated. This meant there was no time to go through the full learning cycle, which would have allowed more practical and focused development. The CRSP guidelines in 1993 stated that “UNICEF has successfully
9 B. B. Samantha (1997), "Role of UNICEF in transfer of technology", Orissa.

Page 8 of Annex 7
demonstrated the validity of the concept of sanitary marts by implementing the scheme through voluntary organisations in Uttar Pradesh and other states”10. By 1995, the RSM was adopted as an integral part of any sanitation project promoted by UNICEF.
Progress was in fact slow. In 1994, there were only about 100 RSMs established, which had established 17,000 sanitary units in different states. In 1998, there are 450 RSMs established in different states by UNICEF, either as part of integrated sanitation projects or as a stand alone programme.
Field visits in Erode and Alwar to RSM sites during this evaluation suggested that the concept was not as successful in practice as many had hoped. Some RSMs in these areas had gone out of business, while those still active were either in deficit or barely breaking even. One of the more successful ones claimed its success was attributable to being slightly cheaper than the private sector, which belies the idea of a gap in the market.
D. CDD-WATSAN
UNICEF also began to apply the CDD-WATSAN strategy, with SIDA support, in one district of every state. The strategy tried to integrate the lost link between water and sanitation hardware and specific health issues – in this case diarrhoea. CDD-WATSAN is thus based on integration between water, sanitation, and diarrhoeal disease control. This is achieved through programmes that stress not just the supply of water and sanitation facilities with health education, but also the promotion of Oral Rehydration Therapy and improved diarrhoeal case management at sub-centres, Primary Health Centres, and the rest of the public health establishment. Programmes which have adopted the strategy set ambitious targets in terms of diarrhoeal disease reduction, and at the sites visited during this evaluation, substantial efforts were made to collect statistics through the public health system. This approach is especially significant for UNICEF as an example of sector convergence.
It is perhaps not surprising that the relative emphasis on the three basic components of CDD WATSAN varies from place to place. Thus in Periyar, we observed that the organisation of the CDD efforts was most impressive, while work on sanitation facilities themselves appeared at a virtual standstill. In Alwar, the hardware efforts, albeit uncoordinated as noted above, were making reasonable progress, but the CDD component was less evident within the public health system. This may reflect the interests of the nodal officer in Periyar (a medical officer), while in Alwar the most interested government bodies are in rural development.
The public health logic of CDD-WATSAN is impeccable; if one wishes to reduce diarrhoeal disease through water and sanitation, it makes sense to look at ALL the ways to reduce diarrhoeal disease and to link the efforts. The use of the data that is being carefully collected at local health centres and sub-centres, however, is not straightforward, and should be viewed with caution. In Alwar, for example, the local
10 Rajiv Gandhi National Drinking Water Mission – “Centrally Sponsored Rural Sanitation Programme – General Guidelines for Implementation” – Ministry of Rural Development, Government of India; 1993.

Page 9 of Annex 7
NGO noted with pride a "decrease" in diarrhoea as a result of the project. In fact, this could just as easily be explained by the fact that a baseline was measured in the summer (a likely time of high diarrhoeal incidence,) while the "after project" data were collected in a different season with less diarrhoea. Apart from seasonality, there are issues about how well centre data reflect the health of the population at large, and what factors may influence the reporting or non-reporting of disease. The data are invaluable for management of the control effort in terms of assessing necessary quantities, but their value as "evidence" for the benefit of the programme is suspect. If the overall data reliability is suspect, it is clear that one cannot try to use them to attribute "fractions" of reduced mortality to improved water supply, sanitation, hygiene promotion, case management at home, and medical case management. Of these, only the last is likely to be reliably measured at the centre.
5. 1995 and Beyond
Between 1995 and 1997, there was no Five Year Plan formulated by the Government of India, largely because of a short-lived political government at the central level. However an annual planning exercise and government budgetary allocations were made in the sanitation programmes. No major policy changes either in the approach or guidelines were made. UNICEF also formulated a two year Master Plan of Operations (MPO) which was agreed upon by the Government of India. All the approaches to sanitation and changes therein were incorporated in this plan of operation.
In April 1997, another major National Workshop on “Women, Children and Sanitation” was organised jointly by the Department of Women and Child Development, in the Ministry of Human Resource Development), in collaboration with UNICEF and Sulabh International Social Service Organisation (an NGO famous for construction of urban public latrine systems). UNICEF for the first time talked of the ‘Rights Perspective’ in sanitation as a part of its major shift from programming to a right’s perspective for women and children.
In 1998, the MPO for UNICEF was formulated and agreed upon by UNICEF and Government of India for the period 1999-2002. In the Chapter now titled “Child's Environment : Sanitation, Hygiene and Water Supply”13 (Chapter 5). The document highlights the problem areas in sanitation such as the inadequacy in coverage and efficacy of bringing about behavioural changes in sanitation, the need to offer a range of technology – cost options for quick diffusion; the need to refocus on the urban environment. The main focus of the programmes visualised by UNICEF include:
• a continued thrust on experimenting with approaches that could lead to quicker diffusion and replication of new models, technologies, IEC materials developed for sanitation;
• strengthening of alternative delivery systems;
• focussing on educational institutions for behavioural change; and
• a more integrated approach to health.

Page 10 of Annex 7
6. Conclusions • Many believe that the key to solution of the sanitation crisis lies in the exploration of
low cost, fast diffusing alternatives on the supply side and sustainable, self financed, promotional techniques and institutions on the demand side. UNICEF, while being an important contributor to possible solutions in sanitation, is only one of the actors (especially through their area focused projects) and advocates, the others being selected NGOs, and enlightened officials within the government system at different levels.
• Sanitation is filled with "success stories" that work well in one place and not another, so caution about the feasibility of "going to scale" outside West Bengal with the Mednipore approach is in order. The common sense features of simplifying the technology to bring the cost down, and working hard on demand generation through aggressive marketing are likely to be ingredients of many or most successful sanitation programmes. Whether or not the approach will work as well in other states remains to be seen.
• True experiments in sanitation should not always succeed; promising avenues may turn out to be dead ends, but the only way we can know is by trying them. Like the TPPF, it is not surprising or shameful that the Total Sanitation Concept did not emerge as a "magic bullet" for sustainable hardware dissemination. An important lesson must be drawn however, by both UNICEF and the GOI about how easily pilot experimentation can be promoted as "successful" in an effort to meet the requirements of going to scale.
• The RSM, like the TPPF and the Total Sanitation Concept, reflects the risks of valid experimentation in a climate that demands "success stories" and "going to scale." It is entirely appropriate and commendable that UNICEF explored the RSM as a concept, and the lack of universal success certainly does not mean that market forces cannot be captured in the aid of sanitation. RSMs do, however, demonstrate the need for rigorous external examination of such experimentation, after the passage of a decent interval of time. Such evaluations would allow UNICEF and partners to learn real lessons and avoid the waste of scarce resources and human energy before "going to scale" within UNICEF and later, with the Government of India.

Page 1 of Annex 8
Annex 8: An Approach Towards Integrated Management of Water Supply
1. Definition
Integrated management of water supply (IMWS) means integration of all aspects (technical, financial, institutional, social, environmental and managerial) into the planning, the operation and the upkeep of water supply systems.
2. Background
Presently demand based approaches are the catch phrase of the day when community empowerment for the management of O&M is considered. Normally these strategies are based on development projects were new infrastructures are constructed. The approaches start from the outset for the construction of new systems, communities are motivated to participate and in return receive an improved service. The challenge in India is the changing over of the O&M strategy at a point when the coverage is near 100%. Demand and choice of technology can not play a major role if the infrastructure is already built and working. The task on hand is to set up institutional structures that allow the communities to take the full responsibility for maintaining their Water supply structures. In order to achieve this the communities need to comprehend the importance of keeping the water systems in working conditions, because of health reasons, and because they are part of their lives. To create this awareness it will be essential to clearly define all roles, responsibilities and tasks on all institutional levels.
Many aspects can be learned from the existing community based maintenance projects and the demand responsive projects (like Swajal) that have been executed in India. It is important not to impose one institutional model. The starting point could be a participatory assessment, with all concerned of what the situation is now, technically, financially, socially, environmentally and managerially and then look at what is needed and what institutional model is locally most appropriate (not one standard model for every community, but mix of best fitting options for O&M, Management and Financing, determined by informed user choice). This complies with a demand-based approach and would go beyond technology and financing also into institutional aspects.
Because it will be difficult to introduce any change without offering some kind of improvement of the services, rehabilitation of water points could be a good entry point. However since in India most villages have one or more handpumps/PWS’s it is not feasible to carry out a full-fledged rehabilitation programme. In a participatory negotiating process, the rehabilitation of the complete water supply system should be determined, agreeing what PHED/Gvt will do and what the community’s part and contribution will be. The process is Participatory Learning resulting in (community) Action (PLA). The starting point should be the Gram Panchayats, if Village Water Committees are already in existence and/or the communities prefer to work through them their functioning should be reviewed. The incorporation into the Gram Panchayats, the functions and authorities need to be defined.

Page 2 of Annex 8
A significant future involvement of UNICEF in the sector would be to address community-based water supply in its entire institutional and environmental context. This means:
Delegation of decision making power for integrated management of water supply systems (including O&M) to the lowest possible level.
Definition of roles of communities (Gram Panchayats) and the interfaces between them and their supporting agencies including the private sector. Integrated management of water supply systems includes the full range technologies (traditional sources, handpumps, PWS, etc.). Gram Panchayats and their sub committees will be in an implementing capacity. The government agencies have backstopping task for which they are accountable to the communities. The process of determining the tasks and functions of all partners should include the following steps:
• Participatory assessment of the holistic situation with all stakeholders.
• Joint action planning whereby decisions, on all aspects (rehabilitation, O&M, management, financing, hygienic conditions, monitoring and evaluation of progress and results) are made by the communities in a gender and poverty conscious manner. The non-community agencies are advisors who need to be specifically trained for their advisory tasks.
• Action planning includes definition of division of responsibilities and authorities of the Gram Panchayats and the interfaces.
• It will be useful to have an independent external monitoring as well (third party monitoring).
Comprehensive pilot projects should be carried out to establish the basis for the transition of the responsibility for the integrated management of water supply systems from the PHED’s/Rural Dev. Dept’s. to the Gram Panchayats. They need to include strategies that allow a smooth changeover during which all partners can build up the capacity to fulfil their new roles and at the same time find ways of how to effectively reduce those capacities that are not any more needed. It will be of utmost importance to safeguard the achievements of the last 30 years, i.e. any transition need to be planned in such a way that the old support structures are still in place and functioning while new capacities are built up. They can only be decreased/abolished once the new structures have firmly taken ground. This has to include the outlining of a clear policy, in operational terms, to define community participation and gender in this process.
3. Redirection of Government Departments/Structures
Presently the government is fully responsible for O&M. The total expenditure for maintaining rural water systems is INR 6 billion per year. The establishment costs within the government departments make up the biggest part of these costs. About 50% of the outlay are salaries. A decentralised management system for the IMWS would need to aim at a lowering of the costs within these departments. A significant cost reduction can only be achieved if the number of personnel employed for O&M by the PHED’s and Department for Rural Development can be reduced. Government regulations do not
Comment: Rather community management of integrated water and sanitation conditions, services and practices; O&M is too limited a concept

Page 3 of Annex 8
allow laying off staff easily. It is therefore essential to closely look at the institutional set-up within these departments. It might be possible to utilise many of these officials in other useful employment. Full transparency is needed to avoid insecurities among the government staff; otherwise, government staff sees decentralised IMWS as a threat. If resistance is created among the staff and it tries to prove that a new approach can not work the whole concept is seriously endangered. The established repair system of the three-tier concept can not be redirected very quickly. Any change will have a long transition period therefore, it is important to ensure the co-operation of the staff involved also during the changeover period.
The institutional change in the government departments will be the great challenge in this process. The first step to introduce decentralised IMWS would be to study the present government structures, and to negotiate with the state governments’ possible solutions of how the present staff can be reduced. The institutional review should be carried out if possible from within. The affected sections themselves should review their position and what other possibilities exist. Such a review should be guided by a specialist. UNICEF’s role in this process could be to make its advocacy influence bear and to build an alliance with other organisations (World Bank, etc.) which have a greater capability for supporting institutional reforms. UNICEF could also ensure that the mediator accepts the importance of social aspects and does not act as a financially driven management consultant.
It will be important to ensure that the higher and the lower level staff will buy into the reform. It can not be based on demand but the process should however make clear the rationale and the inevitable need to decentralise the O&M functions. I will have to point out the opportunities that lay within such a reform in order that government officials have time to adapt to the new situation and support the change.
Since the institutional change has to be responsive to the participatory assessment of the review by all stakeholders and the demands that the communities place on the government agencies it will be essential to formulate the project jointly by the stakeholder representatives. The process of formulation in operational terms the requirement needs to be incorporated into the preparation of the project.
The final target of decentralised IMWS should be to reduce the overall government budget allocation for O&M to about 30% of the present level. It should essentially aim at real savings i.e. the excess staff should only be given new tasks if they are meeting a real demand. It does not make sense to replace one obsolete job with an unnecessary job.
At the same time care has to be taken that not money is taken out of the right pocket and put into the left pocket. That means if the overall allocation for O&M is shifted from one GOI department to another without substantial overall cost reduction, at least the quality of the service has to improve considerably.
4. Use of Panchayati Raj System
The Indian legislation offers a very good basis for the decentralisation of planning, implementation and O&M of water supply systems. This situation should be utilised to the best possible extent.
Comment:

Page 4 of Annex 8
First of all, it needs recognition that ownership (legal ownership) is an essential precondition to any responsible management. Empowerment means to be able to take decisions. Accountability for decisions how to maintain a water system can only be assumed by the owner.
The government can not just give away infrastructures that were built with its money, especially not to private persons or bodies that have no legal standing. Therefore, it will be essential to find ways of handing over ownership. (There might be fine differences possible in India between legal ownership and factual ownership, i.e. the king owns the land but hands it over to those who live on it with full power to do with it what ever they like). In any case, the power to do “what ever they like” with the water system has to go to the person/body that is responsible for it.
As a rule, management should be delegated to lowest possible level. In rural water supply, the Gram Panchayats offer themselves as the lowest possible level. They also offer the necessary legal status for taking over ownership. Gram Panchayats are elected bodies and therefore represent the communities. Many projects that were executed to relief the government from the burden of O&M tried to utilise NGO’s or independent Village water committees. It should be left to the Gram Panchayats to decide the execution of IMWS is delegated. Major options are:
• Direct Management by Panchayat
• Management by elected sub committee (VWC) accountable to Panchayat (PR Act allows this) with various sub-options in how this is done
• Management by a small private enterprise accountable to PR
• Management on a neighbourhood basis, with Panchayats overseeing whole
• Management by a charismatic leader or an NGO
However, care has to be taken not to create new parastatal structures, which depend on support from outside.
5. Private Sector
Rural India manages to maintain millions of irrigation boreholes at all levels of technologies (from treadle pumps to diesel operated pumps). The maintenance requirements for these wells are much higher since the crop needs to be irrigated at a given time. Most of the maintenance requirements are met by the private sector. To give this already established capacity a reasonable and responsible share in the O&M work for drinking water will be a challenge of these pilot projects. It is easily conceivable that virtually all the physical execution of the repair work and the supply of spare parts can be taken over by private contractors/suppliers.
The facilitating and regulating roles would need to be retained by government agencies. None of the villages lives alone on this world, there is needs for co-ordination, planning, monitoring and direction. The government institutions at central, state, district, block level all will have assume these assignments. These roles: the authorities, the

Page 5 of Annex 8
responsibilities and the means how these tasks can be performed need to be defined. Especially if all communities plan, develop and manage their own systems not only for domestic water supply but also for irrigation and catchment the water resources situation could suffers. It is essential that someone looks at the wider consequences and gives guidelines for the micro-catchment management issue.
Taking these preconditions into account, any IMWS project would need to include the following activities:
Activity Responsibility: Who does the work?
Responsibility: Who manages the work?
Who contracts and pays when work is done?
Activities to set up the decentralised Maintenance system
Definition of IMWS concept State/district authorities, communities and Pilot Project
State/district authorities
Pilot Project
Definition of roles and responsibilities
State/district authorities, communities and Pilot Project
State/district authorities
Support to PHED’s Implementing new Roles, retraining Staff
State/district authorities and Pilot Project including supporting management consultant
State/district authorities
Support to Gram Panchayats State/district authorities and Pilot Project
Pilot Project Pilot Project
Training of mechanics PHED’s
Pilot Project
Pilot Project Pilot Project
Water tax legislation District Panchayat District Panchayat

Page 6 of Annex 8
Sustained activities
Day to day repairs of handpumps
Private mechanics, Village Water Committee
Gram Panchayat, Village Water Committee
Gram Panchayat, Village Water Committee
Day to day running and repairs of PWS
Operator/Private mechanics
Gram Panchayat, Village Water Committee
Gram Panchayat, Village Water Committee
Major repairs of handpumps Private mechanics Gram Panchayat, Village Water Committee
Gram Panchayat
Major repairs of PWS PHED District level or private sector
Gram Panchayat Gram Panchayat
Borehole maintenance, redevelopment
PHED District level or private sector
Gram Panchayat Gram Panchayat and PHED
Spare Parts Supplied by private sector
Market and state level regulation (licensed supplier)
Gram Panchayat
Water tax collection Gram Panchayat District Panchayat Village community
Site Hygiene, Community, Gram Panchayat
Community, Gram Panchayat
Village community
Planning of Expansion/Rehabilitation
Community, Gram Panchayat
Community, Gram Panchayat
PHED
Planning, Regulation, Co-ordination, Supervision, Resource management
PHED District level PHED State/District level
PHED
Monitoring Block level PHED District level PHED
State/Central Government contribution to O&M
Allocation to Gram Panchayats & to PHED

Page 1 of Annex 9
Annex 9: Information, Education and Communication
In UNICEF’s water and sanitation programme, both health information and the promotion of improved hygiene behaviour play a prominent role. In particular the educational material production and diffusion is very visible, though it is difficult to determine its share of the budget is. The available information and communication material presently includes some 200 booklets, pamphlets, posters, videos, manuals and other information, communication and education materials (Table 1). These are produced and disseminated in large quantities. One quarter is written and three quarters are visual or audio-visual in nature. Most of it is meant for use at the community level.
Table 1: Types and languages of UNICEF IEC materials
Type of material Language
English Hindi Both Other * TOTAL
Booklets 18 14 7 6 45
Pamphlets, leaflets 1 7 - - 8
Posters, banners 3 18 3 41 65
Flipcharts, flashcards 2 4 2 1 9
Video films 15 17 13 5 50
Slides series - - - - 32 **
Video/audio spots - 49 - 12 61
Guidebooks, manuals 15 1 2 2 20
Other (calendar, stickers, badges) 1 1 2 - 4
TOTAL 55 111 29 99 294
Selected materials have been published also in Bengali, Gujarati, Kannada, Malayalam, Marathi, Mewari, Tamil and Telugu.
** Can be used with any language
Based on: List of communication materials on water and environmental sanitation. WESS library. No date.

Page 2 of Annex 9
Table 9.2: Number of IEC materials by subject field, type and intended users
Note: Some materials have multiple audiences, e.g. for donors and programme staff, or for programme staff and villagers
Subject field
Subject Donors Government Department & NGOs
Com. Members TOTAL
Printed Other Printed Other Printed Other
General WATSAN
Status & development in India
1 1 2
Diarrhoea and worms
1 3 4Disease Control
Guinea worm eradication
3 11 2 16
Sanitation and hygiene practices
4 48 52
School sanitation
2 3 5
Rural Sanitary Mart
1 1 2
Sanitation technologies
1 12 11 24
Sanitation in general
1 1
Case reports 6 6
Rural Sanitation
Concepts and options
1 7 1 9
Rural Water Supply
Handpumps in general
1 1 1 1 9 13
Technical aspects
8 15 1 13 37

Page 3 of Annex 9
Subject field
Subject Donors Government Department & NGOs
Com. Members TOTAL
Printed Other Printed Other Printed Other
Women’s participation (O&M, rainwater harvesting
2 2 6 10
Case reports 1 4
Water resources management
1 1 2
Urban WES
Water use and hygiene, water conservation
4 4
Latrine masons
2 2
Rural Sanitary Marts
1 1
Environmental. Sanitation (modules)
4 4
IEC methods and techniques
4 4
Training
Participatory tools & techniques
3 3
TOTAL 6 14 61 30 95 206*
*Totals of Tables 1and 2 differ because in Table 1 each item was counted separately; in Table 2, sets were classified by subject.
In terms of language, 18% is in English, 48% in Hindi or bilingual and 34% is also available in a local language. The complaint by a few respondents and interviewees that the programme has too many documents in English is not corroborated by the above data. It should, however, be noted that the table presents a bias towards the local languages because all materials were given equal weight in the analysis. In other words, a two-page pamphlet or song in a local language and a forty-page booklet in Hindi got

Page 4 of Annex 9
the same score. The more extensive material is generally in Hindi and English. Guidebooks and training manuals are predominantly published in English and are therefore only usable by English-speaking staff. But many of the videos are training videos, and these are either bilingual (16) or in Hindi (12). Some 11 videos are in English. Most of the latter are meant for training higher level functionaries in the Government, the NGOs and the commercial sector (contractors), although a few also have community hand pump mechanics and masons as the intended trainees.
The tables do not include the materials that the field offices produce together with their partners at the state and district level. The impression is that local design and production have increased, along with adaptation to local conditions. In the states visited by the team, UNICEF has organised workshops with the Dept. of Health and local resource persons to prepare educational material for various target groups (school children, local leaders and women’s groups). This material is along the same lines as the general UNICEF hygiene material.
Local production may increase local adaptation but it does not necessarily enhance local effectiveness. Where more parties participate, all naturally want to make an impact. This then leads to compromises and the inclusion of messages that are perhaps local but not therefore more relevant to health. An example is the ‘tongues cleaning’ message that got included as a result of a district level workshop for the CDD/WATSAN programme.
While local participation in design has increased, local participation in cost sharing has not. After many years UNICEF still finances one hundred per cent of the educational material costs. A gradual increase in the cost sharing for educational materials will encourage districts and states to plan and budget for them. UNICEF can then shift its support to the pre-testing of the materials and message, and to evaluating programmes that use these materials on their cost-effectiveness. These are more urgent priorities that make better use of UNICEF’s comparative advantage and resources, now that local production capacity is established. At present, pre-testing is done in only some cases, yet authorities in the field view this as an essential pre-requisite for effective material development.
The evaluation team could not assess to what extent the training documents and videos have been effectively used in the field. The team did however make efforts to assess whether the promotion materials were available at community level. The emerging picture was rather variable. In Erode, Tamil Nadu and in the former SWACH area in Rajasthan, health workers and village animators generally had some materials on water and environmental sanitation. Often these had been supplied years ago, and though showing signs of use, they were treasured and cared for. Also posters, wall paintings and wall slogans on health/hygiene were well present, both from the old guinea worm eradication program and from the fluoride removal pilot project. The visited diarrhoea control and nutrition centres in Erode, Tamil Nadu had posters and brochures, while in Alwar, the material was hardly visible at the level of primary health centres and subcentres. Angawadis (nursery schools) in Erode and Tamil Nadu had none and would benefit greatly from access to materials of the learning-by-playing type.

Page 5 of Annex 9
UNICEF itself has done a tracer study in 1990 to find out to what degree the supplied materials and equipment could be traced in the concerned institutions and projects1. As there was no baseline on the nature and spread of supplies, and no attempt was made to assess presence and use of educational materials in a typical project area, this study does not provide additional insight.
The greatest focus in the materials is on health and hygiene (52 materials, a quarter of the total). Water and sanitation technologies come next, with 18% and 12% respectively. Community participation and the use of participatory tools and techniques are under-represented, with the exception of handpump maintenance by women mechanics.
Gender is a cross-cutting issue and it was not possible to go through all the materials to see to what extent gender issues are incorporated. Reflection of gender issues in materials can include such approaches as adjusting health or technical information to the different interests and conditions of women and men, or the promotion of the more equitable sharing of work, training, functions and decision-making between women and men. In the reviewed materials on health and hygiene, men’s roles were mainly absent or confirmed existing gender stereotypes. The emphasis was on women’s work in health and hygiene. One of the flipcharts on better practices for example had only one picture in which men were present and active Other materials depict boys and men not as actors, but being served by women and girls. Women, especially among the poor, are already heavily burdened by their work at home and in the fields. Culturally they are often limited in the degree to which they can change male hygiene behaviours. It would therefore help them considerably when education materials and programmes also addressed men on their roles in personal and community hygiene and helped women and men analyse and appreciate gender relations.
Relatively few materials focus on health knowledge; the emphasis is on improving practices. This is in line with the development in India’s rural areas where knowledge of health and hygiene has spread effectively in the last decade. Field studies on knowledge and practices by UNICEF and the RGNDWM show that rural householders increasingly give the expected answers when surveyors ask standard knowledge questions on water and environmental sanitation. For example, in the national survey in 1988/89 the main criterion given for potable water was its looking clear (93%). Ten years later this had changed to being safe (81%) and free from germs (20%) and almost 50% of the respondents state that diarrhoea is water related2.
It can be assumed that the knowledge scores will be even better when people are not asked to answer standard questions with a strong bias to formal health knowledge. When such questions are replaced by in-depth focus discussions the people can
1 Tracer study of UNICEF inputs in WATSAN sector : interim report (1990)
2 N. Mukherjee. 1990. People, water and sanitation: what they know, believe and do in rural India. New Delhi, National Drinking Water Mission and UNICEF. Indian Institute of Mass Communication. Water and Sanitation, A Baseline Survey. A consolidated report on behalf of Rajiv Gandhi National Drinking Water Mission, New Delhi, January 1998.

Page 6 of Annex 9
express their knowledge in local terms and in relation to local conditions. Experience with this approach usually shows that local knowledge is better than indicated by standard KAP studies with their bias toward book learning.
In the light of the above developments it is quite logical that the health material focuses less on improving knowledge and more on improving behaviour. It remains to be ascertained if the materials and methods used do indeed contribute to such behaviour change.
The material and promoters used in UNICEF programmes give many messages. They fall into seven broad areas of sanitation and hygiene:
• safe disposal of human excreta
• adequate personal hygiene
• safe handling of drinking water
• safe disposal of waste water
• safe disposal of solid waste
• good home sanitation and food hygiene
• a clean public environment
These domains undoubtedly all have relevance for the reduction of water and sanitation related diseases. The problem is that the categories are so broad and general that each state or district programme can pick its own emphasis and include its own idiosyncrasies. It then becomes very difficult to compare results and effects against costs.
Nor do all domains carry the same impact on health, as measured by epidemiologists. Of all water and sanitation related diseases, diarrhoea still has the highest morbidity and mortality, especially for children. The safe disposal of human excreta, (including the safe handling and disposal of stools of babies and young children,) and appropriate handwashing of hands has more impact on diarrhoeas than the improved disposal of wastewater and solid wastes. Given UNICEF’s special mandate to focus on children, a priority focus on these risk factors and their measurable reduction would be more cost-efficient and effective than trying to improve too many unsanitary conditions and practices at the same time. Such a focus may require some modification through informed discussion during local planning or programme preparation, where it is clear that the overall objectives may best be met through meeting other priorities of the parents and other village women and men. But where such other demands are not clearly present, the promotion of “total sanitation” from smokeless chulahs to tongue-cleaning by way of hand-washing and excreta disposal can confuse the health priorities for both adults and children.

Page 7 of Annex 9
Box 1: Locally developed wall slogans in villages in Dungapur
• Clean water and clean air will prevent 100 diseases
• We shall go house to house and we shall get rid of guinea worms
• Inform about guinea worm patients before rupture of the blister and get Rs. 500
• Use iodised salt and prevent mental retardation
• It is your responsibility to keep mothers and children healthy
• Use waste water in your kitchen garden
UNICEF and departmental staff are largely responsible for the choice of themes and the formulation of messages and not community members themselves. As a result messages are imposed from above rather than based on community choices, although there are exceptions. (e.g. local villagers worked as paid temporary project workers to develop the wall slogans on guinea worm, sanitation and hygiene in the Dungapur villages of Rajasthan). Messages are also the same for all population groups. In practice, the habits and living conditions, and the possibilities to influence and improve these conditions and practices, are not the same for all. Important differences exist between groups with different socio-cultural (religious, ethnic, gender) and economic conditions. These are sensitive issues and the tendency has been to avoid the tailoring of message contents to the respective user groups.
Mass media geared to inculcating health practices do not change health practices; motivators do. Mass campaigns, involving mass media and village contact drives and camps, are therefore backed up by person-to-person contacts. Water and sanitation projects engage, train and equip local motivators to visit families and promote the adoption of improved sanitation and hygiene. Research in the 1970s has shown this combination to be quite effective.
At the same time personal visits are very labour intensive and results can be slow. Some evaluation reports indicate that 3-4 visits are required for every adopted latrine. Slow results are especially common where local conditions do not foster a demand for improvements for reasons unrelated to health, e.g. privacy and status.
There are other disadvantages besides slow results. Most promoters are only taken on as temporary staff and are laid off at the end of the project. The government fears that otherwise they will in time become permanent members of the government payroll. This has been a problem in the past, e.g., with village handpump mechanics, who became permanent staff without a reduction of the district level staff whose work they took over, as described in Section 4.3. While such concerns are understandable from an administrative point of view, valuable resources and training investments are lost.

Page 8 of Annex 9
Moreover, the approach fails to build up capacities in the communities to assess and manage their own environmental sanitation and hygiene conditions.
The combination of mass media for awareness raising and personal contacts for behaviour change is known to be effective. UNICEF has used this strategy for many years and has not planned for any changes. Yet re-examination would be useful since two more recent developments show promise of equal or better results at a lower cost. The two promising approaches are public health communications (also referred to as social marketing), and community management of hygiene and sanitation improvements. In Box 9.2, the main characteristics of public health communications projects are listed. These projects are usually large scale interventions designed, implemented and monitored by an external project organisation.
Box 2 : Public Health Communications (social marketing)
• Public health communications focus on a few key risks (in an epidemiological sense and in the perspective of the users) that can be measurably reduced
• The users are segmented by class, age, gender, etc. and their perceptions, channels and means for change are investigated before developing the package, promotion strategy and messages
• The programme promotes the new facility or behaviour according to what motivates and is feasible for the various user groups. This may mean that health is even not mentioned to ‘sell’ a product if for certain groups other factors are more influential
• Different channels and places may be used to reach different groups
• The cost of the improvement, financially but also in labour, materials, opportunity cost, time is carefully assessed and different options given to match the differences in available resources
• Promotion also covers proper use and upkeep and their monitoring
• The results of the programme against the objectives are measured regularly and initial outcomes may lead to adjustments

Page 1 of Annex 10
Annex 10: Case Studies in Community Mobilisation
Case 1: Guinea Worm Eradication: A Mission Accomplished with Lasting Effects?
A dunga is a small hill characteristic for the landscape in Dungapur, Rajasthan. Dungapur and its three neighbouring districts once contained 47% of the Indian villages where people suffered from guinea worms. When a guinea worm patient stands in water the larvae of the worm creep out and seek a host in the form of a cyclops, a minute shellfish floating in the water. Whoever collects and drinks the water and ingests the cyclops develops a new worm and becomes a new patient. The whole cycle from ingestion to release of the larvae takes eleven months.
Until 1986, guinea worm patients could only wait till the worm broke the skin and could be extracted and during that period he or she infected many others. The suffering caused by these worms was hard to bear, testified two former patients. One of them had 12 and the other 22 worms removed by the project’s Ayurvedic paramedics. Most worms would erupt on the legs but some would even erupt from the patient’ s mouth or genitals. Till this happened there was no other solution than sit and wait and apply certain herbs to the affected areas. Walking and sleeping were very difficult and the eruptions brought festering wounds that were slow to heal. Towards the end, when suffering would become too great to work, a patient would have easily lost more than one month of wage labour.
The Guinea Worm Eradication project better known as SWACH has put an end to this suffering. SWACH stands for Sanitation, Water and Community Health and also resembles the Hindi word for ‘clean’. In 1984, when SWACH began, there were 6776 villages with 15,210 confirmed guinea worm cases in Rajasthan, almost 40% of the 39,792 confirmed cases in India as a whole. In 1994, no more cases were reported in the four districts despite a reward of Rs. 1000 (about US$ 20) for reporting a suspected case should this case be confirmed. And as from 1997 no new cases have been reported in the whole of Rajasthan and other states in India.
Sida, the Swedish bilateral development agency, UNICEF and the Government of India financed SWACH as a special project. Originally it was not a guinea worm eradication project, but a broader development project. Its objectives were to improve the socio-economic conditions and quality of life, reduce the incidence not only of guinea worm but also of other water related diseases, especially among children, promote community involvement and self-reliance in planning, implementing and maintaining improved drinking water supply and encourage and sustain better health practices. The strategies to achieve these objectives were: participatory water supply projects; health education and promotion of behaviour change through village contact drives and existing village health workers; and medication and Ayurvedic surgical care to extract guinea worms before they reached the infectious stage.
To cut through the bureaucracy SWACH was set up outside the government and outside the existing NGO system. It had its own organisation and director, and government staff

Page 2 of Annex 10
on delegation. A specially recruited temporary cadre of 306 female health promoters with 45 female supervisors promoted safe water use and better hygiene and 940 male guinea worm scouts with 90 co-ordinators traced new patients. The project organised many village contact drives, as well as awareness camps for women, who were given funnel filters to filter all drinking water. Together with the Public Health Engineering Department and between 1986 and 1995 the project converted 9495 stepwells that contributed to the spread of the disease and installed 8660 new handpump wells, thereby achieving construction targets of 117% and 94%. In the high days of the project, between 1987 and 1992, each year saw some 1000 stepwells converted to draw wells and the same number of new tubewells drilled and equipped with handpumps. Some 50 new handpump mechanics were trained for 6 months and 70 of the 140 existing mechanics were given one-month refresher training. Moreover, in 1988 and 1989, a total of 48 women mechanics were trained in a 3-months special course. Other outputs of the project were 14,121 washing platforms and cattle troughs, 16,005 handpump drains, over 7000 household latrines and 1565 school latrines and a similar number of urinals.
The Centre for Development Studies of the University of Wales evaluated the project at the beginning of 1994. The reported investment cost was US $ 5,8 million for the period from 1986 to 1992. The external donors paid 80% of this amount. Annual expenditure has been around US$ 1,5 m, of which 75% has gone to construction and 10% to staff costs and administration. The team concluded that the eradication objective was close to being achieved, but the focus shifted to the narrower goal of guinea worm eradication and the broader objectives need a different approach if they are to be achieved. Design and construction have been non-participatory, although the technical quality of well construction has improved. In the area a well-user ratio of 1:200 has been achieved, against 1:1567 for other villages. Maintenance has shifted to the Panchayats but very few have actually taken up local maintenance and management of water supply. The project gave them some orientation but no management training. School latrines are locked up and reportedly not used. The focus on women in hygiene education has been effective but leaves the roles of men unaddressed. The project relied on temporarily hired and trained staff and a separate project structure with at the peaktime 120 staff in the main office alone.
The approach of SWACH has made for little bureaucracy and fast and good results as far as the narrow objective (Guinea worm eradication) is concerned. In hindsight, disadvantages have been a higher cost, little co-operation with established NGOs and government services, massive lay-off of trained staff at the end of the project period, a period of 1,5 year to re-absorb deputed staff and vehicles into the government and little or no linkage with or effect on longer term developmental goals and strategies. An evaluation of the first batch of 24 women mechanics by the Stockholm School of Economics found that training female mechanics cost three times more than men per pump maintained (the women worked in teams of three and on fewer pumps), but the costs of repairing pumps maintained by women were 1/4th of the pumps maintained by men, and their down time periods shorter. When the researchers calculated the monetary value of the work done by the women mechanics, they arrived at an opportunity cost of over six times the cost of other work, mainly because the women were spending much –unpaid- time on preventive tasks. Most Panchayats did not pay the women for this work and the project paid women less than men. It had decided without testing that women mechanics cannot move alone irrespective of the scope and nature of the area (‘home ground’ or not) and their family conditions (some women have

Page 3 of Annex 10
more freedom to move than others, either out of financial necessity or less restrictive family circumstances).
To try and see what impacts the project has left behind five years after its completion, one of the team members spent three days in the project area. With a colleague who worked in the area but was unrelated to SWACH and a driver who spoke the local dialect visits the small team paid a visit to ten villages and met with present and former community workers, ex-patients, women’s groups, one woman handpump mechanic, teachers and female and male householders.
The visits indicated that besides the eradication of guinea worm many aspects have been sustained or are replicated and built upon. SWACH is now an NGO and works in the area on community health, integrated rural development with watershed development, agricultural extension and marketing, vocational training, a tuberculosis control project and a domestic defluoridation project – the latter with UNICEF. It was learned that the water supply situation has much improved. All villages passed had two or three handpumps; of the 76 handpumps passed, 73 were working and in use at that time or had just been used (platform wet), while 3 were not working. The climate in the area is warm and handpumps are being used intensively - 44 of the 76 pumps were in use irrespective of the hour of the day. Pump locations were seen to be in public places and well spread. This was also confirmed in informal discussions and gatherings in the ten villages visited. In the meetings both men and women took part, usually sitting side to side in two groups. The women were quite vocal in these informal gatherings, perhaps due to the informal character of the gatherings, without formal leadership, the visitors being women, the use of the local language and the encouragement of getting the women’s and the men’s views in turn. These were complemented by contacts with women alone, as despite encouragement not all women can always speak freely in mixed meetings. All villages still have hygiene messages on the wall, not only on guinea worms (including the announcement of the reward for case reporting) but also on other health problems. The messages they give are generally known. Even though guinea worms have vanished many women still have and use their water filters.
A part of the female health workers have continued to work with SWACH, which has become a local NGO, or other NGOs, on family welfare, immunisation, iron deficiency, tuberculosis control and general hygiene promotion. For the later they still rely on their original materials. In Udaipur alone, thirty women who were promoters, or leaders or members of women groups established under the programme have been elected in political functions: village or wardhead (Sarpanch, Wardpanch) and councillors of the local and district councils. A substantial but unspecified number of pre-school teachers, who are all women, also got elected in such functions.
The success of the guinea worm eradication and the presence of an educated cadre have made the area interesting for other projects and agencies such as CARE and DWDA, a women’s development agency which have taken up new projects, some in cooperation with UNICEF.
Meanwhile the Government of Rajasthan replicates the guinea worm eradication strategy in the Regional Integrated Guineaworm Eradication Programme (RIDEP) in four other primary and four secondary districts. In1996 UNICEF contributed $ 200,000 to this programme, or 25% of the total costs, mainly for filters and educational materials. In 1992 there were 792 cases in 191 villages, 1994 saw 135 cases in 57 villages; in 1996 9

Page 4 of Annex 10
cases were left and 1997 was the first year without a confirmed case. Since then no cases have been reported. Surveillance continues for three years after the last reported case to meet WHO criteria of being free from the disease.
Of the women mechanics in Dungapur, 23 are still working. Women mechanics have been taken into this system on the same conditions as and when vacancies occurred. An attempt was made at decentralisation, which the mechanics resented as they wished to remain in government service. After having gone to court all have been taken back on the government pay roll, though payments are made through the Panchayats. Durga Parmar is one of seven female mechanics working in the Punali area. She was trained in 1992 and is since 1996 permanently employed by the Panchayat Samithi. On her own she looks after 30 handpumps. Every day she travels by bus to her duty station where she and one female and two male colleagues can be called out to visit pumps in 4 Panchayats. Her job means a double workload but has earned her much respect. Her husband is a farmer but with the additional income he could buy a sewing machine and now also has a small tailor shop.
There are also aspects where the project has failed to make much progress. Community participation/management of rural water supply did not take off although it was a major objective of the project. Installation is done by the PHED. Whether users can take part in well siting depends on the interest, attitudes and behaviour of the individual staff. Mostly the elected members (local politicians) seem to make the decisions with the water department. Neither have to consult common women and men and the latter have no ensured say in decisions, even not on the location of the facilities meant for their use. For siting the department has set as one of the rules that handpumps must be well spread and this appears to be generally practised and result in quite good access in most, but not all cases. Use of simple tools, such as social maps and transect walks with marking of potentially suitable sites and authorisation of proposed sites in an assembly with a male and female quorum would not be very difficult to introduce, however. For maintenance a double system now exists: by the area mechanics paid by the Government on a monthly basis and by the PHED which carries out an annual handpump repair campaign during the three driest months of the year. The result was mentioned to be much the same as under the earlier single system: 20% of the handpumps are said to be in need of repair during the annual campaign. There is no data on frequency and duration of downtime over the year and Panchayats and departments are not accountable for their performance in keeping the service up to an agreed standard. The project gave the Panchayats some orientation to manage water supply but no management training. This is still the case..
In the training of UNICEF and departmental staff in water supply some attention is given to user participation including recently to gender, but this is limited to general orientation. There are no tested procedures, no hands-on training in the use of participatory techniques and tools and no follow up of fieldwork by UNICEF’s social specialist, as she is fully occupied with her work in child rights. Sanitation as a gift has not worked. Demonstration latrines have not stimulated others to build latrines and both household and school latrines built under the project were seen not to be used and filled up with rubbish. At the same time villagers have invested their own funds in meeting local demands, e.g., they have paid 25% of the costs of a wall around the (very large) school compound and have constructed a temple. Washing slabs are much used but since no arrangements exist with the users and Panchayats on site management the drainage situation at the pumps is very poor.

Page 5 of Annex 10
In its direct outcome, the eradication of guinea worm the project has been very effective. In 1986 there were 8212 confirmed cases on a total population of the areas of 1,47 million (1981 Census). Now for the last three years and more (depending on sites) there have been none. The total cost to cure these patients and safeguard the others has been Rs. 76,6 million, or Rs. 52 per person.1 The project has not only achieved its more narrow objectives, but has set a model for other districts with guinea worm cases in the state. Here the government has taken up the same approach, with the same good results but a lower external support. In the SWACH project the state government financed 29% of the US $1,5 million per year, although the agreed costsharing was 60%-40%. In RIDEP the state government finances 52%, against an agreement of 58% [personal communication with Ms. S. Ganguly, UNICEF Jaipur]. With regard to the broader development aspects the situation has not chanced from the one reported in the external evaluation. The challenge to address community management of water supply and environmental sanitation remains and asks for a different approach than that of a campaign with a combination of mass media and personal contacts.
References
UNICEF, 1994. Project Clean. Jaipur, Rajasthan, UNICEF
SIDA, 1998. Sida pilot project: the example of SWACH. Final report. Stockholm, SIDA
Centre for Develoment Studies, 1994. SIDA: SWACH evaluation Rajasthan: India. Final report. Swansea, University of Wales, Centre for Development Studies
UNICEF, 1990. Towards victory: India battles the guineaworm. New Delhi: UNICEF. Video.
Jonsson, S. an Rudengren, J. 1991. An economic appraisal of a handpump maintenance system using women mechanics. Stockholm, Stockholm School of Economics.
Abelin, C, 1997. The application of a cost benefit approach on rural water supply projects: a minor field study of UNICEF's water supply project in Rajasthan. Lund, Sweden, Lund University. Thesis
RIGEP, undated (c. 1997). Rajasthan integrated guineaworm eradication project. Containment strategy from 1992-1996. Jaipur, RIGEP.
1 Although this is a low cost per person not all these persons would have attracted guinea worms. Costs per patient avoided are much higher, but apart from avoiding several thousand guinea worm cases the general water supply conditions have also improved. In a dry zone such as South Rajasthan this has tremendous implications for the incidence of water washed diseases and the work and energy expenditure of women and girls. These work many more hours, but do not get the calories needed for that work because of their secondary position in the household and so less access to food and the more nutritious parts of meals. Quantification of cost-effectiveness is thus complex, as further discussed in Annex 12 but the results will in any case be better than the cost per patient avoided.

Page 6 of Annex 10
Case 2: Domestic Defluoridation of Drinking Water: Users Eager to Get a Choice
Udaipur district is one of the locations in India where fluoride in the groundwater is high. Years of drinking this water give mottled teeth, malformed joints and stiff necks. Girls with mottled teeth see their marriage chances reduced. Women and men have problems in working and walking and end life bedridden. Villages with fluoride problems have always qualified to get a safer drinking water supply. The problem is installation and exploitation in places that lack fluoride-free water sources. Defluoridation plants have not been successful. In Rajasthan for example only 30% of those installed by the Indian government are working. Hence UNICEF supports an experiment where the women in eight villages remove the fluoride through home treatment.
Two techniques are tested. For the Nalgonda technique, so called after the area where NEERI developed it, the woman of the house pours the water for drinking in a plastic container of 40 liters, with a tap at the bottom. She then mixes the water with 600 mg alum and some lime and waits till the now turbid mixture clears. The water is then safe to drink. The amount of alum depends on the degree of contamination. The latter is tested every six months by the PHED.
The direct cost of the Nalgonda home treatment is Rs. 3 per time. The project advises to renew the alum after six weeks. The families can buy the alum locally in the house of a family that acts as the retailer. The container costs Rs. 600-800. Participating households pay Rs. 50 to the investments costs.
For the second technique the woman of the house pours the water into a 13 liter perforated galvanized bucket on a stand. The bottom of the bucket is filled with activated alumina. This binds the fluoride when the water filters through it into a small pot below. The alumina is active for about five months. A local animator visits the homes and tests if the alumina needs activating. The alumina is then rinsed with reagent several times in a small local workshop and when reactivated can be used again. The disposal of this wastewater is reportedly done in an environmentally safe way (site was not visited). Investment costs of this technique are the bucket and stand (Rs. 200) and 5 kg activated alumina (Rs. 750). The recurrent costs are considerably higher. A rough calculation with the project staff gave a recurrent cost of between Rs 16 and 20 per household per month or Rs. 200-240 per year.2 Households now contribute Rs. 10. A check with UNICEF staff showed the estimated real cost to be a likely figure but there were no precise cost calculations available.
A visit to four of the eight communities showed a high awareness among adults and older schoolchildren on the causes and prevention of the disease (including by a diet of
2 An animator can call on ca. 25 households per visit. Out of 22 working days per month s/he spends about 10 days on the visits proper, the rest is for travel, office work, meetings, etc. Visiting 300 households at a monthly salary cost of Rs. 2500 and a travel allowance of Rs 200 brings the cost for promotion and monitoring at Rs. 9,75 per household per month. To this must be added the cost of supervision (Rs. 1,50/hh/mnth), reactivation (Rs. 3,50/hh/mnth) and transport, incl depreciation. The latter could not be estimated, but we assumed to be Rs. 5,75 at the most.

Page 7 of Annex 10
fruit and milk). Fluorosis has been indigenous but no-one knew its cause. Wall paintings on houses and schools, posters and personal contacts have changed this. Yet the education has not reached all. In one village younger school children did not know handpump water was unfit to drink as the topic was not covered till standard VII. Two female servants who were collecting drinking water for the next village said they had seen the wall poster over the pump but not being literate they had never understood what it explained.
All those visited used the treatment and said the other households also did so (the villages are all small and the women said they know each other, but actual use could not be checked in the short time available). The alum treatment is less popular than the activitated alumina, because water with alum starts to smell badly after about a month. The users also find the plastic container not durable enough. Staff have the same experience: a quart of the containers has got out of order in three years. Large families find the amount of safe water produced by one device on the low side, especially since both methods are time consuming. An informal talk with children ina large family by one of the team who unobtrusively stayed behind did not reveal that e.g. girl children did not get treated water. All those talked with think the treatment well worth the trouble and stressed the value of their children growing up without the disease. It could not be checked how affordable the techniques are for the poorest households. In one village the Panchayat was said to
pay the costs for some very low-income families but as this was learned only towards the end of the visit, this information could not be followed up.
From the discussions emerged that several families were prepared to replace the plastic containers at 100% own financing when they become available in the local market. (All equipment is now supplied by UNICEF) Lively discussions emerged in which users of alum wanted to learn about activated alumina and vice versa. People were also interested in learning more about the costs and experiences of village-level plants, of which some had heard. Generally the picture emerged of very motivated families who wanted to make their own choices of technology, based on differences in ease of operation, waiting time, smell, investment costs and recurrent costs. The readiness of these families to share even all costs provided they can make their own choices contrasts with the proposed expansion of the pilot project, as planned by the RGNDWM and the Tribal Development Department. In the expansion to 250 more villages the implementers rather than the households have decided that only the activated alumina will be used. In this decision considerations of the sustainability of the technique on a longer term and a larger scale appear not to have entered as yet. While home treatment seems a promising alternative, there is also great pressure to scale the pilot up without working out all the options and consequences.
Two more aspects emerged where further progress can be made. The first is in hygiene education. Although the education brought in from the outside (through animators and posters) has a good effect, the spread could reach all age and social groups, when also peer education is promoted: brothers and sisters to younger siblings and users at the pump with fellow-users. The project also offers a good chance to combine health education on fluorosis prevention with education on other health aspects of water, such as safe drawing and handling (e.g. by using a dipper and separate drinking cups). This was now not being done. In one village dippers were said to be a remainder of SWACH and were seen hanging next to the containers (also strainers were still present and being

Page 8 of Annex 10
used), but in the next village this was not the case. Though they were known to be available in the market, their relevance was not known, and so no-one had bought one. Many dippers are allegedly also still available in the SWACH office (but again this was learned only afterwards and could therefore not be checked).
The second issue where progress is possible is in the gender perspective. During SWACH many women in the same district got trained and a job, as health promoter and in hand pump maintenance. In this project two NGOs are involved, of which one is a women’s NGO with a female director. In the women’s NGO one of the field animators is a woman, the other three are men. In the other NGO the only female animator left because she could get another job. Her (male) colleagues said that a secondary reason was however that her being the only woman did not work out. The reason for having more male animators is that the work involves measuring chemicals for which a secondary education is asked. As the chemical processes were not observed, is not possible to give an opinion whether the same work could not be done by, say an experienced female health promoter, who may not have secondary school but who is used to dispense medicines and monitor patients as seen in e.g. the tuberculosis control programme in the same villages. If warranted, the advantages would be that women not only do the physical work but also hold its control (now the work is done by women, the control by men); women health promoters can make a further career and convergent community action between water quality control, hygiene promotion and primary health care is realised.

Page 1 of Annex 11
Annex 11: Cost Effectiveness Analysis for Rural Water Supply
Cost-effectiveness analysis has two dimensions: costs and outputs or impacts. A technology (e.g. a handpump) is considered cost effective if its costs (appropriately quantified and valued) per unit of output are lower than those for another technology (e. g. from a pumped water scheme). Similarly, a technology is said to have improved its cost-effectiveness if , over time, costs per unit of output have come down (e.g. for India Mark II handpump). For a comparison of different models of the same technology (IM-II versus IM-III) which differ in terms of capital costs and operating costs, cost-effectiveness analysis will require a comparison of life-cycle costs for the same level of output.
Although it is , relatively, easier to quantify and value various cost components, it is very difficult to get reliable information on outputs and impacts. Further, it becomes difficult to compare technologies by making each technology “equivalent” in terms of output. Besides, there are considerations other than costs which have to be taken into account in evaluating appropriateness of alternative technologies for rural water supplies. These considerations include, interalia, equity in water availability and use, community management, cost-sharing, water quality and environmental issues (e.g. declining groundwater tables). Hence, in this Report, we have considered “cost-effectiveness” in its broader context including socio-economic, institutional and environmental issues.
I. UNICEF and Cost-Effectiveness Analysis
UNICEF has been conscious of reducing the unit costs of drilling rigs and handpumps both by reducing total costs and by increasing outputs and capacity utilization. In the case of drilling rigs, regular monitoring of utilization rates has been done. In the case of handpumps, focus has been on improving its utilization rate (and output) by improving its design, operation and maintenance and community involvement in management.
Although cost-reduction has been a motivating force for UNICEF programmes, documentation of these objectives and their achievements is not available. There are no explicit time-bound targets of cost reduction or improved capacity utilization (or higher outputs). Further, there are no documents which can show whether these targets of (cost-reduction per unit of output) were achieved or not.
UNICEF has developed a very useful programme on cost analysis of drilling rigs, handpumps and village water supply. Computer programmes under WESCOST have been developed which provide detailed analyses of drilling costs and performance of rigs; costs of handpump installation and maintenance and repairs; and, costs of pumped water schemes. The WESCOST costing study is a good example of efforts to review costs and outputs. However, unfortunately, the WESCOST approach has not been widely used within UNICEF and has not been made available to other agencies dealing with rural water supply. Promoting and supporting the use of cost-effectiveness analysis (with the help of modified WESCOST approach) would have been a very useful

Page 2 of Annex 11
contribution of UNICEF. It is recommended that UNICEF should revive its WESCOST1 programme; provide opportunities for its wider review; incorporate necessary modifications and support its wider dissemination in central and state agencies, NGOs and private sector. This is expected to raise cost-consciousness among planners, NGOs, managers and community leaders. In the medium- term, this will promote explicit considerations of choice of technology, institutional and environmental issues based on costs, outputs, outcomes and impacts. This seems to be a cost-effective activity for UNICEF in the future.
2. Cost-Effectiveness Analysis of Handpumps and Pump Schemes
It may be mentioned that the costs used in this analysis are only for illustrative purposes and are based on conditions in a part of Tami Nadu. Costs of water from handpumps and pumped water schemes (PWS) will vary from one region to another in India and depend very much on the hydro-geological conditions.. It may be mentioned that the cost figures used in this analysis and the assumptions that were made for the cost calculations do not take these hydro-geological situations into account but assume that all technical solutions can be implemented with the same amount of difficulties2. Hence, analysis and conclusions on cost-effectiveness have to be taken as illustrative and similar analyses would have to be carried out for other regions to draw conclusions on choice of technology for RWS.
As mentioned above, cost-effectiveness analysis has two dimensions: costs and outputs or impacts. For cost-effectiveness analysis of hand pumps and pump schemes, unit costs have been obtained by alternative measures of costs and outputs.
1. Estimation of capital costs per person (who receives a given quantity of water per day);
2. Estimation of Annual Costs per person which include annualised capital costs at given discount rate plus annual O&M costs;
1 Detailed cost analysis for handpumps and pump-schemes have been provided for five locations in Gujarat. Cost analysis and comparisons require further work before these can be used for any policy analysis. But, this WESCOST study was a step in the right direction and it is unfortunate The this has not been continued since 1995. The WESCOST study had a great potential of being used for creating data on parameters of Performance Analysis such as unit costs, outputs, utilization rates, working hours etc.. See WESCOST Costing study: UNICEF, Delhi and IBMS, Delhi, 1995
2 For example, in areas where water tables are high, and boreholes are high- yielding, these assumptions will be valid. In other areas, it might be difficult to find boreholes that yield adequate quantities of water. In such situations, the cost of more than one borewell will have to be included. Hence, for these conditions, the cost of borewells to yield required quantities of water will have to be re-estimated. Similarly, the location of a PWS may have to take into account the water yield required (15-20 liters/hr.) and hence, it would be necessary to account for additional cost, if any, of pumping main lines.

Page 3 of Annex 11
3. Estimation of Life-Cycle Costs (LCC) per person which include present value of capital costs plus present value of annual O&M costs over the life of capital equipment;
4. Costs per unit of water output provided to users (Annual costs divided by annual water output adjusted for Unaccounted for Water (UAF) in pump schemes)
Further, these are estimates of only direct capital costs of equipment used in providing adequate “safe” drinking water to rural populations using alternative technologies. In addition to these direct costs, there are infrastructure costs of community participation, NGO participation and project management. As per the current experience of one scheme, these costs can be as high as 20 to 25 percent of the direct capital costs.
It may also be emphasised that cost-effectiveness (lowest unit costs of providing water) is not the only criteria for policy decisions on the choice of technology for RWS. These considerations include, inter alia, issues of equity in water availability and use; institutional aspects of management and environmental issues such as declining groundwater tables in many regions. For example, use of piped systems should be encouraged only if combined with an overall of approach of providing water through a mix of technologies that includes assessment of water resources situation and management. In particular, such choices should take into account the integrated approach to management of local water resources for domestic and irrigation purposes so as to avoid adverse environmental consequences.
A. Cost Effectiveness of Handpumps
Estimation of capital costs per person
Capital costs for handpumps include:
• Capital costs of borewells including costs of drilling
• Capital costs of handpump, costs of installation including casing pipes, platform etc.
Tables 1 & 2 and Charts 1 & 2 show capital costs for drilling per borewell and per meter, respectively, in hardrock areas (Annex Table 1). Under these assumptions, cost per borewell is Rs. 24,855 if 150 borewells are drilled per year. The corresponding cost per meter is Rs. 414. These costs are based on the assumption of private interest rate of 18 percent per annum. The actual costs would be much lower if an interest rate of 10 percent is taken and a higher rate of productivity is assumed.

Page 4 of Annex 11
Chart-2: Drilling Cost Per Meter
0
100
200
300
400
500
600
700
800
900
0 50 100 150 200No. of Wells Drilled/Rig/Year
Rupees/Meter
In Tamil Nadu, private contractors undertake drilling at much lower rates i.e. at Rs. 195 per meter drilled. This cost figure reflects the fact that the private sector drillers probably use a different method for depreciation and, more important, rely on a much higher productivity. They will have to drill 200-250 boreholes a year in order to make a profit3.
3 This can be done because of the way these contracts are let out. Drillers have drilling schedules for weeks and months ahead. That allows them to plan their operation in way that idle times for rigs are minimal. In the new guidelines by RGNDWM wants to move towards demand responsive approaches. It may be pointed out that the piloting of these approaches should also look into cost considerations. If drillers do not have ensured workplans but might have to follow the demand when it arises, in the worst case (for them) they might have negotiate every contract separately with the VWSC. If the productivity goes down because of more complicated logistics, once the supply driven approach is abandoned, the cost per meter drilled might then go up towards the Rupees 400 mark.
Chart-1: Drilling Cost Per Well
0
10
20
30
40
50
60
0 50 100 150 200No. of Wells Drilled/Rig/Yr
1000
Rs/
Wel
l

Page 5 of Annex 11
Using the private contractors rates for drilling (Rs. 195 per meter), the capital costs per borewell are estimated at Rs. 15,400 including casing and siting.
Costs of borewell can be further reduced if rejuvenation of borewell is done through hydrofracturing. Costs of hydrofracturing can vary between Rs. 9,379 and Rs. 11,358 per borewell depending on the utilization rate of hydrofracturing unit (Annexe Table 2). Hence, the costs of handpump installation can be reduced by around Rs. 5,000 if hydrofracturing is done on a larger scale than is being undertaken currently4.
Capital costs for handpump installation are estimated at Rs. 14,680 including platform and IM-II handpump. Thus, the total capital costs per handpump installed are estimated at Rs. 30,080, under Tamil Nadu conditions. These costs may be lower in Uttar Pradesh and higher in Madhya Pradesh or Maharashtra, depending on hydro-geological conditions.
Capital costs per capita have been calculated under two assumptions regarding the number of beneficiaries. In the first case (Case I) , a national norm of 250 persons per handpump is used but per capita water use is taken at 20 LPCD (instead of 40 LPCD in the national norm). This gives a capital cost figure of Rs. 120 per capita/person. However, in the second case (Case II), it is assumed that only 125 persons can benefit from a handpump due to considerations of distance, frequent breakdowns and low water availability in the well due to declining groundwater tables or water quality consideration5. Under this pessimistic assumption, estimated output per handpump is only 2,500 litters per day and the capital costs are estimated at Rs. 240 per person.
Estimation of Annual Costs Per Capita:
Capital costs have been annualized using 10 percent interest and 10 years life. This gives a figure of Rs. 19 per capita for Case I (250 persons/handpump). To this figure we add Rs. 7 per capita as O&M costs. The total annual costs are Rs. 26 per capita per year or Rs. 2 per capita per month. Under Case II, these costs are Rs. 52 per capita per year or Rs. 4 per month. Table 3 and Chart 3 shows annual costs per capita for (a) handpump schemes which do not vary with the size of village population and (b) powerpump schemes. (For details see Annexe Tables 3a and 3b).
4 As explained elsewhere in this report, there are about 200,000 borewells which could be rejuvenated successfully overtime resulting in a cost saving of Rs 1000 million.
5 One source (PEO 1996) which gives such data shows that the number of persons covered per point (of water source) for handpumps was 146 under ARWSP and 227 under MNP. Even in the case of so called “safe” sources, water quality is either not tested or is found contaminated/brackish/saline. According to the PEO (1996) nearly 44 percent of the sample villages reported problems with water quality and in 26 percent of the villages tests of water samples were not conducted. Out of 87 villages, tests were conducted in 64 villages and problems were detected in 30 villages and corrective measures were carried out in 26 villages. Excess iron was detected in 10 villages, excess fluoride in 6 villages, and contamination in 11 villages.

Page 6 of Annex 11
Table - 3 : Annual Cost per Capita (Rs.)
HP service population Power Pumps
Population Case I = 250 Case II = 125
1000 26 52 182
1500 26 52 125
2500 26 52 79
3500 26 52 60
4500 26 52 49
See Annex-Tables 3a and 3b for details
Costs per Cubic Meter of Water
Assuming water availability of 20 litters per capita per day, a handpump is expected to provide 7,300 liters per year. For providing this volume of water, the annual costs are estimated at Rs.26 per year which gives a figure of Rs. 3.6 per cubic meter (or ‘000 litres). If a handpump provides water to 125 persons (Case II), cost of water from a handpump is estimated at Rs.7.2 per thousand liters (Table 4 and Chart 4).
Table - 4: Cost per 1000 ltrs. Of water (Rs.)
HP service Population
250 125
Powerpumps
Population 250 125
1000 3.6 7.2 11
1500 3.6 7.2 7
2500 3.6 7.2 5
3500 3.6 7.2 4
4500 3.6 7.2 3
See Annexe Tables 3a and 3b for details.

Page 7 of Annex 11
Life-Cycle Costs for handpumps
Life-Cycle Costs (which include present value of capital costs and present value of operating costs during the 20-year lifetime6) for handpumps are estimated at Rs.226 and Rs.452 per capita for Case I and Case II , respectively. (Table 5 and Chart 5 and Annexe Table 4).
Table-5 :Per Capita Life Cycle Costs
Population
Handpump service population
250 125
Power Pumps
1000 226 452 1212
1500 226 452 836
2500 226 452 536
3500 226 452 407
See Annex Table 4 for details
Comparative Cost Analysis of IM-II and IM-III
An interesting possibility of reducing maintenance costs by about one-half is now available with the development of India Mark -III. However, the capital costs are marginally higher, by about 5 percent even though Life Cycle Costs are lower (Annex Table 6). Hence, its popularity will depend upon whether government departments (given limited budgets) consider initial costs for taking a decision on the purchase of handpumps. Further, its economics will also depend on whether the overall water output for IM-III is same or higher than IM-II.
B. Cost-effectiveness of Powerpump Systems for Improved Water Supply
In addition to private sources, the needs for rural water supply are being met both through public handpumps and public pumped water schemes. According to one source (PEO 1996) which gives such data shows that the number of persons covered per point (of water source) for handpumps was 146 under ARWSP and 227 under MNP. In contrast to this, the number of persons covered under each point (27 to 37) was much
6 To make these Life-Cycle Costs comparable with pump schemes, a 20-year life has been taken for LCC analysis. This requires that the capital costs of a handpump are included again after 10 years since the working life of a handpump and borewell is taken as 10 years).

Page 8 of Annex 11
lower when PWS point was used indicating that “access” to water under PWS points was easier than under handpump schemes. Further, the number of persons covered under handpumps, on average, was much higher (about 4 to 9 times) when compared with PWS points.
Estimation of Annual Costs Per Capita:
Table 3 and Chart 3 provide annual costs of pump schemes for various villages where population size varies between 1000 to 4500. These include estimates of direct capital costs of providing water through a pump scheme and include the costs of the following components:
• Borewell
• Pumping system including pumphouse
• Overhead storage tank
• Distribution Lines
• Standposts
These capital costs have been annualized using a 10 percent discount rate and 20 years’ life. These costs show significant economies of scale as the number of persons using a pump scheme increase with the size of the village. Annual operating include costs of electricity, repair and maintenance and salary of an operator.
Annual costs per capita (Table 3 and Chart 3) are a high of Rs.182 for a village with 1000 persons to Rs.79 for a village with 2500 persons. Annual costs per capita decline to about Rs.49 when the number of persons in the village is higher than 4,500. This unit cost is marginally lower than the unit cost of a handpump (when a handpump serves 125 persons).
Chart-3: Annual Cost/capita (Rs.)
0
50
100
150
200
1000 1500 2500 3500 4500No. of persons in Village
Annu
al c
ost R
s./C
apita
250 persons per Handpump125 persons per HandpumpPowerpump

Page 9 of Annex 11
In addition to these direct costs, there are infrastructure costs of community participation, NGO participation and project management. As per the current experience of one scheme, these costs can be as high as 20 to 25 percent of the direct capital costs.
Costs per Cubic Meter of Water
Costs of water delivered (assuming 30 percent losses in distribution) are Rs.7 per cubic meter (thousand liters) for a village with population of 1500 (Table 4 and Chart 4). These unit costs decline to Rs. 3.0 per cubic meter for a larger village with population of 4500 and above.
Life-Cycle Costs for power pumps
For villages with populations below 1000, handpumps can provide water (20 lpcd) at a capital cost of Rs. 240 (US $6.0) per capita. Life-Cycle Costs (which include capital costs and present value of operating costs during the lifetime of the capital asset) for handpumps are estimated at Rs.452 per capita. Per capita Life-Cycle Costs for handpumps are the same for large population villages since there are no economies of scale in handpump costs.
For villages with populations of 2500 persons, power pump schemes can provide water (20 LPCD at standposts and 50 LPCD for house connections) at a capital cost of Rs.381 (US$ 9). Life-Cycle Costs (Table 5 and Chart 5) for a power pump scheme are estimated at Rs.536 (US $ 13) per capita7. However, LCC per capita are lower Rs.407 ($9.3) for villages with populations of 3500 and above since power pump schemes have significant economies of scale.
7 Here, we have used a life of 10 years for the calculation of the life cycle cost for handpumps and 20 years for the PWS. To get a more realistic picture we would need to break up the systems in components and calculate the cost with the component's life. (E.g., for PWS: borehole-20yr, pump-10yr, pumphouse-20yr, overhead tank-20yr, distribution and standposts-10yr). The overall results are not affected by taking the costs of various components.
Chart-4 : Cost per Cubic Metre of Water Supply
0.0
2.0
4.0
6.0
8.0
10.0
12.0
1000 1500 2500 3500 4500No. of Persons in a Village
Rupe
es p
er C
ubic
Met
re
250 persons per Handpump125 persons per HandpumpPowerpumps
Chart-5: Per Capita Lifecycle Cost for Handpump and Powerpump
0
200
400
600
800
1000
1200
1400
1000 1500 2500 3500No. of persons in a Village
Life
cycl
e Co
st/c
apita
(R
uppe
s)
250 persons per Handpump125 persons per HandpumpPowerpump

Page 10 of Annex 11
Considerations other than Costs
However, the economies of scale of power pump schemes are available only in contiguous habitations of 2500 persons or above8. If villages/habitations are combined into one big water supply scheme, the cost of distribution pipelines become much higher, the O&M problems more difficult to overcome since management will be under several Panchayats. Hence, a reasonable policy will be to provide PWS in large villages when possible and economic but have the PWS supported by handpumps as stand-by systems or for remote hamlets.
In addition to the direct costs considered above, the mix of handpumps and PWS for a given village depends upon:
• Infrastructure costs of NGO participation and community management;
• Provision of O&M management;
• Equity in supplies to lower costs and poorer people in remote parts of the village;
• Availability and use of water from alternative sources (including traditional sources)
• Access to good quality groundwater (may be easier to tap one source for PWS)
• sustainability of groundwater supplies (due to overpumping);
• Financial sustainability, cost-sharing and cost recovery.
C. Financial Viability of Alternative Technologies
Although handpumps can play an important role in meeting basic needs, investment in handpumps needs to be combined with other alternatives of water supply to meet the objectives of adequate and convenient source of water supply for users who are willing-to-pay. The PEO survey (PEO 1996), showed that in the 29 districts surveyed under the handpumps constituted around 35 percent and PWS about 50 percent of the total supply points created.
Pump supply systems (or mini surface systems) can provide adequate supplies and ensure financial sustainability of investments as well as cross-subsidies from rich to the poor. Piped water supplies (from pumped systems) are found economic and financially viable for villages with populations exceeding 2,500 and where some people are willing to pay for improved services and house connections. Recent experience in Tamil Nadu shows that the state government has now accepted the need for supplementing handpumps with private connections where people are willing-to-pay for services they want. The government order issued in October 1998 allows Panchayats to legalise
8 It would be interesting to classify how many villages have contiguous populations in different states. Available data from water supply surveys in West Bengal and Bihar show that most of the villages are above 3000 persons while in Tamil Nadu the village sizes are relatively lower.

Page 11 of Annex 11
current private connections and provide new house connections in pumped water supply schemes. This is a step in the right direction.
Financial viability of pump schemes has been analysed under the following assumptions
• Each house connection gets 50 lpcd of water delivered at home s compared with 20 LPCD available from standposts;
• 20 percent of the households pay Rs.1,000 as first deposit and 20 percent households pay Rs. 500 as first deposit. Both groups pay Rs.30 per month as water charges;
• Users of handpumps and standposts organize themselves such that each user household pays Rs.6 per month per household.
• The power pump scheme is constructed by PHED or TWAD Board and managed by the village panchayat.
As shown in Table 6 and Chart 6, based on data from two villages in Tamil Nadu, initial deposits from users can meet about 13 to 18 percent of the direct capital costs of pumped water. Monthly revenues from house connections can cover not only full O&M costs but could also contribute towards capital charges. In other words, monthly revenues can cover as much as 48 percent of the Annual Costs (annualized capital charges plus O&M costs.
Chart 6 also shows an interesting possibility of financial viability of handpumps. If a handpump can be used to serve 250 persons and each household (say 5 persons) pay Rs.6 per month, as much as 55 percent of the annual costs (O&M and annualised capital charges) can be recovered. This rate of cost recovery is higher than that in the case of pump scheme. However, the cost recovery is much lower (27 percent) when a handpump can serve only 125 persons. Hence, output from handpump (defined as number of persons served) is a critical variable in cost per person as well as in cost
Chart-6: Revenue as % of Total Annual Cost
0
10
20
30
40
50
60
1000 2500 3500No. of persons in a village
Perc
ent
250 persons per Handpump125 persons per HandpumpPowerpump

Page 12 of Annex 11
recovery. It seems likely that under average conditions of coverage of a handpump and community contributions, it would be possible to cover O&M costs of a handpump.
It may be pointed out that this analysis does not account for collection costs of user fees. These costs can be very high and it would be necessary to ensure that panchayats can collect these fees in a cost-effective way.
It may be noted that the O&M costs per capita for handumps (Rs. 14 to 15) are about the same as those for PWS. Hence, the two systems are not much different in terms of cost recovery through community contributions to O&M costs.
It may be mentioned again that the above comparison of costs of technologies does not take into account (i) the risks and long term costs of increased depletion of groundwater either in quantitative or qualitative terms (ii) The life-cycle costs are the direct costs and do not include any extra costs like paying for the fund collection and bookkeeping (which for transparency may need to be done separately - at least people should make a reasoned choice of their local financing system) and (iii) costs of maintaining HP and traditional sources as all play a role in holistic and sustained IWRM. So the rich may need to pay more than just for a power pump if we agree a sensible village water system is holistic.
D. Equity, Resource Sustainability and Management Issues in RWS
It may also be emphasized that cost-effectiveness (lowest unit costs of providing water) is not the only criteria for policy decisions on the choice of technology for RWS. These considerations include, inter alia, issues of equity in water availability and use; institutional aspects of management and environmental issues such as declining groundwater tables in many regions. For example, use of piped systems should be encouraged only if combined with an overall of approach of providing water through a mix of technologies which includes assessment of water resources situation & management. In particular, such choices should take into account the integrated approach to management of local water resources for domestic and irrigation purposes so as to avoid adverse environmental consequences.
Equity in Water Availability and Use
It is clear that the choice of technology affects the availability and use of water among different income groups. Handpumps provide water to a large number of users and it involves use of labor and some contributions to meeting O&M expenses. Invariably, it does not involve payment towards the capital costs of installation of handpumps that are set up by government agencies. However, this also “restricts” the total availability and use of water by the poor groups. If 20 lpcd of water is considered as the minimum for meeting drinking, cooking and personal hygiene, women and girls will be required to carry 100 litres of water from handpump to the house. In summer months, these requirements may be 150 lpcd for a family and the time spent on fetching water would depend on the distance from the handpump. According to one study9, on average, a
9 Nigam et al (1998, pp 48-50) for Gurrabadu village in Anantpur district of Andhra Pradesh.

Page 13 of Annex 11
woman has to make ten rounds to the handpump to fetch 150 litres of water. This is equivalent to a 5 kilometer walk and takes atleast 2 hours, excluding waiting time for the handpump. This effort is further compounded by the non-functioning of handpumps and the waiting time at the handpump. In this study village, out of 9 public handpumps, not more than 5 were found to be functional at any given point of time, with differing yields across seasons and depending on their proximity to the irrigation borewells. Hence, women and girls may have to spend around three hours per day to fetch water for the family. Given the opportunity cost of labor and alternative uses of women’s time/leisure, this is a substantial cost to the family of depending on handpumps for meeting their water needs.
Average time for fetching water could be reduced either by locating more handpumps near homes (say, one handpumps for about 50 persons) or by providing water through standposts and house connections through a pumped water scheme (PWS). The PWS can provide upto 40 LPCD through standposts near the households and same or higher quantities for house connections. The PWS could be supplemented by handpumps in remote habitations. In this mix of water supplies from PWS and handpumps, people will get adequate and safe water within a reasonable distance with less than one hour for fetching water.
However, the “success” of this mix of PWS and handpumps in providing equitable supplies will depend critically on how the water supply system is managed by the community. In Tamil Nadu, the management of rural water supplies has been handed over by the TWAD Board to the panchayats. The panchayat president may restrict the hours of supplies in order to minimize water wastage due to leaking taps and pipes. If water is available for only three to four hours per day, this will mean long queues at public standposts, thus reducing water available to the poor sections of society10. If private connections are given there will be a demand for more water for house connections and may result in reduced supplies for standposts.
However, such unequal access to water by poor people can be avoided if community management of rural water supplies is made participatory and is sensitive to the needs of the poorest. This would require water committees in the villages that include men and women from all strata of society. Under such a management structure, the rich can pay for the services they want (house connections) and the revenues thus generated can be used for cross-subsidizing public standposts and public handpumps. This will enable the rural water supply schemes to break the vicious circle of low revenues-low supplies and
10 During the fieldwork in February 1999, in the PWS in Vardarajpuram panchayat , near Chennai, it was found that water was restricted to three-and-half hours (6 to 9:30 AM) in the morning. It was mentioned by the Panhayat President that people did not want water in the evenings. However, when taps were providing water during the visit of the team in the village, a large number of people came out to fill their pots at standposts. Further, the number of standposts installed were 16 on the basis of the government norm of one standpost (fountain) for 100 persons. It was found, during discussions with TWAD Board officials during the field visit, that the number of standposts could be easily increased to 30 or more since there was adequate storage capacity and 8-hours’ power supply was adequate to pump water to the overhead tank.

Page 14 of Annex 11
get out of the low equilibrium trap11. These management and tariff structures will provide adequate water to the poor people at prices they can afford. This will also provide water services to the rich people for which they are willing to pay. Hence, this will be a financially sustainable system of RWS.
Competing Uses of Water and Sustainability
It is argued that PWS enables pumping of water which is in excess of what would be pumped out if only handpumps were used. This may be true and may create resource-use problems in some areas. However, this should be considered a welcome development since one of the policy objectives was to provide safe and adequate water supplies to rural people within a reasonable distance. Further, pumping for domestic water supplies is a small fraction of the total quantities pumped for irrigation and hence, the real resource -sustainability can be achieved only through policy reforms in the irrigation sector (e.g. removing subsidies for electricity, groundwater legislation).
For example12, in a micro watershed study areas of Maharashtra, it was found that water requirements of 121 cubic meters per year was only 2.5 percent of the pumped water for irrigation needs (7685 cubic meters). In Narsipur village in Kheda district of Gujarat domestic water consumption is only 1.5 to 2 percent of the water extracted and where over-extraction of groundwater has resulted in drying-up of 18 percent of the 101 energized borewells. In Pathoda village of Kheda district in Gujarat where water table has declined by 7.5 meters in 16 years (from 15 m to 22.5 m), excess withdrawal is 48 percent more than usable groundwater recharge. However, in this village also, excess withdrawal is due to irrigation pumping which accounts for 750,000 cubic meters in comparison with 44,000 cubic meters extracted for drinking water purposes. In this village, drinking water needs were only 10 percent of the usable groundwater and excess withdrawal is mainly due to irrigation. In Gurrabbadu village of Anantpur district of Andhra Pradesh, domestic water requirements for people and cattle was 23 percent of the total groundwater withdrawal in 1995-96.
In view of the situation where bulk of the groundwater withdrawals are used for irrigation, restricting the use of groundwater for domestic purposes including for hygiene, seems to be a wrong strategy. It would be desirable to provide additional water supplies to people through pumped water schemes and/or handpumps so that their basic needs for health and hygiene are met. Since resource -sustainability is an important objective, this should be achieved through removing subsidies for electricity used for pumping and by regulation and legislation on groundwater withdrawals.
11 An example of this can be seen in a study for Kerala rural water supply where Willingness-to-Pay studies were carried out to design tariff structures that will lead to financial viability of RWS. See Singh, Ramasubban, Bhatia and Briscoe (1993).
12 For details see Nigam et al : Fresh Water for India’s Children and Nature: UNICEF 1998.

Page 15 of Annex 11
Management of Rural Water Supply
It is important to consider how the management of rural water supply can be organized in the future. Community management of handpumps has been discussed at length elsewhere in this report. If a mix of systems including pumped water schemes is within a large village, it should be possible to manage the systems by community leaders with assistance from PHED in repair and maintenance. In the PWS in Vardarajpuram panchayat13 near Chennai, it was found that water was restricted to three-and-half hours (6 to 9:30 AM) in the morning. Further, the number of standposts installed were 16 on the basis of the government norm of one standpost (fountain) for 100 persons. It was found, during discussions with TWAD Board officials during the field visit, that the number of standposts could be easily increased to 30 or more since there was adequate storage capacity and 8-hours’ power supply was adequate to pump water to the overhead tank.
The user assessment in Tamil Nadu also found that installation of piped systems had in practice not improved the situation. The main reasons were:
• Lack of direct representation of each user group – women and men in better-off, middle class and poor households – in planning and management;
• Lack of standards for good service and absence of direct accountability for technical and financial management of the service to these same stakeholders – men AND women in better-off, middle class and poor households
Gender specificity is always needed because within rural households, women and men have different interests, knowledge, responsibilities and resources.
3. Cost-Effectiveness Analysis of Rural Sanitation
A number of technical alternatives for rural latrines are now available. These technical alternatives range in cost terms from Rs. 280 to Rs. 2,800.
It is difficult to evaluate cost-effectiveness of these alternatives in the absence of any measurable indicators of output or impact. Assuming that the low-cost technical alternative provides minimum sanitation benefits, cost considerations should be a major consideration (if high cost models merely provide a better surrounding and cover).
Even for this low-cost technology, a cash expenditure of Rs.280 (lumpsum) may be quite high for a large number of low-income people. Although education and knowledge about sanitation practices is a necessary condition, it does not ensure that people will be willing to borrow for such uses at high interest rates. Hence, there is a case for some limited subsidy for target groups.
13 During the fieldwork in February 1999, it was found that the panchayat president was managing a number of rural infrastructure projects such as village street lighting, access roads and water supply. This raises a significant question regarding capacity building for rural community leaders in these areas as well as the cost of their time.
Page 16 of Annex 11
Under the 73rd and 74th Amendment this subsidy may well come from the local Panchayat, rather than from State and/or Central Government resources. In the spirit of this Act, it can even be held that it is the responsibility of better-off community members to help those less well off to realise a minimum level of sanitation since an impact on public health (including that of their own families) is only achieved with a critical mass of some 75%-80% good sanitary conditions and practices. The Convergent Community Action programme may prove to be an effective strategy to achieve both means (cross-subsidy and other forms of creative funding) and goals (sanitation) through a participatory learning and action process with all income groups and both genders.
4. Quantification and Valuation of Outputs/Impacts
As mentioned earlier, cost-effectiveness analysis has two dimensions: costs and outputs or impacts. A technology (e.g. a handpump) is cost effective if its costs (appropriately quantified and valued) are higher than the value of its outputs. In the earlier section on cost-effectiveness of RWS options, the focus was on quantification of various components of costs and approaches to comparison of costs. In that section, some preliminary assumptions were made regarding output of the technology e.g number of persons benefitted from handpumps; volume of water produced or delivered etc.. In this section we discuss , in more detail, issues of quantification of outputs and evaluation of impacts of investments in rural water supply and sanitation. It is suggested that a comprehensive system of Performance Assessment and Impact Evaluation has to be developed and implemented , preferably under the leadership of UNICEF.
A.1 Performance Assessment and Impact Evaluation
Performance Assessment and Impact Evaluation of water supply and sanitation programmes have not received adequate importance in UNICEF and government agencies. Information on performance indicators in terms of access, availability and use of water and sanitation services in rural areas are either missing or very inadequate for any comparative assessment or policy changes. For example, data on “access” to water services is available in terms of habitations and populations under three categories. On April 1, 1998, it was claimed that 1.06 million out of 1.43 million habitations were fully covered while 0.31 million were partially covered. Using these norms, by April 1998, 582 million or 92.6 percent of the total (1991) rural population of 628.7 million were “covered” and had access to safe water supplies. But, these figures do not show what kind of “level of service’ was available in terms of quantity and quality of water supplies
Similarly, the information on number of handpumps installed and working is not based on a consistent set of sources of information and performance measures. In the case of handpumps, it is not known what types of handpumps are available in different states; how many of these handpumps are IM-II, IM-III, TARA, and filter points. Although production figures for IM-II and IM-III are available for a few recent years (1995-98), the

Page 17 of Annex 11
figures on the total stock of IM-II in different states are not available.14 Some of these inadequacies and inconsistencies of data regarding access, availability and use of water are elaborated in the following sections.
A.2 Performance Indicators
For assessing the performance of RWS technologies and assets it is important to identify and quantify performance parameters. These could include indicators of
• Access to Water Supply
Information on Number of Water Supply Points
Indicators of Water Quality
Number of Persons Per Water Supply Point
• Availability of Water
Information on Water Points Under Working Condition
Information on Water Output Per Point
• Water Use for Various Purposes
The following section presents some information on data available on many of these Performance Indicators. This shows the type of data required and the type of data available.
A.3 Access to Water Supply in Rural India
Access to safe drinking water supply rural populations depends upon:
• Number of water points in the village/habitation (including traditional sources);
• Potability and quality of each sources;
• Number Of persons covered by each water supply point.
14 For example, for Tamil Nadu, data show that in September 1998, there were 160,977 handpumps, out of which 119,881 were IM-II, 7463 were IM-III and 33633 were filter points. For the same period, the number of power pumps were given as 31,609 of which 11667 were jet pumps, 8186 were centrifugal pumps and 10211 were submersible pumps. From these data a, it is impossible to “estimate” the volume of water output that is available to the users of these systems. (Source: TWAD Board, personal communication)

Page 18 of Annex 11
The current method of assessing “access” to safe drinking water supply is based on “norms stipulated under the government schemes such as Accelerated Rural Water Supply (ARWSP) and the Minimum Needs Programme (MNP). Based on these norms, a village/habitation is defined as “fully covered” if it has one handpump or standpost for every 250 persons, provides 40 lpcd and the water source exists within 1.6 kilometers in plains and within 100 meters elevation difference in the hilly areas. If these norms are not met, the village is classified as partially covered (PC). Rajiv Gandhi National Drinking Water Mission (RGNDWM) reports figures for “coverage” of rural population under water supply programmes based on (I) the survey of status of water supply facilities in rural habitations undertaken /verified during 1991-94 and progress achieved during 1994-98 as reported by States and Union Territories. According to these data (RGNDWM 1998) on total coverage up to 1997-98, a total rural population of 581.9 million was covered under rural water supply programme. This means that as much as 92.6 percent of the total rural population (1991 Census) of 628.7 million was covered under the rural water supply programme. The percentage of population covered was almost 100 per cent with the exception of Assam (72.6 %), Gujarat (95%), Himachal Pradesh (86%), Kerala (48%), Orissa (80%), Rajasthan (83%), Tamil Nadu (79%), Uttar Pradesh (90%) and West Bengal (82%).
These estimates of “coverage” of populations provide misleading information on the access to safe drinking water sources on account of the following factors:
• Based on government programmes and excludes private sources which may be significant in certain states (e.g. Kerala);
• Water quality is rarely monitored to ensure that water supply is “safe” for drinking and cooking purposes;
• Based on 1991-94 surveys and reports from government agencies that have built-in incentives for showing higher achievements.
Private Sources
National government policy considers drilled wells with handpumps, piped water supply schemes and mini water supply schemes as the only safe sources. A significant proportion of households reported using private sources of water supply even though they had access to public sources of supply. Most of these users were owners of these sources. According to the PEO evaluation (1996), nearly 43 percent of people in selected villages used private open dugwells while 21 percent of people in selected villages used private handpumps (HPs). In four states of UP, Orissa, MP and Rajasthan, 25 to 53 percent of households reported using traditional sources in preference to protected water sources provided by the government (UNICEF 1998, p 63).
Uncertain Water Quality
Water from private dugwells and shallow handpumps are considered unsafe for drinking purposes. Yet a large number of people continue to use these sources for convenience or on account of non-availability of public sources (due to breakdowns, insufficient yield). Even in the case of so called “safe” sources, water quality is either not tested or may be found to be contaminated or unacceptable for use (e.g. high salinity). According to the

Page 19 of Annex 11
PEO (1996) nearly 44 percent of the sample villages reported problems with water quality and in 26 percent of the villages tests of water samples were not conducted. Out of 87 villages, tests were conducted in 64 villages, problems were detected in 30 villages and corrective measures were carried out in 26 villages. Excess iron was detected in 10 villages, excess fluoride in 6 villages, and contamination in 11 villages.
Uncertain catchment populations
Since the available data do not cover all “safe” water sources (traditional and privately owned), the information on “access” to water points is inadequate and misleading. One source (PEO 1996) which gives such data shows that the number of persons covered per point (of water source) for handpumps was 146 under ARWSP and 227 under MNP. In contrast to this, the number of persons covered under each point (27 to 37) was much lower when PWS point was used indicating that “access” to water under PWS points was easier than under handpump schemes. Further, the number of persons covered under handpumps, on average, was much higher (about 4 to 9 times) when compared with PWS points. However, there were considerable variations across 29 districts indicating the need for better data and analysis of “access” to water supply in rural areas.
Availability of Water
Availability of volume of water to each individual user depends on (i) the number of water points installed; (ii) number of water points which are in working condition, (iii) the volume of water that is available from each point during a given period (yield) and (iv) the number of persons who are expected to use these water points. Data base on each of these points is rather inadequate. Since the quantity of water available to each user is critically dependent on what assumptions are made in each case, some of these points are discussed in detail below.
Information on Number of Water Points
Information on number of handpumps installed and working is not based on a consistent set of sources of information and performance measures. In the case of handpumps, it is not known what types of handpumps are available in different states; how many of these handpumps are IM-II, IM-III, TARA, and filter points. Although production figures for IM-II and IM-III are available for a few recent years (1995-98), the figures on the total stock of IM-II in different states are not available. For Tamil Nadu, data show that in September 1998, there were 160,977 handpumps, out of which 119,881 were IM-II, 7,463 were IM-III and 33,633 were filter points. For the same period, the number of power pumps were given as 31,609; of which 11,667 were jet pumps, 8,186 were centrifugal pumps and 10211 were submersible pumps. Since the output of these points varies considerably, it is impossible, from these data, to “estimate” the volume of water output that is available to the users of these systems.
Information on Working Condition
Available figures at the national and State levels show that 2.5 million handpumps (or 88.6 percent of the total stock of 2.8 million) were working in April 1998. These data are

Page 20 of Annex 11
available from the field offices at the Panchayat and block levels. Since the allocation of funds for O&M is based on the number of handpumps that are in working condition, there is a built-in incentive for these officials to show that a majority of these handpumps are working. In as many as 14 out of 28 states and Union Territories, the number of handpumps working were more than 90 percent of those installed.
Such figures can be seen as over-estimates when contrasted with figures obtained from field surveys. The PEO survey (PEO 1996), showed that in the 29 districts surveyed under the ARWSP, handpumps constituted 39.3 percent and PWS 50.2 percent of the total supply points created. Under MNP, the corresponding figures were 32.2 percent for handpumps and 47.2 points for PWS. It was found that quality of construction of handpumps under ARWSP was not satisfactory for 47 percent of the sample points. It was found that 81.3 percent of handpumps and 80 percent of PWS points reported breakdowns during the previous year.
In a detailed survey carried out in five districts of Tamil Nadu, it was shown that 79 percent (as against the state average of 98 percent) of handpumps were in working condition. In a more recent survey of 820 respondents in three districts in Tamil Nadu, it was found that the percentage of handpumps in working condition varied from 53 percent in Salem to 56 percent in Kanyakumari to 67 percent in Vellore. In a similar survey sponsored by RGNDWM in August 98 in Karnataka showed that 66 percent of handpumps and 85percent public standposts were found to be in working condition. The estimated percent of handpumps in working conditions varies between 50 percent to 80 percent in Rajasthan.
Information On Water Output Per Point
In a detailed survey of 4840 IM-II handpumps in 1864 villages spread over 18 districts, in December 1985, Operations Research Group (ORG) found that 80 percent of handpumps were in working order and that average downtime during last one year per pump was 37 days. The average flow in 40 strokes (in one minute) was estimated at 12.5 liters, the variation being between 10 to 14 liters per minute. It was found that 60 households (300-350 persons) were using a pump on average. A pump was used, on average, for 8.4 hours per day in summer and 5.9 hours per day during the rest of the year. Based on these figures, the estimated availability of water per person was 21 liters per day in summer and 15 lpcd during rest of the year. These figures are considerably lower than the norm of 40 lpcd used in classifying a village as “fully covered”. Similarly, in Rajasthan, per capita supplies are significantly lower than norms of 40 or 70 lpcd (UNICEF Annual Report 1997).
Water Use for Various Purposes
Data on water use are rather scarce. Even a detailed survey undertaken by various agencies in 1998 (sponsored by RGNDWM), such data are not consistent, adequate and comparable. For example, in West Bengal, it is shown that in the three surveyed districts, 60 percent of people use handpumps or public hydrants for drinking purposes while 40 percent use dugwells. For washing utensils, bathing and washing clothes, people use all sources depending on what is available nearby.

Page 21 of Annex 11
B. Impact Evaluation
There have been a few studies on impact evaluation of UNICEF programmes, notably for CDD-WATSAN and SWACH programs. In some of these cases, there are methodological issues of estimating “benefits” of the programmes in terms of value of time saved in fetching water or health benefits of water and sanitation activities. There is a need for developing a methodology for comprehensive impact evaluation of the programmes and its application in India. Such a comprehensive impact evaluation should cover both direct and indirect impacts. These impacts should cover economic impacts such as employment and income enhancement and impacts on health, fertility and infant mortality. UNICEF should provide an anchor for such impact evaluation efforts since these programmes should eventually result in better health and welfare of the mother and the child.
There are important methodological issues in impact evaluation of UNICEF activities in the field. Some of these issues are discussed in the context of a recent report (June 1998) sponsored by UNICEF on Assessment of Handpumps installed by PHED under CDD-WATSAN Project in Alwar district. The purpose of the study is stated to assess whether UNICEF supplied handpumps have been able to achieve the desired objectives. This evaluation was confined to the aspect of supply of safe drinking water and did not cover the broader aspects of CDD-WATSAN (which were listed as low cost sanitation, disposal of excrete and management of diarrhoeal diseases). In the evaluation, it was decided to take 20% of the total villages (140) where 267 handpumps were installed during 1994-97. Of these 30 villages, 23 villages were selected from project area (adjacent to the project villages). A total of 389 households and 35 educational institutions were surveyed (287 females, 102 males). It is not discussed why the proportion of villages selected between project and non-project areas is such that project villages are three times those in non-project areas. Further, a systematic random sampling method for selection of villages and household have been adopted which may have biased the statistical results. Further, only mean values of selected indicators have been reported and used for comparison between project and non-project situation. As a result of these biases, it is difficult to accept the conclusions of the study, which are:
• Availability of handpumps is lower in project areas (214 persons per working HP as compared with 72 in non-project areas in Kishangarh bas)
• Norm of 150 persons per HP was not achieved; average persons were 214 and 371 per working in HP in two blocks.
• Average and maximum distance from HP was less in project area.
• Percentage of handpumps with platform was lower in project area; with soak-pits was about the same.
• In Kishangarh bus, 30 percent of handpumps constructed were not working in project area while 45 percent not-working in non-project area. In Rajgarh block, 50% non-working in project area and 8 percent not working in non-project area.
• A lower percentage of families in project area is spending more than one hour in collecting water from handpump (compared to non-project area)

Page 22 of Annex 11
• Only one-third of the families consuming more than 40 liters pcd in Kishangarh bas; 100 percent in Rajgarh.
• Incidence of diarrhoea (22 per 1000) was reported to be higher in project area than in non-project area (16.9 per 1000).
• No female mechanisms were seen; handpumps remained out of order for months.
• In Kishangarh bas 31 percent of households in project area and 53% in non-project area departed on open wells for domestic work supplies.
The results and conclusions of this impact assessment study are totally misleading on account of the following methodological issues:
• Approach of assessment: With Project v/s Without Project OR BEFORE AND AFTER PROJECT
• Sampling Design: Inadequate sample; biased selection of villages and households.
• Methodology of Data Collection: Household interviews and PRA
Data analysis and reporting - no proper statistical techniques were used. These are discussed below.
Approach of Assessment:
The most difficult methodological issue is Before and After and With and Without the Project. This study has adopted with and without approach due to non-availability of baseline data for Before-project situation. However, With and Without approach can give misleading results, particularly if sampling design is not correct and sample sizes are too small (as elaborated later). Besides, the presence of the project (UNICEF assisted handpumps) might have affected (reduced or increased) the number of handpumps installed by PHED under its normal programmes. Further, differences in project and non-project situations have to be shown to be statistically significant (as explained later) and association or caused relationships among variables have to be interpreted very carefully.
Sampling Design:
The sampling design selected is purposive and, hence, has biased the results.
From the analysis of data, it is found that in both blocks, households for village in project area are much higher (two to two and half times) in project areas as compared with non-project areas. Given the target orientation of handpumps per village, this selection biases results in favor of non-project area as seen from the results where number of persons served by each handpump is twice or more than those in non-project area.
The purposive sampling design postulated that from each village households dependent on handpumps for their domestic water consumption were selected (ii) households selected shall be equally spread-over all the handpumps in the village, (iii) 50%

Page 23 of Annex 11
households selected are nearer to the handpump and 50% at a distance (above 30 meters) from the handpump; (iv) a minimum of 3 households for handpump surveyed. If the number of handpumps is 3 or less, atleast ten households were surveyed and (v) ratio of male and female handpump users is kept at 1:2. With these restrictions on household selection, it would be difficult to claim that the selected households provide unbiased information on the access, availability and use of water.
Method of Data Collection: Interviews were used for data collection. However, on most important variable quantity of water consumed. There is no description of how these data were collected, quantity of water measured etc. The report merely says “attempts were made to estimate domestic consumption of water in terms of liters per day in the families. This was not difficult part of the survey and attempts were made to obtain correct information to the extent possible”. For data analysis on water-use, sample households have been classified into three categories: less than 25 LCD, 25 to 40 LCD and Above 40 LCD. Dividing these sample households into three groups reduces the number of households in Non-Project areas in each group to 8 or less in Kishangarh bas ( e.g. 5 in category 25-40 LCD). With such small numbers in each cell, it is difficult to make statistically relevant comparisons between project and non-project areas.
Statistical Analysis and Reporting:
In the Report, all results are reported as mean values of indicators (e.g. persons per handpump) and comparisons are made across project and non-project areas. Given the small sample sizes, it is important to report variances of these variables and perform statistical tests for significance of differences in mean values. Similar biases may be present in number of persons served by each HP since the number of working HPs in non-project area of Kishangarh bas is only five while in non-project area of Rajgarh is eleven. For example, the population served per working HP in Kishangarh bas varies between 150 to 839 while the range for the same for Rajgarh is 123 to 967.
It is due to these considerations that it is a difficult to accept a conclusion that in the project areas the number of persons covered is considerably less (one-third) compared to those in non-project area or the conclusion that number of persons getting more than 40 lpcd in project areas is about the same as in non-project areas.
Conclusions on Impact Evaluation
On balance, it is difficult to conclude the impact of CDD-Watson on provision of handpumps and safe drinking water. This example of UNICEF-sponsored study shows the very poor quality of any of these studies and the need for UNICEF and others to introduce quality control. This means that a) the required expertise to judge this work is lacking in the organizations that commission the study: "having done a study" is the criterion rather than its quality; and b) the consultancy firms do not have access to information and training on good quality studies.
If a network for quality-studies is set up one also needs some review and quality- mark system and perhaps also training. This would be a huge undertaking but would fit well in the current shift from doing more implementation to building better capacities

Page 24 of Annex 11
C. UNICEF’s Role in Performance Assessment and Impact Evaluation
UNICEF can and should play a leadership role in setting-up of a Network for Performance Assessment and Impact Evaluation. The Network will involve all stakeholders, cover all sources of water supply and evaluate socio-economic, managerial and technological issues in an integrated manner. The Network will include representatives of UNICEF, RGNDWM, Groundwater Boards, Pollution Control Agencies; State Governments; Plan Evaluation Organizations; ESAs involved with water sector; NGOs; Consumer Groups and Research Organizations. The Network will cover issues of water quantity, water quality, water pollution, competition for water, augmentation of water supplies, declining groundwater tables, pricing and cost recovery of water supply and irrigation; community participation and women’s role in management of water projects. The Network will develop:
• Approaches for evaluating cost-effectiveness of providing rural water supply and sanitation services in various regions of the country;
• Methodologies for identification and measurement of performance assessment indicators for rural water supply and sanitation;
• Methodologies for impact evaluation of rural water supply and sanitation;
• Institutional arrangements for a comprehensive, integrated and regular performance assessment and impact evaluation of water supply and sanitation services in India.
There is an urgent need for capacity building in the areas of performance assessment and impact evaluation. Although a number of research institutes, NGOs and consulting firms are carrying out various types of evaluation studies (there is excess demand in this sector), the quality of such evaluations varies from satisfactory to bad. There are serious problems with methodological issues relating to approach (With and Without vis-a-vis Before and After); Sampling design (village selection, household selection, sample size); Data Collection (PRA, interviews, questionnaires); Data analysis (statistical methods, estimation of benefits and costs; differences between impacts, outcomes, association and causation) and Data reporting. UNICEF should provide an anchor to ESAs and government agencies to coordinate various training and workshop activities in this important area.

Page 25 of Annex 11
5. Conclusions and Recommendations on Cost-Effectiveness
A. Conclusions
1. UNICEF has rightly promoted handpumps as a source of rural water supply in India since handpumps are a cost-effective way of meeting basic water needs and provide equitable access to poor people for populations in small villages/habitations. The capital cost for handpumps range between US$ 3.0 to 7.4 per capita for hardrock areas and much lower for alluvial regions. The total annual costs can be as low as Rs.26 per capita per year or Rs.2 per capita per month if a handpump provides adequate water to 250 persons. Life Cycle Costs (LCC) for rural water supply through handpumps can be as low as $ 5 per capita for a 20-year period. Hence, UNICEF should continue its advocacy as well as provide technical assistance in installation of handpumps in states where adequate number of handpumps have not been installed to meet the adequacy norms of water supply.
2. UNICEF should appreciate that there are situations where handpumps have to be supplemented with pump water schemes (PWS) so as to provide a higher level of consumption (50 lpcd) for households who are willing-to-pay for house connections and take advantage of economies of scale in villages with populations exceeding 2500. Pump water schemes may also provide adequate supplies from one tubewell and may improve financial viability of rural water supply schemes through cost-sharing and cross-subsidies. Thus, handpumps have to be seen as an important component of the integrated approach to rural water supply efforts where pump water supplies and traditional sources have to be considered simultaneously.
3. UNICEF has highlighted the issues of water resource sustainability (declining groundwater tables) through Workshops, Freshwater Studies and R&D projects on water recharging. All these efforts have focused the efforts of policy makers on important dimensions of assets created under UNICEF programmes. However, the impact of water pollution on the “use” of water from handpumps has not received necessary importance.
4. Apart from sponsoring occasional surveys of performance of India Mark II handpumps, UNICEF has not been concerned with the performance assessment and impact evaluation of rural water supply systems. Studies sponsored by UNICEF have been narrowly focused on the performance of IM-II and rarely covered other handpumps, pumped schemes or traditional sources. Hence, there are no reliable statistics on the access, availability and use of water from various sources under different socio-economic conditions. Hence, there are no reliable statistics on the number of people who have “access” to safe drinking water sources; number of water sources actually “functioning” (as distinct from those installed); output of water actually “available” from these sources; quality (both actual and perceived by users) of water actually available; and the “use” of different volumes of water of varying quality for drinking, cooking, personal hygiene, washing etc. (in order to assess its adequacy for health benefits).

Page 26 of Annex 11
5. Further, there have not been any systematic efforts, either by UNICEF or by the government agencies to evaluate the impact of rural water supply (quantity and quality) on earning opportunities, public health, fertility, and infant mortality/morbidity. Although some special studies are available (e.g. impact of eradication of guinea worms), these are not adequate to evaluate the impacts of UNICEF’s water and environmental sanitation programmes.
6. There has not been explicit consideration of cost-effectiveness or cost reduction in UNICEF activities and programmes. Although reducing costs and improving availability of IM-II were always considered important, there are no explicit cost-reduction targets and achievements. Further, there are no output/outcome or impact targets against expenditures allocated under various programmes/projects. Hence, it is very difficult to evaluate the cost-effectiveness of UNICEF expenditures in terms of their outcomes and impacts.
B. Recommendations
1. UNICEF should continue its activities in providing strategic assistance to the provision of water supply and sanitation services in rural areas. However, instead of promoting and supporting only handpumps, it should develop approaches for evaluating cost-effectiveness of providing rural water supply and sanitation services in various regions of the country. In this context, UNICEF should continue its support for a large-scale adoption of rejuvenation of existing borewells through hydrofracturing units (HFUs) and tractor-mounted compressors (TMCs) since these are cost-effective options in improving the utilization of existing assets. However, it is necessary to ensure better utilization of HFUs and TMCs through better management and monitoring systems.
2. UNICEF can and should play a leadership role in setting-up of a Network for Performance Assessment and Impact Evaluation. The Network will involve all stakeholders, cover all sources of water supply and evaluate socio-economic, managerial and technological issues in an integrated manner. The Network will include representatives of UNICEF, RGNDWM, Groundwater Boards, Pollution Control Agencies; State Governments; Plan Evaluation Organizations; ESAs involved with water sector; NGOs; Consumer Groups and Research Organizations. The Network will cover issues of water quantity, water quality, water pollution, competition for water, augmentation of water supplies, declining groundwater tables, pricing and cost recovery of water supply and irrigation; community participation and women’s role in management of water projects. The Network will develop:
• Approaches for evaluating cost-effectiveness of providing rural water supply and sanitation services in various regions of the country;
• Methodologies for identification and measurement of performance assessment indicators for rural water supply and sanitation;
• Methodologies for impact evaluation of rural water supply and sanitation;

Page 27 of Annex 11
• Institutional arrangements for a comprehensive, integrated and regular performance assessment and impact evaluation of water supply and sanitation services in India.
3. UNICEF should evaluate its current activities under the water resources sustainability and identify where UNICEF has comparative advantage and where UNICEF can provide technical support and leadership. There is a need to consolidate various efforts and focus on one or two important issues. UNICEF may consider providing an anchor to a multi-agency effort in assessing water resources sustainability issues and evaluating policy options (e.g. groundwater legislation, pricing of electricity for irrigation, investments in water recharge structures). In other words, UNICEF takes the lead in identifying the problems and solutions (through pilot studies) and play its advocacy and strategic assistance role in implementing appropriate policies.
4. UNICEF undertakes a careful experiment in comprehensive water management in which costs and feasibility are tested- financially, managerially/institutionally, technically, socially and environmentally.
5. In UNICEF, it would be useful to evolve a system of activities, expenditures, targets, outputs and impacts in a logical framework. Such a logical framework (logframe) would identify objectives, list activities and outputs and specify measurable indicators and means of verification (through surveys, monitoring reports etc.) for outcomes and impacts. This should be done for all major activities in water and environmental sanitation.
6. Given the low motivation for investing in sanitation by the poor people, UNICEF should review its policy regarding subsidies to hygienic toilets. Targeted subsidies for low-cost options for the poorest households may be justified since capital expenditure on toilets is a significant proportion of the cash expenditures of these poor households (as well as a high percentage of annual income for some households). This subsidy may come from the local Panchayat, rather than from State and/or Central Government resources.
References:
Evaluation and Applied Research Department, Madras. Tamil Nadu Agricultural Development Project-Base Line Survey Report on Rural Water Supply, August 1993.
Fouzdar, Dilip: A Quick National Assessment of the status of Ground Water, Serving as the Drinking Water Supply Source. WES- UNICEF.
Government of the Netherlands: Second Progress Report, The National Rural Water Supply and Environmental Sanitation Programme in India. UNICEF, April, 1998.
Nigam, Ashok, Biksham Gujja, Jayanta Bandyopadhyay, Rupert Talbot: Fresh Water for India’s Children and Nature. UNICEF, April 1998.

Page 28 of Annex 11
Parvati Consultants: A Report on Assessment of Hand Pumps Installed by Public Health Engineering Dept. Under CDD-Watson Project in Alwar District. UNICEF, Rajasthan. June, 1998.
PEC Submissions: India: Child’s Environment: Sanitation, Hygiene and Water Supply Project. UNICEF, Dec 1998.
Programme Evaluation Organization (PEO), Planning Commission, Govt. of India: Evaluation Report on Accelerated Rural Water Supply Programme, September 1996.
Rajiv Gandhi National Drinking Water Mission, Department of Rural Development, Ministry of Rural Areas & Employment, Govt. of India: Rural Water Supply Programme, Quarterly Progress Report, Sept, 1998.
Rajiv Gandhi National Drinking Water Mission, Department of Rural Development, Ministry of Rural Areas & Employment, Govt. of India: Monitoring And Evaluation Study in Respect of Rural Water Supply And Sanitation in the State of West Bengal. Department of Sanitary Engineering. All India Institute of Hygiene and Public Health, Calcutta.
Rajiv Gandhi National Drinking Water Mission, Department of Rural Development, Ministry of Rural Areas & Employment, Govt. of India: Monitoring and Evaluation Study of the Rural Water Supply and Sanitation Programme: Study undertaken by Ecotech Services in Rajasthan. ETS, August, 1998.
Rajiv Gandhi National Drinking Water Mission, Department of Rural Development, Ministry of Rural Areas & Employment, Government of India: Report on Monitoring and Evaluation Study of Rural Water Supply & Sanitation Programme, Tamil Nadu. Om Consultants (India) Pvt. Ltd., Bangalore, July 1998.
Samanta, B.B., Dipak Roy, T.N.Dutta: Survey on the Performance of India Mark-II Deepwell Handpump. Maintenance, Repair System and Costs. UNICEF. Operations Research Group, 1988.
Singh,B., R.Ramasubban, R.Bhatia, J.Briscoe and C.Griffen: Rural Water Supply in Kerala: How to emerge out of a low equilibrium trap?, Water Resources Research, 1993.

Page 1 of Annex 12
Annex 12: Results from the Participatory User Assessment
India is the second largest country of the world and covers a sub-continent. A study would have to cover a very wide range of physical, social, cultural and economic conditions to begin to approach some kind of statistically meaningful representation of the whole picture. Obviously that kind of assessment was not possible within the timeframe and resources of the present evaluation. The findings summarised below should therefore be taken only as a global indication of the kinds of effect that the UNICEF programmes may have achieved on the ground, particularly as distinct from the GOI programmes by themselves. What follows does not, therefore, always take account of indirect effects where UNICEF pioneered approaches have been adopted wholesale by the Government, but rather stresses what is different in those specific project areas where UNICEF has worked.
The assessment was carried out in Rajasthan and Tamil Nadu. These states were chosen for a variety of reasons, not least because of their long and extensive history of UNICEF programmes. They also represent very different conditions. The Indian team who performed the field assessment and the international team responsible for the overall evaluation independently visited the same states and areas in these states (although not exactly the same villages and not all study districts). This allowed the cross-checking of consistency of the findings.
The user study was carried out by the Socio-Economic Units Foundation, an independent support centre on water supply, sanitation and hygiene. It covered eighteen communities located in two districts in the two states. In each state one district was chosen where UNICEF has long been active in WES activities and one comparable district in the same zone where only Government of India has carried out water and sanitation programmes. Thus the team went to Alwar and Jaipur in Rajasthan and Erode [previously Periyar] and Dindigul in Tamil Nadu. In each district the mix of villages was selected for size (large/small), character (degree of urbanisation), access (one isolated hamlet included) and mix of population. To avoid any impression of bias SEUF chose the districts independently from a list of UNICEF and non-UNICEF supported districts in the two states. For the same reason the Rajiv Gandhi National Drinking Water Mission provided the letter of introduction and the teams provided their own transport.
Instead of the usual KAP survey based on formal questionnaires, the study used participatory methods and tools to broadly assess the possible impacts of the programmes on the conditions and lives of the people. The methods and tools derived from the work on Participatory Learning done by the UNDP-World Bank Water and Sanitation Program to assess local management of water supply, sanitation and hygiene. The study team also used its earlier work with the London School of Hygiene and Tropical Medicine on assessing hygiene practices with participatory tools. The tools are described in Box 1.

Page 2 of Annex 12
Box 1 Participatory tools and techniques used in village assessments
Introduction to Panchayat authorities and review of general data: population size, composition and settlement (hamlets), basic infrastructure (water supply, schools, household sanitation coverage and types of latrines in poor and better-off households; other sanitation conditions, interventions in water, sanitation and health/hygiene).
Social mapping: quick lay-out of the village with main settlement areas, traditional and improved water sources and schools. Choice of sections for further visit.
School sanitation. Pocket voting by the children on handwashing practices. Visit to the school latrines and observe indicators of hygiene, maintenance and use, using an observation checklist. A good school latrine will earn up to ten marks. Data will be recorded separately for latrines for girls, boys and teachers and their numbers noted.
Transect walk to see how water points are divided over village and observe functioning and sanitation. Focus group discussion with male and female users in separate groups on water access, uses and meeting of needs and demands.
Matrix voting. Using a matrix of pictures of the available water sources, the women vote on what sources they use in summer and during the monsoon and what are the reasons for their choice. Water use practices are distinguished between water for drinking and cooking and other uses. Because of the time limits no detailed breakdown of other uses will be made.
Demonstration with their own utensils, the women assess the total amount of domestic water an average family uses for consumption and hygiene in the wet and dry season and if the amount differs for poor, middle class and high class families. Demonstrations also serve to assess disposal of child excreta and oral rehydration therapy.
Assessing change. In a focus group discussion men and women in age group 40 years and older describe what has changed in their village since they were 10-15 years old and reflect on what has changed. Opinions of women and men are noted separately regarding:
• the water supply situation
• the sanitation situation in homes and community
• the hygiene behaviour of women, children, men
• the water resources situation and patterns of water and land use
• the position of women
• the division of work and influence between women and men in water, sanitation and hygiene and the changes therein
• the forces that have brought about these changes

Page 3 of Annex 12
1. Drinking water supply
Rajasthan
In the eight villages visited in Rajasthan, the drinking water supply conditions are much the same, whether or not UNICEF has been involved. Villages have either only handpumps or handpumps and a piped system with public standpipes and private connections. Change in water supply actually came later in the UNICEF-supported villages, perhaps because the district with only the Government of Rajasthan programmes is closer to the capital and the UNICEF project in Alwar initially concerned sanitation, not water supply1.
Two years ago an NGO started working for UNICEF in Alwar and at that time the PHED also drilled the wells and installed the handpumps. Access to the water systems is generally good in both areas. In three villages the users reported that all families could use handpumps, while in three others this was so for almost everyone (c. 90-95%). Where access is not good (in 2 villages especially) it is worse for the poor and in isolated hamlets with little political clout. The international team also observed this in another district.
Totally the eight villages have 15 handpumps of which 3 were out of order and one had a very low recharge. In all cases of broken pumps the affected villagers still had other handpumps or taps which they could use. The village with the low recharge in the UNICEF supported district has no second handpump. The women of this village, populated by two poor castes, Sapheras (c. 25 families) and Rebaris (c. 55 households) have reverted to a shallow unprotected well. Both well and handpump are on the outskirts of the village. The handpump was located there without consultation because it is a site for a new school, which has not yet been built.
The focus group discussions made clear that the men in the community take the decisions on the water systems. Women had little or no voice e.g. in suggesting the sites of handpumps or taps. Very recently, e.g. in Lalawundi in the UNICEF-supported district women have also started demanding suitable sites for their water points. They said that the government officials talk only to the village leaders or local politicians about the proposed construction or installation of water systems and that the women are not even approached for consultations, leave alone that they have a say in decisions.
While The PHED installs the facilities, maintenance is by the Block2. The functionality of the improved water supplies, say the users, is good in the villages with a UNICEF CDD-
1 In 1987 UNICEF began testing the sanitation package with 7 components and promotion of latrines and hygiene practices by motivators and folk media. An evaluation in 1993/4 gave a twice higher coverage than the control area and 60-100% of the practices adopted. The approach became part of the revised guidelines for the Centrally Sponsored Sanitation Programme of the Government in 1992.
2 In addition the PHED does a yearly round of repairs, which makes the division of responsibilities and accountability for the situation rather unclear.

Page 4 of Annex 12
WATSAN programme and worse in the communities where no special programme is carried out. When piped systems, (which are a recent development), experience motor pump problems, it usually takes two weeks for the system to come back on again; fortunately there are handpumps available during this period. It is not possible to cross check the users’ information on system functionality against data on maintenance and repairs, as there are no records on servicing, repairs and downtime. Users with house connections pay, but neither union Panchayat nor water department is accountable for maintenance performance to the Panchayats and the users they serve.
The Panchayati Raj system under which the villagers will manage their water supplies, sanitation and hygiene started this year. In the UNICEF-supported CDD-WATSAN communities, an NGO engaged by UNICEF has started to form village water committees and train community mechanics and caretakers. In one of the communities the training was going on during the visit. Both committee members and mechanics are women.
The voluntary nature of these jobs raises the question of gender balance. In principle, this training provides more access for women to technical skills and administrative control over their drinking water supply, provided the water committees are effectively linked to the Panchayats. Against this benefit, these voluntary jobs require time and energy which may keep women from work which is directly compensated.
In all villages, whether CDD-WATSAN or not, drainage of waste water at water points was observed to be universally dismal and community management of drainage water non-existent.
Tamil Nadu
In Tamil Nadu the service level in water supply is higher. All study villages in the two districts have both piped water supplies and handpumps and often also a traditional source (open public well, pond). Access to the services is almost universally good (100% in eight of the nine villages according to the transect walks and the knowledge of the various focus groups.) But the quality of the installation and of the service in the district without UNICEF programme is very poor. Three of the schemes were built about one and a half years ago under government financing (JRY). Standposts have no taps, and when water is available, it flows continuously for 30 minutes to 1-2 hours a day. The women try to stop it by plugging the taps with pieces of wood. The users have often complained to the Union Panchayat, but to no avail. Private connections have PVC caps, not taps. Where the tap water is saline (two schemes) the women use it for washing and collect drinking water from the handpumps. In one community they also buy drinking water at Rs.0,50 per pot at a private irrigation borehole. In another, the piped water supply fails in May and the women have to walk very far. Drainage is lacking and where taps are present but broken they have remained so for over a year. The local men and women did and do not participate in the planning, installation and maintenance of their water supply: the responsibility rests with the Union Panchayat.
The men and women who took part in the assessment sessions in the Tamil Nadu areas assisted by UNICEF were poorly informed about CDD/WATSAN, hand pump maintenance and other projects in their community. They have not yet attended any training. Voice and choice in decisions is minimal or totally absent. According to the users, it is usually the government officials and political leaders who take decisions on services, choice of technology, and location of facilities without consulting either men or

Page 5 of Annex 12
women. To settle political scores local politicians in one community influenced the water department to install a handpump at a far away place from the hamlet, near a cemetery, making it difficult for the villagers to draw water from this point. They especially dislike going there at hours that there is no full daylight.
2. Human excreta disposal
Rajasthan
Although generally still very poor, the excreta disposal situation has improved somewhat in the UNICEF-assisted CDD-WATSAN districts. In Rajasthan one tenth and one third of the households in two of the four villages have built latrines of the double-vault pour-flush type. Owners are of all socio-economic levels. The latrines are all in use and were observed to be well-maintained. According to the mothers, the smaller children are also using the latrine. In the district without the UNICEF-assisted CDD-WATSAN programme, progress is less visible. Three villages have no latrines. In one village about eighty percent of the households had a latrine installed under the Centrally Sponsored Rural Sanitation Programme. None of these latrines are used. The households concerned said they were afraid the latrine pits would get filled up.
In the focus group discussions the mothers were invited to mime in demonstrations the way in which they handle the excreta of infants. In both districts mothers showed they use the same ways to dispose of infant stools: they cover them with soil or they throw them into the garbage pit, and, in one village, into the yard. Some women have a special wooden spatula with which they pick up the infant excreta before throwing them with the garbage. This is a traditional practice in some villages but not in others, and is not typical for the UNICEF-supported district.
Tamil Nadu
The user assessments in Tamil Nadu showed a similar lack of progress in safe disposal of human excreta, with very slightly better progress in the UNICEF- supported district. The transect walk and discussions with Panchayat members and groups of women and men showed that in three of the five villages without a UNICEF supported programme, only a few households have built a latrine. The householders do not, however, use them regularly because of lack of water for flushing. The men and women in the other communities also mention the poor water supply as a constraint for installing latrines, and they instead use the open field. In two communities with drainage channels, these are also used for defecation and garbage disposal resulting in blockage and insect breeding.
In the communities of the UNICEF supported districts the excreta disposal situation was slightly better. In two communities half or more of the families have a latrine. The usage problems, however, are the same. Adult men and women do not use the latrines consistently because of the problems with the water supply. Children simply do not use the latrine.
In Tamil Nadu some of the visited Panchayats in the CDD/WATSAN area had taken some initiatives to improve public sanitation. These included: provisions for drainage; the

Page 6 of Annex 12
collection, transport and dumping of solid waste which the households collect in bins or pits; and the construction with government finance of a public toilet with separate facilities for women and men. In one Panchayat the users themselves had made household drainage provisions. Drainage at taps and pumps is better than in the areas visited in Rajasthan.
3. Hygiene
Rajasthan households
The women and men in Rajasthan are unanimous in their views that the introduction of the handpumps has improved water collection and hygiene in their communities. Assessing water consumption in focus group discussions with the help of real pots the women arrived at a daily use of thirty to fifty pots per household. With an average household size of six this works out at a water consumption of between 50 lpcd and 75 lpcd, which would support the plausibility of increased water use for hygiene. In villages with cattle, the consumption is twice as high.
To reduce incidence of diarrhoea, the most important behaviour next to improved sanitation is handwashing with a scrubbing agent (or firm rubbing) and a fair amount of flowing water. To assess and discuss handwashing practices, the study team used either pocket voting, or demonstrations by women, (school)children and men. For assessment by demonstration, the facilitators asked the participants to collect the implements they use from their houses. Participants brought out water, ash, soap and rags. Soil, which is also used, was taken on the spot. The facilitator then asked the participants to demonstrate their habits, and to explain when they practised them.
These demonstrations showed slight but consistently better handwashing habits in Alwar, the UNICEF-assisted district. In three villages one tenth to one third of the women wash hands with soap and in one community some children also wash with soap. Men and women also widely demonstrated the use of ash for handwashing. In the villages in Jaipur (non-UNICEF supported district) the participants only demonstrated handwashing with mud.
The special need to wash hands not only after defecation but also before eating is widely known, and people generally say that those are the times when they wash hands. Whether this is indeed the case is hard to establish in such a short session without much time to build strong rapport. (The limited time was partially offset by the support of two local teachers – one woman, one man - who spontaneously joined the team as voluntary facilitators.) The results that not everyone reports the same “ideal- behaviour” and that ash and soap can be readily shown do however give the impression that better behaviours are to some extent practised. The demonstrations also indicate that women show the best practices. Practices of children, and practices and responsibilities of men in hygiene are unclear. The best handwashing knowledge of all study villages was demonstrated in the two UNICEF-assisted communities of Rajgarh Block, where all state they wash hands before meals and women wash hands (but with water only) before hand-feeding young children. None of the women anywhere state that they wash hands before starting cooking.

Page 7 of Annex 12
In all visited communities the households have and use garbage pits, but there is no village drainage. The increased access to water has also improved personal and domestic hygiene according to the villagers. Observations of the team support this, with somewhat better hygiene in the villages under ‘total sanitation’.
Tamil Nadu households
In Tamil Nadu the projects under UNICEF have also raised water consumption according to the users to around 60 l/c/d. Risky practices in water collection (in which hands touch the water itself) have continued.
“Book knowledge” of women and men on hygiene is high. Many women as well as men listed the various ideal practices they had learned. But the ideals were not practised during observations and demonstrations, and the men and women who took part could not relate their theoretical knowledge to what they were doing every day.
4. School Sanitation
Rajasthan
In Rajasthan the team met with students and teachers and saw the facilities in three schools under the UNICEF programme and one school not under this programme. All schools were co-educational and had female and male teachers. In all three schools in the UNICEF programme, both male and female teachers have received training on sanitation and hygiene. Two schools received a school latrine and urinals. In one school the demand had been high, especially from the female teachers and the girl students. The school had contributed one third of the installation cost of Rs. 6000 from the Parent Teacher Association Fund. The block has been constructed last year. There is one latrine and one urinal for 250 boys, 100 girls, three male teachers and two female teachers. The facility is functional and in use, but signs of outside defecation and urination point to an insufficient number of facilities and/or lack of organisation of their use during class hours. In the other school, there had been no demand for a latrine and therefore there was no local contribution to the cost of the facilities. Here they were neither functional nor used.
In pocket voting sessions, the boys and girls could choose from various illustrated pockets to indicate how they and their parents wash hands at home. In all four sessions, the reported use of soap for handwashing was around 20-30% for boys and 30-40% for girls. According to the students, fathers and mothers use soap less often for handwashing. The students in the first school said the mothers also use ash, the fathers mud. This tallies with the outcome of the demonstrations by the fathers and mothers themselves. Overall the voting of the students confirmed the trends demonstrated in the communities where the schools are located.
Tamil Nadu
In Tamil Nadu the team visited four primary schools and two balwadis in the UNICEF supported district and one school and nursery school in the district with only Government

Page 8 of Annex 12
support. All schools have an almost equal number of boys and girls. The schools in the UNICEF districts had all received support from UNICEF.
• In the first school the teachers had attended a training course on sanitation and hygiene. The school had received toilet brushes and Phenol, but these are not used, as the school has no latrines, urinals or water.
• The second school has a model toilet. UNICEF donated a water tank and two water filters in 1992/3. The toilet is not, however, used by the students.
• In the third school, eight students and eight teachers attended a two-day UNICEF training on sanitation and hygiene. The school has 139 boys, 132 girls and nine female teachers, who share three toilets, one of which is broken. The other two are in use, but hygiene is poor, partly because the water supply does not work until the middle of the day.
• The fourth school has 346 boys and 320 girls and 20 teachers, 14 women and six men. The five toilets are for exclusive use by the teachers. Boys and girls may only use the urinals. The school gets water on alternate days. There are two water reservoirs: one for drinking, and one for other uses. UNICEF has donated 11 water filters for use in the classrooms. The people of the community gave the other two. The school is the only one with a School Health Club. It consists of a water handling group and three toilet cleaning groups. The water handling group is made up entirely of girls. The school has an angawadi with 25 girls and 25 boys, 2 female teachers and 2 assistants. UNICEF donated a child-friendly toilet, which has been in use for four months and is kept clean.
The primary school in Dindigul district where no UNICEF support is given has water but no toilets or urinals. The attached angawadi has no toilet or water but may share the water supply of the primary school. It has neither educational materials nor mats for the children for when they take their nap.
Handwashing with soap or ash being a key practice promoted by UNICEF the school visits included a group discussion or voting session with students –sometimes even facilitated by a student- on their habits. Results differed greatly per school (a range of 23% -97% on the use of soap). They were consistently better for girls than boys.
5. Oral Rehydration
Access and the appropriate use of oral rehydration solutions are key components of programmes to control diarrhoeal diseases, especially in children under five. In the assessment sessions with women, the team invited participants to demonstrate:
• how they prepare the solution,
• explain if they can and do get the ingredients and if so, from where
• when they give it (or not) and
• what else they do when their child has diarrhoea.

Page 9 of Annex 12
These sessions showed the greatest and most consistent difference between the communities with and without UNICEF WES support (Table 1).
Table 1: Level of knowledge, accessibility, skills development and use of Oral Rehydration Syrup (both home made and by package)
UNICEF supported district Other district
Women’s
sessions
Village
1
Village
2
Village
3
Village
4
Village
1
Village
2
Village
3
Village
4
Rajasthan
Knowledge
Access1
Skills
Use
+++
+++
+++
+++
+++
-
+
-
+++
+++
+++
+++
+++
+++
+++
-
-
-
-
-
+
-
-
-
+
-
-
-
-
-
-
-
Tamil Nadu
Knowledge
Access
Skills
Use
Not
Assessed
+++
+++
+++
+++
+++
+++2
+++
+++
+++
+++
+++
+
+++
no info
+++
+++
no info
+++
Not
assessed
Not
assessed
+++= general + some - none 1To ingredients or packages
2Ready made packages only, from health dept.
The mothers further state that diarrhoeas have become less common and that their frequency in both the summer and the monsoon seasons has reduced3.
3 Note that while ORT can be expected to reduce diarrhoeal mortality, as it prevents death from dehydration, it is unlikely to have any effect on the spread of the disease. Other preventative components of CDD-WATSAN (e.g. improved hygiene, better excreta disposal, and improved water supply) can contribute to reduced disease prevalence.

Page 10 of Annex 12
6. Changes over time
Rajasthan
Looking back over one generation the women and men in the study communities in the UNICEF-supported Alwar district pointed out a number of improvements. Access to water has improved and so has health for children. The ICDS facilities (Integrated Child Development Strategy) are perceived as especially beneficial for children and mothers. Residents also value the knowledge and skill of oral rehydration therapy that mothers have obtained. According to the women in villages with a CDD-WATSAN programme, diarrhoeas are less common and their frequency in both the summer and the monsoon seasons has reduced.
Home hygiene and food hygiene have improved, but not sanitation and drainage. Water access is still poor in some places, and water availability and sometimes its quality inadequate. The handpumps break down frequently and repair takes too much time. Information on various development schemes for rural groups is not easily available. In the non-UNICEF supported villages, the two changes mentioned most frequently were the improved water supply and the reduced family size as a result of the family welfare programme.
Tamil Nadu
In Erode the women and men in the focus groups also mention the improved water supply (though not in all villages). In two villages there is now better access to medical services and to schools. In one village all girls now go to school. The two villages with latrines (including one with an additional community latrine) see this as a step forward. The lack of water, however, resulting from too many households per public tap and very short service hours, makes it impossible to use and maintain them properly. The standard of living has improved a great deal.
Women’s Status
Great changes have occurred in women’s status. Women are now more educated and have their own groups. Girl infanticide has decreased (though the sex ratio in the Rajasthan villages is still very unbalanced). Many girls now attend school and in Erode district some go to the English middle school and to college. Women go to meetings and participate in other social activities and functions and this is better accepted in the society. Women’s fears are reduced and they feel more able to stand up against social evils. Although most working women still work as daily wage labour, younger ones seek secure jobs. In one village the female social worker made some outside contacts and helped the women start a weaving industry. One woman has opened a small shop.
But these improvements are not the case everywhere. Some groups of women told how they struggle with the ambition to keep their houses clean and hygienic while they lack water and space. Many women in the Dindigul villages cook outside to keep the inside of the house cleaner. Most children study only for senior secondary school certificate (SSLC) or pre-degree certificate courses (PDC) and then must stop, due to lack of money, lack of educational facilities nearby and social restrictions for girls. Dropping out

Page 11 of Annex 12
of school is more common for girls than boys. Women attend meetings but do not participate. As one villager noted, the younger generations find the restrictions unacceptable, “but they must obey the unacceptable opinion of all generations. Ours is a village of the old-fashioned. Caste differences are very much in evidence up to the point of untouchability in some aspects (separate water points for upper and lower castes). Ladies are afraid of the elders and other men and very reluctant to attend meetings. Children are also restricted”.
7. Summary
Women, men and school children in eighteen communities joined the study team in assessing the impacts of the UNICEF programme on water supply, sanitation, hygiene, diarrhoeal diseases control and their lives in general. These were spread over two districts of Rajasthan and two of Tamil Nadu. For the assessment they used participatory methods and tools. The results of this assessment suggest that UNICEF has made a modest start on impacting the sanitation and hygiene practices of the primary stakeholders. The men and women in the villages report that, compared to the past, the water supply situation has improved. This has especially led to more water use and better personal and domestic hygiene. Other improvements in the thirty years of the UNICEF programme are:
• better education, also for girls;
• in some places better health care facilities; and
• a less restricted life for women, although the latter is not the case in the more conservative communities. Here also caste restrictions are strong.
The assessment confirms the shift towards a mix of water supply systems and a lack of community participation and holistic management of the services. They show that piped supplies offer little improvement if installed with the present procedures and institutional system.
The user assessments show a very slight but consistently better situation in excreta disposal and some signs of better handwashing in those communities assisted by UNICEF’s CDD-WATSAN programme. Mothers in some villages practice traditional methods of safer disposal of infants’ stools, but these are not promoted by the programme. Practices of women have been addressed more directly and relatively more effectively than those of children and men. Promotion of hygiene has not yet made the shift from transferring theoretical understanding to helping women and men identify their own risky conditions and practices and making measurable self-improvements.
Promotion of ORT has been practical and quite successful. Most women say they know the method, have easy access to it, use it when the children have diarrhoea; they say it has drastically reduced diarrhoeas. (As noted earlier, ORT is expected to reduce the dehydration from the diarrhoea and its consequences, rather than reduce the transmission of the disease). They can also effectively demonstrate the preparation.

Page 12 of Annex 12
Success in school latrine programmes appears to demand a number of conditions: the programmes should be demand-based, with schools and parents contributing; the ratio of facilities to girl and boy students are adequate; and the school (teachers, and school health clubs) accept responsibility for the management of use and maintenance. In general the UNICEF-supported school sanitation programmes visited do not appear very successful.

Page 1 of Annex 13
Annex 13: UNICEF’S Contribution to Rural Water Supply Programmes in India
Although the major contributions of UNICEF have been in providing strategic assistance to the governments and NGOs (as discussed elsewhere), UNICEF has also contributed, directly and indirectly, to the total expenditures in water and sanitation sector in India.
In India, UNICEF is contributing about 2.2 percent of the total government expenditure in water and sanitation sector. In six states (Andhra Pradesh, Madhya Pradesh, Orissa, Rajasthan, Uttar Pradesh and West Bengal), UNICEF’s expenditures on rural water and sanitation in 1997 and 1998 varied from 1.1 percent to 5.7 percent (UNICEF: PEC Submission; 1998).
1. UNICEF’S Contribution to Rural Water Supply
As mentioned earlier, UNICEF’ s direct contribution to rural water supply programme in India consisted of provision of drilling rigs and support to handpump development and production. UNICEF’s direct contribution to the rural water supply programme is much more significant than what is implied by the share of UNICEF expenditure to the total government expenditures (varying between 2 percent to 5 percent) in rural water supply.
For example, during the five-year period 1985-89, UNICEF’s commitment was $ 19.8 million for well drilling and $ 7.4 million for handpump installation, maintenance and rejuvenation. This was about 50 per cent of the total commitment of $ 56.4 on the water and environmental sanitation programme.
Drilling Rigs for Borewells
As mentioned elsewhere, UNICEF has supplied 330 rigs to the rural water supply programme in India between 1967 and 1997. During 1969-1974, UNICEF procured a total of 139 drilling rigs at total capital investment of US $ 5.9 million. In 1976, UNICEF supplied rigs (155) were about one-half of the total state-supplied rigs operating in the rural water supply programme. In 1998, UNICEF supplied rigs were about 20 percent of the total (162 out of 807). In addition to these, there were 155 old generation rigs procured during 1969-74 available for use in 1998.
If each rig is estimated to drill about 100 successful borewells per year, this gives a figure of 80,700 borewells installed by state agencies during 1998. In addition, private contractors are estimated to have constructed about 45,000 borewells for public handpumps during 1998. In addition to these, there are private borewells and handpumps, for which the figures are not available.
2. UNICEF Expenditures
During the five-year period 1985-89, UNICEF’s commitment was $ 19.8 million for well drilling and US $ 7.4 million for handpump installation, maintenance and rejuvenation. This was about 50 per cent of the total commitment of US $ 56.4 million on the water and environmental sanitation programme. For the period 1991-95, commitments of US $30.6 million for water supply programmes (drilling and handpumps) accounted for about 40 per cent of the total commitments to WES programmes.

Page 2 of Annex 13
Table 1 presents available data on UNICEF expenditures (actual/planned) on WES for the years 1991 to 1996. It may be noted that the data for actual expenditures is available only for three years 1991-93. These data are not comparable over time because these are in nominal terms and do not take into account the effect of inflation. However, this is not serious because changes in dollar conversion rates partly take into account local inflation.
UNICEF expenditures increased in nominal terms from 1991 to 1996, with the exception of 1993. Water Supply expenditures increased substantially from 1991 to 1995; but declined in the next two years. There was a substantial decline in planned expenditure in 1997 compared with 1996. Table 1 shows that:
• The share of Water Supply in total WES expenditures increased from 26% in 1991 to 54% in 1993 and declined to 19% in 1996. The planned share for 1997 was 40% of the total WES expenditures
• Expenditures on Swach programme declined, as planned, from about US $ 2 millions to none in 1996.
• MIS and project management have been around 10 to 19 percent of the total WES expenditures.
Table 2 presents data on actual expenditures and budgeted expenditures. These data are available only for three years 1991, 1992 and 1993. Table 2 shows that there are wide fluctuations between actual and budgeted expenditures. In 1991 actual as percent of budgeted were very low 23 to 45% in different sub-sectors. In 1992, actual expenditure in water supply was 110 percent of the budgeted expenditure while in communication and social mobilization, it was only 39 percent of the budgeted expenditure.
In 1993, also, actual expenditure on communication and social mobilization was only one-third of the budgeted expenditures. Based on these figures, the following comments may be made.
• This mismatch between budgets and expenditures shows uncertainty of receiving matching funds by UNICEF on its various programme activities.
• This mismatch, perhaps, shows a lack of proper "programme planning" and "programme execution". A continuation of such a mismatch would require probing into the reasons for this and the effects it had on achievements.
• This reflects the changed nature of the programme, from hardware (drilling, equipment, spares) to software and research and development.
• This mismatch perhaps also reflects the lack of adjustment of UNICEF rules on investing in UNICEF human resources and HRD and a lack of a strategy on partnership (which is by far not the same as hiring consultants).
It is hoped that UNICEF will be able to utilize donated funds fully and utilize them well by
• Expanded staffing of UNICEF,
• More and better quality HRD,
• Longer-term partnerships with fewer NGOs,

Page 3 of Annex 13
• Building partner networks with standards of performance to be met on both sides, including comparison of progress and results of R&D projects on commonly agreed denominators, investing in quality development of partners, and,
• Strengthened UNICEF training capabilities and programmes including for in-house staff.
Table 3 provides data on major components under WES expenditures in UNICEF for 1995. In 1995, the only year for which disaggregated data are available, financial support to drilling and HFU and well rejuvenation accounted for about one-third of the total planned expenditure on water supply. HP tools and HP quality control accounted for about US $ 0.6 million or about US $ 6.6 millions of the water supply expenditures. Details for the remaining portion of the WES expenditures were not available.
Table 1: UNICEF Expenditures on WES and Total - Actual and Estimated
UNICEF Expenditure on WES and Total ('000 US $)
Actual Estimated Planned Allocation Requirement
Year 1991 1992 1993 1994 1995 1996 1997 1998
1786 6442 6537 8058 8933 4346 5298 4855Water Supply
26% 40% 54% 49% 41% 19% 40% 40%
850 2713 2323 3998 5289 930 4412 4210 Environmental Sanitation
12% 17% 19% 25% 24% 4% 33% 35%
544 527 526 708 1475 486 1123 1437 Social Mobilization
8% 3% 4% 4% 7% 2% 8% 12%
1314 931 1.4 0 0 0 0 0Swach Prog-1
19% 6% 0% 0% 0% 0% 0% 0%
714 1165 381 427 108 0 0 0Swach Prog-2
10% 7% 3% 3% 0% 0% 0% 0%
415 2864 645 866 1435 14992 40 0Integrated Project for GW Control (IGEP) 6% 18% 5% 5% 7% 66% 0% 0%
1320 1538 1604 1803 3772 2097 2385 1499 MIS & Project Management
19% 10% 13% 11% 17% 9% 18% 12%
T O T A L 6943 16180 12117 16298 22036 22850 13259 12001
Source: UNICEF SHEETS, Programme Summary Sheets, Programme Summary

Page 4 of Annex 13
Table 2: Expenditure by UNICEF (Actual and Budgeted)
Year 1991 1992 1993
Actual
Budgeted Actual % of Budget
Actual
Budgeted Actual % of Budget
Actual Budgeted Actual % of Budget
Water Supply 1,786 5,301 33.7 6,442 5,833 110.4 6,537 6,981 93.6
Environmental Sanitation
850 2,927 29 2,713 3,220 84.3 2,323 3,854 60.3
Communication & Social Mobilization
544 1,222 44.5 527 1,341 39.3 526 1,604 32.8
Integrated project for GW Control (IGEP)
415 1,825 22.7 2,864 2,006 142.8 645 2,401 26.9
Total 3,595 11,275 31.9 12,546 12,400 101.2 10,031 14,840 67.6
Table 3: Details of Plan Expenditure on Water Supply - 1995
Year ('000 US$) ( % )
Water Supply
Environmental Sanitation Support to Drilling and HFU fleets 1289 14.4
Social Mobilization New well construction / Rejuvenation 1277 14.3
Swach Prog-1 Water bore management/ Capacity building 165 1.8
Swach Prog-2 Alternate Water sources 0 0.0
Handpumps tools / studies 230 2.6
HP quality control 356 4.0
Water Quantity Studies 35 0.4
Well construction/ Capacity building 277 3.1
Integrated Project for GW Control (IGEP)
Unprogrammemed Others 1080 12.1
TOTAL 8933 100.0
Note : Aggregate percentage of all components is = 52.7

Page 5 of Annex 13