Embed Size (px)
Citation preview
Learning from Denver’s FasTracks Experience
June 20, 2011
Background
• RTD created by legislature in 1969
• First light rail corridor opened in 1994
• Proposed expansion called “Guide the Ride” failed in 1997 (58% to 42%)
• Three light rail corridors opened – 2000, 2002, and 2006
• RTD began extensive outreach to develop new plan – “FasTracks”
• Needed .4% sales tax increase
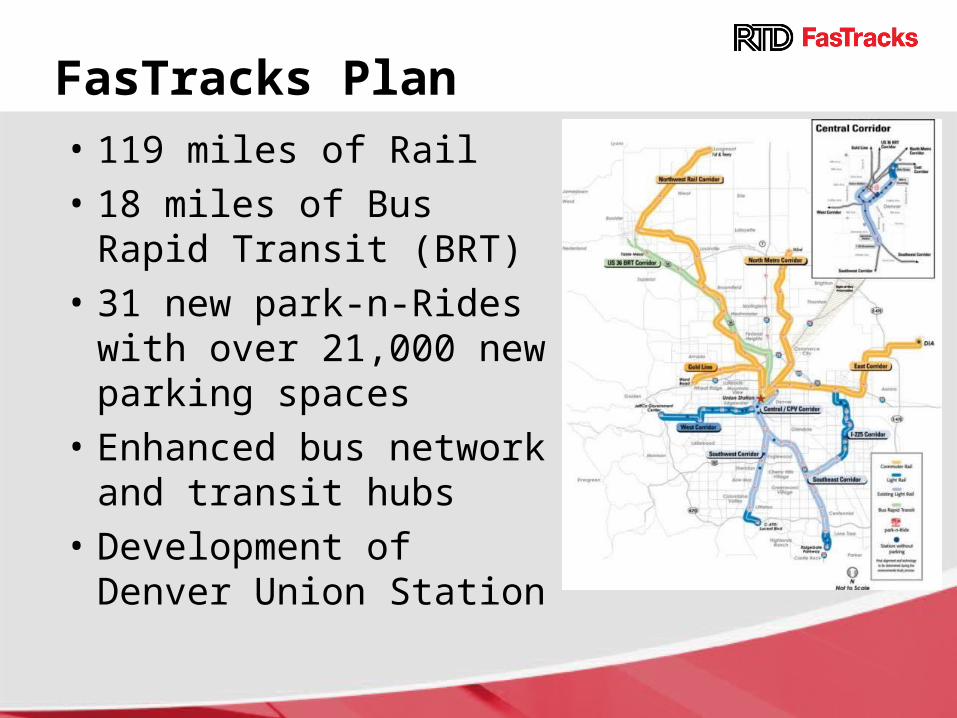
FasTracks Plan
• 119 miles of Rail
• 18 miles of Bus Rapid Transit (BRT)
• 31 new park-n-Rides with over 21,000 new parking spaces
• Enhanced bus network and transit hubs
• Development of Denver Union Station
Research, Research, Research
• Start early
• Avoid “talking to ourselves”
• Listen!
To gain knowledge regarding voter sentiment:
• 4 baseline surveys
• 20+ focus groups
• Tracking polls
Some Things We “Expected”
• Transit riders most likely to support
• Higher income households less likely to support
• “Republicans will never vote to increase taxes for transit”
• It won’t make a difference in “my lifetime”
Key Findings of Research
• Voters wanted something done now to address traffic – 12 years was “too long”
• Highways alone would not solve congestion
• Loved “the trains”
• General awareness of the success of light rail
• Voters did NOT know about the FasTracks Plan – needed major education piece
Key Findings of Research
• Once citizens learned about the Plan, they overwhelmingly supported it
• Perception: good transit equates to more prosperity, higher property values, and a better quality of life
• Transportation choices vs. actual transit use
• Be specific!
Key Campaign Messages
• “The time is now”
• Translate the cost –• 4 pennies on a $10 purchase
• The “Map” was key
• Can’t stop growth – need to plan for it
• FasTracks provides choices– TV visuals – traffic jams– Not ‘just’ commuting
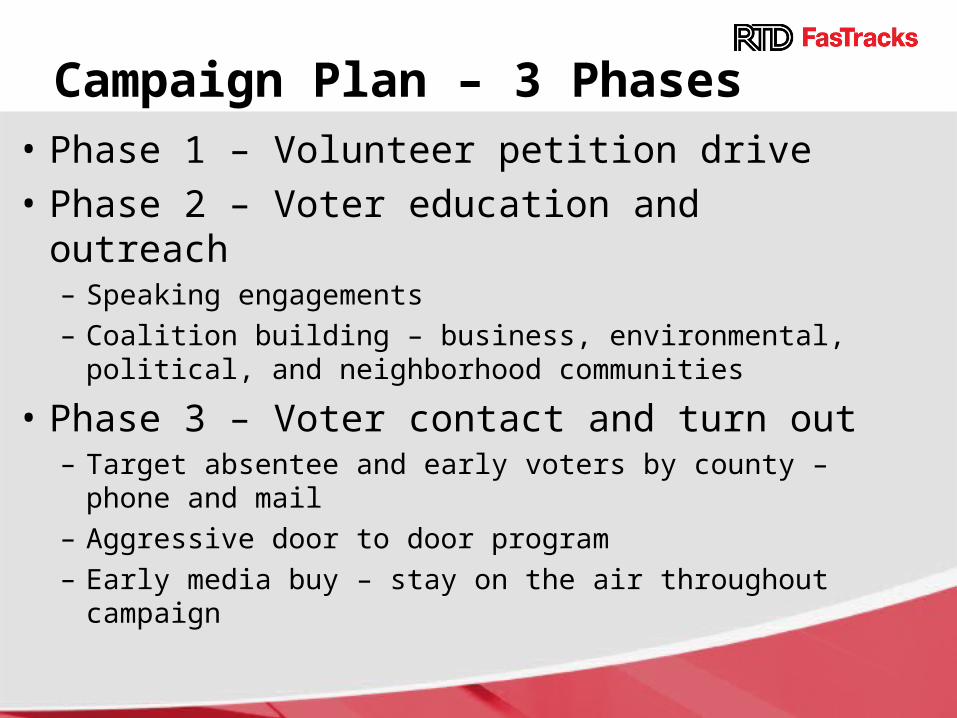
Campaign Plan – 3 Phases
• Phase 1 – Volunteer petition drive
• Phase 2 – Voter education and outreach– Speaking engagements– Coalition building – business, environmental, political,
and neighborhood communities
• Phase 3 – Voter contact and turn out– Target absentee and early voters by county – phone
and mail– Aggressive door to door program– Early media buy – stay on the air throughout
campaign
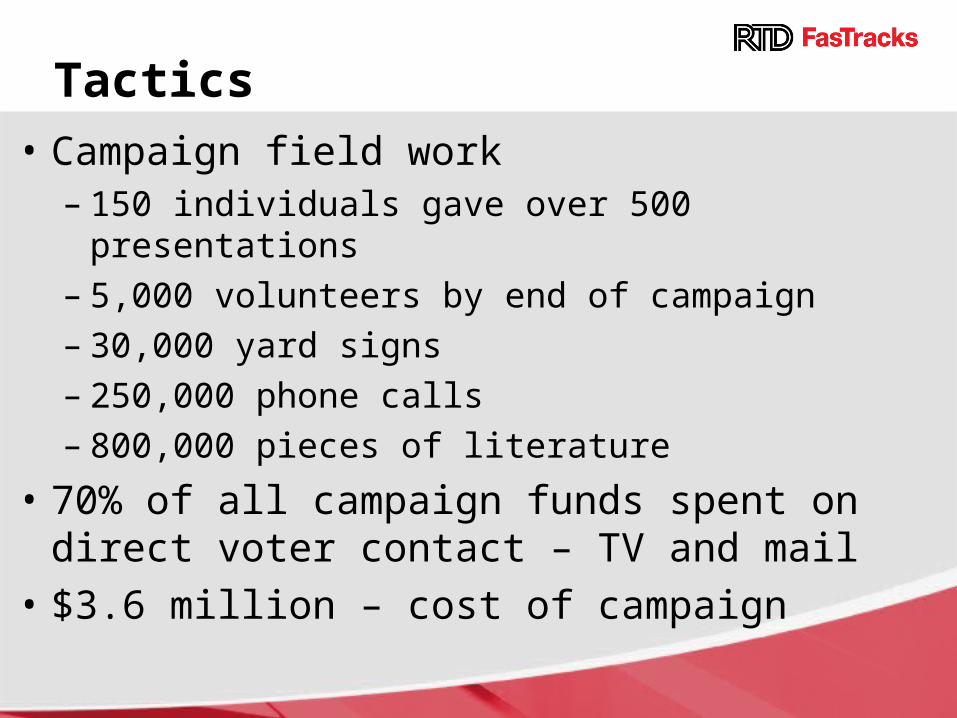
• Campaign field work– 150 individuals gave over 500 presentations– 5,000 volunteers by end of campaign– 30,000 yard signs– 250,000 phone calls– 800,000 pieces of literature
• 70% of all campaign funds spent on direct voter contact – TV and mail
• $3.6 million – cost of campaign
Tactics
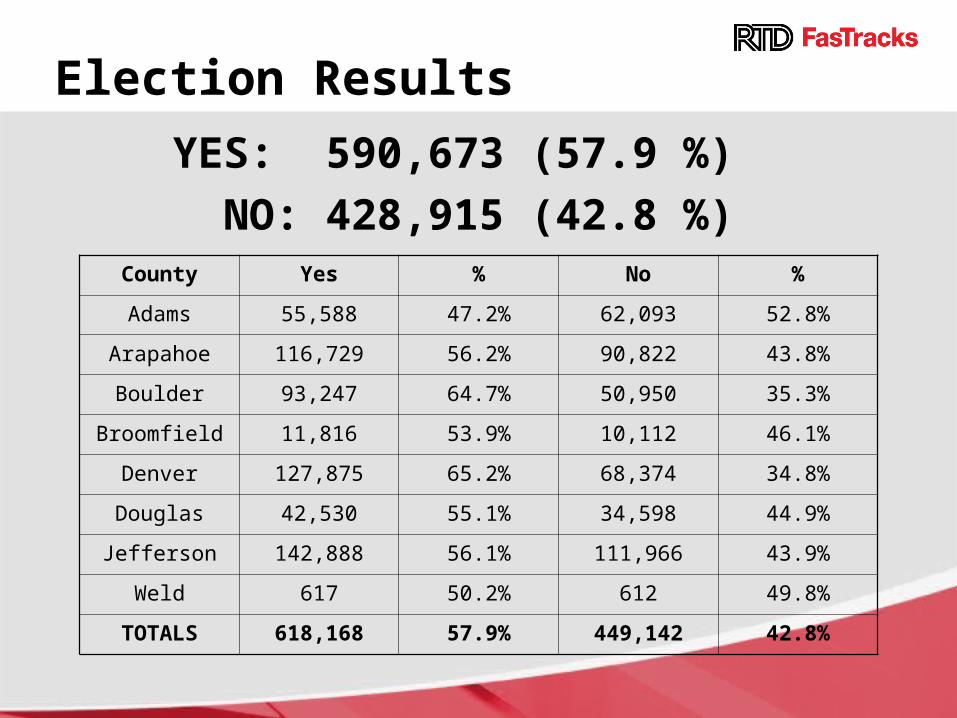
Election Results
YES: 590,673 (57.9 %)
NO: 428,915 (42.8 %)County Yes % No %
Adams 55,588 47.2% 62,093 52.8%
Arapahoe 116,729 56.2% 90,822 43.8%
Boulder 93,247 64.7% 50,950 35.3%
Broomfield 11,816 53.9% 10,112 46.1%
Denver 127,875 65.2% 68,374 34.8%
Douglas 42,530 55.1% 34,598 44.9%
Jefferson 142,888 56.1% 111,966 43.9%
Weld 617 50.2% 612 49.8%
TOTALS 618,168 57.9% 449,142 42.8%
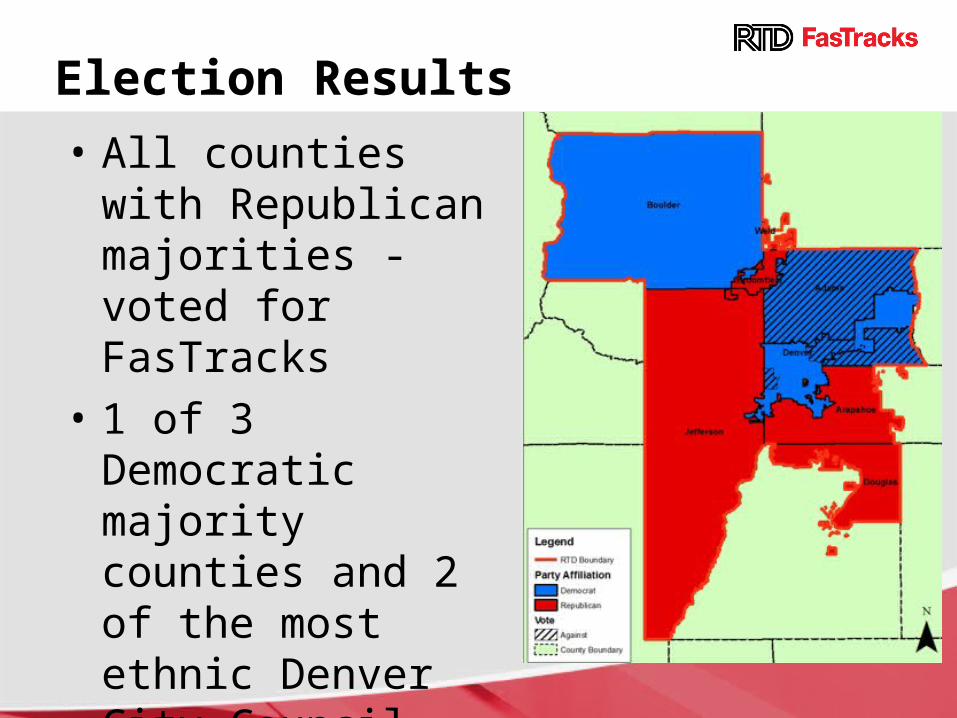
Election Results
• All counties with Republican majorities - voted for FasTracks
• 1 of 3 Democratic majority counties and 2 of the most ethnic Denver City Council districts - voted against
Keys to a Successful Campaign
• Started early
• Hired a professional campaign team
• Thought like a region, acted like a region
• Research driven
• All volunteer petition drive
• Built a very broad-based coalition
• Voter contact and education
• Timely purchase of television ad time
What Happened after 2004?
• “Perfect storm” of the economic downturn and rise in material costs caused budget shortfall
• Currently facing a $2.2 billion shortfall and, if no tax increase is approved, will not be completed until 2042
So, Where Do We Go Now?
• Traffic, transit and transportation have given way to economy and jobs as the most pressing concerns
• Compared to other public services and funding needs, completing FasTracks is not a high-intensity priority at this time
• Financial plan assumes a 2012 sales tax increase of .4 percent to complete FasTracks by 2020
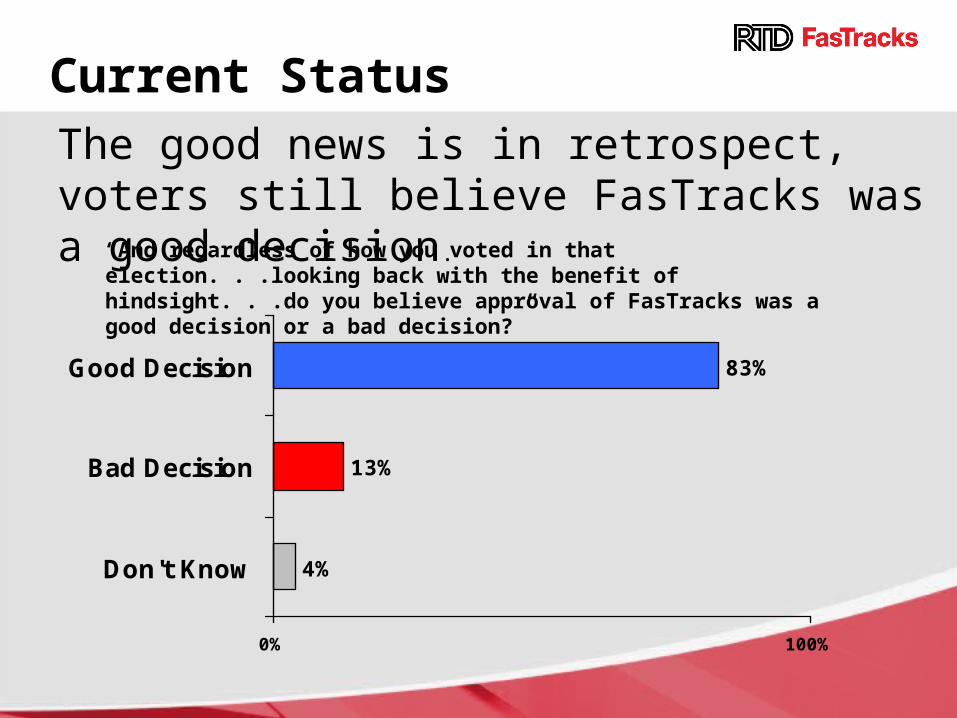
Current Status
4%
13%
83%
0% 100%
Don't Know
Bad Decision
Good Decision
“And regardless of how you voted in that election. . .looking back with the benefit of hindsight. . .do you believe approval of FasTracks was a good decision or a bad decision?”
The good news is in retrospect, voters still believe FasTracks was a good decision.
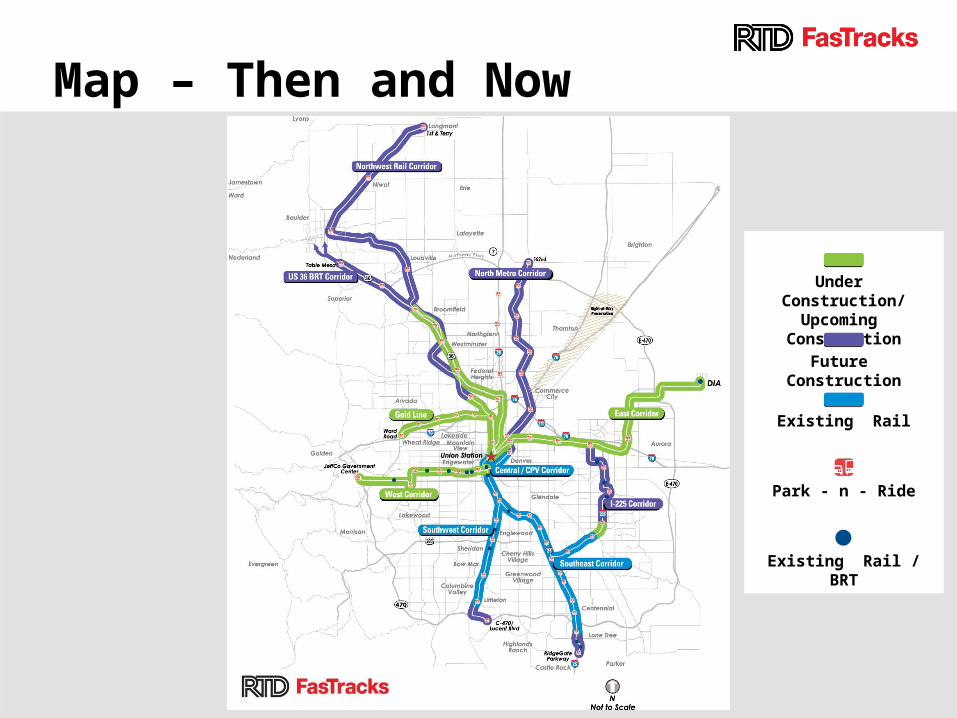
Map – Then and Now
Under Construction/
Upcoming Construction
Future Construction
Existing Rail
Existing Rail / BRT
Park - n - Ride
What is Different in 2011?
• 48 miles of new rail line currently in construction or under contract to begin construction– West Corridor: 75% complete– Denver Union Station: 30% complete– East Corridor (to DIA): Broke ground in August 2010
• All environmental processes complete
• RTD signed agreements with BNSF and UPRR
• Federal funding has been successful – FFGAs/Grants
Current Activities
• Education mode for agency• 18-month plan
• A study to ascertain positive/negative perceptions of RTD and FasTracks
• Focus Groups – test strategic messaging
• Develop marketing plan based on findings
Strategies Moving Forward
• Public information plan spanning 18 months
• Maximize federal funding opportunities
• Continue working with regional stakeholders and elected officials
• Research, Research, Research
• Start early for any ballot initiative
Conclusions
• Board of Directors will decide in early 2012 whether to pursue ballot initiative– Review research/survey results– Review Annual Program Evaluation
• Funding for campaign must come from community/businesses
• Outside campaign group will be formed
• RTD reverts to “information” providing mode
Denver FasTracks
Questions