Embed Size (px)
Citation preview

Learning and Scholarly Technologiesat the University of Washington:Report on the 2008 Faculty, TeachingAssistant, and Student Surveys
April 2009

Learning and Scholarly Technologies at the University of Washington (April 2009)
PROJECT CONTRIBUTORS Project Leaders Alisa Hata, Interim Deputy Chief Operating Officer, UW Technology Greg Koester, Project Manager, Learning & Scholarly Technologies, UW Technology Cara Lane, Research Scientist, Learning & Scholarly Technologies, UW Technology Tom Lewis, Director, Learning & Scholarly Technologies, UW Technology Karalee Woody, Director, Learning & Scholarly Technologies, UW Technology Report Authors Cara Lane, Research Scientist, Learning & Scholarly Technologies, UW Technology Henry Lyle, Graduate Student Assistant, Learning & Scholarly Technologies, UW Technology Janice Fournier, Research Scientist, Learning & Scholarly Technologies, UW Technology Claire Connell, Graduate Student Assistant, Learning & Scholarly Technologies, UW Technology
Steering Committee Gerald Baldasty, Interim Vice Provost and Dean, The Graduate School Jim Loter, Associate Vice Provost, Community & Partnership Development, Office of Information Management Scott Mah, Associate Vice President, UW Technology Services, UW Technology Jill McKinstry, Director, Odegaard Undergraduate Library, UW Libraries Greg Miller, Professor, Civil and Environmental Engineering Tom Norris, Vice Dean for Academic Affairs, School of Medicine Oren Sreebny, Executive Director, Emerging Technology, UW Technology Mary Pat Wenderoth, Senior Lecturer, Biology
Working Group Janice Fournier, Research Scientist, Learning & Scholarly Technologies, UW Technology Henry Lyle, Graduate Student Assistant, Learning & Scholarly Technologies, UW Technology Bayta Maring, Research Scientist, Office of Educational Assessment Tammy Stockton, Director, Customer Services, UW Technology Services, UW Technology Jennifer Ward, Head, Web Services, IT Services, Information Technology Services, UW Libraries Survey Analysis Cara Lane, Research Scientist, Learning & Scholarly Technologies, UW Technology Henry Lyle, Graduate Student Assistant, Learning & Scholarly Technologies, UW Technology Deb McGhee, Research Scientist, Office of Educational Assessment Project Support Devon Bursch, Student Assistant, Learning & Scholarly Technologies, UW Technology Nicole Wedvik, Student Assistant, Learning & Scholarly Technologies, UW Technology Cathy Wu, Student Assistant, Learning & Scholarly Technologies, UW Technology
Acknowledgements We would like to acknowledge the following former UW Technology professional and student staff members for their contributions to this project: Louis Fox, for helping initiate the project; Bill Corrigan, Melanie Kill, and Melody Winkle, for participation on the working group; Ralph Smith, for contributions to data analysis and participation on the working group; and Greg Brandt, Deborah Johnson, and Vanessa Mark for project support. We would also like to thank Kirsten Foot, Associate Professor in the Department of Communication, for her advice on the research management and collaboration portion of the survey and Lauren Manes, Interaction Designer in Learning & Scholarly Technologies, for her help editing this report.
Learning and Scholarly Technologies at the University of Washington (April 2009) 2
EXECUTIVE SUMMARY
In order for the University of Washington (UW) to provide essential technology resources and services that meet the changing needs of the UW community, it is vital to gather reliable information about evolving trends. To this end Learning & Scholarly Technologies partnered with other UW Technology units, UW Libraries, UW Teaching Academy, the Office of Information Management, the Faculty Council on Educational Technology, the School of Medicine, and the Office of Educational Assessment (OEA) to survey faculty, teaching assistants (TAs), and students in spring 2008 about their technology use and needs. This is our third triennial survey on this topic.
The data we share in this report reveal the complexities of technology and support needs at the UW, going beyond the personal anecdotes which can often dominate technology discussions. This report will be valuable to anyone who wishes to increase their understanding of technology use and users’ needs. We summarize key findings below.
Uniformity of Current Technology Use—We found that technology use was much more uniform than we had anticipated: a few technologies were widely used across contexts and goals, while others were seldom used.
The Need for Infrastructure Improvements—The highest priorities for faculty, TAs, and students involved infrastructure. Improvements to classroom equipment and wireless access were at the top of the list for all populations. Students also prioritized enhancements to campus computer labs.
Point‐of‐Need Support—Faculty, TAs, and students all relied on sources of support that were available at the point of need. They first looked to knowledgeable peers for support then to online resources. These sources of support were among the most consistently used by all respondents and the sources rated as the most helpful.
Integrated and Flexible Online Technology—Faculty and TAs desired greater integration of online tools and aggregation of information about available tools and resources. Technologies supported centrally at the UW need to integrate easily with each other, as well as with other online tools or department‐created solutions—since there is no “one‐size‐fits‐all” solution to meeting faculty, TAs, and students’ technology needs.
Unique Needs of Faculty, TAs, and Students—There were specific areas where faculty, TAs, and students had unique needs and support challenges. The main challenge going forward in supporting faculty in their use of learning and scholarly technologies is how to help them better understand their options and opportunities with the technologies available to them. For TAs, it is important to support them while they are at the UW, while simultaneously helping them develop technological knowledge that can transfer to other settings. The main challenge in student support involves understanding how they are using technologies, particularly emerging ones, to support their learning.
Learning and Scholarly Technologies at the University of Washington (April 2009) 3
INTRODUCTION
The vision and values of the University of Washington (UW) spotlight the process of discovery, which permeates all aspects of academic life. The 2008 Surveys on Learning and Scholarly Technologies are a part of this process, but the discovery they promote is introspective; they help the UW understand the growing role that technology plays in our teaching, learning, and research activities. Technology is a vital component of the cutting‐edge scholarship we at the UW seek to promote, the vibrant intellectual community we wish to provide our students, and the spirit of innovation we strive to engender. In order for the UW to provide essential technology resources and services that meet the changing needs of the UW community, it is vital to gather reliable information about evolving technological trends.
To this end, the 2008 Surveys on Learning and Scholarly Technologies provide valuable data about where and how faculty, teaching assistants (TAs), and students use technology to meet their teaching, research, and learning goals. This focus on where and how technology is used, rather than simply what technologies are used, makes these surveys unique from previous surveys conducted at the UW. The survey data allow detailed comparisons of technology use across various teaching and learning contexts (e.g., “large lecture,” “seminar/small discussion‐ based class,” or “field experience”), as well as comparisons of use based on teaching and learning goals (e.g., “help students understand content knowledge” or “cultivate community and connection”). In addition, the surveys identify the sources of technical support that faculty, TAs, and students find most useful, reveal the obstacles to using technology that they find most challenging, and ascertain their priorities for the future. The faculty survey also shows how faculty members use technology to support research management and collaboration. The overall goal of the surveys is to provide detailed, timely information that will help the UW make informed decisions about where best to devote time and resources to technology needs over the next three years. Learning & Scholarly Technologies (LST) led the survey effort, in collaboration with other UW Technology units, UW Libraries, UW Teaching Academy, the Office of Information Management, the Faculty Council on Educational Technology, the School of Medicine, and the Office of Educational Assessment (OEA). The survey partners intend to use survey data to inform decision‐making and priority‐setting processes; our hope is that other units at the UW will consider doing the same. The data we share in this report both confirm and challenge conventional beliefs about technology use. Our discussion reveals the complexities of technology and support needs at the UW, going beyond the personal anecdotes which can often dominate technology discussions. This report will be valuable to anyone who wishes to increase their understanding of technology use and users’ needs.
In this report, we briefly outline the history of the surveys, describe our methods, share key findings, and discuss the implications of this data for the UW. In our presentation of findings, we not only compare faculty, TA, and students’ responses across all three surveys, but also explore differences in technology use based on discipline, technological expertise, demographics, and experience. In our conclusion, we identify unmet needs, highlight trends in
Learning and Scholarly Technologies at the University of Washington (April 2009) 4
the data that go against conventional wisdom, and point out needs for centralized or departmental services.
For those seeking additional information, copies of the survey and data tables are online: http://www.washington.edu/lst/research_development/research_projects/LSTsurvey.html
BACKGROUND
The 2008 surveys are part of a continuing large‐scale effort to assess technology use and needs at the UW, which began in 2001 with the first UW faculty survey on instructional technology.0F
i The 2001 instructor survey was followed in 2002 with a UW‐wide effort to examine students’ educational technology needs.1F
ii In 2005, LST and several UW units joined forces to design the first coordinated instructor and student surveys, which focused on understanding general technology skills and use.2F
iii Key findings from the 2005 survey included the following: (1) faculty respondents desired more opportunities to use technology to support their instruction, including better access to technology in classrooms; (2) TAs exhibited less interest in academic technologies than faculty members, undergraduate students, or other graduate students; and (3) undergraduate students wanted more course materials available online.
The 2008 surveys build upon past surveys, but are not longitudinal; instead questions target the current technology climate at the UW. For the 2008 surveys, we used data from focus groups to inform the design of the survey questions. The purpose of these focus groups was to ensure the relevance of our surveys to faculty, TAs, and students by allowing us to write survey questions that directly addressed their experiences and concerns. This approach was a departure from previous surveys, which held focus groups after the distribution of the surveys. In 2008, we also introduced a separate TA survey and added a section on research technology needs to the faculty survey. We limited the scope of the 2008 surveys to the Seattle campus, since the UW’s technology and support infrastructure differs substantially by campus.
The 2008 survey data also complement other investigative efforts at the UW that have occurred since our 2005 survey. In 2006, the Academic Technology Advisory Committee (ATAC) convened a subcommittee to assess future educational technology needs of faculty. The committee’s report found that faculty’s most pressing unmet need was for “appropriate and immediate support” in using the technologies available to them.3F
iv In November 2007, ATAC’s Researchware Task Force reported that various aspects of research at the UW worked against the selection of a “one‐size‐fits‐all” tool set and offered a description of the strengths and weaknesses of various technologies for different research tasks.4F
v In their November 2008 report, the Collaborative Tools Strategy Task Force outlined three specific challenges related to the use of collaborative tools: (1) lack of adequate support, (2) confusions about tool choice caused by insufficient information, and (3) a lack of interoperability between collaborative tools.5F
vi In February 2009, LST released a report on UW researchers’ IT needs, Conversations with University of Washington Research Leaders: Final Report.6F
vii The main findings from the
Learning and Scholarly Technologies at the University of Washington (April 2009) 5
Conversations project were that technical support and access to data management expertise were the most pressing need for researchers, followed by needs for technology to support data management and computation. As we report findings from the 2008 Surveys on Learning and Scholarly Technologies, we will point out data that speak to the findings from previous surveys and to the reports described above.
METHODS
This research involved three phases, beginning with focus group discussions, followed by pilot surveys, and commencing with our principal online survey instruments. In this section, we discuss the demographics, procedures, data analysis, sampling, content, and format of the focus groups and principal online survey instrument.
UFocus GroupsU
Focus Group Participants During autumn 2007 we conducted 13 focus groups. We held separate focus groups with faculty, TAs, and students; 20 faculty members, 10 TAs, and 20 undergraduate students participated. Participants were volunteers who responded to a recruitment email. The email was sent to a random sample of 900 faculty members who were listed as an instructor of record during the previous academic year, 600 graduate students with teaching appointments, and 800 current students. We had difficulty recruiting non‐TA graduate students to participate in focus groups, so we sent an online questionnaire with a list of open‐ended survey questions to graduate students; 17 students completed the questionnaire. Focus Group Procedures
Focus groups were 60 minutes long for students and TAs and 90 minutes long for faculty. Focus groups ranged in sizes of two to six participants. All participants received a $15 Husky Card credit as compensation for their time. The focus groups were confidential; we captured focus group data in typed notes without identifying information and did not maintain a link between individual participants and focus group data. We employed a dual‐moderator focus group method whereby one moderator brought up topics, while the other moderator took notes, managed time, and made certain each topic was covered.
Learning and Scholarly Technologies at the University of Washington (April 2009) 6
Focus Group Questions
In order to better understand the contexts in which participants used technology, we asked them to describe their teaching or learning goals within a particular academic context (e.g., “large lecture” or “online course”). We then asked what role technology played in helping them achieve those goals. Other questions addressed the supports and obstacles that participants encountered when using technology and the ways they felt technology at UW could be improved or enhanced. We also gave focus group participants an opportunity to share any ideas or concerns that we did not address directly in our questions.
Analysis of Focus Group Data
We analyzed notes from the focus groups to identify common themes within each population (faculty, TAs, and students) and across populations. This data helped us to design the pilot survey format and questions, as well as to determine the specific answer choices listed for each survey item. For instance, participants’ responses to the focus group question “How could technology at the UW be improved?” directly influenced the options listed on a pilot survey question about priorities for the future. The online pilot survey was administered to participants in person, in order to assess the readability and clarity of the survey items.
USurveys
Survey Participants
Our faculty recruitment sample included all individuals listed as an instructor of record during summer 2007, autumn 2007, and/or winter 2008, excluding UW graduate and undergraduate students. Since faculty members from Health Sciences are not always listed as the instructor of record, we collected names of faculty directly from Health Sciences’ departments. Our final recruitment sample included 3,499 faculty members. We had invalid email addresses for 119 of the individuals in our recruitment sample. On the faculty survey, 547 individuals responded for a response rate of 16.2%.
We randomly sampled 1,000 graduate students who held teaching assistantships during summer 2007, autumn 2007, and/or winter 2008. We chose not to include all graduate students with teaching assistantships in our TA recruitment sample so that some graduate students with TA appointments could be included in our recruitment sample for the student survey. We had invalid email addresses for 45 of the individuals in our recruitment sample. On the TA survey, 233 individuals responded for a response rate of 24.5%.
Our student recruitment sample included 5,000 graduate and undergraduate students who were enrolled as of the 10th day of class during spring 2008. We employed a stratified random sampling method, with stratification by disciplinary group. Our sample also reflected the
Learning and Scholarly Technologies at the University of Washington (April 2009) 7
percentage of students on campus who had not declared a major. The student sample was larger than the faculty sample, since students have historically responded in lower numbers to our surveys. Graduate students who were included in the TA sample were excluded from the student recruitment sample; however, some graduate students with TA appointments who were not included in the TA recruitment sample were included in the student sample. We had invalid email addresses for 260 of the individuals in our recruitment sample. On the student survey, 656 individuals responded for a response rate of 13.8%.
Survey Procedures
We recruited faculty, TAs, and students via emails that included links to the online surveys. We created the surveys using Catalyst WebQ. During spring 2008, we sent a recruitment email and two reminders to all three groups. viii We also sent a postcard reminder to nonresponsive faculty. FThe surveys were confidential, with no identifying information linked to individual responses. After completing the survey, participants had the option to enter a drawing for a prize; in total, 35 randomly selected survey respondents received a $30 credit on their Husky cards.
Survey Questions
All three surveys followed the same basic structure. In the first section, we gathered demographic data (e.g., position/class status or gender) and asked general questions about technology expertise. For faculty and TAs, we also included questions about teaching experience.
The next section of the surveys was designed to help us understand how technology was used within various teaching and learning contexts in order to meet diverse teaching and learning goals. We first asked participants to select a context (e.g., “large lecture” or “online course”). Then we asked them to select a goal that was important within that context (e.g., for faculty and TAs, “ensure student access to course material” or, for students, “access and review course material”). Finally, we asked them to indicate which technologies (e.g., “course or project Web page” or “library e‐reserves”) they used in their selected context and, more specifically, which technologies they used to meet their selected goal. We then asked participants to choose a second context different from the first and to answer the same set of questions about goals and technology use. This format allowed us to gather data reflecting a broad range of participants’ experiences using technology. On the TA survey, we also asked respondents to specify their responsibilities within the contexts they selected (e.g., “assisting instructor” or “teaching my own course section or lab”).
The second section of the surveys also included scale items that asked participants to rate the helpfulness of various sources of technical support (e.g., “colleagues” or “UW online help or tutorial”) and the severity of obstacles to using technology (e.g., “lack of time to learn how to

Learning and Scholarly Technologies at the University of Washington (April 2009) 8
use the technology” or “incompatibilities between my computing environment and the tools I need”). These questions were followed by a set of Likert‐type questions that asked participants to rate their level of agreement with several statements about technology (e.g., “Overall, the learning and scholarly technologies available at the UW are adequate to my needs”). Participants were also asked to select the level of priority the UW should assign to several potential technology‐related actions over the next three years (e.g., “greater integration of online tools” or “reliable wireless access”). To reflect patterns in focus group data, some of these questions had unique options for faculty, TAs, and students. For instance, the priorities question for students included the item “up‐to‐date computers and programs in computer labs,” which was not included on the faculty and TA surveys, while the latter surveys asked respondents about “rewards for innovation in teaching with technology.”
The faculty survey included a third section on research management and collaboration. This section expanded the survey beyond instructional contexts to look at the research activities in which most UW faculty are also engaged. This section was inspired by information in the ATAC Researchware Task Force’s report, which evaluated how well various technologies supported different research tasks at the UW. Since we decided to add the section on research after focus groups had been conducted, we could not use focus group data to inform the design of our questions. Instead we drew on the expertise of members of our steering committee and faculty on ATAC to design this portion of the survey. Questions in this section addressed how faculty used technology to support management and collaborative tasks. We specifically focused on these activities, since they transcend disciplinary boundaries. First we asked faculty to select one context that described all or some of their activities managing or participating in a research project during the past year. The research contexts ranged from not being involved in research, to working on a solo research project, to being engaged in various types of collaborative research (e.g., “with an inter‐institutional research team” or “with an inter‐disciplinary research team”). We then asked faculty to select tasks that were among their responsibilities in that context and to indicate which technologies they used to accomplish those tasks. We concluded the section with a series of open‐ended questions which addressed unmet needs related to research technology and priorities for the future.
Analysis of Survey Data Two units involved in the surveys project conducted analyses of the data. OEA produced data tables showing descriptives for each survey, as well as for disciplinary groups within each survey. LST completed more detailed analyses comparing various subsets of faculty, TAs, and students based on differences in demographics, expertise, and experience. We discuss data from all analyses in this report.
In the next section of this report, we will describe the differences and similarities between faculty, TAs, and students for all survey questions. We also engage in a more detailed discussion based on various discipline, demographic, expertise, and experience measures that we used to
Learning and Scholarly Technologies at the University of Washington (April 2009) 9
make comparisons. We describe these measures below; more information about the statistical processes we used for these comparisons is included in our endnotes.
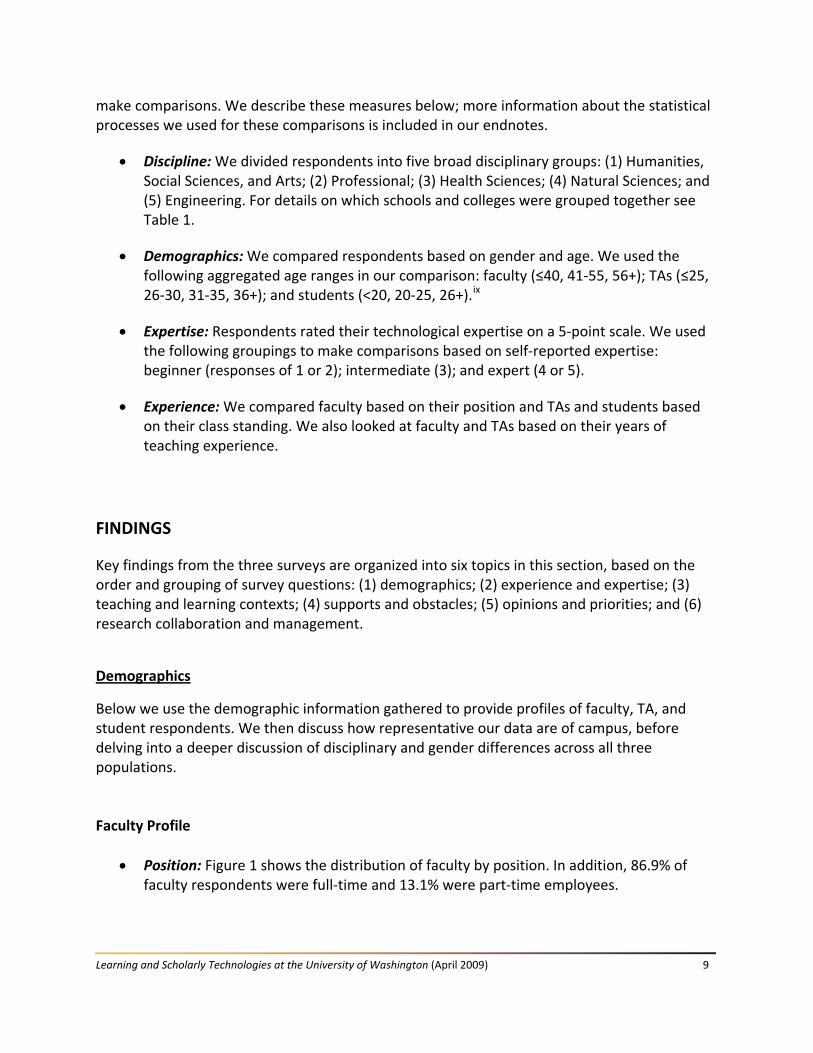
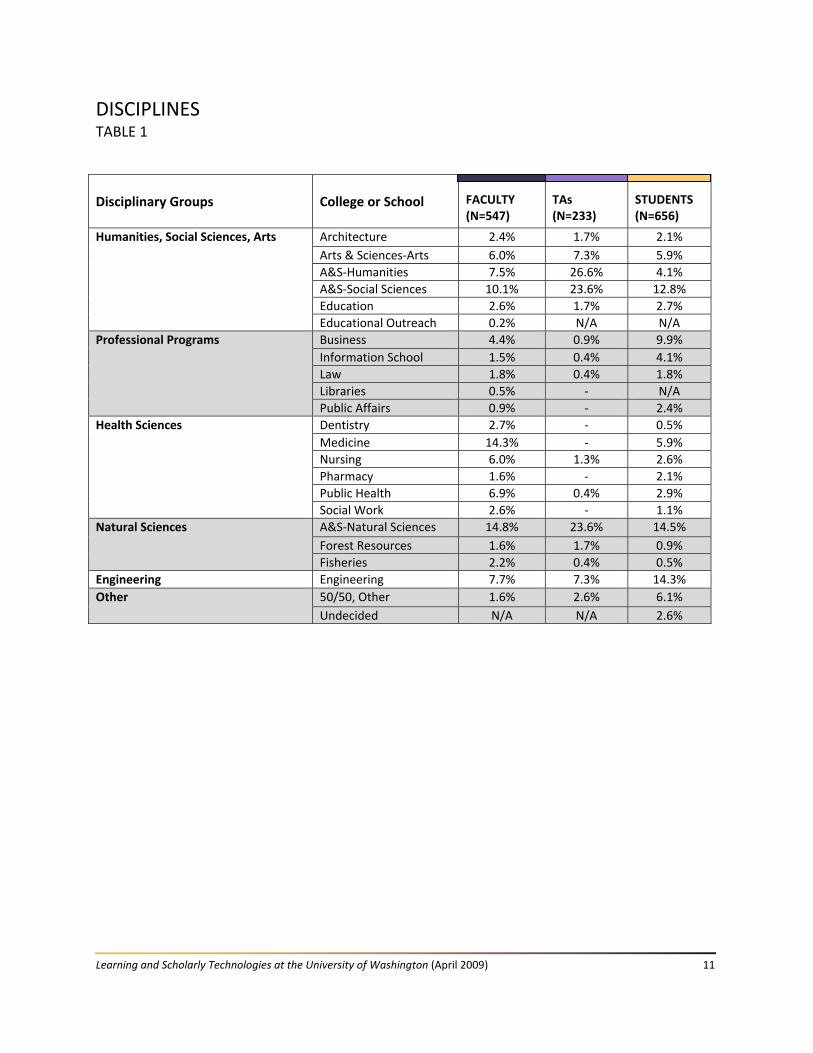
Discipline: We divided respondents into five broad disciplinary groups: (1) Humanities, Social Sciences, and Arts; (2) Professional; (3) Health Sciences; (4) Natural Sciences; and (5) Engineering. For details on which schools and colleges were grouped together see Table 1.
Demographics: We compared respondents based on gender and age. We used the following aggregated age ranges in our comparison: faculty (≤40, 41‐55, 56+); TAs (≤25, 26‐30, 31‐35, 36+); and students (<20, 20‐25, 26+).8F
ix
Expertise: Respondents rated their technological expertise on a 5‐point scale. We used the following groupings to make comparisons based on self‐reported expertise: beginner (responses of 1 or 2); intermediate (3); and expert (4 or 5).
Experience: We compared faculty based on their position and TAs and students based on their class standing. We also looked at faculty and TAs based on their years of teaching experience.
FINDINGS
Key findings from the three surveys are organized into six topics in this section, based on the order and grouping of survey questions: (1) demographics; (2) experience and expertise; (3) teaching and learning contexts; (4) supports and obstacles; (5) opinions and priorities; and (6) research collaboration and management.
UDemographics
Below we use the demographic information gathered to provide profiles of faculty, TA, and student respondents. We then discuss how representative our data are of campus, before delving into a deeper discussion of disciplinary and gender differences across all three populations. Faculty Profile
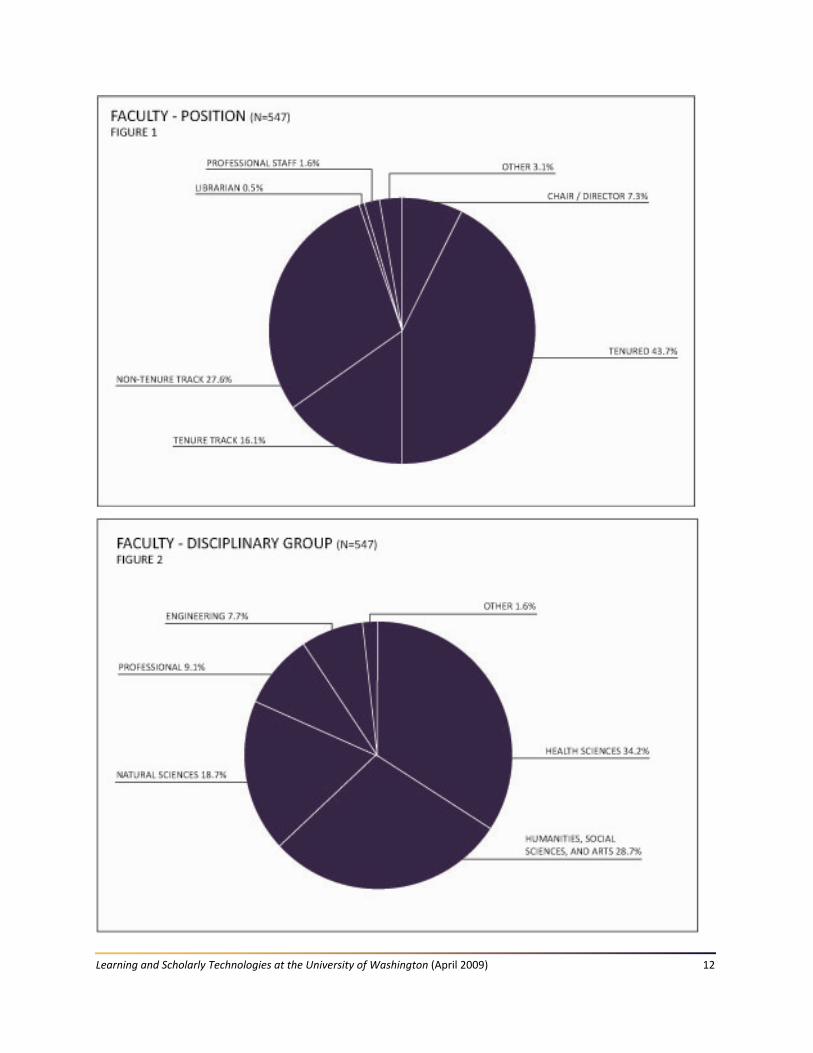
Position: Figure 1 shows the distribution of faculty by position. In addition, 86.9% of faculty respondents were full‐time and 13.1% were part‐time employees.

Learning and Scholarly Technologies at the University of Washington (April 2009) 10
Discipline: Figure 2 shows the breakdown of faculty respondents by disciplinary groups. For a complete distribution of faculty respondents by school or college, see Table 1.
Gender: 48.4% of faculty respondents were female and 51.6% were male.
Age: 18.2% were 40 or younger; 45.1% were 41‐55; and 36.7% were 56 or older.
TA Profile
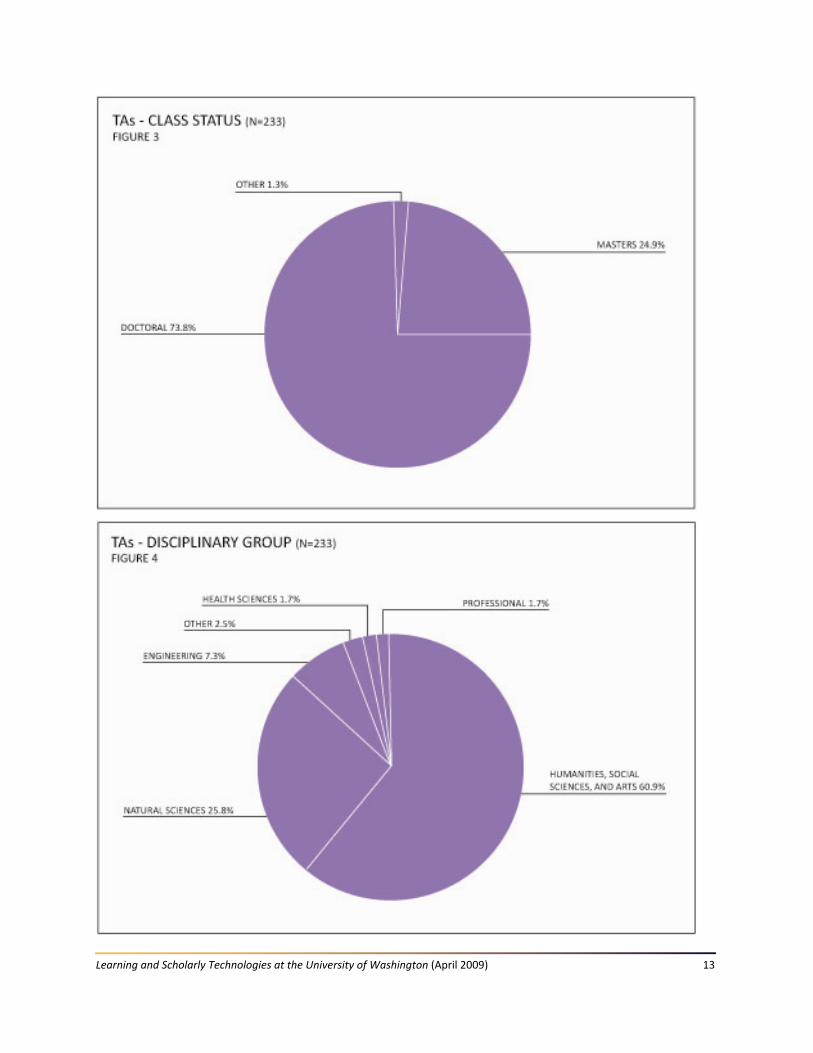
Position: Figure 3 shows the distribution of TAs by class status.
Discipline: Figure 4 shows the breakdown of TAs by disciplinary groups. For a complete distribution of TA respondents by school or college, see Table 1.
Gender: 55.3% of TA respondents were female and 44.7% were male.
Age: 21.6% were 25 or younger; 45.0% were 26‐30; 20.3% were 31‐35; and 13% were 36 or older.
Student Profile
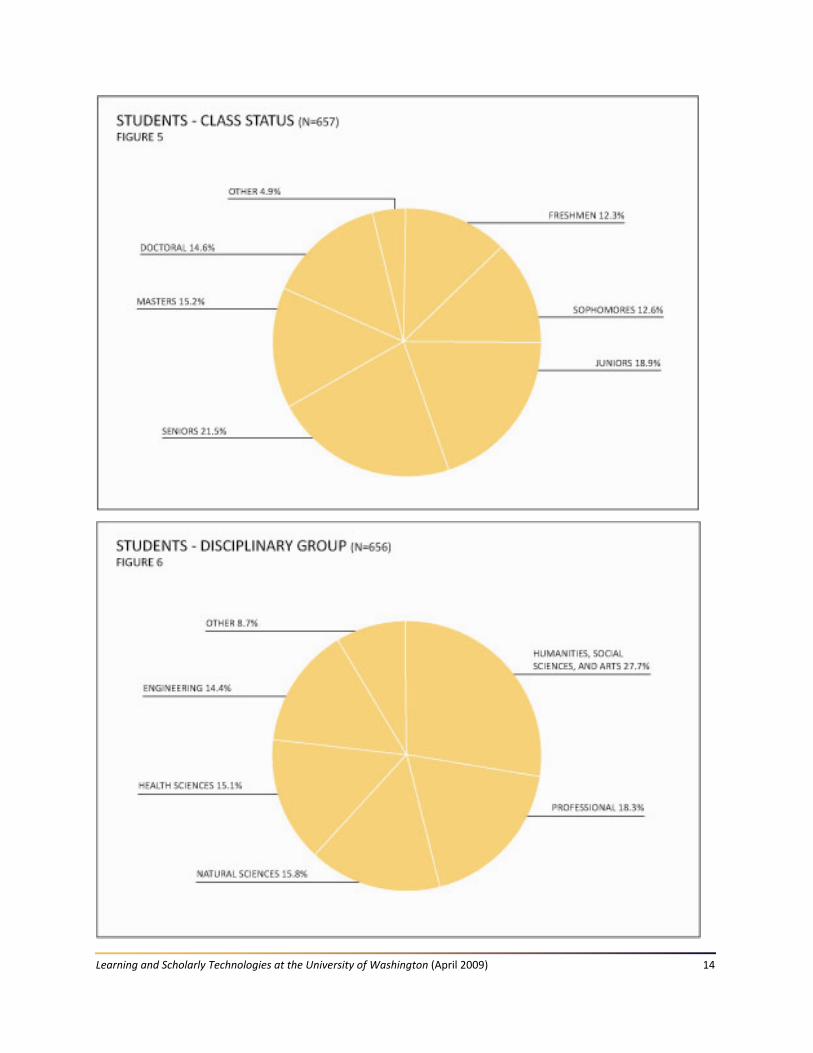
Position: Figure 5 shows the distribution of students by class status.
Discipline: Figure 6 shows the breakdown of student respondents by disciplinary groups. For a complete distribution of student respondents by school or college, see Table 1.
Gender: 63.4% of student respondents were female and 36.6% were male.
Age: 20.9% were younger than 20; 47.7% were 20‐25; and 31.4% were older than 25.
Residence: 21.1% reported living in UW housing; 11.3% lived off campus (with parent/guardian); and 67.6% lived off campus (other).
Learning and Scholarly Technologies at the University of Washington (April 2009) 11
DISCIPLINES TABLE 1
Disciplinary Groups College or School FACULTY (N=547)
TAs (N=233)
STUDENTS (N=656)
Humanities, Social Sciences, Arts Architecture 2.4% 1.7% 2.1%
Arts & Sciences‐Arts 6.0% 7.3% 5.9%
A&S‐Humanities 7.5% 26.6% 4.1%
A&S‐Social Sciences 10.1% 23.6% 12.8%
Education 2.6% 1.7% 2.7%
Educational Outreach 0.2% N/A N/A
Professional Programs Business 4.4% 0.9% 9.9%
Information School 1.5% 0.4% 4.1%
Law 1.8% 0.4% 1.8%
Libraries 0.5% ‐ N/A
Public Affairs 0.9% ‐ 2.4%
Health Sciences Dentistry 2.7% ‐ 0.5%
Medicine 14.3% ‐ 5.9%
Nursing 6.0% 1.3% 2.6%
Pharmacy 1.6% ‐ 2.1%
Public Health 6.9% 0.4% 2.9%
Social Work 2.6% ‐ 1.1%
Natural Sciences A&S‐Natural Sciences 14.8% 23.6% 14.5%
Forest Resources 1.6% 1.7% 0.9%
Fisheries 2.2% 0.4% 0.5%
Engineering Engineering 7.7% 7.3% 14.3%
Other 50/50, Other 1.6% 2.6% 6.1%
Undecided N/A N/A 2.6%
Learning and Scholarly Technologies at the University of Washington (April 2009) 12
Learning and Scholarly Technologies at the University of Washington (April 2009) 13
Learning and Scholarly Technologies at the University of Washington (April 2009) 14
Learning and Scholarly Technologies at the University of Washington (April 2009) 15
Representativeness of Survey Data We looked at key demographic items to investigate whether or not our respondent samples for each survey were representative of the campus community as a whole. In terms of faculty position, our sample of instructors was representative of campus. With regards to gender, our faculty respondent sample, however, was not representative of faculty. We sent recruitment emails to all instructors of record, which according to an Autumn 2007 report from the UW Office of Planning and Budgeting, was comprised of 63% men and 37% women.9F
x Since the percentage of female survey respondents was likely higher than the actual percentage of female instructors at the UW, we tested to see if the opinions of female faculty members were biasing the results and found no significant bias.10F
xi The disciplinary breakdown of our TA recruitment sample was as follows: Humanities, Social Sciences, and Arts (59.9%); Professional programs (3.4%); Health Sciences (1.3%); Natural Sciences (25.0%); Engineering (8.7%); and other (1.3%). The disciplinary breakdown of our survey respondents closely reflected our recruitment sample. We do not have gender information for the TAs in our recruitment sample, thus we were not able to assess representativeness in this regard. When we examined students’ class status, our sample of student respondents was representative of the student population in spring 2008, with the following exception: the student data were slightly overrepresented with regards to freshmen. Freshmen account for 12.3% of the student respondents, which was slightly more than the actual percentage of freshmen (9.1%) in the spring 2008. The gender distribution among the UW student population in spring 2008 was 52% female and 48% male. Among our survey respondents, men (36%) were considerably underrepresented. We tested to see if the responses of female students were biasing the results for all student participants and found no significant bias.11F
xii Demographic Data by Discipline Our analysis of demographic data highlights the fact that disciplinary groups at the UW varied on multiple measures: proportion of part‐time faculty, percentage of graduate students, and number of TAs. Based on these differences, some findings will be more relevant to some disciplines than to others. When we looked at faculty respondents’ full‐ or part‐time status we found that several disciplinary groups appeared very similar: 87.0% of faculty respondents in Humanities, Social Sciences, and Arts were full time, as were 83.4% of respondents in Health Sciences, and 89.1% in Natural Sciences. However, Professional programs had more part‐time faculty (51.0%). On the other extreme, all of the 42 faculty respondents in Engineering were full time. We also saw disciplinary differences in the class status of TAs. While 71.1% of TAs in Humanities, Social Sciences, and Arts were doctoral students, 93.3% of TAs in Natural Sciences were doctoral students. However, the most important aspect of our disciplinary data for TAs was the small number of TA respondents in Health Sciences (n=4), Professional Programs (n=4),
Learning and Scholarly Technologies at the University of Washington (April 2009) 16
and Engineering (n=17). Due to this wide variation in response (which reflects our random recruitment sample), our discussion of TA data throughout this report will need to be interpreted cautiously for the latter disciplines. Looking at discipline and gender, we found that respondents in some fields were dominated by men: 81% of Engineering faculty were men, as were 63.9% of Natural Sciences faculty. Others had more women than men: 64.0% in Professional programs were women, as were 55.2% of Humanities, Social Sciences, and Arts, and 54.1% in Health Sciences. TAs had a distribution very like that of faculty: 62.8% of TAs in the Humanities, Social Sciences, and the Arts were women and 52.5% of TAs in Natural Sciences were men. We also saw a similar pattern among students, except for the Natural Sciences, where 65.0% of student respondents were women. Also, while there were more men than women students in Engineering, the gender division was not as extreme among students as it was among faculty members. Demographics: Key Points
The proportion of full‐time to part‐time faculty varied by discipline; Engineering had the most full‐time faculty respondents (100%) and Professional programs had the least (49%).
TA respondents were primarily from Humanities, Social Sciences, and Arts or from Natural Sciences (a distribution which reflects our recruitment sample); there were very few respondents from Health Sciences, Professional programs, or Engineering.
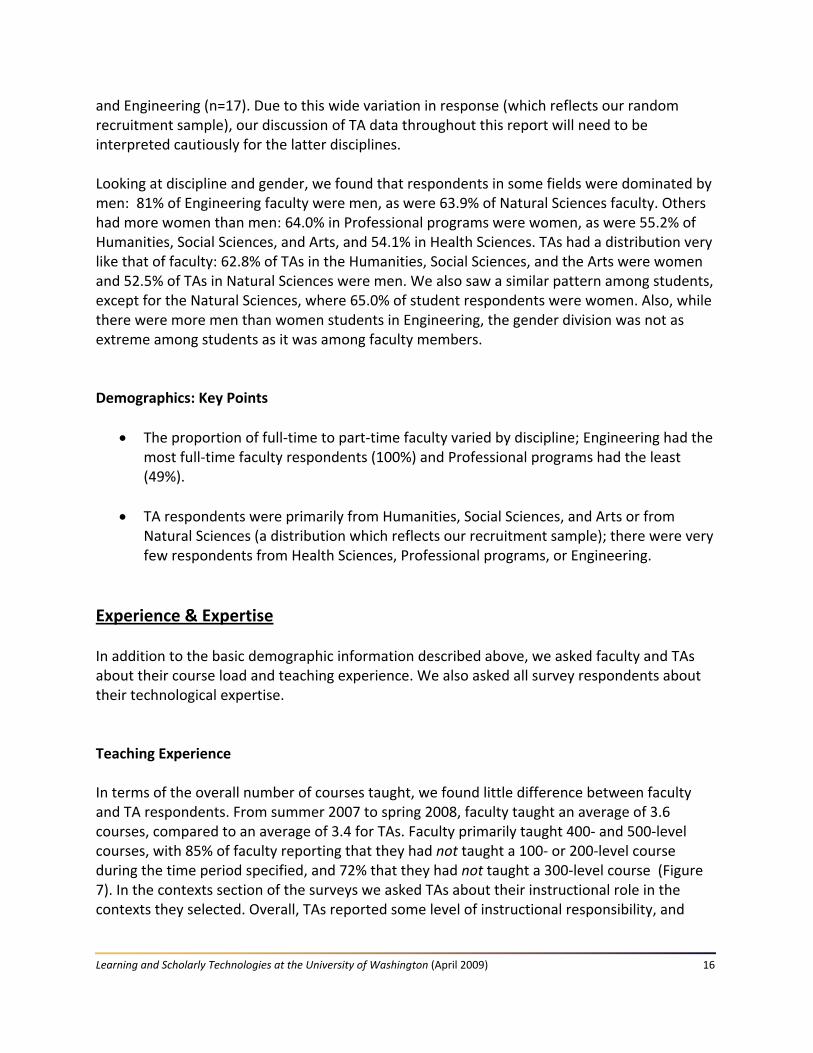
Experience & Expertise In addition to the basic demographic information described above, we asked faculty and TAs about their course load and teaching experience. We also asked all survey respondents about their technological expertise. Teaching Experience In terms of the overall number of courses taught, we found little difference between faculty and TA respondents. From summer 2007 to spring 2008, faculty taught an average of 3.6 courses, compared to an average of 3.4 for TAs. Faculty primarily taught 400‐ and 500‐level courses, with 85% of faculty reporting that they had not taught a 100‐ or 200‐level course during the time period specified, and 72% that they had not taught a 300‐level course (Figure 7). In the contexts section of the surveys we asked TAs about their instructional role in the contexts they selected. Overall, TAs reported some level of instructional responsibility, and
Learning and Scholarly Technologies at the University of Washington (April 2009) 17
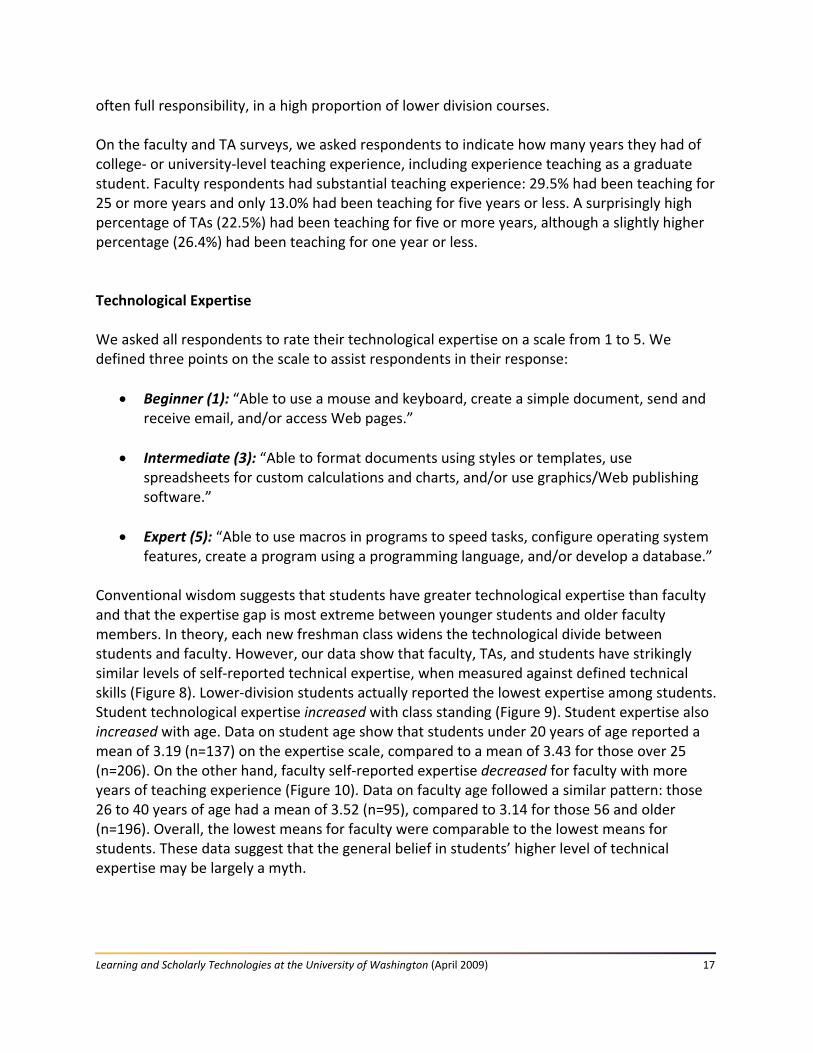
often full responsibility, in a high proportion of lower division courses. On the faculty and TA surveys, we asked respondents to indicate how many years they had of college‐ or university‐level teaching experience, including experience teaching as a graduate student. Faculty respondents had substantial teaching experience: 29.5% had been teaching for 25 or more years and only 13.0% had been teaching for five years or less. A surprisingly high percentage of TAs (22.5%) had been teaching for five or more years, although a slightly higher percentage (26.4%) had been teaching for one year or less. Technological Expertise We asked all respondents to rate their technological expertise on a scale from 1 to 5. We defined three points on the scale to assist respondents in their response:
Beginner (1): “Able to use a mouse and keyboard, create a simple document, send and receive email, and/or access Web pages.”
Intermediate (3): “Able to format documents using styles or templates, use spreadsheets for custom calculations and charts, and/or use graphics/Web publishing software.”
Expert (5): “Able to use macros in programs to speed tasks, configure operating system features, create a program using a programming language, and/or develop a database.”
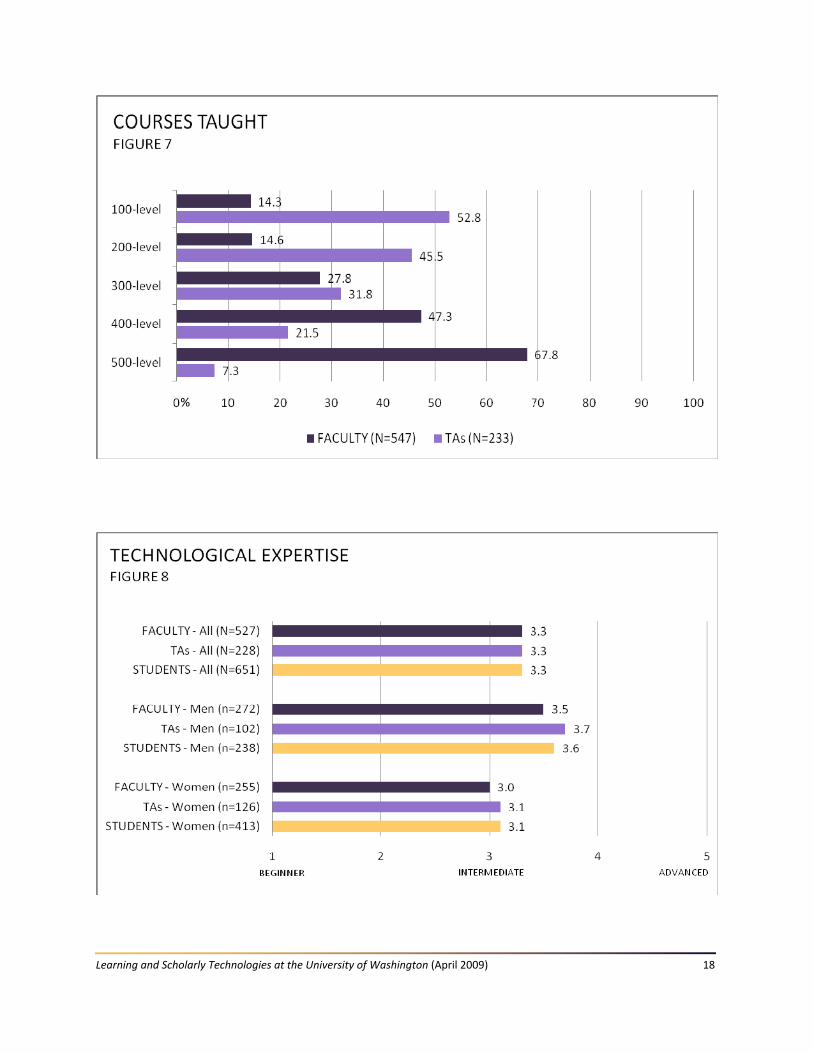
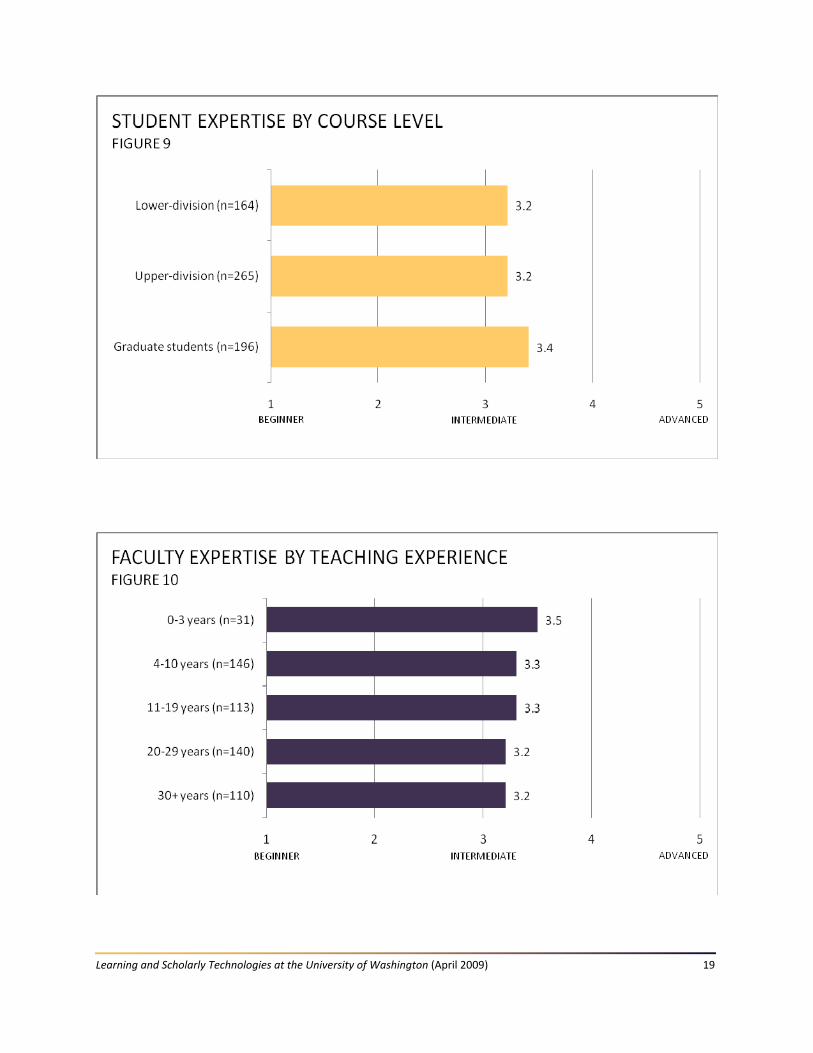
Conventional wisdom suggests that students have greater technological expertise than faculty and that the expertise gap is most extreme between younger students and older faculty members. In theory, each new freshman class widens the technological divide between students and faculty. However, our data show that faculty, TAs, and students have strikingly similar levels of self‐reported technical expertise, when measured against defined technical skills (Figure 8). Lower‐division students actually reported the lowest expertise among students. Student technological expertise increased with class standing (Figure 9). Student expertise also increased with age. Data on student age show that students under 20 years of age reported a mean of 3.19 (n=137) on the expertise scale, compared to a mean of 3.43 for those over 25 (n=206). On the other hand, faculty self‐reported expertise decreased for faculty with more years of teaching experience (Figure 10). Data on faculty age followed a similar pattern: those 26 to 40 years of age had a mean of 3.52 (n=95), compared to 3.14 for those 56 and older (n=196). Overall, the lowest means for faculty were comparable to the lowest means for students. These data suggest that the general belief in students’ higher level of technical expertise may be largely a myth.
Learning and Scholarly Technologies at the University of Washington (April 2009) 18
%
Learning and Scholarly Technologies at the University of Washington (April 2009) 19
Learning and Scholarly Technologies at the University of Washington (April 2009) 20
Expertise and Gender We found significant gender differences on measures of expertise across all three surveys. As Figure 8 shows, women faculty, TAs, and students rated their expertise significantly lower than men.12F
xiii This pattern corresponds with findings from the 2005 survey, which asked a series of questions about technological expertise. The expertise questions in the 2005 survey used a different scale than in 2008 and did not define skills associated with points along the scale, but the gender divide was equally extreme, corroborating the 2008 pattern.xiv Given the gender breakdown of faculty in various disciplines, as described in the previous section, it is not surprising that disciplinary groups with the highest percentage of men also reported the highest expertise and vice versa. For instance, faculty in the Humanities, Social Sciences, and the Arts, who were 55.2% female, had a mean of 3.0 on the expertise scale, while the mean in Engineering, where faculty were 81.0% male, was 4.0. Experience & Expertise: Key Points
Faculty and TAs reported teaching almost the same number of courses or course sections over the past year. More TAs than faculty reported teaching lower‐division courses.
The mean for self‐rated technological expertise was identical for faculty, TAs, and students. The subset of faculty with the lowest expertise (those with 30+ years experience) rated their expertise at a similar level as the subset of students with the lowest expertise (lower‐division students).
Across all three surveys, women rated their expertise significantly lower than men. In disciplinary groups with more women than men faculty members, expertise was also lower and vice versa.
Teaching & Learning Contexts In this section of the survey we focus on contextualized technology use. As discussed earlier, this is a departure from previous surveys that focused on general technology use. Our questions in this section ask where (in what context) and why (for what purpose) faculty, TAs, and students are using technology.14F In our discussion we begin with general data about the contexts and goals selected and then delve deeper into specifics about how a few select technologies are used across contexts and goals.
Learning and Scholarly Technologies at the University of Washington (April 2009) 21
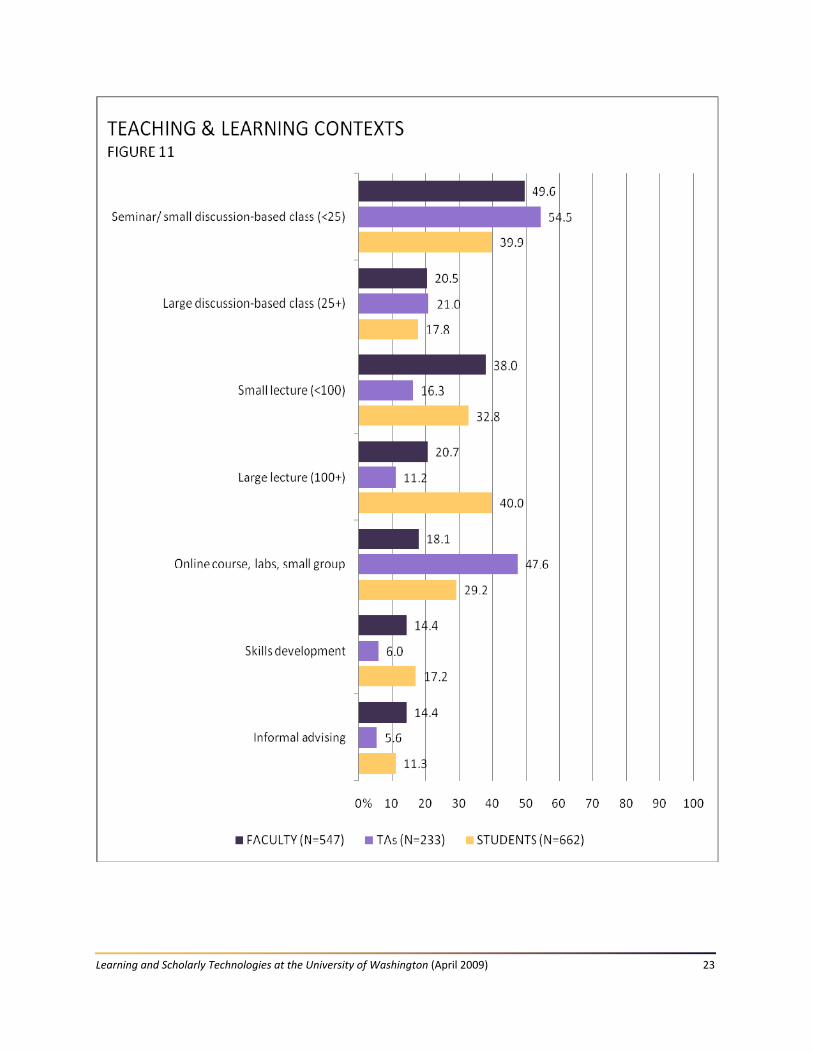
Contexts We provided respondents with a list of twenty formal and informal teaching and learning contexts; this list was the same for all three surveys. Figure 11 shows what percentage of faculty, TA, and student respondents selected each context at least once.xv By far, the most common contexts selected by respondents were the four formal course types: seminar/small discussion‐based class (<25 students), large‐discussion based class (25+ students), small lecture (<100 students), and large lecture (100+ students). Since the other 16 contexts were selected less frequently, we grouped similar types together for our analysis.15F
xvi For both faculty and TAs, seminar/small discussion‐based course was the most frequently selected context. The top responses for students were divided between seminar/small discussion‐based class and large lecture. Also of note, more TAs than faculty selected online courses, labs, or small groups. These data reflected the types of instructional contexts where TAs traditionally have been responsible for a high proportion of the instruction. Contexts by Discipline When we compared the contexts selected by faculty in different disciplinary groups, we saw a variety of differences. 1For instance, faculty in Humanities, Social Sciences, and Arts selected seminar/small discussion‐based class more often than any other group (61.1% selected this context at least once). When we looked at large discussion‐based classes we saw a wide margin between the extremes; 52.0% of faculty in Professional programs selected this context at least once, compared to only 11.8% in Natural Sciences. Similarly, large lecture courses were selected the most by faculty in Natural Sciences (41.2%) and the least by faculty in Engineering (2.4%). It is important to keep in mind that particular contexts align closely with particular disciplinary groups as we look at technology use later in this section. TA and student data followed a similar pattern. For TAs, 41.9% in Humanities, Social Sciences, and Arts selected the seminar/small discussion‐based class context at least once, compared to only 23.4% of TAs in Natural Sciences. For online courses, lab‐based courses, etc, the opposite was true; 21.3% of TAs in Humanities, Social Sciences, and Arts selected this context at least once, compared with 46.8% of TAs in Natural Sciences. Similarly, 50.8% of students in Humanities, Social Sciences, and Arts selected seminar/small discussion‐based class at least once. Goals We provided respondents with a list of goals and asked them to select one goal that was important within the context they had selected.17F
xvii Figure 12 shows the percentage of faculty, TAs, and students who selected each goal in at least one context. The most common goal selected across populations was “help students understand content knowledge” (faculty and
Learning and Scholarly Technologies at the University of Washington (April 2009) 22
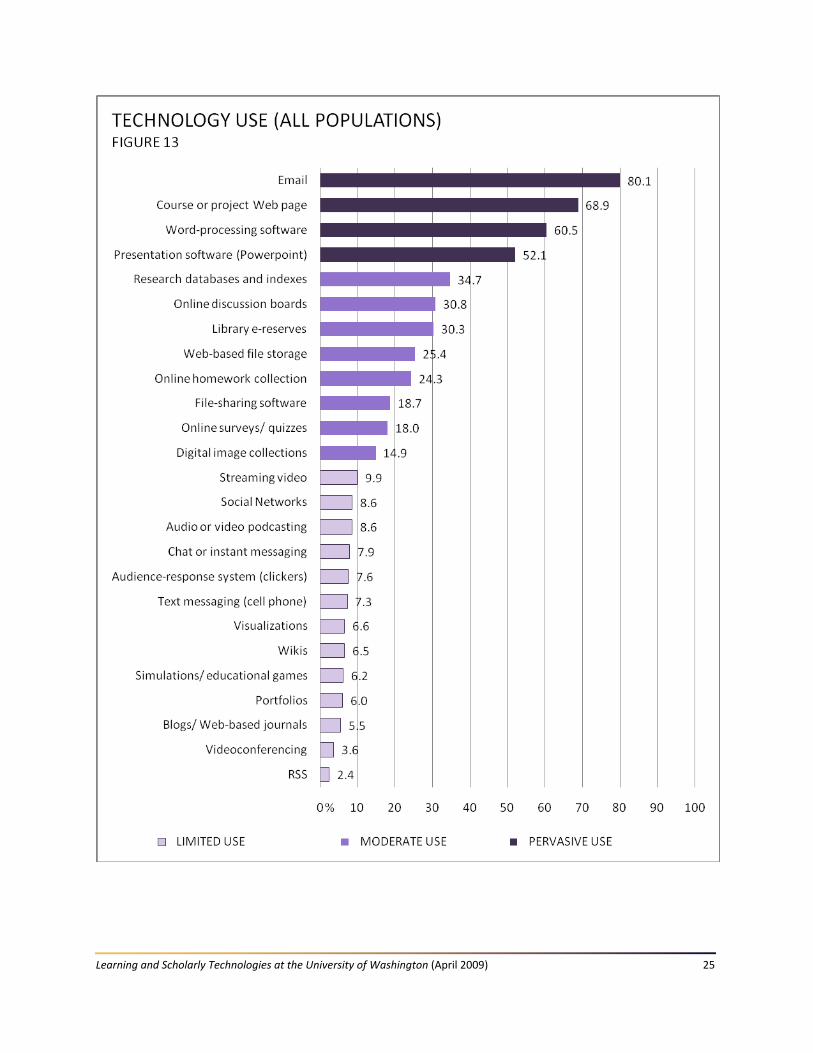
TAs) or “understand content knowledge” (students). While understanding content knowledge was selected as important by all populations, it was most heavily selected by TAs, suggesting that this group may place more importance on this goal. Focus group data suggest that this goal may be one of the primary responsibilities of TAs who teach course sections. For students, the second most common goal was “access and review course material”; the related goal, “ensure student access to course material,” was not widely selected by faculty or TAs. This pattern suggests that students may place more importance on access to materials than faculty or TAs do. However, since the goal questions are tied to context and do not ask respondents to indicate the most important goal, but rather an important goal, these patterns are speculative. Technology Use Figure 13 shows how often various technologies were selected, regardless of context, across the three surveys.18F
xviii Some general patterns of technology use hold true regardless of the context or goal selected: a few technologies are consistently used, while several other technologies are seldom used. It is important to note, however, that since all of our technology use questions asked respondents to first select a context and then to select technologies used within that context, these numbers do not encompass all technology use. We divided the technologies listed into three general categories based on natural clusters within the data: pervasive use (selected in more than 50% of Faculty, TA, and student responses across contexts); moderate use (10.0‐49.9%); and limited use (less than 10.0%). The pervasive use category included four technologies: email, course or project Web page, word‐processing software, and presentation software. All of these technologies are well‐established and widely‐available, and—perhaps most importantly—are generally used for activities beyond teaching and learning. In addition, these technologies support widely‐applicable activities: content delivery and general communication. All of these characteristics make their pervasive use across teaching and learning contexts unsurprising. There were eight technologies in the moderate use category. This category encompassed several technologies that have well‐established and well‐supported options offered by the UW. For instance, three of the technologies in this category are provided by UW libraries: research databases and indexes, library e‐reserves, and digital image collections. The five other moderately‐used technologies all have options available through Catalyst Web tools: online discussion boards, Web‐based file storage, online homework collection, file‐sharing software, and online surveys/quizzes. Some of the technologies in this latter group are also provided to faculty, TAs, and students in a few departments through course‐management systems (e.g., Blackboard or Moodle) or department‐created tools. In general, the technologies with moderate use have more specific and narrow functionality than the technologies within the pervasive use category. In addition, moderate use technologies tend to be more interactive. These characteristics may make these technologies more likely to be applied by faculty, TAs, and students in some teaching and learning contexts but not necessarily in all contexts.
Learning and Scholarly Technologies at the University of Washington (April 2009) 23

Learning and Scholarly Technologies at the University of Washington (April 2009) 24
Learning and Scholarly Technologies at the University of Washington (April 2009) 25
Learning and Scholarly Technologies at the University of Washington (April 2009) 26
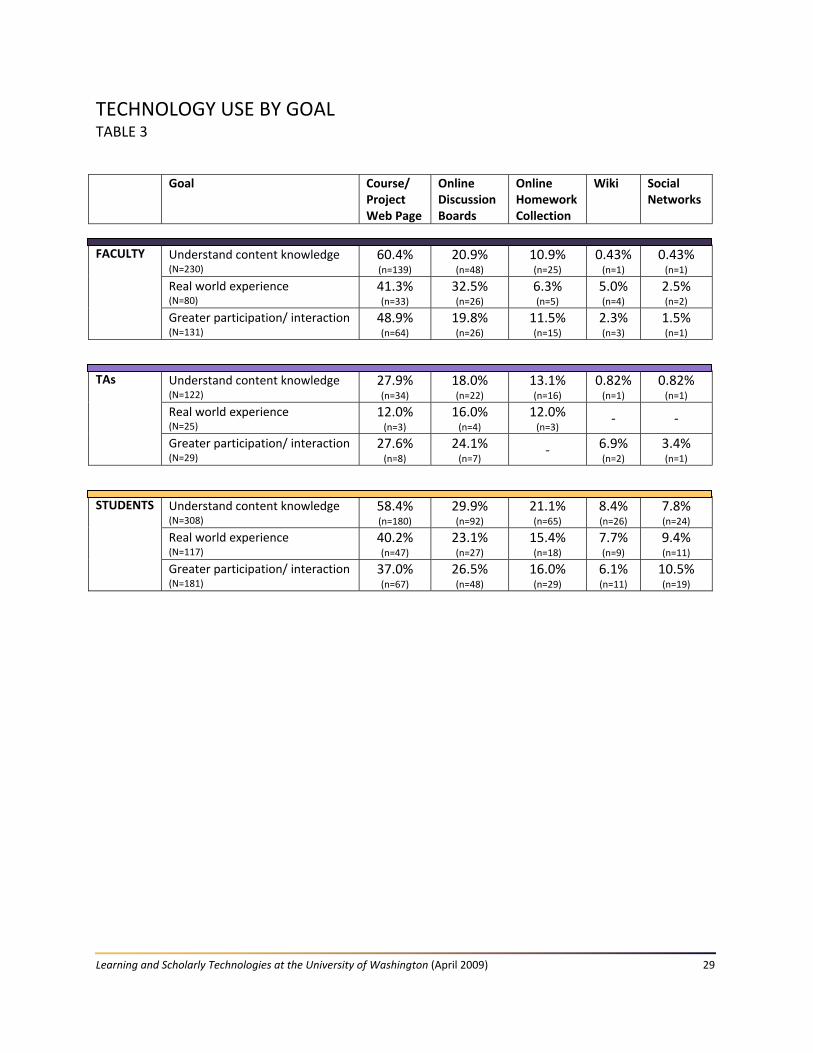
The limited use category was, by far, the largest, with 13 technologies: streaming video, social networks, audio or video podcasting, chat or instant messaging, audience‐response systems, text messaging, visualizations, wikis, simulations/educational games, portfolios, blogs/Web‐based journals, videoconferencing, and RSS. Many of these technologies are newer (e.g., social networks or simulations) than are those in the previous two categories, some have costs associated with their use (e.g., videoconferencing or text messaging), and several require faculty, TAs, and students to find and learn how to use and apply the technology largely on their own because there are only minimally‐supported options at the UW (e.g., wikis or blogs). All of these characteristics likely contribute to their lower use in teaching and learning contexts. Five Technologies across Contexts and Goals While we did see fluctuations of technology use across contexts, the general level of use (i.e., technologies with pervasive use were used more often than those with limited use) held true regardless of context. In order to demonstrate how technology use varies, or does not vary, based on context or goal selected, we have chosen five technologies from different categories of use—course/project Web pages (pervasive); online discussion boards (moderate); online homework collection (moderate); wikis (limited); and social networks (limited)—and tracked their use across the top five contexts (Table 2) and across three common goals (Table 3). Table 2 shows that faculty, TAs, and students, regardless of context, selected course/project Web pages more often than they did any of the other tools. For instance, in large lecture courses 90.7% of faculty used course Web pages, compared to 67.2% in seminars/small discussion‐based courses (Table 2). In both of these contexts, however, email and course Web pages were the top two technologies used. We saw much greater variation in use when we looked at course Web page use by goal (Table 3). The highest use of Web pages across populations was to meet the goal “understand content knowledge,” while the percentages for Web site use dropped precipitously for goals related to “real world experience” and “greater participation‐interaction.” The use of course Web pages to meet all three goals was much lower for TAs. However, faculty, TAs, and students still used course Web pages more than other technologies to meet these goals. One of the most significant findings from the 2005 surveys on educational technology was that a high percentage (54%; n=333) of undergraduate student respondents agreed “strongly” that course Web sites should be required in all courses, while only 9% (n=77) of faculty respondents agreed “strongly” with this statement. This finding raised the concern that course Web pages were not widely used at the UW. Our data from 2008 negates some of this concern, showing that course Web pages were one of the most used technologies across all contexts, without any requirement for their use. However, it is also important to keep in mind that although use of this technology was uniformly higher than the use of most other technologies, Web page use remains inconsistent across the UW. In addition, some important aspects of course Web page use cannot be addressed by use data alone. For instance, in focus groups in 2005 students
Learning and Scholarly Technologies at the University of Washington (April 2009) 27
stressed the importance of having easy‐to‐access, well‐organized, and up‐to‐date information on course Web pages. Student data from the 2008 focus groups suggest that these aspects of course Web page use are still challenges. When we looked at two moderately‐used technologies—online discussion boards and online homework collection—we saw similar trends across contexts and goals. These tools were less frequently used than course Web pages, but more often used than technologies such as wikis or social networks. In general online discussion boards were more often used than online homework collection tools. For instance, 34.3% of faculty teaching large lecture courses reported using an online discussion board, while only 17.6% reported using online homework collection (Table 2). Interestingly, higher use percentages for these technologies were posted by students than for faculty: 55.3% of students in large‐lecture courses reported using online discussion boards. However, in this context the actions of a small percentage of faculty members can have a significant impact on student use, since, by definition, faculty teaching large lectures reach one hundred or more students in each class. When we focused on two technologies with limited use, wikis and social networks, we saw that student use of these tools was consistently higher than use by faculty or TAs; 7.3% or fewer faculty and TA respondents used either technology in any context for any goal (Tables 2 and 3). On the other hand, student wiki use by context ranged between 8.2% (online course/lab‐based course) to 23.3% (seminar/small discussion‐based class). A similar trend was true for student use of social networks, which ranged from 11.3% (small seminars) to 17.9% (large lectures). For most technologies in our limited use category, their use by students was substantially higher than by TAs or faculty. The same pattern emerged in the 2005 surveys, where we also found that students reported using a greater array of technologies to support their academic activities than faculty. This pattern suggests that faculty may have less exposure to some of the technologies that students use.

Learning and Scholarly Technologies at the University of Washington (April 2009) 28
TECHNOLOGY USE BY CONTEXT TABLE 2
Context Course/ Project Web Page
Online Discussion Boards
Online Homework Collection
Wiki Social Networks
FACULTY Seminar/ small discussion‐based class (N=250)
67.2% (n=168)
21.2% (n=53)
20.4% (n=51)
2.0% (n=5)
1.6% (n=4)
Large discussion‐based class (N=107)
72.9% (n=78)
29.0% (n=31)
28.0% (n=30)
3.7% (n=4)
4.7% (n=5)
Small lecture (N=197)
84.3% (n=166)
24.4% (n=48)
20.3% (n=40)
0.5% (n=1)
1.5% (n=3)
Large lecture (N=108)
90.7% (n=98)
34.3% (n‐37)
17.6% (n=19)
‐ ‐
Online course lab‐based course, etc. (N=105)
71 4% (n=75)
25.7% (n=27)
28.6% (n=30)
3.8% (n=4)
3.8% (n=4)
TAs Seminar/ small discussion‐based class (N=110)
80.9% (n=89)
44.5% (n=49)
33.6% (n=37)
7.3% (n=8)
6.4% (n=7)
Large discussion‐based class (N=41)
92.7% (n=38)
56.1% (n=32)
41.4% (n=17)
‐ 2.4% (n=1)
Small lecture (N=34)
82.4% (n=28)
29.4% (n=10)
14.7% (n=5)
2.9% (n=1)
2.9% (n=1)
Large lecture (N=24)
62.5% (n=15)
29.2% (n=7)
25.0% (n=6)
‐ ‐
Online course lab‐based course, etc. (N=92)
77.2% (n=71)
21.7% (n=20)
19.6% (n=18)
2.2% (n=2)
3.3% (n=3)
STUDENTS Seminar/ small discussion‐based class (N=257)
66.5% (n=171)
28.4% (n=73)
9.3% (n=24)
23.3% (n=60)
11.3% (n=29)
Large discussion‐based class (N=118)
74.6% (n=88)
41.5% (n=49)
39.0% (n=46)
16.1% (n=19)
17.8% (n=21)
Small lecture (N=213)
78.9% (n=168)
41.3% (n=88)
30.5% (n=65)
10.8% (n=23)
16.0% (n=34)
Large lecture (N=257)
83.3% (n=214)
55.3% (n=142)
38.9% (n=100)
9.3% (n=24)
17.9% (n=46)
Online course lab‐based course, etc. (N=201)
72.6% (n=146)
65.3% (n=77)
26.8% (n=57)
8.2% (n=21)
13.4% (n=27)
Learning and Scholarly Technologies at the University of Washington (April 2009) 29
TECHNOLOGY USE BY GOAL TABLE 3
Goal Course/ Project Web Page
Online Discussion Boards
Online Homework Collection
Wiki Social Networks
FACULTY Understand content knowledge (N=230)
60.4% (n=139)
20.9% (n=48)
10.9% (n=25)
0.43% (n=1)
0.43% (n=1)
Real world experience (N=80)
41.3% (n=33)
32.5% (n=26)
6.3% (n=5)
5.0% (n=4)
2.5% (n=2)
Greater participation/ interaction (N=131)
48.9% (n=64)
19.8% (n=26)
11.5% (n=15)
2.3% (n=3)
1.5% (n=1)
TAs Understand content knowledge (N=122)
27.9% (n=34)
18.0% (n=22)
13.1% (n=16)
0.82% (n=1)
0.82% (n=1)
Real world experience (N=25)
12.0% (n=3)
16.0% (n=4)
12.0% (n=3)
‐ ‐
Greater participation/ interaction (N=29)
27.6% (n=8)
24.1% (n=7)
‐ 6.9% (n=2)
3.4% (n=1)
STUDENTS Understand content knowledge (N=308)
58.4% (n=180)
29.9% (n=92)
21.1% (n=65)
8.4% (n=26)
7.8% (n=24)
Real world experience (N=117)
40.2% (n=47)
23.1% (n=27)
15.4% (n=18)
7.7% (n=9)
9.4% (n=11)
Greater participation/ interaction (N=181)
37.0% (n=67)
26.5% (n=48)
16.0% (n=29)
6.1% (n=11)
10.5% (n=19)

Learning and Scholarly Technologies at the University of Washington (April 2009) 30
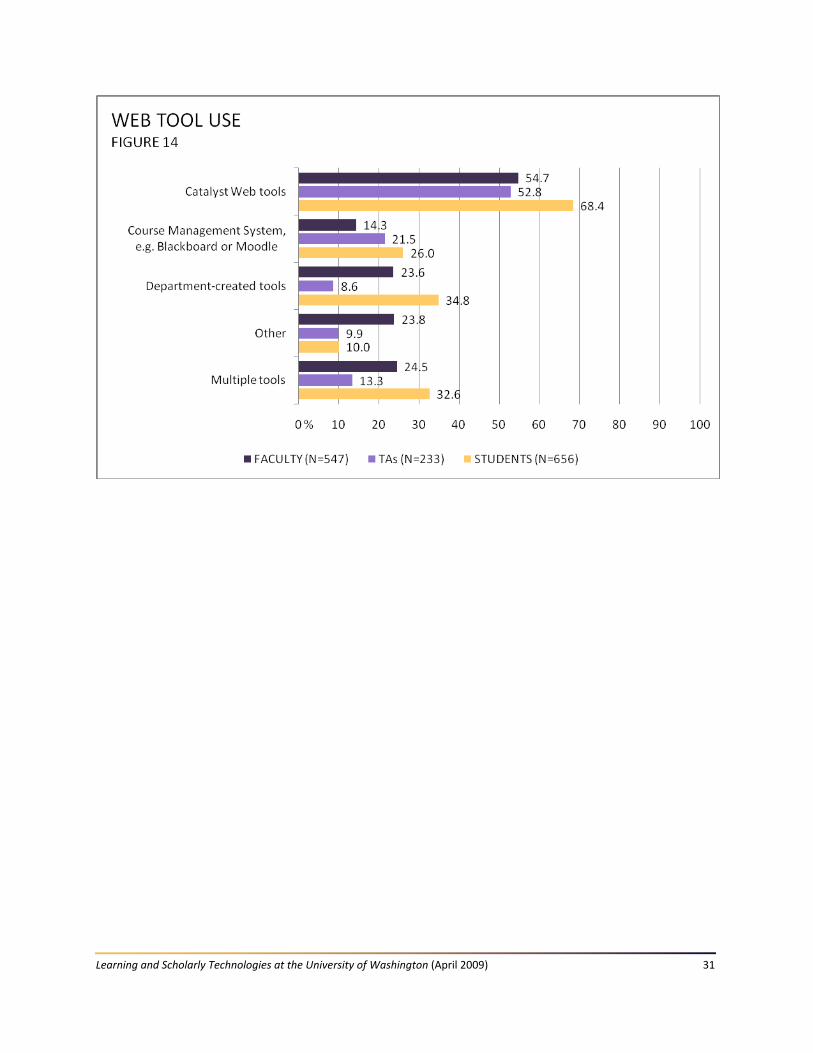
Web Tools Used When we asked respondents to indicate which technologies they used within a context or to meet a particular goal, we added a note that addressed the use of course management systems. We instructed respondents as follows: “if you used a course‐management system (e.g. Blackboard or Moodle), please indicate the individual components you used.” After asking about technologies (or components) respondents used, we then asked them to select all the Web tools they had used in the context they had selected. We asked this question in order to get a better sense of the overall use of these particular sets of tools. We found that across all populations, Catalyst Web tools were used with higher frequency than course‐management systems (e.g., Blackboard or Moodle), department‐created tools, or other (Figure 14). We also gave respondents the opportunity to select more than one type of Web tool in response to this question. We found that 24.5% of faculty used more than one type of Web tool in their selected context. Response to this question points to the diversity of technology use at the UW. This pattern connects to the findings of the Collaborative Tools Task Force report, which emphasized that when it comes to collaborative tools there is no “one‐size‐fits‐all” solution.
TAs and Technology Use When we looked at technology use by TAs across both contexts we saw that their overall technology use was lower than faculty or students’ use. However, when we looked specifically at the contexts where TAs reported having more responsibility in a course, we found that TAs tended to use more technology than faculty. For each set of context questions we asked TAs to indicate their level of instructional responsibility within the context selected: “assisting instructor,” “teaching my own section or lab,” “teaching my own course,” or “mentoring or leading.” TA responsibilities in a course varied based on the size and format of the course. The two discussion‐based contexts were chosen more often by TAs than the two lecture‐based contexts. For seminar/small‐discussion based classes, 44.4% of TAs indicated that they were responsible for teaching the course, while 49.3% were responsible for a course section, and only 6.3% assisted an instructor in this context. Of the TAs who selected large‐discussion based courses, 52.6% of TAs taught a section of the course, 38.6% taught their own course, and only 7.0% assisted an instructor. In lecture‐based classes TAs were more likely to indicate that they assisted an instructor than they were in discussion‐based classes, but even in lecture contexts TAs were more likely to report a different role. The highest proportion of TAs who selected small lecture courses taught the course (47.6%), while 28.6% taught a section, and 23.8% assisted an instructor. Of the 28 TAs who selected large‐lecture courses, none taught the course on their own. The highest percentage of TAs who assisted an instructor (42.9%) did so in large lecture classes, but even in this context a higher percentage taught their own section (46.4%).
Learning and Scholarly Technologies at the University of Washington (April 2009) 31
Learning and Scholarly Technologies at the University of Washington (April 2009) 32
In general, TAs who taught their own course used more technology than did TAs who taught a course section, who, in turn, used more technology than TAs who assisted an instructor. When we looked at course Web site use, we saw a pattern that closely follows TAs’ responsibilities within various contexts. In seminar/small discussion‐based classes, where TAs were more likely to teach a course or section, use of Web pages was quite high: 80.9% reported using course Web pages in this context (Table 2). Conversely, in large lecture courses, where TAs were more likely to assist an instructor or teach a section, only 62.5% reported using course Web pages. Interestingly, this pattern was the exact inverse for faculty, challenging the conventional belief that TAs are often responsible for setting up technology for large lecture courses—since faculty tended to report using more technology in such courses than TAs did. However, since the number of TA respondents who reported assisting an instructor in any context were quite low, we do not know how widely our data apply. In focus groups we learned that union restrictions regarding when TAs can start working on a course can, at times, prevent them from helping an instructor set up technology. Students and Technology Use Data from focus groups complement survey findings about students’ technology use. In focus groups students expressed appreciation for faculty efforts to increase student engagement by adding interactive activities or using interactive technologies, such as audience‐response systems (“clickers”). According to focus group participants, online and computer resources were heavily used by students as a way to revisit material in order to learn. Students wanted course Web pages for all courses; in particular, they wanted easy‐to‐find, up‐to‐date, and accurate online resources. While students in focus groups reported using a wide range of technologies, they first learned how to use many technologies for learning in their courses—it was in courses that they were often first exposed to tools like discussion boards, online homework collection tools, or database searching and first came to practice using these tools. At some point in their career, students began to surpass their instructors in terms of familiarity with technologies and their ability to use these technologies for learning. This may be in a large part due to students’ participation in informal learning communities. In faculty focus groups participants talked extensively about getting students to learn from each other. In student focus groups, it was apparent that students were interacting and seeking this interaction, but not always in class. They reported a variety of means for getting together in self‐selecting groups. Social networking software was especially important to undergraduate lowerclassmen for forming groups and getting together when they could not meet face to face.

Learning and Scholarly Technologies at the University of Washington (April 2009) 33
Teaching & Learning Contexts: Key Points
A few technologies—email, course or project Web pages, and Word‐processing software—were broadly used regardless of context or goal selected. Several other technologies—wikis, blogs, videoconferencing, RSS readers, et cetera—were used considerably less.
Technologies that are widely supported and centrally available at the UW had higher levels of use than did technologies that faculty, TAs, and students had to learn to use on their own with minimal support.
Students used a greater variety of technologies than did faculty or TAs.
Catalyst Web tools were more widely used than course‐management systems (e.g., Blackboard or Moodle) or department‐created tools; however, many respondents indicated that they used multiple technologies from multiple sources.
In contexts where TAs most frequently taught a course or course section, such as seminar/small discussion‐based classes, TAs tended to use more technology than faculty did in the same contexts.
Students were more likely to select “access and review course material” as an important goal than faculty or TAs were to select “ensure student access to course materials.”
While all populations selected “understand content knowledge” as an important goal, more TAs selected this goal than did faculty or students.
Supports & Obstacles
In this section of the survey, we sought to increase our understanding of which sources of support faculty, TAs, and students find the most helpful and which obstacles they find the most challenging when they try something new with technology.
Sources of Support for Technology Use
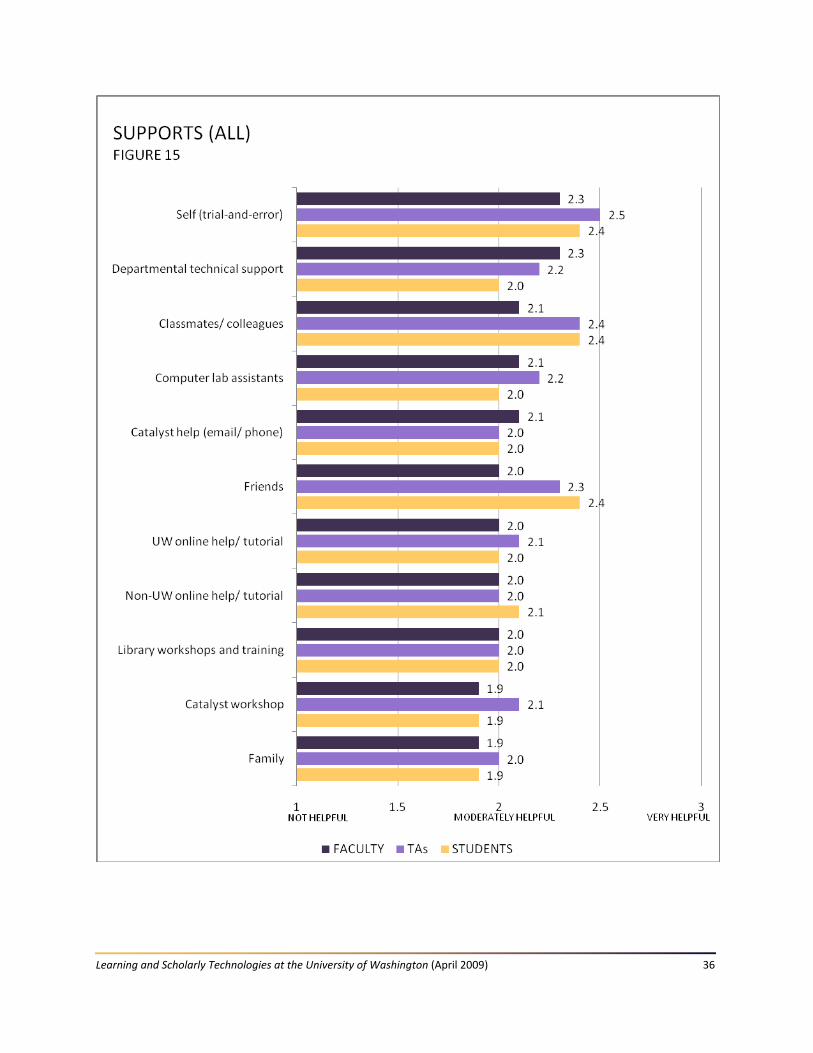
Faculty, TAs, and Students all rated people as the most helpful sources of technical support, rather than online information or formal training options. We asked respondents to rate the helpfulness of various sources of technical support on a three point scale (1=not helpful, 2=moderately helpful; 3=very helpful); respondents could also indicate if they had never used a particular support.
For faculty, the three most helpful sources of support were as follows: self (trial‐and‐error); teaching assistants, and departmental support staff; each of these three items had a mean of 2.3 on our 3‐point scale (Figures 15 and 16). Self (trial‐and‐error) was also the most frequently
Learning and Scholarly Technologies at the University of Washington (April 2009) 34
used source of support: 98.5% of faculty reported using this source, compared to 83.4% who reported using departmental support staff as a source of technical support, and 52% who reported using teaching assistants. Other sources of support used by more than half of faculty respondents included: colleagues (84.4%); UW online help or tutorial (69.6%); non‐UW online help or tutorial (67.5%); their students (61.4%); friends (56.9%); and Classroom Support Services (54.1%). It is noteworthy that the most frequently used sources of support were immediately available at the point‐of‐need; faculty responses indicated that they first looked to themselves, then to knowledgeable peers (colleagues and departmental support) and next to easily accessible information (online).
In looking at these trends it is important to recognize that while they do indicate faculty’s preference for local face‐to‐face support models, they are not an indictment of the support offered by central services. UW help and tutorials and central service units were in general rated as helpful, just to a lesser degree than locally‐available support. This pattern corresponds with findings from the faculty focus groups, where faculty primarily referenced face‐to‐face experiences—whether with colleagues, departmental support staff, or central service units—as the most helpful. It also corresponds with findings in the 2006 report from ATAC’s subcommittee on educational technology needs, which emphasized the need for personal support at the point‐of‐need. LST’s recent report on researchers’ needs also emphasized the need for technical support and access to expertise in data management on an on‐demand basis. Some explanation for the focus on knowledgeable peers as valuable sources of support can also be found in our discussion earlier in this report about the disciplinary variation in who is teaching, in what context, and with what goals. When we look at the diversity of instructors, contexts, and goals across the UW, it follows that support systems may need to be equally diverse to be effective.
The data for TAs closely followed the pattern for faculty, except that TAs used most UW resources and service units with less frequency than did faculty (Figures 15 and 17). The three most helpful sources of support for TAs were also the most used sources of support: self (trial‐and‐error) (used by 97.8%); other grad students in their department (88.3%); and friends (67.8%). Other sources of support used by more than half of TAs included UW online help or tutorial (55%); non‐UW online help or tutorial (64.5%); departmental tech support (58.3%); TA conference/training (56.1%); and faculty members (55.7%). TAs were less likely than faculty members to use their students as sources of technical support (44.2%) and to rate them helpful if they did so. These numbers suggest that TAs rely very strongly on knowledgeable peers for support and do not as frequently use, or may not be aware of, some of the resources at UW available to them. Also, despite the high percentage of TAs who reported using TA conference/training, the usefulness of this item as a source of technical support was lower than many others (1.7), suggesting that technical skills or support may not be the focus of most training TAs are provided. In write‐in responses at the end of the survey, some TAs also commented on the lack of training they were providing in regards to technology. According to one, “In the beginning, TAs are left to sink or swim, and are only given moderate help in figuring out what is available.”
Learning and Scholarly Technologies at the University of Washington (April 2009) 35
Again, student data followed a similar pattern, with locally available sources of support being the most used and considered the most useful (Figures 15 and 18). As was the case with faculty and TAs, the three most helpful sources of support for students were also the most often used: self (trial‐and‐error) (used by 98.0%); classmates (92.5%); and friends (87.8%). Other sources of support used by more than half of students were as follows: instructor/professor (78.6%); non‐UW online help or tutorial (75.9%); teaching assistant (66.1%); UW online help or tutorial (60.9%); and family (61.3%). Another interesting note involved the low levels of use for support available in computer labs and libraries: “computer lab assistants” were only used by 39.5% of students, “library help desk” by 35.8%, and “Learning Commons help desk consultants” by 19.3%. Since the 2008 surveys were conducted, LST has conducted user research that indicated that students had difficulty distinguishing between these roles due to confusing naming. As a result we recently stopped using the term “learning commons,” which had low recognition by students. Considering this, some of our data on computer lab and library support may be artificially low, since students may have had difficulty distinguishing between lab assistants, library help, and Learning Commons’ consultants. The measures of helpfulness for these items are potentially more reliable: these suggest that when students looked for support in these common facilities, they found useful help (Figure 15).
Supports by Expertise
When we compared faculty ratings of various sources of support based on expertise, we found that beginners rated some sources of support more helpful than did experts (Table 4). For instance, faculty who rated themselves at a beginning level of expertise (1 or 2 on our 5‐point scale) were more likely to find “teaching or research assistants” helpful than did experts (4 or 5 on our 5‐point scale). A similar pattern was true for students regarding “Library help desk.” The opposite was true for “trial‐and‐error” and “online help” for faculty, TAs, and students, with experts finding this source of support more helpful than did beginners. We saw the same pattern with “non‐UW online help or tutorial.” This pattern suggests that support for individuals with varying levels of expertise may need to be delivered in different ways to be most effective.
Learning and Scholarly Technologies at the University of Washington (April 2009) 36

Learning and Scholarly Technologies at the University of Washington (April 2009) 37

Learning and Scholarly Technologies at the University of Washington (April 2009) 38
SUPPORTS BY EXPERTISE TABLE 4
*Kruskal‐Wallis test
Supports Beginner Intermediate Expert Significance*
FACULTY Self (trial and error) 2.02
(n=91)
2.22 (n=236)
2.61 (n=193)
p<0.001
Non‐UW online help or tutorial 1.80 (n=41)
1.90 (n=143)
2.09 (n=152)
p<0.01
UW online help or tutorial 1.74 (n=42)
1.96 (n=175)
1.99 (n=142)
p<0.05
Teaching or research assistant 2.38 (n=48)
2.40 (n=123)
2.14 (n=93)
p<0.05
Catalyst workshop 1.70 (n=30)
2.04 (n=83)
1.83 (n=46)
p<0.05
TAs Self (trial and error) 2.05
(n=37)
2.39 (n=105)
2.78 (n=81)
p<0.001
Non‐UW online help or tutorial 1.79 (n=19)
1.96 (n=54)
2.19 (n=69)
p<0.001
Classroom Support Services 2.05 (n=22)
2.26 (n=54)
1.88 (n=26)
p<0.001
Professional society 2.22 (n=18)
2.34 (n=29)
2.00 (n=17)
P<0.01
Your students 2.00 (n=18)
1.90 (n=51)
1.85 (n=26)
p<0.05
STUDENTS Self (trial and error) 2.27
(n=96)
2.33 (n=310)
2.59 (n=225)
p<0.001
Non‐UW online help or tutorial 1.78 (n=65)
2.05 (n=234)
2.14 (n=182)
p<0.001
Friends 2.37 (n=87)
2.45 (n=283)
2.27 (n=190)
p<0.001
Learning and Scholarly Technologies at the University of Washington (April 2009) 39
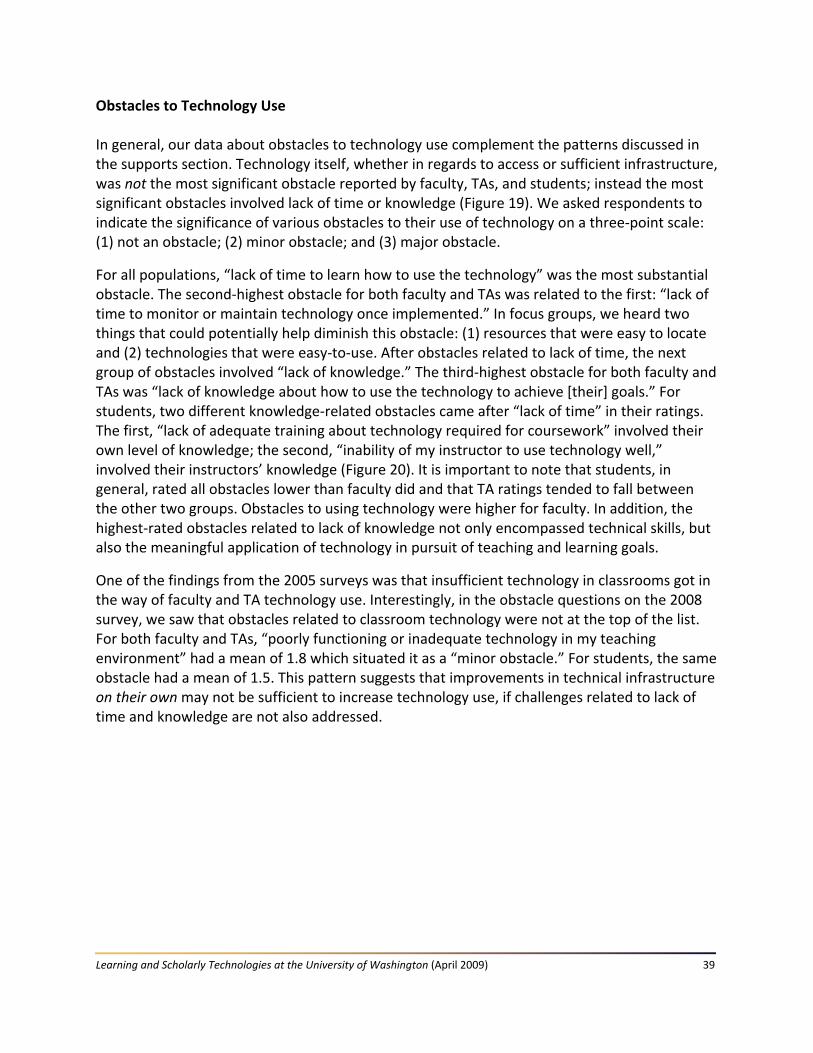
Obstacles to Technology Use In general, our data about obstacles to technology use complement the patterns discussed in the supports section. Technology itself, whether in regards to access or sufficient infrastructure, was not the most significant obstacle reported by faculty, TAs, and students; instead the most significant obstacles involved lack of time or knowledge (Figure 19). We asked respondents to indicate the significance of various obstacles to their use of technology on a three‐point scale: (1) not an obstacle; (2) minor obstacle; and (3) major obstacle.
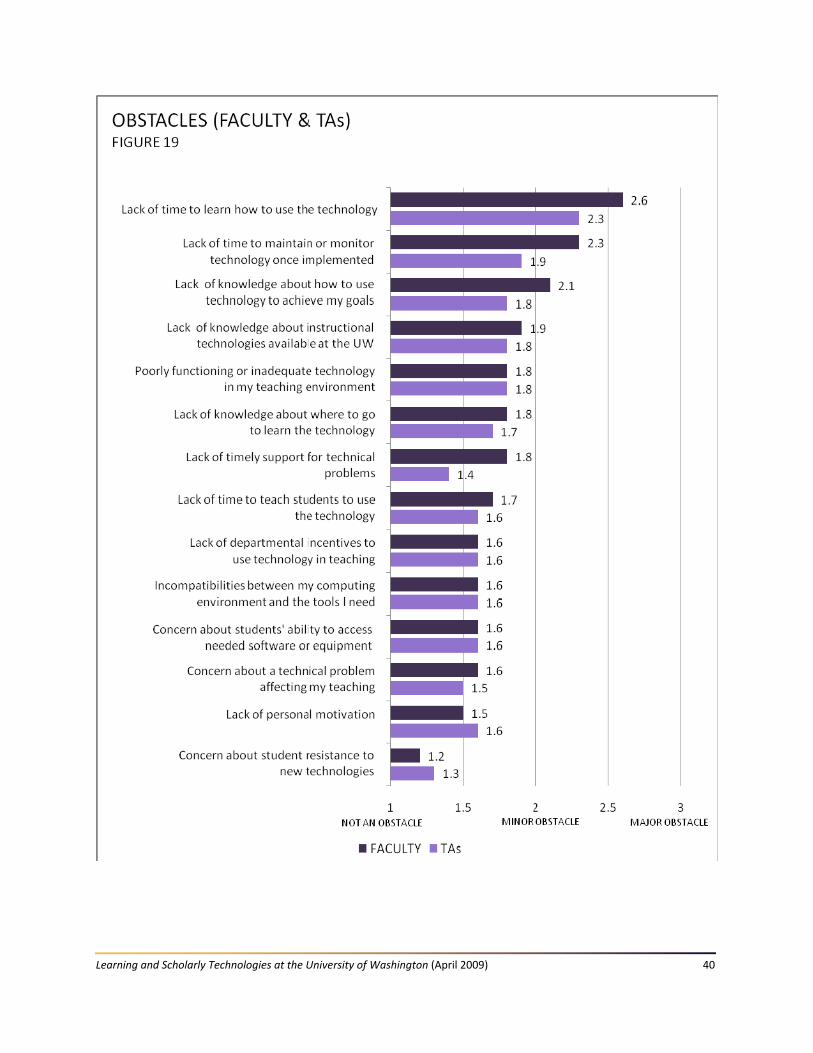
For all populations, “lack of time to learn how to use the technology” was the most substantial obstacle. The second‐highest obstacle for both faculty and TAs was related to the first: “lack of time to monitor or maintain technology once implemented.” In focus groups, we heard two things that could potentially help diminish this obstacle: (1) resources that were easy to locate and (2) technologies that were easy‐to‐use. After obstacles related to lack of time, the next group of obstacles involved “lack of knowledge.” The third‐highest obstacle for both faculty and TAs was “lack of knowledge about how to use the technology to achieve [their] goals.” For students, two different knowledge‐related obstacles came after “lack of time” in their ratings. The first, “lack of adequate training about technology required for coursework” involved their own level of knowledge; the second, “inability of my instructor to use technology well,” involved their instructors’ knowledge (Figure 20). It is important to note that students, in general, rated all obstacles lower than faculty did and that TA ratings tended to fall between the other two groups. Obstacles to using technology were higher for faculty. In addition, the highest‐rated obstacles related to lack of knowledge not only encompassed technical skills, but also the meaningful application of technology in pursuit of teaching and learning goals.
One of the findings from the 2005 surveys was that insufficient technology in classrooms got in the way of faculty and TA technology use. Interestingly, in the obstacle questions on the 2008 survey, we saw that obstacles related to classroom technology were not at the top of the list. For both faculty and TAs, “poorly functioning or inadequate technology in my teaching environment” had a mean of 1.8 which situated it as a “minor obstacle.” For students, the same obstacle had a mean of 1.5. This pattern suggests that improvements in technical infrastructure on their own may not be sufficient to increase technology use, if challenges related to lack of time and knowledge are not also addressed.
Learning and Scholarly Technologies at the University of Washington (April 2009) 40
Learning and Scholarly Technologies at the University of Washington (April 2009) 41

Learning and Scholarly Technologies at the University of Washington (April 2009) 42
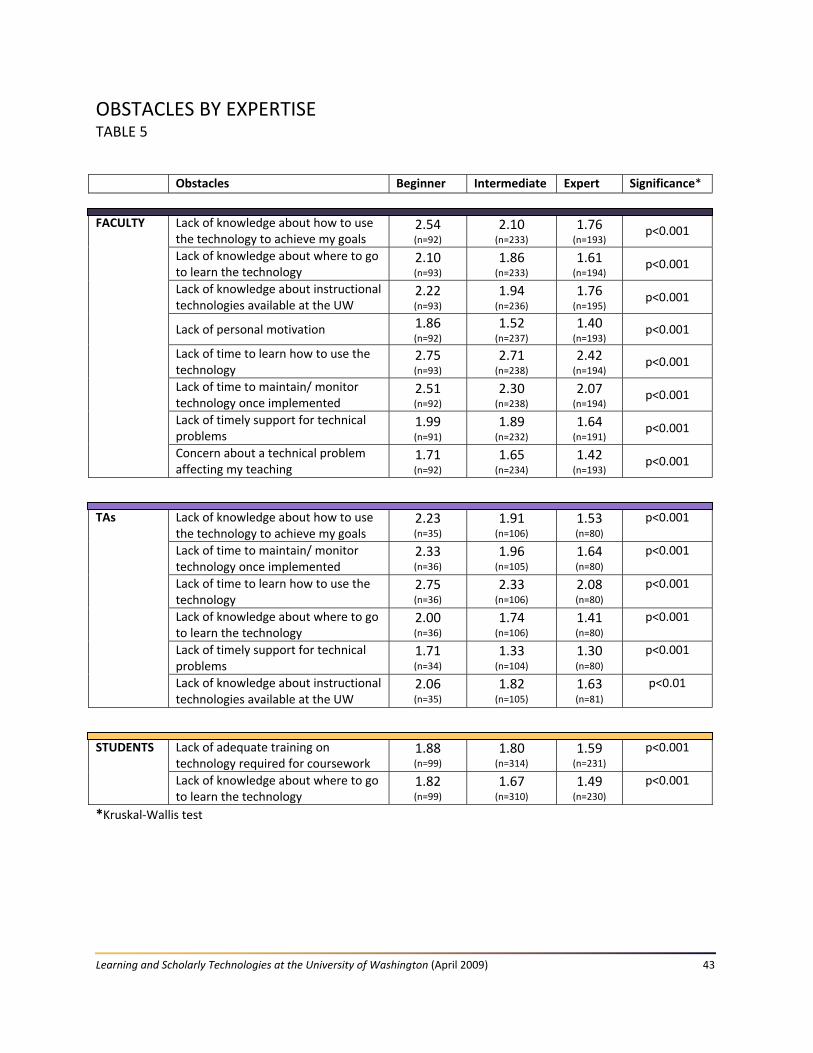
Obstacles by Expertise Table 5 shows the obstacle ratings of those faculty, TAs, and students with different levels of self‐rated technological expertise. For faculty, we found statistically significant differences comparing those with different levels of technological expertise for the following items: (1) “lack of knowledge about how to use the technology to achieve my goals;” (2) “lack of knowledge about where to go to learn the technology;” (3) “lack of knowledge about instructional technologies available for use at the UW;” (4) “lack of personal motivation;” (5) “lack of time to learn how to use the technology;” (6) “lack of time to monitor or maintain the technology once implemented;” (7) “lack of timely support for technical problems;” and (8) “concern about a technical problem affecting my teaching.” In all cases, faculty who rated their expertise at a beginning level were significantly more likely to rate an obstacle as more severe than were experts. Most notably, on the item “Lack of knowledge about how to use technology to achieve my goals,” beginners had a mean of 2.54, while experts had a mean of 1.76. On the other hand, for obstacles related to technology infrastructure, student access, technical incompatibilities, or departmental incentives there were no significant differences between faculty members with differing levels of expertise.
In general, TAs’ patterns closely followed the patterns for faculty described above, with the following exceptions: there was no significant difference between beginner and expert TAs for the item “concern about a technical problem affecting my teaching” and differences between beginner and advanced TAs were slightly less significant than they were for faculty for the items “lack of knowledge about technologies available for use at the UW” and “lack of personal motivation” (Table 5). A similar pattern was true for students, although for fewer items than for faculty or TAs. Two items showed statistical differences: “lack of adequate training on technology required for coursework” yielded a mean of 1.6 for experts and 1.9 for beginners, while “lack of knowledge about where to go to learn the technology” yielded a mean of 1.5 for experts and 1.8 for beginners. In both of these cases, however, even the mean for beginners fell below the “minor obstacle” point on the scale (Table 5).
Supports & Obstacles: Key Points
In general, all populations found knowledgeable peers (i.e., “classmates,” “colleagues,” and “departmental tech support”) to be the most useful sources of technical support.
The most significant obstacles to using technology involved lack of time and lack of knowledge, rather than infrastructure problems, technology access issues, or technical concerns.
Individuals with self‐rated expertise in the expert range were significantly more likely to find trial‐and‐error and online help more useful than were those at the beginner level.
Learning and Scholarly Technologies at the University of Washington (April 2009) 43
OBSTACLES BY EXPERTISE TABLE 5
*Kruskal‐Wallis test
Obstacles Beginner Intermediate Expert Significance*
FACULTY Lack of knowledge about how to use the technology to achieve my goals
2.54 (n=92)
2.10 (n=233)
1.76 (n=193)
p<0.001
Lack of knowledge about where to go to learn the technology
2.10 (n=93)
1.86 (n=233)
1.61 (n=194)
p<0.001
Lack of knowledge about instructional technologies available at the UW
2.22 (n=93)
1.94 (n=236)
1.76 (n=195)
p<0.001
Lack of personal motivation 1.86 (n=92)
1.52 (n=237)
1.40 (n=193)
p<0.001
Lack of time to learn how to use the technology
2.75 (n=93)
2.71 (n=238)
2.42 (n=194)
p<0.001
Lack of time to maintain/ monitor technology once implemented
2.51 (n=92)
2.30 (n=238)
2.07 (n=194)
p<0.001
Lack of timely support for technical problems
1.99 (n=91)
1.89 (n=232)
1.64 (n=191)
p<0.001
Concern about a technical problem affecting my teaching
1.71 (n=92)
1.65 (n=234)
1.42 (n=193)
p<0.001
TAs Lack of knowledge about how to use the technology to achieve my goals
2.23 (n=35)
1.91 (n=106)
1.53 (n=80)
p<0.001
Lack of time to maintain/ monitor technology once implemented
2.33 (n=36)
1.96 (n=105)
1.64 (n=80)
p<0.001
Lack of time to learn how to use the technology
2.75 (n=36)
2.33 (n=106)
2.08 (n=80)
p<0.001
Lack of knowledge about where to go to learn the technology
2.00 (n=36)
1.74 (n=106)
1.41 (n=80)
p<0.001
Lack of timely support for technical problems
1.71 (n=34)
1.33 (n=104)
1.30 (n=80)
p<0.001
Lack of knowledge about instructional technologies available at the UW
2.06 (n=35)
1.82 (n=105)
1.63 (n=81)
p<0.01
STUDENTS Lack of adequate training on technology required for coursework
1.88 (n=99)
1.80 (n=314)
1.59 (n=231)
p<0.001
Lack of knowledge about where to go to learn the technology
1.82 (n=99)
1.67 (n=310)
1.49 (n=230)
p<0.001

Learning and Scholarly Technologies at the University of Washington (April 2009) 44
Faculty and TAs with self‐rated expertise at the beginner level rated several obstacles significantly more severe than they were rated by experts. These included items relating to lack of time, lack of knowledge, and lack of motivation, but did not include items related to infrastructure or access.
Opinions & Priorities
All three surveys included questions that addressed respondents’ opinions and beliefs about technology and their priorities for the future. Opinions about Technology
We asked respondents to indicate their level of agreement with a number of statements about technology use on a 5‐point Likert scale: (1) strongly disagree; (2) disagree; (3) no opinion; (4) agree; and (5) strongly agree.19F
xix In general, responses corresponded with commonly‐held beliefs about technology (Figures 21 and 22). For instance, faculty disagreed with the statement, “I can teach most course material more effectively without technology;” on the other hand, faculty agreed with the statement, “I use technology to improve my students; learning.” However, there were a few more surprising aspects of these data. When given the same statement as faculty about teaching more effectively without technology, TAs responses yielded a considerably higher mean of 2.9. The latter response corresponds with TAs’ inconsistent technology use, as discussed earlier. Students were ambivalent with regards to the statement “Too much technology in the classroom gets in the way of my learning.” Students’ lack of opinion about whether or not too much technology hindered their learning corresponds with sentiments voiced in focus group discussions, where students emphasized that no amount of “cool technology” can substitute for good teaching.
When presented with the statement “Overall, the learning and scholarly technologies available at UW are adequate for my needs,” respondents in all populations expressed agreement. This belief in the adequacy of technology at the UW corresponds with the findings of the 2006 ATAC subcommittee that examined the future technology needs of faculty. In the 2008 surveys, students agreed with this statement more than faculty did. Belief in the adequacy of technology at the UW also was apparent in focus groups. There was a general perception among focus group participants that the UW possessed many resources and that the technologies that participants needed were available. However, the variety of options and multiple sources of information could sometimes be overwhelming when it came to learning new tools.
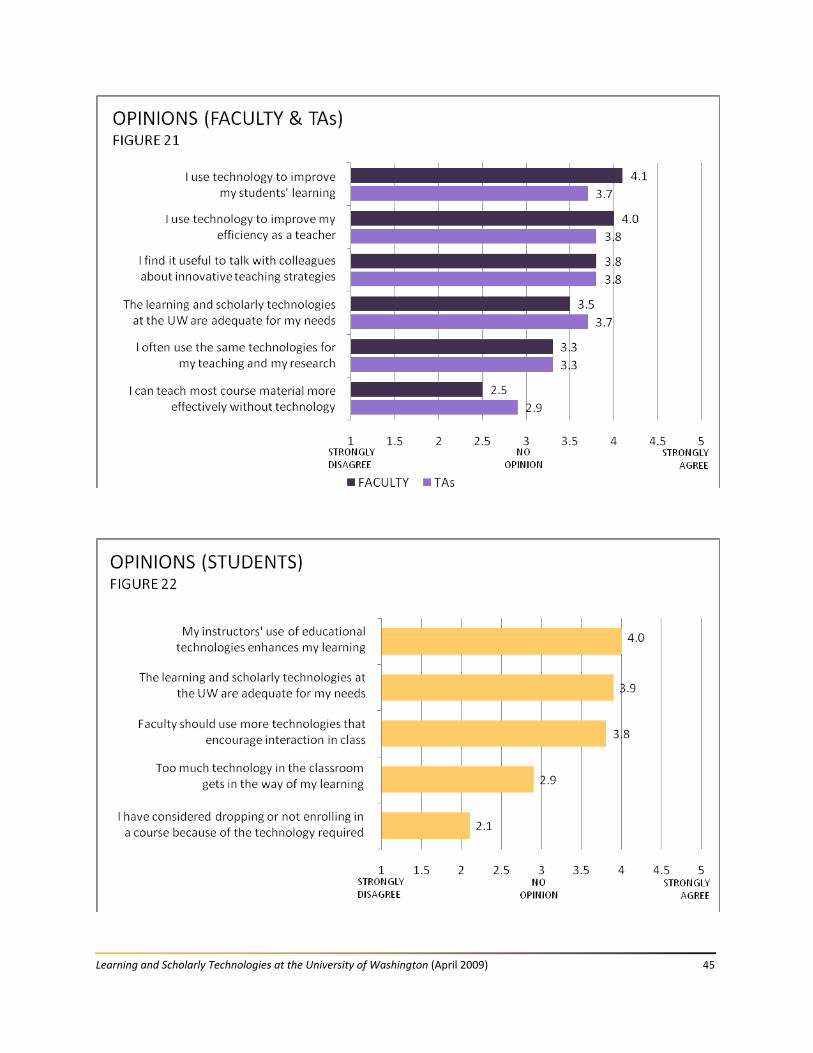
Learning and Scholarly Technologies at the University of Washington (April 2009) 45

Learning and Scholarly Technologies at the University of Washington (April 2009) 46
Opinions by Expertise
There were statistically significant differences between faculty members with different levels of technological expertise for nearly all of the opinion items (Table 6). In general, experts were more likely to agree with statements about the efficiency of technology and its ability to enhance various aspects of instruction. On the other hand, beginners disagreed less (although they still disagreed overall) with the statement about “teaching most material more effectively without technology.” There were fewer items with statistically significant differences between TAs with differing levels of technical expertise. Like faculty, TAs with lower expertise agreed less strongly than experts did with statements about technology’s efficiency and impact on student learning (Table 6).
A similar pattern was true for students, with the mean for beginners still showing some level of agreement, but not as strong as experts for the following items: “Faculty should use more technologies that encourage interaction in class” and “In general, my instructors’ use of educational technologies enhances my learning” (Table 6). On the other hand, while students at all levels of expertise reported means that expressed disagreement with the statement, “I have considered dropping or not enrolling in a course because of the technology it required,” students with lower expertise disagreed less strongly. In general these patterns show that respondents of all levels of expertise expressed opinions that highlighted the merits of using technology for various purposes; experts had a higher opinion of the benefits of using technology than did beginners (Table 6). Technological Priorities At the end of the Teaching and Learning section of the surveys we asked respondents to consider a series of potential actions that the UW could take over the next three years and to rate the level of priority of each item on a three‐point scale: (1) low priority; (2) medium priority; and (3) high priority (Figures 23 and 24). Several items on the list were common across all three populations, but we also listed priorities specific to faculty and TAs or to students, based on information gathered during our focus groups.
For faculty and TAs, the item rated as the top priority was the same: “reliable and consistent technology/software in all classrooms” (Figure 23). For students, classroom equipment was the item with the second‐highest priority rating (Figure 24). In 2005 one of the main findings from the surveys was that classroom infrastructure was inadequate. In 2005 focus group and write‐in responses at the end of the survey, instructors and students both voiced concerns about the lack of digital projectors in many small and medium classrooms, inconsistent hardware and software in classrooms, and different procedures for accessing and setting up equipment in various rooms. More significantly, faculty indicated that inconsistencies in room assignments from quarter to quarter meant that even when they taught in a well‐equipped room, they were reluctant to integrate much technology into their instruction, since they might be assigned a room with less equipment the next time they taught the class.
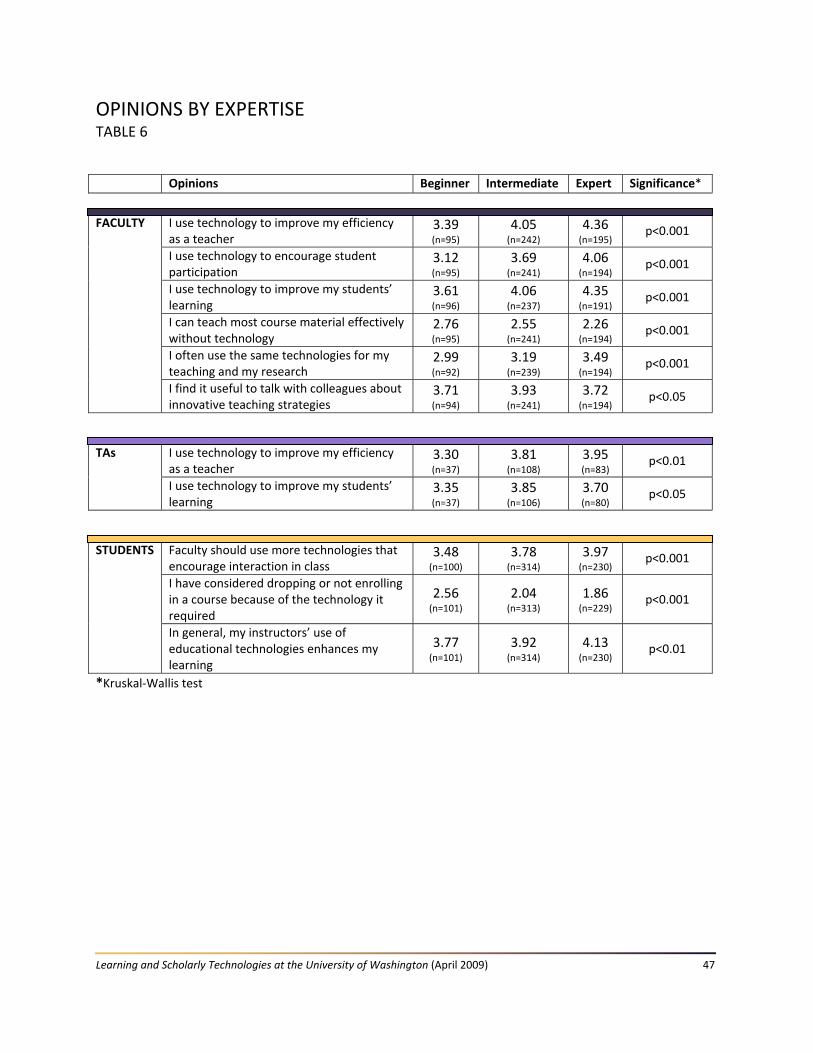
Learning and Scholarly Technologies at the University of Washington (April 2009) 47
OPINIONS BY EXPERTISE TABLE 6
*Kruskal‐Wallis test
Opinions Beginner Intermediate Expert Significance*
FACULTY I use technology to improve my efficiency as a teacher
3.39 (n=95)
4.05 (n=242)
4.36 (n=195)
p<0.001
I use technology to encourage student participation
3.12 (n=95)
3.69 (n=241)
4.06 (n=194)
p<0.001
I use technology to improve my students’ learning
3.61 (n=96)
4.06 (n=237)
4.35 (n=191)
p<0.001
I can teach most course material effectively without technology
2.76 (n=95)
2.55 (n=241)
2.26 (n=194)
p<0.001
I often use the same technologies for my teaching and my research
2.99 (n=92)
3.19 (n=239)
3.49 (n=194)
p<0.001
I find it useful to talk with colleagues about innovative teaching strategies
3.71 (n=94)
3.93 (n=241)
3.72 (n=194)
p<0.05
TAs I use technology to improve my efficiency as a teacher
3.30 (n=37)
3.81 (n=108)
3.95 (n=83)
p<0.01
I use technology to improve my students’ learning
3.35 (n=37)
3.85 (n=106)
3.70 (n=80)
p<0.05
STUDENTS Faculty should use more technologies that encourage interaction in class
3.48 (n=100)
3.78 (n=314)
3.97 (n=230)
p<0.001
I have considered dropping or not enrolling in a course because of the technology it required
2.56 (n=101)
2.04 (n=313)
1.86 (n=229)
p<0.001
In general, my instructors’ use of educational technologies enhances my learning
3.77 (n=101)
3.92 (n=314)
4.13 (n=230)
p<0.01
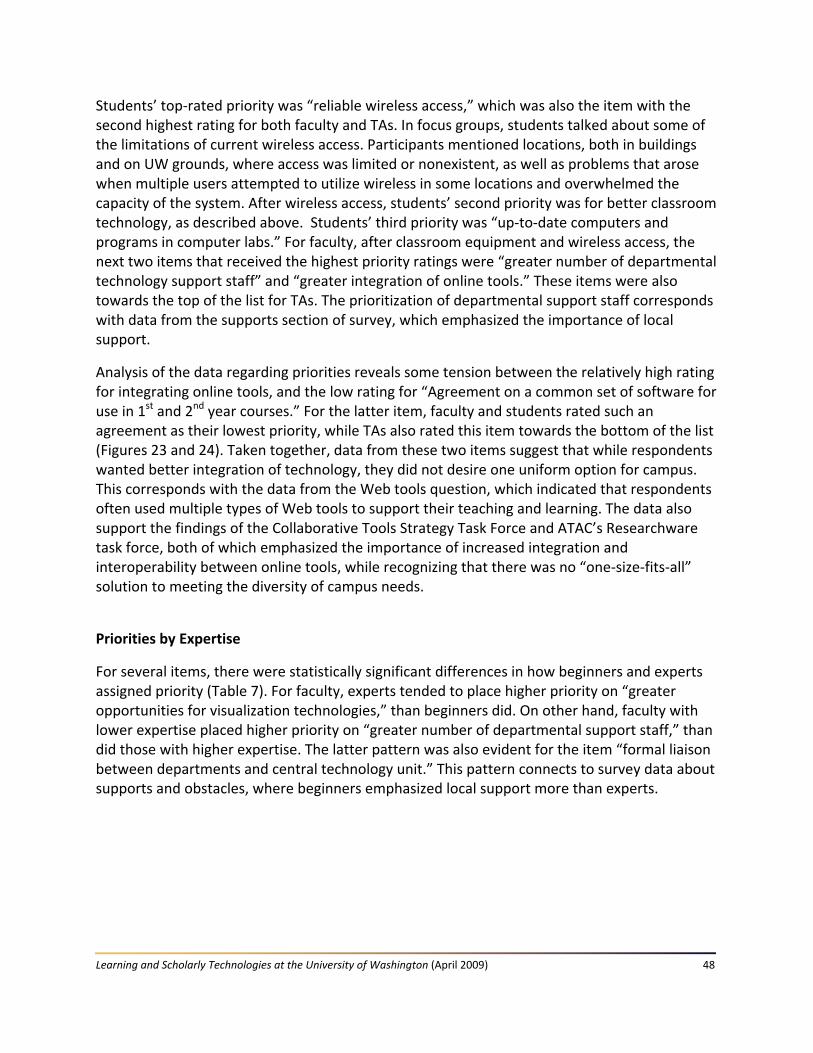
Learning and Scholarly Technologies at the University of Washington (April 2009) 48
Students’ top‐rated priority was “reliable wireless access,” which was also the item with the second highest rating for both faculty and TAs. In focus groups, students talked about some of the limitations of current wireless access. Participants mentioned locations, both in buildings and on UW grounds, where access was limited or nonexistent, as well as problems that arose when multiple users attempted to utilize wireless in some locations and overwhelmed the capacity of the system. After wireless access, students’ second priority was for better classroom technology, as described above. Students’ third priority was “up‐to‐date computers and programs in computer labs.” For faculty, after classroom equipment and wireless access, the next two items that received the highest priority ratings were “greater number of departmental technology support staff” and “greater integration of online tools.” These items were also towards the top of the list for TAs. The prioritization of departmental support staff corresponds with data from the supports section of survey, which emphasized the importance of local support.
Analysis of the data regarding priorities reveals some tension between the relatively high rating for integrating online tools, and the low rating for “Agreement on a common set of software for use in 1st and 2nd year courses.” For the latter item, faculty and students rated such an agreement as their lowest priority, while TAs also rated this item towards the bottom of the list (Figures 23 and 24). Taken together, data from these two items suggest that while respondents wanted better integration of technology, they did not desire one uniform option for campus. This corresponds with the data from the Web tools question, which indicated that respondents often used multiple types of Web tools to support their teaching and learning. The data also support the findings of the Collaborative Tools Strategy Task Force and ATAC’s Researchware task force, both of which emphasized the importance of increased integration and interoperability between online tools, while recognizing that there was no “one‐size‐fits‐all” solution to meeting the diversity of campus needs.
Priorities by Expertise
For several items, there were statistically significant differences in how beginners and experts assigned priority (Table 7). For faculty, experts tended to place higher priority on “greater opportunities for visualization technologies,” than beginners did. On other hand, faculty with lower expertise placed higher priority on “greater number of departmental support staff,” than did those with higher expertise. The latter pattern was also evident for the item “formal liaison between departments and central technology unit.” This pattern connects to survey data about supports and obstacles, where beginners emphasized local support more than experts.

Learning and Scholarly Technologies at the University of Washington (April 2009) 49
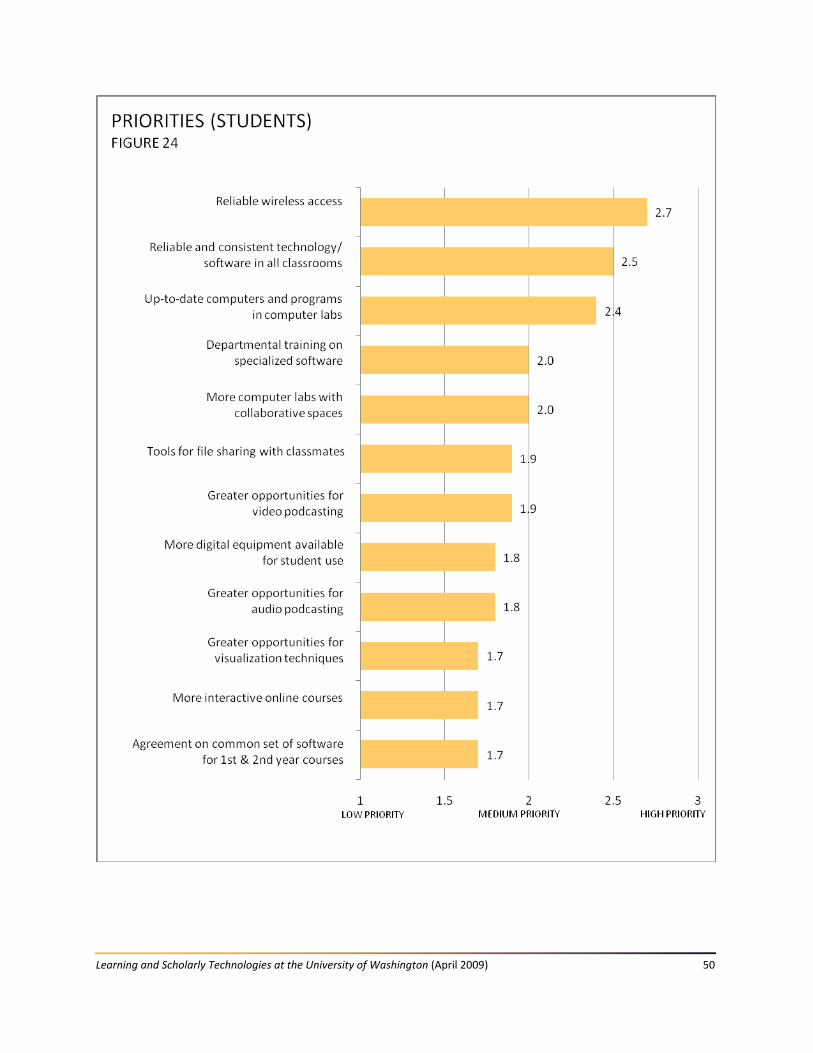
Learning and Scholarly Technologies at the University of Washington (April 2009) 50

Learning and Scholarly Technologies at the University of Washington (April 2009) 51
PRIORITIES BY EXPERTISE TABLE 7
*Kruskal‐Wallis test
Priorities Beginner Intermediate Expert Significance*
FACULTY Greater opportunities for visualization technologies (e.g. interactive graphics, virtual reality)
1.45 (n=84)
1.57 (n=229)
1.79 (n=190)
p<0.001
Greater number of departmental technology support staff
2.45 (n=92)
2.22 (n=232)
2.03 (n=192)
p<0.001
Formal liaison between departments and central technology unit
1.98 (n=88)
1.88 (n=228)
1.71 (n=188)
p<0.01
Regular forums for collegial discussion of teaching and technology
1.99 (n=88)
1.86 (n=232)
1.76 (n=189)
p<0.05
TAs Greater number of departmental technology support staff
1.95 (n=37)
2.00 (n=104)
1.61 (n=80)
p<0.01
One central technology unit responsible for informing others about available instructional technologies and their uses
2.17 (n=36)
1.95 (n=106)
1.73 (n=81)
p<0.01
STUDENTS Tools for file sharing with classmates 1.69
(n=101)
1.91 (n=315)
1.93 (n=229)
p<0.01

Learning and Scholarly Technologies at the University of Washington (April 2009) 52
There were two items where TAs had statistically significant differences based on expertise (Table 7). Like faculty, beginners were more likely to rate departmental support staff as a higher priority. Unlike faculty, TAs with lower levels of expertise were more likely to prioritize having “one central unit responsible for informing others about available instructional technologies and their uses.” For faculty, response to the latter item did not vary significantly by expertise. For students, only one item had significant differences based on expertise; students with more expertise were more likely to prioritize tools for file sharing with classmates (Table 7).
Student Priorities by Class Level
There were substantial differences between lower‐division students, upper‐division students, and graduate students for many priorities (Table 8). Most significantly, lower‐division students rated priorities related to access to audio and video podcasting and visualization technologies higher than other students did, which may indicate demand for these technologies will grow over time. On the other hand, upper‐division students rated the item “more computer labs with collaborative spaces” higher than other did other students. Opinions & Priorities: Key Points
Overall, learning and scholarly technologies at the UW were adequate for faculty, TAs, and students’ needs.
Infrastructure improvements related to classroom technologies and wireless access were the top priorities for faculty, TA, and student respondents.
More departmental support staff was also a priority for faculty and TAs and up‐to‐date computer labs was a priority for students.
Faculty and TAs desired more integration of online tools, but did not desire a uniform set of software in lower‐division courses.
For faculty, respondents whose technological expertise was at the beginner level were more likely to rate priorities related to local support higher than were experts.
For students, lower‐division students rated items related to accessing technologies such as podcasting and visualization higher than did other students.

Learning and Scholarly Technologies at the University of Washington (April 2009) 53
STUDENT PRIORITIES BY CLASS STATUS TABLE 8
*Kruskal‐Wallis test
Priorities Lower‐division
Upper‐division
Graduate student
Significance*
STUDENTS Greater opportunities for visualization technologies (e.g. interactive graphics, virtual reality)
1.90 (n=159)
1.70 (n=264)
1.54 (n=189)
p<0.001
Greater opportunities for audio podcasting 1.89 (n=159)
1.86 (n=264)
1.56 (n=190)
p<0.001
Greater opportunities for video podcasting 2.02 (n=159)
1.94 (n=262)
1.63 (n=191)
p<0.001
More computer labs with collaborative spaces
1.90 (n=160)
2.09 (n=264)
1.89 (n=192)
p<0.01
Reliable and consistent technology/ software in all classrooms
2.36 (n=160)
2.53 (n=263)
2.51 (n=192)
p<0.05
Agreement on common set of software for use in 1st and 2nd year courses
1.79 (n=161)
1.81 (n=262)
1.63 (n=189)
p<0.05

Learning and Scholarly Technologies at the University of Washington (April 2009) 54
Research Management & Collaboration
We concluded the faculty survey with a separate section on research management and collaboration. The questions in this section had a similar structure to the teaching and learning contexts questions earlier in the survey. First we asked faculty to select one research context that described their activities managing or participating on a research project or team from summer 2007 to winter 2008 and to answer questions about their tasks for that project and the technologies they used to complete those tasks. Research Contexts and Tasks The research contexts we had faculty choose from emphasized the different types of teams they could work with for research, in addition to solo research activities. Overall, 17.3% of faculty respondents indicated that they had been engaged in no research during the past year, while 26.7% selected the “solo project” context. Most faculty (54.9%) selected a collaborative context of some type, whether collaborating with a “UW departmental team,” a “UW interdisciplinary team,” or “an inter‐institutional team,” et cetera. Faculty who had not been engaged in research skipped to the end of the survey.
We next asked faculty to indicate all research management and collaboration tasks that were among their responsibilities in the context they had selected (Figure 25). By far, the most common tasks selected by faculty involved “Managing versions of files,” which was selected by 63.3% of respondents. Other common tasks included “tracking progress toward project milestones” (45.6%) and “archiving files” (43.6%). Several of the communication related tasks were towards the bottom of the list, with only 8.7% of faculty “enabling synchronous online communication” and 13.1% “recording/archiving online communication produced by project.”
Technology Use for Research
Faculty used very few technologies to support their research management and collaboration activities. When asked to select any technologies that they had used to complete their selected tasks, email was the only frequently selected technology: 88.6% of faculty reported using email (Figure 26). The next most commonly used technology was teleconferencing at 27.5%. The percentage of responses for most technologies on the list was quite low; 16 of 22 had use below 10.5%. Interestingly, “none of the above” selected by 4.7% of respondents was still selected more frequently than nine other technologies. These patterns show that faculty used a very limited number of technologies to support research management and collaboration activities. This pattern is consistent with findings from our Conversations with UW Research Leaders project which found that most researchers primarily relied on email and teleconferencing to meet their research communication and collaboration needs.
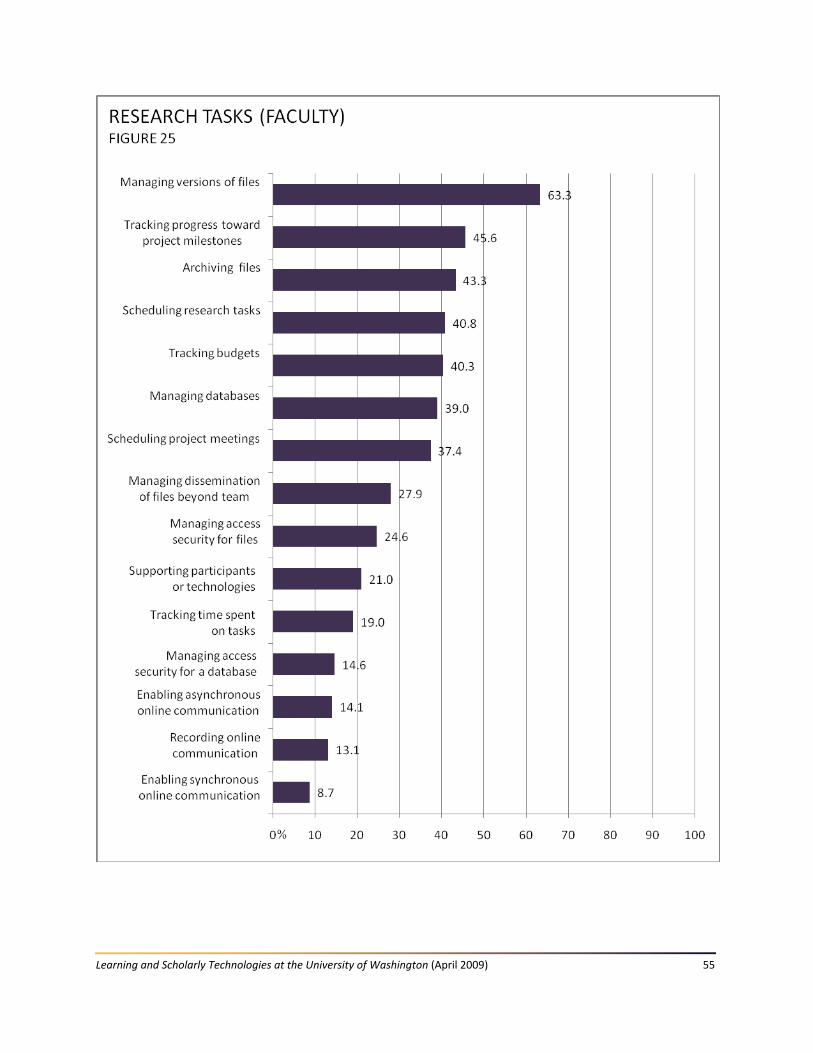
Learning and Scholarly Technologies at the University of Washington (April 2009) 55

Learning and Scholarly Technologies at the University of Washington (April 2009) 56
Learning and Scholarly Technologies at the University of Washington (April 2009) 57
Considering this data alongside findings from elsewhere in the surveys provides some potential explanations for this pattern. Faculty encountered obstacles related to lack of time to learn technologies in their teaching, as well as lack of knowledge on how to apply those technologies to achieve their goals; the same may well be true for technology use in research. In considering how best to support faculty moving forward it is important to consider their needs in the research domain as well as their instructional needs.
Research Technology Needs
At the end of the research section, we asked respondents to identify how the UW could best support their research collaboration and management activities over the next three years. The top needs faculty members expressed were (1) increased technical support, including assistance selecting and applying technologies; (2) more access to and information about collaborative technologies; and (3) streamlined administrative processes for grant management and human subjects review. Faculty’s comments on research technology needs highlighted obstacles related to lack of time and knowledge. As one faculty member stated, “I think I just need to be aware of what’s out there and find the time to learn how to use them.” Some faculty members directly asked for assistance in identifying useful technologies and learning how to apply them to meet their goals. In discussing collaborative technologies, faculty mentioned the importance of finding technologies that could be used for both instruction and research activities. According to one faculty member, it is important to ensure that collaborative tools are “very easy to pick up and use and are extremely flexible.” These patterns support the findings from the ATAC Researchware Task Force’s 2007 report, Evaluation of tools for research project management, and LST’s 2009 report, Conversations with UW Research Leaders. These patterns also correspond with data from the teaching section of the survey, suggesting that some technology needs transcend domains of activity.
Research Management & Collaboration: Findings
The most common research management and collaboration tasks reported by faculty involved various aspects of file management, as well as tracking project milestones, tasks, and budgets.
Faculty used very few technologies to support their research management and collaboration activities.
The top research needs faculty members expressed were (1) increased technical support, including assistance selecting and applying technologies; (2) more access to and information about collaborative technologies; and (3) streamlined administrative processes for grant management and human subjects review.
Learning and Scholarly Technologies at the University of Washington (April 2009) 58
CONCLUSION
The 2008 data provide valuable information about current patterns of technology use, while also highlighting faculty, TA, and student needs related to campus infrastructure, online technologies, and technical support. As departments and units at the UW make decisions related to learning and scholarly technologies, there are five key trends from the 2008 surveys that should be considered: (1) the general uniformity of technology use at the UW; (2) the need for infrastructure improvements; (3) the importance of support at the point‐of‐need; (4) the desire for both integration and flexibility in online technologies; and (5) the unique support needs of faculty, TAs, and students. We conclude our report with a discussion of these trends and their implications. 1. Uniformity of Technology Use
We specifically designed the teaching and learning contexts section of the survey to help us capture differences in technology use. We found that technology use was much more uniform than we had anticipated: a few technologies were widely used across contexts and goals, while others were seldom used. While the survey data do allow us to understand nuances of use that we could not see with previous instruments (i.e., comparisons between large lectures and seminars), the general breakdown of technology use within our data emphasized similarities rather than differences.
In general, only four technologies had use that we considered pervasive (selection in 50% or more of faculty, TA, and student responses across contexts): (1) email; (2) course or project Web pages; (3) word‐processing software; and (4) presentation software were widely used across respondents, disciplines, and contexts. In technology circles, most discussion focuses on “Web 2.0” technologies, those which encourage engagement and interaction, but the most used technologies at the UW did not fall within this category. Instead, they focused on content delivery or general communication. Technologies with pervasive use were also well‐established and widely used for activities beyond teaching and learning.
Some of the technologies that enjoyed moderate use (10 to 49% of responses) were more interactive; online discussion boards, file sharing, library databases and indexes, and other similar technologies fell within this category. More than half of the technologies we listed had limited use (less than 10% of responses); social networks, podcasting, blogs, and wikis were some of the technologies in this category. An important characteristic that separates technologies with moderate use from those with limited use was that there are well‐supported and centrally‐available options in place at the UW for technologies in the former category, while many of the technologies in the latter category have only minimally‐supported options available, requiring faculty, TAs, and students to learn how to use and apply the technologies largely on their own.
Learning and Scholarly Technologies at the University of Washington (April 2009) 59
2. Infrastructure Improvements
When asked what technology‐related actions the UW should prioritize over the next three years, the highest priorities for faculty, TAs, and students involved infrastructure. Improvements to classroom technology and wireless access were at the top of the list for all populations. Students also prioritized enhancements to campus computer labs. These patterns are consistent with findings from our 2005 surveys, which emphasized the need for improvements to classroom technologies and widespread interest in wireless access (which, in 2005, was just becoming available). However, data from elsewhere in the survey challenged some of the emphasis on infrastructure. Data about faculty, TAs, and students’ opinions about technology suggested that, in general, most found the current technology available at the UW adequate to their needs. Also, the most significant obstacles to technology use, as reported by all populations, involved lack of time and lack of knowledge, while obstacles related to classroom technologies and technology access were rated much lower. Taken together, these patterns suggest that the current infrastructure is adequate for meeting most needs, although improvements are desired. More importantly, they raise the possibility that infrastructure improvements alone may not promote technology use if obstacles related to lack of time and lack of knowledge are not also addressed.
3. Point‐of‐Need Support
Respondents’ ratings of the helpfulness of several sources of technical support indicated a strong need for support at the point‐of‐need. Faculty, TAs, and students, all turned to knowledgeable peers for support (e.g., “colleagues,” “classmates,” or “departmental support staff”). These sources of support were among the most consistently used by all respondents and the sources rated as the most helpful. Faculty, TAs, and students also frequently used online materials to support their technology use, which could also be accessed at the point‐of‐need. While all populations tended to rate online materials as helpful, most found them somewhat less helpful than knowledgeable peers. The pattern of relying on people at the point‐of‐need was particularly true for respondents who rated themselves as beginners on our technology‐expertise scale; also of note, expert users found online resources more helpful than beginners.
While infrastructure was the largest priority for all populations, obstacles related to lack of time (whether to learn how to use technology or to maintain and monitor it once implemented) topped the list of obstacles to using technology by all populations. Also of note, lack of knowledge on how to use technology to achieve instructional goals was a significant obstacle for faculty, particularly for those with lower expertise. When we look at the diversity of instructors, contexts, and goals across disciplines at the UW it follows that this knowledge may vary significantly by discipline. Support structures may need to reflect this diversity to be effective. The 2006 report by the ATAC subcommittee that looked at faculty’s future

Learning and Scholarly Technologies at the University of Washington (April 2009) 60
educational technology needs also presented a similar conclusion about the importance of local support. Overall, our data demonstrate the importance of recognizing a range of expertise within all populations and of offering support that helps individuals of varying skill levels. For the survey partners, and other central units, this pattern highlights the importance of connecting with the formal and informal local support networks that currently exist at the UW.
4. Integrated and Flexible Technology
Given the disciplinary variation in who is doing the teaching and the correlation of certain instructional contexts (e.g., “seminar/small discussion‐based class” or “large lecture”) by discipline, there is no standard instructional model at the UW. Despite the uniformity in technology use that emerged in our teaching and learning contexts, other survey data suggest that faculty, TAs, and students did not desire uniform technology on campus. All populations rated, “agreement on a common set of software for use in 1st and 2nd year courses” as one of their lowest priorities. However, “greater integration of online tools” was towards the top of the list of priorities for both faculty and TA, falling just after infrastructure improvements and “greater number of departmental support staff” in their ratings. Overall, data suggest that while current technologies at the UW are adequate to needs, they can be enhanced by greater integration of online tools and aggregation of information about available tools and resources. However, all populations value the flexibility of having multiple technologies available and often use multiple tools (or sets of tools) to meet their needs.
This tension between integration and flexibility also emerged in the report of the 2007 ATAC Researchware Task Force and in the 2008 report of the Collaborative Tools Strategy Task Force. For the survey partners, considering this pattern alongside obstacles related to lack of time highlights the importance of providing access to easy‐to‐use, easy‐to‐learn, and easy‐to‐maintain technologies that have wide applicability across disciplines and domains (i.e., instruction and research). More importantly, technologies supported centrally at the UW need to integrate easily with each other, as well as with other online tools or department‐created solutions—since there is no “one‐size‐fits‐all” solution to meeting faculty, TAs, and students’ technology needs.
5. Unique Needs of Faculty, TAs, and Students Looking across our survey data, many trends are consistent across populations, but there are also specific areas where faculty, TAs, and students have unique needs. Below we highlight patterns specific to each of these populations, as well as highlighting challenges for the UW to consider as we strive to meet their evolving needs.

Learning and Scholarly Technologies at the University of Washington (April 2009) 61
Faculty Our data show that faculty, TAs, and students all reported a similar level of technical expertise, so faculty skill was likely not as significant a barrier to technology use as conventional wisdom would suggest. The main pattern we saw with faculty technology use was that this population used a narrow range of technologies to meet their teaching and research goals. The technologies they primarily used had a strong content‐delivery focus, so integrating more interactive and participatory technologies (i.e., “Web 2.0” tools) is likely to require different practices. The main challenge going forward in supporting faculty in their use of learning and scholarly technologies is not how to help faculty use more technology, which on its own may not be beneficial, but how to help faculty better understand their options and opportunities with the technologies available to them. Since one of the obstacles faculty faced, particularly those with lower technical expertise, was lack of knowledge of how to apply technologies to achieve their goals, it is important for technology support efforts to focus on the application of technology. It would also be beneficial, as focus group data suggest, to provide more opportunities for faculty to learn strategies for using technology from each other. This pattern connects directly with the emphasis on support at the point‐of‐need, which can address disciplinary and context differences. Teaching Assistants
Our data showed that TA technology use was inconsistent. While TAs’ overall technology use was lower than faculty or students’, in contexts where TAs had more responsibility they used more technology. In addition, TA respondents were less likely to use UW resources and staff as sources of technical support than were faculty respondents. Considering the high proportion of 100‐ and 200‐level courses where TAs taught the course or taught a section, TA support should be a part of any discussion about undergraduate education at the UW. The main challenge in supporting TAs is to support them while they are at the UW, while simultaneously helping them develop technological knowledge that can transfer to other settings.
Students
Our data show that while overall student technology use mirrored the general pattern we saw among faculty and TAs—with some technologies consistently used and others seldom used across disciplines, contexts, and goals. There was one important difference in this pattern: students were more likely than faculty and TAs to use technologies in our limited use category to support their learning. Indeed, it was largely due to student use that technologies in this category were as high as they were (even though overall use for these tools still fell below 10% of faculty, TA, and student responses). This pattern suggests that students used a wider array of technologies to support their learning than faculty or TAs used in the courses they taught. Our survey focused on technology use within learning contexts, thus it did not capture students’ social use of technology. Familiarity with various technologies in social contexts may be a key
Learning and Scholarly Technologies at the University of Washington (April 2009) 62
force that drives students’ application of some technologies to learning contexts. At the same time there were several learning technologies, such as online discussion boards, online homework collection, or library databases that students first discovered how to use in their courses. The main challenge for supporting students in their use of technology is to better understand how students are using technologies, particularly emerging ones, to support their learning. It is also important for support units to keep in mind that students’ technical expertise grows and develops during the course of their education, both due to technical skills they learn in their courses and others they discover on their own. Students, like faculty and TAs, have differing levels of technical expertise and thus need different levels of support.
In closing, the purpose of the 2008 surveys was to provide data that would help the UW make informed decisions about where to devote time and resources over the next three years. Given the significant budgetary constraints the UW currently faces, it is likely to be challenging for the UW to make large financial commitments to infrastructure improvements and technology enhancements in the near future. However, the top priorities for 2008 survey respondents, including improvements to classroom technologies and wireless, were also priorities for respondents in 2005. These improvements are likely to remain priorities until addressed. There are, however, other trends in the data that are less directly tied to financial investments. The 2008 survey data provide information on how to address the support needs and minimize obstacles to technology use for faculty, TAs, and students, while also highlighting the differing needs of beginner and expert users. The data also provide useful information about requirements for online technologies. By taking into account the trends described above, the UW can better meet the evolving needs of its constituents.
ENDNOTES
i Lowell, N. & McGhee, D.E. (October 2001). Faculty survey on instructional technology 2001: Methodology and preliminary findings. Retrieved April 1, 2009, from http://www.washington.edu/oea/pdfs/reports/OEAReport0106.pdf
ii McGhee, D.E. (February 2003). The student survey on educational technology 2002: Methodology and descriptives. Retrieved April 1, 2009, from http://www.washington.edu/oea/pdfs/reports/OEAReport0304.pdf
iii Lane, C.A., & Yamashiro, G. (February 2006). Educational technology at the University of Washington: Report on the 2005 instructor and student surveys. Retrieved April 1, 2009, from http://www.washington.edu/lst/research_development/papers/2006/edtech_2005report
iv ATAC Courseware Subcommittee, University of Washington. (September 27, 2006). Report to ATAC about the educational technology needs of UW faculty. Retrieved April 1, 2009, from http://www.washington.edu/president/tacs/atac/meetings/2006‐07/materials/11.01.courseware.task.force.subcommittee.report.pdf

Learning and Scholarly Technologies at the University of Washington (April 2009) 63
v ATAC Researchware Task Force, University of Washington. (November 2007). Evaluation of tools for research project management. Retrieved April 1, 2009, from http://www.washington.edu/president/tacs/atac/meetings/2007‐08/materials/12.06.researchware.report.pdf
vi Collaborative Tools Strategy Task Force, University of Washington (November 21, 2008). Collaborative tools strategy task force report. Retrieved April 1, 2009, from http://www.washington.edu/provost/oim/reports/CTSTF_Report_Final_Draft.pdf
vii Fournier, J., Koester, G., Lane, C. A., Lewis, T., & Washington, W. (February 2009). Conversations with University of Washington research leaders: Final report. Retrieved April 1, 2009, from http://www.washington.edu/lst/research_development/papers/2009/Conversations_UW_Research‐Leaders.pdf
viii Faculty and TA recruitment emails were signed by Werner Kaminsky, Chair of the Faculty Council on Educational Technology; Mary Pat Wenderoth, Chair of the Faculty Council on Instructional Quality; and Ron Johnson, Vice President and CTO for UW Technology. Student recruitment emails were signed by Eric Godfrey, Vice Provost of Student Life; and Neil Rotta, Chair of the Student Technology Fee Committee.
ix The surveys included a greater variety of age ranges than shown here. To facilitate data analysis, age groups were condensed into a smaller number of age categories.
x Office of Planning and Budgeting, University of Washington. (April 7, 2009). Human resources 2007‐08. Retrieved April 1, 2009, from http://www.washington.edu/admin/factbook/OisAcrobat/2007‐08_human_resources_seattle.pdf
xi A random sample of women faculty respondents was selected (n=169; 38%) and combined with the total sample of men faculty respondents (n=275; 62%) to generate a sample that corresponded with the gender composition of faculty as of autumn 2007, according to The UW Office of Planning and Budgeting’s report cited above. The means for survey items from the selected sample fell within the 95% confident intervals of the means of the original sample of survey respondents. Thus, we conclude that the disproportionately higher number of women in our sample were not biasing the results.
xii A random sample of women student respondents was selected (n=261; 52%) and combined with the total sample of men students respondents (n=239; 48%) to generate a sample that corresponded with the gender composition of the UW student population in spring of 2008. The means for survey items from the selected sample (N=500) fell within the 95% confidence intervals of the means for all participants (N=657). Thus, we conclude that the disproportionately higher number of women in our sample were not biasing the results.
xiii p<0.001 Mann‐Whitney U‐test
xiv The 2005 instructor and student surveys used a five‐point scale for expertise: (0) don’t use; (1) beginner; (2)
intermediate; (3) advanced; and (4) expert.
xv For most of the context data analysis we look at the number of respondents that selected a particular context at least once. This method is different than the method used in the OEA tables, which analyze the data in terms of percentage of responses rather than respondents.
xvi We grouped the following “online courses, labs, and small groups” into one category that includes the following: online course; lab (course‐based); computer lab; studio/ ensemble/rehearsal; small group instruction; and tutoring. We also grouped the following “skills development contexts” together: field experience; internship/practicum/clinic; research team/lab; and workshop/training. Finally, we grouped contexts related to “informal advising” together: mentoring; advising (office hours/independent study); advising (library help desk);

Learning and Scholarly Technologies at the University of Washington (April 2009) 64
and informal conversation (in person or online). Since no respondents selected “online learning community” we omitted this item from our analysis.
xvii The wording for some of the goals varied for each population, but the topic remained the same. For instance, students could select the learning goal of “actively participate and share my thinking,” while faculty could select the instructional goal of “encourage greater student participation and/or interaction.” We grouped this “participation” goal together with “cultivate community and connection” under the heading “greater participation/ interaction.” We also grouped “real‐world experience” with “synthesize experiences in and outside the classroom” under the heading “prepare for real‐world experience.” We omitted two goals for faculty from our analysis due to the extremely low number of selections.
xviii The data in this figure shows the percentage of selections for each technology of the total possible selections for each technology. For example, of the 2671 opportunities for participants to select that they used “email”, it was selected 2140 times (80.1%).
xix In the surveys, we used the following Likert scale: (1) strongly agree; (2) agree; (3) no opinion; (4) disagree; and (5) strongly disagree. We reversed the scale for data analysis and presentation such that (1) strongly disagree; (2) disagree; (3) no opinion; (4) agree; and (5) strongly agree.