Embed Size (px)
Citation preview

Law Enforcement, Municipal Budgets and Spillover Effects: Evidence from a Quasi-Experiment in Italy
Sergio Galletta
CESIFO WORKING PAPER NO. 5707 CATEGORY 2: PUBLIC CHOICE
JANUARY 2016
An electronic version of the paper may be downloaded • from the SSRN website: www.SSRN.com • from the RePEc website: www.RePEc.org
• from the CESifo website: Twww.CESifo-group.org/wp T
ISSN 2364-1428

CESifo Working Paper No. 5707 Law Enforcement, Municipal Budgets and Spillover Effects: Evidence from a Quasi-Experiment in Italy
Abstract In this paper, I empirically investigate the presence of spillover effects resulting from the strengthening of law enforcement against corruption and organized crime in local governments. Specifically, I take advantage of an Italian law that gives power to the central government to replace democratically elected municipal officials who are potentially connected with mafia with a commission of non-elected administrators. Fixed effects model estimates that focus on a sample of municipalities from three Italian regions (Campania, Calabria and Sicilia) for the period 1998 to 2013 show that the city council dismissal of a municipality fosters a reduction in public investments in neighboring municipalities. Additional empirical evidence suggests that this result could be explained by the presence of law enforcement spillovers potentially reducing misconducts in neighboring municipalities.
JEL-codes: D730, E620, K420.
Keywords: horizontal interaction, Italy, mafia, corruption.
Sergio Galletta Institute of Economics (IdEP)
University of Lugano Switzerland – 6904 Lugano
I wish to thank Gianmarco Daniele, Ruben Durante, Mario Jametti, Stephan Litschig, Paolo Pinotti, Hannes Mueller, Albert Solé-Ollé, Raphaël Parchet, Pilar Sorribas-Navarro and Juan Carlos Suarez Serrato for insightful comments. I have also benefited from comments by participants at the Sinergia Workshop (Lugano), CESifo Workshop (Dresden) and SIEP (Ferrara). Financial support from the Swiss National Science Foundation (grants Early Postdoc.Mobility - 15860) is gratefully acknowledged.
1. Introduction
Political corruption negatively affects economic growth and fosters excessive andinefficient public spending (Mauro, 1995, 1998; Del Monte and Papagni, 2001; Arinet al., 2011; Hessami, 2014). In countries where sub-national governments are left withlarge autonomy, the negative effect is potentially amplified (Brueckner, 2000). This isparticularly important with respect to public spending as a decentralized setting couldworsen problems of corruption and increase the occasions that favor, for example, bribesor rents (Bardhan and Mookherjee, 2006; Fan et al., 2009). Theoretical arguments andrecent empirical evidence suggest that monitoring activities and punishments could beeffective in reducing these types of misconducts making possible more efficient publicspending (Becker, 1968; Becker and Stigler, 1974; Di Tella and Schargrodsky, 2003;Olken, 2007; Litschig and Zamboni, 2011).
Interestingly, despite these relevant findings on the direct effect of anti-corruptionpolicies, there is very little empirical evidence focusing on their potential spillover ef-fects.1
This paper aims to complement the existing research by analyzing the presenceof spillover effects that could come from anti-corruption policies. Every time there isan intervention directed at fighting corruption in a specific area or jurisdiction, onecould expect its neighbors to be affected as well. For instance, the effective controlof illegal activities in the administration of a locality can yield positive spillovers be-cause it works as a credible threat for similar activities in neighboring areas (Sah, 1991;Rincke and Traxler, 2011). Nevertheless, alike to what happens with more commoncriminal operations, one might also expect that dishonest conducts in public adminis-tration will relocate to other jurisdictions (Knight, 2013; Dell, 2015). Moreover, anti-corruption policies that have an important effect on the public budget can favor eitherpositive or negative fiscal spillovers (Besley and Case, 1995; Case et al., 1993). Hence,whether spillover effects exist and whether they increase or decrease the benefits of
1For example, Silva (2010) and Carozzi and Muço (2015) account for the potential presence ofspillovers by studying the effect of Brazilian random auditing policy on neighbors’ outcomes (e.g.,electoral results or corruption); Acemoglu et al. (2015) study spillover effects of local state capacityin Colombia; Durante and Gutierrez (2015) investigate how inter-jurisdictional cooperation amongMexican municipalities can prevent crime.
2

anti-corruption activities is an empirical matter.Specifically, this paper empirically tests the presence of transitory spillover effects
by linking variation in spending on public investment by Italian municipalities with theapplication of a policy that aims to control political corruption due to mafia infiltrationin local administrations.2 For decades organized crime has taken advantage of localspending by draining public resources.3 In 1991, after a period of very intense activityby organized crime, the parliament approved a law that gives the power to the Italiancentral government to dismiss the city council of municipalities where local officials arefound to have a potential relationship with the mafia. This law was issued with theclear objective of cracking down on corruption in public administrations due to orga-nized crime. From 1991 until 2013, there have been 243 council dismissals concerning191 municipalities in total. Not surprisingly, more than 90% of these municipalitiesbelong to the three regions of Italy in which there is a historical presence of mafia-type organized crime (Campania, Calabria and Sicilia). During the dismissal period ofusually 18 months, a commission of three technocrats, having equal powers as electedofficials, governs the municipality. I provide descriptive results that confirm the anec-dotal evidence suggesting that commissioners cut expenditures on public investment asthese are likely to be affected by the mafia influence.
The central finding of this study is derived from a fixed effects model that valuesthe effect of city council dismissal in a municipality on the investment spending of itsneighboring municipalities. I do so using data from municipalities belonging to theregions of Campania, Calabria and Sicilia considering the period from 1998 to 2013.To reduce concern about potential selection bias, my estimates focus on the sampleof treated municipalities (i.e., those municipalities which have at least one neighborthat experienced a city council dismissal in the period of time of the analysis). Thisallows me to produce causal estimates of the spillover effects by exploiting both thetime series and the cross-sectional variation in the sample. Therefore, to give a causalinterpretation of the results, I rely on the assumption that the time of a council dismissal
2It is worth noting that the results from the Eurobarometer survey (issue 245) show that morethan 50% of the persons interviewed believes that most of the corruption is caused by organized crime.Importantly, Italy is the country with the highest percentage of people agreeing on (71%).
3Estimates from the Corte dei Conti, the Italian Court of Auditors, suggest that nearly 40% of thecost of large-scale public investments is due to corruption.
3
in the neighboring area is random conditional on controls. I test the robustness of theidentifying assumption by first showing that unobservables need to be relatively large,compared to observables, to invalidate my finding (Altonji et al., 2005; Oster, 2015).Second, I apply a placebo test that suggests the absence of anticipatory effects.
From these first estimates, I suggest that spillovers exist as the compulsory ad-ministration of a municipality negatively affects public investments in its neighbors.These results, however, do not yield clear evidence on the mechanism by which thesespillovers exist. For instance, this reduction in investment could be due either to areduction in corruption or waste (i.e., law enforcement spillover), or the consequenceof fiscal spillovers (i.e., yardstick competition and benefit spillovers). Hence, I providefurther checks, which indicate that a large part of the negative effect on investmentcan be explained by the presence of law enforcement spillovers. In fact, I find that themunicipalities which actually react are those which are more likely to generate illegalactivity (i.e., those municipalities where the mafia is active). Further, I specifically ruleout the presence of fiscal spillovers due to yardstick competition by showing that elec-toral incentives do not significantly affect the main result. Finally, I apply a falsificationtest showing that spillovers are present only if commissioners are assigned because ofmafia infiltration and not for other reasons.
Overall, this analysis provides a new empirical evidence that polices put in placeto reduce corruption could produce spillover effects. In the case of Italy, compulsoryadministration seems to cause positive spillovers as there is a decrease in public in-vestment in jurisdictions neighboring the areas that are subject to the intervention.Further evidence suggests that this effect is potentially driven by a reduction in mis-conducts in the neighboring local administrations. In sum, the results highlight thatanti-corruption policies can induce benefits which spread beyond the geographical limitsof the intervened jurisdiction.
The remainder of the paper is organized as follows. Section 2 illustrates the insti-tutional framework while Section 3 presents the data used in the empirical estimation.Section 4 lays out first results on the direct effect of compulsory administration onthe municipal budget and provides an explanation on the potential mechanisms thatproduce spillovers. Section 5 describes the empirical strategy. Section 6 shows anddiscusses the results. Section 7 concludes.
4
2. Institutional Background
2.1. Municipal level institutions and budget
Italy is structured on three different sub-national tiers of government. There are 20regions (regioni), 110 provinces (province), and around 8000 municipalities (comuni).The focus of this paper will be on the lowest administrative unit of government. Italianmunicipalities are administrated by the mayor (sindaco) together with the executivebranch (giunta) and the city council (consiglio comunale). The mayor and the citycouncil are elected for a term of 5 years. The former has a limit of two terms andchooses the members of the executive branch. In general, national parties participatein local elections, though in smaller municipalities the presence of independents or localparties is fairly high. National and local parties, commonly, form coalitions and standfor elections with the same mayoral candidate.
Italian municipalities’ spending responsibilities are in different areas such as theenvironment (e.g., water and waste management, pollution monitoring, regulation andpreservation of urban green spaces), education (e.g., kindergarten, supplementary ser-vices for primary school), transport (e.g., road maintenance, public transport), welfare(e.g., social housing, aids to needy people) and culture (e.g., library, museum). Specif-ically, considering the aggregated municipal budget for the year 2013, almost 30% ofthe municipal expenditure is for administrative cost, while policy related to traffic andtransport, and to environmental services accounts, respectively, for 20% and 13% of thetotal expenditure. Moreover, around 70% of the total expenditure was used for currentspending while 16% went to investments. The remaining 14% came from either loansrepayment or expenditure on behalf of third parties.
These expenditures are largely covered by transfers from other tiers of governmentor by the municipalities own revenue. The tax instruments at the hands of the munici-palities are mainly property tax and a surcharge on the national income tax.4 In 2013,roughly 40% of the revenue was derived from local taxation, while 15% from transfersand another 15% from non-tax revenues. The remaining 30% came from either sales ofpublic assets, loans or revenue on behalf of third parties .
4The property tax was abolished and reintroduced several times during the period of the analysis.In the years in which it was not in place, municipalities usually received transfers from the centralgovernment to compensate for the missing revenues.
5

2.2. The law against mafia infiltration
Italy suffers from the pervasive presence of organized crime. In recent decades,in addition to the problems that organized crime created in the real economy, mafiainfiltration in the public administration impacted and inflated public budgets.5 Duringthe 1980s and early 1990s several laws were passed in order to address the damagesthat mafia-type organizations were producing in the Italian economy.6 Among thesemeasures, in 1991 the Italian parliament approved a law (D.L. 31/05/1991, n. 164)that allows the central government, through the Ministry of Interior, to dismiss thecity council of municipalities that are found to have potential connections with themafia. In place of the democratically elected officials, a commission composed of threenon-elected members governs the municipalities for an in initial period of usually 18months, which can be extended to a maximum of 24 months.7 The clear goal of this lawis to break the links between the local public administration and the mafia. Typically,the process starts with a police investigation that identifies the presence of contactsbetween municipal officials and organized crime. Interestingly, most of the time theseinvestigations begin for reasons which are extraneous to the direct involvement of mafiain the public admnistration.8 This information is then passed to the representative ofthe Ministry of Interior at the provincial level, the prefetto, which gives the task to acommission to report, within 3 months, on whether the local government is likely to beliable to prosecution. After the final report is drafted, the prefetto has 45 days to notifythe Ministry of Interior. The latter decides whether there are grounds to dismiss the
5Caneppele and Martocchia (2014) describe in detail the different channels that the mafia uses totake advantage of public contracts.
6Usually, laws were approved right after very violent attacks against people who were a symbolof the war with the mob. For instance, article 416-bis of the penal code that specifically targets theoffence of mafia-type association (associazione mafiosa) was approved in September 1982 as a reactionto the assassination of Gen. Dalla Chiesa, who was at that time the representative of the Ministry ofInterior in the province of Palermo.
7The law approved in 1991 was largely integrated in 1993 (D.L. 20/12/1993, n. 529) with detailson the actual powers of the commission. In 2000 (D.Lgs. 18/08/2000, n. 267) it was merged withexisting laws regulating the activities of local jurisdictions (TUEL). Additional changes occurred in2009 (L. 15/07/2009, n. 94).
8Commissione parlamentare d’inchiesta sul fenomeno delle mafie e sulle altre associazioni criminali,anche straniere - 2005.
6

municipality and in that case the President of the Republic will confirm this decision byissuing a decree. At the end of the period of compulsory administration, new municipalelections are held.
Since the law’s approval until the end of 2013, there have been 243 city councildismissals involving 191 municipalities in total.9 Figure 1 shows the number of dismissedmunicipalities by year. Of them, 147 experienced compulsory administration once, 36twice and 8 three times. Further, the city council dismissal has been eventually declaredunjustified and hence revoked 19 times. To a certain extent, the fact that almostone-fourth of these municipalities experienced the dismissal more than once suggeststhat the application of this law does not seem to permanently affect the presence ofmafia activity in public administration. Indeed, many critics were expressly againstthe law because of its very limited long-term effects. For this reason, the paper avoidsexploring the long run effects and focuses more on the existence of temporary effectsthat correspond with the presence of the compulsory administration.
Table 1 provides insights on where these municipalities are located. As expected,almost the totality of these municipalities are in southern regions which, traditionally,have active Mafia-type crime organizations: Mafia in Sicilia, ’Ndrangheta in Calabria,Camorra in Campania and Sacra Corona Unita in Puglia. Recently, however, Liguria,Lazio, Piemonte and Lombardia have been experiencing a few city council dismissals.
3. Data
I assembled a database that brings together information from a variety of sourcesfor all municipalities belonging to the Italian regions of Campania, Calabria and Siciliaover the period 1998–2013. As shown, compulsory administration for mafia infiltrationis more frequent in the south of Italy. Indeed, the regions of Campania, Calabria andSicilia account for more than 90% of all dismissals in the frame time considered here.10
This allows me to achieve a certain degree of homogeneity in the sample composition,which helps to reduce bias stemming from using heterogeneous municipalities in termsof unobservables. In addition, for data availability reasons, I have to restrict my data-
9The complete list of all municipalities is reported in Table A.1 in Appendix A.10Golden and Picci (2005) suggest that these are also the Italian regions with the highest level of
corruption.
7
set from the year 1998 until 2013 by leaving out the first 7 years from the law’s approval.This partial data, however, should not significantly impact my analysis, as I consider a16-year period in which more than half of the total number of dismissals occurred.
My first source of information is the website of the Minister of Interior, from whichI gather municipal spending data.11 I collect data on total expenditure, current expen-diture and investment expenditure.12
Second, I have taken information about the political status of each municipality inthe sample from the database provided by the Ministry of Interior called “Anagrafedegli Amministratori Locali e Regionali”, which contains information on public officialsin power in sub-central level jurisdictions. Since I noticed that this database sometimesdoes not report clearly whether a municipality is under compulsory administrationbecause of mafia infiltration or not, I checked the original decrees of the President ofthe Republic and complemented the database information accordingly. From here, Iconstruct two variables compulsory administration and council dismissal. The first oneis a dummy variable taking the value of 1 for the three-year period starting from theyear in which a municipality experiences a city council dismissal, and 0 otherwise. I doso, since compulsory administration can be of different lengths (i.e., from 12 up to 24months) but most of the time lasts for at least 18 months, and there is usually a 1-yeardelay for budget decisions to take place. This is the more conservative way to look atthe effect of the compulsory administration as it considers all years in which either thewhole or at least part of the budget process has been affected by the commissioners.The second variable, council dismissal, is equal to 1 for the year in which the city councilhas been dismissed (i.e., the first year of compulsory administration), and 0 otherwise.
In order to create the main regressor, I relate the presence of compulsory admin-istration with information on the level of neighborliness among municipalities. There-fore, the variable neighbors compulsory administration is equal to 1 when at least oneneighboring municipality has the dummy compulsory administration equal to 1, and0 otherwise. Similarly, the variable neighbors council dismissal is equal to 1 when at
11I am thankful to Luca Repetto for having shared his data on municipal expenditures to allow meto check and complement my database.
12In a few cases the website of the Minister of Interior was missing information with respect tomunicipal budgets. Although this slightly reduces the total number of observations in the sample, itshould not affect my analysis as these occurrences are likely to be random.
8
least one neighboring municipality has the dummy council dismissal equal to one, and 0otherwise. Specifically, the measure of neighborliness is constructed by using data fromthe “Matrici di contiguità, distanza e pendolarismo” provided by the Italian statisticaloffice. Geographical proximity is probably the most relevant characteristic to take intoaccount. Hence, my definition considers neighbors of a municipality i all those munici-palities that share a border with it. This is a standard approach in the research relatedto spillovers.13 Indeed, I expect the physical closeness among municipalities to be theright measure to account for the relevant theoretical channels supporting my empiricalanalysis, which are highlighted in Section 4.2.14
Additionally, I create two dummy variables: other council dismissal and other com-pulsory administration. Both account for a council dismissal in a municipality forreasons other than mafia infiltration. While the first variable is equal to 1 only in theyear in which the dismissal occurred, the second takes value 1 for a two-year periodfrom the beginning of the dismissal. That is because in these cases the commissionerstays in power for 1 year, rather than 18 or 24 months, which means that the periodin which his decisions can take effect is shorter than that of compulsory administra-tion for mafia infiltration.15 These events are ruled by the law D.Lgs. 18/08/2000, n.267 art. 141. For instance, commissioners are called to govern a city whenever thereis a resignation of elected officials, the annual budget is not approved or the mayordies. Clearly these are more common events compared to compulsory administrationfor mafia infiltration. Moreover, the variable commissioner accounts for whether ina given year a municipality is run by commissioners (i.e., governed by commissionerseither because of mafia infiltration or due to other reasons) or by elected officials.
Again from the “Anagrafe degli Amministratori Locali e Regionali”, I compute fur-ther variables that I use as additional controls. Local party takes the value 1 when amunicipality is governed by a mayor who has no party affiliation or who belongs to alist with no clear connection to a national party, and 0 otherwise. A second variable,electoral cycle, is a measure that weighs the strength of electoral incentives depending
13See, for example, Case et al. (1993), Bordignon et al. (2003) and Lyytikäinen (2012).14Summary statistics of each variable are reported in Table 2. Figures B.1, B.2 and B.3 in Appendix
B show where the municipalities of interest are located.15Following the strategy mentioned in the previous paragraph, I also compute the variables neighbors
other council dismissal and neighbors other compulsory administration.
9
on the expected time (in years) from the next election. Thus, as the electoral incentivesare stronger when the elections are closer, the variable counts the number of years fromthe last election.16
Further, I collected time-varying control variables from the “Atlante statistico deicomuni” provided by the Italian statistical office. These variables include municipalpopulation and dependency ratio. I construct the latter using the percentage of the oldand young population (share pop > 64 and share pop < 15 ).
Finally, I define the time-invariant variable mafia. It identifies those municipalitieswhere the mafia is more likely to be active and hence the probability of having a cor-rupted municipality is relatively higher. Thus, following Buonanno et al. (2015), thevariable mafia is a dummy that takes the value 1 for each municipality that experiencedat least one real estate or firm seizure related to crimes committed by mafia-type orga-nizations. I use data provided by the ANBSC (Agenzia Nazionale per l’amministrazionee la destinazione dei beni sequestrati e confiscati alla criminalita’ organizzata) that ac-counts for the number of seizures connected to mafia-type organizations starting fromthe 1980s until the end of 2012.
4. The consequences of a city council dismissal
4.1. The direct effect of compulsory administration
All actions taken by the commissioners aim at eliminating political corruption andensuring the smooth functioning of the local administration. This is the central aim ofthe policy. Typically, the commission uses its power to cancel any contract or concessionconfirmed by previous governors that is clearly illegitimate. Other immediate cuts in thebudget are normal as the commissioners need time to gather more information on thegeneral status of the expenditure structure. However, these important reductions in thebudget are usually experienced in the first year of compulsory administration while inthe remaining periods there is usually an increase in expenditure due to implementationof the new decisions taken by the commission. Interestingly, Acconcia et al. (2014)provided both anecdotal and empirical evidence on the effect compulsory administration
16It happens that this variable reports values higher than 4, which is supposed to be the highestpossible value because elections are held every 5 years. This is due to the arrivals of commissionersright at the end of the term.
10
has on public decisions showing that provinces with at least one council dismissal reducethe total amount of investment in infrastructure compared with provinces with nodismissal.
To make sure that compulsory administration has direct impacts on different cate-gories of municipal spending in line with existing research, I report below some usefuldescriptive evidence. I run two sets of regressions where I link municipal annual bud-gets and compulsory administrations focusing on the 124 municipalities from my samplethat experienced at least one dismissal. The first set investigates what happens to thebudget the first year the commission takes office. In the second set, I test how thepresence of commissioners affects spending in the following years (three-year period).Table 3 shows the results from the OLS estimates using as a dependent variable, sepa-rately, municipal total expenditure, current expenditure and expenditure on investmentin per capita term. The results reported in column (1) of Table 3, show that the currentexpenditure is not affected in the first year of the city council dismissal while invest-ment is more than 45% lower than the average expenditure from the other periods.This strong reduction in investments affects total expenditure, which also experiencesa slight decrease. Column (2) highlights that compulsory administration significantlylowered expenditure not just in the very first year but also in the following years. In thiscase, total and current expenditure are not affected. Instead, spending in investmentis reduced, on average, by nearly 15% in each year of the three-year period after thecouncil dismissal.
It is worth noting that these results are not meant to identify the direct effect ofcorruption on public spending, though the presence of a decrease only on investment,and not in current spending, is in line with previous research showing that corruptioncan lead to potentially inefficient over-investment in the public sector (Mauro, 1998;Tanzi and Davoodi, 2000). In fact, further reasons could explain this evidence. Forinstance, compulsory administration might improve the quality of the local officials.Indeed, there is a high probability that municipal officials during the compulsory ad-ministration are more competent than those previously in power. The latter relies onthe assumption that education level is positively related to competency (Galasso andNannicini, 2011; Besley et al., 2011). If this is the case, a commission composed ofsenior officials from the Italian civil services is likely more competent than an average
11

mayor from a dismissed municipality.17 Moreover, from a political economy perspec-tive, one can argue that the dismissal of a city council because of mafia infiltrationreplaces politicians with bureaucrats. As it is well known in the literature, decisions ofpoliticians with electoral incentives are different from decisions of bureaucrats (Besleyand Coate, 2003; Alesina and Tabellini, 2007). For example, the latter are less proneto be influenced by lobbies or enact policy just to please voters.
Summing up, compulsory administration along with a reduction in corruption pro-duces a negative effect on public spending on investment. However, whether the latteris solely a direct consequence of the former is not clear as other possible mechanismscould take place at the same time.
4.2. Compulsory administration and spillovers
This paper evaluates spillover effects by looking at how municipal investment spend-ing is affected by the crackdown on political corruption in a neighboring municipality.Since local spending decisions could be responsive to several of the consequences of thecrackdown in the “vicinity”, I discuss a number of relevant competing channels.
For instance, Sah (1991) suggests that law enforcement can produce spillovers. Heargues that an individual’s perceived risk of punishment, which has a direct impact onthe probability of engaging in criminal activities, is endogenously determined and itimportantly depends on detections in the vicinity.18 Here, this would mean that thepresence of a municipality under compulsory administration might affect existing fraud-ulent activities in other neighboring jurisdictions as it updates agent’s risk perceptions.In a recent study, Rincke and Traxler (2011) provide empirical evidence confirmingSah’s (1991) predictions. They show that Austrian households’ compliance behaviorwith respect to TV license fees increases in those communities where some householdsexperience enforcement from the arrival of licensing inspectors. Importantly, they showincreasing compliance among both treated and untreated households. Therefore, one
17Interestingly, local officials are not only better during compulsory administration. Daniele and Geys(2015) study the effect of compulsory administration for mafia infiltration on the level of education ofthe newly elected representatives after compulsory administration. They find that they are on averagemore educated compared to those from the dismissed city council.
18Sah’s (1991) model relaxes the assumption of exogeneity of the risk and perception of detection,which is standard in the literature building on the influential model of crime by Becker (1968).
12
should expect that the city council dismissal would produce a decrease in the occurrenceof corruption activities not just in the municipality affected but also in its neighbor-ing municipalities. In this scenario, the spillover effect should produce a reduction inneighboring municipalities budgets.
Alternatively, as corruption is driven here by the presence of organized crime in thepublic administration, one might expect a reaction from the criminal organization thataims at compensating for the reduced amount of revenues from public resources comingfrom the dismissed municipality. For instance, one might expect an increase in thenumber of other types of illegal activities in the dismissed municipality. However, for thescope of the current study, the most interesting event would be the potential temporaryrelocation of the mafia interests to other areas.19 In this scenario, the mafia wouldhave the incentives to meddle with public activities in the neighboring municipalities.Indeed, if this was the mechanism at work, one should expect an increase in spendingon investment in these municipalities.
Finally, as one of the clear effects of compulsory administration is a reduction inpublic investments, fiscal spillover might show up as well. These competing channelsfocus on the well-established idea in public finance that spending decisions from onegovernment should be affected by decisions taken by its neighbors (Besley and Case,1995; Case et al., 1993).20 In particular, yardstick competition models link the qualityof a government with the performance of its neighbors (Besley and Case, 1995). Underthe assumption that neighboring municipalities have similar shocks, voters can infer thequality of a government by comparing its performance with that of its neighbors. Hence,office-oriented politicians will adjust fiscal decisions accordingly to their neighbors tomaximize their probability of reelection or political consensus. In this context, thedismissal of a municipality produces two consequences: first, it reveals the quality offormer local officials; second, it improves the quality of the local officials by assigningpower to the commission. These information shocks increase the awareness of citizenswith respect to the quality of their own politicians who may react by mimicking thebehaviors of the commissioners. Therefore, one may expect that public investment will
19See, Knight (2013) and Dell (2015) as recent empirical examples that stress how law enforcementaffects crime relocation in neighboring jurisdictions.
20See also, for example, Baicker (2005), Bordignon et al. (2003) or Solé-Ollé (2006).
13

decrease not only in municipalities put under compulsory administration but also inneighboring jurisdictions. An alternative explanation is the presence of classical benefitspillovers where public goods or services provided by a jurisdiction increase the utilityof citizens from neighboring municipalities because they consume them free of charge(Case et al., 1993).
Overall, city council dismissals should produce enough changes so that in the casespillovers exist they would impact budget decisions in neighboring municipalities. How-ever, both the mechanism through which the externality should occur and whether thisis positive (i.e., decrease in neighboring expenditure) or negative (i.e., increase in neigh-boring expenditure) is not clear.
5. Methodology
5.1. The estimation strategy
Most of the literature on spillover effects has focused on standard spatial econo-metric models. In principle, these models improve the results from OLS estimatesby taking care of the omitted variable bias due to the spatial correlation (Anselin,1988). However, in a recent contribution, Gibbons and Overman (2012) contend thatthe identification of these models is correct only if very strong assumptions hold andtherefore their results could be misleading.21 Interestingly, the policy under study canbe considered as a source of exogenous variation that is likely to overcome issues risingfrom spatial dependence in the error terms. Hence, a reduced form approach basedon OLS models, which satisfy specific identifying assumptions, should allow estimateswith causal interpretation. My strategy is composed of two steps. First, I evaluatewhether council dismissal in a municipality affects public spending of neighboring mu-nicipalities. While this analysis emphasizes whether spillovers are likely to exist or not,
21Typically, these models use an IV strategy where the policy implemented by a jurisdiction (e.g.,tax rate or public expenditure) is regressed against a weighted average of those implemented by itsneighbors. Eventually, socio-economic characteristics of these neighbors are used to instrument theendogenous variable. These instruments, however, do not seem to satisfy the required exclusion restric-tion. Indeed, it is likely that either the instruments do directly affect the main dependent variable orthere are unobserved characteristics which are correlated with both the instruments and the dependentvariable. An alternative methodology is the Maximum Likelihood (ML), which still relies on strongassumptions in terms of both exogeneity and distributional and functional form.
14

it does not reveal anything about the mechanism through which city council dismissalsshould affect neighbors’ budget. Hence, as a second step, I complement this approachby further checks that aim at understanding which channels are likely to play a role.Formally, in the baseline analysis I estimate the following model:
Yipt = βTit + αXit + δi + χpt + εit, (1)
where i denotes a municipality, p the province and t the year. Yipt, the dependentvariable, refers to expenditure in the investment of a municipality i in year t. Instead,Tit, depending on the specification, is equal to either neighbors city council dismissalor neighbors compulsory administration. The first variable takes the value 1 the year inwhich at least one neighbor experience a council dismissal, while the second is a dummytaking the value of 1 if at least one of the neighbors of the municipality i experiences acity council dismissal in year t or has experienced it in the previous two years (i.e., in t,t−1 or t−2). Xit are time varying municipal controls, while δi and χpt are municipalityand province-year fixed effects, respectively. Finally, εit is the error term.
5.2. Identification issues
As already suggested, under certain conditions, the estimates of the β coefficientfrom the fixed effects model of equation (1) can mimic a randomized experiment andrepresent the causal effect of compulsory administration on local public spending ofneighboring municipalities.
A first concern is that the municipalities which are neighbors of a municipalityput under compulsory administration could be systematically different from the othermunicipalities in the sample. In this case it would be difficult to make a comparisonbecause the city council dismissal would affect “treated” and “un-treated” municipalitiesin very different ways. In order to get rid of this potential selection bias, I decide tofocus all my regressions only on those municipalities that experienced the treatmentat least once (i.e., have at least one neighboring municipality put under compulsoryadministration in the time period considered). Although this implies a reduction in thenumber of municipalities considered, it makes it possible to produce causal estimatesunder weaker identifying assumptions.22 In fact, given the previous sample restriction
22The whole sample would be composed of 1348 municipalities. With the restriction it includesaround 400 municipalities with each of the two different measures of neighborliness I use.
15

the estimates will provide a causal evidence if the timing of city council dismissal amongneighboring municipalities is random conditional on the controls. With regard to this,it is worth stressing that for a municipality the occurrence of a city council dismissalhas some elements of exogeneity as the decision is taken by the central government.Nevertheless, one may still expect that municipalities that are put under compulsoryadministration have engaged in behaviors triggering the city council dismissal. Yet, thisevent is clearly exogenous and potentially unexpected for their neighboring municipal-ities (i.e., those I am interested in). However, in order to consistently reduce furtherconcerns about potentially omitted variable bias, I control for fixed and time varyingmunicipal characteristics.
The model includes municipality fixed effects to control for distinctive municipalfeatures that are fixed over time. This removes concerns about specific municipal char-acteristics that could bias the estimates because they are correlated with budget deci-sions. For instance, they account for the historical presence of organized crime in a givenmunicipality and its effect on public spending. Importantly, the main specification alsocontrols for all time-varying characteristics at the provincial level. The inclusion of theprovince-year fixed effects is a very strong element in my specification as it controlsfor attributes varying over time for a rather small geographical area (e.g., GDP shocksor changes in the provincial government). They control for potential variability, bothwithin and between provinces, in the abilities of the prefetto in running his office andthus of properly using the policy of interest. Additionally, as I already described inthe data section, I include a set of time-varying control variables that might help inincreasing the precision of my estimates.
Finally, I follow two different approaches in order to test the identifying assumptions.First, I look at the relative size of the omitted variable bias by examining how theinclusion of additional controls affects the size of the coefficient of interest. On theone hand, the introduction of controls can produce a significant variation in the maincoefficient. This implies that the estimated coefficient is likely to be affected by theintroduction of even more controls and, hence, the bias coming from omitting controlscould confound my estimate. On the other hand, the inclusion of further controlscan have a very limited impact on the size of the main coefficient. In this case thestability of the coefficient would favor a causal interpretation of the results. I follow thepapers of Altonji et al. (2005) and Oster (2015) to produce a formal test. Therefore,
16
I quantify how large the effect of unobservables has to be to neutralize the estimatedeffect under the assumption that the selection on observables is proportional to theselection on unobservables. Second, I give evidence from a placebo test that controlsfor anticipatory effects by including leads that represent dummies for future compulsoryadministration in neighboring municipalities. This should emphasize whether municipalspending was somewhat affected by the presence of unlawful conduct in an eventuallydissolved neighboring municipality.
5.3. Identifying the channels
While the baseline specification aims at estimating the effect of the council dismissalon neighboring municipalities’ spending, it does not deal with the alternative theoreticalreasons on why this might occur. In Section 4.2 I suggested a number of explanations onwhy spillovers should exist. Although it is arguably difficult to empirically distinguishamong the different determinants of spillovers, I complement the basic results withadditional estimates.
I begin by looking at how the main regressor interacts with variables that proxy ei-ther for presence of local officials’ electoral incentives or of corrupting behaviors (mafia).
One relevant channel that could explain spillovers from the city council dismissalto the spending decision of neighbors is yardstick competition. As described in Section3, I constructed the variable electoral cycle to account for the variability of electoralincentives over the years of each term. That should help me to verify whether the effecton expenditure of a city council dismissal in a neighboring municipality increases thecloser the year of the next election. Hence, I run the following equation:
Yipt = β1Tit + β2Tit ∗ ElecCycleit + αXit + δi + χpt + εit, (2)
that replicates the main specification of equation (1) but adds the interaction betweenelectoral cycle and either neighbors city council dismissal or neighbors compulsory ad-ministration. Therefore, if yardstick competition is the explaining mechanism, I shouldexpect the interaction term to be significantly different from 0 and the sign to be thesame as Tit, as its effect should be stronger.
Alternatively, I aim at testing whether there is relocation of mafia activity or attenu-ation of corruption activities in other municipalities. In order to study these alternative
17

mechanisms I estimate the following model:
Yit = β1Tit + β2Tit ∗Mafiai + αXit + δi + χpt + εit, (3)
which adds to my main specification a term that interacts either neighbors city councildismissal or neighbors compulsory administration with the variable mafia which defineswhich of the municipalities are more likely to be mafia-ridden.
Unfortunately, it is a very hard task to measure the variation in mafia activityover time in a given municipality. This is also more challenging in this analysis as Iam using municipal observations.23 Nevertheless, my baseline specification implicitlycontrols for variation in mafia-activities over time at the provincial level (province-yearfixed effects) and accounts for the historical presence of mafia in a specific municipality(municipality fixed effects). Indeed, it is worth mentioning that several studies on theorigins of organized crime in the south of Italy have confirmed that the location of mafiaactivity across different areas today has arisen from the specific conditions of decades orcenturies ago (Buonanno et al., 2015). Therefore, if the presence of mafia in a territory isto a certain extent predetermined, I can test the plausibility of this channel by verifyingwhether the presence of mafia activity in a municipality makes the potential spilloverstronger or weaker. The idea is that ceteris paribus municipalities that are likely to havea history of mafia in the territory should react differently to the city council dismissalof a neighboring municipality with respect to the other municipalities in which themafia is less likely to be present. If there is a relocation of fraudulent activities toneighboring municipalities, the sign of the overall effect is supposed to be positive.However, organized crime could move to where it is not already active or increase itsstrength in municipalities where it is long-standing. Therefore, the interaction termcould go in either direction.
The same equation can be used to test the case of law enforcement spillovers, whichproduce an attenuation of corruption in neighboring municipalities (i.e., the overall ef-
23Of the existing research about mafia in Italy, there is no study that accounts for variation over timeof mafia activity at the municipal level. Papers that study the municipality level (see, for example,Barone and Narciso (2015)) focus on cross-section analyses. The other papers that account for variationover time of mafia activity were aggregating information at a provincial level (see, for example, Acconciaet al. (2014) or Pinotti (2015)).
18

fect is negative). In this case the variable mafia tells something about the probabilityof having a corrupted government in a municipality, assuming that mafia-ridden mu-nicipalities are more likely to be corrupted. Again, the focus is on the interaction term.Thus, I expect the effect to be stronger in those municipalities with a higher probabil-ity of mafia presence in their territory, which means a negative sign for the interactionterm.
It is worth mentioning that for both equations (2) and (3) the identifying assumptionis the same as that in the baseline analysis. Indeed, the variable mafia is fixed andlocal elections in Italy do not occur for all municipalities in the same year (i.e., they donot have a systematic correlation with the presence of compulsory administration in aneighboring municipality).
To summarize, the overall effect is supposed to be negative if either yardstick com-petition or law enforcement spillovers are present, while it should be positive if there is arelocation of mafia activities. Under yardstick competition, the interaction term needsto be negative, as I expect stronger incentives the closer are the next elections. Alsopositive law enforcement spillovers should produce a negative sign in the interactionterm, as the municipalities more affected by a reduction in corruption in a neighboringmunicipality are those more likely to be corrupted. Moreover, if there is a relocation ofmafia activity, the sign of the interaction can go either way.
Finally, similar to Acconcia et al. (2014) and Daniele and Geys (2015), I provideadditional results from a falsification test in which I focus on the effect generated bycity council dismissals that occurred for reasons not related to mafia infiltration in thepublic administration. The idea is to look at how local spending reacts to the occur-rence of such an event in a neighboring municipality and compare it with the effectalready estimated in previous sections. To do so, I replicate part of the results usingas main regressors either other compulsory administration or neighbors other councildismissal or neighbors other compulsory administration instead of compulsory admin-istration, neighbors council dismissal and neighbors compulsory administration, respec-tively. If the intervention of commissioners who are in power for reasons other thanmafia produces a similar direct effect on investment (i.e., a reduction on expenditure oninvestment in municipalities that experience the council dismissal), then I can empha-size the presence of fiscal spillovers that are not determined together with a crackdownin corruption. In other words, law enforcement spillovers should not be observed in this
19

scenario. Therefore, if I find spillovers in both types of compulsory administration itis likely that fiscal spillovers are in place (i.e., either yardstick competition or benefitspillover). Instead, if only compulsory administration for mafia infiltration producesspillovers, these are more likely to be either law enforcement spillover (negative sign)or mafia relocation (positive sign).
6. Results
6.1. Baseline results
Table 4 reports the effect of compulsory administration in a municipality on publicinvestment of neighboring municipalities using the two different regressors I mentionedin the previous section: neighbors city council dismissal or neighbors compulsory admin-istration. Importantly, as I am considering only the group of “treated” municipalities,this coefficient identifies the average treatment effect on the treated. In the first threecolumns (1 to 3), the focus is on a three-year period from the city council dismissal,while the latter three (4 to 6) account for the very first year of compulsory administra-tion.
In column (1), I include only the main regressor without any additional controls.The coefficient would suggest a reduction of investment of 8% when a neighbor is putunder compulsory administration. However, this effect is not significantly different fromzero from a statistical point of view.24 In column (2), I add municipality fixed effectsand province-year fixed effects. The estimated effect is now 6% and is significantlydifferent from 0 at the 5% level. Column (3), where further municipal time varyingcontrols are considered, suggests again a reduction in investment of nearly 6% and hasthe same level of significance as the previous estimate. This evidence confirms that citycouncil dismissals have a significant effect on the budget of those municipalities thatare geographically closer if I consider a three-year period.
These results, however, are not confirmed if I look at the effect occurring the firstyear of the dismissal. In fact, in none of the last three columns (4,5 and 6) is the mainregressor significantly different from 0, though the coefficient is consistently negative.The discrepancy between the two effects highlights that neighbors’ reactions take place,on average, with a delay with respect to the actual council dismissal.
24In all regressions I use standard errors clustered two ways by municipality and by year.
20

Interestingly, compulsory administration reduces investment in both the municipal-ities experiencing the dismissal (Table 3) and their neighbors. Hence, this finding isconsistent with some of the alternative mechanisms that are described in section 5.3.In fact, the reduction in investment could be due either to local officials who want tomaximize their electoral support by mimicking the behavior of the commission or tothe attenuation of fraudulent activity or positive benefit spillover.
The presence of spillover effects with regard to the policy under analysis is alreadyan interesting result. Indeed, it adds to the literature more evidence on how policyand decisions from different jurisdictions might be interdependent. Moreover, differentfrom the majority of the existing literature, this result comes from a quasi-experimentalframework that in principle produces casual estimates bypassing some of the issuesarising from the use of standard spatial econometrics methods.
In the next sections, I test the identifying assumptions (i.e., whether the city councildismissal of a neighboring municipality is random conditional on the controls) andprovide additional results to identify the channels more likely to explain the baselineresults.
6.2. Checking the identifying assumptions
The first element to emphasize is the relative stability of the coefficients shownover the different specifications in Table 4. If one considers the three-year period ofcompulsory administration, the effect decreases from 8% of the first specification to 6%when I include all controls, while for its first year it moves from 7.4% to 3.4%. Moreformally, Table 5 reports the results of a test in the spirit of Altonji et al. (2005) andOster (2015).25 The key information is in the last two rows, where the parameter δand the identifying bounds are displayed. The former tells how large the selection onunobservables has to be such that the results are canceled out while the latter reportsthe set of values the coefficient can take assuming a δ = 1. Interestingly, the computed δfor the estimates in columns (2) and (3) are much higher than 1, which is the thresholdusually considered to define whether the results are robust or not (Oster, 2015). Morespecifically, δ is 11.20 and 7.88 in column (2) and (3), respectively. Therefore, the effectof unobservables needs to be roughly, at least, 7.5 times stronger than the one from
25For further details and a formal derivation of δ and the identification set see Oster (2015). Allcalculations are made using the PSACALC stata module by Oster (2013).
21

observables, so that the effect is completely nullified. Also, all the identification setsestimated include only negative values. The results shown in columns (5) and (6) arealso robust as the δ are still higher then 1. Overall, these results do not seem to bebiased by omitted variables possibly correlated with both the dependent variable andtreatment.
As a further test to check the reliability of my analysis, I investigate the presenceof anticipatory effects. To do so, I introduce leads of Neighbors counc. dism. up to 4years, to the full controlled regression (i.e., column (6) of Table 4). These results arereported in Table 6. Expenditure on investments in year t is not associated with thecity council dismissal in future years. This is true either if one looks at each individualyear separately or at the overall effect of the following 4 years. To conclude, bothrobustness checks seem to confirm the identifying assumptions, thus reinforcing thecausal interpretation of the baseline results.
6.3. Testing the mechanisms
Table 7 shows the results from estimates of equations (2) and (3). Both columns (1)and (3) report that the interaction between either neighbors compulsory administrationor neighbors council dismissal and mafia is negative and significantly different from0 at the 1% level. Moreover, the dummy neighbors compulsory administration is notsignificantly different from 0 and it is positive in both specifications. Specifically, ex-penditure investment decreases by 12% in mafia-ridden municipalities sharing a borderwith a municipality that experienced compulsory administration. Interestingly, a simi-lar result also appears when I consider the regressor that identifies only the first year ofthe council dismissal, though in the baseline estimations reported in Table 4 there wasno significant effect. In this case the reduction in investment is 11%.26 These findingsfavor the hypothesis that law enforcement spillovers could be driving the overall effectemphasized in the baseline analysis.27 Indeed, the city council dismissal in a neighbor-ing municipality does not affect expenditure on investment in those municipalities in
26These come from summing up the two reported coefficients respectively, in column (1) and (4)of Table 7. The p-value of the joint significance of the two coefficients in column (1) is 0.007 and incolumn (3) is 0.009.
27These results also implicitly rule out the presence of benefit spillovers as they are expected to havean homogeneous effect on neighbors.
22
which the probability of having mafia activity in the territory is low (i.e., mafia=0).Instead, the effect is negative and significant in municipalities that are more likely tohave the presence of mafia activity starting from the arrival of the commissioners in theneighboring municipalities.
Columns (2) and (4) show the effect of the city council dismissal interacted withthe time from the last election, which fills in for the strength of the electoral incentives.The interaction terms of both specifications are not significantly different from 0, henceit rules out the presence of spillover of yardstick competition in this specific framework.Still, the electoral cycle variable is always significant and positive, confirming the hy-pothesis that expenditure increases the closer are elections. The coefficient of neighborscompulsory administration, as expected from the main analysis, is significant and alsonegative when the neighbors are computed in terms of spatial proximity.
Finally, to further investigate the law enforcement channel, Table 8 reports theresults from the falsification test. Columns (1) and (2) present the direct effect ofexperiencing a city council dismissal for reasons other than mafia. This is estimatedconsidering only those municipalities from the whole sample that experience at leastone city council dismissal of this kind in the period of the analysis. There is a dropin public investment in both the first year of the dismissal and in the two-year periodthat follows the council dismissal. This is probably due to the fact that the commis-sioner is often called to resolve conditions of financial instability, and hence they putforward strong actions to reorganize the municipal budget. I present this descriptiveevidence to emphasize that it is comparable to what is reported in Table 3 where thefocus was on council dismissal for mafia infiltration. The results shown in columns (2)through (6) of Table 8 are estimated for a restricted sample of neighbors. I includeonly municipalities that are studied in the main analysis and also experienced at leasta city council dismissal in their neighbors for reasons other than mafia. The numberof municipalities goes from 406 to 368. These estimates suggest that city council dis-missal for reasons other than mafia do not significantly effect spending on investmentof neighboring municipalities. Interestingly, the fact that a municipality is identified asmafia-ridden or not does not seem to matter.
23

7. Conclusion
Anti-corruption policies such as monitoring and auditing of public officials’ activitiesseem to be effective mechanisms for solving corruption and misconduct in lower levels ofgovernment. Nevertheless, when illegal activities in the local public administration areregular events, these kinds of policies are more likely to produce indirect consequences toneighbors that may potentially reduce or increase their actual efficiency. In this paper,taking the case of Italy, I provide the first empirical evidence showing the existence ofpositive spillovers.
Specifically, I explore the effect of an Italian policy that produces an importantexogenous break in the governance of those municipalities whose representatives’ deci-sions are affected by organized crime. In fact, once the potential connection with mafiaarises, the minister of interior replaces the city council of these municipalities with acommission composed of three bureaucrats who govern for typically three semesters.The presence of the commission significantly reduces municipal spending on investment.Interestingly, my estimates show that the same policy also negatively affects neighbor-ing municipalities’ investments. Again, during the first three years after the dismissalof a neighbor, the municipal spending on investment decreases at a yearly average of 6percent. I check the identifying assumption of my empirical strategy in two ways. First,I show that unobservable factors need to be relatively large to completely neutralizemy findings. Second, I provide results that exclude the presence of any anticipatoryresponse to the arrival of the commission.
However, as spending spillovers are possible for several reasons, I test alternativemechanisms. Neither yardstick competition nor the relocation of mafia activities in theneighborhood seem plausible explanations. Instead, the analysis suggests that positivelaw enforcement spillovers indirectly affecting mismanagement in neighboring munic-ipalities is the potential mechanism at work. In fact, I show that only mafia-riddenmunicipalities (i.e., those with a higher probability of corruption in public administra-tion) are those affected by the arrival of commissioners in the neighboring municipalitiesand that compulsory administration for reasons other than mafia do not produce anyspillover.
All these findings are coherent with Sah’s (1991) model. The presence of com-missioners in a municipality affects the perceived probability of punishment of publicofficials from neighboring municipalities, which are expected to change their behavior
24
accordingly (i.e., decrease misconducts). However, this mechanism produces conse-quences which are heterogeneous depending on the propensity for crime of each groupof municipalities. Hence, only the municipalities where illegal activity is potentially inplace will experience a reduction in expenditure.
In conclusion, anti-corruption policies can create law enforcement spillovers. Still,further investigations are needed to evaluate whether my findings are specific to the com-pulsory administration policy applied in Italy or can be generalized to anti-corruptionpolicies in place in other countries.
25

010
2030
40N
umbe
r of
dis
mis
sed
mun
icip
aliti
es
1991 1992 1993 1994 1995 1996 1997 1998 1999 2000 2001 2002 2003 2004 2005 2006 2007 2008 2009 2010 2011 2012 2013
Figure 1: Council dismissals by year.
26

Table 1: City council dismissals by region and province
Basilicata Calabria Campania Lazio Liguria
Matera 1 Catanzaro 8 Avellino 4 Roma 1 Imperia 2Cosenza 2 Benevento 1Crotone 4 Caserta 33Reggio Calabria 45 Napoli 51Vibo Valentia 14 Salerno 6
Lombardia Piemonte Puglia Sicilia
Milano 1 Torino 3 Bari 5 Agrigento 7Lecce 2 Caltanissetta 6
Catania 10Messina 3Palermo 26Ragusa 1Siracusa 1Trapani 7
Notes: The table displays the number of municipality dismissals for the period 1991-2013 by region and province.
27

Table 2: Summary statistics
Bordering municipalities
Variable Mean Std. Dev. N
Total expenditure p/c 1323.38 977.66 6303Current expenditure p/c 700.86 297.41 6303Investment expenditure p/c 388.55 786.71 6303Council dismissal 0.015 0.121 6303Compulsory administration 0.038 0.192 6303Other council dismissal 0.037 0.19 6303Other compulsory administration 0.07 0.255 6303Neighbors council dismissal 0.112 0.315 6303Neighbors compulsory administration 0.266 0.442 6303Neighbors other council dismissal 0.198 0.399 6303Neighbors other compulsory administration 0.335 0.472 6303Electoral cycle 1.866 1.408 6303Commissioner 0.066 0.249 6303Mafia 0.572 0.495 6303Local party 0.378 0.485 6303Population 16325.86 61661.39 6303Dependency ratio 0.349 0.036 6303
28
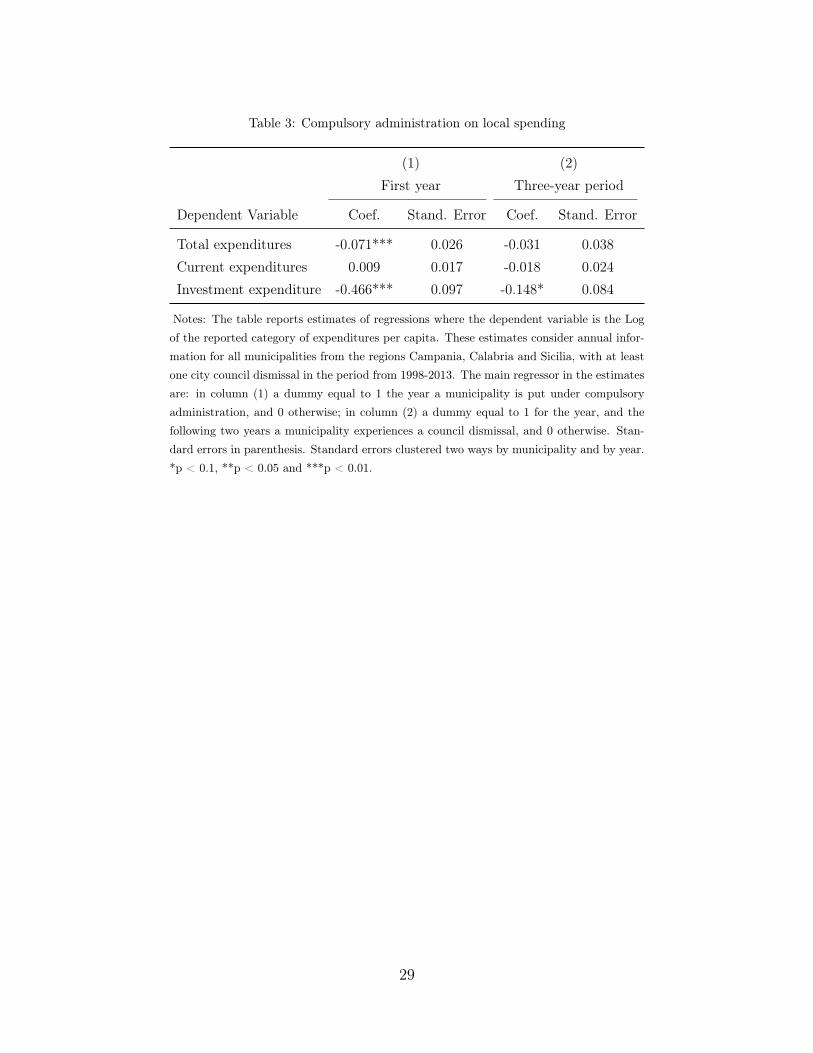
Table 3: Compulsory administration on local spending
(1) (2)First year Three-year period
Dependent Variable Coef. Stand. Error Coef. Stand. Error
Total expenditures -0.071*** 0.026 -0.031 0.038Current expenditures 0.009 0.017 -0.018 0.024Investment expenditure -0.466*** 0.097 -0.148* 0.084
Notes: The table reports estimates of regressions where the dependent variable is the Logof the reported category of expenditures per capita. These estimates consider annual infor-mation for all municipalities from the regions Campania, Calabria and Sicilia, with at leastone city council dismissal in the period from 1998-2013. The main regressor in the estimatesare: in column (1) a dummy equal to 1 the year a municipality is put under compulsoryadministration, and 0 otherwise; in column (2) a dummy equal to 1 for the year, and thefollowing two years a municipality experiences a council dismissal, and 0 otherwise. Stan-dard errors in parenthesis. Standard errors clustered two ways by municipality and by year.*p < 0.1, **p < 0.05 and ***p < 0.01.
29

Table 4: Municipal investment and council dismissals in neighboring municipalities
Bordering municipalities
(1) (2) (3) (4) (5) (6)
Neighbors comp. admin. -0.087 -0.067** -0.061**(0.057) (0.033) (0.031)
Neighbors counc. dism. -0.074 -0.040 -0.034(0.079) (0.048) (0.048)
Municipality FE No Yes Yes No Yes YesProvince × year fixed effects No Yes Yes No Yes YesMunicipality control variables No No Yes No No Yes
R2 0.001 0.382 0.391 0.001 0.382 0.391N 6303 6303 6303 6303 6303 6303N mun 404 404 404 404 404 404
Notes: The dependent variable is the Log of investment expenditure p/c. Neighbors compulsory adminis-tration is a dummy taking the value of 1 if at least one of the neighbors of the municipality i experiences acity council dismissal in year t or have experienced it in the previous two years (t− 1 or t− 2). Neighborscouncil dismissal is a dummy taking the value of 1 the year in which a neighboring municipality expe-riences a council dismissal. Municipality control variables are: local party, population dependency ratio,electoral cycle and commissioner. Standard errors in parenthesis. Standard errors clustered two ways bymunicipality and by year. *p < 0.1, **p < 0.05 and ***p < 0.01.
Table 5: Selection on unobservables
(1) (2) (3) (4) (5) (6)Uncontrolled Controlled Controlled Uncontrolled Controlled Controlled
Coefficient -0.087 -0.067 -0.061 -0.074 -0.040 -0.034R-squared 0.001 0.382 0.391 0.000 0.382 0.391
δ 11.20 7.88 3.92 2.84Identified Set [-0.067,-0.061] [-0.061,-0.054] [-0.034,-0.022] [-0.041,-0.022]
Notes: The dependent variable is expenditure on investment. The reported coefficients are those of Neighbors comp. admin. incolumns (1) to (3) and Neighbors counc. dism in columns (3) to (6). Each column replicates the specification used in Table 4. δ iscalculated assuming Rmax = 1.3R-squared and β = 0. The identified set is calculated assuming Rmax = 1.3R-squared and δ = 1.
30
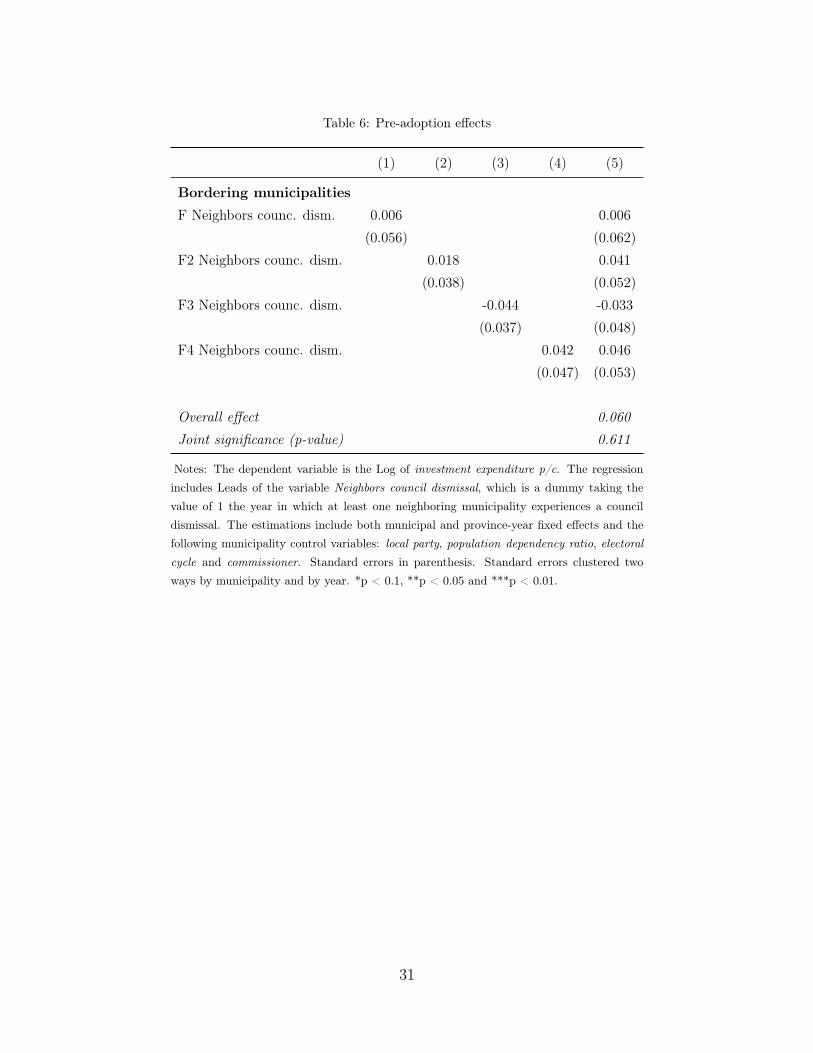
Table 6: Pre-adoption effects
(1) (2) (3) (4) (5)
Bordering municipalities
F Neighbors counc. dism. 0.006 0.006(0.056) (0.062)
F2 Neighbors counc. dism. 0.018 0.041(0.038) (0.052)
F3 Neighbors counc. dism. -0.044 -0.033(0.037) (0.048)
F4 Neighbors counc. dism. 0.042 0.046(0.047) (0.053)
Overall effect 0.060Joint significance (p-value) 0.611
Notes: The dependent variable is the Log of investment expenditure p/c. The regressionincludes Leads of the variable Neighbors council dismissal, which is a dummy taking thevalue of 1 the year in which at least one neighboring municipality experiences a councildismissal. The estimations include both municipal and province-year fixed effects and thefollowing municipality control variables: local party, population dependency ratio, electoralcycle and commissioner. Standard errors in parenthesis. Standard errors clustered twoways by municipality and by year. *p < 0.1, **p < 0.05 and ***p < 0.01.
31

Table 7: Testing the mechanism
Bordering municipalities
(1) (2) (3) (4)
Neighbors comp. admin. 0.032 -0.111**(0.047) (0.045)
Neighbors comp. admin. X Mafia -0.156***(0.061)
Neighbors comp. admin. X Electoral cycle 0.026(0.018)
Neighbors counc. dism. 0.112 -0.057(0.073) (0.068)
Neighbors counc. dism. X Mafia -0.228***(0.074)
Neighbors counc. dism. X Electoral cycle 0.012(0.025)
Electoral cycle 0.065*** 0.071***(0.010) (0.009)
Municipality FE Yes Yes Yes YesProvince × year fixed effects Yes Yes Yes YesMunicipality control variables Yes Yes Yes Yes
R2 0.392 0.392 0.391 0.391N 6303 6303 6303 6303N mun 404 404 404 404
Notes: The dependent variable is the Log of investment expenditure p/c. Neighbors compulsory adminis-tration is a dummy taking the value of 1 if at least one of the neighbors of the municipality i experiencesa city council dismissal in year t or has experienced it in the previous two years (t− 1 or t− 2). Neighborscouncil dismissal is a dummy taking the value of 1 the year in which a neighboring municipality experi-ences a council dismissal. Mafia is a dummy taking the value of 1 for each municipality that experiencedat least one real estate or firm seizure related to crimes committed by mafia-type organizations. Electoralcycle counts the number of years from the last election. Municipality control variables are: local party,population, dependency ratio, electoral cycle and commissioner. Standard errors in parenthesis. Standarderrors clustered two ways by municipality and by year. *p < 0.1, **p < 0.05 and ***p < 0.01.
32
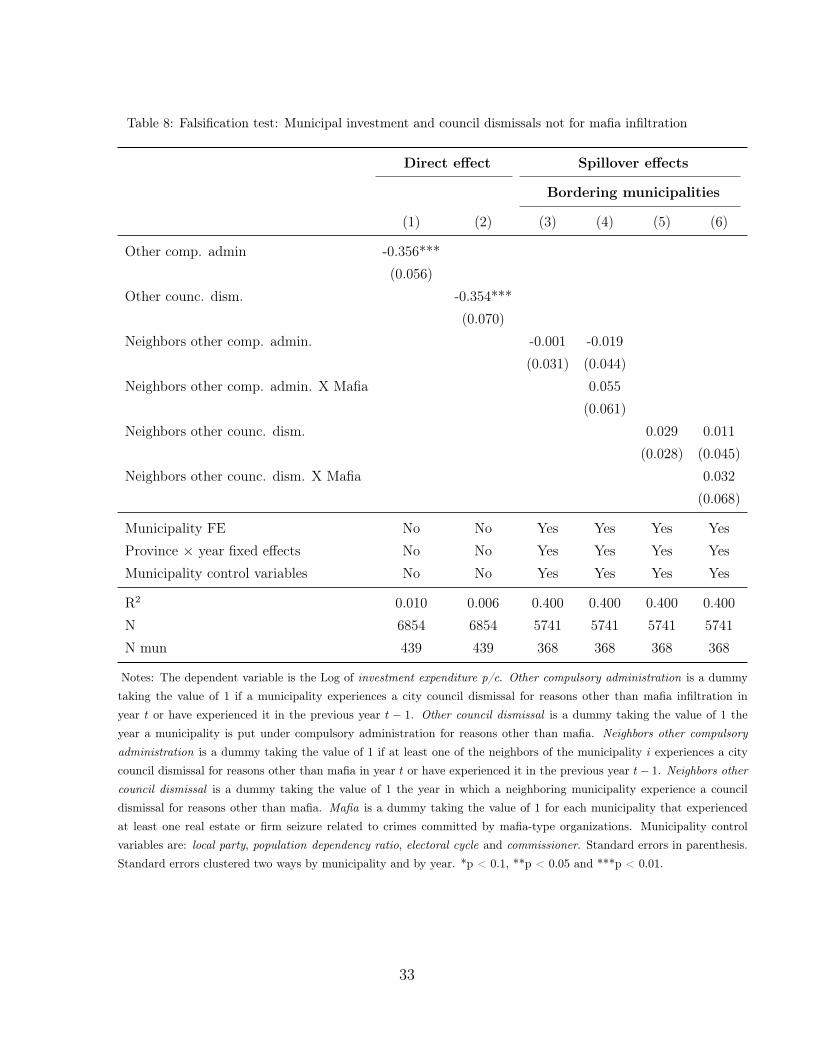
Table 8: Falsification test: Municipal investment and council dismissals not for mafia infiltration
Direct effect Spillover effects
Bordering municipalities
(1) (2) (3) (4) (5) (6)
Other comp. admin -0.356***(0.056)
Other counc. dism. -0.354***(0.070)
Neighbors other comp. admin. -0.001 -0.019(0.031) (0.044)
Neighbors other comp. admin. X Mafia 0.055(0.061)
Neighbors other counc. dism. 0.029 0.011(0.028) (0.045)
Neighbors other counc. dism. X Mafia 0.032(0.068)
Municipality FE No No Yes Yes Yes YesProvince × year fixed effects No No Yes Yes Yes YesMunicipality control variables No No Yes Yes Yes Yes
R2 0.010 0.006 0.400 0.400 0.400 0.400N 6854 6854 5741 5741 5741 5741N mun 439 439 368 368 368 368
Notes: The dependent variable is the Log of investment expenditure p/c. Other compulsory administration is a dummytaking the value of 1 if a municipality experiences a city council dismissal for reasons other than mafia infiltration inyear t or have experienced it in the previous year t − 1. Other council dismissal is a dummy taking the value of 1 theyear a municipality is put under compulsory administration for reasons other than mafia. Neighbors other compulsoryadministration is a dummy taking the value of 1 if at least one of the neighbors of the municipality i experiences a citycouncil dismissal for reasons other than mafia in year t or have experienced it in the previous year t− 1. Neighbors othercouncil dismissal is a dummy taking the value of 1 the year in which a neighboring municipality experience a councildismissal for reasons other than mafia. Mafia is a dummy taking the value of 1 for each municipality that experiencedat least one real estate or firm seizure related to crimes committed by mafia-type organizations. Municipality controlvariables are: local party, population dependency ratio, electoral cycle and commissioner. Standard errors in parenthesis.Standard errors clustered two ways by municipality and by year. *p < 0.1, **p < 0.05 and ***p < 0.01.
33

A. Appendix
Table A.1: List of municipalities experiencing a city council dismissal (1991-2013)
Acerra Condofuri Montecorvino Pugliano San LucaAci Catena Corigliano Calabro Nardodipace San Paolo BelsitoAdrano Cosoleto Nettuno San ProcopioAfragola Crispano Nicotera San TammaroAfrico Delianuova Niscemi Santa FlaviaAltavilla Milicia Ercolano Nocera Inferiore Santa Maria La Carita’Amantea Fabrizia Nola Sant’Andrea Apostolo dello IonioArdore Ficarazzi Orta di Atella Sant’AntimoArzano Frattamaggiore Ottaviano Sant’Antonio AbateAugusta Frignano Pagani Sant’Ilario dello IonioBagaladi Furnari Pago del Vallo di Lauro Santo Stefano in AspromonteBagheria Gallipoli Pantelleria Sant’OnofrioBardonecchia Gela Parghelia SarnoBordighera Gioia Del Colle Partanna ScafatiBorgia Gioia Tauro Pignataro Maggiore ScicliBoscoreale Giugliano in Campania Pimonte SedrianoBotricello Gragnano Piraino SeminaraBova Marina Grazzanise Plati’ SiculianaBriatico Gricignano di Aversa Poggiomarino SidernoBrusciano Guardavalle Polizzi Generosa SinopoliBurgio Isca sullo Ionio Pollina Soriano CalabroCaccamo Isola delle Femmine Pomigliano d’Arco StefanaconiCalanna Isola di Capo Rizzuto Pompei StrongoliCalatabiano Lamezia Terme Portici SurboCaltavuturo Lascari Pozzuoli TaurianovaCamini Leini Quarto TerlizziCampobello di Licata Licata Quindici Terme VigliatoreCampobello di Mazara Liveri Racalmuto Termini ImereseCanicatti’ Lusciano Ragalna TerzignoCapaci Marano di Napoli Recale TeverolaCareri Marcedusa Reggio di Calabria Torre AnnunziataCarinola Marcianise Riesi Torre del GrecoCasal di Principe Marina di Gioiosa Jonica Rivarolo Canavese TorrettaCasalnuovo di Napoli Mascali Rizziconi TrabiaCasaluce Mascalucia Roccaforte del Greco TraniCasamarciano Mazara del Vallo Roccamena TufinoCasandrino Melito di Napoli Roghudi Vallelunga PratamenoCasapesenna Melito di Porto Salvo Rosarno VentimigliaCasignana Mileto S. Maria La Fossa VicariCasola di Napoli Misilmeri S.Lorenzo Maggiore Villa di BrianoCasoria Misterbianco Salemi Villa LiternoCastel Volturno Modugno Samo VillabateCastellammare del Golfo Molochio San Calogero VillariccaCastello di Cisterna Monasterace San Cipriano d’Aversa VollaCastrofilippo Mondragone San FerdinandoCerda Mongiana San Gennaro VesuvianoCesa Monopoli San Giovanni La PuntaCinisi Montalbano Jonico San Giuseppe VesuvianoCiro’ Montebello Jonico San Gregorio d’Ippona
Notes: This is a list of all municipalities that experienced at least one city council dismissal starting from the law approval in 1991 untilthe end of 2013.
34

B. Appendix
Figure B.1: City council dismissals (Campania, Calabria and Sicilia).
35
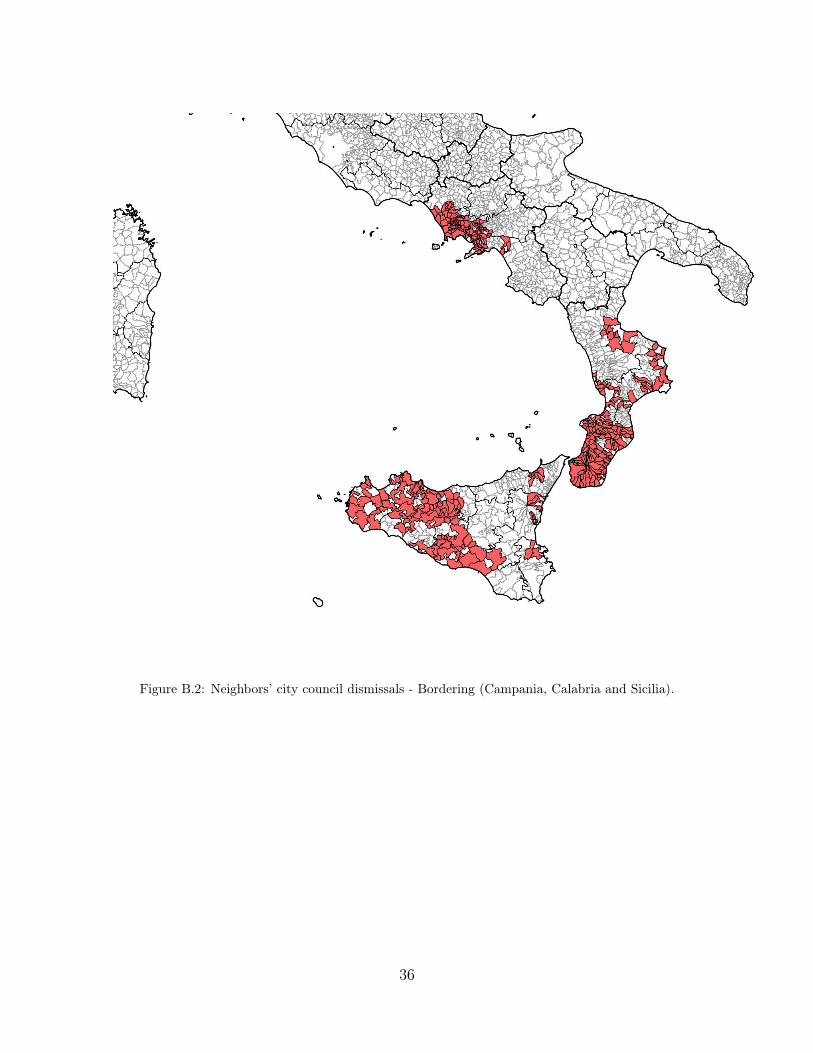
Figure B.2: Neighbors’ city council dismissals - Bordering (Campania, Calabria and Sicilia).
36
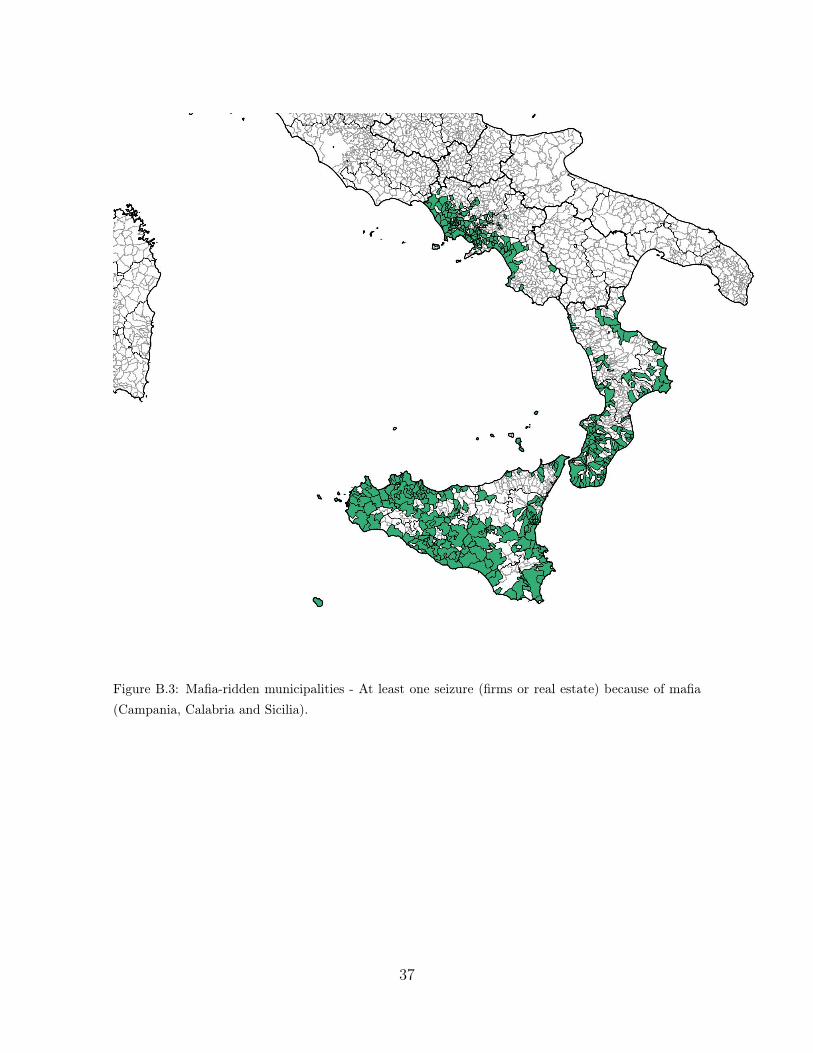
Figure B.3: Mafia-ridden municipalities - At least one seizure (firms or real estate) because of mafia(Campania, Calabria and Sicilia).
37
Bibliography
Acconcia, A., Corsetti, G., Simonelli, S., 2014. Mafia and public spending: Evidence onthe fiscal multiplier from a quasi-experiment. American Economic Review 104 (7),2185–2209.
Acemoglu, D., Garcia-Jimeno, C., Robinson, J. A., 2015. State capacity and economicdevelopment: A network approach. American Economic Review 105 (8), 2364–2409.
Alesina, A., Tabellini, G., 2007. Bureaucrats or Politicians? Part I: A single policytask. American Economic Review 97 (1), 169–179.
Altonji, J. G., Elder, T. E., Taber, C. R., 2005. Selection on observed and unobservedvariables: Assessing the effectiveness of catholic schools. Journal of Political Economy113 (1), 151–184.
Anselin, L., 1988. Spatial Econometrics: Methods and Models. NATO Asi Series. SeriesE, Applied Sciences. Springer.
Arin, K. P., Chmelarova, V., Feess, E., Wohlschlegel, A., 2011. Why are corrupt coun-tries less successful in consolidating their budgets? Journal of Public Economics95 (7-8), 521–530.
Baicker, K., 2005. The spillover effects of state spending. Journal of Public Economics89 (2-3), 529–544.
Bardhan, P., Mookherjee, D., 2006. Decentralization, corruption and government ac-countability. Edward Elgar Publishing, Inc.
Barone, G., Narciso, G., 2015. Organized crime and business subsidies: Where does themoney go? Journal of Urban Economics 86, 98 – 110.
Becker, G. S., 1968. Crime and punishment: An economic approach. Journal of PoliticalEconomy 76, 169.
Becker, G. S., Stigler, G. J., 1974. Law enforcement, malfeasance, and compensation ofenforcers. The Journal of Legal Studies 3 (1), 1–18.
38

Besley, T., Case, A., 1995. Incumbent behavior: Vote-seeking, tax-setting, and yardstickcompetition. American Economic Review 85 (1), 25–45.
Besley, T., Coate, S., 2003. Elected versus appointed regulators: Theory and evidence.Journal of the European Economic Association 1 (5), 1176–1206.
Besley, T., Montalvo, J. G., Reynal-Querol, M., 2011. Do educated leaders matter?Economic Journal 121 (554), F205–.
Bordignon, M., Cerniglia, F., Revelli, F., 2003. In search of yardstick competition:A spatial analysis of Italian municipality property tax setting. Journal of UrbanEconomics 54 (2), 199–217.
Brueckner, J. K., 2000. Fiscal decentralization in developing countries: The effects oflocal corruption and tax evasion. Annals of Economics and Finance 1 (1), 1–18.
Buonanno, P., Durante, R., Prarolo, G., Vanin, P., 2015. Poor institutions, rich mines:Resource curse in the origins of the sicilian mafia. The Economic Journal 125 (586),F175–F202.
Caneppele, S., Martocchia, S., 2014. Italian mafias, public procurement and publicworks in southern italy. In: Caneppele, S., Calderoni, F. (Eds.), Organized Crime,Corruption and Crime Prevention. Springer International Publishing, pp. 293–299.
Carozzi, F., Muço, A., 2015. Learn from thy neighbour: Do voters punish politicalparties?, mimeo.
Case, A. C., Rosen, H. S., Hines, J. J., 1993. Budget spillovers and fiscal policy interde-pendence : Evidence from the states. Journal of Public Economics 52 (3), 285–307.
Daniele, G., Geys, B., 2015. Organised crime, institutions and political quality: Empiri-cal evidence from italian municipalities. The Economic Journal 125 (586), F233–F255.
Del Monte, A., Papagni, E., 2001. Public expenditure, corruption, and economic growth:the case of italy. European Journal of Political Economy 17 (1), 1–16.
Dell, M., 2015. Trafficking networks and the Mexican drug war. American EconomicReview 105 (6), 1738–79.
39

Di Tella, R., Schargrodsky, E., 2003. The role of wages and auditing during a crackdownon corruption in the city of buenos aires. Journal of Law and Economics 46 (1), 269–92.
Durante, R., Gutierrez, E., 2015. Fighting crime with a little help from my friends: Po-litical alignment, inter-jurisdictional cooperation and crime in mexico. CEPR (Dis-cussion Paper #10769).
Fan, C. S., Lin, C., Treisman, D., 2009. Political decentralization and corruption: Evi-dence from around the world. Journal of Public Economics 93 (1-2), 14–34.
Galasso, V., Nannicini, T., 2011. Competing on good politicians. American PoliticalScience Review 105 (01).
Gibbons, S., Overman, H. G., 2012. Mostly pointless spatial econometrics? Journal ofRegional Science 52 (2), 172–191.
Golden, M. A., Picci, L., 2005. Proposal for a new measure of corruption, illustratedwith italian data. Economics and Politics 17, 37–75.
Hessami, Z., 2014. Political corruption, public procurement, and budget composition:Theory and evidence from oecd countries. European Journal of Political Economy34 (C), 372–389.
Knight, B., 2013. State gun policy and cross-state externalities: Evidence from crimegun tracing. American Economic Journal: Economic Policy 5 (4), 200–229.
Litschig, S., Zamboni, Y., 2011. Audit risk and rent extraction: Evidence from a ran-domized evaluation in Brazil. Economics working papers 1270.
Lyytikäinen, T., 2012. Tax competition among local governments: Evidence from aproperty tax reform in finland. Journal of Public Economics 96 (7-8), 584–595.
Mauro, P., 1995. Corruption and growth. The Quarterly Journal of Economics 110 (3),681–712.
Mauro, P., 1998. Corruption and the composition of government expenditure. Journalof Public Economics 69 (2), 263–279.
40

Olken, B. A., 2007. Monitoring corruption: Evidence from a field experiment in indone-sia. Journal of Political Economy 115, 200–249.
Oster, E., 2013. Psacalc: Stata module to calculate treatment effects or bounds underproportional selection of observables and unobservables.
Oster, E., 2015. Unobservable selection and coefficient stability: Theory and validation,mimeo.
Pinotti, P., 2015. The economic costs of organised crime: Evidence from Southern Italy.The Economic Journal 125 (586), F203–F232.
Rincke, J., Traxler, C., 2011. Enforcement spillovers. The Review of Economics andStatistics 93 (4), 1224–1234.
Sah, R. K., 1991. Social osmosis and patterns of crime. Journal of Political Economy99 (6), 1272–95.
Silva, P., 2010. Learning to fear the inspector-general: Measuring spillovers from anti-corrupt policies, mimeo.
Solé-Ollé, A., 2006. Expenditure spillovers and fiscal interactions: Empirical evidencefrom local governments in spain. Journal of Urban Economics 59 (1), 32–53.
Tanzi, V., Davoodi, H. R., 2000. Corruption, growth, and public finances. IMF WorkingPapers.
41