Embed Size (px)
Citation preview

Laurus Labs Limited
Corporate Office 2"" Floor. Serene Chambers, Rood No. 7 Banjara Hills, Hyderabad · 500034. Telangana, India T +91 40 39804333 I 2342 0500 I 501 F +91 40 3980 4320
To
The Corporate Relations Department BSE Limited Phiroz Jeejeebhoy Towers, 251h Floor, Dalal Street Mumbai - 400001 Code: 540222
Dear Sirs,
Sub: Annual Report 2017-18
LAURUSLabs Knowledge . Innovation . Excellence
July 06, 2018
To
The Listing Department National Stock Exchange oflndia Limited Exchange Plaza, Bandra Kurla Complex, Bandra (East) Mumbai- 400 051 Code: LAURUSLABS
Pursuant to Regulation 34(1) of the SEBI (Listing Obligations and Disclosure Requirements) Regulations, 2015, Annual Report of the Company for 2017-18 is enclosed herewith.
This is for your information and records.
Thanking you,
. anaki Authorized Signatory
Encl: a.a.
Registered Office : Plot No:21, Jawaharlal Nehru Pharma City, Parawada. Visakhapatnam • 531021. Andhra Pradesh, India. CIN : L24239AP200SPLC04 7518 T +91 891 3061222 F +91 891 3061270 E [email protected] W lauruslabs.com
LAURUS Generics LAURUS Ingredients LAURUS Synthesis Active Pharmaceutical Ingredients & Intermediates Specialty Ingredients for Nutraceutical & Allied Industry Contract Development & Manufacturing Services

M O M E N T U MB U I L D I N G
2017-18Annual Report
LAURUS LABS LIMITED

ContentsSTRATEGIC REVIEW
Our main objective is to Our Activities
Outcome
Laurus Generics APIs
Laurus Generics FDFs
Laurus Synthesis
Laurus Ingredients
This is achieved through our resources
High quality
m
anufacturing
Esta
blis
hed
pres
ence
Experienced sales
and marketing team
Broad R&Dcapabilities
Dedicatedemployees
Strong
partnerships
Enriched Product Portfolio Value Creation Model The Year in ReviewOverview02 Laurus Labs at a Glance04 Manufacturing Facilities 05 Operational Highlights
Performance Review06 Positive Momentum 08 Building Momentum for
Future Growth 10 Megatrends - Operating Environment
Strategic Review 12 Value Creation Model 14 Growth Strategy
Building Momentum 16 Building Momentum through an
Enriched Product Portfolio 18 Building Momentum through
Capacity Augmentation 20 Building Momentum through
Global Reach
People and CSR 22 Engaging People 24 Supporting Communities25 Awards and Recognitions
Governance Report 26 Governance Framework 27 Risk Management 28 Board of Directors 30 Management Team
Management Commentary32 Management Discussion
and Analysis
Statutory Reports38 Board’s Report63 Report on Corporate Governance77 Business Responsibility Report
Financial Statements82 Standalone Financial Statements137 Consolidated Financial Statements
194 Notice
p16
Read more
CEO's Perspective
For further information log on to www.lauruslabs.com
Financial Goals
p06
Read more
p08
Read more
p12
Read more
2017-18 Highlights
Profit After Tax Dividend
D1,731 million
D1.50 per share
Net Sales
D20,268 million8% (y-o-y growth)
0.5% (y-o-y growth) (Face Value of D 10)
Net Sales (E in million)
2013-14
2014-15
2015-16
2016-17
2017-18
11,597
13,263
17,746
18,919
20,268
15% (5-year CAGR)

We are reinforcing the foundations of our business model by strengthening R&D, embracing a spirit of excellence, building capacities, securing revenues through long-term contracts, going deeper into regulated markets and expanding the product portfolio. These initiatives will translate into improved and sustainable value across markets. Our leadership position in antiretrovirals (ARVs), focus on compliance and presence across the pharma value chain have cemented our position as a niche player in the pharmaceutical industry.
In 2017-18, we advanced our overall preparedness by:
- Enhancing capacities to address growing customer needs
- Strengthening our R&D backbone to grow existing businesses and to explore new opportunities
- Increasing our reach to more countries and markets, to keep growing
Moving forward, we are convinced that with the right people, led by a culture of innovation and excellence, we will continue to achieve sustainable and balanced growth. With our core strengths fortified, we stand reaffirmed to our promise of delivering long-term value.
Forging Ahead with Purpose
At Laurus Labs, delivering value over the long-term is rooted in our culture. We have invested significant resources in forward integration and business expansion. During the year, we continued to build this momentum through bold steps.

OVERVIEW
Laurus Labs at a Glance
Laurus Labs is a leading developer and manufacturer of generic pharmaceutical products with a strong focus on Active Pharmaceutical Ingredients (APIs). The Company targets on products in which it has cost leadership owing to innovation in process chemistry or through manufacturing efficiencies.
Soon after operations began in 2008, Laurus Labs built a leadership position in Antiretroviral (ARV) APIs and Hepatitis C and in due course expanded the portfolio to include oncology and other select APIs. It is leveraging its API skills and forward integrating to supply finished dosages, which would enable Laurus to expand margins. In its largest business segment of ARV APIs, Laurus Labs has emerged as a leading independent supplier to formulation companies, catering to the large and fast-growing markets of low
and middle-income countries (e.g., Africa and Latin America). It has leveraged chemistry skills towards synthesis services and manufacture of specialty ingredients.
Leading integrated global player - Well-diversified product portfolio across
varied markets
- Integrated manufacturing infrastructure with key regulatory approvals
- Long-standing relationships with multinational pharmaceutical companies
- Experienced and proven management team with strategic oversight of Board of Directors
- Strong compliance environment with impeccable regulatory track record
- Technology-led control on operations and quality
To become a leading player in offering integrated solutions to global pharmaceutical needs in creating a healthier world.
Vision
Key Numbers
59Products commercialised since inception
46Drug Master File (DMFs) filed
224Patents filed
57Patents granted
Laurus Labs Limited
Annual Report 2017-182

Divisions Business Product & Service Offerings
Laurus Generics APIs Revenue Contribution:
Development, manufacture and sale of APIs and advanced intermediates
Therapeutic areas include ARV, Hepatitis C, cardiovascular, anti-diabetic, anti-asthmatic, gastro in large volumes, oncology and ophthalmic products in small volumes
Laurus Generics Finished Dosage Forms (FDF)Revenue Contribution:
Development and manufacture of oral solid formulations. Building on API strengths to forward integrate and become a leading FDF (Finished Dosage Form) player globally
ARVs, anti-diabetic, cardiovascular, proton pump inhibitors
Laurus SynthesisRevenue Contribution:
Contract development and manufacturing services for global pharmaceutical companies
Commercial scale contract manufacturing, clinical phase supplies, analytical and research services
Laurus IngredientsRevenue Contribution:
Manufacture and sale of specialty ingredients for use in nutraceutical, dietary supplements and cosmeceutical products. Leverages existing R&D, process chemistry competence and manufacturing capabilities
Nutraceuticals (natural ingredients), dietary supplements and cosmeceutical products
Business Divisions
We constantly strive for innovation to enhance quality and to provide affordable integrated pharmaceutical solutions to facilitate wellness and well-being across the globe.
Mission
109 ANDAs and 1 NDA filed
3,000+No. of employees
225+Customers
70+APIs manufactured
89.5%
0.3%
7.4%
2.8%
The Year in Review Statutory Reports Financial Statements
3Building Momentum

OVERVIEW
Manufacturing Facilities
Our world-class infrastructure comprises a state-of-the-art R&D and scale-up laboratory in Hyderabad and large-scale manufacturing facilities at Visakhapatnam.
Facility Type Approvals Remarks
Unit 1 API, Ingredients, Synthesis and Contract Manufacturing
USFDA, WHO, PmDA, KFDA and NIP Hungary
315 reactors with 1,140 Kilo Litres (KL) capacity
Spread across 34 acres with 1,000+ employees
Unit 2 FDF and API BfArM, USFDA inspection completed in December 2016
FDF capacity of 5 billion tablets/year
API block with 12 reactors and capacity of 84 KL
Commenced commercial operations in 2017
Unit 3 API, Ingredients, Synthesis and Contract Manufacturing
USFDA and WHO-Geneva 143 reactors with a total capacity of 800 KL
Unit 4 API, Ingredients, Synthesis and Contract Manufacturing
Inaugurated in November 2017
29 reactors + 2 extractors with 78.8 KL capacity
Unit 5 API (Dedicated to Aspen) 46 reactors of 125 KL capacity in two manufacturing buildings
Unit 6 Intermediaries Unit acquired through slump sale from Sriam Labs in December 2017
41 reactors with 244 KL capacity
Kilo Lab API, Ingredients, Synthesis and Contract Manufacturing before going for commercial scale
USFDA, KFDA and PMDA. 43 reactors and a capacity of 4.3 KL
We supply to most of the top generic companies and are well-positioned to capitalise on the ARV, API, Hepatitis C and other therapeutic opportunities across products.
Laurus Labs Limited
Annual Report 2017-184

Q2
- Successfully completed USFDA inspection for API facility in Unit 2 without any 483s observations
- Unit IV inaugurated and the facility will add to the capacities for synthesis and ingredients business
- API unit located at Achutapuram, Vishakhapatnam acquired from Sriam Labs Pvt. Ltd. on a slump sale basis. Renamed as Unit 6
- Commenced commercial supplies from Unit 5 to Aspen
- Incorporated Laurus Holdings Limited (a 100% subsidiary), in the UK
- Incorporated Laurus Generics Inc (a 100% subsidiary) in the US for the formulations business
- Units 1 and 3 completed USFDA inspection. Received EIR
- Units 1 and 3 successfully audited and approved by WHO, received Inspection Assessment Report
- Set up a dedicated block in Unit 4 for an international partner, C2 Pharma
- Capacity expansion for Generics FDF to 5 billion units completed
- Unit 2 completed USFDA inspection with no observations
- Received first ANDA approval for Tenofovir Disoproxil Fumarate Tablets - 300mg
- Cumulatively filed 9 ANDAs, 1 NDA and further completed 6 validations
- Launched Tenofovir (TDF) after the final approval from USFDA
Operational Highlights
APRIL TO JUNE 2017
OCTOBER TO DECEMBER 2017
JULY TO SEPTEMBER 2017
JANUARY TO MARCH 2018
2
3 4
1
The Year in Review Statutory Reports Financial Statements
5Building Momentum

Profit and Loss Metrics
Net Profit (E in million)
EBITDA (E in million)Net Sales (E in million)
2013-14
2014-15
2015-16
2016-17
2017-18
11,597
13,263
17,746
18,919
20,268
15% (5-year CAGR)
2013-14
2014-15
2015-16
2016-17
2017-18
2,206
2,395
3,740
4,443
4,369
19% (5-year CAGR)
2013-14
2014-15
2015-16
2016-17
2017-18
991
736
1,447
2,000
1,731
15% (5-year CAGR)
EPS (Basic) Post Bonus (E)
2013-14
2014-15
2015-16
2016-17
2017-18
16
12
23
22
16
- Synthesis business reported robust revenue growth with the commencement of initial supplies to Aspen from Unit 5
- Oncology and other APIs showcased healthy growth, with improved volumes and new product additions
- Efficient use of capital and prudent leverage
PERFORMANCE REVIEW
Positive Momentum
Laurus Labs Limited
Annual Report 2017-186

Balance Sheet Metrics
2013-14
2014-15
2015-16
2016-17
2017-18
1,575
1,867
2,229
2,660
3,186
Social Metrics
Employee Engagement (No.)
2013-14
2014-15
2015-16
2016-17
2017-18
4.84
16.88
27.02
41.03
43.98
CSR Spend (E in million)
Net Worth (E in million)
Net Carrying Value (E in million)
Debt Equity Ratio (in %)
2013-14
2014-15
2015-16
2016-17
2017-18
3,603
7,292
8,724
13,556
15,133
43% (5-year CAGR)
2013-14
2014-15
2015-16
2016-17
2017-18
4,987
7,403
10,140
11,933
14,477
31% (5-year CAGR)
Reserves & Surplus (E in million)
2013-14
2014-15
2015-16
2016-17
2017-18
2,825
6,471
7,900
12,49814,073
49% (5-year CAGR)
2013-14
2014-15
2015-16
2016-17
2017-18
1.51
1.13
1.07
0.60
0.63
The Year in Review Statutory Reports Financial Statements
7Building Momentum

Building Momentum for Future Growth
Dear Shareholders,
We have grown steadily since inception on the strength of our fundamentals. However, in a rapidly transforming pharmaceutical landscape, we need to consistently fine-tune our focus and evolve at every step. With this agility in mind, we delivered again on promises in 2017-18 – a year of intense activity when we launched new products, expanded our manufacturing capability and focused on execution. I am happy to share that these continual efforts have resulted in Laurus Labs becoming a leading player in offering integrated solutions to global pharmaceutical companies. It is our endeavour to be present across the entire value chain and we are firmly on our path of developing into a full-fledged pharma company with unique R&D capabilities.
Investing for growth Our approach is to use science-based innovation to deliver better patient outcomes in emerging areas of healthcare. We recognise that the ability to put more successful products in the marketplace needs to be complemented with growth in manufacturing capacities. We are creating scale that can address
potential demand as well as fill gaps in our current manufacturing infrastructure. Our opportune investment in world-class facilities ensures sufficient capabilities to meet the sales growth. The commercialisation of these capacities in a phased manner will enhance our product mix and plug portfolio gaps, thereby strengthening revenues. We have invested C2 billion in expanding the formulations facility at Vishakapatnam and have expanded the capacity from 1 billion tablets per year to 5 billion.
We stepped up our presence in the US market with a select portfolio, which included complex technology products. During the year, we filed 9 ANDAs and 1 NDA with USFDA, two dossiers in Europe, and one each in Canada, South Africa and with the WHO. We believe new launches and improved productivity will also lead to growth in the domestic formulation market.
Further, we are building on the oncology franchise for not only generic, but also new chemical entities. The synthesis business is still at a nascent stage, but the
deal with Aspen, the world’s sixth largest generic drug maker, provides potential for growth over the next couple of years.
Our consolidated revenues stood at C20,562 million in 2017-18, against C19,046 million in 2016-17. Our EBITDA fell by 1.69% to C4,369 million vis-à-vis C4,443 million in the previous year. Our PAT fell by 13.45% to C1,731 million against C2,000 million in 2016-17. Our superior manufacturing capabilities and cost-effective process optimisation have led to new synthetic routes and product variants, leading to market leadership for key products in the ARV, oncology and Hepatitis C therapeutic areas.
Our strategy is delivered through a consistently evolving business model. It enables us to develop effective service solutions for clients, generate healthy returns for our shareholders and build a sustainable business. Industry recognition and awards speak volumes about our innovations and the many milestones we have achieved. We entered the Fortune 500 list of Indian companies and were certified as a ‘Great Place to Work’ for the
"It is our endeavour to be present across the entire value chain and we are firmly on our path of developing into a full-fledged pharma company with unique R&D capabilities."
Dr. C SatyanarayanaChief Executive Officer
PERFORMANCE REVIEW
Laurus Labs Limited
Annual Report 2017-188

year 2018. We are confident that our role and strengths in quality, capacity, cost-competitiveness and research-first focus will help us reach the next level.
Strong compliance track recordLaurus’ emphasis on automation and quality control has ensured a good compliance track record. Across our manufacturing sites, we have put in place quality systems that cover all areas of business processes, from supply chain to product delivery, to ensure consistent quality, efficiency and safety of products. During the year, Unit 1 and 3 facilities received USFDA and WHO approval and the new formulation facility was also approved by the US regulator. The Company has cleared 9 inspections at its facilities, indicating its robust quality system.
We have fine-tuned our expansion strategies, planned well for the short and medium term and made appropriate investments in technology and capacity to drive growth and take advantage of future opportunities. We have invested in scale, expertise as well as in the breadth of our offerings to ensure long-term success of Laurus Labs. We are systematising processes to replicate our successes. Importantly, we have headroom to grow with our strong product portfolio and large world-class manufacturing capacities.
A confident future Going forward, we aim to utilise our assets to the best advantage of our customers. We will continue our effort on continuous innovation and excellence in development and commercialisation.
We are building human capital at Laurus Labs by ensuring the career aspirations of our people are in line with their roles and responsibilities. We are also working to instil a corporate culture that enables employees to take initiatives and explore new opportunities. It is only through consistent innovation and empowerment of our people that we will be able to sustain leadership in our focus areas.
Looking ahead, we will continue to build on our strong foundation and achievements. We have a clear growth strategy and a streamlined organisation. We know where we are heading and, in great measure, how we are going to get there. As we continue to enhance and implement plans for sustained growth, we will sequentially advance our strategic framework for long-term shareholder value creation.
Regards,
Dr. C. SatyanarayanaChief Executive Officer
"As we continue to enhance and implement plans for sustained growth, we will sequentially advance our strategic framework for long-term shareholder value creation."
Net Revenue
D20,268 million
The Year in Review Statutory Reports Financial Statements
9Building Momentum

PERFORMANCE REVIEW
Megatrends – Operating Environment
The outlook for growth in the healthcare sector is positive, with global spending on drugs expected to increase to $1.4 trillion by 2020 (Source: Outlook for Global Medicines – Quintiles IMS Institute). The macro trend in healthcare demand is that an increasing number of molecules are being developed, with rise in speciality products requiring customised strategies for patient engagement. We are functioning in a fast-changing environment with proportional potential for growth. Here, we outline some of the key opportunities and challenges that influence our new long-view priorities.
Risk-based audit methodology Over the last few years, the USFDA has been following a more stringent regulatory regime built on a rigorous risk-based audit methodology for approval of manufacturing sites. This has led to an industry-wide increase in the USFDA issuing Form 483s, which are inspectional observations, with subsequent warning letters and, on occasions, with import alerts. The regulator’s expectations have increased regarding what constitutes proper documentation and in avoiding ‘what can go wrong’ in manufacturing and quality processes – occasionally going even beyond the good manufacturing practice (GMP) requirements.
Increased product approvals and resultant competition in generics The number of filings and drug approvals is rising sharply, with an increasing number of Indian companies (e.g., accounting for around 40% of the ANDA approvals in 2017) competing for a share of the same pie. This will increase further in the coming years.
Embracing digital and advanced analytics for accelerated growthThe recent technological shift has encouraged the rapid rise of Advanced Analytics (AA), which is enabling companies to surface perceptions even with complex and unstructured data sets. Globally, the pharma industry has seen usage of AA driving growth and productivity across the pharmaceuticals value chain, including R&D, manufacturing, quality, supply chain, sales, etc.
Pricing and access Increasing demand for healthcare, partially led by demographic change, continues to put pressure on the government and payer budgets. This is impacting both developing and developed markets, including Europe and the US, where both public and privately funded organisations are looking for ways to address the affordability of medicines.
Positive demographics Demographic change such as increasing life expectancy and an expanding global population is driving demand for healthcare products. Growing affluence and changing diets and lifestyles are also a demand factor – especially for chronic conditions such as respiratory diseases.
Regulatory and political environment Healthcare is a highly regulated industry reflecting public expectations that products comply to rigorous levels of quality, safety and efficacy. Globally, changing national politics are impacting the operating environment, particularly as governments are making healthcare a priority.
Laurus Labs Limited
Annual Report 2017-1810

The global pharmaceutical industry is at an inflection point where it must address certain inherent challenges to ride the wave of significant future opportunities. To cope with the ever-changing business regime, companies are re-evaluating business models to establish superior variants. Our strategy is designed to respond to this changing environment: To bring differentiated, high-quality and necessary healthcare products to as many people as possible with our four core businesses, scientific and technical know-how and talented people.
Laurus Labs Approach
The Year in Review Statutory Reports Financial Statements
11Building Momentum

STRATEGIC REVIEW
Value Creation Model
Our strategy is to deliver high-quality, affordable medicines to patients by reinforcing our position in specialty products, targeting different therapeutic segments as a leading global manufacturer.
Our main objective is to Our Activities
Improve lives across our key markets
comprises development, manufacture and sale of APIs and advanced intermediates
comprises development and manufacture of oral solid formulations
includes contract development and manufacturing services for global pharmaceutical companies
comprises manufacture and sale of specialty ingredients for use in nutraceutical and cosmeceutical sectors
Laurus Generics APIs
Laurus Generics FDFs
Laurus Synthesis
Laurus Ingredients
Laurus Labs Limited
Annual Report 2017-1812

Outcome
Our shareholders Maintaining a strong balance sheet by ensuring focused R&D investment and a pipeline delivery to target long- term growth
Our environment and local communitiesOffering quality employment opportunities and higher potential for healthier communities
Patient benefits - High-quality,
affordable medicines - Innovative in-licensed products - Products tailored to
patient needs
Our partnersScientific and operational excellence and a broad range of technologies and capabilities to support the development of medicines to treat diseases
Our peopleCreating a dynamic and rewarding place to work with clear development opportunities
This is achieved through our resources
High quality
m
anufacturing
Esta
blis
hed
pres
ence
Experienced sales
and marketing team
Broad R&Dcapabilities
Dedicatedemployees
Strong
partnerships
The Year in Review Statutory Reports Financial Statements
13Building Momentum

STRATEGIC REVIEW
Growth Strategy
Strategy Opportunity Progress in 2017-18 Outlook for 2018-19
1. Capitalise on leadership position in APIs in select, high-growth therapeutic areas
- Significant increase in HIV patient population with revised WHO guidelines
- New opportunities in second line therapies
- ARV drugs patent expiry in the US and European markets
- Strong opportunity in Hepatitis C in emerging markets
- Successfully completed USFDA inspection for API facility in Unit 2 without any 483s observations
- Successfully completed the USFDA inspection for Units 1 and 3
- WHO inspection for Units 1 and 3 was successfully audited and approved; received Inspection Assessment Report
APIs business to deliver volume growth in key ARV and Hepatitis C segments
2. Expand API portfolio in key therapeutic areas such as oncology, cardio-vascular, anti-diabetic and ophthalmology
- Increasing incidence of cancer along with cardiovascular disease
- Increase in access to medicines
- Advancements in technology
- Improved volumes and new product additions
Other therapeutic areas including oncology to offer consistent opportunities to broaden scope
3. Leverage API cost advantage for forward integration into generic FDF
- Consumers becoming more comfortable with generic medications
- Increasing number of patent expiration of branded drugs and government initiatives
- Partnerships in place for commercialisation of FDFs in the US market
- Distributors appointed for ROW
- Infrastructure in place to support manufacturing with current capacity of 5 billion tablets
Commercial operations of FDF expected to result in higher growth
4. Develop synthesis business - Increase in supplies of molecules, which have advanced to higher phases of clinical trials
- Completed 24 projects in various stages of clinical research development
- Set up a dedicated block in Unit 4 for global partners
- Commenced commercial supplies from Unit 5 to Aspen
Show gains in-line with scale-up in engagement with Aspen
5. Strengthen ingredients business
- The nutraceutical and cosmeceutical sectors are undergoing consolidation globally and implementing quality standards like those of the pharmaceutical industry
- Unit 4 inaugurated to add capacities for ingredients business
Leverage process chemistryskills to strengthen presence in nutraceutical and cosmeceutical sectors as they adopt quality standards at a par with the pharma industry
Laurus Labs Limited
Annual Report 2017-1814

Laurus Labs has travelled a long way from where it started. The expertise of the R&D team, enhanced capacity and the emphasis on quality and technology remain principal business drivers to elevate to the next level of growth as a global pharma player.
The Year in Review Statutory Reports Financial Statements
15Building Momentum

We have steadily invested in a wide range of innovations to make our product portfolio diverse and differentiated in a competitive market. Guided by the mission to become an innovation-led transnational pharmaceutical company, our scientific pool constantly strives to develop new technologies and products. We have the proficiency to make a wide range of pharmaceuticals across the value chain.
BUILDING MOMENTUM
Building Momentum
through an Enriched
Product Portfolio
Laurus Labs Limited
Annual Report 2017-1816

Laurus Labs, through its innovative and patented technologies, has been at the forefront of developing and manufacturing highly pure, well-characterised specialty ingredients for use in nutraceutical, dietary supplements and cosmeceutical products.
Our integrated development approach ensures distinct advantages for the organisation. Primarily, it helps to control quality attributes of key input materials and cost across the product lifecycle, apart from de-risking supply chain challenges. Our progression towards formulation represents a win-win for us and our customers – providing us with a sustainable revenue model while allowing our clients to focus on market expansion and branding. We have entered into partnerships with other pharma companies for developing and marketing of several ARV formulations on profit and cost sharing basis.
Strong R&D thrustWe continue to prioritise resources and focus on discovery activities on diseases within our existing therapy areas where we believe there is the greatest potential to meet patient needs through the application of novel science. This continual process of prioritisation is designed to ensure that the projects we have in our pipeline constitute programmes which we believe are most likely to deliver technical and commercial success. During the financial year, the
Company invested 5.53% of its revenue on R&D and continues to build the support infrastructure. Our research-first approach is geared to:
- Deliver innovative solutions that address unmet medical needs through a patient-centred approach to R&D
- Create new value by building a competitive R&D pipeline in core therapeutic areas
- Focus on increasing R&D productivity by advancing initiatives for the short, medium and long-term
- Ensure higher intensity of research spends as a proportion to sales results in broader portfolio of commercialised products
- Set up continuous development programmes for established products
Focus on quality and safety beyond complianceTo strengthen our quality systems, we integrated all manufacturing processes and support functions under a unified 'Global Quality Management System' to drive the quality agenda at an enterprise level. We have been making significant investments in upgrading our manufacturing infrastructure and quality systems to the best-in-class for the industry. We are investing in structured capability building across all levels to keep pace with technological enhancements. We have also invested heavily in compliance processes, with additional efforts in creating awareness, hiring more personnel and upgrading our equipment and facilities.
550+R&D scientists
8New products launched in 2017-18
55+No. of R&D laboratories
The Year in Review Statutory Reports Financial Statements
17Building Momentum

BUILDING MOMENTUM
At Laurus Labs, we have invested in progressively adding capacities with the objective to leverage economies of scale and to ensure sufficient supply for our customers. We offer R&D services on a global scale with a specialisation in development processes that are scalable to commercialisation.
Building Momentum
through Capacity
Augmentation
Laurus Labs Limited
Annual Report 2017-1818

By leveraging our global manufacturing footprint, we are optimising the allocation of production to maximise efficiencies.
Integrated manufacturing capacity in place- During the year, we invested in
expending the formulations facility at Vishakapatnam and expanded the capacity from 1 billion tablets per year to 5 billion
- We are targeting 30 ANDAs filings (10 filed till date) over the next three years
- We are focused on forward integration for further improvement in profitability and sustainability
Set up a dedicated block in Unit 4 for an international partner, C2 PharmaWe built a state-of-the art, dedicated production facility for manufacturing of digoxin at Unit 4 in Vishakapatnam
Pick-up in commercial operations from contract with AspenWe entered into a manufacturing and supply agreement with our largest customer Aspen for a custom synthesis, for which we have set up a dedicated block at Unit 1. We have also set up Unit 5 as a dedicated manufacturing block for supplying certain APIs and intermediates exclusively to the Aspen Group. Validations for products from this facility have commenced and commercial production is expected to begin in 12 to 18 months.
The manufacturing facilities are capable of large-scale commercial production of APIs, enabling us to position ourselves as suppliers of choice for pharmaceutical companies seeking to leverage their technical expertise with cost-effective manufacturing and capacities.
The plants are periodically audited by some of the world’s most stringent regulatory agencies – FDA (USA), FDA (Korea), MHRA (UK), TGA (Australia) and WHO-cGMP. Our research and development centre is recognised by TGA (Australia), FDA (USA) and FDA (Korea). We believe quality is a key differentiator in the business and have made strong efforts to adopt uniform manufacturing standards across all the facilities. We also aim to achieve standardised product quality for all the markets.
We expect to grow further going forward, which will translate into a wider product basket that will help generate enhanced revenues and service the needs of a large global customer community.
30 ANDAstarget for filings over the next three years
By leveraging our global manufacturing footprint, we are optimising the allocation of production to maximise efficiencies.
The Year in Review Statutory Reports Financial Statements
19Building Momentum

BUILDING MOMENTUM
Building Momentum
through Global Reach
Global demand for generic drugs will continue to grow as consumers pursue avenues to reduce costs. In the US, generic drugs comprise about 70% of the pharma market by volume. The price destruction after patent expiration is also among the highest in the US, revealing the extent of competitive pressures.
Laurus Labs Limited
Annual Report 2017-1820

With ~$100 billion worth of patent expiries over the next five years, the generics business has huge growth potential. Besides patent expirations, healthcare transformations initiated by the US government, aimed at reducing healthcare spending and covering a larger proportion of the population under public healthcare, are also likely to provide thrust to the generics market.
US patents on key components for some important HIV therapies are set to expire starting from December 2018, and Laurus Labs is gearing up to manufacture generics for HIV patients in the US and across the globe. Our focus is to develop products globally, not only in the US – we have filed two dossiers in Europe, one each in South Africa, Canada and with the WHO. These ANDAs are vertically integrated, which is our biggest advantage, as we develop products and maximise its reach by filing across the geographies. We received the first USFDA approval for g-Viread (Tenofovir Disoproxil Fumarate or TDF) tablets, which are indicated for the treatment of HIV-1 infection in adults and children.
We have a significant market share in the API segment in the ARV category, mainly due to the cost efficiency. We are leveraging these API skills and forward integrating to supply finished dosages, which will enable us to expand. With the
formulations facility in place and a dossier filed with the WHO, we also plan to supply to Low and Middle Income Countries (LMIC) through the tender process. We have entered into partnerships with various companies on profit-sharing basis.
Partnerships We entered into a profit-sharing partnership for developing and selling a basket of FDFs in the US market.
We entered into a partnership for development and sale of ARV FDFs for the US market on profit-and cost-sharing basis.
We entered into a profit-sharing partnership for development and sale of Hepatitis C products in India and emerging markets.
We look forward to building our presence in the segment through a focused portfolio based on our API core strength, while being completely backward-integrated for these products. We target filings of about 8 to 10 ANDAs every year in therapeutic areas such as ARV, diabetes and cardiovascular. Laurus Labs is uniquely positioned in the pharmaceutical opportunity landscape, as our vision has led us to follow an unconventional path that offers sustainable revenues and a competitive advantage.
We look forward to building our presence in the segment through a focused portfolio based on our API core strength, while being completely backward-integrated for these products.
The Year in Review Statutory Reports Financial Statements
21Building Momentum

PEOPLE AND CSR
Engaging People
Our people truly stand apart. It is this talent mix that has helped us become a global pharma company. This year was a momentous one in this journey. It saw us setting new records, crafting innovative breakthroughs and displaying, once again, our immense focus on creating tangible, lasting value in everything we do.
During the year, we were certified as a ‘Great Place to Work’ in the large-sized organisation category in India. Laurus Labs is known for its values and every employee strives to live those values and contribute to the larger goal and vision of the organisation.
Training and development At Laurus Labs, we empower people to develop the skills and expertise required to achieve their professional goals. We encourage and support our people in achieving their full potential by providing a range of Learning and Development (L&D) programmes. These are designed to build their capabilities and encourage the behaviours needed to deliver our business strategy. Our leadership development frameworks are focused on the core capabilities, which we believe are essential for strong and effective leadership. These capabilities are defined for each level in the organisation and apply to all our employees. We are confident in the knowledge that the investment in their training is an investment in our future. Our ability to create benchmarks rests on the
diverse and versatile talents of our people, their capabilities and the skillsets that we have built over the years.
Improving employee engagementWe use a variety of global leadership communications channels to engage employees in our business strategy. These include face-to-face meetings and video-conferencing to encourage two-way dialogue. Critical to our success is our capability to identify and attract the right person with the right experience, skills and cultural fit. We invest deeply in the recruitment and interview process to ensure that a candidate’s aspirations, values and talents collaborate with the Company goals, values and needs.
Ensuring health and safety We have set in a stringent safety policy at every workspace we occupy, across our operations, from the R&D centres to sales offices.
3,186
32
Total employee strength as on March 31, 2018
Average age of employees
Laurus Labs Limited
Annual Report 2017-1822

Our ability to create benchmarks rests on the diverse and versatile talents of our people, their capabilities and the skillsets that we have built over the years.
The Year in Review Statutory Reports Financial Statements
23Building Momentum

PEOPLE AND CSR
Supporting Communities
At Laurus Labs, we believe that for development to be sustainable, people need to be empowered to support themselves. We also trust that in every human being and organisation, there is a latent need to ‘give back to society’. It is with this perspective that we focus on sustainable livelihoods and quality education.
Key activities undertaken during the year: -
- Donated an amount of nearly `33 lakhs to LV Prasad Eye Institute, promoting preventive healthcare
- Constructed a laboratory at Andhra University to promote education
- Donated mobile van to Akshaya Patra for transporting food, thereby helping eradicate hunger, poverty and malnutrition
- Contributed to science fair, promoting education
- Contributed salary for an additional school teacher in Government primary school in Hyderabad and Visakhapatnam
- Contributed stipend for Krishna University Students as per the agreement executed with them during the internship
- Sponsored a mobile science van to promote education in all the schools in Parawada, Visakhapatnam
- CSR Promotion for ISB Programme
- Sponsored the tuition fee as well as the stipend for MSc integrated course to Gitam University
- Donated funds to Devnar Foundation for ear surgeries
- Contributed for sports activities at ZPHS Lankelapalem
Laurus Labs Limited
Annual Report 2017-1824

Awards & Recognitions
Laurus Labs listed in the Fortune 500 Companies List in India
Laurus Labs certified as ‘Great Place to Work’ for the year 2018Laurus Labs has been certified as a ‘Great Place to Work’, in the large-sized organisation category in India, in the 2018 edition of Great Place to Work – a study by the Great Place to Work Institute. It is an important step for the organisation in its journey to build a high-trust, high-performance culture.
IKP Achiever Award 2017Laurus Labs received the IKP Achiever Award 2017 for the growth it recorded during 2017. The Award was received by Mr. Chandrakanth Chereddi, Executive Director, Laurus Labs, accompanied by Mr. Anjaneyulu GSR, Exe-VP, and Mr. Raman Rao CHV, VP, on October 29, 2017.
Laurus wins ‘API Supplier of the Year’ AwardLaurus Labs has been named as the ‘API Supplier of the Year—2017’ at the Global Generics and Biosimilars Awards. These awards recognise companies that implement best practices in the global pharmaceutical industry.
National Safety AwardLaurus Labs received the prestigious National Safety Award for best safety performance from DGFASLI, Ministry of Labour and Employment, Government of India.
The Year in Review Statutory Reports Financial Statements
25Building Momentum

GOVERNANCE FRAMEWORK
Governance Framework
Laurus Labs has positioned the enhancement of corporate governance as an important management task. We are committed to responding appropriately and fairly to the requests of shareholders and continually increase corporate value. We believe that good corporate governance is a critical factor in achieving business success and originates from robust internal controls and high ethical standards.
Risk management processThe objective of our risk management activities is to recognise, assess and manage risks early on and to implement appropriate measures to minimise them. Risk management at Laurus Labs is a continuous process of analysing and managing all the opportunities and threats faced by the Company in its efforts to attain its goals and to ensure continuity of the business. It is an integral part of management, embedded in Company’s culture and practices, and tailored to fit the business functions and processes of the organisation. The process is a continuous loop comprising context formation, risk assessment, risk treatment, communication and consultation, and finally, monitoring and review. We have established processes and guidelines, along with a strong overview and monitoring system, at the Board and Senior Management levels.
Risk management
process
1
2
34
5
Context
Mon
itorin
g
Risk
formation
and
revi
ew
assessment
Communicatio
n
and consulta
tion
Risktreatment
Laurus Labs Limited
Annual Report 2017-1826

Nature of Risk Definition and impact Mitigating factors
Industry Risk Downturn in the industry could adversely impact the Company’s performance
- Laurus Labs is present across major pharmaceutical markets in the world
- The Company periodically evaluates various developments in these markets to identify the risk, if any, arising from them
Competition Risk Competition in domestic as well as international markets could affect market presence
- Building economies of scale in manufacturing, distribution and procurement to maintain cost advantage
- Strengthening long-term relationships with key customers by offering better quality and service know-how
- Introducing cost-improvement initiatives and manufacturing efficiency expansion at plants
- Undertaking R&D initiatives, focusing on optimising raw material consumption and increasing manufacturing capability
Regulatory Risk Pharmaceutical business is highly regulated and is under continuous surveillance by various regulatory authorities. Inability to receive necessary approvals for manufacturing could affect business operations
- Stringent review systems to ensure compliance with the statutory guidelines and norms of the pharmaceuticals industry
Innovation Risk Lack of niche products and processes may negatively affect growth rate
- Strong R&D capabilities
- Proven track record in filing, approval and commercialisation of niche products and processes
- Robust pipeline of products and processes under development
- Strong chemistry know-how, efficient process optimisation and niche product portfolio have resulted in a strong global presence and market leadership
Operating Risk Inability to manage vendor-cum-customer relationships could impact revenues
- Laurus Labs has successfully retained vendor-cum-customer relationships, leading to organisational stability and predictability despite stringent business environment
- We enjoy enduring relationships with major global and Indian pharma majors, ensuring revenue visibility
- Efficient review mechanism to enhance operational efficiency
Capacity Planning and Optimisation Risk
Inadequate capacity could threaten the capability to meet customer demands, affecting margins
- The business team frequently monitors product trends to ensure adequate capacity and meet the demand
- Robust processes are in place to continuously examine plant capacities
- We drive improvements associated with manufacturing practices such as preventive maintenance schedules and alterations to plant designs in case of frequent breakdowns
- Project management processes are aligned to business goals
Risk Management
The Year in Review Statutory Reports Financial Statements
27Building Momentum

Board of Directors GOVERNANCE FRAMEWORK
Dr. M. Venu Gopala RaoNon-Executive Chairman and Independent Director
Dr. Lakshmana Rao C VExecutive Director
Mr. Ramesh SubrahmanianIndependent Director
Dr. Ravindranath KancherlaIndependent Director
Dr. Satyanarayana Chava Executive Director and Chief Executive Officer
Mr. Narendra OstawalDirector
Mr. Ravi Kumar Venkata Vantaram Executive Director and Chief Financial Officer
Mrs. Aruna Rajendra BhingeIndependent Director
Mr. Chandrakanth ChereddiExecutive Director
Dr. Rajesh Koshy ChandyIndependent Director
Dr. M. Venu Gopala RaoNon-Executive Chairman and Independent Director
Dr. M. Venu Gopala Rao is a B.Sc. (Hons) in Chemical Engineering from the Andhra University, with a Post-Graduation in Pulp and Paper Technology from the Forest Research Institute, Dehradun. He received advanced training in Pulp and Paper Technology in the US and, subsequently, one year of intensive training in Rayon Grade Pulping at M/s. Snia Viscosa S.P.A. Italy, pioneers in man-made fibre industry. Dr. Rao was the past Chairman of Indian Paper Makers Association and is a Director on the Boards of various companies of Nava Bharat Group.
Laurus Labs Limited
Annual Report 2017-1828

Dr. Satyanarayana ChavaExecutive Director and Chief Executive Officer
Dr. Chava is the Founder and Chief Executive Officer of Laurus Labs. He is also Executive Director of the Company. He holds a bachelor's and master's degree in Science from Andhra University and completed his Ph.D in 1992. He has received an honorary degree of Doctor of Science from the Gandhi Institute of Technology and Management. He also holds a post-graduate diploma in quality management from the Worldwide Quality Certification and has completed the post-graduate programme in management for senior executives from the Indian School of Business. With over three decades of experience in the pharmaceutical industry, he has been steering the Company towards growth, both in domestic and global markets. He has valuable experience in various domains of the industry such as research and development, and API process development. His stints with top pharmaceutical companies let him gather experience in other aspects of the business such as manufacturing and business development. He has more than 100 patents registered to his name, which helped him garner knowledge regarding intellectual property in the pharma sector.
Mr. Ravi Kumar Venkata Vantaram Executive Director and Chief Financial Officer
Mr. Vantaram is an Executive Director at Laurus Labs since 2006. He holds bachelor's and master's degrees in Commerce from Andhra University and is a fellow member of the Institute of Cost Accountants of India (formerly ICWAI). With nearly three decades of experience in finance, information technology, HR and supply chain, he contributes significantly in formulating and executing core strategies for the Company. His knowledge in dealing with mergers and acquisitions and joint venture management in the global context has helped Laurus Labs emerge as a global pharmaceutical player.
Mr. Chandrakanth ChereddiExecutive Director
Mr. Chereddi is an Executive Director of the Company since August 9, 2016, and has been associated with Laurus
Labs since February 10, 2012. He has over eight years of experience in project management. Before Laurus Labs, he worked with McKinsey & Company as a healthcare practice member in India. He holds a bachelor’s degree in Engineering (Computer Science and Engineering) from Osmania University and a master’s degree in Science in Electrical and Computer Engineering from University of Illinois. He has also completed the post-graduate program in Management from Indian School of Business, Hyderabad.
Dr. Lakshmana Rao C V Executive Director
Dr. Rao is an Executive Director of the Company and one of the promoters of the Company. He has been associated with the Company for more than a decade and heads the quality function. He holds a master’s degree in Science and a Ph.D. from Andhra University. Dr. Rao has over 24 years of experience in quality control, quality assurance and regulatory affairs. He has been involved in formulating and executing the core strategies of the Company. Prior to joining Laurus Labs in February 2007, he was associated with Mayne Health Pty Ltd., Australia.
Mr. Narendra OstawalDirector
Mr. Ostawal is a Non-Executive Director of the Company. He is the Managing Director at Warburg Pincus’ India division and focuses on Warburg’s investments in India. Previously, he worked as an Associate with 3i Group plc, and McKinsey and Company. He is a CA and holds an MBA from Indian Institute of Management, Bangalore.
Mrs. Aruna Rajendra BhingeIndependent Director
Mrs. Bhinge is a Non-Executive, Independent Director of the Company. She holds bachelor’s and master’s degrees in Science from University of Poona and University of Mumbai respectively. She also holds a master’s degree in Management Studies from University of Mumbai. She has over 15 years of experience in food security and strategic planning. She was the head of food security agenda, APAC, at Syngenta India Limited.
Dr. Rajesh Koshy ChandyIndependent Director
Dr. Chandy is a Non-Executive, Independent Director of the Company. He holds a bachelor’s degree in Engineering (Electronics and Communications) from Madurai Kamraj University, a master’s degree in Business Administration from University of Oklahoma and a Ph.D in Business Administration from University of Southern California. He has been a professor of marketing at London Business School and has held the Tony and Maureen Wheeler Chair in Entrepreneurship at LBS.
Mr. Ramesh SubrahmanianIndependent Director
Mr. Subrahmanian is a Non-Executive, Independent Director of the Company. He holds a bachelor’s degree in Commerce from the University of Mumbai. He is also a certified Chartered Accountant from the Institute of Chartered Accountants in England & Wales. He has over 25 years of experience in pharmaceuticals, medical devices and speciality chemicals including 19 years of experience with Sanofi and its predecessor companies (Aventis, HMR and Hoechst AG). He is also the founder and director of Alchemy Advisors, an advisory firm based in Singapore.
Dr. Ravindranath KancherlaIndependent Director
Dr. Kancherla is a Non-Executive Independent Director of the Company. He is a world-renowned expert in surgical gastroenterology and laparoscopic surgery and is heading Global Hospitals Group. He developed India’s most comprehensive hospital dedicated to gastroenterology and a centre to efficiently conduct the complicated procedure of organ transplantation. With extensive experience in surgeries, Dr. Ravindranath has become an authority in liver, pancreatic and bile duct resections, revision gastric surgeries and reconstructive coloproctology. He has trained over 700 surgeons in laparoscopic procedures.
The Year in Review Statutory Reports Financial Statements
29Building Momentum

Management Team
Dr. Anjaneyulu G S R Executive Vice President - Supply Chain Management
Dr. Anjaneyulu has over 25 years of experience in the pharmaceutical industry with over 120 patents and 20 scientific journals to his name. A member of American Chemical Society, he has served as the Associate Vice President at Matrix Laboratories. He led the research and development team that handled the API research there. He has a rich experience of intellectual property management, process development, scale-up and technology transfer of drug substances of many therapeutic categories, fine chemicals and intermediates.
Dr. V Uma Maheswer RaoExecutive Vice President - Chemical R&D
Dr. Rao has been associated with the Company since June 9, 2016. He holds a master’s degree in Science and a Ph.D from Osmania University. He has several years of experience in the fields of process research and development and API manufacturing process. Prior to joining Laurus Labs, he was the executive director of Sriam Labs.
Mr. Srinivasa Rao SExecutive Vice President - Manufacturing
Mr. Rao spearheads the Company’s manufacturing facility at Vizag. He is a post-graduate in Chemistry. He has over 24 years of experience working with various pharma companies in production planning, coordination and execution of the manufacturing processes.
Mr. Bhaskaraiah MSenior Vice President - Supply Chain Management
Mr. Bhaskaraiah is a chemical engineer with over 20 years of experience in the pharma industry. Previously, he has worked with top pharma companies where he served in different positions. He has handled roles involving project management, manufacturing, production planning and supply chain management, among others.
GOVERNANCE FRAMEWORK
Laurus Labs Limited
Annual Report 2017-1830

Mr. Martyn Oliver James PeckSenior Vice President - Business Development
Mr. Peck handles business development of the generics API. He has over 20 years of experience in the industry and has performed various functions such as sourcing, purchasing, sales and market intelligence. He has served as the Global Head of API sourcing for Mayne Pharma. He is a BSc in Biological and Medicinal Chemistry.
Dr. Prafulla Kumar NandiSenior Vice President – Global Regulatory Affairs
Dr. Nandi brings along 22 years of rich experience in global regulatory affairs and pharmaceutical research. He is actively involved in managing regulatory submissions and negotiating with regulators to obtain timely product approvals. He has extensive knowledge in global drug development for highly regulated markets like the US and Europe. He has strong background in providing responses to regulatory agencies regarding product information or issues. Before joining Laurus Labs, he was associated with Apotex India, Jubliant Generics and Sun Pharma Advanced Research Centre, among others.
Mr. Krishna Chaitanya ChavaSenior Vice President – Head Synthesis and Ingredients
Mr. Krishna Chaitanya spearheads the Synthesis and Ingredients divisions of the Company and has rich work experience in strategy, skill workshops and marketing within the Indian Pharma Market.
Mr. Krishna Chaitanya has completed PGP MFAB from Indian School of Business, Hyderabad, and has done a master’s degree in Mechanical Engineering from North Carolina State University, USA, Bachelor’s Degree in Mechanical Engineering from BITS Pilani Dubai.
Before joining team Laurus, he was associated with M/s. Dr Reddys Laboratories Ltd.
Mr. Thomas Versosky President - FDF, North America
Mr. Versosky leads the commercial team bringing Finished Dosage Form products to the market in North America. He brings nearly 15 years of experience in leadership roles across the US generic pharmaceutical industry with diverse experience in commercial operations including portfolio management and business development licensing and acquisitions. He has launched over 100 products in the US from generics to 505(b)2 and NDA products.
The Year in Review Statutory Reports Financial Statements
31Building Momentum

MANAGEMENT COMMENTARY
Management Discussion and Analysis
Economic Overview
Global Economy
Sustained and broad-based macroeconomic growth was firmly in the saddle in 2017-18 with pick-up in investment, stable earnings performance and gradual tightening of monetary policies of the world’s leading advanced economies. The US economy benefited from implementation of tax reforms, robust activity and favourable monetary policies in 2017. These reforms elevated US GDP growth to 2.3% in 2017, which is 80 basis points higher compared to 2016. The eurozone posted a 10-year-high growth of 2.5% due to strong domestic demand and higher exports. The world’s second largest economy, China, gained from uptick in world trade and posted its highest growth since 2015. China’s GDP grew 6.9% in 2017 versus 6.7% in the previous year.
Global Growth %
Particulars Projections
2016 2017 2018 2019
World Output 3.2 3.7 3.9 3.9Advanced Economies 1.7 2.3 2.3 2.2United States 1.5 2.3 2.7 2.5Eurozone 1.8 2.4 2.2 2.0Japan 0.9 1.8 1.2 0.9United Kingdom 1.9 1.7 1.5 1.5Other Advanced Economies* 2.3 2.7 2.6 2.6Emerging Markets and Developing Economies
4.4 4.7 4.9 5.0
China 6.7 6.8 6.6 6.4India** 7.1 6.7 7.4 7.8
* Excludes the G7 (Canada, France, Germany, Italy, Japan, United Kingdom and United States) and eurozone countries
** For India, data and forecasts are presented on a fiscal year basis and GDP from 2011 onwards is based on GDP at market prices with FY2011-12 as the base year
Source: International Monetary Fund (IMF)
Buoyant investments coupled with higher capital
expenditure will be the other drivers of global growth
in 2018.
OutlookAll-round improvement in economic growth propelled the International Monetary Fund (IMF) to raise its global growth estimates for 2018 and 2019 to 3.9%. The trend of strong investments and increase in global trade is likely to continue, benefiting economies with higher exports. Central Banks around the world are looking to align their monetary policies to balance liquidity and interest rates with higher growth. Buoyant investments coupled with higher capital expenditure will be the other drivers of global growth in 2018.
Indian Economy
According to Central Statistics Office (CSO)’s latest estimates, India’s GDP is likely to grow at 6.6% in 2017-18, which is a tad lower than the 7.1% growth registered in 2016-17. However, this steady pace shows the resilience of Indian economy to structural reforms such as the Goods and Services Tax (GST) and demonetisation. Slower growth in agriculture and allied industries had some bearing on the economic growth but was partly offset by the uptick seen in the services sector and rise in construction activity.
The Reserve Bank of India (RBI) adopted an accommodative policy in 2017-18 and kept key rates largely unchanged. The index of consumer price inflation stood at 4.28% in March
Annual Report 2017-1832
Laurus Labs Limited

2018, slowing for the third straight month from a 17-month high supported by stable price components and particularly from food and beverages.
Strong output from the manufacturing segment aided growth in Index of Industrial Production (IIP), which stood at 7.5% in January 2018 versus 7.1% in December 2017. This metric though came down to 3.7% in April to January 2017-18 from 5.1% in the comparable period a year ago. Lower non-tax revenues led to a sharp surge in fiscal deficit, which stood at ` 7.15 trillion or 120% of the Government’s 2017-18 revised estimate of ` 5.95 trillion. However, the 2017-18 fiscal deficit is likely to fall below the revised estimate as RBI transfers ` 100 billion in surplus and the Food Corporation of India (FCI) returns the excess allocation of ` 500 billion back to the Government.
In the Union Budget 2018-19, the Government announced that it will launch a flagship National Health Protection scheme to cover ~100 million families or ~500 million people and provide cover of up to ` 0.5 million per family per year for secondary and tertiary hospitalisation. This is positive for hospitals as the patient base will expand.
2018 2nd est
2018 1st est
2017
2016
6.6
6.5
7.1
8.2
Annual Growth Outlook Gets Better (%)
Source: Central Statistics Office (CSO)
OutlookIndia’s economic growth is likely to pick up in 2018-19. Though there are upside risks to inflation, it is expected to remain range-bound in the short-term. As the global economy is expected to grow at a healthy clip, India’s exports too are likely to improve in the coming year. Disruptions caused by GST implementation
will smoothen out gradually and benefit economic activity across the country. Continued focus on reforms will be instrumental in boosting India’s economic growth. Higher tax revenues and increasing formalisation across sectors are among the key benefits of GST and will ensure long-term and consistent growth of the economy.
Pharmaceutical Industry
Global
As per the IQVIA Institute, net spending on branded medicines in developed markets increased to $395 billion from $326 billion over the past five years. The institute believes net spending on brands will remain flat even as it is likely to fall 1-3% to $391 billion in developed markets in 2018. New medicine growth could drive 2.5% to 3.5% of brand spending in developed markets between 2018-22. In this period, patent expiry will be 37% higher than in the preceding five years and spending on exclusive brands will reduce by $30 billion across developed markets. Specialty medicines are likely to form 41% of developed market spending in 2018, compared to $172 billion in 2013 and will largely make up for the fall in traditional medicines. Specialty medicines are aimed at curing ailments such as autoimmune diseases, cancer and antivirals for Hepatitis C, among others. While oncology and autoimmune biologics are at the top in specialty medicines, antiviral treatments of Hepatitis C are likely to fall as most patients are cured.
Global Medicine Spending and Growth 2007-22
Spen
ding
$ b
illio
n
Forecast Spending Growth%
Gro
wth
Con
stan
t U
S$
2007 2008 2009 2010 2011 2012 2013 2014 2015 2016 2017 2018 2019 2020 2021 2022
1,600
1,400
1,200
1,000
800
600
400
200
0
10%
9%
8%
7%
6%
5%
4%
3%
2%
1%
0%
Source: IQVIA Market Prognosis, September 2017; IQVIA Institute, October 2017
New medicine growth could drive 2.5% to 3.5% of brand spending in developed markets between 2018-22.
The Year in Review Statutory Reports Financial Statements
33Building Momentum

United States
The US has accounted for 87% of the net growth in branded medicine in developed markets over the past five years. Going forward as well, the US will witness growth of 1-4% in net spending on branded medicines between 2018-22. The country has been the frontrunner in growth of specialty medicines and such medicines are likely to account for more than half of all medicine spends in the US in 2022. In contrast, the real net per capita spending on medicines is likely to fall in 2018 in the US and is expected to stay flat at ~$800 per person till 2022. New oncology medicine growth slowed in 2017 due to fewer launches of earlier medicines and the fact that new medicines catered to smaller populations. While biologics grew at a healthy clip in 2017, spending on biosimilars too increased in the year.
Total Spending on Medicines and Growth $ billion
Spen
ding
$ b
illio
n
Net Spending
Invoice to Net Difference
Net Spending Growth%
Invoice Spending Growth%
2008 2009 2010 2011 2012 2013 2014 2015 2016 2017
500
450
400
350
300
250
200
150
100
50
0
20%
15%
10%
5%
0%
-5%
Source: IQVIA, National Sales Perspective; IQVIA Institute, December 2017
MANAGEMENT COMMENTARY
Europe
The European pharmaceutical market is likely to grow by 25% during 2017-22 (Source: Evaluate). The five major European countries (France, Germany, Italy, Spain and the UK) are among the top few countries witnessing strong growth in the specialty medicines space with a share of above 41%.
Emerging MarketsAccording to the IQVIA Market Prognosis report, medicine spending from the pharmerging markets has increased at CAGR of 13% between 2007 and 2017 to $270 billion. On one hand, governments of these countries are taking initiatives to step up healthcare access to the public while on the other, most of these markets are the next growth frontiers for a host of MNC manufacturers. Generics will continue to dominate these markets in 2018 as well with estimated growth of 7-8% in 2018. The growth in these markets is pegged at 6-9% to $345-375 billion by 2022. The largest pharmerging market, China, will grow by just 5-8% by 2022 to $145-175 billion with India growing at the fastest pace of 9-12%. Russia will grow by 7-10% in this period. India is likely to be in the top 10 countries by spending in 2018.
Africa
The pharma industry in Africa is estimated to grow at 9.8% annually over 2010-20 and will be worth $40-65 billion at the end of the decade. The key drivers of this growth will be improving economic activity, setting of a new regulatory agency and higher foreign investments in the industry. Generic drugs are gaining market share from branded medicine and over-the-counter products in the African market. Infectious diseases like malaria, AIDS and tuberculosis are some of the prominent diseases on the continent, which is also likely to see rise in the incidences of lifestyle diseases such as diabetes, cancer and cardiovascular diseases, among others.
The US has accounted for 87% of the net growth in branded medicine in
developed markets over the past five years.
Laurus Labs Limited
Annual Report 2017-1834

India
The pharmaceutical industry in India is estimated to grow at $100 billion by 2025 and from 3.1% to 3.6% of the global industry (Source: IBEF Pharmaceuticals Report, March 2018). In 2017, the Indian pharmaceutical market grew 5.5% over the previous year. In India, the cost of manufacturing pharma products is lower compared to other countries, which has contributed to the country having a strong manufacturing base. This is aided by technology development and availability of highly skilled and large pool of scientists and engineers who have the potential to steer the industry to an even higher level.On the macro front, factors like rising penetration of health insurance, improvement in medical infrastructure and increasing size of middle-class households will drive pharmaceutical industry growth in the country.
India’s pharmaceutical exports are expected to reach $20 billion by 2020. The country’s share in global generics exports stands at 20% and it is the largest maker of generics drugs globally. The generics market is slated to reach $27.9 billion by 2020 and currently forms about 70% of India’s pharmaceutical industry. R&D spends contribute anywhere between 8-13% of revenues of Indian pharmaceutical companies and is likely to move northwards going forward.
Government InitiativesThe Government of India has adopted a host of measures to facilitate the growth of the pharmaceutical sector in India. Allowance of 100% foreign direct investment in the sector through the automatic route and reduced approval time for new facilities are the prominent measures in this direction.
.
Pharma Vision 2020Aimed at boosting end-to-end drug manufacturing in India, this policy could catapult India into becoming a major hub for drug discovery and manufacturing in the world.
National Health Policy, 2017This policy is aimed at providing affordable healthcare services to the people of the country. It focuses on increasing public expenditure on the healthcare segment and the Government has allocated ` 1,200 crore ($185.36 million) towards this scheme. ~1,50,000 health and wellness centres will be set up under this scheme to take quality, affordable healthcare facilities to every nook and corner of the country.
National Health Protection SchemeThis scheme is aimed at providing health insurance in the country and will provide a cover of up to ` 5 lakh ($7,723.2) per family per year for secondary and tertiary care hospitalisation. This will lead to expansion of patient base across hospitals.
Outlook The Indian pharmaceutical market is well-poised for growth. Improved accessibility of drugs, increasing fatal diseases, rising penetration of health insurance, increasing incidence of lifestyle diseases such as diabetes and cancer, among others, are some factors enabling long-term demand for the sector. Availability of a large pool of skilled manpower, low-cost advantage, boost to manufacturing and R&D are key supply side drivers of growth. These, coupled with continued Government support and favourable policies, will continue to aid growth of the sector in India.
Active Pharmaceutical Ingredients (API) IndustryThe global API market is estimated to grow to $198.8 billion by 2022 driven by factors such as government initiatives, regional penetration, increasing aged population and patent expiration of prominent drugs. Among its various applications such as anti-infectives, gastrointestinal disorders, oncology and hormone-related disorders, oncology is likely to be the fastest growing application of API by 2022. Investments in R&D coupled with patent expirations of drugs will make Asia Pacific the fastest growing API market by 2022.
Antiretroviral (ARV) MarketAccording to Mordor Intelligence, the global anti-retroviral therapeutics market is expected to register a CAGR of 6.2% during the forecast period 2018 to 2023. North America dominates the market due to growing occurrence of Hepatitis C and HIV infections, coupled with the presence of huge patient pool suffering from virally infectious diseases. In 2017, 20.9 million people were accessing antiretroviral therapy, globally. The high demand for anti-viral drugs will likely drive the market growth during the forecast period.
The World Health Organisation (WHO) has updated its treatment guidelines to include additional treatment options for the HIV patients. The new fixed combination recommended as an alternative to the current therapy of TLE/TEE (Tenofovir + Lamivudine or Emtricitabine + Efavirenz) are TLD/TED (Tenofovir+ Lamivudine or Emtricitabine + Dolutegravir) and TLE400 (Tenofovir+ Lamivudine or Emtricitabine + Efavirenz 400). The shift to Dolutegravir (DTG) is driven by better efficacy and higher genetic resistance barrier, while Efavirenz lower dose is recommended for its better safety profile compared to Efavirenz 600 mg/day dose. Share of DTG is likely to surge to 59% in Generic Accessible (GA) Low and Middle-Income Countries (LMICs) by 2021.
The Year in Review Statutory Reports Financial Statements
35Building Momentum

MANAGEMENT COMMENTARY
Hepatitis C MarketGlobally, 1.76 million people received treatment for infection with the Hepatitis C Virus (HCV) in 2016. Hepatitis C results in inflammation of the liver, spreading through contact with infected blood and bodily fluids. Given that affordable medicines are available for this disease, the market is likely to see high growth. These medicines have negligible side-effects and increased awareness about this disease will drive drug demand for Hepatitis C.
CRAMS IndustryThe Contract Research and Manufacturing Services (CRAMS) industry is expected to reach $18 billion in 2018 at a robust CAGR growth of 18-20% between 2013-18. The US market continues to hold the largest share even as India is expected to witness strong growth in this market in the coming years. Growing demand for generic drugs and patent expiry of major therapeutic brands are a few growth drivers for this market. India’s CRAMS market is likely to grow at thrice the pace of global growth by 2018. Reduced drug development time, and rise in the trend of outsourcing of non-core activities to drive cost efficiencies are key factors enabling the growth of the Indian CRAMS market.
NutraceuticalsThe nutraceuticals market is estimated to be worth around ~250 billion by 2018 and $275 billion by 2021 (Source: KPMG). Against CAGR growth of 4% between 2002-2010, this market is likely to grow at CAGR rate of 7.3% over 2015 to 2021. Nutraceuticals are dietary products having some degree of purported or clinically evidenced medical benefit. Increasing awareness
around the consumption of healthy foods, steady innovation of natural ingredients used in nutraceuticals and faster growth of e-commerce are some factors driving nutraceuticals demand worldwide. Consumers perceive these products as healthier compared to synthetic medicines and hence, the demand for such products is likely to grow at a rapid pace.
Generics The generics market stood at $26.1 billion in 2016 and is likely to reach $88 billion by 2021 in the US, while in India it is expected to touch $27.9 billion in 2020, up from $13.1 billion in 2015. India accounts for 20% of global generics exports and was the world’s third largest generic API market in 2016 with record 300 generic drug approvals in the US in 2017 and the highest number of DMF applications. The major growth drivers include macroeconomic factors such as rising per capita incomes, growing healthcare awareness, increasing medical insurance penetration and higher incidence of chronic ailments.
Company OverviewHyderabad-based Laurus Labs is a niche player in the pharmaceutical space and enjoys leadership position in generic APIs for select, high-growth antiretrovirals such as Efavirenz, Tenofovir, Hepatitis C and oncology. It also manufactures APIs in other areas such as anti-diabetes, anti-asthma, ophthalmology, cardiovascular and Proton Pump Inhibitors (PPIs), to name a few. APIs contribute ~89.5% of the Company’s total revenues. Besides APIs, Laurus Labs is also present in three other segments –Synthesis (7.4% of revenues), Ingredients (2.8%) and Generic Finished Dosage Formulations or FDF (0.3%).
Generic APIs Synthesis Ingredients Generic FDFs
Development, manufacture and sale of:
• APIs
• Advanced intermediaries
• Contract development
• Manufacturing services for global pharma companies
Manufacture and sale of speciality ingredients used in:
• Nutraceuticals, dietary supplements and cosmeceutical products
Development and manufacture of:
• Oral solid formulations
Laurus Labs Limited
Annual Report 2017-1836

We have four manufacturing facilities in Visakhapatnam, Andhra Pradesh. Of these, three manufacture APIs and ingredients and the fourth facility produces FDFs and one API. The Company inaugurated Unit 4 in November 2017, which boosted capacities of the Synthesis and Ingredients businesses. Laurus Labs also acquired the API unit of its wholly-owned subsidiary Sriam Labs Pvt. Ltd. on a slump sale basis and renamed it Unit 6. Capacity at Unit 2 was also expanded from 1 billion tablets per year to 5 billion.
Strengths• Leadership position in APIs in niche therapeutic areas
• Strong R&D capabilities and process chemistry skills
• Well-established and compliant manufacturing facilities
• Strong and time-tested relationships with leading pharmaceutical companies
• Well-experienced management team
Key Business Highlights 2017-18 • Filed 224 patent applications and 57 patents were granted
in the year
• Ramped up Unit 2’s annual capacity to 5 billion tablets
• Kick-started commercial supplies from Unit 5 to Aspen
• In July 2017, incorporated UK-based 100% subsidiary – Laurus Holdings Ltd.
• In August 2017, incorporated US-based 100% subsidiary – Laurus Generics Inc.
• Launched Velpatasvir (Hepatitis C) product in India in May 2017
• Entered manufacturing and supply agreement for Oncology NCE for clinical phase and commercial supplies
Research and Development (R&D)R&D is at the core of Laurus Labs’ business and is instrumental in driving its growth. In fact, the Company’s ‘Research First’ approach has driven it to achieve and maintain its leadership position in generic APIs in select therapeutic areas. Expert scientists dedicated to R&D form one-fourth of Laurus Labs’ total workforce.
The Company’s strong R&D competencies enable it to keep innovating and serve patients around the world better. Laurus Labs undertakes a systematic R&D approach while selecting molecules by carefully evaluating the technical and commercial feasibility data. We reinforce our manufacturing excellence through proactive investments in R&D. Our operational R&D team focuses on process improvements, which improve yields, minimise variation and reduce waste. There is increasing process discipline, focus on results and motivation to be better at execution capabilities.
At Laurus Labs, R&D is not limited to product innovation but also extends to manufacturing processes, which can in turn drive overall efficiencies. The R&D team (including 45 PhDs) has the expertise to cater to molecules of varying complexities in the areas of chemistry, IP, regulatory, engineering and manufacturing.
Quality and ComplianceWe have been able to create a consistent and credible track record of excellence due to our determined efforts to sustain world-class infrastructure and quality standards. We are continuously delivering and exceeding the expectations of our customers. We follow the philosophy of ‘One quality for all markets’. Across all our manufacturing sites, we have put in place quality systems that cover all areas of business processes from supply chain to product delivery, to ensure consistent quality, efficiency and safety of products. Regular audit programmes validate our attempts to deliver consistent quality. Quality risk management procedures are established and followed for internal audits, failure inquiries and implementation of permanent corrective measures.
Financial Review ` million
Year 2017-18 2016-17 Growth (%)
Net Sales 20,268 19,046 8.0EBITDA 4,369 4,396 0.5PBT 2,374 2,352 0.9PAT 1,731 1,903 (11.9)
Internal Control Systems& AdequacyLaurus Labs has adequate internal control systems and procedures, covering all financial and operating functions commensurate to its size and nature of operations. A strong internal control framework is among the important pillars of corporate governance and the Company strives to enhance it consistently. It is designed to provide reasonable assurance regarding maintaining of accounting controls and assets from unauthorised use or losses. The audit committee considers all internal aspects and advises corrective actions as and when required.
Cautionary Statement Certain statements in this report describing the Company’s objectives, projections, estimates, expectations or predictions may be forward-looking statements within the meaning of applicable securities, laws and regulations. Although the expectations are based on reasonable assumptions, actual results could materially differ from those expressed or implied.
The Year in Review Statutory Reports Financial Statements
37Building Momentum

BOARD’S REPORT
To The Members ofLaurus Labs Limited
Your Directors have pleasure in presenting the 13th Annual Report of the Company together with the Audited Financial Statements for the Financial Year ended 31st March 2018.
Financial Highlights:(` in Million)
Particulars 2017-18 2016-17
Gross Income 20,393 19,183Earnings Before Interest, Tax, Depreciation and Amortization (EBITDA)
4,369 4,443
Finance Charges 754 970Depreciation/Amortization 1,212 1,038Net Profit Before Tax 2,409 2,450Provision for Tax 678 451Net Profit After Tax carried to Balance Sheet
1,731 2,000
Proposed Dividend amount 159 159Proposed Dividend Tax amount 33 32
Company’s Affairs:(i) Operations: During the year under review, your Company achieved the
following:
Revenue crossed INR 20 Bn mark and grew by 7%.
Incorporated the following subsidiaries outside India.
Laurus Holdings Limited, UK
Laurus Generics Inc, USA and
Laurus Generics GmbH, Germany
Acquired Unit 2 of Sriam Labs on slump sale basis with effect from December 1, 2017.
Commenced commercial supplies from Unit 4 for global partner, C2 Pharma.
Commenced commercial supplies from Unit 5 to Aspen.
Commenced commercial supplies from Unit 2 (FDF facility).
Six Product Validations completed for formulation apart from filing of nine ANDAs and one NDA.
Formulations Unit 2, inspected by USFDA with Zero 483 observations.
Formulations Unit 2, Successfully completed inspections from various countries like Tanzania, Uganda & Malawi.
Formulations Unit 2, capacity increased to 5 Bn units.
Tenofovir (TDF) launched after the final approval from USFDA.
Certified as “Best Place to Work” in Jan 2018.
Entered the Fortune 500 list of companies in India.
Received Global Generics and Biosimilar “API supplier of the year award 2017”.
Received IKP Achiever award 2017 for the growth recorded during the year 2017.
Received Indian Innovation award from Clarivate Analytics.
(ii) Outlook: Business prospects will remain positive because of the
growing global demand for generics and opportunities provided by expiry of patents in developed markets.
Various business aspects including market conditions, business opportunities, challenges etc. have been discussed at length in the Management’s Discussion and Analysis (MDA), which forms part of this Annual Report.
Dividend:Your directors are pleased to recommend a dividend @ 15% (i.e. ` 1.50/- per share of face value of ` 10/- each) for the Financial Year ended March 31, 2018. The dividend, if approved by the Members, in their forthcoming Annual General Meeting to be held on July 5, 2018, will be paid to the Members on or after July 11, 2018, whose names appear on the Register of Members as on Book Closure Date.
Transfer to Reserves:Your Company does not propose to transfer any portion of profits to Reserves.
Share Capital:During the year under review, the Company had allotted 2,73,500 equity shares of ` 10/- each to the eligible employees under ESOP Schemes, 2011 & 2016. Accordingly, the share capital has increased as follows:
Paid Up Capital as on March 31, 2017 Movement during the year 2017-18 Cumulative Paid Up Capital after such movement
105,756,249 equity shares of ` 10/- each Allotted 2,73,500 equity shares of ` 10/- each in September, 2017 under ESOP Schemes, 2011 & 2016
106,029,749 equity shares of ` 10/- each
Laurus Labs Limited
Annual Report 2017-1838

Change in the nature of business, if any:There is no change in the nature of business of the Company or any of its subsidiaries or associates, during the year under review.
Material Changes and commitments, affecting the financial position of the Company:There are no material changes and commitments affecting the financial position of the Company that have occurred between the end of the financial year of the Company to which the financial statements relate and the date of the Report i.e. between March 31, 2018 to May 10, 2018.
Fixed deposits:The Company did not accept any fixed deposits.
Subsidiaries, Associates and Joint Ventures:The Company has the following Subsidiaries, namely, (i) Sriam Labs Private Limited; (ii) Laurus Synthesis Inc., USA and (iii) Laurus Holdings Ltd., United Kingdom (UK). Laurus Holdings Ltd., UK, in turn, established two subsidiaries, namely (i) Laurus Generics Inc., United States of America; and (ii) Laurus Generics GmbH, Germany. These subsidiaries are in the process of commencing their business activity.
As per Sec.129(3) of the Companies Act, 2013 the consolidated financial statement of the Company and all its Subsidiaries and Associates prepared in accordance with the applicable accounting standards forms part of this Annual Report. Further, a statement containing salient features of the financial statements of our subsidiaries and associates in the prescribed form in AOC-1 is attached as Annexure - 1 to the Directors’ Report.
Consolidated Financial Statements:Consolidated Financial Statements have been prepared by the Company in accordance with the requirements of applicable Accounting Standards and the provisions of Companies Act, 2013. As per the provisions of Section 136 of the Companies Act, 2013, the Company has placed separately the audited financial statements of its subsidiaries on its website www.lauruslabs.com and copies of audited financial statements of the subsidiaries will be provided to the Members at their request.
Particulars of Loans, Guarantees and Investments:During the year, your Company has continued the Corporate Guarantee to Citi Bank, India and, in turn, Standby Letter of Credit issued by Citi Bank, India to Citi Bank Inc. USA on behalf of the Subsidiary Company, namely Laurus Synthesis Inc. USA, for US Dollars 2 Million, to meet the objectives of the said Subsidiary Company.
Further, the Company has also issued a Corporate Guarantee to the Bankers of Sriam Labs Private Limited in the previous financial year for an amount of ` 290.00 Million, both of which are well within the limits prescribed under Sec.186 of the Companies Act, 2013.
Board of Directors and Key Management Personnel:As per the provisions of the Companies Act, 2013, Mr. V.V.Ravi Kumar and Dr. Satyanarayana Chava will retire at the ensuing annual general meeting and being eligible, seek reappointment. The Board of Directors recommends their re-appointment.
Dr. Satyanarayana Chava and Mr. VV Ravi Kumar have been appointed as Whole Time Directors for a period of 5 years with effect from April 1, 2015 and whose appointments have been approved by the Members in their 10th Annual General Meeting held on July 31, 2015 continue to function as Whole Time Directors of the Company. Subject to approval of the Shareholders of the Company, the Board of Directors of the Company have appointed Dr. Lakshman Rao Ch as Executive Director of the Company with effect from March 8, 2018.
Mr. Rajesh Kumar Dugar, Non-Executive and Nominee Director and Dr. Srihari Raju Kalidindi, Executive Director have resigned as Directors during the year under review. Your directors have appreciated the immense contributions made by the above directors for the growth of the Company.
Board Meetings:The Board and Committee meetings are pre-scheduled and a tentative calendar of the meetings shall be finalized in consultation with the Directors to facilitate them to plan their schedule. However, in case of urgent business needs, approval is taken by passing resolutions through circulation. During the year under review, nine board meetings were held. The details of the meetings including composition of various committees are provided in the Corporate Governance Report.
Declaration from Independent Directors:The independent directors have submitted the declaration of independence stating that they meet the criteria of independence as provided in sub-section (6) of Section 149 of the Companies Act, 2013.
Policy on Directors’ Appointment and Remuneration:The policy of the Company on directors’ appointment and remuneration, including criteria for determining qualifications, positive attributes, independence of a director and other matters are adopted as per the provisions of the Companies Act, 2013. The remuneration paid to the Directors is as per the terms laid out in the nomination and remuneration policy of the Company. The nomination and remuneration policy is adopted by the Board is placed on the Company’s website.
http://www.lauruslabs.com/sites/all/themes/lauruslab//Investors/PDF/Policies/Remuneration_Policy.pdf
Risk Management:Your Company had formulated a risk management policy for dealing with different kinds of risks which it faces in day-to-day operations of the Company. Risk Management Policy of the company outlines different kinds of risks and risk mitigating measures to be adopted by the Board. The Company has
39Building Momentum
The Year in Review Statutory Reports Financial Statements
adequate internal financial control systems and procedures to mitigate the risk. The risk management procedure is reviewed by the Risk Management Committee and Board of Directors on regular basis at the time of review of quarterly financial results of the Company. Further, your Company had constituted a Risk Management Committee which lays down various risk mitigating practices that your Company is required to implement in the Company.
Adequacy of Internal Financial Controls:The internal financial controls with reference to the Financial Statements, apart from statutory audit, internal audit and cost compliance, are adequate to the size and operations of the Company.
Directors’ Responsibility Statement:In terms of Section 134(3)(c) of the Companies Act, 2013, the Board of Directors of the Company states that:
(a) in the preparation of the annual accounts, the applicable accounting standards had been followed along with proper explanation relating to material departures;
(b) the directors had selected such accounting policies and applied them consistently and made judgments and estimates that are reasonable and prudent so as to give a true and fair view of the state of affairs of the Company at the end of the financial year and of the profit and loss of the Company for that period;
(c) the directors had taken proper and sufficient care for the maintenance of adequate accounting records in accordance with the provisions of Companies Act for safeguarding the assets of the Company and for preventing and detecting fraud and other irregularities;
(d) the directors had prepared the annual accounts on a going concern basis;
(e) the directors had laid down internal financial controls to be followed by the company and that such internal financial controls are adequate and were operative effectively; and
(f) the directors had devised proper systems to ensure compliance with the provisions of all applicable laws and that such systems were adequate and operative effectively.
Related Party Transactions:In accordance with Sec 134(h) of the Companies Act, 2013 and Rule 8(2) of Companies (Accounts) Rules, 2014, the particulars of contracts or arrangements entered into by the Company with the Related Parties referred to in Sec.188(1) of the Act, have been provided in Form AOC-2 and attached the same as Annexure - 2.
The details of related party disclosures as stated in the notes to the financial statements forms part of this annual report.
Vigil Mechanism:The Company established whistle blower policy in order to assure that the business is conducted with integrity and that the Company’s financial information is accurate.
BOARD’S REPORT CONTINUE
Auditors:(i) Statutory Auditors: The Board of Directors of your Company, on the
recommendation of the Audit Committee, have recommended to the members for ratification of Deloitte, Haskins & Sells LLP, Firm Registration No.117366W/W-100018 as Statutory Auditors of the Company from the conclusion of 13th Annual General Meeting till the conclusion of 14th Annual General Meeting of the Company.
(ii) Cost Auditors: In accordance with Section 148 of the Companies Act,
2013 read with Companies (Audit & Auditors’) Rules, 2014 and the Companies (Cost Records and Audit) Amendments Rules, 2014, the Company maintains the cost records in respect of its business.
Your Board has appointed M/s. Bharathula & Associates, Cost Accountants, as the Cost Auditors of the Company for the Financial Year 2018-19. As required by the Act, the remuneration of the Cost Auditors has to be ratified by the Members and accordingly the resolution relating to the Cost Auditors is being placed before the Members for their ratification.
(iii) Secretarial Auditors & Secretarial Audit Report: Pursuant to the provisions of Section 204 of the Companies
Act, 2013 and Rule 9 of the Companies (Appointment and Remuneration of Managerial Personnel) Rules, 2014, the Company has appointed Y.Ravi Prasada Reddy, Practising Company Secretary (CP No. 5360) proprietor of RPR & Associates, to undertake the Secretarial Audit of the Company for the financial year 2017-18. The Secretarial Audit Report issued in Form MR-3 is in Annexure - 3 to this Report. There are no qualifications, reservations or adverse remarks in the Secretarial Audit Report.
Auditors’ Qualifications/reservations/adverse remarks/Frauds reported:There are no Auditors’ Qualifications or reservations or adverse remarks on the financial statements of the Company. The Auditors have not reported any frauds to the Audit committee as prescribed under Sec. 143(12) of the Companies Act, 2013.
Significant and material orders passed by the Courts/Regulators:There are no significant and material orders passed by the Courts or Regulators against the Company.
Rating:CARE has upgraded its rating from A+ i.e. Positive Outlook to AA- i.e. Stable on the long term bank facilities of the Company and reaffirmed its rating as A1+ on the short term bank facilities of the Company.
Insurance:All properties and insurable interests of the Company including buildings, plant and machinery and stocks have been fully insured.
Laurus Labs Limited
Annual Report 2017-1840

Corporate Social Responsibility initiatives:Pursuant to the provisions of Section 135 and Schedule VII of the Companies Act, 2013, CSR Committee of the Board of Directors had framed the policy on Corporate Social Responsibility and the Projects and Programs undertaken by the Company during the year under review have been provided in Annexure - 4 and forms part of this Report.
Extract of Annual Return:As required pursuant to section 92(3) of the Companies Act, 2013 and rule 12(1) of the Companies (Management and Administration) Rules, 2014, an extract of annual return in MGT 9 is given in the Annexure - 5 and forms part of this Report.
Statement of Particulars of Appointment and Remuneration of Managerial Personnel/ employees:In accordance with the provisions of Section 134 and Rule 5 of Companies (Appointment and Remuneration of Managerial Personnel) Rules, 2014, the statement of particulars of appointment and remuneration of managerial personnel and employees is attached in Annexure - 6 to this Report.
Human resources:The management believes that the competent and committed human resources are vitally important to attain success in the organization. In line with this philosophy, utmost care is being exercised to attract quality resources and suitable training is imparted on various skill-sets and behavior. Annual sports and games were conducted across the organization to enhance the competitive spirit and encourage bonding teamwork among the employees.
Employee Stock Options:During the year, the Company has allotted 273,500 (Two hundred Seventy-three thousand and five hundred only) equity shares of ` 10/- at a price of ` 10/- per share to various eligible employees of the Company under Employee Stock Option Schemes-2011&2016 upon exercise of their vesting rights.
The details of stock options are as mentioned in Annexure - 7 and forms part of this Report. Further, the details of the stock options stated in the notes to accounts of the financial statements also forms part of this Annual Report.
Conservation of energy, technology absorption and foreign exchange earnings/outgo:The information required under Section 134 (3) (m) of the Companies Act, 2013, read with Rule 8(3) of Companies (Accounts) Rules, 2014, is appended hereto as Annexure - 8 and forms part of this Report.
Policy on Prevention of Sexual Harassment:The Company has formulated and implemented a policy for Prevention of Sexual Harassment of Women at workplace. During the year under review, the Company has not received any complaints under the policy.
The Company has many systems, processes and policies to ensure professional ethics and harmonious working environment. We follow Zero Tolerance towards Corruption and unethical conduct. These are ensured through Whistle Blower Policy, Anti-Corruption Policy, Gift Policy, Sexual Harassment Policy and Redressal Guidelines.
BSE 500:The Equity Shares of your Company have been inducted in S&P BSE 500 indices with effect from March 31, 2017.
Board Evaluation:The Companies Act, 2013 states that a formal annual evaluation needs to be made by the Board of its own performance and that of its committees and individual directors. Schedule IV of the Companies Act, 2013 states that the performance evaluation of independent directors shall be carried out by the entire Board of Directors, excluding the director being evaluated. SEBI (LODR) Regulations, 2015 also mandates that the Board shall monitor and review the Board evaluation framework. The evaluation of all the Directors and the Board as a whole was conducted based on the criteria and framework adopted by the Nomination and Remuneration Committee including performance and working of its committees.
Corporate Governance:A separate section on Corporate Governance practices followed by your Company, as stipulated under Schedule V(C) of the SEBI (LODR) Regulations, 2015 is enclosed forming part of this report.
The certificate of the Practising Company Secretary Mr. Y.Ravi Prasada Reddy with regard to compliance of conditions of corporate governance as stipulated under Schedule V (E) of the SEBI (LODR) Regulations, 2015 is annexed to the Report on Corporate Governance.
41Building Momentum
The Year in Review Statutory Reports Financial Statements

Disclosure with respect to unclaimed suspense account:The following are the details that are required to be provided under Schedule V (F) of the SEBI (LODR) Regulations, 2015:
No. of Shareholders and outstanding shares in the suspense account in the beginning of the year
No. of Shareholders approached for transfer of shares during the year
No. of Shareholders to whom shares were transferred and no. of shares transferred
No. of shareholders and the no. of outstanding shares in the suspense account at the end of the year
3 Shareholders and 105 Equity Shares
3 Shareholders 3 Shareholders and 105 Shares NIL
Business Responsibility Report (BRR)The Listing Regulations mandate the inclusion of the BRR as part of the Annual Report for top 500 listed entities based on market capitalization. In accordance with the Listing Regulations, we have integrated BRR disclosures into our Annual Report.
Acknowledgements:Your Directors would like to place on record their sincere appreciation to customers, business associates, bankers, vendors, government agencies and shareholders for their continued support.
Your Directors are also happy to place on record their sincere appreciation to the co-operation, commitment and contribution extended by all the employees of the Laurus family and look forward to enjoying their continued support and cooperation.
For and on behalf of the Board
Dr. Satyanarayana Chava Ravi Kumar V.VExecutive Director & Executive Director &Chief Executive Officer Chief Financial Officer
Place: Hyderabad DIN:00211921 DIN:0142418010th May 2018
BOARD’S REPORT CONTINUE
Laurus Labs Limited
Annual Report 2017-1842

ANNEXURE - 1
FORM AOC - 1
PART - A: SUBSIDIARIES INFORMATION
S.No. Particulars Details
1 Name of Subsidiary Laurus Synthesis Inc., USA
Sriam Labs Private Limited
Laurus Holdings Ltd (UK)
2 Reporting period for the subsidiary concerned, if different from the holding company's reporting period
April 01, 2017 to March 31, 2018
3 Reporting currency and Exchange rate as on the last date of the relevant Financial year in the case of foreign subsidiaries
US Dollars (in Mn.)
Indian Rupees (in Mn.)
GBP (in Mn.)
4 Share capital 3.00 142.03 0.145 Reserves & Surplus (4.29) (70.70) (0.06)6 Total Assets 1.20 503.52 0.187 Total Liabilities 2.49 432.18 0.108 Investments - - -9 Turnover 2.98 534.37 0.0210 Profit before taxation (0.64) (54.34) (0.06)11 Provision for taxation - 19.26 -12 Profit after taxation (0.64) (73.61) (0.06)13 Proposed Dividend - - -14 % of shareholding 100% 100% 100%
PART - B: ASSOCIATES AND JOINT VENTURES
S.No. Name of Associates/Joint Ventures - NIL March 31, 2018
1 Latest Audited Balance Sheet Date
NIL
2 Shares of Associate/Joint Ventures held by the Company on the year endNo.Amount of Investment in Associates/Joint Venture / ` in MnExtend of Holding %
3 Description of how there is significant influence4 Reason why the associate/joint venture is not consolidated5 Networth attributable to Shareholding as per latest audited Balance Sheet6 Profit/Loss for the year
i. Considered in Consolidationii. Not Considered in Consolidation
43Building Momentum
The Year in Review Statutory Reports Financial Statements

AOC-2
Particulars of contracts/arrangements entered into by the Company with related parties(Pursuant to clause (h) of sub-section (3) of Section 134 of the Companies Act, 2013 and Rule 8(2)
of the Companies (Accounts) Rules, 2014)
(Referred to in sub-section (1) of Section 188 of the Companies Act, 2013 including certain arm’s length transactions under third proviso thereto)
1. Details of contracts or arrangements or transactions not at arm’s length basis: Nil
All contracts/arrangements entered into by the Company with related parties referred to in sub-section (1) of Section 188 of the Companies Act, 2013 are at arm’s length basis.
2. Details of material contracts or arrangement or transactions at arm’s length basis: The details are set out in the standalone financial statements forming part of this Annual Report. The same may be referred for this purpose.
Nature of the related party Nature of relationship Nature of contracts / arrangements / transactions
Duration of the contracts / arrangements / transactions
Salient terms of the contracts or arrangements or transactions including the value, if any
Amount
Appropriate approvals have been taken for related party transactions. No amount was paid as advance.
ANNEXURE - 2
Laurus Labs Limited
Annual Report 2017-1844

ANNEXURE - 3
ToThe Members,M/s. LAURUS LABS LIMITEDPlot No.21, Jawaharlal Nehru Pharma City,Parawada, Visakhapatnam, Andhra Pradesh – 531021.
We have conducted the Secretarial Audit on the compliance of applicable statutory provisions and the adherence to good corporate practices by M/s. Laurus Labs Limited (hereinafter referred as the “Company”). Secretarial Audit was conducted in a manner that provided us a reasonable basis for evaluating the corporate conducts/statutory compliances and expressing our opinion thereon.
Based on our verification of the Company’s books, papers, minute books, forms and returns filed and other records maintained by the Company and also the information provided by the Company, its officers, agents and authorized representatives during the conduct of Secretarial Audit, the explanations and clarifications given to us and the representations made by the Management, we hereby report that in our opinion, the Company has, during the audit period covering the “Financial Year” ended on 31st March, 2018, (i.e. from 1st April, 2017 to 31st March, 2018) complied with the statutory provisions listed hereunder and also that the Company has proper Board processes and compliance-mechanism in place to the extent, in the manner and subject to the reporting made hereinafter:
The Company is carrying on the business of offering broad and integrated portfolio of Active Pharmaceutical Ingredients (API) including intermediates and Contract Research Services to cater to the needs of the global pharmaceutical industry.
We have examined the books, papers, minute books, forms and returns filed and other records maintained by the Company to the applicable extent for the financial year ended on 31st March, 2018 according to the provisions of:
A. The Companies Act, 2013 (the “Act”) and the rules made thereunder;
B. The Securities Contracts (Regulation) Act, 1956 (‘SCRA’) and the rules made thereunder;
C. The Depositories Act, 1996 and the Regulations and Bye-laws framed thereunder;
D. Foreign Exchange Management Act, 1999 and the Rules and Regulations made thereunder to the extent of Foreign Direct Investment, Overseas Direct Investment and External Commercial Borrowings;
Form No. MR-3 SECRETARIAL AUDIT REPORT
For the Financial Year ended 31st March, 2018[Pursuant to Section 204(1) of the Companies Act, 2013 and Rule No.9 of the Companies
(Appointment and Remuneration of Managerial Personnel) Rules, 2014]
E. The following Regulations and Guidelines prescribed under the Securities and Exchange Board of India Act, 1992 (‘SEBI Act’) to the extent applicable to the Company:-
(a) The Securities and Exchange Board of India (Substantial Acquisition of Shares and Takeovers) Regulations, 2011;
(b) The Securities and Exchange Board of India (Prohibition of Insider Trading) Regulations, 2015;
(c) The Securities and Exchange Board of India (Issue of Capital and Disclosure Requirements) Regulations, 2009 and amendments from time to time;
(d) The Securities and Exchange Board of India (Employee Stock Option Scheme and Employee Stock Purchase Scheme) Guidelines, 1999 and The Securities and Exchange Board of India (Share Based Employee Benefits) Regulations, 2014;
(e) The Securities and Exchange Board of India (Issue and Listing of Debt Securities) Regulations, 2008 (Not applicable to the Company during the financial year);
(f) The Securities and Exchange Board of India (Registrars to an Issue and Share Transfer Agents) Regulations, 1993 regarding the Companies Act and dealing with client;
(g) The Securities and Exchange Board of India (Delisting of Equity Shares) Regulations, 2009 (Not applicable to the Company during the financial year);
(h) The Securities and Exchange Board of India (Buyback of Securities) Regulations, 1998 (Not applicable to the Company during the financial year);
F. The Memorandum and Articles of Association.
G. The Company has identified and confirmed the following laws as specifically applicable to the Company.
(a) Drugs (Control) Act, 1950
(b) Drugs and Cosmetics Act, 1940 and the Drugs and Cosmetics Rules, 1945
(c) Narcotic Drugs and Psychotropic Substances Act, 1985
(d) The Food Safety and Standards Act, 2006
(e) The Indian Boilers Act, 1923
45Building Momentum
The Year in Review Statutory Reports Financial Statements

We have also examined compliance with the applicable clauses/regulations of the following:
(i) Secretarial Standards issued by The Institute of Company Secretaries of India (ICSI);
(ii) The Securities and Exchange Board of India (Listing Obligations and Disclosure Requirements) Regulations, 2015 and the Listing Agreements entered into with BSE Limited and National Stock Exchange of India Limited;
During the period under review the Company has complied with the provisions of the Act, Rules, Regulations, Guidelines, Standards, etc. mentioned above.
We further report that, having regard to the compliance system prevailing in the Company and on examination of relevant documents and records in pursuance thereof, on test check basis, the Company has complied with all the applicable laws.
We further report that:The Board of Directors of the Company is duly constituted with proper balance of Executive Directors, Non-Executive Directors and Independent Directors. The changes in the composition of the Board of Directors that took place during the period under review were carried out in compliance with the provisions of the Act/Listing Agreement.
Adequate notice is given to all directors to schedule the board meetings, agenda and detailed notes on agenda were sent in advance as required, and a system exists for seeking and obtaining further information and clarifications on the agenda items before the meeting and for meaningful participation at the meeting.
All the decisions at Board Meetings and Committee Meetings are carried out unanimously as recorded in the minutes of
the meetings of the Board of Directors or Committee of the Board, as the case may be. We further report that there are adequate systems and processes in the Company commensurate with the size and operations of the Company to monitor and ensure compliance with applicable laws, rules, regulations and guidelines.
We further report that during the financial year the Company had following events which had bearing on the Company’s affairs in pursuance of the above referred Laws, Rules, Regulations, Standards etc.,
1. The Company has issued and allotted 2,73,500 equity shares of ` 10/- each at face value to the eligible employees in September, 2017 under ESOP Schemes 2011 & 2016.
2. The Company had incorporated a Wholly Owned Subsidiary (WOS) known as Laurus Holdings Limited in United Kingdom (UK). Through this WOS, the Company got incorporated a step down subsidiary known as Laurus Generics Inc., in United States of America (USA) and we were also informed that the necessary steps have been taken to incorporate another step down subsidiary in Germany known as Laurus Generics GmbH.
For RPR & ASSOCIATESCompany Secretaries
Y Ravi Prasada ReddyPlace: Hyderabad ProprietorDate: 04.05.2018. FCS No. 5783, C P No. 5360.
This Report is to be read with our letter of even date which is annexed as Annexure and forms part of this report.
Laurus Labs Limited
Annual Report 2017-1846

ToThe Members,M/s. LAURUS LABS LIMITEDPlot No.21, Jawaharlal Nehru Pharma City,Parawada, Visakhapatnam, Andhra Pradesh – 531021.
Our report of even date is to be read along with this letter.
1. Maintenance of Secretarial records is the responsibility of the management of the Company. Our responsibility is to express an opinion on these secretarial records based on our audit.
2. We have followed the audit practices and process as were appropriate to obtain reasonable assurance about the correctness of the contents of the Secretarial records. The verification was done on test basis to ensure that correct facts are reflected in Secretarial records. We believe that the process and practices followed by us provide a reasonable basis for our opinion.
3. We have not verified the correctness and appropriateness of financial records and books of accounts of the Company.
ANNEXURE
4. Wherever required, we have obtained the Management representations about the compliance of laws, rules and regulations and happening of events etc.,
5. The Compliance of the provisions of Corporate and other applicable laws, rules, regulations, standards is the responsibility of management. Our examination was limited to the verification of procedure on test basis.
6. The Secretarial Audit report is neither an assurance as to the future viability of the Company nor of the efficacy or effectiveness with which the management has conducted the affairs of the Company.
For RPR & ASSOCIATESCompany Secretaries
Y Ravi Prasada ReddyPlace: Hyderabad ProprietorDate: 04.05.2018. FCS No. 5783, C P No. 5360.
47Building Momentum
The Year in Review Statutory Reports Financial Statements

CORPORATE SOCIAL RESPONSIBILTY POLICY STATEMENT1 A brief outline of the company's CSR policy, including overview of projects or
programs proposed to be undertaken and a reference to the web-link to the CSR policy and projects or programs.
: The scope of the CSR Policy would include all/any activities specified in Schedule VII of the Companies Act, 2013. Web link: www.lauruslabs.com/csr-activities
2 The Composition of the CSR Committee. : As stated in Directors' Report3 Average net profit of the company for last three financial years : 1664.074 Prescribed CSR Expenditure (2% of item 3 above) : 33.285 Details of CSR spent during the financial year. : Detailed below6 Total amount to be spent for the financial year; : 43.987 Amount unspent, if any; : 08 Manner in which the amount spent during the financial year is detailed below.
1 2 3 4 5 6 7 8
CSR project oractivityidentified.
Sector inwhich the Project iscovered
Projects orprograms(1)Local area or other(2) Specify the State and district where projects or programswas undertaken
Amount outlay
(budget) project
orprograms
wise
Amount spent on the
projects orPrograms
Sub-heads:(1)Direct
expenditureon projects or
programs.(2) Overheads:
Cumul-ativeexpenditureupto to the
reporting period
Amount spent: Direct
or through implementing
agency *
1 Stipend for Gitam University Students
Promoting Education Visakhapatnam 16,229,414 16,229,414 Direct
2 Laboratory constructed at Andhra University
Promoting Education Visakhapatnam 6,239,069 6,239,069 Direct
3 Contribution to hospital Promoting Preventive Health Care
Visakhapatnam 4,122,500 4,122,500 Direct
4 Indian School of Business Promoting Education Hyderabad 5,000,000 5,000,000 Direct
5 Contribution for Sports at ZPHS Lankelapalem
Promoting rural and national sports
Visakhapatnam 4,019,003 4,019,003 Direct
6 Contribution to LV Prasad Eye Institute
Promoting Preventive Health Care
Hyderabad 3,333,333 3,333,333 Direct
7 Mobile Van to Akshaya Patra for Food Transport
Eradicating hunger, poverty and malnutrition
Hyderabad 1,326,298 1,326,298 Paid to Trust
8 Stipend for Krishna University Students
Promoting Education Visakhapatnam 1,357,192 1,357,192 Direct
9 Contribution for Science Fair Promoting Education Visakhapatnam 1,193,841 1,193,841 Direct10 Contribution for Mobile Science Lab Promoting Education Visakhapatnam 626,000 626,000 Direct11 Contribution for Girls Children's
EducationPromoting Education Hyderabad 300,000 300,000 Paid to Trust
12 Contribution for School Teacher Salary
Promoting Education Hyderabad 138,500 138,500 Direct
13 Contribution to Devnar foundation for blind
Promoting Preventive Health Care
Hyderabad 50,000 50,000 Paid to Trust
14 Contribution for School Teacher Salary
Promoting Education Visakhapatnam 41,064 41,064 Direct
Total 43,976,214 43,976,214
ANNEXURE - 4
Laurus Labs Limited
Annual Report 2017-1848
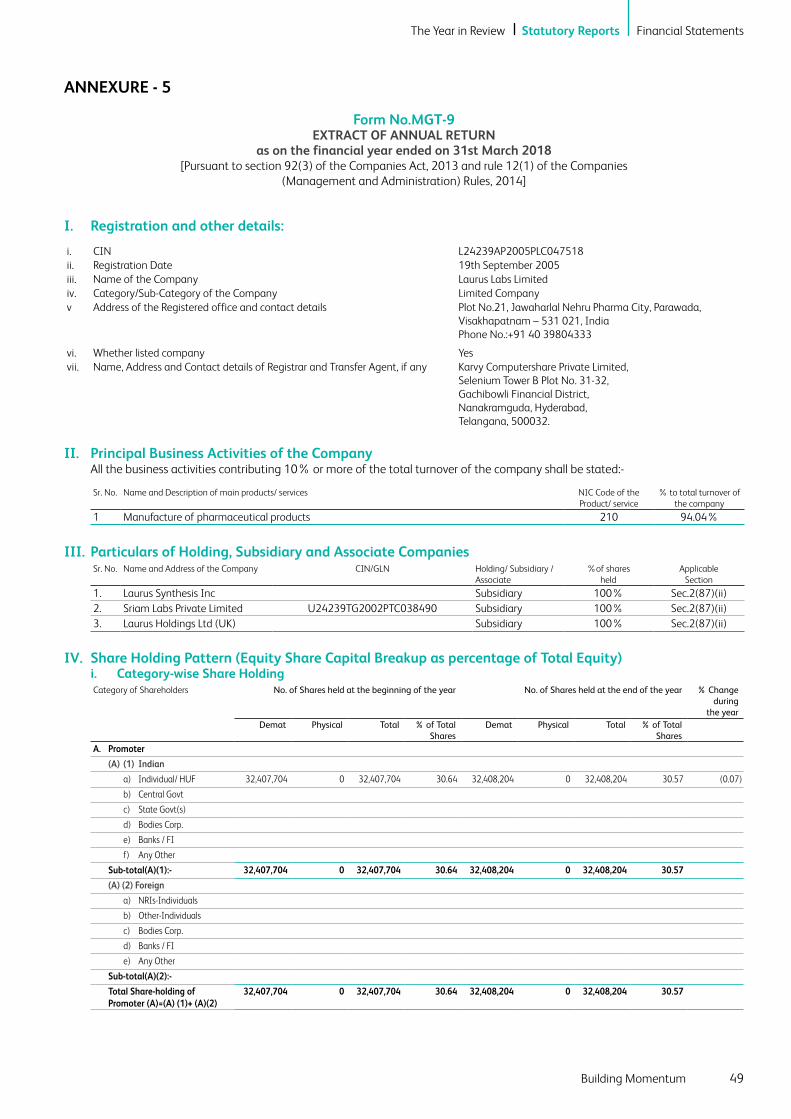
ANNEXURE - 5
I. Registration and other details:
i. CIN L24239AP2005PLC047518ii. Registration Date 19th September 2005iii. Name of the Company Laurus Labs Limitediv. Category/Sub-Category of the Company Limited Companyv Address of the Registered office and contact details Plot No.21, Jawaharlal Nehru Pharma City, Parawada,
Visakhapatnam – 531 021, IndiaPhone No.:+91 40 39804333
vi. Whether listed company Yesvii. Name, Address and Contact details of Registrar and Transfer Agent, if any Karvy Computershare Private Limited,
Selenium Tower B Plot No. 31-32,Gachibowli Financial District,Nanakramguda, Hyderabad,Telangana, 500032.
II. Principal Business Activities of the Company All the business activities contributing 10% or more of the total turnover of the company shall be stated:-
Sr. No. Name and Description of main products/ services NIC Code of the Product/ service
% to total turnover of the company
1 Manufacture of pharmaceutical products 210 94.04%
III. Particulars of Holding, Subsidiary and Associate CompaniesSr. No. Name and Address of the Company CIN/GLN Holding/ Subsidiary /
Associate%of shares
heldApplicable
Section
1. Laurus Synthesis Inc Subsidiary 100% Sec.2(87)(ii)2. Sriam Labs Private Limited U24239TG2002PTC038490 Subsidiary 100% Sec.2(87)(ii)3. Laurus Holdings Ltd (UK) Subsidiary 100% Sec.2(87)(ii)
IV. Share Holding Pattern (Equity Share Capital Breakup as percentage of Total Equity) i. Category-wise Share Holding
Category of Shareholders No. of Shares held at the beginning of the year No. of Shares held at the end of the year % Change during
the yearDemat Physical Total % of Total
SharesDemat Physical Total % of Total
SharesA. Promoter
(A) (1) Indian
a) Individual/ HUF 32,407,704 0 32,407,704 30.64 32,408,204 0 32,408,204 30.57 (0.07)
b) Central Govt
c) State Govt(s)
d) Bodies Corp.
e) Banks / FI
f) Any Other
Sub-total(A)(1):- 32,407,704 0 32,407,704 30.64 32,408,204 0 32,408,204 30.57
(A) (2) Foreign
a) NRIs-Individuals
b) Other-Individuals
c) Bodies Corp.
d) Banks / FI
e) Any Other
Sub-total(A)(2):-
Total Share-holding of Promoter (A)=(A) (1)+ (A)(2)
32,407,704 0 32,407,704 30.64 32,408,204 0 32,408,204 30.57
Form No.MGT-9EXTRACT OF ANNUAL RETURN
as on the financial year ended on 31st March 2018[Pursuant to section 92(3) of the Companies Act, 2013 and rule 12(1) of the Companies
(Management and Administration) Rules, 2014]
49Building Momentum
The Year in Review Statutory Reports Financial Statements

Category of Shareholders No. of Shares held at the beginning of the year No. of Shares held at the end of the year % Change during
the yearDemat Physical Total % of Total
SharesDemat Physical Total % of Total
SharesB. Public Shareholding
(B) (1). Institutions
a) Mutual Funds 11,723,602 0 11,723,602 11.09 8,244,088 0 8,244,088 7.78 (3.31)
b) Banks/FI 239,476 0 239,476 0.23 27,729 0 27,729 0.03 (0.20)
c) Central Govt
d) State Govt(s)
e) Venture Capital Funds
f) Insurance Companies
g) FIIs 33,227,208 0 33,227,208 31.41 33,227,208 0 33,227,208 31.33 (0.08)
h) Foreign Venture Capital Funds
i) Others (specify)
i. Alternate Investment Funds
1,247,228 0 1,247,228 1.18 1,334,511 0 1,334,511 1.26 0.08
ii. Foreign Portfolio Investors 10,355,622 0 10,355,622 9.79 10,784,660 0 10,784,660 10.17 0.38
Sub-total(B)(1) 56,793,136 0 56,793,136 53.70 53,618,196 0 53,618,196 50.57
(B) (2). Non Institutions
a) Bodies Corp.
(i) Indian
(ii) Overseas
b) Individuals
(i) Individual shareholders holding nominal share capital upto ` 1 lakh
5,315,678 798,507 6,114,185 5.78 4,824,238 16,007 4,840,245 4.56 (1.22)
(ii) Individual shareholders holding nominal share capital in excess of ` 1 lakh
4,722,902 920,000 5,642,902 5.33 8,006,725 20,000 8,026,725 7.57 2.24
c) Others(Specify)
i) NR Individual 373,735 0 373,735 0.36 948,404 0 948,404 0.89 0.53
ii) Foreign National 0 80,000 80,000 0.08 80,000 0 80,000 0.07 (0.01)
iii) NBFCs registered with RBI 321,791 0 321,791 0.30 184,691 0 184,691 0.17 (0.13)
iv) Trusts 827,000 0 827,000 0.78 827,000 0 827,000 0.78 0
v) Clearing Members 94,618 0 94,618 0.09 32,267 0 32,267 0.03 (0.06)
vi) Bodies Corporate 2,503,941 0 2,503,941 2.37 4,485,718 0 4,485,718 4.23 1.86
vii) HUF 597,237 0 597,237 0.56 578,299 0 578,299 0.55 (0.01)
Sub-total(B)(2) 14,756,902 1,798,507 16,555,409 15.65 19,967,342 36,007 20,003,349 18.85
Total Public Shareholding (B)=(B)(1)+ (B)(2)
71,550,038 1,798,507 73,348,545 69.36 73,585,538 36,007 73,621,545 69.43
C. Shares held by Custodian for
GDRs &ADRs Grand Total (A+B+C) 103,957,742 1,798,507 105,756,249 100.00 105,993,742 36,007 10,6029,749 100
ANNEXURE - 5 CONTINUE
Laurus Labs Limited
Annual Report 2017-1850

ii. Shareholding of Promoters
Sl. No Shareholder’s Name
Shareholding at the beginning of the year Shareholding at the end of the year
No. of Shares % of total Shares of the
company
%of Shares Pledged /
encumbered to total shares
No. of Shares % of total Shares of the
company
%of Shares Pledged /
encumbered to total shares
% change in shareholding
during the year
1 Dr. Satyanarayana C 16,781,704 15.87 Nil 16,781,704 15.83 Nil (0.04)2 Ms. Naga Rani C 6,240,000 5.90 Nil 6,240,000 5.89 Nil (0.01)3 Dr. Raju S Kalidindi 5,200,000 4.92 Nil 5,200,000 4.90 Nil (0.02)4 Mr. Ravi Kumar V V 1,600,000 1.51 Nil 1,600,000 1.51 Nil 05 Dr. Lakshman Rao C V 2,300,000 2.17 Nil 2,300,000 2.17 Nil 0Promoter Group6 Ms. Kommana Kamala 20,000 0.02 Nil 20,000 0.02 Nil 07 Ms. Vasireddy
Krishnaveni40,000 0.04 Nil 40,000 0.04 Nil 0
8 Ms. Suryadevara Rama 40,000 0.04 Nil 40,000 0.04 Nil 09 Ms. Chintalapati
Jayapadma40,000 0.04 Nil 40,000 0.04 Nil 0
10 Ms. Chintalapati Vijaya Durga
40,000 0.04 Nil 40,000 0.04 Nil 0
11 Mr. S Narasimha Rao 26,000 0.02 Nil 26,500 0.02 Nil 012 Ms. Hymavathi V 40,000 0.04 Nil 40,000 0.04 Nil 013 Mr. Sekhar Babu C 20,000 0.02 Nil 20,000 0.02 Nil 014 Ms. Naga Mani T 20,000 0.02 Nil 20,000 0.02 Nil 0
Total 32,407,704 30.64 32,408,204 30.57
iii. Change in Promoters’ Shareholding (please specify, if there is no change)Sl. No Shareholding at the beginning of
the yearCumulative Shareholding during
the yearNo. of shares % of total shares
of the companyNo. of shares % of total shares
of the company
At the beginning of the year 32,407,704 30.64Date wise Increase / Decrease in Shareholding during the year specifying the reasons for increase / decrease (e.g. allotment / transfer / bonus/ sweat equity etc):Due to Allotment of shares in ESOP, percentage came down to 30.57. 30.57Add: Purchase as per Benpos 24/11/2017 by Mr. Suryadevara Narasimha Rao
500 0.00 32,408,204 30.57
At the End of the year 32,408,204 30.57
iv Shareholding Pattern of top ten Shareholders (other than Directors, Promoters and Holders of GDRs and ADRs):
Sl. No.
Name Shareholding at the beginning of the year
Cumulative Shareholding during the Year
No. of shares % of total shares of the
company
No. of shares % of total shares of the
company
1. Bluewater Investment LtdAt the beginning of the year 20,989,596 19.84Date wise Increase / Decrease in Shareholding during the year specifying the reasons for increase / decrease (e.g. allotment / transfer / bonus/ sweat equity etc):Due to allotment of shares in ESOP, percentage came down to 19.79. 20,989,596 -0.05 20,989,596 19.79At the end of the year 20,989,596 19.79
2. FIL capital Management (Mauritius) LimitedAt the beginning of the year 12,237,612 11.57Date wise Increase / Decrease in Shareholding during the year specifying the reasons for increase / decrease (e.g. allotment / transfer / bonus/ sweat equity etc):Due to allotment of shares in ESOP, percentage came down to 11.54. 12,237,612 -0.03 12,237,612 11.54At the end of the year 12,237,612 11.54
ANNEXURE - 5 CONTINUE
51Building Momentum
The Year in Review Statutory Reports Financial Statements

Sl. No.
Name Shareholding at the beginning of the year
Cumulative Shareholding during the Year
No. of shares % of total shares of the
company
No. of shares % of total shares of the
company
3 SBI Mutual FundAt the beginning of the year 7,427,959 7.02Date wise Increase / Decrease in Shareholding during the year specifying the reasons for increase / decrease (e.g. allotment / transfer / bonus/ sweat equity etc):Less: Sale as per Benpos 07/04/2017 -94,284 -0.09 7,333,675 6.93Less: Sale as per Benpos 14/04/2017 -64,655 -0.06 7,269,020 6.87Less: Sale as per Benpos 21/04/2017 -134,420 -0.12 7,134,600 6.75Less: Sale as per Benpos 05/05/2017 -9,150 -0.01 7,125,450 6.74Less: Sale as per Benpos 12/05/2017 -30,000 -0.03 7,095,450 6.71Less: Sale as per Benpos 26/05/2017 -100,000 -0.1 6,995,450 6.61Less: Sale as per Benpos 02/06/2017 -29,450 -0.02 6,966,000 6.59Less: Sale as per Benpos 16/06/2017 -156,537 -0.15 6,809,463 6.44Less: Sale as per Benpos 23/06/2017 -54,376 -0.05 6,755,087 6.39Less: Sale as per Benpos 30/06/2017 -161,515 -0.16 6,593,572 6.23Less: Sale as per Benpos 07/07/2017 -352,364 -0.33 6,241,208 5.9Less: Sale as per Benpos 14/07/2017 -196,424 -0.18 6,044,784 5.72Less: Sale as per Benpos 21/07/2017 -135,443 -0.13 5,909,341 5.59Less: Sale as per Benpos 28/07/2017 -1,520 0 5,907,821 5.59Less: Sale as per Benpos 11/08/2017 -66,027 -0.07 5,841,794 5.52Less: Sale as per Benpos 18/08/2017 -19,876 -0.01 5,821,918 5.51Less: Sale as per Benpos 25/08/2017 -22,106 -0.03 5,799,812 5.48Less: Sale as per Benpos 01/09/2017 -76,709 -0.07 5,723,103 5.41Add: Purchase as per Benpos 08/09/2017 60,000 0.06 5,783,103 5.47Less: Sale as per Benpos 08/09/2017 -440,013 -0.42 5,343,090 5.05Less: Sale as per Benpos 15/09/2017 -309,093 -0.29 5,033,997 4.76Less: Sale as per Benpos 22/09/2017 -129,669 -0.12 4,904,328 4.64Less: Sale as per Benpos 20/10/2017 -5,776 -0.02 4,898,552 4.62Less: Sale as per Benpos 27/10/2017 -19,257 -0.02 4,879,295 4.6Less: Sale as per Benpos 10/11/2017 -241,732 -0.23 4,637,563 4.37Less: Sale as per Benpos 17/11/2017 -45,269 -0.04 4,592,294 4.33Less: Sale as per Benpos 24/11/2017 -117,564 -0.11 4,474,730 4.22Less: Sale as per Benpos 01/12/2017 -1,173 0 4,473,557 4.22Add: Purchase as per Benpos 08/12/2017 130,204 0.12 4,603,761 4.34Less: Sale as per Benpos 08/12/2017 -3,140 0 4,600,621 4.34Less: Sale as per Benpos 22/12/2017 -39,832 -0.04 4,560,789 4.3Less: Sale as per Benpos 16/02/2018 -100,000 -0.09 4,460,789 4.21Less: Sale as per Benpos 23/03/2018 -20,912 -0.02 4,439,877 4.19At the end of the year 4,439,877 4.19
4 Kotak Mahindra Balance Unit Scheme 99At the beginning of the year 2,561,987 2.42Date wise Increase / Decrease in Shareholding during the year specifying the reasons for increase / decrease (e.g. allotment / transfer / bonus/ sweat equity etc):
1
Add: Purchase as per Benpos 07/04/2017 15,168 0.02 2,577,155 2.44Add: Purchase as per Benpos 14/04/2017 281,832 0.26 2,858,987 2.7Add: Purchase as per Benpos 21/04/2017 2,360 0.01 2,861,347 2.71Add: Purchase as per Benpos 28/04/2017 41,439 0.03 2,902,786 2.74Add: Purchase as per Benpos 05/05/2017 11,443 0.03 2,914,229 2.76Less: Sale as per Benpos 02/06/2017 -10,000 -0.01 2,904,229 2.75Add: Purchase as per Benpos 14/07/2017 20,000 0.02 2,924,229 2.77Add: Purchase as per Benpos 04/08/2017 22,128 0.02 2,946,357 2.79Add: Purchase as per Benpos 11/08/2017 15,642 0.01 2,961,999 2.8Add: Purchase as per Benpos 18/08/2017 30,000 0.03 2,991,999 2.83Add: Purchase as per Benpos 25/08/2017 15,000 0.01 3,006,999 2.84Add: Purchase as per Benpos 01/09/2017 85,781 0.08 3,092,780 2.92Add: Purchase as per Benpos 08/09/2017 5,683 0.01 3,098,463 2.93
ANNEXURE - 5 CONTINUE
Laurus Labs Limited
Annual Report 2017-1852

Sl. No.
Name Shareholding at the beginning of the year
Cumulative Shareholding during the Year
No. of shares % of total shares of the
company
No. of shares % of total shares of the
company
Add: Purchase as per Benpos 15/09/2017 31,628 0.03 3,130,091 2.96Add: Purchase as per Benpos 29/09/2017 24,819 0.02 3,154,910 2.98Add: Purchase as per Benpos 06/10/2017 19,374 0.02 3,174,284 3Less: Sale as per Benpos 06/10/2017 -1,393 0 3,172,891 3Add: Purchase as per Benpos 13/10/2017 6,447 0.01 3,179,338 3.01Less: Sale as per Benpos 17/11/2017 -69,710 -0.08 3,109,628 2.93Add: Purchase as per Benpos 15/12/2017 20,000 0.02 3,129,628 2.95Add: Purchase as per Benpos 05/01/2018 25,000 0.03 3,154,628 2.98Less: Sale as per Benpos 12/01/2018 -2,243 -0.01 3,152,385 2.97Add: Purchase as per Benpos 09/03/2018 9,826 0.01 3,162,211 2.98Less: Sale as per Benpos 23/03/2018 -10,000 -0.01 3,152,211 2.97Add: Purchase as per Benpos 30/03/2018 25,000 0.03 3,177,211 3At the end of the year 3,177,211 3.00
5 Yalavarthy Vijaya LakshmiAt the beginning of the year 2,437,275 2.30Date wise Increase / Decrease in Shareholding during the year specifying the reasons for increase / decrease (e.g. allotment / transfer / bonus/ sweat equity etc):Less: Sale as per Benpos 12/05/2017 -1,221 0 2,436,054 2.3Add: Purchase as per Benpos 23/06/2017 1,100 0 2,437,154 2.3Add: Purchase as per Benpos 30/06/2017 100,000 0.1 2,537,154 2.4Add: Purchase as per Benpos 07/07/2017 125,650 0.12 2,662,804 2.52Add: Purchase as per Benpos 14/07/2017 130,000 0.12 2,792,804 2.64Add: Purchase as per Benpos 21/07/2017 121,309 0.12 2,914,113 2.76Add: Purchase as per Benpos 11/08/2017 200 0 2,914,313 2.76Add: Purchase as per Benpos 09/02/2018 2,000 0 2,916,313 2.76Less: Sale as per Benpos 23/02/2018 -700,000 -0.67 2,216,313 2.09At the end of the year 2,216,313 2.09
6 Nomura India Investment Fund Mother FundAt the beginning of the year 2,018,462 1.91Date wise Increase / Decrease in Shareholding during the year specifying the reasons for increase / decrease (e.g. allotment / transfer / bonus/ sweat equity etc):Add: Purchase as per Benpos 14/04/2017 299,957 0.28 2,318,419 2.19Less: Sale as per Benpos 09/06/2017 -164,968 -0.15 2,153,451 2.04Less: Sale as per Benpos 02/02/2018 -79,443 -0.08 2,074,008 1.96Less: Sale as per Benpos 02/03/2018 -320,000 -0.31 1,754,008 1.65At the end of the year 1,754,008 1.65
7 Goldman Sachs India LimitedAt the beginning of the year 1,432,643 1.35Date wise Increase / Decrease in Shareholding during the year specifying the reasons for increase / decrease (e.g. allotment / transfer / bonus/ sweat equity etc):At the end of the year 1,432,643 1.35
8 The Nomura Trust and Banking Co., Ltd As The Trustee of Nomura India Stock Mother FundAt the beginning of the year 519,983 0.49Date wise Increase / Decrease in Shareholding during the year specifying the reasons for increase / decrease (e.g. allotment / transfer / bonus/ sweat equity etc):Add: Purchase as per Benpos 14/04/2017 313,199 0.30 833,182 0.79Add: Purchase as per Benpos 15/09/2017 300,000 0.28 1,133,182 1.07At the end of the year 1,133,182 1.07
ANNEXURE - 5 CONTINUE
53Building Momentum
The Year in Review Statutory Reports Financial Statements

Sl. No.
Name Shareholding at the beginning of the year
Cumulative Shareholding during the Year
No. of shares % of total shares of the
company
No. of shares % of total shares of the
company
9 Government Pension Fund GlobalAt the beginning of the year 1128003 1.07Date wise Increase / Decrease in Shareholding during the year specifying the reasons for increase / decrease (e.g. allotment / transfer / bonus/ sweat equity etc):Less: Sale as per Benpos 07/04/2017 -33,589 0.04 1,094,414 1.03Less: Sale as per Benpos 14/04/2017 -1,094,414 1.03 0 0.00At the end of the year 0 0
10 Anukar Projects Private LimitedAt the beginning of the year 26,726 0.03Date wise Increase / Decrease in Shareholding during the year specifying the reasons for increase / decrease (e.g. allotment / transfer / bonus/ sweat equity etc):Add: Purchase as per Benpos 12/05/2017 10,000 0.01 36,726 0.04Add: Purchase as per Benpos 19/05/2017 700 0 37,426 0.04Add: Purchase as per Benpos 02/06/2017 180,291 0.17 217,717 0.21Add: Purchase as per Benpos 30/06/2017 5,000 0 222,717 0.21Add: Purchase as per Benpos 21/07/2017 25,000 0.02 247,717 0.23Add: Purchase as per Benpos 28/07/2017 111,991 0.11 359,708 0.34Add: Purchase as per Benpos 15/12/2017 60,086 0.06 419,794 0.4Less: Sale as per Benpos 15/12/2017 -30,086 -0.03 389,708 0.37Add: Purchase as per Benpos 23/02/2018 700,000 -0.66 1,089,708 1.03At the end of the year 1,089,708 1.03
11 Morgan Stanley Investment Funds Indian Equity FundAt the beginning of the year 0 0Date wise Increase / Decrease in Shareholding during the year specifying the reasons for increase / decrease (e.g. allotment / transfer / bonus/ sweat equity etc):Add: Purchase as per Benpos 02/06/2017 29,240 0.03 29,240 0.03Add: Purchase as per Benpos 30/06/2017 1,063,543 1.00 1,092,783 1.03Less: Sale as per Benpos 23/02/2018 -100,000 992,783 0.94At the end of the year 992,783 0.94
12 Canara HSBC Oriental Bank of Commerce Life InsuranceAt the beginning of the year 962,164 0.91Date wise Increase / Decrease in Shareholding during the year specifying the reasons for increase / decrease (e.g. allotment / transfer / bonus/ sweat equity etc):Less: Sale as per Benpos 07/04/2017 -1,458 0 960,706 0.91Add: Purchase as per Benpos 14/04/2017 1,739 0 962,445 0.91Less: Sale as per Benpos 21/04/2017 -7,269 -0.01 955,176 0.9Add: Purchase as per Benpos 28/04/2017 199 0 955,375 0.9Less: Sale as per Benpos 05/05/2017 -10,180 -0.01 945,195 0.89Less: Sale as per Benpos 12/05/2017 -11,041 -0.01 934,154 0.88Less: Sale as per Benpos 19/05/2017 -939 -0.01 933,215 0.88Less: Sale as per Benpos 26/05/2017 -8,400 -0.01 924,815 0.87Less: Sale as per Benpos 02/06/2017 -1,705 0 923,110 0.87Less: Sale as per Benpos 09/06/2017 -1,162 0 921,948 0.87Less: Sale as per Benpos 16/06/2017 -923 0 921,025 0.87Less: Sale as per Benpos 23/06/2017 -2,307 0 918,718 0.87Less: Sale as per Benpos 30/06/2017 -1,323 0 917,395 0.87Less: Sale as per Benpos 07/07/2017 -5,651 -0.01 911,744 0.86Less: Sale as per Benpos 14/07/2017 -1,589 0 910,155 0.86Less: Sale as per Benpos 21/07/2017 -2,882 0 907,273 0.86
ANNEXURE - 5 CONTINUE
Laurus Labs Limited
Annual Report 2017-1854

Sl. No.
Name Shareholding at the beginning of the year
Cumulative Shareholding during the Year
No. of shares % of total shares of the
company
No. of shares % of total shares of the
company
Less: Sale as per Benpos 28/07/2017 -1,891 0 905,382 0.86Less: Sale as per Benpos 04/08/2017 -7,402 -0.01 897,980 0.85Less: Sale as per Benpos 11/08/2017 -6,183 0.01 891,797 0.84Add: Purchase as per Benpos 18/08/2017 361 0 892,158 0.84Add: Purchase as per Benpos 25/08/2017 285 0 892,443 0.84Less: Sale as per Benpos 01/09/2017 -7,455 -0.01 884,988 0.83Less: Sale as per Benpos 08/09/2017 -3,336 0 881,652 0.83Less: Sale as per Benpos 15/09/2017 -10,589 -0.01 871,063 0.82Less: Sale as per Benpos 22/09/2017 -10,287 -0.01 860,776 0.81Less: Sale as per Benpos 29/09/2017 -4,759 0 856,017 0.81Less: Sale as per Benpos 06/10/2017 -11,881 -0.01 844,136 0.8Less: Sale as per Benpos 13/10/2017 -2,478 0 841,658 0.8Less: Sale as per Benpos 20/10/2017 -3,677 -0.01 837,981 0.79Less: Sale as per Benpos 27/10/2017 -3,105 0 834,876 0.79Less: Sale as per Benpos 31/10/2017 -7,474 -0.01 827,402 0.78Less: Sale as per Benpos 03/11/2017 -1,413 0 825,989 0.78Less: Sale as per Benpos 10/11/2017 -1,599 0 824,390 0.78Less: Sale as per Benpos 17/11/2017 -6,192 -0.01 818,198 0.77Less: Sale as per Benpos 24/11/2017 -1,624 0 816,574 0.77Add: Purchase as per Benpos 01/12/2017 181,265 0.17 997,839 0.94Less: Sale as per Benpos 08/12/2017 -3,811 0 994,028 0.94Less: Sale as per Benpos 15/12/2017 -11,173 -0.01 982,855 0.93Less: Sale as per Benpos 22/12/2017 -877 0 981,978 0.93Less: Sale as per Benpos 29/12/2017 -9,562 -0.01 972,416 0.92Less: Sale as per Benpos 05/01/2018 -7,513 -0.01 964,903 0.91Less: Sale as per Benpos 12/01/2018 -1,437 0 963,466 0.91Less: Sale as per Benpos 19/01/2018 -2,668 0 960,798 0.91Add: Purchase as per Benpos 26/01/2018 891 0 961,689 0.91Add: Purchase as per Benpos 02/02/2018 2,537 0 964,226 0.91Less: Sale as per Benpos 09/02/2018 -9,875 -0.01 954,351 0.9Less: Sale as per Benpos 16/02/2018 -2,101 0 952,250 0.9Add: Purchase as per Benpos 23/02/2018 810 0 953,060 0.9Add: Purchase as per Benpos 02/03/2018 1,491 0 954,551 0.9Add: Purchase as per Benpos 09/03/2018 657 0 955,208 0.9Add: Purchase as per Benpos 16/03/2018 72 0 955,280 0.9Less: Sale as per Benpos 23/03/2018 -1482 0 953,798 0.9Less: Sale as per Benpos 30/03/2018 -4205 0 949,593 0.9At the end of the year 949,593 0.90
13 DSP Blackrock AIF Pharma FundAt the beginning of the year 745,727 0.70Date wise Increase / Decrease in Shareholding during the year specifying the reasons for increase / decrease (e.g. allotment / transfer / bonus/ sweat equity etc):Add: Purchase as per Benpos 08/12/2017 40,239 0.04 785,966 0.74Add: Purchase as per Benpos 02/02/2018 19,710 0.01 805,676 0.75Add: Purchase as per Benpos 09/02/2018 27,334 0.03 833,010 0.78At the end of the year 833,010 0.78
ANNEXURE - 5 CONTINUE
55Building Momentum
The Year in Review Statutory Reports Financial Statements

v. Shareholding of Directors and Key Managerial PersonnelSl No.
For Each of the Directorsand KMP
Shareholding at the beginning of the year
Cumulative Shareholding during the year
No. of shares % of totalshares of the
company
No. of shares % of total shares of the
company
1 Dr. C SatyanarayanaAt the beginning of the year 16,781,704 15.86Date wise Increase / Decrease in Shareholding during the year specifying the reasons for increase / decrease (e.g. allotment / transfer / bonus/ sweat equity etc):Due to allotment of further shares in ESOP scheme, the percentage came down to 15.83.
15.83
At the end of the year 16,781,704 15.832 Dr. Srihari Raju Kalidindi
At the beginning of the year 5,200,000 4.91Date wise Increase / Decrease in Shareholding during the year specifying the reasons for increase / decrease (e.g. allotment / transfer / bonus/ sweat equity etc):Due to allotment of further shares in ESOP scheme, the percentage came down to 4.90.
4.90
At the end of the year 5,200,000 4.903 Mr. V V Ravi Kumar
At the beginning of the year 1,600,000 1.51Date wise Increase / Decrease in Shareholding during the year specifying the reasons for increase / decrease (e.g. allotment / transfer / bonus/ sweat equity etc):At the end of the year 1,600,000 1.51
4 Dr. C V Lakshmana RaoAt the beginning of the year 2,300,000 2.17Date wise Increase / Decrease in Shareholding during the year specifying the reasons for increase / decrease (e.g. allotment / transfer / bonus/ sweat equity etc):At the end of the year 2,300,000 2.17
5 Mr. G. Venkateswar ReddyAt the beginning of the year 428 0.00Date wise Increase / Decrease in Shareholding during the year specifying the reasons for increase / decrease (e.g. allotment / transfer / bonus/ sweat equity etc):Add: Purchase as per Benpos 08/09/2017. 72 0.00 500 0.00Add: ESOP Allotment on 21/09/2017. 2000 0.00 2500 0.00At the end of the year 2500 0.00
ANNEXURE - 5 CONTINUE
Laurus Labs Limited
Annual Report 2017-1856

V. Indebtedness Indebtedness of the Company including interest outstanding/accrued but not due for payment
` in MillionsSecured Loans
excluding depositsUnsecured
LoansDeposits Total
Indebtedness
Indebtedness at the beginning of the financial yeari) Principal Amount 7,813.17 - - 7,813.17ii) Interest due but not paid - - - -iii) Interest accrued but not due 26.83 - - 26.83Total (i+ii+iii) 7,840.00 - - 7,840.00Business combination adjustment 262.10 - - 262.10Adjusted Total 8,102.10 - - 8,102.10Change in Indebtedness during the financial year- Addition 2,179.19 - - 2,179.19- Reduction (780.27) - - (780.27)Net ChangeIndebtedness at the end of the financial yeari) Principal Amount 9,474.47 - - 9,474.47ii) Interest due but not paid - - - -iii) Interest accrued but not due 26.55 - - 26.55Total (i+ii+iii) 9,501.02 - - 9,501.02
VI. Remuneration of directors and key managerial personnel A. Remuneration to Managing Director, Whole-time Directors and/or Manager
Sl. No.
Particulars of Remuneration Name of MD/WTD/ Manager TotalAmountWhole-time Directors
Dr. Satyanarayana C
Dr. Srihari Raju Kalidindi
Ravi Kumar V.V.
Chandrakanth. Ch Dr. C V Lakshmana
Rao1. Gross salary
(a) Salary as per provisions contained in section17(1) of the Income-tax Act, 1961
124,553,516 29,446,741 27,686,191 12,773,653 557,111 195,017,212
(b) Value of perquisites u/s 17(2)Income-tax Act, 1961
(c) Profits in lieu of salary under section17(3)Income- tax Act,1961
2. Stock Option3. Sweat Equity4. Commission
- as % of profit- others, specify..
5. Others6. Total(A) 124,553,516 29,446,741 27,686,191 12,773,653 557,111 195,017,212
Ceiling as per the Act 268,804,017
ANNEXURE - 5 CONTINUE
57Building Momentum
The Year in Review Statutory Reports Financial Statements

B. Remuneration to other directors:Sl. No. Particulars of Remuneration Name of Directors Total Amount
Dr. MVG Rao
Amal Ganguli
Aruna Rajendra
Bhinge
Rajesh Koshy
Chandy
Ramesh Subrahmanian
Dr. K. Ravindranath
Independent Directors Fee for attending board
committee meetings450,000 - 701,000 500,227 700,000 200,000 2,551,227
Commission Others: Director’s
Remuneration1,743,148 369,581 2,002,504 2,589,914 2,874,086 1,743,149 11,322,382
Total(1) 2,193,148 369,581 2,703,504 3,090,141 3,574,086 1,943,149 13,873,609Other Non-Executive Directors
Fee for attending board committee meetings
- - - - - - -
Commission Others: Director’s
RemunerationTotal(2) - - - - - - -Total(B)=(1+2) 2,193,148 369,581 2,703,504 3,090,141 3,574,086 1,943,149 13,873,609Total Managerial Remuneration (A+B)
208,890,821
Overall Ceiling as per the Act 295,684,418
C. Remuneration to Key Managerial Personnel Other Than MD/Manager/WTDSl. no. Particulars of Remuneration Key Managerial
Personnel
Company Secretary 1. Gross salary
(a) Salary as per provisions contained in section17(1) of the Income-tax Act, 1961 5,463,880(b) Value of perquisites u/s 17(2) Income-tax Act, 1961(c) Profits in lieu of salary under section 17(3) Income-tax Act, 1961
2. Stock Option3. Sweat Equity4. Commission
- as % of profit- others, specify
5. Others6. Total 5,463,880
VII. Penalties / Punishment / Compounding of offences:Type Section of the
companies ActBrief description Details of Penalty/
Punishment/Compounding fees
imposed
Authority[RD /NCLT/Court]
Appeal made. If any (give details)
A. Company
Nil
Penalty Punishment CompoundingB. Directors Penalty Punishment CompoundingC. Other Officers In Default Penalty Punishment Compounding
ANNEXURE - 5 CONTINUE
Laurus Labs Limited
Annual Report 2017-1858

ANNEXURE - 6Em
ploy
ee W
orke
d fo
r ful
l Fin
anci
al y
ear &
Rec
eive
d A
ggre
gate
Rem
uner
atio
n of
not
Les
s Th
an O
ne H
undr
ed A
nd T
wo
Lakh
Rup
ees
/ Top
Ten
Em
ploy
ees
(Inc
ludi
ng E
mpl
oyer
Co
ntrib
utio
n to
PF)
S.N
o.N
ame
of th
e Em
ploy
eeD
esig
nati
onRe
mun
erat
ion
rece
ived
(C
TC in
`)
FY 2
017-
18
Nat
ure
Cont
ract
/ Pe
rman
ent
Qua
lific
atio
n &
Ex
perie
nce
in
year
s
Dat
e of
co
mm
ence
men
t of
em
ploy
men
t
Age
of
empl
oyee
Last
Em
ploy
men
t he
ld b
efor
e jo
inin
g th
e Co
mpa
ny
No.
of
Equi
ty
shar
es
held
Whe
ther
rela
tive
of
Dire
ctor
1Sa
tyan
aray
ana
Cha
vaEx
ecut
ive
Dire
ctor
&
Chi
ef E
xecu
tive
Off
icer
1245
5351
6Pe
rman
ent
M.s
c., P
h.D
; 32
21-0
1-20
0655
Mat
rix L
abor
ator
ies
Ltd
1678
1704
Yes
2Ra
vi K
umar
Van
tara
m
Venk
ata
Exec
utiv
e D
irect
or
& C
hief
Fin
anci
al
Off
icer
2768
6191
Perm
anen
tM
.Com
, FC
MA
; 29
30-1
1-20
0653
Mat
rix L
abor
ator
ies
Ltd
1600
000
No
3M
arty
n pe
ckSr
. Vic
e Pr
esid
ent
1737
5902
Perm
anen
tB.
Sc; 2
818
-08-
2008
49M
ayne
Pha
rma,
Aus
tral
ia80
000
No
4C
hand
raka
nth
Ch
Exec
utiv
e D
irect
or12
7736
53Pe
rman
ent
M.T
ech,
MS,
PG
PM; 9
10-0
2-20
1235
Mc
Kins
ey0
Yes
5Sr
iniv
asa
Rao
SEx
ecut
ive
Vic
e Pr
esid
ent
1205
5393
Perm
anen
tM
.Sc;
23
02-0
4-20
0850
Mat
rix L
abor
ator
ies
Ltd
1266
80N
o
6Sr
eeni
vasa
Rao
DV
ice
Pres
iden
t12
0357
76Pe
rman
ent
M.S
c; P
h.d;
2704
-05-
2013
56Vi
zipha
r Bio
scie
nces
Pvt
Ltd
2399
3N
o
7Ve
nkat
a La
kshm
ana
Rao
CEx
ecut
ive
Dire
ctor
1143
0990
Perm
anen
tM
.sc.
, Ph.
D; 3
007
-02-
2007
56M
ayne
Pha
rma,
Aus
tral
ia23
0000
0N
o
8Pr
aful
la K
umar
Nan
diSr
. Vic
e Pr
esid
ent
1093
9466
Perm
anen
tPh
.D; 2
311
-07-
2016
49A
pote
x In
dia
3988
No
9U
ma
Mah
esw
er R
ao
Vasi
redd
iEx
ecut
ive
Vic
e Pr
esid
ent
1080
9097
Perm
anen
tM
.sc.
, Ph.
D; 2
609
-06-
2016
57Sr
iam
Lab
s Pv
t Ltd
5394
No
10A
njan
eyul
u G
SREx
ecut
ive
Vic
e Pr
esid
ent
9435
031
Perm
anen
tM
.sc.
, Ph.
D; 3
305
-02-
2007
57M
atrix
Lab
orat
orie
s Lt
d26
1383
No
Empl
oyee
Wor
ked
Part
of t
he F
inan
cial
yea
r & R
ecei
ved
Agg
rega
te R
emun
erat
ion
of n
ot L
ess
Than
Eig
ht L
akh
Fift
y Th
ousa
nd R
upee
s Pe
r Mon
th (I
nclu
ding
Em
ploy
er C
ontr
ibut
ion
to P
F)
S.N
o.N
ame
of th
e Em
ploy
eeD
esig
nati
onRe
mun
erat
ion
rece
ived
(C
TC in
`)
FY 2
017-
18
Nat
ure
Cont
ract
/ Pe
rman
ent
Qua
lific
atio
n &
Ex
perie
nce
in
yea
rs
Dat
e of
co
mm
ence
men
t of
em
ploy
men
t
Dat
e of
exi
t of
em
ploy
men
tA
ge o
f em
ploy
eeLa
st E
mpl
oym
ent
held
bef
ore
join
ing
the
Com
pany
No.
of
Equi
tysh
ares
held
Whe
ther
rela
tive
of
Dire
ctor
1Ra
ju S
Kal
idin
diW
hole
-tim
e D
irect
or29
4467
41Pe
rman
ent
M.s
c., P
h.D
; 32
03-0
4-20
0608
-03-
2018
55M
ayne
Pha
rma,
A
ustr
alia
5200
000
No
59Building Momentum
The Year in Review Statutory Reports Financial Statements

Information pursuant to Section 197(12) of the Companies Act, 2013 read with Rule 5(1) of the Companies (Appointment and Remuneration of Managerial Personnel) Rules, 2014
1 The ratio of remuneration of each director to the median remuneration of the employees of the Company for the financial year:Sl. No. Name & Designation Ratio
1 Mr. Amal Ganguli, Chairman & Independent Director (deceased on May 7, 2017) 1
2 Dr. Satyanarayana, Whole-time Director & CEO 333
3 Dr. Raju Srihari Kalidindi, Whole-time Director (upto March 08, 2018) 79
4 Mr. VV Ravi Kumar, Whole-time Director & CFO 74
5 Mr. Chandrakanth Chereddi, Whole-time Director 34
6 Dr. Ravindranath K, Independent Director (effective from May 18, 2017) 5
7 Mrs. Aruna Bhinge, Independent Director 7
8 Dr. Rajesh Koshy Chandy, Independent Director 8
9 Mr. Ramesh Subrahmanian, Independent Director 10
10 Dr. M.Venu Gopala Rao, Chairman & Independent Director (effective from May 18, 2017) 6
11 Dr. Venkata Lakshmana Rao C, Whole-time Director (effective from March 08, 2018) 31
2 The percentage increase in remuneration of each Director, Chief Financial Officer; Chief Executive Officer, Company Secretary or Manager, if any, in the financial year:Sl. No. Name & Designation
Increase in percentage
1 Mr. Amal Ganguli, Chairman & Independent Director (deceased on May 7, 2017) -90%
2 Dr. Satyanarayana, Whole-time Director & CEO 29%
3 Dr. Raju Srihari Kalidindi, Whole-time Director (upto March 08, 2018) 15%
4 Mr. VV Ravi Kumar, Whole-time Director & CFO 6%
5 Mr. Chandrakanth Chereddi, Whole-time Director 64%
6 Mrs. Aruna Bhinge, Independent Director 21%
7 Dr. Rajesh Koshy Chandy, Independent Director 46%
8 Mr. Ramesh Subrahmanian, Independent Director 88%
9 Dr. Ravindranath K, Independent Director (effective from May 18, 2017) NA
10 Dr. M.Venu Gopala Rao, Chairman & Independent Director (effective from May 18, 2017) NA
11 Dr. Venkata Lakshmana Rao C, Whole-time Director (effective from March 08, 2018) NA
12 Mr. G.Venkateswar Reddy, Sr. General Manager (Legal & Secretarial) and Company Secretary 40%
3 The percentage increase in the median remuneration of employees in the financial year was 5%
4 The number of permanent employees on the rolls of the Company as on March 31, 2017 was 3,224
5 Average increment of other than the managerial personnel 13.12%
Affirmation
We hereby affirm that the above remuneration is as per the Remuneration Policy of the Company.
Laurus Labs Limited
Annual Report 2017-1860

ANNEXURE - 7
Details of Employees Stock Option SchemePursuant to Rule 12(9) of Companies (Share Capital and Debentures) Rules, 2014
The details of Stock Options as on March 31, 2018 under the Employees Stock Option Scheme-2011 of the Company are as under:
S.No. Particulars Grant-1 Grant-2 Grant-3 Grant-4 Grant-5 Total
a Options grantedOptions granted initially 553,000 28,000 38,500 75,500 185,438 880,438*Additional Options granted pursuant to Bonus issue 0 30,000 57,375 162,000 538,314 787,689Total Options granted 553,000 58,000 95,875 237,500 723,752 1,668,127*
b Options vested 505,250 51,750 86,125 103,000 170,500 916,625c Options exercised 505,250 51,750 86,125 103,000 170,500 916,625d The total no. of shares arising as a result of exercise
of options505,250 51,750 86,125 103,000 170,500 916,625
e Options lapsed 47,750 6,250 9,750 37,500 49,252 150,502f The Exercise Price (`) 10 10 10 10 10 10g Variations of terms of Options Nil Nil Nil Nil Nil Nilh Money realized by exercise of options 5,052,500 517,500 861,250 1,030,000 1,705,000 9,166,250i Total number of options in force 0 0 0 97,000 504,000 601,000
* including re-issue of lapsed options
j. Employee-wise details of options granted to –
(i) Key Managerial Personnel: Nil
(ii) Any other employee who receives a grant of options in any one year of option amounting to five percent or more of options granted during that year: Nil
(iii) Identified employees who were granted option, during any one year, equal to or exceeding one percent of the issued capital (excluding outstanding warrants and conversions) of the company at the time of grant: Nil
The details of Stock Options as on March 31, 2018 under the Employees Stock Option Scheme-2016 of the Company are as under:
S.No. Particulars Grant-1 Total
a Options grantedOptions granted initially 178,438 178,438Additional options granted pursuant to Bonus Issue 515,814 515,814Total Options granted 694,252 694,252
b Options vested 2,000 2,000c Options exercised 2,000 2,000d The total no. of shares arising as a result of exercise of options 2,000 2,000e Options lapsed 50,252 50,252f The Exercise Price (`) 550 550g Variations of terms of Options Nil Nilh Money realized by exercise of options 20,000 20,000i Total number of options in force 642,000 642,000
j. Employee-wise details of options granted to –
(i) Key Managerial Personnel : Nil
(ii) Any other employee who receives a grant of options in any one year of option amounting to five percent or more of options granted during that year: Nil
(iii) Identified employees who were granted option, during any one year, equal to or exceeding one percent of the issued capital (excluding outstanding warrants and conversions) of the company at the time of grant: Nil
61Building Momentum
The Year in Review Statutory Reports Financial Statements

ANNEXURE - 8
Conservation of Energy, Technology Absorption, Adaptation and Innovation(A) Conservation of energy:
(i) The steps taken or impact on conservation of energy
ITFE, CPA recovery processes were remodelled to increase recovery and reduce utilities & energy consumption. This contributed an annual energy conservation of ` 20 lacs/annum.
(ii) The steps taken by the Company for utilizing alternate sources of energy
To reduce power bill, we are purchasing open access power through bidding process.In order to reduce carbon foot print we are utilizing by-product steam generated from neighbor company M/s Kanoria Chemicals Private Limited.
(iii) The capital investment on energy conservation equipment
No significant capital investments on energy conservation equipment during the year.
(B) Technology Absorption:
(i) The efforts made towards technology absorption No major technology absorption form external sources during the year however there have been various internal technologies developed and used.
(ii) The benefits derived like product improvement, cost reduction, product development or import substitution
Various innovations had lead to increase in productivity and reduction of quality failures.
(iii) In case of imported technology (imported during the last three years reckoned from the beginning of the financial year)
No import of technology.
(a) The details of technology imported -(b) The year of import -(c) Whether the technology has been absorbed -(d) If not fully absorbed, areas where absorption has not
taken place, and the reasons thereof; -
(iv) The expenditure incurred on Research and Development ` 74 Mn (Capex) and ` 1,122 Mn (Recurring) Total = ` 1,196 Mn
(C) Foreign Exchange Earnings and Outgo: Total Forex Inflow ` 20,393 Mn
Total Forex Outflow ` 8,723 Mn
Laurus Labs Limited
Annual Report 2017-1862

REPORT ON CORPORATE GOVERNANCE
1. Company’s Philosophy: Laurus Labs works towards improving health outcomes for patients around the world through the manufacture of high-quality
medicines and active pharmaceutical ingredients. Our Corporate Governance policies and procedures set the standard for how we engage with our stakeholders. We prioritize the long-term over the short-term to drive sustainable growth and create lasting value. With empowerment and accountability as its two pillars, our Corporate Governance code guides all our actions. We aim for total transparency and meet our societal commitments by being a responsible corporate citizen.
2. Board and Its Composition: Your Board comprises optimal combination of Independent as well as Non-executive Directors having in-depth knowledge of the
business of the industry. The size and composition of the Board conforms to the requirements of the Corporate Governance code under SEBI (Listing Obligations and Disclosure Requirements) Regulations, 2015.
The composition of directors, their attendance and other details are as follows:
Sl No.
Name of the Director & DIN Category of DirectorshipAttendance at Board Meetings
No of Directorship in listed entities including this listed entity (ReferRegulation 25(1) of Listing Regulations)
Number of memberships / chairmanship in Audit / Stakeholder Committee(s) including this listed entity (Refer Regulation 26(1) ofListing Regulations)
Whether present at the previous AGM
Held Attended Chairman Member
1. Mr. Amal GanguliDIN: 00013808(passed away on 08th May, 2017)
Chairman, Non-Executive andIndependent Director
1 0 0 0 0 Not Applicable
2. Dr. Malempati Venugopala RaoDIN: 00012704(Appointed on 18th May, 2017
Chairman, Non-Executive andIndependent Director
7 6 2 0 2 Yes
3. Dr. Chava SatyanarayanaDIN: 00211921
Promoter, Executive Director and Chief Executive Officer
9 9 1 0 0 Yes
4. Dr. Kalidindi Srihari Raju DIN: 00982034(Resigned on 8th March, 2018)
Promoter and Executive Director
8 7 1 0 0 Yes
5. Mr. Venkata Ravi Kumar VantaramDIN: 01424180
Promoter, Executive Director and Chief Financial Officer
9 9 1 0 1 Yes
6. Mr. Chereddi ChandrakanthDIN: 06838798
Executive Director 9 9 1 0 1 No
7. Mr. Rajesh Kumar DugarDIN: 00307729(Resigned on 23rd November, 2017)
Non-Executive andNominee Director
6 5 1 0 0 No
8. Mr. Narendra OstawalDIN: 06530414
Non-Executive andNominee Director
9 5 3 1 3 No
9. Mrs. Aruna Rajendra BhingeDIN: 07474950
Non-Executive andIndependent Director
9 9 1 0 1 No
10. Dr. Rajesh Koshy ChandyDIN: 07575240
Non-Executive andIndependent Director
9 8 1 0 0 No
11. Mr. Ramesh SubrahmanianDIN: 02933019
Non-Executive andIndependent Director
9 9 1 1 0 Yes
12. Dr. Ravindranath KancherlaDIN: 00117940(Appointed on 18th May, 2017)
Non-Executive andIndependent Director
7 4 1 0 0 No
13. Dr. Chunduru Venkata Lakshmana Rao DIN: 06885453(appointed on 8th March, 2018)
Promoter and Executive Director
0 0 1 0 0 Not Applicable
63Building Momentum
The Year in Review Statutory Reports Financial Statements

Disclosure of relationships between directors inter-se:Mr. Chandrakanth Chereddi is son-in-law of Dr.Satyanarayana Chava. Other than these two directors, none of the directors are related to any other director.
Details about familiarization programme:During the year, the Company has inducted one executive director and two independent directors on the Board. The new executive director has been associated with the Company for more than a decade and heads Quality function. The Company has arranged a special induction/familiarization program to the new independent directors wherein the two directors have made visit to Corporate Office and R&D Plant at Hyderabad, its manufacturing facilities at Visakhapatnam and interacted with all senior colleagues including the whole time directors of the Company. During March 2018 also once again the Board meeting was conducted in Visakhapatnam and the Directors have visited the manufacturing facilities of the Company. At the time of appointment, the CEO and some other Board members have interacted with these new independent directors and explained the objective and philosophy and core values of the Company. The Company has provided all the literature such as its previous annual reports, presentation on operations, budget vs. achievements etc. The new independent directors have been provided with the letters of appointments wherein their duties, roles and expectations of the Company etc. have been clearly specified.
Apart from the above, senior management personnel of the Company regularly make presentations to the Board members on the operations of the Company, its plans, strategy, risks involved, new initiatives etc. and seek their views and suggestions on the same. The Board members have been provided with various policies of the Company including Code of Conduct for Directors and Senior Management Personnel etc.
The details of these familiarization programs have been placed on the Company’s website at
http://www.lauruslabs.com/sites/all/themes/lauruslab//Investors/PDF/Policies/Familirization_Programmes_for_Independent_Directors.pdf
No. of shares held by non-executive directors:
Except Mrs. Aruna Rajendra Bhinge, who is holding 1,500 equity shares as on March 31, 2018, none of the Non-Executive Directors are holding any shares or convertible Instruments in the Company.
Details of Directors proposed for re-appointment and regularisation at the Annual General Meeting:Dr.Satyanarayana Chava and Mr.V V Ravi Kumar shall retire by rotation and being eligible, seek re-appointment.
Dr.Chunduru Venkata Lakshmana Rao who has been appointed as additional director seeks regularization as director of the Company. Further, a proposal is being placed before the members to appoint Dr.Lakshamana Rao as Executive Director of the Company.
The details of these directors are as follows:Dr. Satyanarayana ChavaDr. Satyanarayana Chava is an Executive, whole time Director and the Chief Executive Officer of our Company. He has been a Director of our Company since January 21, 2006. He holds a bachelors and masters degree in Science from Andhra University. He was also a research scholar at the College of Science and Technology, Andhra University from 1985 to 1992 and went on to obtain his Ph.D in the year 1992. He has received a honorary degree of Doctor of Science from the Gandhi Institute of Technology and Management. He also holds a post graduate diploma in quality management from the Worldwide Quality Certification and has completed the post graduate programme in management for senior executives from the Indian School of Business. He was featured on the cover page of September 2015 issue of Forbes India and your Company was recognized as one of the 13 hidden gems of India in that issue. During the last 23 years he has worked in various pharmaceutical companies including Ranbaxy Laboratories Limited, Vera Laboratories Limited and Vorin Laboratories Limited, especially under the domains of research and development. He was also the Chief Operating Officer at Matrix Laboratories Limited, Hyderabad. He has been determined as inventor in 103 patents or patent applications filed across the world.
Directorships in other Companies:
Sl. No.Name of the Companies/Bodies Corporate / Firms / Association of Individuals
Nature of Interest or Concern / change in Interest or Concern
Date on which interest or Concern arose / changed
1. Laurus Infosystems (India) Private Limited Director January 10, 20142. Laurus Labs Limited Whole-time Director January 21, 20063. Laurus Holdings Ltd Director July 10, 20174. Laurus Generics Inc., Director August 07, 20175. NSN Investments Managing Partner August 17, 2017
Committee Membership Details:
Sl. No. Name of the Company Name of the Committee Whether Chairman / Member
1. Laurus Labs Limited Risk Management Committee Chairman
Laurus Labs Limited
Annual Report 2017-1864

Mr. V V Ravi KumarMr. V V Ravi Kumar is an Executive, whole time Director and Chief Financial Officer of our Company. He has been a Director of our Company since November 30, 2006 and is in-charge of finance, human resources functions of the company, he has also handled the supply chain management department of our company for a significant time. He holds a bachelors and masters degree in Commerce from Andhra University. He is a member of the ICWAI. He has over 25 years of experience in the field of finance. Prior to joining our Company, he was the Vice President – Finance of Matrix Laboratories Limited.
Directorships in other Companies:
Sl. No.Name of the Companies/Bodies Corporate / Firms / Association of Individuals
Nature of Interest or Concern / change in Interest or Concern
Date on which interest or Concern arose / changed
1. Laurus Labs Limited Whole-time Director November 30, 20062. Laurus Holdings Limited Director July 10, 20173. Laurus Synthesis Inc., Director September 12, 2014
Committee Membership Details:
Sl. No. Name of the Company Name of the Committee Whether Chairman/Member
1. Laurus Labs Limited Stakeholders Relationship Committee
Member
2. Laurus Labs Limited Corporate Social Responsibility Chairman3. Laurus Labs Limited Risk Management Committee Member
Dr. C V Lakshmana RaoDr. C V Lakshmana Rao is one of the Promoters of the Company. He has been associated with the Company for more than a decade and heads Quality function. He holds a Master’s degree in Science and a Ph.D. from Andhra University. Dr. C.V. Lakshmana Rao has over 23 years of experience in quality control, quality assurance and regulatory affairs. He has been involved in formulating and executing the core strategy of our Company. Prior to joining the Company in February 2007, he was associated with Mayne Health Pty Ltd., Australia.
Directorships in other Companies:
Sl. No.Name of the Companies/Bodies Corporate / Firms / Association of Individuals
Nature of Interest or Concern / change in Interest or Concern
Date on which interest or Concern arose / changed
1. Laurus Labs Limited Executive Director March 08, 20182. Sriam Labs Private Limited Director July 25, 2014
Committee Membership Details: NIL
3. Committees of the Board:
(i). Audit Committee The Audit Committee of the Board is headed under the stewardship of Mr. Ramesh Subrahmanian. The other members of
the Committee are Mrs. Aruna Rajendra Bhinge, Dr. M. Venu Gopala Rao and Mr. Narendra Ostawal. The Composition of the Audit Committee meets the requirement of Section 177 of the Companies Act, 2013 read with SEBI (Listing Obligations and Disclosure Requirements) Regulations, 2015. The Audit Committee reviews reports of the Internal Auditors, meets Statutory Auditors as and when required and discusses their findings, suggestions, observations and other related matters. It also reviews major accounting policies followed by the Company.
65Building Momentum
The Year in Review Statutory Reports Financial Statements

During the year, the Audit Committee met 4 (Four) times and the attendance of members is as follows:
Sl. No. Name of the Audit Committee Member No. of Meetings held No. of Meetings attended
1. Mr. Ramesh SubrahmanianIndependent DirectorDIN: 02933019(from 13th May, 2017)
4 4
2. Mr. Venkata Ravi Kumar VantaramChief Financial OfficerDIN: 01424180(Up to 14th July, 2017)
1 1
3. Mrs. Aruna Rajendra BhingeIndependent DirectorDIN: 07474950
4 4
4. Dr. Malempati Venugopala RaoChairman & Independent DirectorDIN: 00012704(from 14th July, 2017)
3 3
5. Mr. Narendra OstawalNon-Executive Nominee DirectorDIN: 06530414(from 14th July, 2017)
3 3
(ii). Nomination and Remuneration Committee The Nomination and Remuneration Committee of the Board is headed by Mr. Ramesh Subrahmanian. The other members of the
Committee are Dr. Rajesh Koshy Chandy and Mr. Narendra Ostawal. Pursuant to the provisions of the Companies Act 2013 and SEBI (Listing Obligations and Disclosure Requirements) Regulations, 2015, the Nomination and Remuneration Committee at its meetings evaluated every director on the basis of criteria for evaluation of directors formulated by it.
During the year, apart from two circular resolutions passed, the Nomination and Remuneration Committee met 1 (One) time and the attendance of members is as follows:
Sl. No. Name of the Committee Member No. of Meetings held No. of Meetings attended
1. Mr. Ramesh SubrahmanianIndependent DirectorDIN: 02933019
1 1
2. Mr. Narendra OstawalNon-Executive Nominee DirectorDIN: 06530414
1 1
3. Mr. Rajesh Koshy ChandyIndependent DirectorDIN: 07575240
1 1
Remuneration to Directors: Details of remuneration paid to Directors during the financial year 2017-18 are as follows:
a. Executive Directors:
In Rupees
S. No. Name Salary Bonus Perks Others Total
1. Dr.C.Satyanarayana 59,851,980 55,816,517 39,600 8,845,419 124,553,5162. Dr.Raju S.Kalidindi (up to 8th
March 2018)15,780,024 7,879,432 39,600 5,747,685 29,446,741
3. Mr. V.V.Ravi Kumar 16,669,968 7,879,432 39,600 3,097,191 27,686,1914. Mr.Ch.Chandrakanth 8,825,976 1,893,456 265,946 1,788,275 12,773,6535. Dr. Lakshmana Rao
C V (from 8th March 2018)510,284 - 2,555 44,272 557,111
Laurus Labs Limited
Annual Report 2017-1866

b. Non-Executive Directors: Non-Executive Directors are paid sitting fee of ` 50,000 for attending each meeting of the Board of Directors and each meeting
of the Committee of Directors. Further, some of the Non-Executive Directors and Independent Directors are paid Remuneration as well, the details of which are provided below:
In Rupees
S. No. Name of the Director Remuneration/Rs. Sitting Fee/Rs.
1. Mr.Amal Ganguli (up to 8th May, 2017) 369,581 02. Dr. Malempati Venugopala Rao (from 18th May 2017) 1,743,148 450,0003. Mrs. Aruna Rajendra Bhinge 2,002,504 701,0004. Dr. Rajesh Koshy Chandy 2,589,914 500,2275. Mr. Ramesh Subrahmanian 2,874,086 700,0006. Dr. Ravindranath Kancherla (from 18th May 2017) 1,743,149 200,000
Nomination/Remuneration Policy: The compensation of the Executive Directors comprises of fixed component, perquisites and performance based incentive and
is determined based on the remuneration prevailing in the industry and the performance of the Company. The remuneration package of the Executive Directors is periodically reviewed and suitable revision is recommended to the Board by the Nomination and Remuneration Committee. The Board shall recommend the same for the approval of the Shareholders.
The nomination and remuneration policy as adopted by the Board is placed on the Company’s website at: http://www.lauruslabs.com/sites/all/themes/lauruslab//Investors/PDF/Policies/Remuneration_Policy.pdf
Performance evaluation criteria for independent directors: The performance evaluation is done on an annual basis by the Nomination & Remuneration Committee and Board of Directors
of the Company.
On the basis of the report of performance evaluation, it is determined by the Nomination and Remuneration Committee and Board whether to extend or continue the term of appointment of Independent Director subject to all other applicable provisions.
Independent Directors Meeting: Schedule IV of the Companies Act, 2013 and the Rule thereunder mandate that the independent directors of the Company hold
at least one meeting in a year, without the attendance of non-independent directors and members of the Management. It is recommended that all the independent directors of the Company be present at such meetings.
Independent Directors meeting was held on 08th March, 2018 and except one Independent Director, all other Independent Directors attended the meeting.
Stakeholders’ Relationship Committee: The Stakeholders Relationship Committee is headed under the stewardship of Mr. Narendra Ostawal. The other members of the
committee are Mr. V.V. Ravi Kumar and Mr. Ch. Chandrakanth.
CSR Committee: The CSR Committee is headed by Mr. V.V. Ravi Kumar, the other members being Mr. Narendra Ostawal and Mrs. Aruna Rajendra
Bhinge.
67Building Momentum
The Year in Review Statutory Reports Financial Statements

Shareholders Annual General Meetings (AGM’s): Venue, date and time of the Last Three Annual General Meetings:
(i). Financial Year 2014-15Date 31st July, 2015 – 11.00 AMVenue Plot No. 21, Jawaharlal Nehru Pharma City, Parawada, Visakhapatnam – 531021, A.P.Special Resolutions 1. Appointment of Mr. Amal Ganguli as Director who is liable to retire by rotation.
2. Re-Appointment of Dr. Chava Satyanarayana as Whole-time Director in the capacity and designation of Chief Executive Officer for a period of 5 years effective from 1st April 2015.
3. Re-Appointment of Dr. Kalidindi Srihari Raju as Whole-time Director in the capacity and designation of Executive Director for a period of 5 years effective from 1st April 2015.
4. Re-Appointment of Mr. Venkata Ravi Kumar Vantaram as Whole-time Director in the capacity and designation of Executive Director for a period of 5 years effective from 1st April 2015.
(ii). Financial Year 2015-16Date 09th June, 2016 – 11.00 AMVenue Plot No. 21, Jawaharlal Nehru Pharma City, Parawada, Visakhapatnam – 531021, A.P.Special Resolutions 1. Creation of mortgages and/or charges on all or any of the assets and properties, immovable and
movable, both present and future, including the undertaking of the Company over the aggregate of the paid-up capital and free reserves of Company up to ` 2,000 crores.
2. Borrowing of any sum or sums of money from time to time at their discretion, for the purpose of the business of the Company, may exceed at any time, the aggregate of the paid-up capital of the Company and its free reserves by a sum not exceeding ` 2,000 crores.
3. Approval of Employee Stock Option Scheme 2016 (iii). Financial Year 2016-17
Date 12th July, 2017 – 10.30 AMVenue Oyster Hall, Waltair Club, Opposite Government Circuit House, Siripuram, Visakhapatnam – 530003.Special Resolutions 1. Bluewater Investment Ltd. will have right to appoint one nominee director until they hold 15% of
the fully diluted share capital of the Company.
2. To alter the Articles of Association of the Company. 3. To create charge on the immovable properties of the Company in favour of lenders u/s. 180(1)(a)
of the Companies Act 2013.
4. To borrow any sum or sums of money from time to time not exceeding ` 2,000 crores u/s.180(1)(c) of the Companies Act, 2013.
5. To ratify the ESOP Scheme 2011 post-IPO under Regulation 12 of SEBI (SBEB) Regulations, 2014.
6. To ratify the ESOP Scheme 2016 post-IPO under Regulation 12 of SEBI (SBEB) Regulations, 2014.
Means of Communication: The quarterly reports, along with additional information and official news releases, are posted on our website www.lauruslabs.
com. Moreover, the quarterly/ annual results and official news releases are generally published in Business Standard (English) and Prajasakthi (Telugu) newspapers.
Earnings calls with analysts and investors and their transcripts are also posted on the website. Further, all material information which has any impact on the operations of the Company is sent to the Stock Exchanges and also the same shall be placed on the Company’s website.
The Management Discussion and Analysis forms part of this Report and is provided separately in this Annual Report.
General Shareholder Information: The 13th Annual General Meeting of the Company will be held at Oyster Hall, Waltair Club, Opposite Government Circuit House,
Siripuram, Visakhapatnam – 530 003, Andhra Pradesh at 03.00 p.m. on Thursday the 05th day of July, 2018.
The Financial Year of the Company is from 1st April to 31st March next every year.
The Board of Directors have recommended a dividend of 15% (i.e. ` 1.50/- per share) to the Shareholders. The dividend, if approved and declared by the Shareholders, shall be paid / credited on or after July 11, 2018 to all the shareholders of the
Laurus Labs Limited
Annual Report 2017-1868

Company who are in the Register of Members of the Company as on the date of Book Closure. Book closure for the purpose of AGM and Dividend will be from July 2, 2018 to July 5, 2018 (both days inclusive). Cut-off date for e-voting is June 29, 2018.
The Shares of the Company are listed on the following Stock Exchanges: (i). BSE Limited, Phiroze Jeejeebhoy Towers, 25th Floor, Dalal Street, Mumbai-400001; and
(ii). National Stock Exchange of India Limited (NSE), Exchange Plaza, Bandra-Kurla Complex, Bandra (East), Mumbai – 400051.
The listing fees for the financial year has been paid to the respective stock exchanges.
Stock code: BSE Limited: 540222, NSE: LAURUSLABS. International Subscribers Identification Number (ISIN) for the Company's Equity Shares is INE947Q01010
Depositories for Equity Shares: (i). National Securities Depository Limited (NSDL) and
(ii). Central Depository Services Limited (CDSL).
Market Price data: High, low market price during each month in the financial year and volume of shares traded on NSE:
MonthNSE Nifty 50
High Low Close Volume High Low CloseApr 2017 533.85 502.5 519.9 2377141 9367.15 9075.15 9304.05May 2017 593.9 513.05 572.5 3542382 9649.6 9269.9 9621.25June 2017 634.5 569.2 615.15 3991028 9709.3 9448.75 9520.9July 2017 640 571.55 580.7 2125929 10114.85 9543.55 10077.1Aug 2017 595 418.9 527.35 1688695 10137.85 9685.55 9917.9Sept 2017 568 504.9 507.15 1856268 10178.95 9687.55 9788.6Oct 2017 556.95 502.25 538.4 1215028 10384.5 9831.05 10335.3Nov 2017 557.85 514.7 525.4 2011195 10490.45 10094 10226.55Dec 2017 579.9 499 542.9 3132075 10552.4 10033.35 10530.7Jan 2018 565 508 516.6 2152295 11171.55 10404.65 11027.7Feb 2018 549.9 491.2 543.55 1382796 11117.35 10276.3 10492.85Mar 2018 547.65 495 502.85 1177413 10525.5 9951.9 10113.7
615.15
580.7
527.35 507.15 538.4 525.4 542.9
11027.7
543.55502.85
10113.710492.85
516.6
10530.7
10226.5510335.3
9788.6
9917.910077.1
9520.9
9621.25
9304.05
519.9
572.5
11500 700
600
500
400
300
200
100
0
11000
10500
10000
9500
9000
8500NSE Nifty 50 Vs Laurus Share Price
NSE
Nif
ty 5
0
Laur
us S
hare
Pric
e
Apr-17 May-17 Jun-17 Jul-17 Aug-17 Sep-17 Oct-17 Nov-17 Dec-17 Jan-18 Feb-18 Mar-18
Apr-17 May-17 Jun-17 Jul-17 Aug-17 Sep-17 Oct-17 Nov-17 Dec-17 Jan-18 Feb-18 Mar-18
NSE Nifty 50 9304.05 9621.25 9520.9 10077.1 9917.9 9788.6 10335.3 10226.55 10530.7 11027.7 10492.85 10113.7
Laurus Share Price 519.9 572.5 615.15 580.7 527.35 507.15 538.4 525.4 542.9 516.6 543.55 502.85
Chart given below shows the stock performance at closing prices in comparison to the broad-based index such as NSE Nifty 50.
NSE Nifty 50 Vs Laurus Share Price
69Building Momentum
The Year in Review Statutory Reports Financial Statements

High, low market price during each month in the financial year and volume of shares traded on BSE:
MonthBSE S&P BSE Sensex
High Low Close Volume High Low CloseApr 2017 533 502.5 518.45 1038995 30184.22 29241.48 29918.4May 2017 594 516.5 569.15 573313 31255.28 29804.12 31145.8June 2017 634 576.8 614.4 940431 31522.87 30680.66 30921.61July 2017 630 576.8 580.75 208993 32672.66 31017.11 32514.94Aug 2017 592 497.2 526.9 182340 32686.48 31128.02 31730.49Sept 2017 574 503.7 505.9 901109 32524.11 31081.83 31283.72Oct 2017 554.05 505 536.55 175408 33340.17 31440.48 33213.13Nov 2017 556 514.2 523.9 485219 33865.95 32683.59 33149.35Dec 2017 579.25 499 542.9 540810 34137.97 32565.16 34056.83Jan 2018 566 509 519 316218 36443.98 33703.37 35965.02Feb 2018 548.55 485 538.35 766934 36256.83 33482.81 34184.04Mar 2018 547.5 496 503.1 210527 33505.53 32972.56 33019.07
Chart given below shows the stock performance at closing prices in comparison to the broad-based index such as BSE Sensex.
BSE Sensex Vs Laurus Share Price
29918.4
31145.8
614.4569.15 580.75
526.9505.9
536.55 523.9524.9
538.35
34184.04503.1
30921.61
32514.94
31730.49
31283.72
33213.13 33149.35
34056.83
35965.02
519
33019.07
518.45
37000 700
600
500
400
300
200
100
0
35000
33000
31000
29000
27000
25000BSE Sensex Vs Laurus Share Price
BSE
Sen
sex
Laur
us S
hare
Pric
e
Apr-17 May-17 Jun-17 Jul-17 Aug-17 Sep-17 Oct-17 Nov-17 Dec-17 Jan-18 Feb-18 Mar-18
Apr-17 May-17 Jun-17 Jul-17 Aug-17 Sep-17 Oct-17 Nov-17 Dec-17 Jan-18 Feb-18 Mar-18
BSE Sensex 29918.4 31145.8 30921.61 32514.94 31730.49 32183.72 33213.13 33149.35 34056.83 35965.02 34184.04 33019.07
Laurus Share Price 518.45 569.15 614.4 580.75 526.9 505.9 536.55 523.9 542.9 519 538.35 503.1
There was no suspension of trading of securities of the Company during the year under review.
The Company’s shares are transferable through the depository system. The Company has appointed Karvy Computershare Pvt Ltd. as its Registrars and Share Transfer Agents and also Depository Transfer Agent. Shares received for physical transfers are generally registered within a period of 15 days from the date of receipt of the valid and duly filled up transfer deeds. The Company has signed a tripartite agreement with NSDL/CDSL and Karvy to facilitate dematerialization of shares. The Members may contact for the redressal of their grievances to either Karvy or the Company Secretary of the Company.
In respect of transfer of physical shares, Shareholders are advised to contact our Registrars:
Karvy Computershare Private Limited,Selenium Tower B Plot No. 31-32,Gachibowli Financial District,Nanakramguda, Hyderabad,Telangana, 500032.
Telephone: 040 - 67162222Fax: 040 - 23431551Email: [email protected]: www.karisma.karvy.com
Laurus Labs Limited
Annual Report 2017-1870

Distribution of Shareholding as on March 31, 2018:
Category (No. of Shares)
No. of Share Holders % No. of Shares %
1 500 47583 96.34 2647055 2.5501 1000 834 1.69 668574 0.631001 2000 389 0.79 592118 0.562001 3000 129 0.26 322906 0.303001 4000 67 0.14 243207 0.234001 5000 66 0.13 304722 0.295001 10000 108 0.22 783614 0.7410001 and above 217 0.44 100467553 94.75Total 49393 100.00 106029749 100.00
Details of Shareholding in physical mode and electronic mode as on 31.03.2018
S. No. Description % of Shareholders No. of Shares % of Equity
1. Physical 0.01 36007 0.032. NSDL 57.57 102029717 96.233. CDSL 42.42 3964025 3.74
Total 100.00 106029749 100.00
The Company has not issued any GDR/ADR and there are no outstanding warrants or any convertible instruments.
The Company has undertaken hedging activities for foreign exchange risk, whereas the Company has not undertaken any hedging for commodity price risk.
Location of Plants: Unit 1Plot No: 21, Jawaharlal Nehru Pharma City, Parawada, Visakhapatnam 531021, Andhra Pradesh, India.
Unit 2Plot No: 19, 20, 21; APSEZ, Gurajapalem, Atchutapuram, Visakhapatnam 531011, Andhra Pradesh, India.
Unit 3Plot No: 18, Jawaharlal Nehru Pharma City, Parawada, Visakhapatnam 531021, Andhra Pradesh, India.
Unit 4Plot No: 25, Lalamkoduru, Atchutapuram, Visakhapatnam 531011, Andhra Pradesh, India.
Unit 5Plot No: 102 & 103, SEZ, Lemarthi, Parwada, Visakhapatnam 531021, Andhra Pradesh, India.
Unit 6Plot No: 22D & 22E, APSEZ De-Notified Area, Atchutapuram, Visakhapatnam 531011, Andhra Pradesh, India.
Research & Development CentrePlot No. DS1 & DS2, IKP Knowledge Park, Turkapally, Shameerpet, Hyderabad 500078, Telangana, India.
Address for correspondence:Registered Office: Plot No.21, Jawaharlal Nehru Pharma City, Parawada, Visakhapatnam 531021, Andhra Pradesh, India.
Corporate Office: 2nd Floor, Serene Chambers, Road No.7, Banjara Hills, Hyderabad 500034, Telangana, India.
Other Disclosures:Related Party transactions:No transaction of material nature has been entered into by the Company with its Directors/Management and their relatives etc. that may have a potential conflict with the interest of the Company. Only one related party transaction that was approved by the Board in its meeting held on April 19, 2017 is relating to the appointment of Mr. Krishna Chaitanya Chava as Asst. Vice President (Corporate Development), who is the son of Dr. Satyanarayana Chava, CEO of the Company was placed before the members on 12th July 2017 for their approval in terms of Sec.188 of the Companies Act, 2013. The Register of Contracts containing transactions, in which Directors are interested, is placed before the Board regularly.
71Building Momentum
The Year in Review Statutory Reports Financial Statements

Transactions with Related Parties are disclosed in the Notes to Accounts in the Annual Report.
In terms of SEBI (LODR) Regulations 2015, the Audit Committee and Board of Directors of the Company have adopted a policy to determine the related party transactions. The policy is placed on the Company’s website at http://www.lauruslabs.com/sites/all/themes/lauruslab//Investors/PDF/Policies/Related_Party_Transactions_Policy.pdf
Details of Non-compliances and penalties:There were no instances of non-compliance or penalties/strictures by the stock exchanges/SEBI/statutory authorities on any matter related to capital markets during the last three years.
Vigil mechanism:The Board of Directors of the Company had adopted the Whistle Blower policy. The Company has established a mechanism for employees and Directors to report to the management, concerns about unethical behaviour, actual or suspected fraud or violation of the Company’s Code of conduct etc. The employees have been appropriately communicated within the organization about the mechanism and have been provided direct access to the Chairman of the Audit Committee. The mechanism also lays emphasis on making enquiry into whistle blower complaint received by the Company. The Audit Committee reviews periodically the functioning of the whistle blower mechanism. No employee has been denied access to the Audit Committee. A copy of the Whistle Blower Policy is hosted on the Company’s website at http://www.lauruslabs.com/sites/all/themes/lauruslab//Investors/PDF/Policies/Whistle_Blower_Policy.pdf
Details of compliance with mandatory requirements and adoption of the non-mandatory requirements:The Company has complied with all the mandatory requirements of Corporate Governance as per SEBI (LODR) Regulations, 2015 and is in the process of implementing the non-mandatory requirements.
Policy on material subsidiaries:In terms of the SEBI (LODR) Regulations, 2015, the Board of Directors of the Company has adopted a policy with regard to determination of material subsidiaries. The policy is placed on the Company’s website at http://www.lauruslabs.com/sites/all/themes/lauruslab//Investors/PDF/Policies/Policy_on_Materiality_of_Subsidiaries.pdf
Non-compliance of any requirements of corporate governance report of sub-paras (2) to (10) of Schedule VThe Company has complied with the requirement of corporate governance report of sub-paras (2) to (10) of Schedule V of the SEBI (LODR) Regulations, 2015.
Adoption of discretionary requirements as specified in Part E of Schedule II of SEBI (LODR) Regulations, 2015
With regard to discretionary requirements, the Company has adopted clauses relating to the following:
Separate persons were appointed for the post of the Chairman and the CEO. The financial statements of the Company so far have an unmodified audit opinion. Internal auditors report directly to the Audit Committee.
The disclosures of the compliance with Corporate Governance requirements specified in Regulation 17 to 27 and clauses (b) to (i) of sub-regulation (2) of regulation 46 are as follows:
Regulation Particulars of RegulationsCompliance Status
Yes/No
17 Board of Directors Yes18 Audit Committee Yes19 Nomination and Remuneration Committee Yes20 Stakeholders Relationship Committee Yes21 Risk Management Committee Yes22 Vigil Mechanism Yes23 Related Party Transactions Yes24 Corporate Governance requirements with respect to subsidiary of listed entity Yes25 Obligations with respect to Independent Directors Yes26 Obligations with respect to Directors and Senior Management Yes27 Other Corporate Governance requirements Yes46 (2)(b) to (i) Functional Website Yes
Code of Conduct:In compliance with Regulation 26(3) of the SEBI (Listing Obligations and Disclosure Requirements) Regulation, 2015 and the Companies Act, 2013, the Company has framed and adopted a Code of Conduct policy. The Code is applicable to the members of the Board, the executive officers and all employees of the Company and its subsidiaries. The Code is available on our website http://www.lauruslabs.com/sites/all/themes/lauruslab//Investors/PDF/Policies/Code_of_Conduct_Policy.pdf
Laurus Labs Limited
Annual Report 2017-1872

All members of the Board, the executive officers and senior financial officers have affirmed compliance to the Code as on March 31, 2018.
Prevention of Insider Trading:The Company has adopted an Insider trading Policy to regulate, monitor and report trading by insiders under the SEBI (Prohibition of Insider Trading) Regulations, 2015. This policy includes practices and procedures for fair disclosure of unpublished price-sensitive information, initial and continual disclosure. The Board reviews the policy on a need basis. The policy is available on our website http://www.lauruslabs.com/sites/all/themes/lauruslab//Investors/PDF/Policies/Code_for_Prohibition_of_Insider_Trading.pdf.
CEO and CFO Certification:As required by SEBI (Listing Obligations and Disclosure Requirements) Regulation, 2015, the CEO & CFO certification is provided in this Annual report.
Auditors’ Certificate on Corporate GovernanceAs required by Schedule V of the SEBI (Listing Obligations and Disclosure Requirements) Regulation, 2015, the Certificate on Corporate Governance issued by practising Company Secretary is annexed to the Board’s report.
DeclarationI, Satyanarayana Chava, Chief Executive Officer, hereby declare that as provided under SEBI (LODR) Regulations, 2015, the Board Members and the senior management personnel have confirmed compliance with the Code of Conduct for the year ended March 31, 2018.
For Laurus Labs Limited
Place: Hyderabad Dr. Satyanarayana ChavaDate: May 10, 2018 Chief Executive Officer
73Building Momentum
The Year in Review Statutory Reports Financial Statements

CEO & CFO DECLARATION
Date: 03rd May 2018
ToThe Board of DirectorsLaurus Labs Limited
We, Satyanarayana Chava, CEO and V.V. Ravi Kumar, CFO hereby certify as under:
A. We have reviewed financial statements and the cash flow statement for the year ended 31st March, 2018 and that to the best of our knowledge and belief:
(1) These statements do not contain any materially untrue statement or omit any material fact or contain statements that might be misleading;
(2) These statements together present a true and fair view of the Company's affairs and are in compliance with existing Accounting Standards, applicable laws and regulations.
B. To the best of our knowledge and belief, no transactions entered into by the Company during the year ended 31st March 2018 are fraudulent, illegal or violative of the Company's Code of Conduct.
C. We accept responsibility for establishing and maintaining internal controls for financial reporting and we have evaluated the effectiveness of internal control systems of the Company pertaining to financial reporting. Deficiencies in the design or operation of such internal controls, if any, of which we are aware have been disclosed to the auditors and the Audit Committee and steps have been taken to rectify these deficiencies.
D. (1) There has not been any significant changes in internal control over financial reporting during the year;
(2) There has not been any significant changes in accounting policies during the year requiring disclosure in the notes to the financial statements; and
(3) We are not aware of any instances during the year of significant fraud with involvement therein of the management or an employee having a significant role in the Company's internal control system over financial reporting.
Thanking you,For Laurus Labs Limited For Laurus Labs Limited
Satyanarayana Chava V.V. Ravi KumarChief Executive Officer Chief Financial Officer
Laurus Labs Limited
Annual Report 2017-1874

CERTIFICATE ON CORPORATE GOVERNANCE
ToThe Members ofM/s. LAURUS LABS LIMITEDPlot No.21, Jawaharlal Nehru Pharma City, Parawada, Visakhapatnam, Andhra Pradesh – 531021.
We have examined the compliance conditions of Corporate Governance by M/s. Laurus Labs Limited for the financial year ended 31st March, 2018, as stipulated in the Securities and Exchange Board of India (Listing Obligations and Disclosure Requirements) Regulations, 2015 [“SEBI (LODR) Regulations, 2015”] and the Uniform Listing Agreement entered between the Company & Stock Exchanges.
The compliance of conditions of Corporate Governance is the responsibility of the Company’s management. Our examination was limited to procedures and implementation thereof, adopted by the Company for ensuring the compliance of the conditions of the Corporate Governance. It is neither an audit nor an expression of opinion on the financial statements of the Company.
In our opinion and to the best of our knowledge and according to the explanations given to us, we certify that the Company has complied with the conditions of applicable Corporate Governance as stipulated in the above mentioned SEBI (LODR) Regulations, 2015 and the Uniform Listing Agreement.
We further state that such compliance is neither an assurance as to the future viability of the Company nor the efficiency or effectiveness with which the management has conducted the affairs of the Company.
For RPR & ASSOCIATESCompany Secretaries
Place: Hyderabad Y.Ravi Prasada ReddyDated: 04th May, 2018. Proprietor, FCS No.5783, CP No.5360
75Building Momentum
The Year in Review Statutory Reports Financial Statements

AUDITOR CERTIFICATE ON ESOP SCHEME
Independent Auditor's Report on the Employees Stock Option Scheme 2011 and 2016, as required by the Securities and Exchange Board of India (Share Based Employee Benefits) Regulations, 2014
The Board of DirectorsLaurus Labs Limited2nd Floor, Serene Chambers,Road Number 7, Banjara Hills,Hyderabad – 500 034Telangana, India.
1. This certificate is issued in accordance with the terms of our engagement letter dated July 24, 2017.
2. We, Deloitte Haskins & Sells LLP, Chartered Accountants, (Firm’s Registration No: 117366W / W - 100018), the Statutory Auditors of Laurus Labs Limited, (the “Company”) having its registered office at Plot No.21, Jawaharlal Nehru Pharma City, Parawada, Visakhapatnam-531021, have examined the implementation of Employee Stock Option Scheme 2011 (“ESOP 2011”) and Employee Stock Option Scheme 2016 (“ESOP 2016”), of the Company for the year ended March 31, 2018 as stipulated under Regulation 13 of the Securities and Exchange Board of India (Share Based Employee Benefits) Regulations, 2014 (“SEBI Regulations”), as amended from time to time.
Management’s Responsibility
3. The implementation of the ESOP 2011 and ESOP 2016, in accordance with the SEBI Regulations, as amended from time to time, and also in accordance with the resolutions of the company is the responsibility of the Management of the Company. The Management of the Company is also responsible for design, implementation and maintenance of internal control relevant to the preparation and presentation of the said ESOP 2011 and ESOP 2016, maintenance of proper books of account, other relevant records and documents as prescribed under the aforesaid Regulations.
Auditor’s Responsibility
4. Our responsibility, for the purpose of this certificate, is limited to the review of the procedures and implementation thereof, adopted by the Company for the year ended March 31, 2018 in respect of the compliance with the aforesaid SEBI Regulations, as stipulated in Regulation 13 of the SEBI Regulations.
5. We conducted our examination of the Statement in accordance with the Guidance Note on Reports or Certificates for Special Purposes issued by the Institute of Chartered Accountants of India (“ICAI”) and the Standards on Auditing specified under Section 143(10) of the Companies Act 2013, as applicable. The Guidance Note requires that we comply with the ethical requirements of the Code of Ethics issued by the ICAI.
6. We have complied with the relevant applicable requirements of the Standard on Quality Control (SQC) 1, Quality Control for Firms that Perform Audits and Reviews of Historical Financial Information, and Other Assurance and Related Services Engagements.
Opinion
7. Based on our examination as above, and according to the information and explanations provided to us by the Management of the Company, we certify that the ESOP 2011 and ESOP 2016 of the Company referred to above, has been implemented for the year ended March 31, 2018 in accordance with the SEBI Regulations, as amended from time to time, and in accordance with the resolutions of the members of the Company.
Restriction on Use
8. This Certificate is addressed to and provided to the Board of Directors of the Company for the purpose of placing the same before the shareholders of the Company at the ensuing Annual General Meeting of the Company and should not be used for any other purpose without our prior written consent. Accordingly, we do not accept or assume any liability or any duty of care for any other purpose or to any other person to whom this report is shown or into whose hands it may come without our prior consent in writing.
For DELOITTE HASKINS & SELLS LLPChartered Accountants
(Firm’s Registration No. 117366W/W-100018)
Ganesh BalakrishnanPlace: Hyderabad PartnerDate: May 10, 2018 (Membership No. 201193)
Laurus Labs Limited
Annual Report 2017-1876

BUSINESS RESPONSIBILITY REPORT
Overview:Laurus Labs strives for innovation to enhance quality and to provide affordable integrated pharmaceutical solutions to facilitate wellness and wellbeing across the globe. One Quality for all the Markets is the philosophy under which the Company operates its businesses. The Company strives to seek greater alignment between its stakeholders to generate value in the long term.
Section A: General Information about the Company
1. Corporate Identity Number (CIN) of the Company
L24239AP2005PLC047518
2. Name of the Company Laurus Labs Limited3. Company Address Registered Office: Plot No.21, Jawaharlal Nehru Pharma City, Parawada, Visakhapatnam – 531
021, Andhra Pradesh, India.Corporate Office: 2nd Floor, Serene Chambers, Road No.7, Banjara Hills, Hyderabad – 500 034, Telangana, India.
4. Website www.lauruslabs.com5. E-mail ID [email protected]. Financial year reported April 1, 2017 to March 31, 20187. Sector(s) that the Company is engaged in
(industrial activity code-wise)NIC Code of product/service:21001/21002Description: Manufacturing of active pharmaceutical ingredients
8. List of three key products/services that the Company manufactures / provides (as in balance sheet)
Laurus manufactures Active Pharmaceutical Ingredients (API) for anti-retroviral, oncology, cardio vascular, diabetic and hypertension, nutraceutical and other products. Key Products: Efavirenz, Tenofovir (TDF), Gemcitabine
9. Total number of locations where business activity is undertaken by the Company
There are six manufacturing facilities and one R&D Centre. Laurus Synthesis Inc., an US Subsidiary of the Company has office and R& D Centre at Boston, USA. Sriam Labs Pvt Ltd., another subsidiary, has one manufacturing facility. Laurus Holdings Limited, an UK Subsidiary of the Company has office at South Gate Chambers, 37/39, South Gate Street, Winchester, Hants, United Kingdom – S023 9EH. Laurus Generics Inc., an US step down Subsidiary of the Company has office at 200, Bellevue Parkway, Suite 210, Wilmington, County of New Castle – 19809 and Laurus Generics GmbH, a Germany step down Subsidiary of the Company has office at C/o. Alfred E. Tiefenbacher, Van-Der-Smissen-Strasse 1, Hamburg DE – 22767.
10. Markets served by the Company – Local/state/national/international
The Company, in addition to marketing its products domestically, also markets its products globally over 55 countries. Around 39% of sales are generated from international markets.
Section B: Financial details of the Company:
1. Paid up Capital ` 1060.29 Million2. Total Turnover Gross turnover of ` 20,392.88 Million on standalone basis.3. Total Profit After Tax ` 1,731 Million on standalone basis.4. Total spending on Corporate Social Responsibility (CSR) as
percentage of profit after tax (%)CSR spend during the financial year 2017-18 was ` 43.98 Million (2.64% of last three years average Profit After Tax on standalone basis)
5. List of activities in which the expenditure in 4 above has been incurred
Education Health Rural sports promotion, Eradicating hunger, poverty and malnutrition etc.
Section C: Other Details:
1. Does the Company have any subsidiary Company/companies Yes, the Company has three Subsidiaries and two step down Subsidiaries, one Subsidiary is located in India, one in United States of America and one in United Kingdom. One Step down Subsidiary is located in United States of America and another Step down Subsidiary is located in Germany.
2. Do the subsidiary company/ companies participate in the BR initiatives of the parent company? If yes, then indicate the number of such subsidiary company(s)
The parent company undertakes majority of the BR initiatives
3. Do any other entity/entities (eg. Suppliers, distributors etc.) that the Company does business with, participate in the BR initiatives of the Company? If yes, then indicate the percentage of such entity/entities.
Entities like suppliers, distributors did not participate in the Company BR initiatives in the reporting period.
77Building Momentum
The Year in Review Statutory Reports Financial Statements

Section D: BR Information
1. Details of Director responsible for BR a. Details of the Director responsible for implementation of the BR policies:Particular DetailsDIN Number 00211921Name Dr.Satyanarayana ChavaDesignation Chief Executive OfficerTelephone No. 040-39804333E-mail ID [email protected]
b. Details of the BR head: Same as above
2. Principle-wise (as per NVGs) BR Policy/policies Details of Compliance:
S. No.
QuestionsEthics
Product Lifecycle
Sustainability*
Employees wellbeing
Stakeholders engagement
Human rights
EnvironmentPolicy
advocacy
Community Development
(CSR)
Customer Value
P1 P2 P3 P4 P5 P6 P7 P8 P9
1 Do you have policies for Yes No Yes No formal policy yet
No formal policy yet
Yes No Yes No
2 Has the policy being formulated in consultation with the relevant stakeholders?
Yes N.A. Yes NA NA Yes NA Yes N.A.
3 Does the policy conform to any national/international standards? If yes, specify.
Yes N.A. Yes NA NA Yes** NA Yes N.A.
4 Has the policy being approved by the Board? If yes, has it been signed by MD/owner/CEO/ appropriate Board Director?
Yes N.A. Yes NA NA Yes NA Yes N.A.
5 Does the Company have a specified committee of the Board/Director/official to oversee the implementation of the policy
Yes N.A. Yes NA NA Yes NA Yes N.A.
6 Indicate the link for the policy to be viewed on-line
www.lauruslabs.
com
N.A. Intranet NA NA Intranet NA www.laurus labs.com
N.A.
7 Has the policy been formally communicated to all relevant internal and external stakeholders?
Yes N.A. Yes NA NA Yes NA Yes N.A.
8 Does the Company have in-house structure to implement the policies?
Yes N.A. Yes NA NA Yes NA Yes N.A.
9 Does the Company have a grievance redressal mechanism related to the policies to address stakeholders’ grievances related to the policies?
Yes N.A. Yes NA NA Yes NA Yes N.A.
10 Has the Company carried out independent audit/ evaluation of the working of this policy by an internal or external agency?
No N.A. Yes NA NA Yes NA Yes N.A.
The policies are framed as per the national standards applicable to India.
* Definition Product Lifecycle Sustainability: It is an approach to managing the stages of – product existence so that any negative impact on the environment is minimized. Although we have done Life Cycle Assessment) for Curcumin and Resvertrol carried out, no policy in place.** Policy is in line with ISO 14001 international standards
Laurus Labs Limited
Annual Report 2017-1878

3. Governance related to BR a. Indicate the frequency with which the Board of Directors,
Committee of the Board or CEO assess the BR performance of the Company
To be Reviewed Annually.
b. Does the Company publish a BR or a Sustainability Report? What is the hyperlink for viewing this report? How frequently it is published? This is part of the Annual Report for the financial year 2017-18.
Section-E : Principle-wise PerformancePrinciple-1 – Ethics1. Does the policy relating to ethics, bribery and corruption
cover only the Company? Yes/No. Does it extend to the group/joint ventures/suppliers/contractors/NGOs/ others?
The Company is committed to building a strong ethical organization. Currently, the policy relating to ethics, bribery and corruption cover only the Company. However, the Company has adopted a Code of Conduct policy which is applicable to all supervisory, executive and managerial employees of the Company including the board members and also covers subsidiaries as well but not extended to others vendors/others.
2. How many stakeholder complaints have been received in the past financial year and what percentage was satisfactorily resolved by the management?
The Company has received 19 investor complaints all of which relate to their subscription in the Initial Public Offering of Securities (IPO) of the Company and all of them have been resolved satisfactorily and no complaint is pending for resolution as on March 31, 2018.
Principle-2 – Product Life Cycle Sustainability1. List up to 3 of your products or services whose design has
incorporated social or environmental concerns, risks and/or opportunities.
Carbon footprint study carried out for two of nature identical products Curcumin and Resveratrol.
2. For each such product, provide the following details in respect of resource use (energy, water, raw material etc.) per unit of product (optional)
Reduction during sourcing/production/distribution achieved since the previous year throughout the value chain?
Reduction during usage by consumers (energy, water) has been achieved since the previous year?
3. Does the Company have procedures in place for sustainable sourcing (including transportation)? If yes, what percentage of your inputs was sourced sustainably? Also, provide details thereof.
The Company has laid down standard operating procedures for the selection of its vendors and approving the same for sourcing of materials. We did natural products sourcing using Nogoya protocol and Biodiversity Act.
4. Has the Company taken any steps to procure goods and services from local & small producers, including communities surrounding their place of work?
The Company needs to follow certain procedures in terms of sourcing of materials and based on the availability preference will be given for the domestic sources. Contract workmen were engaged from the local community.
5. Does the Company have a mechanism to recycle products and waste? If yes, what is the percentage of recycling of products and waste? Also, provide details thereof, in about 50 words or so.
Yes, the Company has a mechanism to recycle or dispose waste materials. The solvents are recovered and reused wherever possible in the process.
Principle-3 – Employee Wellbeing1. Please indicate the total number of employees 3186
2. Please indicate the total number of employees hired on temporary/contractual/casual basis 2383
3. Please indicate the number of permanent women employees 242
4. Please indicate the number of permanent employees with disabilities Nil
5. Do you have an employee association that is recognized by the management No
6. What percentage of your permanent employees is member of this recognized employee association? Not applicable
7. Please indicate the number of complaints relating to child labour, forced labour, involuntary labour, sexual harassment in the last financial year and pending, as on the end of the financial year. Nil
8. What percentage of your under-mentioned employees were given safety & skill up-gradation training in the last year?
79Building Momentum
The Year in Review Statutory Reports Financial Statements

R&D (%) U-1 (%) U-2 (%) U-3 (%) U-4 (%) U-5 (%) U-6 (%) Total %
Permanent employees 85 81 82 100 70 81 60 80%Permanent women employees 80 100 93 100 100 100 80 93%Casual/Temporary/Contractual employees 100 100 95 100 100 100 75 96%Employees with disabilities NA NA NA NA NA NA NA NA
Principle-4 – Stakeholders engagement1. Has the Company mapped its internal and external
stakeholders? Yes
2. Out of the above, has the Company identified the disadvantaged, vulnerable & marginalized stakeholders? Yes
3. Are there any special initiatives taken by the Company to engage with the disadvantaged, vulnerable and marginalized stakeholders. If so, provide details thereof, in about 50 words or so.
The Company implements all special protection rights such as Whistle blower mechanism, minority shareholders’ rights etc. and implements all Corporate Governance Practices with highest standards so that all stakeholders gets their due share of benefits.
Principle-5 – Human Rights1. Does the policy of the Company on human rights cover
only the Company or extend to the group/joint ventures/suppliers/contractors/NGOs/others?
The Company is yet to implement the formal policy.
2. How many stakeholder complaints have been received in the past financial year and what per cent was satisfactorily resolved by the management? Nil
Principle 6 – Environment1. Does the policy cover only the Company or extends to the
group/joint ventures/suppliers/contractors/NGOs/others?
The Company and its subsidiaries
2. Does the Company have strategies/initiatives to address global environmental issues such as climate change, global warning, etc.?
Few assessments conducted for carbon foot print study. As part of the global warming and climate change, Company complies with avoiding use of ozone depleting chemicals CTC, EDC, CFC etc.,
3. Does the Company identify and assess potential environmental risks?
Yes. Now products are introduced after proper HAZOP and environmental impact assessment.
4. Does the Company have any project related to Clean Development Mechanism? If so, provide details thereof, in about 50 words or so? No
5. Has the Company undertaken any other initiatives on clean technology, energy efficiency, renewable energy etc.?
Yes. To minimize power usage LED lights have been used and more efficient agitators have been used.
6. Are the emissions/waste generated by the Company within the permissible limits given by CPCB/SPCB for the financial year being reported? Yes
7. Number of show cause/legal notices received from CPCB/SPCB which are pending (i.e. not resolved to satisfaction) as at the end of the financial years. Nil
Principle-7 – Policy advocacy1. Is your company a member of any trade and chamber of
association? If yes, Name only those major ones that your business deals with.
The Company is a member in – Confederation of Indian Industry Pharmaceuticals Export Promotion Council of India The Federation of TG and AP Chambers of Commerce &
Industry (FTAPCCI) Bulk Drugs Manufacturers Association JNPC Manufacturers Association The Associated Chambers of Commerce & Industry
of India Indo American Chamber of Commerce, Hyderabad
2. Have you advocated/lobbied through above associates for the advancement or improvement of public good? Yes/No; if yes, specify the broad areas.
No, but the Company implements various CSR activities for the advancement or improvement of public good.
Principle-8 – Community Development (CSR)1. Does the company have specified programs/initiatives/
projects in pursuit of this policy? If yes, details thereof.
Promoting Education, Health and sanitation. The Company collaborated with Universities for providing practical training as part of curriculum in M.Sc course.
Laurus Labs Limited
Annual Report 2017-1880
2. Are the programs/projects undertaken through in-house team/own foundation/ external NGO/government structures/any other organization?
In house team
3. Have you done any impact assessment of your initiative? Yes.
4. What is your Company’s direct contribution to community development projects – amount and details of the projects undertaken? ` 43.98 million
5. Have you taken steps to ensure that this community development initiative is successfully adopted by the community? Yes
Principle-9 – Customer value1. What percentage of customer complaints/consumer cases
are pending as on the end of the financial year? Nil
2. Does the Company display product information on the product label, over and above what is mandated as per local laws?
Based on specific customer requirement
3. Is there any case filed by any stakeholder against the Company regarding unfair trade practices, irresponsible advertising and/or anti-competitive behaviour during the last five years and pending as on end of the financial year? Nil
4. Did your Company carry out any consumer survey/consumer satisfaction trends? No
81Building Momentum
The Year in Review Statutory Reports Financial Statements

INDEPENDENT AUDITOR'S REPORT
To The Members of Laurus Labs Limited
Report on the Standalone Ind AS Financial Statements We have audited the accompanying standalone Ind AS financial statements of Laurus Labs Limited (“the Company”), which comprise the Balance Sheet as at March 31, 2018, and the Statement of Profit and Loss (including Other Comprehensive Income), the Cash Flow Statement and the Statement of Changes in Equity for the year then ended, and a summary of the significant accounting policies and other explanatory information.
Management’s Responsibility for the Standalone Ind AS Financial StatementsThe Company’s Board of Directors is responsible for the matters stated in Section 134(5) of the Companies Act, 2013 (“the Act”) with respect to the preparation of these standalone Ind AS financial statements that give a true and fair view of the financial position, financial performance including other comprehensive income, cash flows and changes in equity of the Company in accordance with the Indian Accounting Standards (Ind AS) prescribed under section 133 of the Act read with the Companies (Indian Accounting Standards) Rules, 2015, as amended, and other accounting principles generally accepted in India.
This responsibility also includes maintenance of adequate accounting records in accordance with the provisions of the Act for safeguarding the assets of the Company and for preventing and detecting frauds and other irregularities; selection and application of appropriate accounting policies; making judgments and estimates that are reasonable and prudent; and design, implementation and maintenance of adequate internal financial controls, that were operating effectively for ensuring the accuracy and completeness of the accounting records, relevant to the preparation and presentation of the standalone Ind AS financial statements that give a true and fair view and are free from material misstatement, whether due to fraud or error.
Auditor’s ResponsibilityOur responsibility is to express an opinion on these standalone Ind AS financial statements based on our audit.
In conducting our audit, we have taken into account the provisions of the Act, the accounting and auditing standards and matters which are required to be included in the audit report under the provisions of the Act and the Rules made thereunder and the Order issued under section 143(11) of the Act.
We conducted our audit of the standalone Ind AS financial statements in accordance with the Standards on Auditing
specified under Section 143(10) of the Act. Those Standards require that we comply with ethical requirements and plan and perform the audit to obtain reasonable assurance about whether the standalone Ind AS financial statements are free from material misstatement.
An audit involves performing procedures to obtain audit evidence about the amounts and the disclosures in the standalone Ind AS financial statements. The procedures selected depend on the auditor’s judgment, including the assessment of the risks of material misstatement of the standalone Ind AS financial statements, whether due to fraud or error. In making those risk assessments, the auditor considers internal financial control relevant to the Company’s preparation of the standalone Ind AS financial statements that give a true and fair view in order to design audit procedures that are appropriate in the circumstances. An audit also includes evaluating the appropriateness of the accounting policies used and the reasonableness of the accounting estimates made by the Company’s Directors, as well as evaluating the overall presentation of the standalone Ind AS financial statements.
We believe that the audit evidence obtained by us is sufficient and appropriate to provide a basis for our audit opinion on the standalone Ind AS financial statements.
OpinionIn our opinion and to the best of our information and according to the explanations given to us, the aforesaid standalone Ind AS financial statements give the information required by the Act in the manner so required and give a true and fair view in conformity with the Ind AS and other accounting principles generally accepted in India, of the state of affairs of the Company as at March 31, 2018, and its profit, total comprehensive income, its cash flows and the changes in equity for the year ended on that date.
Report on Other Legal and Regulatory Requirements1. As required by Section 143(3) of the Act, based on our audit
we report that:
a) We have sought and obtained all the information and explanations which to the best of our knowledge and belief were necessary for the purposes of our audit.
b) In our opinion, proper books of account as required by law have been kept by the Company so far as it appears from our examination of those books.
c) The Balance Sheet, the Statement of Profit and Loss including Other Comprehensive Income, the Cash Flow
Laurus Labs Limited
Annual Report 2017-1882

Statement and Statement of Changes in Equity dealt with by this Report are in agreement with the books of account.
d) In our opinion, the aforesaid standalone Ind AS financial statements comply with the Indian Accounting Standards prescribed under section 133 of the Act.
e) On the basis of the written representations received from the directors of the Company as on March 31, 2018 taken on record by the Board of Directors, none of the directors is disqualified as on March 31, 2018 from being appointed as a director in terms of Section 164(2) of the Act.
f) With respect to the adequacy of the internal financial controls over financial reporting of the Company and the operating effectiveness of such controls, refer to our separate Report in “Annexure A”. Our report expresses an unmodified opinion on the adequacy and operating effectiveness of the Company’s internal financial controls over financial reporting.
g) With respect to the other matters to be included in the Auditor’s Report in accordance with Rule 11 of the Companies (Audit and Auditors) Rules, 2014, as amended, in our opinion and to the best of our
information and according to the explanations given to us:
i. The Company has disclosed the impact of pending litigations on its financial position in its standalone Ind AS financial statements;
ii. The Company did not have any long-term contracts including derivative contracts for which there were any material foreseeable losses.
iii. There were no amounts which were required to be transferred to the Investor Education and Protection Fund by the Company.
2. As required by the Companies (Auditor’s Report) Order, 2016 (“the Order”) issued by the Central Government in terms of Section 143(11) of the Act, we give in “Annexure B” a statement on the matters specified in paragraphs 3 and 4 of the Order.
For DELOITTE HASKINS & SELLS LLPChartered Accountants
(Firm’s Registration No. 117366W/W-100018)
P. R. RameshPlace: Hyderabad PartnerDate: May 10, 2018 (Membership No. 70928)
83Building Momentum
The Year in Review Statutory Reports Financial Statements

ANNEXURE “A” TO THE INDEPENDENT AUDITOR’S REPORT (Referred to in paragraph 1(f) under ‘Report on Other Legal and Regulatory Requirements’ section of our report of even date)
Report on the Internal Financial Controls Over Financial Reporting under Clause (i) of Sub-section 3 of Section 143 of the Companies Act, 2013 (“the Act”)
We have audited the internal financial controls over financial reporting of Laurus Labs Limited (“the Company”) as of March 31, 2018 in conjunction with our audit of the standalone Ind AS financial statements of the Company for the year ended on that date
Management’s Responsibility for Internal Financial ControlsThe Company’s management is responsible for establishing and maintaining internal financial controls based on the internal control over financial reporting criteria established by the Company considering the essential components of internal control stated in the Guidance Note on Audit of Internal Financial Controls Over Financial Reporting issued by the Institute of Chartered Accountants of India. These responsibilities include the design, implementation and maintenance of adequate internal financial controls that were operating effectively for ensuring the orderly and efficient conduct of its business, including adherence to company’s policies, the safeguarding of its assets, the prevention and detection of frauds and errors, the accuracy and completeness of the accounting records, and the timely preparation of reliable financial information, as required under the Companies Act, 2013.
Auditor’s ResponsibilityOur responsibility is to express an opinion on the Company's internal financial controls over financial reporting of the Company based on our audit. We conducted our audit in accordance with the Guidance Note on Audit of Internal Financial Controls Over Financial Reporting (the “Guidance Note”) issued by the Institute of Chartered Accountants of India and the Standards on Auditing prescribed under Section 143(10) of the Companies Act, 2013, to the extent applicable to an audit of internal financial controls. Those Standards and the Guidance Note require that we comply with ethical requirements and plan and perform the audit to obtain reasonable assurance about whether adequate internal financial controls over financial reporting was established and maintained and if such controls operated effectively in all material respects.
Our audit involves performing procedures to obtain audit evidence about the adequacy of the internal financial controls system over financial reporting and their operating effectiveness. Our audit of internal financial controls over financial reporting
included obtaining an understanding of internal financial controls over financial reporting, assessing the risk that a material weakness exists, and testing and evaluating the design and operating effectiveness of internal control based on the assessed risk. The procedures selected depend on the auditor’s judgement, including the assessment of the risks of material misstatement of the standalone Ind AS financial statements, whether due to fraud or error.
We believe that the audit evidence we have obtained is sufficient and appropriate to provide a basis for our audit opinion on the Company’s internal financial controls system over financial reporting.
Meaning of Internal Financial Controls Over Financial ReportingA company's internal financial control over financial reporting is a process designed to provide reasonable assurance regarding the reliability of financial reporting and the preparation of standalone Ind AS financial statements for external purposes in accordance with generally accepted accounting principles. A company's internal financial control over financial reporting includes those policies and procedures that (1) pertain to the maintenance of records that, in reasonable detail, accurately and fairly reflect the transactions and dispositions of the assets of the company; (2) provide reasonable assurance that transactions are recorded as necessary to permit preparation of standalone Ind AS financial statements in accordance with generally accepted accounting principles, and that receipts and expenditures of the company are being made only in accordance with authorisations of management and directors of the company; and (3) provide reasonable assurance regarding prevention or timely detection of unauthorised acquisition, use, or disposition of the company's assets that could have a material effect on the standalone Ind AS financial statements.
Inherent Limitations of Internal Financial Controls Over Financial ReportingBecause of the inherent limitations of internal financial controls over financial reporting, including the possibility of collusion or improper management override of controls, material misstatements due to error or fraud may occur and not be detected. Also, projections of any evaluation of the internal financial controls over financial reporting to future periods are
Laurus Labs Limited
Annual Report 2017-1884
subject to the risk that the internal financial control over financial reporting may become inadequate because of changes in conditions, or that the degree of compliance with the policies or procedures may deteriorate.
OpinionIn our opinion, to the best of our information and according to the explanations given to us, the Company has, in all material respects, an adequate internal financial controls system over financial reporting and such internal financial controls over financial reporting were operating effectively as at March 31, 2018, based on the criteria for internal financial control over
financial reporting established by the Company considering the essential components of internal control stated in the Guidance Note on Audit of Internal Financial Controls Over Financial Reporting issued by the Institute of Chartered Accountants of India.
For DELOITTE HASKINS & SELLS LLPChartered Accountants
(Firm’s Registration No. 117366W/W-100018)
P. R. RameshPlace: Hyderabad PartnerDate: May 10, 2018 (Membership No. 70928)
85Building Momentum
The Year in Review Statutory Reports Financial Statements

ANNEXURE “B” TO THE INDEPENDENT AUDITOR’S REPORT (Referred to in paragraph 2 under ‘Report on Other Legal and Regulatory Requirements’ section of our report of evendate)
(i) (a) The Company has maintained proper records showing full particulars, including quantitative details and situation of fixed assets.
(b) Some of the fixed assets were physically verified during the year by the Management in accordance with a programme of verification, which in our opinion provides for physical verification of all the fixed assets at reasonable intervals. According to the information and explanations given to us no material discrepancies were noticed on such verification.
(c) According to the information and explanations given to us and the records examined by us and based on the examination of the registered sale deed on property provided to us, we report that, the title deeds, comprising all the immovable properties of land and buildings which are freehold, are held in the name of the Company as at the balance sheet date. In respect of immovable properties of land and buildings that have been taken on lease, the lease agreements are in the name of the Company, where the Company is the lessee in the agreement.
(ii) As explained to us, the inventories were physically verified during the year by the Management at reasonable intervals and no material discrepancies were noticed on physical verification.
(iii) The Company has not granted any loans, secured or unsecured, to companies, firms, Limited Liability Partnerships or other parties covered in the register maintained under section 189 of the Companies Act, 2013.
(iv) In our opinion and according to the information and explanations given to us, the Company has complied with the provisions of Sections 185 and 186 of the Companies Act, 2013 in respect of grant of loans, making investments and providing guarantees and securities, as applicable.
(v) According to the information and explanations given to us, the Company has not accepted any deposit during the
year. There are no unclaimed deposits, in respect of which compliance with the provisions of Sections 73 to 76 or any other relevant provisions of the Companies Act, 2013 is required.
(vi) The maintenance of cost records has been specified by the Central Government under section 148(1) of the Companies Act, 2013 for manufacture of Active Pharma Ingredients. We have broadly reviewed the cost records maintained by the Company pursuant to the Companies (Cost Records and Audit) Rules, 2014, as amended prescribed by the Central Government under sub-section (1) of Section 148 of the Companies Act, 2013, and are of the opinion that, prima facie, the prescribed cost records have been made and maintained. We have, however, not made a detailed examination of the cost records with a view to determine whether they are accurate or complete.
(vii) According to the information and explanations given to us, in respect of statutory dues:
(a) The Company has generally been regular in depositing undisputed statutory dues, including Provident Fund, Employees’ State Insurance, Income-tax, Sales Tax, Service Tax, Customs Duty, Excise Duty, Value Added Tax, Goods and Services Tax, cess and other material statutory dues applicable to it to the appropriate authorities.
(b) There were no undisputed amounts payable in respect of Provident Fund, Employees’ State Insurance, Income-tax, Sales Tax, Service Tax, Customs Duty, Excise Duty, Value Added Tax, Goods and Services Tax, cess and other material statutory dues in arrears as at March 31, 2018 for a period of more than six months from the date they became payable.
(c) Details of dues of Income-tax, Sales Tax, Service Tax and Value Added Tax which have not been deposited as on March 31, 2018 on account of disputes are given below:
Name of Statute Nature of Dues Forum where Dispute is PendingPeriod to which the
Amount RelatesAmount Involved
(` million)Amount Unpaid
(` million)
The Income Tax Act, 1961
Income Tax Honorable High Court of Karnataka A.Y. 2008-09 10.10 3.05
The Finance Act, 1994
Service Tax CESTAT 2010-2015 99.78 96.042008-2009 0.49 0.49
AP VAT Act, 2005 Sales Tax High Court of Judicature at Hyderabad for the State of Telangana and State of Andhra Pradesh
2006-07 4.80 4.80
Sales Tax and VAT Appellate Tribunal, Telangana
2013-14 4.68 4.68
Laurus Labs Limited
Annual Report 2017-1886

(viii) In our opinion and according to the information and explanations given to us, the Company has not defaulted in the repayment of loans or borrowings to banks. The Company has not issued any debentures.
(ix) The Company has not raised moneys by way of initial public offer or further public offer (including debt instruments). The term loans have been applied by the Company during the year for the purposes for which they were raised
(x) To the best of our knowledge and according to the information and explanations given to us, no fraud by the Company and no material fraud on the Company by its officers or employees has been noticed or reported during the year.
(xi) In our opinion and according to the information and explanations given to us, the Company has paid / provided managerial remuneration in accordance with the requisite approvals mandated by the provisions of section 197 read with Schedule V to the Companies Act, 2013.
(xii) The Company is not a Nidhi Company and hence reporting under clause (xii) of the Order is not applicable.
(xiii) In our opinion and according to the information and explanations given to us the Company is in compliance with Section 177 and 188 of the Companies Act, 2013, where
applicable, for all transactions with the related parties and the details of related party transactions have been disclosed in the financial statements etc. as required by the applicable accounting standards.
(xiv) During the year the Company has not made any preferential allotment or private placement of shares or fully or partly convertible debentures and hence reporting under clause (xiv) of Order is not applicable to the Company.
(xv) In our opinion and according to the information and explanations given to us, during the year the Company has not entered into any non-cash transactions with its directors or directors of its holding, subsidiary or associate company or persons connected with them and hence provisions of section 192 of the Companies Act, 2013 are not applicable.
(xvi) The Company is not required to be registered under section 45-IA of the Reserve Bank of India Act, 1934.
For DELOITTE HASKINS & SELLS LLPChartered Accountants
(Firm’s Registration No. 117366W/W-100018)
P. R. RameshPlace: Hyderabad PartnerDate: May 10, 2018 (Membership No. 70928)
87Building Momentum
The Year in Review Statutory Reports Financial Statements

BALANCE SHEET as at March 31, 2018
Notes March 31, 2018 March 31, 2017
AssetsNon-current assets Property, plant and equipment 3 14,405.52 11,860.13 Capital work-in-progress 3 1,631.80 1,432.56 Intangible assets 4 71.39 72.42 Financial assets Investments 5A 517.42 505.25 Other financial assets 5C 226.44 200.93 Deferred tax assets (net) 6 486.52 634.61 Income tax assets (net) 16A 7.05 7.05 Other non-current assets 7A 439.97 449.42 Total non-current assets 17,786.11 15,162.37 Current assets Inventories 8 5,757.75 5,012.13 Financial assets Trade receivables 9 5,551.35 5,619.56 Cash and cash equivalents 10A 8.66 7.49 Other balances with banks 10B 0.53 16.68 Loans 5B 8.26 2.77 Other financial assets 5C 190.18 252.11 Other current assets 7B 774.90 652.40 Total current assets 12,291.63 11,563.14 Total assets 30,077.74 26,725.51 Equity and Liabilities Equity Equity share capital 11 1,060.30 1,057.56 Other equity 14,072.66 12,498.21 Total equity 15,132.96 13,555.77 LiabilitiesNon-current liabilities Financial liabilities Borrowings 13A 1,416.59 1,223.88 Provisions 15A 201.01 141.70 Other non-current liabilities 14A 646.97 630.72 Total non-current liabilities 2,264.57 1,996.30 Current liabilities Financial liabilities Borrowings 13B 7,260.57 6,150.58 Trade payables 13C 3,068.10 2,988.00 Current maturities and other financial liabilities 13D 1,466.99 1,313.22 Other current liabilities 14B 837.14 583.07 Provisions 15B 44.58 46.81 Income tax liabilities (net) 16B 2.83 91.76 Total current liabilities 12,680.21 11,173.44 Total - equity and liabilities 30,077.74 26,725.51 Summary of significant accounting policies 2.1
The accompanying notes are an integral part of the financial statements.As per our report of even date
For Deloitte Haskins & Sells LLP For and on behalf of the Board of Directors Chartered Accountants LAURUS LABS LIMITED ICAI FirmRegistration Number :117366W/W-100018
P. R. Ramesh Dr. C. Satyanarayana V. V. Ravi Kumar Partner Membership No. 70928
Whole Time Director & Chief Executive Officer DIN: 00211921
Executive Director & Chief Financial Officer DIN: 01424180
Place: Hyderabad Place: Hyderabad G. Venkateswar Reddy Date: May 10, 2018 Date: May 10, 2018 Company Secretary
(All amounts in Million Rupees except for share data or as otherwise stated)
Laurus Labs Limited
Annual Report 2017-1888

The accompanying notes are an integral part of the financial statements.As per our report of even date
For Deloitte Haskins & Sells LLP For and on behalf of the Board of Directors Chartered Accountants LAURUS LABS LIMITED ICAI FirmRegistration Number :117366W/W-100018
P. R. Ramesh Dr. C. Satyanarayana V. V. Ravi Kumar Partner Membership No. 70928
Whole Time Director & Chief Executive Officer DIN: 00211921
Executive Director & Chief Financial Officer DIN: 01424180
Place: Hyderabad Place: Hyderabad G. Venkateswar Reddy Date: May 10, 2018 Date: May 10, 2018 Company Secretary
Notes For the year ended
March 31, 2018 For the year ended
March 31, 2017
I. INCOME Revenue from operations 17 20,392.88 19,183.17 Other income 18 281.28 304.59 Total income ( I ) 20,674.16 19,487.76
II. EXPENSES Cost of materials consumed 19 10,544.97 10,156.83 Purchase of traded goods 270.15 129.60 Changes in inventories of finished goods, work-in-progress and stock-in-trade 20 (251.05) (360.79)Excise duty 124.46 263.94 Employee benefits expenses 21 2,381.40 1,957.94 Other expenses 22 3,235.49 2,897.41 Total expenses ( II ) 16,305.42 15,044.93
III. Earnings before Interest, Tax, Depreciation and Amortisation (EBITDA) (I-II) 4,368.74 4,442.83 Depreciation and amortisation 3 & 4 1,212.34 1,037.75 Finance income 23A (7.07) (14.85)Finance costs 23B 754.40 969.73
IV. Profit Before Tax 2,409.07 2,450.20 V. Tax Expense 27
Current tax 531.09 533.09 Adjustment of tax relating to earlier years (1.40) - Deferred tax 131.24 (66.65)Adjustment of deferred tax relating to earlier years 16.75 (15.83)Income tax expense 677.68 450.61
VI. Profit for the year (IV-V) 1,731.39 1,999.59 Other comprehensive income (OCI) 24Items that will not be reclassified subsequently to profit or loss: Re-measurement gains / (losses) on employee defined benefit plans 0.28 (9.92)Deferred tax credit (0.10) 3.43 Total other comprehensive income for the year, net of tax 0.18 (6.49)Total comprehensive income for the year, net of tax 1,731.57 1,993.10 Earnings per equity share ` 10/- each fully paid (March 31, 2017: ` 10/- each fully paid)
25
Computed on the basis of total profit for the year Basic (`) 16.35 21.85 Diluted (`) 16.28 21.85 Summary of significant accounting policies 2.1
STATEMENT OF PROFIT AND LOSS for the year ended March 31, 2018
(All amounts in Million Rupees except for share data or as otherwise stated)
89Building Momentum
The Year in Review Statutory Reports Financial Statements

STATEMENT OF CHANGES IN EQUITY for the year ended March 31, 2018
a. Equity share capitalEquity shares of ` 10 each, fully paid up No. `
As at April 01, 2016 15,767,255 157.67 Issued during the year - ESOP 118,500 1.19 Converted from preference shares to equity shares 8,889,846 88.90 Issue of bonus shares 73,971,303 739.71 Issue of equity shares - IPO 7,009,345 70.09 As at March 31, 2017 105,756,249 1,057.56 Issued during the year - ESOP 273,500 2.74 As at March 31, 2018 106,029,749 1,060.30 0.001% Compulsorily convertible participatory cumulative preference shares - Series A of ` 10/- each fully paid up
No. `
As at April 01, 2016 2,259,060 22.59 Converted during the year (2,259,060) (22.59) As at March 31, 2017 - - Changes during the year - - As at March 31, 2018 - - 0.001% Compulsorily convertible participatory cumulative preference shares - Series B of ` 243/- each fully paid up
No. `
As at April 01, 2016 2,477,387 602.01 Converted during the year (2,477,387) (602.01) As at March 31, 2017 - - Changes during the year - - As at March 31, 2018 - - 0.001% Compulsorily convertible participatory cumulative preference shares - Series C of ` 10/- each fully paid up
No. `
As at April 01, 2016 4,153,399 41.53 Converted during the year (4,153,399) (41.53) As at March 31, 2017 - - Changes during the year - - As at March 31, 2018 - -
b. Other equityReserves and surplus
TotalCapital reserve
Securities Premium
Share based payments reserve
Retained Earnings
As at April 01, 2016 17.92 4,070.93 26.58 3,784.51 7,899.94 Profit for the year - - - 1,999.59 1,999.59 Other comprehensive income (refer note no. 24) - - - (6.49) (6.49)Total comprehensive income 17.92 4,070.93 26.58 5,777.61 9,893.04 Transferred from stock options outstanding - 5.94 (5.94) - - Expense arising from equity-settled share-based
payment transactions - - 37.89 - 37.89
- Premium on conversion of CCPS - 577.23 - - 577.23 - Premium on IPO Allotment (net of share issue
expenses) (refer note no. 43) - 2,789.15 - - 2,789.15
- Issue of bonus shares - (739.71) - - (739.71) Final dividend to equity and preference shareholders - Final dividend on equity shares (refer note no. 12) - - - (31.53) (31.53) - Tax on final dividend on equity shares - - - (6.42) (6.42) - Final dividend on CCPCPS - Series A, Series B and
Series C (refer note no. 12) - - - (17.81) (17.81)
- Tax on proposed dividend on CCPCPS - Series A, Series B and Series C
- - - (3.63) (3.63)
(All amounts in Million Rupees except for share data or as otherwise stated)
Laurus Labs Limited
Annual Report 2017-1890

Reserves and surplus
TotalCapital reserve
Securities Premium
Share based payments reserve
Retained Earnings
As at March 31, 2017 17.92 6,703.54 58.53 5,718.22 12,498.21 Profit for the year - - - 1,731.39 1,731.39 Expense arising from equity-settled share-based
payment transactions - - 33.55 - 33.55
Transferred from stock options outstanding - 33.78 (33.53) - 0.25 - Final dividend on equity shares (158.63) (158.63) - Tax on final dividend on equity shares (32.29) (32.29) Other comprehensive income (refer note no. 24) - - - 0.18 0.18 As at March 31, 2018 17.92 6,737.32 58.55 7,258.87 14,072.66
b. Other equity (Contd.)
(All amounts in Million Rupees except for share data or as otherwise stated)
The accompanying notes are an integral part of the financial statements.As per our report of even date
For Deloitte Haskins & Sells LLP For and on behalf of the Board of Directors Chartered Accountants LAURUS LABS LIMITED ICAI FirmRegistration Number :117366W/W-100018
P. R. Ramesh Dr. C. Satyanarayana V. V. Ravi Kumar Partner Membership No. 70928
Whole Time Director & Chief Executive Officer DIN: 00211921
Executive Director & Chief Financial Officer DIN: 01424180
Place: Hyderabad Place: Hyderabad G. Venkateswar Reddy Date: May 10, 2018 Date: May 10, 2018 Company Secretary
91Building Momentum
The Year in Review Statutory Reports Financial Statements

STATEMENT OF CASH FLOWS for the year ended March 31, 2018
Particulars For the year ended
March 31, 2018 For the year ended
March 31, 2017
Profit before tax 2,409.07 2,450.20 Cash Flows from operating activitiesAdjustments for : Depreciation of property, plant and equipment 1,183.18 1,013.18 Amortisation of intangible assets 29.16 24.57 Loss on sale of fixed assets (net) 5.20 4.38 Finance income (7.07) (14.85) Interest expense 721.30 903.31 Share based payment expense 33.55 37.89 Net loss/ (gain) on foreign exchange fluctuations (unrealised) 85.35 (52.74) Provisions no longer required written back 37.41 - Allowance for/ (Reversal of) bad and doubtful advance and debts 9.30 37.25 Profit on sale of investment - (3.00) Provision for insurance claim receivable - (26.81) Gratuity and compensated absences 57.79 32.50 Operating profit before working capital changes 4,564.24 4,405.88 Movement in working capital: Increase in inventories (728.37) (138.36) (Increase)/ (Decrease) in trade receivables 119.14 (1,227.93) Increase in financial and non-financial assets (211.61) (370.95) Increase in trade payables 457.13 70.53 Increase in financial, non-financial liabilities and provisions 104.13 970.70 Cash generated from operations 4,304.66 3,709.87 Income tax paid (618.63) (501.06)Net cash flows from operating activities (A) 3,686.03 3,208.81 Cash flows used in investing activities Purchase of property, plant and equipment, including intangible assets, capital work in progress and
capital advances (3,810.53) (2,705.67)
Proceeds from sale of property, plant and equipment 4.28 0.93 Proceeds from sale of investments in deposits 60.38 106.43 Purchase of investments - (27.30) Investment in subsidiaries (12.17) (209.96) Acquisition of Business combinations (refer note no. 42) (423.79) - Net cash inflow on disposal of subsidiary - 3.00 Interest received 7.07 14.85 Net cash flows used in investing activities (B) (4,174.76) (2,817.72)Net cash flows from financing activities Proceeds from issue of equity shares (net of share issue expenses: ` nil (March 31, 2017: ` 137.86) - 2,859.24 Proceeds from exercise of employee stock options 2.74 1.19 Repayment of long - term borrowings (1,011.39) (4,360.33) Proceeds from long - term borrowings 1,313.38 572.56 Proceeds from short - term borrowings (net) 1,097.68 1,436.00 Dividend paid (158.63) (49.34) Tax on dividend (32.29) (10.05) Interest paid (721.59) (922.41)Net cash flows from/(used in) financing activities (C) 489.90 (473.14)
(All amounts in Million Rupees except for share data or as otherwise stated)
Laurus Labs Limited
Annual Report 2017-1892

Particulars For the year ended
March 31, 2018 For the year ended
March 31, 2017
Net increase/(decrease) in cash and cash equivalents (A+B+C) 1.17 (82.05)Cash and cash equivalents at the beginning of the year 7.49 89.54 Cash and cash equivalents at the year end 8.66 7.49 Components of cash and cash equivalents: Cash on hand 2.11 2.12 Balances with banks On current accounts 6.55 5.37 Total cash and cash Equivalents 8.66 7.49
(All amounts in Million Rupees except for share data or as otherwise stated)
The accompanying notes are an integral part of the financial statements.As per our report of even date
For Deloitte Haskins & Sells LLP For and on behalf of the Board of Directors Chartered Accountants LAURUS LABS LIMITED ICAI FirmRegistration Number :117366W/W-100018
P. R. Ramesh Dr. C. Satyanarayana V. V. Ravi Kumar Partner Membership No. 70928
Whole Time Director & Chief Executive Officer DIN: 00211921
Executive Director & Chief Financial Officer DIN: 01424180
Place: Hyderabad Place: Hyderabad G. Venkateswar Reddy Date: May 10, 2018 Date: May 10, 2018 Company Secretary
93Building Momentum
The Year in Review Statutory Reports Financial Statements

(All amounts in Million Rupees except for share data or as otherwise stated)
NOTES to financial statements for the year ended March 31, 2018
1. Corporate information Laurus Labs Limited (the “Company”) offers a broad and
integrated portfolio of Active Pharma Ingredients (API) including intermediates, Generic Finished dosage forms (FDF) and Contract Research services to cater to the needs of the global pharmaceutical industry. The Company is a public company domiciled in India and is incorporated under the provisions of the Companies Act applicable in India. Its shares are listed on two recognised stock exchanges in India. The registered office of the company is located at Plot no. 21, Jawaharlal Nehru Pharma city, Parawada, Vishakapatnam, Andhra Pradesh, India - 531201.
The Company is equipped with an Active Pharma Ingredients (API) manufacturing facilities situated in Jawaharlal Nehru Pharma City at Visakhapatnam, FDF drug manufacturing facility situated in Achutapuram and a Research and Development Centre in IKP Knowledge Park at Hyderabad.
These financial statements are authorised by the Board of Directors for issue in accordance with their resolution dated May 10, 2018.
2. Significant accounting policies 2.1 Basis of preparation (a) The financial statements of the Company have been
prepared in accordance with Indian Accounting Standards ('Ind AS'), under the historical cost convention on the accrual basis except for certain financial instruments which are measured at fair values, the provisions of the Companies Act, 2013 ('the Act') (to the extent notified) and guidelines issued by Securities and Exchange Board of India (SEBI). The Ind AS are prescribed under Section 133 of the Act read with Rule 3 of the Companies (Indian Accounting Standards) Rules, 2015 and relevant amendment rules issued there after.
For all periods up to and including the year ended March 31, 2016, the Company had prepared its financial statements in accordance accounting standards notified under the section 133 of the Companies Act 2013, read together with paragraph 7 of the Companies (Accounts) Rules, 2014 ('Indian GAAP'). Effective April 1, 2016, the Company has adopted all the Ind AS standards and the adoption was carried out in accordance with Ind AS 101 First time adoption of Indian Accounting Standards, with April 1, 2015 as the transition date.
Amounts for the year ended and as at March 31, 2017 were audited by previous auditors - S R Batliboi & Associates LLP.
2.2 Summary of significant accounting policies (a) Current versus non-current classification The Company presents assets and liabilities in
the balance sheet based on current/ non-current
classification. An asset is treated as current when it is:
Expected to be realised or intended to be sold or consumed in normal operating cycle
Held primarily for the purpose of trading
Expected to be realised within twelve months after the reporting period, or
Cash or cash equivalent unless restricted from being exchanged or used to settle a liability for at least twelve months after the reporting period
All other assets are classified as non-current.
A liability is current when:
It is expected to be settled in normal operating cycle
It is held primarily for the purpose of trading
It is due to be settled within twelve months after the reporting period, or
There is no unconditional right to defer the settlement of the liability for at least twelve months after the reporting period
The Company classifies all other liabilities as non-current.
Deferred tax assets and liabilities are classified as non-current assets and liabilities.
The operating cycle is the time between the acquisition of assets for processing and their realisation in cash and cash equivalents. The Company has identified twelve months as its operating cycle.
(b) Foreign currencies The financial statements are presented in Indian
rupees, which is the functional currency of the Company and the currency of the primary economic environment in which the Company operates.
Transactions and balances Transactions in foreign currencies are initially recorded
by the Company at its functional currency spot rates at the date the transaction first qualifies for recognition. Monetary assets and liabilities denominated in foreign currencies are translated at the functional currency spot rates of exchange at the reporting date.
Exchange differences arising on settlement or translation of monetary items are recognised in Statement of Profit and Loss.
Laurus Labs Limited
Annual Report 2017-1894

(All amounts in Million Rupees except for share data or as otherwise stated)
NOTES to financial statements for the year ended March 31, 2018
(c) Fair value measurement The Company measures financial instruments, such as,
derivatives at fair value at each balance sheet date.
Fair value is the price that would be received to sell an asset or paid to transfer a liability in an orderly transaction between market participants at the measurement date. The fair value measurement is based on the presumption that the transaction to sell the asset or transfer the liability takes place either:
In the principal market for the asset or liability, or
In the absence of a principal market, in the most advantageous market for the asset or liability
The principal or the most advantageous market must be accessible by the Company.
The fair value of an asset or a liability is measured using the assumptions that market participants would use when pricing the asset or liability, assuming that market participants act in their economic best interest.
A fair value measurement of a non-financial asset takes into account a market participant’s ability to generate economic benefits by using the asset in its highest and best use or by selling it to another market participant that would use the asset in its highest and best use.
The Company uses valuation techniques that are appropriate in the circumstances and for which sufficient data are available to measure fair value, maximising the use of relevant observable inputs and minimising the use of unobservable inputs
All assets and liabilities for which fair value is measured or disclosed in the financial statements are categorised within the fair value hierarchy, described as follows, based on the lowest level input that is significant to the fair value measurement as a whole:
Level 1 : Quoted (unadjusted) market prices in active markets for identical assets or liabilities
Level 2 : Valuation techniques for which the lowest level input that is significant to the fair value measurement is directly or indirectly observable
Level 3 : Valuation techniques for which the lowest level input that is significant to the fair value measurement is unobservable
For assets and liabilities that are recognised in the financial statements on a recurring basis, the Company determines whether transfers have occurred between
levels in the hierarchy by re-assessing categorisation (based on the lowest level input that is significant to the fair value measurement as a whole) at the end of each reporting period.
The Company's chief financial officer and the financial controller of the Company determines the appropriate valuation techniques and inputs for fair value measurements. In estimating the fair value of an asset or a liability, the Company uses market-observable data to the extent it is available. Where level 1 inputs are not available, the Company engages third party qualified valuers to perform the valuation. Any change in the fair value of each asset and liability is also compared with relevant external sources to determine whether the change is reasonable.
For the purpose of fair value disclosures, the Company has determined classes of assets and liabilities on the basis of the nature, characteristics and risks of the asset or liability and the level of the fair value hierarchy as explained above.
(d) Revenue recognition Revenue is recognised to the extent that it is probable
that the economic benefits will flow to the Company and the revenue can be reliably measured, regardless of when the payment is being made. Revenue is measured at the fair value of the consideration received or receivable, taking into account contractually defined terms of payment and excluding taxes or duties collected on behalf of the government. The Company has concluded that it is the principal in all of its revenue arrangements since it is the primary obligor in all the revenue arrangements as it has pricing latitude and is also exposed to inventory and credit risks.
The specific recognition criteria described below must also be met before revenue is recognised.
Sale of products Revenue from sale of goods is recognised when all
the significant risks and rewards of ownership of the goods have been passed to the buyer, usually on delivery of the goods and acceptance by the buyer. Any additional amount based on the terms of the agreement entered into with customers, is recognised in the period when the collectability of the profit share becomes probable and a reliable measure of the profit share is available. Revenue from the sale of goods is measured at the fair value of the consideration received or receivable, net of returns and allowances, trade discounts and volume rebates.
Based on the Educational Material on Ind AS 18 issued by the ICAI, the Company has assumed that recovery of excise duty flows to the Company on its
95Building Momentum
The Year in Review Statutory Reports Financial Statements
(All amounts in Million Rupees except for share data or as otherwise stated)
NOTES to financial statements for the year ended March 31, 2018
own account. This is for the reason that it is a liability of the manufacturer which forms part of the cost of production, irrespective of whether the goods are sold or not. Since the recovery of excise duty flows to the Company on its own account, revenue includes excise duty.
However, sales tax/ value added tax (VAT) is not received by the Company on its own account. Rather, it is tax collected on value added to the commodity by the seller on behalf of the government. Accordingly, it is excluded from revenue.
The Government of India introduced the Goods and Services Tax (GST) with effect from July 01, 2017. Accordingly, in compliance with Indian Accounting Standard (Ind AS) 18 - 'Revenue', Revenue from operations for for the year ended March 31, 2018 includes Excise duty up to June 30, 2017. Revenue from operations of earlier periods included Excise duty which is now subsumed in GST.
Sale of services Revenue from contract research operations is
recognised based on services performed till date as a percentage of total services. The agreed milestones are specified in the contracts with customers which determine the total services to be performed.
Interest income For all debt financial instruments measured either
at amortised cost or at fair value through other comprehensive income, interest income is recorded using the effective interest rate (EIR). EIR is the rate that exactly discounts the estimated future cash payments or receipts over the expected life of the financial instrument or a shorter period, where appropriate, to the gross carrying amount of the financial asset or to the amortised cost of a financial liability. Interest income is included in finance income in the Statement of Profit and Loss.
Dividends Revenue is recognised when the Company’s right to
receive the payment is established, which is generally when shareholders approve the dividend.
(e) Government grants Government grants are recognised where there is
reasonable assurance that the grant will be received and all attached conditions will be complied with. When the grant relates to an expense item, it is recognised as income on a systematic basis over the periods that the related costs, for which it is intended to compensate, are expensed. When the grant relates to an asset, it is recognised as income in equal amounts over the expected useful life of the related asset.
Export incentives are recognised as income when the right to receive credit as per the terms of the scheme is established in respect of the exports made and where there is no significant uncertainty regarding the ultimate collection of the relevant export proceeds.
(f) Taxes Current income tax Current income tax assets and liabilities are measured
at the amount expected to be recovered from or paid to the taxation authorities. The tax rates and tax laws used to compute the amount are those that are enacted or substantively enacted, at the reporting date in the countries where the Company operates and generates taxable income. Current income tax relating to items recognised outside profit or loss is recognised outside profit or loss (either in other comprehensive income or in equity). Current tax items are recognised in correlation to the underlying transaction either in OCI or directly in equity.
Management periodically evaluates positions taken in the tax returns with respect to situations in which applicable tax regulations are subject to interpretation and establishes provision where appropriate.
Deferred tax Deferred tax is provided using the liability method on
temporary differences between the tax bases of assets and liabilities and their carrying amounts for financial reporting purposes at the reporting date.
Deferred tax liabilities are recognised for all taxable temporary differences.
Deferred tax assets are recognised for all deductible temporary differences, the carry forward of unused tax credits and any unused tax losses. Deferred tax assets are recognised to the extent that it is probable that taxable profit will be available against which the deductible temporary differences, and the carry forward of unused tax credits and unused tax losses can be utilized.
The carrying amount of deferred tax assets is reviewed at each reporting date and reduced to the extent that it is no longer probable that sufficient taxable profit will be available to allow all or part of the deferred tax asset to be utilised. Unrecognised deferred tax assets are re-assessed at each reporting date and are recognised to the extent that it has become probable that future taxable profits will allow the deferred tax asset to be recovered.
Deferred tax assets and liabilities are measured at the tax rates that are expected to apply in the year when the asset is realised or the liability is settled, based
Laurus Labs Limited
Annual Report 2017-1896

(All amounts in Million Rupees except for share data or as otherwise stated)
NOTES to financial statements for the year ended March 31, 2018
on tax rates and tax laws that have been enacted or substantively enacted at the reporting date.
Deferred tax relating to items recognised outside profit or loss is recognised outside profit or loss (either in other comprehensive income or in equity). Deferred tax items are recognised in correlation to the underlying transaction either in OCI or directly in equity.
Deferred tax assets and deferred tax liabilities are offset if a legally enforceable right exists to set off current tax assets against current tax liabilities and the deferred taxes relate to the same taxable entity and the same taxation authority.
Minimum alternate tax (MAT) paid in a year is charged to the Statement of Profit and Loss as current tax. The Company recognises MAT credit available as an asset only to the extent that there is convincing evidence that the Company will pay normal income tax during the specified period, i.e., the period for which MAT credit is allowed to be carried forward. The Company reviews the “MAT credit entitlement” asset at each reporting date and writes down the asset to the extent the Company does not have convincing evidence that it will pay normal tax during the specified period.
(g) Property, plant and equipment Under the previous GAAP (Indian GAAP), property,
plant and equipment and capital wok in progress were carried in the balance sheet at cost of acquisition. The Company has elected to regard those values of property, plant and equipment as deemed cost at the date of the acquisition since there is no change in the functional currency as at 1 April 2015 (date of transition to Ind AS) on the date of transition to Ind AS. The Company has also determined that cost of acquisition or construction at deemed cost as at 1 April 2015 .
Capital work-in progress, Property, plant and equipment is stated at cost, net of accumulated depreciation and accumulated impairment losses, if any. Such cost includes the cost of replacing part of the plant and equipment and borrowing costs for long-term construction projects if the recognition criteria are met. When significant parts of plant and equipment are required to be replaced at intervals, the Company depreciates them separately based on their specific useful lives. Likewise, when a major inspection is performed, its cost is recognised in the carrying amount of the plant and equipment as a replacement if the recognition criteria are satisfied. All other expenses on existing property, plant and equipment, including day-to-day repair and maintenance expenditure and cost of replacing parts, are charged to the statement of profit and loss for the period during which such expenses are incurred.
Subsequent expenditure related to an item of property, plant and equipment is added to its book value only if it increases the future benefits from the existing asset beyond its previously assessed standard of performance or extends its estimated useful life.
Depreciation is calculated on a straight-line basis over the estimated useful lives of the assets as follows:
Factory buildings : 30 yearsOther buildings : 60 yearsPlant and equipment : 5 to 20 yearsFurniture and fixtures : 10 yearsVehicles : 5 yearsComputers : 3 to 6 years
The Company, based on technical assessment and management estimate, depreciates certain items of plant and equipment and vehicles over estimated useful lives which are different from the useful life prescribed in Schedule II to the Companies Act, 2013. The management believes that these estimated useful lives are realistic and reflect fair approximation of the period over which the assets are likely to be used.
An item of property, plant and equipment and any significant part initially recognised is derecognised upon disposal or when no future economic benefits are expected from its use or disposal. Any gain or loss arising on derecognition of the asset (calculated as the difference between the net disposal proceeds and the carrying amount of the asset) is included in the Statement of Profit and Loss when the asset is derecognised.
The residual values, useful lives and methods of depreciation of property, plant and equipment are reviewed at each financial year end and adjusted prospectively, if appropriate.
(h) Intangible assets Computer Software Costs relating to software, which is acquired, are
capitalised and amortised on a straight-line basis over their estimated useful lives of five years.
Gains or losses arising from derecognition of an intangible asset are measured as the difference between the net disposal proceeds and the carrying amount of the asset and are recognised in the Statement of Profit and Loss when the asset is derecognised.
On transition to Ind AS, the Company has elected to continue with the carrying value of all of its intangible assets recognised as at April 01, 2015, measured as
97Building Momentum
The Year in Review Statutory Reports Financial Statements

(All amounts in Million Rupees except for share data or as otherwise stated)
NOTES to financial statements for the year ended March 31, 2018
per the previous GAAP, and use that carrying value as the deemed cost of such intangible assets.
Amortisation method, useful lives and residual values are reviewed at the end of each financial year and adjusted if appropriate.
(i) Leases The determination of whether an arrangement is
(or contains) a lease is based on the substance of the arrangement at the inception of the lease. The arrangement is, or contains, a lease if fulfillment of the arrangement is dependent on the use of a specific asset or assets and the arrangement conveys a right to use the asset or assets, even if that right is not explicitly specified in an arrangement.
Company as a lessee A lease is classified at the inception date as a finance
lease or an operating lease. A lease that transfers substantially all the risks and rewards incidental to ownership to the Company is classified as a finance lease.
Operating lease payments are recognised as an expense in the Statement of Profit and Loss on a straight-line basis over the lease term.
Company as a lessor Leases in which the Company does not transfer
substantially all the risks and rewards of ownership of an asset are classified as operating leases. Rental income from operating lease is recognised on a straight-line basis over the term of the relevant lease. Initial direct costs incurred in negotiating and arranging an operating lease are added to the carrying amount of the leased asset and recognised over the lease term on the same basis as rental income.
Leases are classified as finance leases when substantially all of the risks and rewards of ownership transfer from the Company to the lessee. Amounts due from lessees under finance leases are recorded as receivables at the Company’s net investment in the leases. Finance lease income is allocated to accounting periods so as to reflect a constant periodic rate of return on the net investment outstanding in respect of the lease.
(j) Borrowing costs Borrowing costs directly attributable to the acquisition,
construction or production of an asset that necessarily takes a substantial period of time to get ready for its intended use or sale are capitalised as part of the cost of the asset. All other borrowing costs are expensed in the period in which they occur. Borrowing costs consist of interest and other costs that an entity incurs in connection with the borrowing of funds. Borrowing
cost also includes exchange differences to the extent regarded as an adjustment to the borrowing costs.
(k) Inventories Inventories are valued at the lower of cost and net
realisable value. Cost is determined on weighted average basis.
Costs incurred in bringing each product to its present location and condition are accounted for as follows:
Raw materials: Materials and other items held for use in the production of inventories are not written down below cost if the finished products in which they will be incorporated are expected to be sold at or above cost. Cost includes cost of purchase and other costs incurred in bringing the inventories to their present location and condition.
Finished goods and work in progress: cost includes cost of direct materials and labour and a proportion of manufacturing overheads based on the normal operating capacity.
Traded goods: cost includes cost of purchase and other costs incurred in bringing the inventories to their present location and condition.
Stores, spares and packing materials are valued at the lower of cost and net realisable value.
Net realisable value is the estimated selling price in the ordinary course of business, less estimated costs of completion and the estimated costs necessary to make the sale.
(l) Impairment of non-financial assets The Company assesses, at each reporting date,
whether there is an indication that an asset may be impaired. If any indication exists, or when annual impairment testing for an asset is required, the Company estimates the asset’s recoverable amount. An asset’s recoverable amount is the higher of an asset’s or cash-generating unit’s (CGU) fair value less costs of disposal and its value in use. Recoverable amount is determined for an individual asset, unless the asset does not generate cash inflows that are largely independent of those from other assets or groups of assets. When the carrying amount of an asset or CGU exceeds its recoverable amount, the asset is considered impaired and is written down to its recoverable amount.
In assessing value in use, the estimated future cash flows are discounted to their present value using a pre-tax discount rate that reflects current market assessments of the time value of money and the risks specific to the asset. In determining fair value less
Laurus Labs Limited
Annual Report 2017-1898

(All amounts in Million Rupees except for share data or as otherwise stated)
NOTES to financial statements for the year ended March 31, 2018
costs of disposal, recent market transactions are taken into account. If no such transactions can be identified, an appropriate valuation model is used. These calculations are corroborated by valuation multiples, quoted share prices for publicly traded companies or other available fair value indicators.
The Company bases its impairment calculation on detailed budgets and forecast calculations, which are prepared separately for each of the Company’s CGUs to which the individual assets are allocated.
Impairment losses, including impairment on inventories, are recognised in the statement of profit and loss. An assessment is made at each reporting date to determine whether there is an indication that previously recognised impairment losses no longer exist or have decreased. If such indication exists, the Company estimates the asset’s or CGU’s recoverable amount. A previously recognised impairment loss is reversed only if there has been a change in the assumptions used to determine the asset’s recoverable amount since the last impairment loss was recognised. The reversal is limited so that the carrying amount of the asset does not exceed its recoverable amount, nor exceed the carrying amount that would have been determined, net of depreciation, had no impairment loss been recognised for the asset in prior periods/ years. Such reversal is recognised in the statement of profit or loss unless the asset is carried at a revalued amount, in which case, the reversal is treated as a revaluation increase.
(m) Provisions General Provisions are recognised when the Company has a
present obligation (legal or constructive) as a result of a past event, it is probable that an outflow of resources embodying economic benefits will be required to settle the obligation and a reliable estimate can be made of the amount of the obligation. When the Company expects some or all of a provision to be reimbursed, for example, under an insurance contract, the reimbursement is recognised as a separate asset, but only when the reimbursement is virtually certain. The expense relating to a provision is presented in the statement of profit and loss net of any reimbursement
If the effect of the time value of money is material, provisions are discounted using a current pre-tax rate that reflects, when appropriate, the risks specific to the liability. When discounting is used, the increase in the provision due to the passage of time is recognised as a finance cost.
(n) Retirement and other employee benefits Retirement benefit in the form of provident fund is a
defined contribution scheme. The Company has no
obligation, other than the contribution payable to the provident fund. The Company recognizes contribution payable to the provident fund scheme as an expense, when an employee renders the related service. If the contribution payable to the scheme for service received before the Balance Sheet date exceeds the contribution already paid, the deficit payable to the scheme is recognized as a liability after deducting the contribution already paid. If the contribution already paid exceeds the contribution due for services received before the Balance Sheet date, then excess is recognized as an asset to the extent that the pre-payment will lead to, for example, a reduction in future payment or a cash refund.
The Company operates a defined benefit gratuity plan in India, which requires contributions to be made to a separately administered fund by a third party.
The cost of providing benefits under the defined benefit plan is determined based on projected unit credit method.
Remeasurements, comprising of actuarial gains and losses, the effect of the asset ceiling, excluding amounts included in net interest on the net defined benefit liability and the return on plan assets (excluding amounts included in net interest on the net defined benefit liability), are recognised immediately in the Balance Sheet with a corresponding debit or credit to retained earnings through other comprehensive income ("OCI") in the period in which they occur. Remeasurements are not reclassified to Statement of Profit and Loss in subsequent periods.
Past service costs are recognised in profit or loss on the earlier of:
The date of the plan amendment or curtailment, and
The date that the Company recognises related restructuring costs
Net interest is calculated by applying the discount rate to the net defined benefit liability or asset. The Company recognises the following changes in the net defined benefit obligation as an expense in the statement of profit and loss:
Service costs comprising current service costs, past-service costs, gains and losses on curtailments and non-routine settlements; and
Net interest expense or income
The Company treats accumulated leaves which are to be settled after 12 months as a long-term employee
99Building Momentum
The Year in Review Statutory Reports Financial Statements

(All amounts in Million Rupees except for share data or as otherwise stated)
NOTES to financial statements for the year ended March 31, 2018
benefit and accumulated leaves which are to be settled in the next 12 months as a short-term employee benefit for measurement purposes. Such accumulated leaves are provided for based on an actuarial valuation using the projected unit credit method at the year-end. Actuarial gains/losses are immediately taken to the statement of profit and loss and are not deferred.
(o) Share-based payments Employees of the Company receive remuneration
in the form of share-based payments, whereby employees render services as consideration for equity instruments.
Equity-settled transactions The cost of equity-settled transactions is determined
by the fair value at the date when the grant is made using Black Scholes valuation model.
That cost is recognised, together with a corresponding increase in share-based payment (SBP) reserves in equity, over the period in which the performance and/or service conditions are fulfilled in employee benefits expense. The cumulative expense recognised for equity-settled transactions at each reporting date until the vesting date reflects the extent to which the vesting period has expired and the Company’s best estimate of the number of equity instruments that will ultimately vest. The statement of profit and loss expense or credit for a period represents the movement in cumulative expense recognised as at the beginning and end of that period and is recognised in employee benefits expense.
Service and non-market performance conditions are not taken into account when determining the grant date fair value of awards, but the likelihood of the conditions being met is assessed as part of the Company’s best estimate of the number of equity instruments that will ultimately vest. Market performance conditions are reflected within the grant date fair value.
The dilutive effect of outstanding options is reflected as additional share dilution in the computation of diluted earnings per share.
(p) Financial instruments A financial instrument is any contract that gives rise to
a financial asset of one entity and a financial liability or equity instrument of another entity.
Financial assets Initial recognition and measurement All financial assets are recognised initially at fair value
plus, in the case of financial assets not recorded at fair value through profit or loss, transaction costs that are attributable to the acquisition of the financial asset.
Purchases or sales of financial assets that require delivery of assets within a time frame established by regulation or convention in the market place (regular way trades) are recognised on the trade date, i.e., the date that the Company commits to purchase or sell the asset.
Subsequent measurement For purposes of subsequent measurement, a ‘debt
instrument’ is measured at the amortised cost if both the following conditions are met:
(a) The asset is held within a business model whose objective is to hold assets for collecting contractual cash flows, and
(b) Contractual terms of the asset give rise on specified dates to cash flows that are solely payments of principal and interest (SPPI) on the principal amount outstanding.
After initial measurement, such financial assets are subsequently measured at amortised cost using the effective interest rate (EIR) method. Amortised cost is calculated by taking into account any discount or premium on acquisition and fees or costs that are an integral part of the EIR. The EIR amortisation is included in finance income in the profit or loss. This category generally applies to trade and other receivables. For more information on receivables, refer to Note 9.
Derecognition A financial asset (or, where applicable, a part of a
financial asset or part of a group of similar financial assets) is primarily derecognised (i.e. removed from the Company’s balance sheet) when:
a) the rights to receive cash flows from the asset have expired, or
b) the Company has transferred its rights to receive cash flows from the asset or has assumed an obligation to pay the received cash flows in full without material delay to a third party under a 'pass-through' arrangement; and either
i. the Company has transferred substantially all the risks and rewards of the asset, or
ii. the Company has neither transferred nor retained substantially all the risks and rewards of the asset, but has transferred control of the asset.
When the Company has transferred its rights to receive cash flows from an asset or has entered into a pass-through arrangement, it evaluates if and to
Laurus Labs Limited
Annual Report 2017-18100

(All amounts in Million Rupees except for share data or as otherwise stated)
NOTES to financial statements for the year ended March 31, 2018
what extent it has retained the risks and rewards of ownership. When it has neither transferred nor retained substantially all of the risks and rewards of the asset, nor transferred control of the asset, the Company continues to recognise the transferred asset to the extent of the Company’s continuing involvement. In that case, the Company also recognises an associated liability. The transferred asset and the associated liability are measured on a basis that reflects the rights and obligations that the Company has retained.
Continuing involvement that takes the form of a guarantee over the transferred asset is measured at the lower of the original carrying amount of the asset and the maximum amount of consideration that the Company could be required to repay.
Impairment of financial assets In accordance with Ind AS 109, the Company
applies expected credit loss (ECL) model for measurement and recognition of impairment loss on the following financial assets and credit risk exposure:
a) Financial assets that are debt instruments, and are measured at amortised cost e.g., loans, depositsand bank balances.
b) Trade receivables that result from transactions that are within the scope of Ind AS 18.
The Company follows ‘simplified approach’ for recognition of impairment loss. The application of simplified approach does not require the Company to track changes in credit risk. Rather, it recognises impairment loss allowance based on lifetime ECLs at each reporting date, right from its initial recognition. For recognition of impairment loss on other financial assets and risk exposure, the Company determines that whether there has been a significant increase in the credit risk since initial recognition. If credit risk has not increased significantly, 12-month ECL is used to provide for impairment loss. However, if credit risk has increased significantly, lifetime ECL is used. If, in a subsequent period, credit quality of the instrument improves such that there is no longer a significant increase in credit risk since initial recognition, then the entity reverts to recognising impairment loss allowance based on 12-month ECL.
Lifetime ECL are the expected credit losses resulting from all possible default events over the expected life of a financial instrument. The
12-month ECL is a portion of the lifetime ECL which results from default events that are possible within 12 months after the reporting date.
ECL is the difference between all contractual cash flows that are due to the Company in accordance with the contract and all the cash flows that the entity expects to receive (i.e., all cash shortfalls), discounted at the original effective interest rate. When estimating the cash flows, an entity is required to consider:
All contractual terms of the financial instrument (including prepayment, extension and similar options) over the expected life of the financial instrument. However, in rare cases when the expected life of the financial instrument cannot be estimated reliably, then the entity is required to use the remaining contractual term of the financial instrument
Cash flows from the sale of collateral held or other credit enhancements that are integral to the contractual terms
As a practical expedient, the Company uses a provision matrix to determine impairment loss allowance on portfolio of its trade receivables. The provision matrix is based on its historically observed default rates over the expected life of the trade receivables and is adjusted for forward-looking estimates. At every reporting date, the historical observed default rates are updated and changes in the forward-looking estimates are analysed. On that basis, the Company estimates the following provision matrix at the reporting date:
Particulars% of provision on outstanding
receivables
> 1 year and < 2 years 25%> 2 years and < 3 years 50%> 3 years 100%
Financial liabilities Initial recognition and measurement Financial liabilities are classified, at initial recognition,
as financial liabilities at fair value through profit or loss, loans and borrowings, payables, or as derivatives designated as hedging instruments in an effective hedge, as appropriate.
All financial liabilities are recognised initially at fair value and, in the case of loans and borrowings and payables, net of directly attributable transaction costs.
payables, loans and borrowings including bank overdrafts, financial guarantee contracts and derivative financial instruments.
101Building Momentum
The Year in Review Statutory Reports Financial Statements

(All amounts in Million Rupees except for share data or as otherwise stated)
NOTES to financial statements for the year ended March 31, 2018
Subsequent measurement The measurement of financial liabilities depends on
their classification, as described below:
Financial liabilities at fair value through profit or loss
Financial liabilities at fair value through profit or loss include financial liabilities designated upon initial recognition as at fair value through profit or loss.
Financial liabilities designated upon initial recognition at fair value through profit or loss are designated as such at the initial date of recognition, and only if the criteria in Ind AS 109 are satisfied. For liabilities designated as FVTPL, fair value gains/ losses attributable to changes in own credit risk are recognized in OCI. These gains/ loss are not subsequently transferred to P&L. However, the Company may transfer the cumulative gain or loss within equity. All other changes in fair value of such liability are recognised in the statement of profit or loss. The Company has not designated any financial liability as at fair value through profit and loss.
Loans and borrowings After initial recognition, interest-bearing loans and
borrowings are subsequently measured at amortised cost using the EIR method. Gains and losses are recognised in profit or loss when the liabilities are derecognised as well as through the EIR amortisation process.
Amortised cost is calculated by taking into account any discount or premium on acquisition and fees or costs that are an integral part of the EIR. The EIR amortisation is included as finance costs in the statement of profit and loss.
Derecognition A financial liability is derecognised when the obligation
under the liability is discharged or cancelled or expires. When an existing financial liability is replaced by another from the same lender on substantially different terms, or the terms of an existing liability are substantially modified, such an exchange or modification is treated as the derecognition of the original liability and the recognition of a new liability. The difference in the respective carrying amounts is recognised in the statement of profit or loss.
Reclassification of financial assets The Company determines classification of financial
assets and liabilities on initial recognition. After initial recognition, no reclassification is made for financial assets which are equity instruments and financial liabilities. For financial assets which are debt instruments, a reclassification is made only if there is a change in the business model for managing those assets. Changes to the business model are expected to be infrequent. The Company’s senior management determines change in the business model as a result of external or internal changes which are significant to the Company’s operations. Such changes are evident to external parties. A change in the business model occurs when the Company either begins or ceases to perform an activity that is significant to its operations. If the Company reclassifies financial assets, it applies the reclassification prospectively from the reclassification date which is the first day of the immediately next reporting period following the change in business model. The Company does not restate any previously recognised gains, losses (including impairment gains or losses) or interest.
The following table shows various reclassification and how they are accounted for:
Original classification Revised classification Accounting treatment
Amortised cost FVTPL Fair value is measured at reclassification date. Difference between previous amortized cost and fair value is recognised in Statement of Profit and Loss.
FVTPL Amortised Cost Fair value at reclassification date becomes its new gross carrying amount. EIR is calculated based on the new gross carrying amount.
Amortised cost FVTOCI Fair value is measured at reclassification date. Difference between previous amortised cost and fair value is recognised in OCI. No change in EIR due to reclassification.
FVTOCI Amortised cost Fair value at reclassification date becomes its new amortised cost carrying amount. However, cumulative gain or loss in OCI is adjusted against fair value. Consequently, the asset is measured as if it had always been measured at amortised cost.
FVTPL FVTOCI Fair value at reclassification date becomes its new carrying amount. No other adjustment is required.
FVTOCI FVTPL Assets continue to be measured at fair value. Cumulative gain or loss previously recognized in OCI is reclassified to P&L at the reclassification date.
Offsetting of financial instruments Financial assets and financial liabilities are offset and the net amount is reported in the balance sheet if there is a currently
enforceable legal right to offset the recognised amounts and there is an intention to settle on a net basis, to realise the assets and settle the liabilities simultaneously.
Laurus Labs Limited
Annual Report 2017-18102

(All amounts in Million Rupees except for share data or as otherwise stated)
NOTES to financial statements for the year ended March 31, 2018
(q) Investments in subsidiaries and associates In respect of equity investments, the entity prepares
separate financial statements and account for its investments in subsidiaries and associates at cost.
(r) Derivative financial instruments The Company uses derivative financial instruments,
such as forward currency contracts to hedge its foreign currency risks. Such derivative financial instruments are initially recognised at fair value on the date on which a derivative contract is entered into and are subsequently re-measured at fair value. Derivatives are carried as financial assets when the fair value is positive and as financial liabilities when the fair value is negative.
The purchase contracts that meet the definition of a derivative under Ind-AS 109 are recognised in the Statement of Profit and Loss. Any gains or losses arising from changes in the fair value of derivatives are taken directly to profit or loss.
(s) Cash and cash equivalents Cash and cash equivalent in the balance sheet
comprise cash at banks and on hand and short-term deposits with an original maturity of three months or less, which are subject to an insignificant risk of changes in value.
For the purpose of the statement of cash flows, cash and cash equivalents consist of cash and short-term deposits, as defined above, net of outstanding bank overdrafts as they are considered an integral part of the Company’s cash management.
(t) Research and Development Revenue expenditure on research and development is
charged to revenue in the period in which it is incurred. Capital expenditure on research and development is added to property, plant and equipment and depreciated in accordance with the policies of the Company.
(u) Measurement of EBITDA The Company presents EBITDA in the statement of
profit or loss, which is neither specifically required by Ind AS 1 nor defined under Ind AS. Ind AS complaint Schedule III allows companies to present line items, sub-line items and sub-totals shall be presented as an addition or substitution on the face of the financial statements when such presentation is relevant to an understanding of the company’s financial position or performance or to cater to industry/sector-specific disclosure requirements or when required for compliance with the amendments to the Companies Act or under the Indian Accounting Standards. Accordingly, the Company has elected to present EBITDA as a separate line item on the face of the
statement of profit and loss and does not include depreciation and amortization expense, finance income, finance costs, share of profit/ loss from associate and tax expense in the measurement of EBITDA.
(v) New standards and interpretations not yet adopted
Appendix B to Ind AS 21, Foreign currency transactions and advance consideration:
On March 28, 2018, Ministry of Corporate Affairs (""MCA"") has notified the Companies (Indian Accounting Standards) Amendment Rules, 2018 containing Appendix B to Ind AS 21, Foreign currency transactions and advance consideration which clarifies the date of the transaction for the purpose of determining the exchange rate to use on initial recognition of the related asset, expense or income, when an entity has received or paid advance consideration in a foreign currency.
The amendment will come into force from April 1, 2018. The Company is evaluating the requirement of the amendment and the effect of the financial statements.
Ind AS 115- Revenue from Contract with Customers:
On March 28, 2018, Ministry of Corporate Affairs (""MCA"") has notified the Ind AS 115, Revenue from Contract with Customers. The core principle of the new standard is that an entity should recognize revenue to depict the transfer of promised goods or services to customers in an amount that reflects the consideration to which the entity expects to be entitled in exchange for those goods or services. Further the new standard requires enhanced disclosures about the nature, amount, timing and uncertainty of revenue and cash flows arising from the entity’s contracts with customers.
The standard permits two possible methods of transition:
(a) Retrospective approach - Under this approach the standard will be applied retrospectively to each prior reporting period presented in accordance with Ind AS 8 - Accounting Policies, Changes in Accounting Estimates and Errors.
(b) Retrospectively with cumulative effect of initially applying the standard recognised at the date of initial application (Cumulative catch - up approach)
The effective date for adoption of Ind AS 115 is financial periods beginning on or after April 1, 2018. The Company is evaluating the requirement of the amendment and the effect of the financial statements.
103Building Momentum
The Year in Review Statutory Reports Financial Statements

(All amounts in Million Rupees except for share data or as otherwise stated)
NOTES to financial statements for the year ended March 31, 2018
3. Property, plant and equipment
Particulars Freehold land Buildings Plant and
equipment Furniture and
Fixtures Computers Vehicles
Total Property, plant and
equipment
Gross carrying valueAs at April 01, 2016 803.46 3,421.66 6,376.78 168.33 71.43 61.70 10,903.36 Additions 66.27 971.20 1,582.98 97.91 17.56 67.05 2,802.97 Disposals - - (9.17) - - (22.04) (31.21)As at March 31, 2017 869.73 4,392.86 7,950.59 266.24 88.99 106.71 13,675.12 Additions 52.01 1,150.32 2,405.48 37.58 28.73 63.93 3,738.05 Disposals - - - - - (21.08) (21.08)As at March 31, 2018 921.74 5,543.18 10,356.07 303.82 117.72 149.56 17,392.09 DepreciationAs at April 01, 2016 - 112.16 665.31 28.52 16.42 5.30 827.71 Charge for the year - 151.52 784.62 36.15 18.54 22.35 1,013.18 Disposals - - (9.04) - - (16.86) (25.90)As at March 31, 2017 - 263.68 1,440.89 64.67 34.96 10.79 1,814.99 Charge for the year - 195.22 903.94 34.24 19.31 30.47 1,183.18 Disposals - - - - - (11.60) (11.60)As at March 31, 2018 - 458.90 2,344.83 98.91 54.27 29.66 2,986.57 Net carrying valueAs at April 01, 2016 803.46 3,309.50 5,711.47 139.81 55.01 56.40 10,075.65 As at March 31, 2017 869.73 4,129.18 6,509.70 201.57 54.03 95.92 11,860.13 As at March 31, 2018 921.74 5,084.28 8,011.24 204.91 63.45 119.90 14,405.52
Capital work-in-progress (including expenditure during construction period - note 41) : ` 1,631.80 (March 31, 2017: ` 1,432.56).
Estimated amount of contracts remaining to be executed on capital account and not provided for : ` 732.35 (March 31, 2017: ` 586.86) (Refer note 40b).
Includes expenditure during the construction period amounting to ` 0.69 (March 31,2017: ` 18.48 (Note 41)).
Pledge on Property, plant and equipment: Property, plant and equipment (other than vehicles) with a carrying amount of ` 14,285.62 (March 31, 2017: ` 11,008.18) are
subject to a pari passu first charge on the Company's term loans, except to the extent of plant & machinery exclusively charged towards term loan and buyers credit from ICICI Bank with a carrying amount of ` nil (March 31, 2017: ` 191.49). Further, the property, plant and equipment (other than vehicles) are subject to a pari passu second charge on the Company's current borrowings and SBI buyer's credit. Also, refer note 13A and 13B.
Vehicles with a carrying amount of ` 119.90 (March 31, 2017: ` 95.92) are hypothecated to respective banks against vehicle loans.
Laurus Labs Limited
Annual Report 2017-18104

(All amounts in Million Rupees except for share data or as otherwise stated)
NOTES to financial statements for the year ended March 31, 2018
4. Intangible assets
ParticularsComputer Software
purchased Total Intangible
Assets
Gross carrying valueAs at April 01, 2016 82.85 82.85 Additions 33.11 33.11 Disposals - - As at March 31, 2017 115.96 115.96 Additions 28.13 28.13 Disposals - - As at March 31, 2018 144.09 144.09 AmortisationAs at April 01, 2016 18.97 18.97 Charge for the year 24.57 24.57 Disposals - - As at March 31, 2017 43.54 43.54 Charge for the year 29.16 29.16 Disposals - - As at March 31, 2018 72.70 72.70 Net carrying valueAs at April 01, 2016 63.88 63.88 As at March 31, 2017 72.42 72.42 As at March 31, 2018 71.39 71.39
5. Financial assets
March 31, 2018 March 31, 2017
A. InvestmentsEquity instruments of subsidiaries 483.37 471.20 Others 34.05 34.05
517.42 505.25 Unquoted investments carried at costInvestments in subsidiary- 30,000 (March 31, 2017: 30,000) Equity Shares of US$ 100 each fully paid-up in Laurus Synthesis Inc.
189.26 189.26
- 14,203,363 (March 31, 2017:14,203,363) Equity Shares of ` 10 each of Sriam Labs Private Limited
281.94 281.94
- 1,350 (March 31, 2017: Nil ) Equity Shares of GBP 100 each fully paid-up in Laurus Holding Limited
12.17 -
483.37 471.20 Unquoted investments (valued at fair value through profit and loss) March 31, 2018 March 31, 2017 - 3,405,000 (March 31, 2017: 3,405,000) Equity Shares of ` 10 each of Atchutapuram Effluent Treatment Ltd (Refer note 42)
34.05 34.05
34.05 34.05 B. Loans
Current (unsecured, considered good unless otherwise stated) Other Loans-Loans to employees 8.26 2.77 Total 8.26 2.77
105Building Momentum
The Year in Review Statutory Reports Financial Statements

(All amounts in Million Rupees except for share data or as otherwise stated)
NOTES to financial statements for the year ended March 31, 2018
March 31, 2018 March 31, 2017
C. Other financial assetsNon-current (unsecured, considered good unless stated otherwise)Security deposits 114.96 103.38 Other balances with banks - 44.22 Export and other incentives receivable * 111.48 53.33 Total 226.44 200.93 Current (unsecured, considered good unless stated otherwise)Security deposits - 30.00 Export and other incentives receivable * 190.18 195.30 Insurance claim receivable - 26.81 Total 190.18 252.11
* Export and other incentives receivable has been recognized on the following: a) Incentive in the form of duty credit scrip upon sale of exports under Merchandise Exports from India Scheme under Foreign Trade Policy of India b) Sales tax incentive and reimbursement of power cost under the Andhra Pradesh state incentives IIPP 2015-20 scheme. There are no unfulfilled conditions or contingencies attached to these incentives.
Breakup of financial assets
March 31, 2018 March 31, 2017
Valued at fair value through profit or loss Investments 34.05 34.05 Total financial assets carried at fair value through profit or loss Valued at amortised cost
34.05 34.05
Loans 8.26 2.77 Other financial assets 416.62 453.04 Trade receivables 5,551.35 5,619.56 Cash and cash equivalents 8.66 7.49 Other balances with banks 0.53 16.68 Total financial assets carried at amortised cost 5,985.42 6,099.54
6. Deferred tax assets (net)
March 31, 2018 March 31, 2017
Deferred tax liability Income tax at the applicable rate on the difference between the aggregate book
written down value and tax written down value of property, plant and equipment (836.66) (541.47)
Income tax on deferred revenue on embedded leases (342.75) (396.20) (A) (1,179.41) (937.67)
Deferred tax asset MAT credit entitlement 1,546.39 1,467.37 Expenses allowable on payment basis 85.65 96.78 Other items giving raise to temporary differences 33.89 8.13
(B) 1,665.93 1,572.28 Deferred tax assets (net) (A+B) 486.52 634.61
Deferred tax assets/(liabilities): For the year ended March 31, 2018:
Opening Balance Recognised in
profit & loss
Recognised in other comprehensive
income Closing balance
Accelerated depreciation for tax purposes (541.47) (295.19) - (836.66)Deferred revenue on embedded leases (396.20) 53.45 - (342.75)MAT credit entitlement 1,467.37 79.02 - 1,546.39 Expenses allowable on payment basis 96.78 (11.13) - 85.65 Other items giving rise to temporary differences 8.13 25.86 (0.10) 33.89
634.61 (147.99) (0.10) 486.52
5. Financial assets (Contd.)
Laurus Labs Limited
Annual Report 2017-18106

(All amounts in Million Rupees except for share data or as otherwise stated)
NOTES to financial statements for the year ended March 31, 2018
For the year ended March 31, 2017:
Opening Balance Recognised in
profit & loss
Recognised in other comprehensive
income Closing balance
Accelerated depreciation for tax purposes (541.47) (295.19) - (836.66)Deferred revenue on embedded leases (396.20) 53.45 - (342.75)MAT credit entitlement 1,467.37 79.02 - 1,546.39 Expenses allowable on payment basis 96.78 (11.13) - 85.65 Other items giving rise to temporary differences 8.13 25.86 (0.10) 33.89
634.61 (147.99) (0.10) 486.52
The Company has accounted for deferred tax assets (net) of ` 486.52 (March 31, 2017: ` 634.61) based on approval of business plan by board, agreements entered with customers, orders on hand, fresh infusion of funds, successful patent filings and a portfolio of drugs.
During the year ended March 31, 2018, the Company has paid dividend to its shareholders. This has resulted in payment of Dividend Distribution Tax (DDT) to the taxation authorities. The Company believes that DDT represents additional payment to taxation authority on behalf of the shareholders. Hence, DDT paid is charged to equity.
7. Other assets
March 31, 2018 March 31, 2017
A) Non-current (unsecured, considered good unless otherwise stated) Capital advances 132.28 124.02 Advances recoverable in cash and kind 24.29 16.79 Prepayments 283.25 300.34 Balances with statutory/Government authorities 20.00 20.00 Deferred lease expenses - 1.32 Taxes paid under protest 4.44 3.74
464.26 466.21 Less: Allowance for doubtful advances (24.29) (16.79)Total 439.97 449.42
B) Current (unsecured, considered good unless otherwise stated) Advances recoverable in cash or kind 102.76 68.99 Loans and advances to related parties (Refer note 33) 116.07 392.35 Prepayments 94.08 70.27 Balances with statutory/Government authorities 460.18 118.83 Deferred lease expenses 0.68 0.98 Others 1.13 0.98 Total 774.90 652.40
8. Inventories
March 31, 2018 March 31, 2017
(At lower of cost and net realisable value) Raw materials [including port stock and stock-in-transit: ` 543.32 (March 31, 2017:
` 471.18)] (Refer note 43) 2,358.61 1,907.40
Work-in-progress 1,731.91 1,515.88 Finished goods 1,510.00 1,474.98 Stores, spares and packing materials 157.23 113.87 Total 5,757.75 5,012.13
107Building Momentum
The Year in Review Statutory Reports Financial Statements

(All amounts in Million Rupees except for share data or as otherwise stated)
NOTES to financial statements for the year ended March 31, 2018
9. Trade receivables
March 31, 2018 March 31, 2017
Unsecured Considered good * 5,551.35 5,619.56 Considered bad and doubtful 23.29 21.52
5,574.64 5,641.08 Less: Allowance for bad and doubtful receivables (23.29) (21.52)
5,551.35 5,619.56
* Includes ` 2.61 (March 31, 2017 ` nil) due from subsidiaries (refer note no. 33)
a) No trade or other receivables are due from directors or other officers of the Company either severally or jointly with any other person. Nor any trade or other receivables are due from firms or private companies respectively in which any director is a partner, a director or a member.
b) Trade receivables are non-interest bearing and are generally on terms of 30 - 90 days.
c) Of the trade receivables balance, ` 2,997.24 in aggregate (as at March 31, 2017 ` 3,380.44) is due from the Company's customers individually representing more than 5 % of the total trade receivables balance.
d) The Company has used practical expedient by computing the expected credit loss allowance for doubtful trade receivables based on a provision matrix. The provision matrix takes into account historical credit loss experience and adjusted for forward-looking estimates. The expected credit loss allowance is based on the ageing of the days the receivables are due and the rates used in the provision matrix.
Movement in the expected credit loss allowance March 31, 2018 March 31, 2017
Balance at the beginning of the year 21.52 - Movement in expected credit loss allowance on trade receivables 1.77 21.52 Balance at the end of the year 23.29 21.52
10. Cash and cash equivalents and other bank balances
March 31, 2018 March 31, 2017
A) Cash and cash equivalents Balances with banks - On current accounts 6.55 5.37 Cash on hand 2.11 2.12
8.66 7.49 B) Other balances with banks On deposit accounts - Remaining maturity for more than twelve months - 44.22 - Remaining maturity for less than twelve months 0.53 16.68
0.53 60.90 Less : Amount disclosed under other assets - (44.22)
0.53 16.68
Deposits with a carrying amount of ` 0.53 (March 31, 2017: ` 60.90) are towards margin money given for letter of credit and bank guarantees.
11. Equity share capital
March 31, 2018 March 31, 2017
Authorised 111,000,000 (March 31, 2017: 111,000,000) Equity shares of ` 10/- each 1,110.00 1,110.00 Total 1,110.00 1,110.00 Issued, Subscribed and Paid Up106,029,749 (March 31, 2017: 105,756,249) Equity share of ` 10/- each fully paid up 1,060.30 1,057.56 Total 1,060.30 1,057.56
Laurus Labs Limited
Annual Report 2017-18108

(All amounts in Million Rupees except for share data or as otherwise stated)
NOTES to financial statements for the year ended March 31, 2018
11.1. Reconciliation of the shares outstanding at the beginning and at the end of the reporting year
For the year ended March 31, 2018
For the year ended March 31, 2017
Equity Shares of ` 10 each, fully paid up No. ` No. ` Balance as per last financial statements 105,756,249 1,057.56 15,767,255 157.67 Issued during the year - ESOP 273,500 2.74 118,500 1.19 Converted from preference shares to equity shares - - 8,889,846 88.90 Issued during the year - Bonus shares - - 73,971,303 739.71 Issue of equity shares - IPO - - 7,009,345 70.09 Outstanding at the end of the year 106,029,749 1,060.30 105,756,249 1,057.56 0.001% Compulsorily convertible participatory cumulative Preference Shares - Series A of `10/- each fully paid up Balance as per last financial statements - - 2,259,060 22.59 Converted from preference shares to equity shares - - (2,259,060) (22.59) Outstanding at the end of the year - - - - 0.001% Compulsorily convertible participatory cumulative Preference shares - Series B of ` 243/- each fully paid up Balance as per last financial statements - - 2,477,387 602.01 Converted from preference shares to equity shares - - (2,477,387) (602.01) Outstanding at the end of the year - - - - 0.001% Compulsorily convertible participatory cumulative Preference Shares - Series C of ` 10/- each fully paid up Balance as per last financial statements - - 4,153,399 41.53 Converted from preference shares to equity shares - - (4,153,399) (41.53) Outstanding at the end of the year - - - -
11.2. Rights attached to equity shares The Company has only one class of equity shares having a
par value of ` 10/- per share. Each holder of equity shares is entitled to one vote per share at the general meetings of the Company. For liquidation terms and preferential rights refer note 11.3a.
The Company declares and pays dividends in Indian rupees. The dividend proposed by the Board of Directors is subject to the approval of shareholders in the ensuing Annual General Meeting.
During the year ended March 31, 2018, the amount of dividend per share declared as distribution to equity shareholders was ` 1.50 (March 31, 2017: ` 1.50).
11.3. Rights attached to preference shares 0.001% Compulsorily convertible participatory
cumulative Preference Shares - Series A of ` 10/- each fully paid up
During the year ended March 31, 2008, the Company issued 6,800,000 CCPCPS of ` 10/- each fully paid at a premium of ` 140 per share and also during the year ended March 31, 2009, 88,690 CCPCPS had been issued at par as part of the scheme of amalgamation of Aptuit Informatics India Private Limited with the Company. Each CCPCPS at
the option of the holder is convertible into one equity share or will automatically be converted into one equity share on the twentieth anniversary of the initial issuance. For Liquidation terms and preferential rights refer note 11.3a.
During the year ended March 31, 2012, the preference share holder converted 4,629,630 CCPCPS into equity shares and the balance of 2,259,060 CCPCPS was renamed as ""Series A Preference Shares"". Each ""Series A Preference Shareholder"" is entitled to cumulative preference dividend equal to 0.001% per financial year and to exercise one vote per one share at the general meetings of the Company. For liquidation terms and preferential rights refer note 11.3a. During the year ended March 31, 2017, all the 2,259,060 Series A Preference Shares have been converted into equity shares in the ratio of 1:1.
0.001% Compulsorily convertible participatory cumulative Preference shares - Series B of ` 243/- each fully paid up
During the year ended March 31, 2012, the Company had issued Series B Preference Shares of ` 243 each fully paid up aggregating 2,477,387 shares to FIL Capital Management (Mauritius) Limited, Fidelity India Principals and Dr. Satyanarayana Chava(Promoter). Each Series B
109Building Momentum
The Year in Review Statutory Reports Financial Statements
(All amounts in Million Rupees except for share data or as otherwise stated)
NOTES to financial statements for the year ended March 31, 2018
Preference Share at the option of the holder is convertible into one equity share or will automatically be converted into one equity share after completion of 19 years and 365 days from the date of issue. Each Series B Preference Shareholder is entitled to cumulative preference dividend equal to 0.001% per financial year and to exercise one vote per share at the general meetings of the Company. For liquidation terms and preferential rights refer note 11.3a.
During the year ended March 31, 2017, all the 2,477,387 Series B Preference Shares have been converted into equity shares in the ratio of 1:1.
0.001% Compulsorily convertible participatory cumulative Preference Shares - Series C of ` 10/- each fully paid up
During the year ended March 31, 2015, the Company had issued Series C Preference Shares of ` 10/- each fully paid up aggregating 4,153,399 shares to Bluewater Investment Limited (""Blue Water""). Each Series C Preference Share at the option of the holder is convertible into one equity share or will automatically be converted into one equity share after completion of 19 years and 365 days from the date of issue. Each Series C Preference Shareholder is entitled to cumulative preference dividend equal to 0.001% per financial year and to exercise one vote per share at the general meetings of the Company. For liquidation terms and preferential rights refer note 11.3a.
During the year ended March 31, 2017, all the 4,153,399 Series C Preference Shares have been converted into equity shares in the ratio of 1:1.
11.3a. Liquidation terms and preferential rights In case of winding up or liquidation, if the liquidation
proceeds are adequate to cater to the amount of investment of Bluewater, FIL Capital Management (Mauritius) Limited and Fidelity India Principals as increased by an Internal Rate of Return (IRR) of 18% per annum computed thereon from the date of investment by each of them, then the liquidation proceeds will be shared equally among all the shareholders including preference shareholders proportionate to their holdings.
In the case of winding up or liquidation , if the liquidation proceeds are not adequate to cater to the amount of investment of Bluewater, FIL Capital Management (Mauritius) Limited and Fidelity India Principals, then such proceeds shall be distributed amongst Bluewater, FIL Capital Management (Mauritius) Limited, Fidelity India Principals and Promoter pari passu in proportion to Bluewater Investment Amount, FIL Capital Management (Mauritius) Limited Investment amount, Fidelity India Principals Investment amount and Promoter Investment Amount of Series B Preference Shares respectively. Of the remaining proceeds if any, the preference is defined as under:
- Contracted investment of Series A preference shareholders
- Promoter contracted investment amount of 465,000 equity shares
- Other shareholders including promoter contracted investment amount of equity shares
- Balance distributed to all shareholders in proportion to their shareholding.
However, with effect from December 19, 2016, upon equity shares of the Company becoming listed on the stock exchanges, the liquidation terms are as follows:
(a) If the company shall be wound up, the Liquidator may, with the sanction of a special resolution of the company and any other sanction required by the Act divide amongst the shareholders, in specie or kind the whole or any part of the assets of the company, whether they shall consist of property of the same kind or not.
(b) For the purpose aforesaid, the Liquidator may set such value as he deems fair upon any property to be divided as aforesaid and may determine how such division shall be carried out as between the shareholders or different classes of shareholders.
Laurus Labs Limited
Annual Report 2017-18110

(All amounts in Million Rupees except for share data or as otherwise stated)
NOTES to financial statements for the year ended March 31, 2018
11.4. Details of shareholders holding more than 5% shares of the Company:
Equity Shares of ` 10/- each Held ByMarch 31, 2018 March 31, 2017
% Holding No. % Holding No.
Blue Water Investment Limited 19.80% 20,989,596 19.85% 20,989,596 FIL Capital Management (Mauritius) Limited 11.54% 12,237,612 11.57% 12,237,612 Dr.C.Satyanarayana 15.83% 16,781,704 15.87% 16,781,704 SBI Magnum Multiplier Fund 4.19% 4,439,877 7.02% 7,427,959 Mrs.C.Naga Rani 5.89% 6,240,000 5.90% 6,240,000
11.5. Details of shares reserved for issue under options For details of shares reserved for issue under Employee Stock Options Scheme plan of the Company, refer note no. 29
11.6. Aggregate number of bonus shares issued, shares issued for consideration other than cash during the period of five years immediately preceding the reporting date:
March 31, 2018 March 31, 2017
No. of equity shares allotted as fully paid bonus shares by capitalization of securities premium - 73,971,303
12. Distributions made and proposed March 31, 2018 March 31, 2017
Cash dividends on Equity shares declared and paid: Final dividend for the year ended March 31, 2017 : ` 1.50 per share
(March 31, 2016 : ` 2.00 per share) 158.63 31.53
Dividend distribution tax on final dividend 32.29 6.42 Cash dividends on CCPCPS - Series A, Series B and Series C declared and paid: Final dividend for the year ended March 31, 2017 : ` Nil per share (March 31, 2016: ` 2.00 per
share) (including cumulative preference dividend) (not adjusted for bonus issue) - 17.81
Dividend distribution tax on final dividend - 3.63 190.92 59.39
Proposed dividends on Equity shares: Final cash dividend 159.04 158.63 Dividend distribution tax on proposed dividend 32.69 32.29
191.73 190.92
Proposed dividend on equity shares are subject to approval at the annual general meeting and not recognised as a liability as at March 31, 2018.
13. Financial liabilities March 31, 2018 March 31, 2017
A) Non-current borrowings Term loans Indian rupee loans from banks (Secured) 1,014.87 984.08 Foreign currency loans from banks (Secured) 368.00 - Buyers credit (Secured) - 188.56 Other loans Vehicle loans from banks (Secured) 33.72 51.24 Total 1,416.59 1,223.88 Current maturities of non current borrowings Term loans Indian rupee loans from banks (Secured) 399.61 494.14 Foreign currency loans from banks (Secured) 184.35 42.69 Buyers credit (Secured) 189.16 138.59 Other loans Vehicle loans from banks (Secured) 24.19 25.39
797.31 700.81 Less: Amount disclosed under the head "other current financial liabilities" (refer note no. 13 D) (797.31) (700.81) Total - -
B) Current borrowingsCash credits and working capital demand loansIndian rupee loans from banks (Secured) 4,913.34 5,190.22 Foreign currency loans from banks (Secured) 1,401.10 - Buyers credit from banks (Secured) 946.13 960.36 Total 7,260.57 6,150.58
111Building Momentum
The Year in Review Statutory Reports Financial Statements

(All amounts in Million Rupees except for share data or as otherwise stated)
NOTES to financial statements for the year ended March 31, 2018
(a) The details of Indian rupee term loans from banks are as under:
Name of the BankOutstanding
as on March 31, 2018
Outstanding as on
March 31, 2017Sanction Amount No. of Installments
Commencement of installments
Effective interest rate
State Bank of India (SBI)
- 67.02 300.00 8 quarterly installments ranging from ` 15.00 to ` 22.50
June 2016 MCLR Plus 0.50% p.a (March 31, 2017: MCLR plus 1.90 % p.a.
State Bank of India (SBI)#
- 350.00 490.00 23 quarterly installments ranging from ` 20.00 to ` 22.50
September 2015 MCLR Plus 0.50% p.a (March 31, 2017: MCLR plus 1.90 % p.a.
State Bank of India (SBI)#
- 377.38 450.00 20 quarterly installments ranging from ` 18.00 to ` 24.00
June 2016 MCLR Plus 0.50% p.a (March 31, 2017: MCLR plus 1.90 % p.a.
ICICI Bank (ICICI) - 22.57 67.67 20 quarterly installments of ` 3.38
February 2014 MCLR plus 2.75% p.a. (March 31, 2017 : MCLR plus 2.75% p.a.)
HSBC Bank (HSBC) 199.60 399.15 500.00 10 quarterly installments of ` 50
December 2016 MCLR plus 0.5% p.a. (March 31, 2017 :MCLR plus 0.5% p.a.)
Andhra Bank (AB)* 214.88 262.10 231.80 14 quarterly installments ranging from ` 15.16 to ` 16.67
January 2018 MCLR plus 1.55 p.a. (March 31, 2017 : MCLR plus 1.60% p.a.)
HDFC Bank (HDFC) 1,000.00 - 1,000.00 15 quarterly installments of ` 66.67
November 2018 At 1 Year G-Sec plus 155 bps
" * Andhra Bank term loan has been taken over from Sriam Labs Private limited as part of slump sale (refer note no. 42) # Converted to FCNR (B) Term Loan "
(b) Foreign Currency loans from banks comprise of Long Term Buyer’s Credit, Foreign Currency Non Resident Term Loan (FCNR TL) and ECB loan:
Name of the Bank & Nature of Loan
Outstanding as on
March 31, 2018
Outstanding as on
March 31, 2017Sanction Amount No. of installments
Commencement of installments
Rate of Interest
Bank of Bahrain and Kuwait (BBK) - ECB Loan
- 42.69 US$ 5.40 Mn 16 quarterly installments ranging from US$ 0.338 to US$ 0.330.
November 2013 6M London Inter -Bank Offered Rate (LIBOR) plus 3.50% p.a. (March 31, 2017 : 6M LIBOR plus 3.50% p.a.)
ICICI Bank (ICICI) - Buyer's Credit
- 138.59 US$ 2.14 Mn Single installment April 2017 LIBOR plus 0.74% p.a. (March 31, 2017 : LIBOR plus 0.74% p.a.)
State Bank of India (SBI) - Buyer's Credit
189.16 188.56 US$ 2.91 Mn Two installments April 2018 LIBOR plus 0.56% p.a. (March 31, 2017: LIBOR plus 0.56% p.a.)
State Bank of India (SBI) - FCNR TL
269.54 - US$ 4.764 Mn 14 quarterly installments
December 2017 6M LIBOR plus 2% p.a. (March 31, 2017: NIL)
State Bank of India (SBI) - FCNR TL
282.81 - US$ 5.1 Mn 14 quarterly installments
December 2017 6M LIBOR plus 2% p.a. (March 31, 2017: NIL)
(c) All Term loans (except Andhra Bank & HDFC) are secured by pari passu first charge on the property, plant and equipment (both present and future) except to the extent of assets exclusively charged to banks. It is further secured by pari passu second charge on current assets both present and future. (March 31, 2017 All Term loans (except ICICI) were secured by pari passu first charge on the property, plant and equipment (both present and future) except to the extent of assets exclusively charged to banks. They were further secured by pari passu second charge on current assets both present and future. Also personal guarantees were given by the Chief Executive Officer and one of the Executive Directors of the Company. ICICI Term loan and buyers credit was secured by exclusive charge on the movable machinery/property, plant and equipment procured from the term loan/buyers credit sanctioned by ICICI Bank and also personal guarantees were given by the Chief Executive Officer and one of the Executive Directors of the Company).
Laurus Labs Limited
Annual Report 2017-18112

(All amounts in Million Rupees except for share data or as otherwise stated)
NOTES to financial statements for the year ended March 31, 2018
HDFC Term loan is secured by pari passu first charge on the property, plant and equipment (both present and future). Andhra Bank Term loan is secured by an exclusive charge on the present and future assets of Unit VI. State Bank of India (SBI) buyer's credit is secured by pari passu first charge on current assets and pari passu second charge on the fixed assets (both present and future) (March 31, 2017 State Bank of India (SBI) buyer's credit was secured by pari passu first charge on current assets and pari passu second charge on the fixed assets (both present and future) and also personal guarantees were given by the Chief Executive Officer and one of the Executive Directors of the Company).
(d) Vehicle loans from banks are repayable in installments ranging from 36 to 48 months from the date of the loan and secured by hypothecation of the respective vehicles.
(e) Current borrowings are availed of in both Rupee and Foreign currencies. Interest on rupee loans ranges from MCLR plus 0% to 0 .60%(March 31, 2017: MCLR plus 0% to 1.85%, ). Buyers credit loan interest ranges from LIBOR plus 0.17% to 0.75%(March 31, 2017: LIBOR plus 0.23% to 0.75%, ). These borrowings are secured by pari passu first charge on current assets and pari passu second charge on the fixed assets (both present and future).
(March 31, 2017 Current borrowings were secured by pari passu first charge on current assets and pari passu second charge on the fixed assets (both present and future). Also personal guarantees were given by the Chief Executive Officer and one of the Executive Directors of the Company)
C) Trade payables
March 31, 2018 March 31, 2017
Valued at amortised cost - Outstanding dues to creditors other than micro enterprises and small enterprises 2,966.07 2,896.84 - Outstanding dues to micro enterprises and small enterprises (Refer note 30) 27.89 11.46 - Outstanding dues to related parties (Refer note 33) 74.14 79.70
3,068.10 2,988.00
Terms and conditions of the above financial liabilities: Trade payables are non-interest bearing and are normally settled on 30-120 day terms. For explanations on the Company’s credit risk management processes, refer note no. 38.
D) Current maturities and other financial liabilities
March 31, 2018 March 31, 2017 Current maturities of non-current borrowings (refer nore no. 13 A) 797.31 700.81 Capital creditors 642.40 521.87 Interest accrued 26.55 26.83 Payable to selling shareholders (IPO) - 40.20 Outstanding derivative contracts 0.73 23.51 Total 1,466.99 1,313.22
Interest payable is normally settled monthly/quarterly throughout the financial year.
Breakup of financial liabilities carried at amortised cost
March 31, 2018 March 31, 2017
Valued at fair value through profit or loss Outstanding derivate contracts 0.73 23.51 Total financial liabilities carried at fair value through profit or loss Valued at amortised cost
0.73 23.51
Non-current borrowings 1,416.59 1,223.88 Current maturities of non-current borrowings 797.31 700.81 Current borrowings 7,260.57 6,150.58 Interest accrued 26.55 26.83 Trade payables 3,068.10 2,988.00 Capital creditors and others 642.40 562.07 Total financial liabilities carried at amortised cost 13,211.52 11,652.17
113Building Momentum
The Year in Review Statutory Reports Financial Statements

(All amounts in Million Rupees except for share data or as otherwise stated)
NOTES to financial statements for the year ended March 31, 2018
14. Other Non-current and current liabilities
March 31, 2018 March 31, 2017
A) Non-current Advances from customers 646.97 630.72
646.97 630.72 B) Current
Advances from customers 742.87 474.39 Unclaimed dividend 0.06 - Statutory dues 94.21 108.68 Total 837.14 583.07
15. Provisions
March 31, 2018 March 31, 2017
A) Non-current provisions Provision for gratuity 112.43 89.24 Provision for compensated absences 88.58 52.46 Total 201.01 141.70
B) Current provisions Provision for gratuity 17.16 7.25 Provision for compensated absences 27.42 39.56 Total 44.58 46.81
16. Income tax assets/liabilities
March 31, 2018 March 31, 2017
A) Income tax assets Tax paid under protest 7.05 7.05
7.05 7.05 B) Income tax liabilities Provision for taxes (net) 2.83 91.76
2.83 91.76
17. Revenue from operations
For the year ended March 31, 2018
For the year ended March 31, 2017
Sale of products Income from sale of API and Intermediates 18,934.15 18,362.14 Income from sale of traded goods 243.86 150.10 (A) 19,178.01 18,512.24 Sale of services Contract research services 624.64 280.16 (B) 624.64 280.16 Other operating revenue Sale of scrap 17.26 17.67 Export and other incentives* 269.23 175.15 Others 303.74 197.95 (C) 590.23 390.77 Revenue from operations (A+B+C) 20,392.88 19,183.17
* Export and other incentives have been recognized on the following: a) Incentive in the form of duty credit scrip upon sale of exports under Merchandise Exports from India Scheme under Foreign Trade Policy of India b) Sales tax incentive under the Andhra Pradesh state incentives IIPP 2015-20 scheme. There are no unfulfilled conditions or contingencies attached to these incentives.
Laurus Labs Limited
Annual Report 2017-18114

(All amounts in Million Rupees except for share data or as otherwise stated)
NOTES to financial statements for the year ended March 31, 2018
18. Other income
For the year ended March 31, 2018
For the year ended March 31, 2017
Net gain on foreign exchange fluctuations 191.24 236.90 Reversal of provision for insurance claim receivable - 26.81 Provision no longer required written back 37.41 - Bad debts recovered 10.52 9.00 Profit on sale of investment (valued at cost) - 3.00 Lease rental income 38.96 18.48 Miscellaneous income 3.15 10.40 Total 281.28 304.59
19. Cost of materials consumed
For the year ended March 31, 2018
For the year ended March 31, 2017
Raw materials consumed Opening stock at the beginning of the year 1,904.55 2,182.40 Add : Purchases 10,922.18 9,804.20
12,826.73 11,986.60 Less : Closing stock at the end of the year 2,358.61 1,904.55 (A) 10,468.12 10,082.05 Packing materials consumed (B) 76.85 74.78 Total (A+B) 10,544.97 10,156.83
20. Changes in inventories of finished goods, work-in-progress and stock-in-trade
For the year ended March 31, 2018
For the year ended March 31, 2017
Opening stock of inventories Finished goods of API and Intermediates 1,474.98 1,222.06 Work-in-progress of API and Intermediates 1,515.88 1,408.01
2,990.86 2,630.07 Closing stock of inventories Finished goods of API and Intermediates 1,510.00 1,474.98 Work-in-Progress of API and Intermediates 1,731.91 1,515.88
3,241.91 2,990.86 Increase in inventories of finished goods and work-in-progress (251.05) (360.79)Increase in finished goods of API and Intermediates (35.02) (252.92)Decrease/(Increase) in Work-in-Progress of API and Intermediates (216.03) (107.87)Increase in inventories of finished goods and work-in-progress (251.05) (360.79)
21. Employee benefits expenses
For the year ended March 31, 2018
For the year ended March 31, 2017
Salaries, allowances and wages 1,752.59 1,412.18 Contribution to provident fund and other funds 114.56 91.12 Gratuity expense 38.24 15.29 Share based payment expense 33.55 37.89 Managerial remuneration 199.03 186.56 Recruitment and training 11.31 18.10 Staff welfare expenses 232.12 196.80 Total 2,381.40 1,957.94
115Building Momentum
The Year in Review Statutory Reports Financial Statements

(All amounts in Million Rupees except for share data or as otherwise stated)
NOTES to financial statements for the year ended March 31, 2018
22. Other expenses
For the year ended March 31, 2018
For the year ended March 31, 2017
Consumption of stores and spares 235.17 181.85 Conversion charges 121.15 175.61 Factory maintenance 546.47 450.01 Effluent treatment expenses 158.05 157.76 Power and fuel 905.42 637.57 Repairs and maintenance Plant and machinery 142.94 117.09 Buildings 45.76 39.06 Others 5.11 2.65 Product development 240.63 307.58 Testing and analysis charges 10.70 11.74 Rent 47.35 41.47 Rates and taxes 103.55 86.25 Office maintenance 21.83 19.70 Insurance 69.96 57.25 Printing and stationery 18.21 15.29 Consultancy and other professional charges 83.42 75.74 Membership and subscription 41.98 26.24 Remuneration to auditors * -Audit fee 4.20 4.10 -Tax audit fee 0.50 0.50 -Limited review 3.00 0.80 -Other services 3.97 0.20 -Out of pocket expenses ^ 0.10 0.18 Travelling and conveyance 57.71 57.53 Communication expenses 20.66 18.48 Loss on sale of property, plant and equipment (net) 5.20 4.38 Allowance for bad and doubtful advance and debts 9.30 37.25 Carriage outwards 114.50 83.83 Commission on sales 59.55 82.34 Royalty - 64.07 Other selling expenses 17.13 15.83 Business promotion and advertisement 92.09 75.15 CSR expenditure (refer note no.26) 43.98 41.03 Donations 3.07 6.66 Miscellaneous expenses 2.83 2.22 Total 3,235.49 2,897.41
* Excludes ` nil (March 31, 2017: ` 20.87) of which Company's share has been adjusted to securities premium.
^ Paid to previous auditors
23A. Finance income
For the year ended March 31, 2018
For the year ended March 31, 2017
Interest income on Deposits and margin money held - 8.31 Security deposits at amortised cost 0.72 1.06 Electricity deposits and others 6.35 5.48 Total 7.07 14.85
Laurus Labs Limited
Annual Report 2017-18116

(All amounts in Million Rupees except for share data or as otherwise stated)
NOTES to financial statements for the year ended March 31, 2018
23B. Finance costs
For the year ended March 31, 2018
For the year ended March 31, 2017
Interest - on term loans 109.64 356.98 - on working capital loans 534.87 495.22 - on others 9.67 22.06 Total interest expense 654.18 874.26 Bank charges 33.10 66.42 Exchange differences to the extent considered as an adjustment to finance cost 67.12 29.05 Total 754.40 969.73
24. Components of other comprehensive income (OCI) The disaggregation of changes to OCI by each type of reserve in equity is shown below:
For the year ended March 31, 2018
For the year ended March 31, 2017
Remeasurement costs on net defined benefit liability 0.28 (9.92)Deferred tax effect on remeasurement costs (0.10) 3.43 Total 0.18 (6.49)
25. Earnings per share (EPS)
For the year ended March 31, 2018
For the year ended March 31, 2017
The following reflects the profit and share data used in the basic and diluted EPS computations: Profit for the year attributable to shareholders 1,731.39 1,999.59 Less: Preference dividend and tax thereon - 21.44 Profit available for equity shareholders 1,731.39 1,978.15 Weighted average number of equity shares in computing basic EPS 105,900,117 90,514,497 Add: Effect of dilution Stock options granted under ESOP 445,130 529,204 Weighted average number of equity shares in computing diluted earnings per share * 106,345,247 91,043,701 Face value of each equity share (`) 10.00 10.00 Earnings per share - Basic (`) 16.35 21.85 - Diluted (`) 16.28 21.85
* During the year ended March 31, 2017, the Company on July 27, 2016, has allotted 73,971,303 equity shares of ` 10/- each to the then existing shareholders of the Company as Bonus shares in the ratio of 3:1. Accordingly, the earnings per share has been adjusted for bonus issue for previous periods presented in accordance with the requirements of Indian Accounting Standard (Ind AS) 33 - Earnings per share.
26. Details of CSR expenditure During the year, as per the Companies Act, 2013, Gross amount required to be spent by the Company during the year is ` 33.28
(March 31, 2017 : ` 24.61)
CSR Activities In cash Yet to be
paid in cash Total
(i) Construction/acquisition of any asset - - - (-) (-) (-)
(ii) On purposes other than (i) above 43.98 - 43.98 (41.03) - (41.03)
Amounts in bracket indicate previous year numbers
117Building Momentum
The Year in Review Statutory Reports Financial Statements
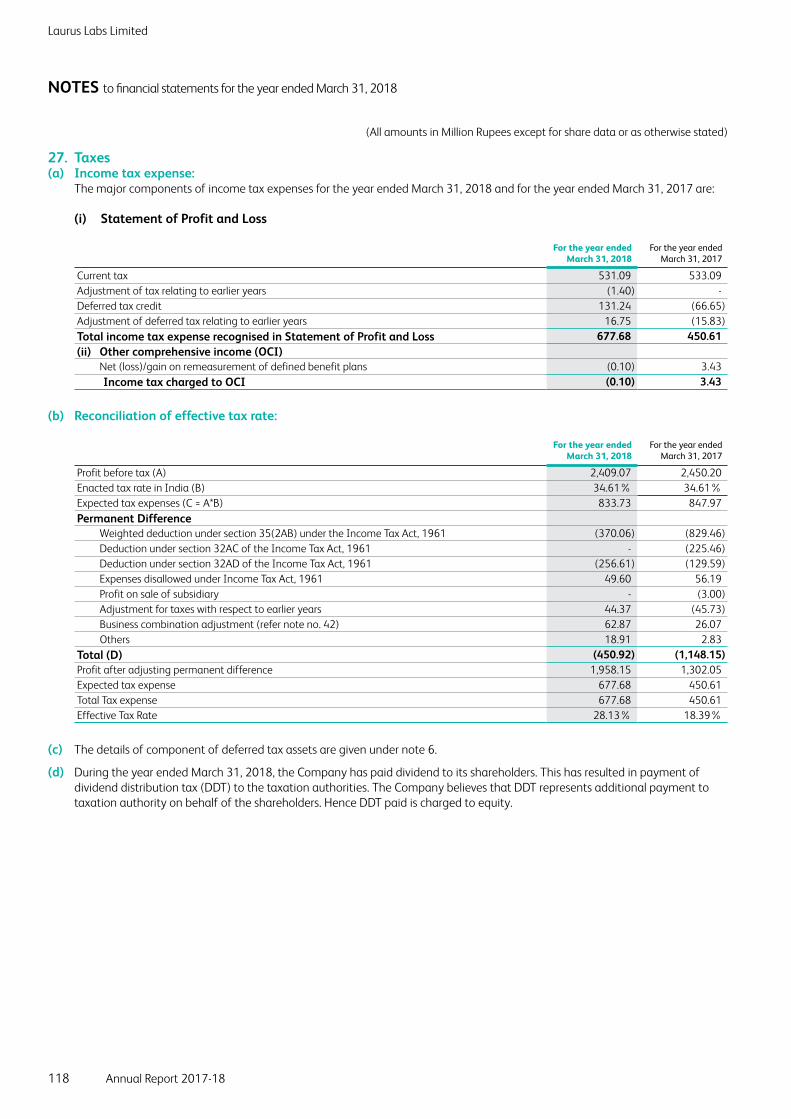
(All amounts in Million Rupees except for share data or as otherwise stated)
NOTES to financial statements for the year ended March 31, 2018
27. Taxes (a) Income tax expense: The major components of income tax expenses for the year ended March 31, 2018 and for the year ended March 31, 2017 are:
(i) Statement of Profit and Loss
For the year ended March 31, 2018
For the year ended March 31, 2017
Current tax 531.09 533.09 Adjustment of tax relating to earlier years (1.40) - Deferred tax credit 131.24 (66.65)Adjustment of deferred tax relating to earlier years 16.75 (15.83)Total income tax expense recognised in Statement of Profit and Loss 677.68 450.61 (ii) Other comprehensive income (OCI) Net (loss)/gain on remeasurement of defined benefit plans (0.10) 3.43 Income tax charged to OCI (0.10) 3.43
(b) Reconciliation of effective tax rate:
For the year ended March 31, 2018
For the year ended March 31, 2017
Profit before tax (A) 2,409.07 2,450.20 Enacted tax rate in India (B) 34.61% 34.61%Expected tax expenses (C = A*B) 833.73 847.97 Permanent Difference Weighted deduction under section 35(2AB) under the Income Tax Act, 1961 (370.06) (829.46) Deduction under section 32AC of the Income Tax Act, 1961 - (225.46) Deduction under section 32AD of the Income Tax Act, 1961 (256.61) (129.59) Expenses disallowed under Income Tax Act, 1961 49.60 56.19 Profit on sale of subsidiary - (3.00) Adjustment for taxes with respect to earlier years 44.37 (45.73) Business combination adjustment (refer note no. 42) 62.87 26.07 Others 18.91 2.83 Total (D) (450.92) (1,148.15)Profit after adjusting permanent difference 1,958.15 1,302.05 Expected tax expense 677.68 450.61 Total Tax expense 677.68 450.61 Effective Tax Rate 28.13% 18.39%
(c) The details of component of deferred tax assets are given under note 6.
(d) During the year ended March 31, 2018, the Company has paid dividend to its shareholders. This has resulted in payment of dividend distribution tax (DDT) to the taxation authorities. The Company believes that DDT represents additional payment to taxation authority on behalf of the shareholders. Hence DDT paid is charged to equity.
Laurus Labs Limited
Annual Report 2017-18118

(All amounts in Million Rupees except for share data or as otherwise stated)
NOTES to financial statements for the year ended March 31, 2018
28. Gratuity Defined Benefit Plans The Company has a defined benefit gratuity plan and governed by Payment of Gratuity Act, 1972. Every employee who has
completed five years or more of service is entitled to a gratuity on departure at 15 days salary for each completed year of service. The scheme is funded through a policy with SBI Life Insurance Company Limited. The following tables summarise net benefit expenses recognised in the Statement of Profit and Loss, the status of funding and the amount recognised in the Balance sheet for the gratuity plan:
For the year ended March 31, 2018
For the year ended March 31, 2017
A) Net employee benefit expense (recognised in Employee benefits expenses)Current service cost 30.79 9.41 Interest cost 7.55 6.00 Expected return on plan assets (0.10) (0.12)Net employee benefit expenses 38.24 15.29 Actual return on plan asset (0.10) (0.12)
B) Amount recognised in the Balance SheetDefined benefit obligation 131.09 98.37 Fair value of plan assets 1.50 1.88
129.59 96.49 C) Changes in the present value of the defined benefit obligation
Opening defined benefit obligation 98.37 74.90 Current service cost 30.79 9.41 Interest cost 7.55 6.00 Benefits paid (5.34) (3.72)Net Actuarial (gains) / losses on obligation for the year recognised under OCI (0.28) 9.92 On account of business combination (refer note no. 42) - 1.86 Closing defined benefit obligation 131.09 98.37
D) Change in the fair value of plan assetsOpening fair value of plan assets 1.88 0.49 Actual return on plan assets 0.10 0.12 Contributions 4.86 4.99 Benefits paid (5.34) (3.72)Closing fair value of plan assets 1.50 1.88
The Company expects to contribute ` 17.16 to the gratuity fund in the next year (March 31, 2017: ` 7.50) against the short term liability of ` 17.16 (March 31, 2017: ` 7.25) as per the actuarial valuation.
The major categories of plan assets as a percentage of the fair value of total plan assets are as follows:
March 31, 2018 March 31, 2017
Investments with SBI Life Insurance Company Limited 100.00% 100.00%E) Remeasurement adjustments:
Financial loss/ (gain) on plan assets (0.28) 9.92 Remeasurement gains/(losses) recognised in other comprehensive income: (0.28) 9.92
119Building Momentum
The Year in Review Statutory Reports Financial Statements

(All amounts in Million Rupees except for share data or as otherwise stated)
NOTES to financial statements for the year ended March 31, 2018
(i) The principal assumptions used in determining gratuity for the Company’s plans are shown below:
March 31, 2018 March 31, 2017
Discount rate 7.85% 8.00%Expected rate of return on assets 9.05% 8.50%Salary rise 11.00% 16.00%Attrition Rate 14.00% 12.00%
The estimates of future salary increases, considered in the actuarial valuation, take account of inflation, seniority, promotion and other relevant factors, such as supply and demand in the employment market.
The overall expected rate of return on assets is determined based on the actual rate of return during the current year.
(ii) Disclosure related to indication of effect of the defined benefit plan on the entity’s future cashflows: Expected benefit payments for the year ending:
Year ending March 31, 2018 March 31, 2017
Year 1 - 31.88 Year 2 - 34.55 Year 3 0.18 46.43 Year 4 3.80 41.29 Year 5 3.76 31.19 Beyond 5 years 176.92 -
The average duration of the defined benefit plan obligation at the end of the reporting period is 25.92 years (March 31, 2017: 25.91 years).
(iii) Sensitivity analysis: A quantitative sensitivity analysis for significant assumption is as shown below:
March 31, 2018 March 31, 2017
(a) Effect of 1% change in assumed discount rate on defined benefit obligation - 1% increase (10.57) (11.00) - 1% decrease 12.57 13.13 (b) Effect of 1% change in assumed salary escalation rate on defined benefit obligation - 1% increase 8.37 0.32 - 1% decrease (7.73) (0.31)(c) Effect of 1% change in assumed attrition rate on defined benefit obligation - 1% increase (4.16) (11.00) - 1% decrease 4.98 13.13
Defined contribution plan
March 31, 2018 March 31, 2017
Contribution to provident fund 100.62 79.77 Contribution to superannuation fund 13.94 11.35
29. Share based payments ESOP 2011 Scheme The board of directors/ compensation committee has approved the Laurus Employees Stock Option Scheme(ESOP) 2011 for
issue of stock options to eligible employees of the Company effective from September 19, 2011. According to the Scheme, the options granted vest within a period of four years, subject to the terms and conditions specified in the scheme. Options granted shall vest so long as the employee continues to be in the employment of the Company as on the date of vesting. Subject to an employee’s continued employment with the Company, options can be exercised any time on or after the date of vesting of options as specified in the respective grants under the Scheme.
Laurus Labs Limited
Annual Report 2017-18120

(All amounts in Million Rupees except for share data or as otherwise stated)
NOTES to financial statements for the year ended March 31, 2018
ESOP 2016 Scheme The board of directors/ compensation committee has approved the Laurus Employees Stock Option Scheme (ESOP) 2016 for
issue of stock options to eligible employees of the Company effective from July 01, 2016. According to the Scheme, the options granted vest within a period of four years, subject to the terms and conditions specified in the scheme. Options granted shall vest so long as the employee continues to be in the employment of the Company as on the date of vesting. Subject to an employee’s continued employment with the Company, options can be exercised any time on or after the date of vesting of options as specified in the respective grants under the Scheme.
Vesting period
Scheme Grant Number of options Year 1 Year 2 Year 3
ESOP 2011 Grant I 553,000 20-Sep-13 20-Sep-14 20-Sep-15ESOP 2011 Grant II 28,000 19-Sep-14 19-Sep-15 19-Sep-16ESOP 2011 Grant III 38,500 19-Sep-15 19-Sep-16 19-Sep-17ESOP 2011 Grant IV 75,500 19-Sep-16 19-Sep-17 19-Sep-18ESOP 2011 Grant V 185,438 19-Sep-17 19-Sep-18 19-Sep-19ESOP 2016 Grant I 178,438 01-Jul-18 01-Jul-19 01-Jul-20
Scheme Date of GrantNumber of options
Granted *Exercise price
Weighted Average Fair value of option
at grant date
ESOP 2011 September 19, 2011 553,000 10 105.96ESOP 2011 September 19, 2012 28,000 10 163.94ESOP 2011 September 19, 2013 38,500 10 175.94 ESOP 2011 September 19, 2014 75,500 10 262.84 ESOP 2011 September 19, 2015 185,438 10 525.65 ESOP 2016 July 01, 2016 178,438 550 84.45
* The Company issued bonus shares in the ratio of 3 shares for every 1 share held.
The details of activity under the Scheme ESOP 2011 are summarised below :
For the year ended March 31, 2018
For the year ended March 31, 2017
No. of options No. of options
Outstanding at the beginning of the year 906,500 260,313 Granted during the year - 8,250 Additional options on adjustment of bonus issue @3:1 on July 15, 2016 - 788,439 Forfeited during the year 34,000 32,002 Exercised during the year 271,500 118,500 Outstanding at the end of the year 601,000 906,500 Exercisable at the end of the year - - Weighted average exercise price for all the above options 10 10
The details of activity under the Scheme ESOP 2016 are summarised below :
For the year ended March 31, 2018
For the year ended March 31, 2017
No. of options No. of options
Outstanding at the beginning of the year 669,500 - Granted during the year - 178,438 Additional options on adjustment of bonus issue @3:1 on July 15, 2016 - 518,064 Forfeited during the year 25,500 27,002 Exercised during the year 2,000 - Outstanding at the end of the year 642,000 669,500 Exercisable at the end of the year - - Weighted average exercise price for all the above options 550 550
121Building Momentum
The Year in Review Statutory Reports Financial Statements

(All amounts in Million Rupees except for share data or as otherwise stated)
NOTES to financial statements for the year ended March 31, 2018
For options exercised during the year, the weighted average share price at the exercise date under ESOP 2011 scheme, was ` 547.65 per share (March 31, 2017: ` 514.79 per share) and under ESOP 2016 scheme, was ` 547.65 per share (March 31, 2017: ` Nil per share).
The weighted average remaining contractual life for the stock options outstanding under ESOP 2011 scheme as at March 31, 2018 is 2.31 years (March 31, 2017: 3.19 years) and under ESOP 2016 as at March 31, 2017 is 3.26 years (March 31, 2017: 4.26 years). The range of exercise prices for options outstanding under ESOP 2011 scheme as at March 31, 2018 was ` 10 (March 31, 2017: ` 10) and under ESOP 2016 as at March 31, 2018 was ` 550 (March 31, 2017: ` 550).
The weighted average fair value of stock options granted during the year under ESOP 2011 scheme was ` Nil (March 31, 2017: ` nil) and under ESOP 2016 scheme was ` Nil (March 31, 2017: ` 84.45). The Black Scholes valuation model has been used for computing the weighted average fair value considering the following inputs:
March 31, 2018
ESOP 2011 scheme ESOP 2016
scheme
Grant V Grant IV Grant III Grant II Grant I Grant I
Dividend yield 0.00% 0.00% 0.00% 0.00% 0.00% 0.00%Expected volatility 0.00% 0.00% 0.00% 0.00% 0.00% 0.00%Risk-free interest rate 7.71% 8.56% 8.47% 8.01% 8.34% 7.03%Weighted average share price of ` 533.00 269.97 183.10 171.22 113.15 514.79Exercise price of ` 10.00 10.00 10.00 10.00 10.00 550.00Expected life of options granted in years 3.51 3.50 3.50 3.50 3.51 2.50
March 31, 2017
ESOP 2011 scheme ESOP 2016
scheme
Grant V Grant IV Grant III Grant II Grant I Grant I
Dividend yield 0.00% 0.00% 0.00% 0.00% 0.00% 0.00%Expected volatility 0.00% 0.00% 0.00% 0.00% 0.00% 0.00%Risk-free interest rate 7.71% 8.56% 8.47% 8.01% 8.34% 7.03%Weighted average share price of ` 533.00 269.97 183.10 171.22 113.15 514.79Exercise price of ` 10.00 10.00 10.00 10.00 10.00 550.00Expected life of options granted in years 3.51 3.50 3.50 3.50 3.51 2.50
The expected life of the stock is based on the historical data and current expectations and is not necessarily indicative of exercise pattern that may occur.
30. Trade payables (Details of dues to Micro, Small and Medium Enterprises as per MSMED Act, 2006):
March 31, 2018 March 31, 2017
The principal amount and the interest due thereon (to be shown separately) remaining unpaid to any supplier as at the end of each accounting year
27.89 11.46
The amount of interest paid by the buyer in terms of section 16, of the Micro Small and Medium Enterprise Development Act, 2006 along with the amounts of the payment made to the supplier beyond the appointed day during each accounting year
- -
The amount of interest due and payable for the period of delay in making payment (which have been paid but beyond the appointed day during the year) but without adding the interest specified under Micro Small and Medium Enterprise Development Act, 2006.
- -
The amount of interest accrued and remaining unpaid at the end of each accounting year; and - - The amount of further interest remaining due and payable even in the succeeding years, until such date when the interest dues as above are actually paid to the small enterprise for the purpose of disallowance as a deductible expenditure under section 23 of the Micro Small and Medium Enterprise Development Act, 2006.
- -
Dues to Micro and Small Enterprises have been determined to the extent such parties have been identified on the basis of information collected by the Management. This has been relied upon by the auditors.
Laurus Labs Limited
Annual Report 2017-18122

(All amounts in Million Rupees except for share data or as otherwise stated)
NOTES to financial statements for the year ended March 31, 2018
31. In accordance with Indian Accounting Standard (Ind AS) 108 on Operating segments, segment information has been given in the consolidated financial statements of the Company, and therefore no separate disclosure on segment information is given in these financial statements.
32. Research and developmenti). Details of Revenue expenditure (expensed as and when incurred):
March 31, 2018 March 31, 2017
Cost of materials consumed Raw materials consumed 213.82 350.01 Employee benefits expensesSalaries, allowances and wages 387.92 346.91 Contribution to provident fund and other funds 24.49 23.80 Staff welfare expenses 30.74 29.95 Other expensesFactory maintenance 12.03 11.38 Effluent treatment expenses 2.27 1.88 Power and fuel 32.79 15.09 Product development 227.94 288.21 Testing and analysis charges 5.24 5.90 Rates and taxes 70.71 32.63 Insurance 8.75 7.53 Membership and subscription 12.90 6.86 Consultancy and other professional charges 31.43 30.73 Depreciation and amortisation 60.57 64.16 Total 1,121.60 1,215.04
ii). Details of property, plant and equipment * :
Particulars Buildings Plant and
Equipment Furniture and
Fixtures Computers
Total Property, Plant and Equipment
Gross carrying valueAs at April 01, 2016 58.73 318.63 21.01 0.05 398.42 Additions - 130.05 56.53 - 186.58 As at March 31, 2017 58.73 448.68 77.54 0.05 585.00 Additions - 73.82 - - 73.82 As at March 31, 2018 58.73 522.50 77.54 0.05 658.82 Depreciation As at April 01, 2016 2.64 40.57 9.77 0.03 53.01 Charge for the year 2.64 51.07 10.56 0.02 64.29 As at March 31, 2017 5.28 91.64 20.33 0.05 117.30 Charge for the year 2.64 51.09 6.84 60.57 As at March 31, 2018 7.92 142.73 27.17 0.05 177.87 Net carrying valueAs at March 31, 2016 56.09 278.06 11.24 0.02 345.41 As at March 31, 2017 53.45 357.04 57.21 - 467.70 As at March 31, 2018 50.81 379.77 50.37 - 480.95
* For details of pledge, refer note 3.
123Building Momentum
The Year in Review Statutory Reports Financial Statements

(All amounts in Million Rupees except for share data or as otherwise stated)
NOTES to financial statements for the year ended March 31, 2018
33. Related party disclosures Names of related parties and description of relationship
Name of the related party Relationship
Company which exercises significant influencei) Bluewater Investment Limited *Subsidiary Companiesi) Laurus Synthesis Inc.ii) Sriam Labs Private Limited **iii) Laurus Holdings Limited ***iv) Laurus Generics Inc **** (Wholly owned subsidiary of Laurus Holdings Limited)v) Laurus Generics GmbH ***** (Wholly owned subsidiary of Laurus Holdings Limited)Associate Companyi) Sriam Labs Private Limited **Enterprise over which Key Management Personnel exercise significant influencei) Laurus Infosystems (India) Private LimitedKey Management Personneli) Dr. C. Satyanarayana Whole-time director & Chief executive officerii) Dr. Raju S Kalidindi ^ Executive Directoriii) Mr. V.V. Ravi Kumar Executive Director & Chief financial officeriv) Mr. C. Chandrakanth ^^ Executive Directorv) Dr. C.V.Lakshmana Rao ^^^ Executive Directorvi) Mr. Amal Ganguli Independent Director (passed away on May 7, 2017)vii) Mr. Frank J Wright Independent Director (ceased from April 01 2017)viii) Mr. Ramesh Subrahmanian Independent Directorix) Mrs. Aruna Rajendra Bhinge Independent Directorx) Mr. Rajesh Chandy Independent Directorxi) Dr. M.Venu Gopala Rao Independent Director (appointed w.e.f. May 18, 2017)xii) Dr. Ravindranath K Independent Director (appointed w.e.f. May 18, 2017)xiii) Mr. G Venkateswar Reddy Company SecretaryRelatives of Key Management Personneli) Mr. C. Narasimha Rao Brother of Dr. C. Satyanarayanaii) Mr. C. Chandrakanth ^ Son-in-Law of Dr. C. Satyanarayanaiii) Mr. C. Krishna Chaitanya Son of Dr. C. Satyanarayana (appointed w.e.f April 17, 2017)iv) Mrs. C. Soumya Daughter of Dr. C. Satyanarayana
* Cease to exercise significant influence effective from December 15, 2016
** Cease to be an associate and became subsidiary effective from November 01, 2016
*** Effective from July 10, 2017
**** Effective from August 07, 2017
***** Effective from April 06, 2018
^ Resigned with effective from March 08, 2018
^^ Key Management Personnel effective from August 09, 2016
^^^ Key Management Personnel effective from March 08, 2018
Laurus Labs Limited
Annual Report 2017-18124
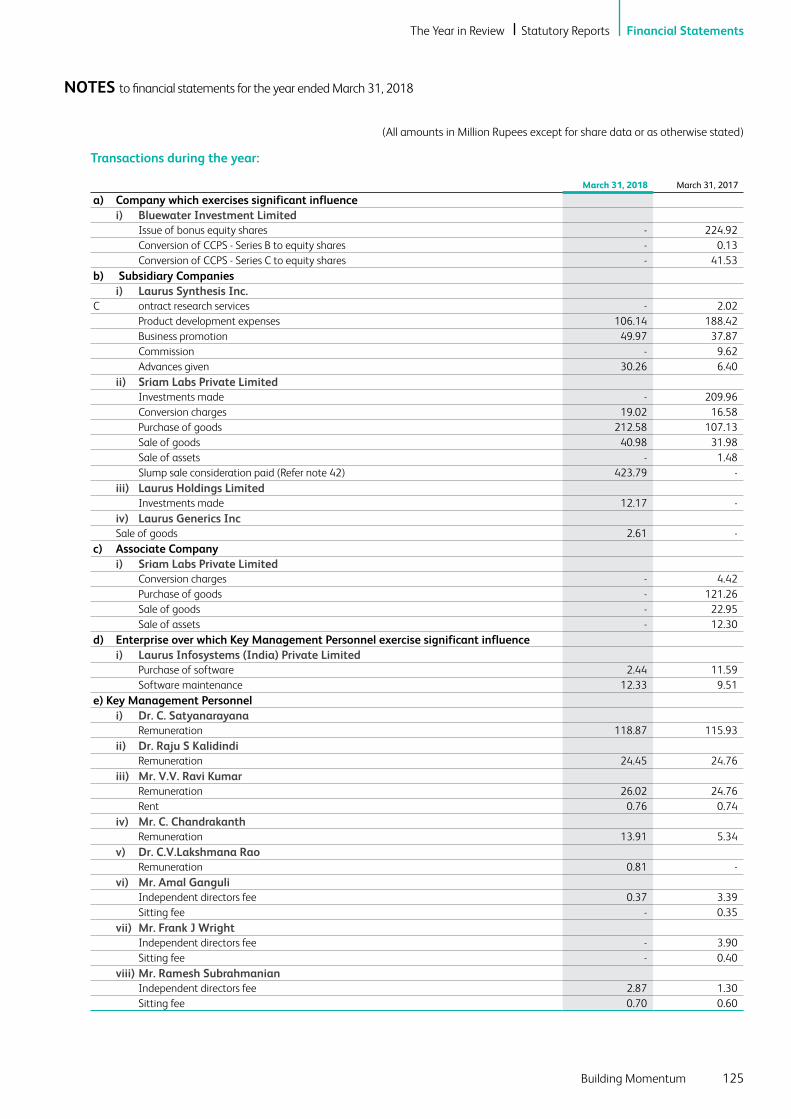
(All amounts in Million Rupees except for share data or as otherwise stated)
NOTES to financial statements for the year ended March 31, 2018
Transactions during the year:
March 31, 2018 March 31, 2017
a) Company which exercises significant influence i) Bluewater Investment Limited Issue of bonus equity shares - 224.92 Conversion of CCPS - Series B to equity shares - 0.13 Conversion of CCPS - Series C to equity shares - 41.53 b) Subsidiary Companies i) Laurus Synthesis Inc.C ontract research services - 2.02 Product development expenses 106.14 188.42 Business promotion 49.97 37.87 Commission - 9.62 Advances given 30.26 6.40 ii) Sriam Labs Private Limited Investments made - 209.96 Conversion charges 19.02 16.58 Purchase of goods 212.58 107.13 Sale of goods 40.98 31.98 Sale of assets - 1.48 Slump sale consideration paid (Refer note 42) 423.79 - iii) Laurus Holdings Limited Investments made 12.17 - iv) Laurus Generics Inc Sale of goods 2.61 - c) Associate Company i) Sriam Labs Private Limited Conversion charges - 4.42 Purchase of goods - 121.26 Sale of goods - 22.95 Sale of assets - 12.30 d) Enterprise over which Key Management Personnel exercise significant influence i) Laurus Infosystems (India) Private Limited Purchase of software 2.44 11.59 Software maintenance 12.33 9.51 e) Key Management Personnel i) Dr. C. Satyanarayana Remuneration 118.87 115.93 ii) Dr. Raju S Kalidindi Remuneration 24.45 24.76 iii) Mr. V.V. Ravi Kumar Remuneration 26.02 24.76 Rent 0.76 0.74 iv) Mr. C. Chandrakanth Remuneration 13.91 5.34 v) Dr. C.V.Lakshmana Rao Remuneration 0.81 - vi) Mr. Amal Ganguli Independent directors fee 0.37 3.39 Sitting fee - 0.35 vii) Mr. Frank J Wright Independent directors fee - 3.90 Sitting fee - 0.40 viii) Mr. Ramesh Subrahmanian Independent directors fee 2.87 1.30 Sitting fee 0.70 0.60
125Building Momentum
The Year in Review Statutory Reports Financial Statements

(All amounts in Million Rupees except for share data or as otherwise stated)
NOTES to financial statements for the year ended March 31, 2018
March 31, 2018 March 31, 2017
ix) Mrs. Aruna Rajendra Bhinge Independent directors fee 2.00 1.48 Sitting fee 0.70 0.75 x) Mr. Rajesh Chandy Independent directors fee 2.59 1.82 Sitting fee 0.50 0.30 xi) Dr. M.Venu Gopala Rao Independent directors fee 1.74 - Sitting fee 0.45 - xii) Dr. Ravindranath K Independent directors fee 1.74 - Sitting fee 0.20 - xiii) Mr. G.Venkateswar Reddy Remuneration 4.03 4.12 f) Relatives of Key Management Personnel i) Mr. C. Narasimha Rao Remuneration 5.24 4.96 ii) Mr. C. Chandrakanth Remuneration - 2.82 iii) Mr. C. Krishna Chaitanya Remuneration 5.17 - iv) Mrs. C. Soumya Rent 1.52 1.38 Closing balances (Unsecured)a) Subsidiary Companies i) Laurus Synthesis Inc. Disclosed under other current assets 30.26 6.40 ii) Sriam Labs Private Limited Disclosed under other current assets 79.34 272.01 iii) Laurus Generics Inc. Disclosed under other current assets 6.47 - Trade receivable 2.61 - b) Enterprise over which Key Management Personnel exercise significant influence i) Laurus Infosystems (India) Private Limited Trade Payables 0.16 - c) Key Management Personnel i) Dr. C. Satyanarayana Remuneration payable 52.80 58.06 ii) Dr. Raju S Kalidindi Remuneration payable 6.98 8.51 iii) Mr. V.V. Ravi Kumar Remuneration payable 7.45 8.51 Rent Payable 0.06 0.06 iv) Mr. C. Chandrakanth Remuneration payable 4.00 2.49 v) Dr. C.V.Lakshmana Rao Remuneration payable 0.24 - vi) Mr. G.Venkateswar Reddy Remuneration payable 0.58 0.69 d) Relatives of Key Management Personnel i) Mr. C. Narasimha Rao Remuneration payable 0.96 1.27 ii) Mr. C. Krishna Chaitanya Remuneration 0.77 - iii) Mrs. C. Soumya Rent Payable 0.12 0.11
Transactions during the year: (Contd.)
Laurus Labs Limited
Annual Report 2017-18126
(All amounts in Million Rupees except for share data or as otherwise stated)
NOTES to financial statements for the year ended March 31, 2018
The advance given to subsidiaries/ associate are in the nature of trade advances against orders for supply of goods & services and accordingly disclosures on maximum amount of loans/ advances/ investments during the year as required under regulation 53 (f) read with para A of Schedule V of Securities And Exchange Board Of India (Listing Obligations And Disclosure Requirements) Regulations, 2015 has not been disclosed.
The Company has provided guarantees for ` 420.09 (March 31, 2017: ` 820.28) in the form of Standby Letter of Credit (SBLC) to Citi Bank NA and Corporate guarantee to Andhra Bank for the loans obtained by Laurus Synthesis Inc. and Sriam Labs Private Limited respectively, which were be utilised for business purposes.
As the future liability for gratuity and leave encashment is provided on an actuarial basis for the Company as a whole, the amount pertaining to the Key Management personnel and their relatives is not ascertainable and, therefore, not included above.
The transactions with related parties are made on terms equivalent to those that prevail in arm’s length transactions. This assessment is undertaken each financial year through examining the financial position of the related party and the market in which the related party operates. Outstanding balances at the year-end are unsecured.
34. Significant accounting judgements, estimates and assumptions
The preparation of the Company's financial statements requires management to make judgements, estimates and assumptions that affect the reported amounts of revenues, expenses, assets and liabilities, and the accompanying disclosures, and the disclosure of contingent liabilities. Uncertainty about these assumptions and estimates could result in outcomes that require a material adjustment to the carrying amount of assets or liabilities affected in future periods.
(A) Judgements In the process of applying the Company's accounting
policies, management has made the following judgements, which have the most significant effect on the amounts recognised in the financial statements.
(i) Lease commitments - the Company as lessor
The Company has entered into agreements to manufacture and supply API and intermediates produced at a dedicated blocks located at Unit-1 and Unit-5 constructed exclusively for the lessee. The Company has identified assets under operating and finance lease based on the factors indicated under Appendix C to Ind AS 17 and terms of the agreement, viz., economic life of the
asset vs. lease term, ownership of the asset after the lease term.
(ii) Lease commitments - the Company as lessee
The Company has entered into leases for land and office premises. The Company has determined, based on an evaluation of the terms and conditions of the arrangements, such as the lease term not constituting a major part of the economic life of the land and office premises and the fair value of the asset, that it does not retain significant risks and rewards of ownership of the land and the office premises and accounts for the contracts as operating leases.
(iii) Taxes The Company has a Minimum Alternate Tax
(MAT) credit of ` 1,546.39 as on March 31, 2018 (March 31, 2017: ` 1,467.37). The Company recognises MAT credit available as an asset only to the extent that there is convincing evidence that the Company will pay normal income tax during the specified period, i.e., the period for which MAT credit is allowed to be carried forward. The Company based on its future projections of profit believes that the MAT credit would be utilized from financial year 2018-19.
(B) Estimates and assumptions The key assumptions concerning the future and other
key sources of estimation uncertainty at the reporting date, that have a significant risk of causing a material adjustment to the carrying amounts of assets and liabilities within the next financial year, are described below. The Company based its assumptions and estimates on parameters available when the financial statements were prepared. Existing circumstances and assumptions about future developments, however, may change due to market changes or circumstances arising that are beyond the control of the Company. Such changes are reflected in the assumptions when they occur.
(i) Share-based payments Estimating fair value for share-based payment
transactions requires determination of the most appropriate valuation model, which is dependent on the terms and conditions of the grant. This estimation requires determination of the most appropriate inputs to the valuation model including the expected life of the share option, volatility and dividend yield and making assumptions about them. The Black Scholes valuation model has been used by the Management for share-based payment transactions. The assumptions and models used
127Building Momentum
The Year in Review Statutory Reports Financial Statements
(All amounts in Million Rupees except for share data or as otherwise stated)
NOTES to financial statements for the year ended March 31, 2018
for estimating fair value for share-based payment transactions are disclosed in Note 29.
(ii) Taxes Deferred tax assets are recognised for unused
tax losses to the extent that it is probable that taxable profit will be available against which the losses can be utilised. Significant management judgement is required to determine the amount of deferred tax assets that can be recognised, based upon the likely timing and the level of future taxable profits together with future tax planning strategies.
(iii) Defined employee benefit plans (Gratuity) The cost of the defined benefit gratuity plan
and the present value of the gratuity obligation are determined using actuarial valuations. An actuarial valuation involves making various assumptions that may differ from actual developments in the future. These include the determination of the discount rate, future salary increases and mortality rates. Due to the complexities involved in the valuation and its long-term nature, a defined benefit obligation is highly sensitive to changes in these assumptions. All assumptions are reviewed at each reporting date.
The parameter most subject to change is the discount rate. In determining the appropriate discount rate for plans operated in India, the management considers the interest rates of government bonds in currencies consistent with the currencies of the post-employment benefit obligation.
The mortality rate is based on publicly available mortality tables for the specific countries. Those mortality tables tend to change only at interval in response to demographic changes. Future salary increases and gratuity increases are based on expected future inflation rates for the respective countries. Further details about gratuity obligations are given in Note 28.
(iv) Fair value measurement of financial instruments
When the fair values of financial assets and financial liabilities recorded in the balance sheet cannot be measured based on quoted prices in active markets, their fair value is measured using valuation techniques including the Discounted Cash Flow ("DCF") model. The inputs to these models are taken from observable markets where possible, but where this is not feasible, a degree of judgement is required in establishing fair values. Judgements include considerations of inputs such as liquidity risk, credit risk and volatility. Changes in assumptions about these factors could affect the reported fair value of financial instruments. See note 37 and 38 for further disclosures.
(v) Depreciation on property, plant and equipment
Depreciation on property, plant and equipment is calculated on a straight-line basis using the rates arrived at based on the useful lives and residual values of all its property, plant and equipment estimated by the management. The management believes that depreciation rates currently used fairly reflect its estimate of the useful lives and residual values of property, plant and equipment, though these rates in certain cases are different from lives prescribed under Schedule II of the Companies Act, 2013.
35. Hedging activities and derivatives Derivatives not designated as hedging
instruments The Company uses foreign currency denominated
borrowings and foreign exchange forward contracts to manage some of its transaction exposures. The foreign exchange forward contracts are not designated as cash flow hedges and are entered into for periods consistent with foreign currency exposure of the underlying transactions, generally from one week to twelve months.
Laurus Labs Limited
Annual Report 2017-18128

(All amounts in Million Rupees except for share data or as otherwise stated)
NOTES to financial statements for the year ended March 31, 2018
36. Fair values Set out below, is a comparison by class of the carrying amounts and fair value of the Company’s financial instruments:
Carrying value Fair value
March 31, 2018 March 31, 2017 March 31, 2018 March 31, 2017
Financial assets at fair value through profit and loss:Investments 34.05 34.05 34.05 34.05 Financial assets at amortised cost:Loans 8.26 2.77 8.26 2.77 Deposits and export and other incentive receivable 416.62 453.04 416.62 453.04 Trade receivables 5,551.35 5,619.56 5,551.35 5,619.56 Cash and cash equivalents 8.66 7.49 8.66 7.49 Other balances with banks 0.53 16.68 0.53 16.68 Financial liabilities at amortised cost:Borrowings (Non-current and current) 9,474.47 8,075.27 9,474.47 8,075.27 Interest accrued 26.55 26.83 26.55 26.83 Trade payables 3,068.10 2,988.00 3,068.10 2,988.00 Capital creditors and others 642.40 562.07 642.40 562.07 Financial liabilities at fair value through profit and loss: Derivative contracts 0.73 23.51 0.73 23.51
The management assessed that cash and cash equivalents, trade receivables, trade payables and other current liabilities approximate their carrying amounts largely due to the short-term maturities of these instruments. Further, the management has assessed that fair value of borrowings approximate their carrying amounts largely since they are carried at floating rate of interest.
The fair value of the financial assets and liabilities is included at the amount at which the instrument could be exchanged in a current transaction between willing parties, other than in a forced or liquidation sale.
37. Fair value hierarchy The following table provides the fair value measurement hierarchy of the Company's assets and liabilities.
Quantitative disclosures fair value measurement hierarchy for assets and liabilities as at March 31, 2018:
Fair value measurement using
Date of valuation TotalQuoted prices in
active markets Significant
observable inputsSignificant
unobservable inputs
(Level 1) (Level 2) (Level 3)
Financial assets at fair value through profit or loss:Investments March 31, 2018 34.05 - 34.05 - Financial liabilities at fair value through profit & loss:Forward contracts (Derivatives) March 31, 2018 0.73 - 0.73 -
Quantitative disclosures fair value measurement hierarchy for assets and liabilities as at March 31, 2017:
Fair value measurement using
Date of valuation TotalQuoted prices in
active markets Significant
observable inputsSignificant
unobservable inputs
(Level 1) (Level 2) (Level 3)
Financial liabilities at fair value through profit & loss:Forward contracts (Derivatives) March 31, 2017 23.51 - 23.51 -
129Building Momentum
The Year in Review Statutory Reports Financial Statements

(All amounts in Million Rupees except for share data or as otherwise stated)
NOTES to financial statements for the year ended March 31, 2018
Measurement of fair value Valuation techniques The following table shows the valuation techniques used in measuring Level 2 fair values for assets and liabilities carried at fair
value through profit or loss.
Type Valuation Technique
Assets measured at fair value:Investments The fair value is determined based on value per share derived from net
worth of the Company as at the reporting date.
Liabilities measured at fair value:Derivative contracts The fair value is determined using quoted forward exchange rates at the
reporting date.
38. Financial risk management objectives and policies
Financial risk management framework The Company is exposed primarily to credit risk, liquidity risk
and market risk (fluctuations in foreign currency exchange rates and interest rate), which may adversely impact the fair value of its financial instruments. The Company assesses the unpredictability of the financial environment and seeks to mitigate potential adverse effects on the financial performance of the Company.
A Credit risk Credit risk is the risk that counterparty will not
meet its obligations under a financial instrument or customer contract, leading to a financial loss. Credit risk encompasses of both, the direct risk of default and the risk of deterioration of creditworthiness as well as concentration of risks. Credit risk is controlled by analysing credit limits and creditworthiness of customers on a continuous basis to whom the credit has been granted after obtaining necessary approvals for credit. Financial instruments that are subject to concentrations of credit risk principally consist of trade receivables, investments, derivative financial instruments, cash and cash equivalents, bank deposits and other financial assets. None of the financial instruments of the Company result in material concentration of credit risk, except for trade receivables.
Trade receivables: The customer credit risk is managed by the Company’s
established policy, procedures and control relating to customer credit risk management. Credit quality of a customer is assessed based on the individual credit limits are defined in accordance with this assessment and outstanding customer receivables are regularly monitored. Of the trade receivables balance, ` 2,997.24 in aggregate (as at March 31, 2017 ` 3,380.44) is due from the Company's customers individually representing more than 5 % of the total trade receivables balance and accounted for approximately 54%(March 31, 2017: 60%)
of all the receivables outstanding. The Company' receivables turnover is quick and historically, there was no significant defaults on account of those customer in the past. Ind AS requires an entity to recognise in profit or loss, the amount of expected credit losses (or reversal) that is required to adjust the loss allowance at the reporting date to the amount that is required to be recognised in accordance with Ind AS 109. The Company assesses at each date of statements of financial position whether a financial asset or a group of financial assets is impaired. Expected credit losses are measured at an amount equal to the 12 month expected credit losses or at an amount equal to the life time expected credit losses if the credit risk on the financial asset has increased significantly since initial recognition. The Company has used a practical expedient by computing the expected credit loss allowance for trade receivables based on a provision matrix. The provision matrix takes into account historical credit loss experience and adjusted for forward-looking information.
Before accepting any new customer, the Company uses an internal credit scoring system to assess the potential customer's credit quality and defines credit limits by customer. Limits and scoring attributed to customers are reviewed on periodic basis. The expected credit loss allowance is based on the ageing of the days the receivables are due and the rates as given in the provision matrix.
Exposure to credit risk: The carrying amount of financial assets represents the
maximum credit exposure. The maximum exposure to credit risk was ` 5,551.35, (March 2017:` 5,619.56), being the total of the carrying amount of balances with trade receivables.
B Liquidity risk Liquidity risk refers to the risk that the Company
cannot meet its financial obligations. The objective of liquidity risk management is to maintain sufficient liquidity and ensure that funds are available for use
Laurus Labs Limited
Annual Report 2017-18130

(All amounts in Million Rupees except for share data or as otherwise stated)
NOTES to financial statements for the year ended March 31, 2018
as per requirements. The Company manages liquidity risk by maintaining adequate reserves, banking facilities and reserve borrowing facilities, by continuously monitoring forecast and actual cash flows, and by matching the maturity profiles of financial assets and liabilities.
The table below summarises the maturity profile of the Company’s financial liabilities based on contractual undiscounted payments:
Up to 1 Year 1 to 3 years 3 to 5 years > 5 years Total
March 31, 2018:Non current borrowings (including current maturities)
797.31 1,069.31 347.28 - 2,213.90
Current borrowings 7,260.57 - - - 7,260.57 Interest payable 26.55 - - - 26.55 Trade Payables 3,068.10 - - - 3,068.10 Other Payables 642.40 - - - 642.40
11,794.93 1,069.31 347.28 - 13,211.52 March 31, 2017:Non-current borrowings (including current maturities)
922.59 809.61 192.49 - 1,924.69
Current borrowings 6,150.58 - - - 6,150.58 Interest payable 26.83 - - - 26.83 Trade Payables 2,988.00 - - - 2,988.00 Other Payables 562.07 - - - 562.07
10,650.07 809.61 192.49 - 11,652.17
C Market risk Market risk is the risk that the fair value or future cash flows of a financial instrument will fluctuate because of changes
in market prices. Such changes in the values of financial instruments may result from changes in the foreign currency exchange rates, interest rates, credit, liquidity and other market changes.
Interest rate risk Interest rate risk is the risk that the fair value or future cash flows of a financial instrument will fluctuate because of change
in market interest rates. In order to optimize the Company’s position with regards to interest income and interest expenses and to manage the interest rate risk, treasury performs a comprehensive corporate interest risk management by balancing the proportion of fixed rate and floating rate financial instruments in its total portfolio.
Interest rate sensitivity The following table demonstrates the sensitivity to a reasonably possible change in interest rates on that portion of
borrowings affected, after the impact of hedge accounting. With all other variables held constant, the Company’s profit before tax is affected through the impact on borrowings, as follows:
Change in basis points Effect on profit before tax
Increase Decrease Decrease Increase
March 31, 2018 Indian Rupees 0.50% 0.50% (37.39) 37.39 US Dollars 0.50% 0.50% (11.31) 11.31 March 31, 2017 Indian Rupees 0.50% 0.50% (42.30) 42.30 US Dollars 0.50% 0.50% (6.48) 6.48
The assumed movement in basis points for the interest rate sensitivity analysis is based on the currently observable market environment.
131Building Momentum
The Year in Review Statutory Reports Financial Statements

(All amounts in Million Rupees except for share data or as otherwise stated)
NOTES to financial statements for the year ended March 31, 2018
Foreign Currency exchange rate risk The fluctuation in foreign currency exchange rates may have potential impact on the statement of profit or loss and other
comprehensive income and equity, where any transaction references more than one currency or where assets / liabilities are denominated in a currency other than the functional currency of the respective entities. Considering the countries and economic environment in which the Company operates, its operations are subject to risks arising from fluctuations in exchange rates in those countries. The risks primarily relate to fluctuations in US Dollar against the functional currencies of the Company. The Company, as per its risk management policy, uses derivative instruments primarily to hedge foreign exchange. The Company evaluates the impact of foreign exchange rate fluctuations by assessing its exposure to exchange rate risks. It hedges a part of these risks by using derivative financial instruments in line with its risk management policies. The information on derivative instruments is as follows:
a) Forward contract (Derivatives): Forward contract outstanding as at Balance Sheet date:
March 31, 2018 Buy US $ 91,81,381 Hedging of borrowingsMarch 31, 2018 Sell US $ 950,000 Hedging of receivablesMarch 31, 2017 Buy US $ 17,245,117 Hedging of borrowings and creditors
b) Details of Unhedged foreign currency exposure: The year end foreign currency exposures that have not been hedged by a derivative instrument or otherwise are as under :
Currency
March 31, 2018 March 31, 2017
Amount in Foreign Currency
Amount in `Conversion
Rate
Amount in Foreign Currency
Amount in `Conversion
Rate
Secured loans USD 32,125,759 2,089.59 65.04 4,515,133 292.75 64.84 EURO 5,000,000 403.11 80.62 - - -
Interest accrued but not due on borrowings
USD 78,104 5.08 65.04 92,971 6.03 64.84 EURO 877 0.07 80.62 - - -
Trade payables USD 17,721,645 1,152.69 65.04 17,404,875 1,128.51 64.84 EURO 221,217 17.84 80.62 418,643 28.99 69.25 GBP 5,156 0.48 92.28 2,802 0.23 80.88 CAD - - 50.82 19,687 1.00 50.82 CHF 25,192 1.72 68.34 - - - CNY 54,907 0.57 10.31 - - -
Capital creditors USD 179,327 11.66 65.04 87,600 5.68 64.84 GBP 26,971 2.49 92.28 21 0.00 80.88 EURO 43,759 3.53 80.62 388,226 26.88 69.25
Trade receivables USD 28,888,372 1,879.02 65.04 20,204,199 1,310.01 64.84 EURO 3,124,351 251.89 80.62 3,012,737 208.62 69.25 GBP 4,250 0.39 92.28 199,013 16.10 80.88 CAD 37,000 1.88 50.82 - - -
Cash and cash equivalents
USD 1,245 0.08 65.04 2,840 0.18 64.84 AED - - - 20 0.00 17.62 BRL - - - 249 0.01 20.70 SGD 5,000 0.25 49.83 - - -
Advances from customers
USD 9,885,382 642.99 65.04 6,594,669 427.59 64.84 EURO 9,113,455 734.75 80.62 9,670,637 669.67 69.25
Advances recoverable in cash or kind
USD 1,085,217 70.59 65.04 615,139 39.88 64.84 EURO 81,777 6.59 80.62 235,381 16.30 69.25 GBP 3,752 0.35 92.28 54,829 4.43 80.88 CHF 1,750 0.12 68.34 3,664 0.24 64.91 JPY 36,500 0.02 0.62 77,310 0.04 0.58 CNY 46,164 0.48 10.31 - - -
* Amount less than Indian Rupees 10,000.
Laurus Labs Limited
Annual Report 2017-18132

(All amounts in Million Rupees except for share data or as otherwise stated)
NOTES to financial statements for the year ended March 31, 2018
c) Foreign currency sensitivity: The following tables demonstrate the sensitivity to a reasonably possible change in USD and EURO exchange rates, with
all other variables held constant. The impact on the Company’s profit before tax is due to changes in the fair value of monetary assets and liabilities including foreign currency derivatives. The Company’s exposure to foreign currency changes for all other currencies is not material.
Change in USD rate Effect on profit before tax
Increase Decrease Increase/(Decrease)
March 31, 2018USD 1.00% 1.00% (19.52) 19.52 EURO 1.00% 1.00% (9.01) 9.01 March 31, 2017USD 1.00% 1.00% (5.10) 5.10 EURO 1.00% 1.00% (5.01) 5.01
39. Capital management For the purpose of the Company's capital management, capital includes issued equity capital, compulsorily convertible
preference shares, share premium and all other equity reserves attributable to the equity holders. The primary objective of the Company’s capital management is to maximise the shareholder value.
The Company manages its capital structure in consideration to the changes in economic conditions and the requirements of the financial covenants. The Company monitors capital using a gearing ratio, which is net debt divided by total capital plus net debt. The Company intends to keep the gearing ratio between 0.5 to 1.5. The Company includes within net debt, borrowings including interest accrued on borrowings less cash and short-term deposits.
March 31, 2018 March 31, 2017
Borrowings including interest accrued on borrowings (Note 13) 9,501.02 8,102.10 Less: cash and cash equivalents; other balances with banks (Note 10A and 10B) (9.19) (24.17)Net debt 9,491.83 8,077.93Equity 1,060.30 1,057.56Other equity 14,072.66 12,498.21Total equity 15,132.96 13,555.77Gearing ratio (Net debt/ total equity) 0.63 0.60
In order to achieve this overall objective, the Company’s capital management, amongst other things, aims to ensure that it meets financial covenants attached to the interest-bearing loans and borrowings that define capital structure requirements. Breaches in meeting the financial covenants would permit the bank to immediately call loans and borrowings. There have been no breaches in the financial covenants of any interest-bearing loans and borrowing in the current year.
No changes were made in the objectives, policies or processes for managing capital during the year ended March 31, 2018.
40. Commitments and contingencies a. Leases Operating and finance lease commitments - Company as lessor The company has entered into agreement to manufacture and supply intermediates produced at a dedicated block constructed
exclusively for the lessee. The Company has identified assets under operating and finance lease based on the factors indicated under Appendix C to Ind AS 17 and terms of the agreement, viz., economic life of the asset vs. lease term, ownership of the asset after the lease term. This lease term of assets under operating lease is upto 10 years.
133Building Momentum
The Year in Review Statutory Reports Financial Statements

(All amounts in Million Rupees except for share data or as otherwise stated)
NOTES to financial statements for the year ended March 31, 2018
Future minimum rentals receivable under non-cancellable operating leases are as follows:
March 31, 2018 March 31, 2017
Within one year 38.96 39.24 After one year but not more than five years 155.85 156.97 More than five years 677.51 720.77
872.32 916.98
March 31, 2018 March 31, 2017
Within one year 163.47 163.47 After one year but not more than five years 607.65 438.00 More than five years 209.74 542.85
980.86 1,144.32
Operating lease commitments - Company as lessee The company has entered into operating leases agreement on Land, with lease terms between 33-51 years. Also, the Company
has taken certain office premises on leases, with lease term of 5 years and is renewable for further periods. There are escalation clauses in the office premises lease agreement to enable upward revision of the rental charge on an annual basis according to prevailing market conditions.
March 31, 2018 March 31, 2017
In case of land taken on leaseLease payment recognised in the Statement of Profit and Loss 10.56 10.50 Minimum lease payments under non cancellable operating leases payable:Within one year 10.92 10.81 After one year but not more than five years 43.69 43.23 More than five years 255.44 254.62
320.61 319.16
b. Commitments
March 31, 2018 March 31, 2017
Estimated amount of contracts remaining to be executed on capital account and not provided for 732.35 586.86
c. Contingent liabilities
March 31, 2018 March 31, 2017
(i) Outstanding bank guarantees (excluding performance obligations) 191.08 110.64 (ii) Bills discounted 455.96 257.25 (iii) Demand for direct taxes under appeal 10.10 10.10 (iv) Demand for indirect taxes under appeal 265.28 101.03 (v) Corporate guarantee 420.09 820.28
41. Expenditure during construction period (pending allocation)
March 31, 2018 March 31, 2017
Opening balance 0.69 3.67 Add: Power and fuel - 9.27 Rent - 0.55 Factory maintenance - 4.34 Insurance - 0.84 Others - 0.50 Less: Capitalised during the year 0.69 18.48
- 0.69
Laurus Labs Limited
Annual Report 2017-18134

(All amounts in Million Rupees except for share data or as otherwise stated)
NOTES to financial statements for the year ended March 31, 2018
42. Business combination Acquisitions during the year ended March 31, 2018 During the current year, the Company acquired the existing assets and liabilities of an API unit located at Visakhapatnam of
Sriam Labs Private Limited, a wholly owned subsidiary of the Company, on a slump sale basis w.e.f. December 01, 2017. The Company accounted for the business combination in accordance with the requirement of Appendix C of Ind AS 103 Business Combination which lays down the principles in respect of accounting for business combinations of entities or businesses under common control. As required by the standard, pooling of interest method has been considered for common control business combination and accordingly, the assets and liabilities are reflected in the books of the Company at their respective carrying amounts.
In accordance with the requirement of Appendix C of Ind AS 103 Business Combination, the financial information in the financial statements in respect of prior periods has been restated as if the business combination had occurred from the beginning of the preceding period in the financial statements, irrespective of the actual date of the combination. Accordingly the financial statements have been restated from the date of business combination i.e. November 01, 2016 and consequently, year ended March 31, 2017 include the results of the aforementioned business acquired.
Assets acquired and liabilities assumed The carrying values of the identifiable assets and liabilities of the said unit of Sriam Labs Private Limited as at the date of
acquisition were:
December 01, 2017
Non-current assetsProperty, plant and equipment 591.01 Financial Assets Investments 6.75 Security deposits 5.72 Current assetsInventories 20.10 Other current assets 33.90 Total assets (A) 657.48 Non-current liabilitiesFinancial liabilities Borrowings 231.87 Provisions 1.44 Current liabilitiesOther current liabilities 0.38 Total liabilities (B) 233.69 Total identifiable net assets at carrying value (C=A-B) 423.79 Total purchase consideration transferred 423.79
43. The Company has completed the Initial Public Offer (IPO) of 31,116,785 equity shares of ` 10 each at an issue price of ` 428 per share (` 388 per share for eligible employees), consisting of fresh issue of 7,009,345 equity shares and an offer for sale of 24,107,440 equity shares by selling shareholders. The equity shares of the Company were listed on BSE Limited ('BSE') and National Stock Exchange of India Limited ('NSE'), w.e.f from December 19, 2016.
The details of utilisation of IPO proceeds - ` 2,859.24 (net off IPO related expenses including service tax - ` 137.86) are as follows:
Particulars As per ProspectusUtilised upto March
31, 2017
Unutilised amount as at March
31, 2017
Pre-payment of term loans 2,262.90 2,262.90 - General corporate purposes 596.34 596.34 - Total 2,859.24 2,859.24 -
135Building Momentum
The Year in Review Statutory Reports Financial Statements

(All amounts in Million Rupees except for share data or as otherwise stated)
NOTES to financial statements for the year ended March 31, 2018
The Company had originally estimated ` 644.00 (inclusive of service tax) as IPO related expenses. Of such IPO related expenses, certain expenses (such as listing fee) aggregating to ` 5.78 are directly attributable to the Company. Remaining IPO related expenses aggregating to ` 638.22, have been allocated between the Company (` 143.77) and the selling shareholders (` 494.45) in proportion to the equity shares allotted to the public as fresh issue by the Company and under offer for sale by the selling shareholders. The company has incurred an amount of ` 592.11 (inclusive of service tax) towards IPO related expenses and does not expect any further expenditure. The remaining unspent amount of ` 51.89 has been re-allocated between the Company and the selling shareholders in the originally apportioned manner. Accordingly, an amount of ` 11.69 has been credited to securities premium and an amount of ` 40.20 is paid to the selling shareholders during the current year.
For and on behalf of the Board of Directors LAURUS LABS LIMITED
Dr. C. Satyanarayana V. V. Ravi Kumar Whole Time Director & Chief Executive Officer DIN: 00211921
Executive Director & Chief Financial Officer DIN: 01424180
Place: Hyderabad G. Venkateswar Reddy Date: May 10, 2018 Company Secretary
Laurus Labs Limited
Annual Report 2017-18136

INDEPENDENT AUDITOR'S REPORT
To The Members of Laurus Labs Limited
Report on the Consolidated Ind AS Financial StatementsWe have audited the accompanying consolidated Ind AS financial statements of Laurus Labs Limited (hereinafter referred to as "the Parent") and its subsidiaries (the Parent and its subsidiaries together referred to as "the Group"), comprising the Consolidated Balance Sheet as at March 31, 2018, the Consolidated Statement of Profit and Loss (including other comprehensive income), the Consolidated Cash Flow Statement, the Consolidated Statement of Changes in Equity, for the year then ended, and a summary of the significant accounting policies and other explanatory information (hereinafter referred to as "the consolidated Ind AS financial statements").
Management's Responsibility for the Consolidated Ind AS Financial StatementsThe Parent's Board of Directors is responsible for the preparation of these consolidated Ind AS financial statements in terms of the requirements of the Companies Act, 2013 (hereinafter referred to as "the Act") that give a true and fair view of the consolidated financial position, consolidated financial performance including other comprehensive income, consolidated cash flows and consolidated statement of changes in equity of the Group including its Associates and Joint ventures in accordance with the Indian Accounting Standards (Ind AS) prescribed under section 133 of the Act read with the Companies (Indian Accounting Standards) Rules, 2015, as amended, and other accounting principles generally accepted in India. The respective Board of Directors of the companies included in the Group are responsible for maintenance of adequate accounting records in accordance with the provisions of the Act for safeguarding the assets of the Group and for preventing and detecting frauds and other irregularities; the selection and application of appropriate accounting policies; making judgments and estimates that are reasonable and prudent; and the design, implementation and maintenance of adequate internal financial controls, that were operating effectively for ensuring the accuracy and completeness of the accounting records, relevant to the preparation and presentation of the consolidated Ind AS financial statements that give a true and fair view and are free from material misstatement, whether due to fraud or error, which have been used for the purpose of preparation of the consolidated Ind AS financial statements by the Directors of the Parent, as aforesaid.
Auditor's ResponsibilityOur responsibility is to express an opinion on these consolidated Ind AS financial statements based on our audit. In conducting our audit, we have taken into account the provisions of the Act, the accounting and auditing standards and matters which are required to be included in the audit report under the provisions of the Act and the Rules made thereunder.
We conducted our audit in accordance with the Standards on Auditing specified under Section 143(10) of the Act. Those Standards require that we comply with ethical requirements and
plan and perform the audit to obtain reasonable assurance about whether the consolidated Ind AS financial statements are free from material misstatement.
An audit involves performing procedures to obtain audit evidence about the amounts and the disclosures in the consolidated Ind AS financial statements. The procedures selected depend on the auditor's judgment, including the assessment of the risks of material misstatement of the consolidated Ind AS financial statements, whether due to fraud or error. In making those risk assessments, the auditor considers internal financial control relevant to the Parent's preparation of the consolidated Ind AS financial statements that give a true and fair view in order to design audit procedures that are appropriate in the circumstances. An audit also includes evaluating the appropriateness of the accounting policies used and the reasonableness of the accounting estimates made by the Parent's Board of Directors, as well as evaluating the overall presentation of the consolidated Ind AS financial statements.
We believe that the audit evidence obtained by us and other auditors in terms of their reports referred to below in the Other Matters paragraph, is sufficient and appropriate to provide a basis for our audit opinion on the consolidated Ind AS financial statements.
OpinionIn our opinion and to the best of our information and according to the explanations given to us and based on the consideration of reports of the other auditors on separate financial statements/ financial information of the subsidiaries referred to below in the Other Matters paragraph, the aforesaid consolidated Ind AS financial statements give the information required by the Act in the manner so required and give a true and fair view in conformity with the Ind AS and other accounting principles generally accepted in India, of the consolidated state of affairs of the Group as at March 31, 2018, and their consolidated profit, consolidated total comprehensive income, their consolidated cash flows and consolidated statement of changes in equity for the year ended on that date.
Other MattersWe did not audit the financial statements / financial information of five subsidiaries, whose financial statements/ financial information reflect total assets of ` 597.93 million as at March 31, 2018, total revenues of ` 728.48 million and net cash inflows amounting to ` 4.65 million for the year ended on that date, as considered in the consolidated Ind AS financial statements. These financial statements / financial information have been audited by other auditors whose reports have been furnished to us by the Management and our opinion on the consolidated Ind AS financial statements, in so far as it relates to the amounts and disclosures included in respect of these subsidiaries, is based solely on the reports of the other auditors.
Our opinion on the consolidated Ind AS financial statements above and our report on Other Legal and Regulatory Requirements below, is not modified in respect of the above
137Building Momentum
The Year in Review Statutory Reports Financial Statements

ANNEXURE “A” TO THE INDEPENDENT AUDITOR’S REPORT (Referred to in paragraph (f) under ‘Report on Other Legal and Regulatory Requirements’ section of our report of even date)
Report on the Internal Financial Controls Over Financial Reporting under Clause (i) of Sub-section 3 of Section 143 of the Companies Act, 2013 (“the Act”)
In conjunction with our audit of the consolidated Ind AS financial statements of the Company as of and for the year ended March 31, 2018, we have audited the internal financial controls over financial reporting of Laurus Labs Limited (hereinafter referred to as “Parent”) and its subsidiary company, which is incorporated in India, as of that date.
Management’s Responsibility for Internal Financial ControlsThe respective Board of Directors of the Parent and its subsidiary company, which is incorporated in India, are responsible for
establishing and maintaining internal financial controls based on the internal control over financial reporting criteria established by the respective Companies considering the essential components of internal control stated in the Guidance Note on Audit of Internal Financial Controls Over Financial Reporting issued by the Institute of Chartered Accountants of India (ICAI). These responsibilities include the design, implementation and maintenance of adequate internal financial controls that were operating effectively for ensuring the orderly and efficient conduct of its business, including adherence to the
matters with respect to our reliance on the work done and the reports of the other auditors.
Report on Other Legal and Regulatory RequirementsAs required by Section 143(3) of the Act, based on our audit and on the consideration of the report of the other auditors on separate financial statements and the other financial information of subsidiaries incorporated in India, referred in the Other Matters paragraph above we report, to the extent applicable, that:
(a) We have sought and obtained all the information and explanations which to the best of our knowledge and belief were necessary for the purposes of our audit of the aforesaid consolidated Ind AS financial statements.
(b) In our opinion, proper books of account as required by law relating to preparation of the aforesaid consolidated Ind AS financial statements have been kept so far as it appears from our examination of those books, returns and the reports of the other auditors.
(c) The Consolidated Balance Sheet, the Consolidated Statement of Profit and Loss (including Other Comprehensive Income), the Consolidated Cash Flow Statement and Consolidated Statement of Changes in Equity dealt with by this Report are in agreement with the relevant books of account maintained for the purpose of preparation of the consolidated Ind AS financial statements.
(d) In our opinion, the aforesaid consolidated Ind AS financial statements comply with the Indian Accounting Standards prescribed under Section 133 of the Act.
(e) On the basis of the written representations received from the directors of the Parent as on March 31, 2018 taken on record by the Board of Directors of the Parent and the reports of the statutory auditors of its subsidiary company, incorporated in India, none of the directors of the Group
companies, incorporated in India is disqualified as on March 31, 2018 from being appointed as a director in terms of Section 164 (2) of the Act.
(f) With respect to the adequacy of the internal financial controls over financial reporting and the operating effectiveness of such controls, refer to our separate Report in “Annexure A”, which is based on the auditors’ reports of the Parent, subsidiary company incorporated in India. Our report expresses an unmodified opinion on the adequacy and operating effectiveness of internal financial controls over financial reporting of those companies, for the reasons stated therein.
(g) With respect to the other matters to be included in the Auditor's Report in accordance with Rule 11 of the Companies (Audit and Auditor's) Rules, 2014, as amended, in our opinion and to the best of our information and according to the explanations given to us:
i. The consolidated Ind AS financial statements disclose the impact of pending litigations on the consolidated financial position of the Group.
ii. The Group did not have any material foreseeable losses on long-term contracts including derivative contracts.
iii. There were no amounts which were required to be transferred to the Investor Education and Protection Fund by the Parent and its subsidiary company incorporated in India.
For DELOITTE HASKINS & SELLS LLPChartered Accountants
(Firm’s Registration No. 117366W/W-100018)
P. R. RameshPlace: Hyderabad PartnerDate: May 10, 2018 (Membership No. 70928)
Laurus Labs Limited
Annual Report 2017-18138
respective company’s policies, the safeguarding of its assets, the prevention and detection of frauds and errors, the accuracy and completeness of the accounting records, and the timely preparation of reliable financial information, as required under the Companies Act, 2013.
Auditor’s ResponsibilityOur responsibility is to express an opinion on the internal financial controls over financial reporting of the Parent and its subsidiary company, which is incorporated in India, based on our audit. We conducted our audit in accordance with the Guidance Note on Audit of Internal Financial Controls Over Financial Reporting (the “Guidance Note”) issued by the Institute of Chartered Accountants of India and the Standards on Auditing, prescribed under Section 143(10) of the Companies Act, 2013, to the extent applicable to an audit of internal financial controls. Those Standards and the Guidance Note require that we comply with ethical requirements and plan and perform the audit to obtain reasonable assurance about whether adequate internal financial controls over financial reporting was established and maintained and if such controls operated effectively in all material respects.
Our audit involves performing procedures to obtain audit evidence about the adequacy of the internal financial controls system over financial reporting and their operating effectiveness. Our audit of internal financial controls over financial reporting included obtaining an understanding of internal financial controls over financial reporting, assessing the risk that a material weakness exists, and testing and evaluating the design and operating effectiveness of internal control based on the assessed risk. The procedures selected depend on the auditor’s judgement, including the assessment of the risks of material misstatement of the consolidated Ind AS financial statements, whether due to fraud or error.
We believe that the audit evidence we have obtained and the audit evidence obtained by the other auditor of the subsidiary company, which is incorporated in India, in terms of their report referred to in the Other Matters paragraph below, is sufficient and appropriate to provide a basis for our audit opinion on the internal financial controls system over financial reporting of the Parent and its subsidiary company, which is incorporated in India.
Meaning of Internal Financial Controls Over Financial ReportingA company's internal financial control over financial reporting is a process designed to provide reasonable assurance regarding the reliability of financial reporting and the preparation of consolidated Ind AS financial statements for external purposes in accordance with generally accepted accounting principles. A company's internal financial control over financial reporting includes those policies and procedures that (1) pertain to the maintenance of records that, in reasonable detail, accurately and fairly reflect the transactions and dispositions of the assets of the company; (2) provide reasonable assurance that transactions are
recorded as necessary to permit preparation of consolidated Ind AS financial statements in accordance with generally accepted accounting principles, and that receipts and expenditures of the company are being made only in accordance with authorisations of management and directors of the company; and (3) provide reasonable assurance regarding prevention or timely detection of unauthorised acquisition, use, or disposition of the company's assets that could have a material effect on the consolidated Ind AS financial statements.
Inherent Limitations of Internal Financial Controls Over Financial ReportingBecause of the inherent limitations of internal financial controls over financial reporting, including the possibility of collusion or improper management override of controls, material misstatements due to error or fraud may occur and not be detected. Also, projections of any evaluation of the internal financial controls over financial reporting to future periods are subject to the risk that the internal financial control over financial reporting may become inadequate because of changes in conditions, or that the degree of compliance with the policies or procedures may deteriorate.
OpinionIn our opinion to the best of our information and according to the explanations given to us and based on the consideration of the report of the other auditor referred to in the Other Matters paragraph below, Parent and its subsidiary company, which is incorporated in India, have, in all material respects, an adequate internal financial controls system over financial reporting and such internal financial controls over financial reporting were operating effectively as at March 31, 2018, based on the criteria for internal financial control over financial reporting established by the respective companies considering the essential components of internal control stated in the Guidance Note on Audit of Internal Financial Controls Over Financial Reporting issued by the Institute of Chartered Accountants of India.
Other MattersOur aforesaid report under Section 143(3)(i) of the Act on the adequacy and operating effectiveness of the internal financial controls over financial reporting insofar as it relates to one subsidiary company, which is incorporated in India, is based solely on the corresponding report of the auditor of such company incorporated in India.
Our opinion is not modified in respect of the above matters.
For DELOITTE HASKINS & SELLS LLPChartered Accountants
(Firm’s Registration No. 117366W/W-100018)
P. R. RameshPlace: Hyderabad PartnerDate: May 10, 2018 (Membership No. 70928)
139Building Momentum
The Year in Review Statutory Reports Financial Statements

CONSOLIDATED BALANCE SHEET as at March 31, 2018
The accompanying notes are an integral part of the financial statements. As per our report of even date
For Deloitte Haskins & Sells LLP For and on behalf of the Board of Directors Chartered Accountants LAURUS LABS LIMITED ICAI FirmRegistration Number :117366W/W-100018
P. R. Ramesh Dr. C. Satyanarayana V. V. Ravi Kumar Partner Membership No. 70928
Whole Time Director & Chief Executive Officer DIN: 00211921
Executive Director & Chief Financial Officer DIN: 01424180
Place: Hyderabad Place: Hyderabad G. Venkateswar Reddy Date: May 10, 2018 Date: May 10, 2018 Company Secretary
Notes March 31, 2018 March 31, 2017
AssetsNon-current assets Property, plant and equipment 3 14,638.98 12,123.43 Capital work-in-progress 3 1,631.80 1,432.56 Goodwill 4 97.39 97.39 Other intangible assets 4 71.58 78.53 Financial assets Investments 5A 34.05 34.05 Other financial assets 5C 238.55 209.02 Deferred tax assets (net) 6 528.97 698.86 Income tax assets (net) 16A 10.00 12.75 Other non-current assets 7A 439.97 449.42 Total non-current assets 17,691.29 15,136.01 Current assets Inventories 8 5,847.82 5,090.46 Financial assets Trade receivables 9 5,705.87 5,676.05 Cash and cash equivalents 10A 30.04 24.23 Other balances with banks 10B 0.53 16.68 Loans 5B 8.26 2.77 Other financial assets 5C 205.15 292.56 Other current assets 7B 678.24 295.44 Total current assets 12,475.91 11,398.19 Total assets 30,167.20 26,534.20 Equity and Liabilities Equity Equity share capital 11 1,060.30 1,057.56 Other equity 13,766.09 12,246.92 Total equity 14,826.39 13,304.48 LiabilitiesNon-current liabilities Financial liabilities Borrowings 13A 1,416.59 1,245.62 Provisions 15A 208.39 145.88 Other non-current liabilities 14A 646.97 630.72 Total non-current liabilities 2,271.95 2,022.22 Current liabilities Financial liabilities Borrowings 13B 7,585.17 6,441.71 Trade payables 13C 3,123.27 2,630.99 Current maturities and other financial liabilities 13D 1,474.93 1,406.47 Other current liabilities 14B 837.65 584.66 Provisions 15B 44.74 47.06 Income tax liabilities (net) 16B 3.10 96.61 Total current liabilities 13,068.86 11,207.50 Total - equity and liabilities 30,167.20 26,534.20 Summary of significant accounting policies 2.2
(All amounts in Million Rupees except for share data or as otherwise stated)
Laurus Labs Limited
Annual Report 2017-18140

The accompanying notes are an integral part of the financial statements. As per our report of even date
For Deloitte Haskins & Sells LLP For and on behalf of the Board of Directors Chartered Accountants LAURUS LABS LIMITED ICAI FirmRegistration Number :117366W/W-100018
P. R. Ramesh Dr. C. Satyanarayana V. V. Ravi Kumar Partner Membership No. 70928
Whole Time Director & Chief Executive Officer DIN: 00211921
Executive Director & Chief Financial Officer DIN: 01424180
Place: Hyderabad Place: Hyderabad G. Venkateswar Reddy Date: May 10, 2018 Date: May 10, 2018 Company Secretary
CONSOLIDATED STATEMENT OF PROFIT AND LOSS for the year ended March 31, 2018
Notes For the year ended
March 31, 2018 For the year ended
March 31, 2017
I. Income Revenue from operations 17 20,690.03 19,315.49 Other income 18 284.31 319.33 Total income ( I ) 20,974.34 19,634.82
II. Expenses Cost of materials consumed 19 10,613.94 10,187.05 Purchase of traded goods 270.15 129.60 Changes in inventories of finished goods, work-in-progress and stock-in-trade 20 (247.04) (349.00)Excise duty 128.33 269.02 Employee benefits expenses 21 2,580.47 2,233.90 Other expenses 22 3,210.98 2,768.57 Total expenses ( II ) 16,556.83 15,239.14
III. Earnings before Interest, Tax, Depreciation and Amortisation (EBITDA) (I-II) 4,417.51 4,395.68 Depreciation and amortisation 3 & 4 1,254.53 1,059.82 Finance income 23A (7.62) (15.05)Finance costs 23B 796.44 998.96
IV. Profit before tax 2,374.16 2,351.95 V. Tax expense 27
Current tax 531.09 533.09 Adjustment of current tax relating to earlier years (2.62) - Deferred tax 120.92 (78.62)Adjustment of deferred tax relating to earlier years 48.67 (15.83)Total tax expense 698.06 438.64
VI. Share of loss of an associate - (10.55)VII. Profit for the year (IV-V) 1,676.10 1,902.76
Other comprehensive income (OCI) 24Items that will not be reclassified subsequently to profit or loss: Re-measurement gains / (losses) on employee defined benefit plans 1.07 (10.55) Income tax relating to items that will not reclassified to profit or
loss in subsequent periods (0.30) 3.62
0.77 (6.93)Items that will be reclassified subsequently to profit or loss: Exchange differences on translation of foreign operations (0.57) 1.74
(0.57) 1.74 Total other comprehensive income for the year, net of tax 0.20 (5.19)Total comprehensive income for the year, net of tax 1,676.30 1,897.57 Earnings per equity share ` 10/- each fully paid (March 31, 2017: ` 10/- each fully paid)
25
Computed on the basis of total profit for the year Basic (`) 15.83 20.78 Diluted (`) 15.76 20.78 Summary of significant accounting policies 2.2
(All amounts in Million Rupees except for share data or as otherwise stated)
141Building Momentum
The Year in Review Statutory Reports Financial Statements

CONSOLIDATED STATEMENT OF CHANGES IN EQUITY for the year ended March 31, 2018
a. Equity share capitalEquity shares of ` 10 each, fully paid up No. `
As at March 31, 2016 15,767,255 157.67 Issued during the year - ESOP 118,500 1.19 Converted from preference shares to equity shares 8,889,846 88.90 Issue of bonus shares 73,971,303 739.71 Issue of equity shares - IPO 7,009,345 70.09 As at March 31, 2017 105,756,249 1,057.56 Issued during the year 273,500 2.74 As at March 31, 2018 106,029,749 1,060.30 0.001% Compulsorily convertible participatory cumulative preference shares - Series A of ` 10/- each fully paid upAs at April 01, 2016 2,259,060 22.59 Converted during the year (2,259,060) (22.59)As at March 31, 2017 - - Changes during the year - - As at March 31, 2018 - - 0.001% Compulsorily convertible participatory cumulative preference shares - Series B of ` 243/- each fully paid upAs at April 01, 2016 2,477,387 602.01 Converted during the year (2,477,387) (602.01)As at March 31, 2017 - - Changes during the year - - As at March 31, 2018 - - 0.001% Compulsorily convertible participatory cumulative preference shares - Series C of ` 10/- each fully paid upAs at April 01, 2016 4,153,399 41.53 Converted during the year (4,153,399) (41.53)As at March 31, 2017 - - Changes during the year - - As at March 31, 2018 - -
b. Other equity
Reserves and surplusItems of Other comprehensive
incomeTotal
Capital reserveSecurities Premium
Employee Stock option
Retained Earnings
Foreign currency translation
reserve
At March 31, 2016 17.92 4,070.93 26.58 3,623.86 4.89 7,744.18 Profit for the year - - - 1,902.76 - 1,902.76 Other comprehensive income
(Refer note 24) - - - (6.93) 1.74 (5.19)
Total comprehensive income 17.92 4,070.93 26.58 5,519.69 6.63 9,641.75 Transferred from stock options outstanding - 5.94 (5.94) - - Expense arising from equity-settled
share-based payment transactions - - 37.89 - - 37.89
- Premium on conversion of CCPS - 577.23 - - - 577.23 - Premium on IPO Allotment (net of share
issue expenses) (refer note no. 43) - 2,789.15 - - - 2,789.15
- Issue of bonus shares (739.71) - - - (739.71)Final dividend to equity and preference shareholders
- Final dividend on equity shares (refer note no. 12)
- - - (31.53) - (31.53)
- Tax on final dividend on equity shares - - - (6.42) - (6.42) - Final dividend on CCPCPS - Series A,
Series B and Series C (refer note no. 12) - - - (17.81) - (17.81)
- Tax on final dividend on CCPCPS - Series A, Series B and Series C
- - - (3.63) - (3.63)
(All amounts in Million Rupees except for share data or as otherwise stated)
Laurus Labs Limited
Annual Report 2017-18142

Reserves and surplusItems of Other comprehensive
incomeTotal
Capital reserveSecurities Premium
Employee Stock option
Retained Earnings
Foreign currency translation
reserve
At March 31, 2017 17.92 6,703.54 58.53 5,460.30 6.63 12,246.92 Profit for the year - - - 1,676.10 - 1,676.10 Expense arising from equity-settled share-based payment transactions
- - 33.55 - - 33.55
Transferred from stock options outstanding - 33.78 (33.53) - - 0.25 - Final dividend on equity shares - - - (158.64) - (158.64)- Tax on final dividend on equity shares - - - (32.29) - (32.29)Other comprehensive income (Refer note 24) - - - 0.77 (0.57) 0.20 At March 31, 2018 17.92 6,737.32 58.55 6,946.24 6.06 13,766.09
b. Other equity (Contd.)
(All amounts in Million Rupees except for share data or as otherwise stated)
The accompanying notes are an integral part of the financial statements. As per our report of even date
For Deloitte Haskins & Sells LLP For and on behalf of the Board of Directors Chartered Accountants LAURUS LABS LIMITED ICAI FirmRegistration Number :117366W/W-100018
P. R. Ramesh Dr. C. Satyanarayana V. V. Ravi Kumar Partner Membership No. 70928
Whole Time Director & Chief Executive Officer DIN: 00211921
Executive Director & Chief Financial Officer DIN: 01424180
Place: Hyderabad Place: Hyderabad G. Venkateswar Reddy Date: May 10, 2018 Date: May 10, 2018 Company Secretary
143Building Momentum
The Year in Review Statutory Reports Financial Statements

CONSOLIDATED STATEMENT OF CASH FLOW for the year ended March 31, 2018
For the year ended March 31, 2018
For the year ended March 31, 2017
Profit before tax 2,374.16 2,351.95 Cash flows from operating activitiesAdjustments for : Depreciation of property, plant and equipment 1,219.26 1,032.70 Amortisation of intangible assets 35.27 27.12 Loss on sale of fixed assets (net) 5.20 4.38 Interest income (7.62) (15.05) Interest expenses 760.85 931.19 Share based payment expense 33.55 37.89 Net loss/ (gain) on foreign exchange fluctuations (unrealised) 85.06 (52.74) Advances and bad debts written off (Net) - 0.20 Allowance for/ (Reversal of) bad and doubtful advances and receivables 9.30 37.25 Provisions no longer required written back 37.41 - Profit on sale of investment - (3.19) (Reversal of)/ allowance for insurance claim receivable - (39.35) Gratuity and compensated absences 61.26 33.39 Operating profit before working capital changes 4,613.70 4,345.74 Movement In working capital: Increase in inventories (757.37) (123.13) (Increase)/ Decrease in trade receivables 21.14 (1,201.85) Increase in financial and non-financial assets (344.45) (78.76) Increase in trade payables 408.47 (74.67) Increase in financial, non-financial liabilities and provisions 102.60 953.87 Cash generated from operations 4,044.09 3,821.20 Income tax paid (619.15) (501.35)Net cash flows from operating activities (A) 3,424.94 3,319.85 Cash flows used in investing activities Purchase of property, plant and equipment, including intangible assets, capital work in
progress and capital advances (3,911.12) (2,774.99)
Proceeds from sale of property, plant and equipment 0.11 0.93 Proceeds from sale of investments in deposits 61.87 106.46 Purchase of investments - (34.05) Acquisition of subsidiary (net of cash acquired) - (203.14) Disposal of subsidiary - 3.00 Interest received 7.62 15.05 Net cash flows used in investing activities (B) (3,841.52) (2,886.74)Net cash flows (used in)/ from financing activities Proceeds from issue of equity shares (net of share issue expenses: ` nil (March 31, 2017: ` 137.86)) - 2,859.24 Proceeds from exercise of employee stock options 2.74 1.19 Repayment of long - term borrowings (1,072.54) (4,390.88) Proceeds from long - term borrowings 1,313.38 572.56 Proceeds from short - term borrowings (net) 1,131.16 1,431.55 Dividend paid (158.64) (49.34) Tax on dividend (32.29) (10.05) Interest paid (761.38) (950.35)Net cash flows from / (used in) financing activities (C) 422.43 (536.08)
(All amounts in Million Rupees except for share data or as otherwise stated)
Laurus Labs Limited
Annual Report 2017-18144

For the year ended March 31, 2018
For the year ended March 31, 2017
Net Decrease in cash and cash equivalents (A+B+C) 5.85 (102.97)Effect of exchange differences on cash and cash equivalents (0.04) (0.86)Cash and cash equivalents at the beginning of the year 24.23 128.06 Cash and cash equivalents at the year end 30.04 24.23 Components of cash and cash equivalents: Cash on hand 2.11 2.20 Balances with banks On current accounts 24.34 19.46 On deposit accounts 3.59 2.57 Total cash and cash equivalents 30.04 24.23
(All amounts in Million Rupees except for share data or as otherwise stated)
The accompanying notes are an integral part of the financial statements. As per our report of even date
For Deloitte Haskins & Sells LLP For and on behalf of the Board of Directors Chartered Accountants LAURUS LABS LIMITED ICAI FirmRegistration Number :117366W/W-100018
P. R. Ramesh Dr. C. Satyanarayana V. V. Ravi Kumar Partner Membership No. 70928
Whole Time Director & Chief Executive Officer DIN: 00211921
Executive Director & Chief Financial Officer DIN: 01424180
Place: Hyderabad Place: Hyderabad G. Venkateswar Reddy Date: May 10, 2018 Date: May 10, 2018 Company Secretary
145Building Momentum
The Year in Review Statutory Reports Financial Statements

(All amounts in Million Rupees except for share data or as otherwise stated)
NOTES to Consolidated financial statements for the year ended March 31, 2018
1. Corporate information The consolidated financial statements comprise financial
statements of Laurus Labs Limited (the 'Company') and its subsidiaries (collectively, the 'Group') for the year ended March 31, 2018. The Company is a public company domiciled in India and is incorporated under the provisions of the Companies Act applicable in India. The Company's shares are listed on BSE Limited and National Stock Exchange of India Limited in India. The registered office of the company is located at Plot no. 21, Jawaharlal Nehru Pharma city, Parawada, Vishakapatnam, Andhra Pradesh, India - 531201.
The Group is principally engaged in offering a broad and integrated portfolio of Active Pharmaceuticals Ingredients (API) including intermediates, Generic Finished dosage forms (FDF) and Contract Research services to cater to the needs of the global pharmaceutical industry. Information on the Group’s structure is provided in Note 38. Information on other related party relationships of the Group is provided in Note 32.
The consolidated financial statements were authorised for issue in accordance with a resolution of the directors on May 10, 2018.
2. Significant accounting policies 2.1 Basis of preparation (a) The financial statements of the Group have been
prepared in accordance with Indian Accounting Standards ('Ind AS'), under the historical cost convention on the accrual basis except for certain financial instruments which are measured at fair values, the provisions of the Companies Act, 2013 ('the Act') (to the extent notified) and guidelines issued by Securities and Exchange Board of India (SEBI). The Ind AS are prescribed under Section 133 of the Act read with Rule 3 of the Companies (Indian Accounting Standards) Rules, 2015 and relevant amendment rules issued there after.
The consolidated financial statements have been prepared on a historical cost convention and on an accrual basis, except for the following assets and liabilities which have been measured at fair value or revalued amount required by relevant Ind AS:
i Derivative financial instruments;
ii Certain financial assets and liabilities measured at fair value (refer accounting policy regarding financial instruments).
The financial statements are presented in Indian Rupees and all values are rounded to the nearest millions, except otherwise indicated.
Basis of consolidation The Consolidated financial statements comprise the
financial statements of the Group as at March 31, 2018 and March 31, 2017.
Control is achieved when the Group is exposed, or has rights, to variable returns from its involvement with the investee and has the ability to affect those returns through its power over the investee. Specifically, the Group controls an investee if and only if the Group has:
Power over the investee (i.e. existing rights that give it the current ability to direct the relevant activities of the investee)
Exposure, or rights, to variable returns from its involvement with the investee, and
The ability to use its power over the investee to affect its returns.
Generally, there is a presumption that a majority of voting rights result in control. To support this presumption and when the Group has less than a majority of the voting or similar rights of an investee, the Group considers all relevant facts and circumstances in assessing whether it has power over an investee, including:
The contractual arrangement with the other vote holders of the investee
Rights arising from other contractual arrangements
The Group’s voting rights and potential voting rights
The Group re-assesses whether or not it controls an investee if facts and circumstances indicate that there are changes to one or more of the three elements of control. Consolidation of a subsidiary begins when the Group obtains control over the subsidiary and ceases when the Group loses control of the subsidiary. Assets, liabilities, income and expenses of a subsidiary acquired or disposed of during the year are included in the consolidated financial statements from the date the Group gains control until the date the Group ceases to control the subsidiary.
Consolidated financial statements are prepared using uniform accounting policies for like transactions and other events in similar circumstances. If a member of the group uses accounting policies other than those adopted in the consolidated financial statements for like transactions and events in similar circumstances,
Laurus Labs Limited
Annual Report 2017-18146
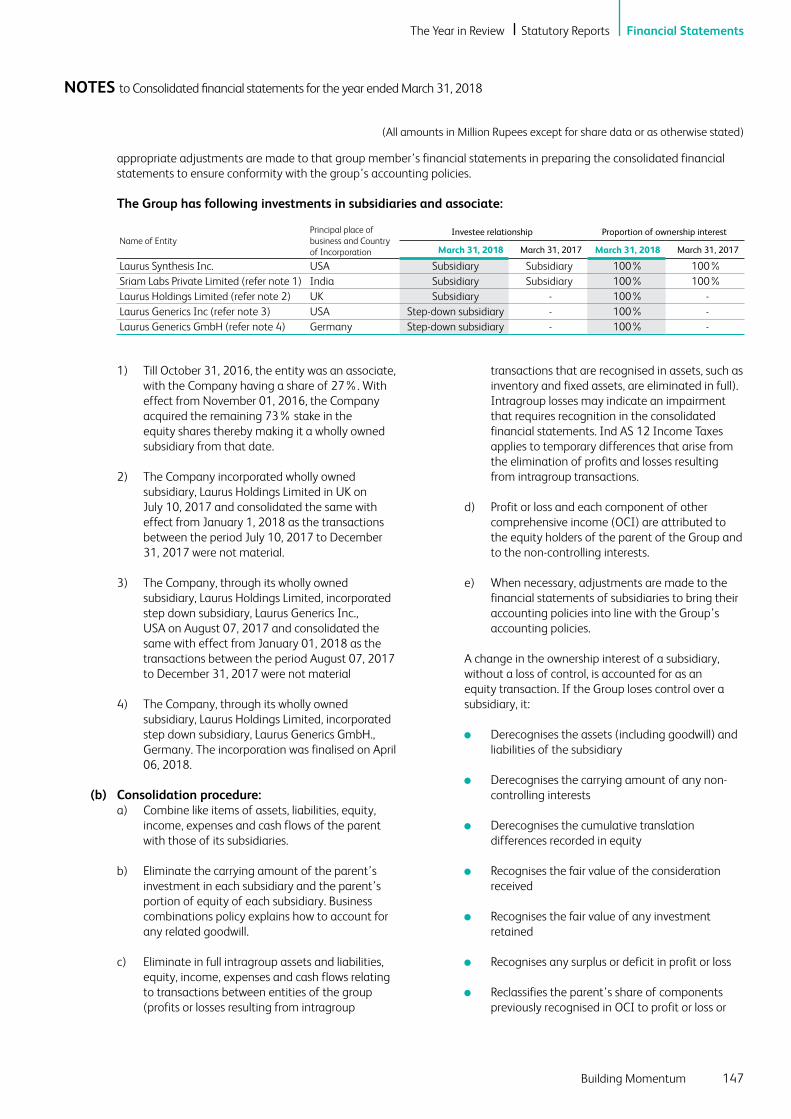
(All amounts in Million Rupees except for share data or as otherwise stated)
NOTES to Consolidated financial statements for the year ended March 31, 2018
appropriate adjustments are made to that group member’s financial statements in preparing the consolidated financial statements to ensure conformity with the group’s accounting policies.
The Group has following investments in subsidiaries and associate:
Name of EntityPrincipal place of business and Country of Incorporation
Investee relationship Proportion of ownership interest
March 31, 2018 March 31, 2017 March 31, 2018 March 31, 2017
Laurus Synthesis Inc. USA Subsidiary Subsidiary 100% 100%Sriam Labs Private Limited (refer note 1) India Subsidiary Subsidiary 100% 100%Laurus Holdings Limited (refer note 2) UK Subsidiary - 100% - Laurus Generics Inc (refer note 3) USA Step-down subsidiary - 100% - Laurus Generics GmbH (refer note 4) Germany Step-down subsidiary - 100% -
1) Till October 31, 2016, the entity was an associate, with the Company having a share of 27%. With effect from November 01, 2016, the Company acquired the remaining 73% stake in the equity shares thereby making it a wholly owned subsidiary from that date.
2) The Company incorporated wholly owned subsidiary, Laurus Holdings Limited in UK on July 10, 2017 and consolidated the same with effect from January 1, 2018 as the transactions between the period July 10, 2017 to December 31, 2017 were not material.
3) The Company, through its wholly owned subsidiary, Laurus Holdings Limited, incorporated step down subsidiary, Laurus Generics Inc., USA on August 07, 2017 and consolidated the same with effect from January 01, 2018 as the transactions between the period August 07, 2017 to December 31, 2017 were not material
4) The Company, through its wholly owned subsidiary, Laurus Holdings Limited, incorporated step down subsidiary, Laurus Generics GmbH., Germany. The incorporation was finalised on April 06, 2018.
(b) Consolidation procedure: a) Combine like items of assets, liabilities, equity,
income, expenses and cash flows of the parent with those of its subsidiaries.
b) Eliminate the carrying amount of the parent’s investment in each subsidiary and the parent’s portion of equity of each subsidiary. Business combinations policy explains how to account for any related goodwill.
c) Eliminate in full intragroup assets and liabilities, equity, income, expenses and cash flows relating to transactions between entities of the group (profits or losses resulting from intragroup
transactions that are recognised in assets, such as inventory and fixed assets, are eliminated in full). Intragroup losses may indicate an impairment that requires recognition in the consolidated financial statements. Ind AS 12 Income Taxes applies to temporary differences that arise from the elimination of profits and losses resulting from intragroup transactions.
d) Profit or loss and each component of other comprehensive income (OCI) are attributed to the equity holders of the parent of the Group and to the non-controlling interests.
e) When necessary, adjustments are made to the financial statements of subsidiaries to bring their accounting policies into line with the Group’s accounting policies.
A change in the ownership interest of a subsidiary, without a loss of control, is accounted for as an equity transaction. If the Group loses control over a subsidiary, it:
Derecognises the assets (including goodwill) and liabilities of the subsidiary
Derecognises the carrying amount of any non-controlling interests
Derecognises the cumulative translation differences recorded in equity
Recognises the fair value of the consideration received
Recognises the fair value of any investment retained
Recognises any surplus or deficit in profit or loss
Reclassifies the parent’s share of components previously recognised in OCI to profit or loss or
147Building Momentum
The Year in Review Statutory Reports Financial Statements

(All amounts in Million Rupees except for share data or as otherwise stated)
NOTES to Consolidated financial statements for the year ended March 31, 2018
retained earnings, as appropriate, as would be required if the Group had directly disposed of the related assets or liabilities.
2.2 Summary of significant accounting policies (a) Business combinations and goodwill In accordance with Ind-AS 101 provisions related to
first time adoption, the Group has elected to apply Ind AS accounting for business combinations prospectively from April 01, 2015. As such, Indian GAAP balances relating to business combinations entered into before that date, including goodwill, have been carried forward with minimal adjustment. Similarly, such first time adoption exemption is also adopted for associate.
Business combinations are accounted for using the acquisition method. The cost of an acquisition is measured as the aggregate of the consideration transferred measured at acquisition date fair value and the amount of any non-controlling interests in the acquiree. For each business combination, the Group elects whether to measure the non-controlling interests in the acquiree at fair value or at the proportionate share of the acquiree’s identifiable net assets. Acquisition-related costs are expensed as incurred.
At the acquisition date, the identifiable assets acquired and the liabilities assumed are recognised at their acquisition date fair values. For this purpose, the liabilities assumed include contingent liabilities representing present obligation and they are measured at their acquisition fair values irrespective of the fact that outflow of resources embodying economic benefits is not probable. However, the following assets and liabilities acquired in a business combination are measured at the basis indicated below:
Deferred tax assets or liabilities, and the assets or liabilities related to employee benefit arrangements are recognised and measured in accordance with Ind AS 12 Income Tax and Ind AS 19 Employee Benefits respectively.
Liabilities or equity instruments related to share based payment arrangements of the acquiree or share based payments arrangements of the Group entered into to replace share-based payment arrangements of the acquiree are measured in accordance with Ind AS 102 Share-based Payments at the acquisition date.
When the Group acquires a business, it assesses the financial assets and liabilities assumed for appropriate classification and designation in accordance with the contractual terms, economic circumstances and
pertinent conditions as at the acquisition date. This includes the separation of embedded derivatives in host contracts by the acquiree.
If the business combination is achieved in stages, any previously held equity interest is re-measured at its acquisition date fair value and any resulting gain or loss is recognised in profit or loss or OCI.
Goodwill is initially measured at cost, being the excess of the aggregate of the consideration transferred and the amount recognised for non-controlling interests, and any previous interest held, over the net identifiable assets acquired and liabilities assumed. If the fair value of the net assets acquired is in excess of the aggregate consideration transferred, the Group re-assesses whether it has correctly identified all of the assets acquired and all of the liabilities assumed and reviews the procedures used to measure the amounts to be recognised at the acquisition date. If the reassessment still results in an excess of the fair value of net assets acquired over the aggregate consideration transferred, then the gain is recognised in OCI and accumulated in equity as capital reserve. However, if there is no clear evidence of bargain purchase, the entity recognises the gain directly in equity as capital reserve, without routing the same through OCI.
After initial recognition, goodwill is measured at cost less any accumulated impairment losses. For the purpose of impairment testing, goodwill acquired in a business combination is, from the acquisition date, allocated to each of the Group’s cash-generating units that are expected to benefit from the combination, irrespective of whether other assets or liabilities of the acquiree are assigned to those units.
A cash generating unit to which goodwill has been allocated is tested for impairment annually, or more frequently when there is an indication that the unit may be impaired. If the recoverable amount of the cash generating unit is less than its carrying amount, the impairment loss is allocated first to reduce the carrying amount of any goodwill allocated to the unit and then to the other assets of the unit pro rata based on the carrying amount of each asset in the unit. Any impairment loss for goodwill is recognised in Statement of Profit and Loss. An impairment loss recognised for goodwill is not reversed in subsequent periods.
Where goodwill has been allocated to a cash-generating unit and part of the operation within that unit is disposed of, the goodwill associated with the disposed operation is included in the carrying amount
Laurus Labs Limited
Annual Report 2017-18148

(All amounts in Million Rupees except for share data or as otherwise stated)
NOTES to Consolidated financial statements for the year ended March 31, 2018
of the operation when determining the gain or loss on disposal. Goodwill disposed in these circumstances is measured based on the relative values of the disposed operation and the portion of the cash-generating unit retained.
(b) Current versus non-current classification The Group presents assets and liabilities in the balance
sheet based on current/ non-current classification. An asset is treated as current when it is:
Expected to be realised or intended to be sold or consumed in normal operating cycle
Held primarily for the purpose of trading
Expected to be realised within twelve months after the reporting period, or
Cash or cash equivalent unless restricted from being exchanged or used to settle a liability for at least twelve months after the reporting period
All other assets are classified as non-current.
A liability is current when:
It is expected to be settled in normal operating cycle
It is held primarily for the purpose of trading
It is due to be settled within twelve months after the reporting period, or
There is no unconditional right to defer the settlement of the liability for at least twelve months after the reporting period
The Group classifies all other liabilities as non-current.
Deferred tax assets and liabilities are classified as non-current assets and liabilities.
The operating cycle is the time between the acquisition of assets for processing and their realisation in cash and cash equivalents. The Group has identified twelve months as its operating cycle.
(c) Foreign currencies The Group's consolidated financial statements are
presented in Indian rupees, which is also the parent company's functional currency. For each entity the Group determines the functional currency and items included in the financial statements of each entity are measured using that functional currency. The
Group uses the direct method of consolidation and on disposal of a foreign operation the gain or loss that is reclassified to profit or loss reflects the amount that arises from using this method.
Transactions and balances Transactions in foreign currencies are initially recorded
by the Group at its functional currency spot rates at the date the transaction first qualifies for recognition. However, for practical reasons, the group uses an average rate if the average approximates the actual rate at the date of the transaction.
Monetary assets and liabilities denominated in foreign currencies are translated at the functional currency spot rates of exchange at the reporting date.
Exchange differences arising on settlement or translation of monetary items are recognised in profit or loss except with the exception of exchange differences arising on monetary items that forms part of a reporting entity’s net investment in a foreign operation are recognised in profit or loss in the separate financial statements of the reporting entity or the individual financial statements of the foreign operation, as appropriate. In the financial statements that include the foreign operation and the reporting entity, such exchange differences are recognised initially in OCI. These exchange differences are reclassified from equity to profit or loss on disposal of the net investment.
Non-monetary items that are measured in terms of historical cost in a foreign currency are translated using the exchange rates at the dates of the initial transactions. Non-monetary items measured at fair value in a foreign currency are translated using the exchange rates at the date when the fair value is determined. The gain or loss arising on translation of non-monetary items measured at fair value is treated in line with the recognition of the gain or loss on the change in fair value of the item (i.e., translation differences on items whose fair value gain or loss is recognised in OCI or profit or loss are also recognised in OCI or profit or loss, respectively).
Group Companies On consolidation, the assets and liabilities of foreign
operations are translated into functional currency at the rate of exchange prevailing at the reporting date and their statements of profit or loss are translated at exchange rates prevailing at the dates of the transactions. For practical reasons, the Group uses an average rate to translate income and expense items, if the average rate approximates the exchange rates at the date of transactions. The exchange differences
149Building Momentum
The Year in Review Statutory Reports Financial Statements
(All amounts in Million Rupees except for share data or as otherwise stated)
NOTES to Consolidated financial statements for the year ended March 31, 2018
arising on translation for consolidation are recognised in OCI. On disposal of a foreign operation, the component of OCI relating to that particular foreign operation is recognised in Statement of Profit and Loss.
(d) Fair value measurement The Group measures financial instruments, such as,
derivatives at fair value at each balance sheet date.
Fair value is the price that would be received to sell an asset or paid to transfer a liability in an orderly transaction between market participants at the measurement date. The fair value measurement is based on the presumption that the transaction to sell the asset or transfer the liability takes place either:
In the principal market for the asset or liability, or
In the absence of a principal market, in the most advantageous market for the asset or liability
The principal or the most advantageous market must be accessible by the Group. The fair value of an asset or a liability is measured using the assumptions that market participants would use when pricing the asset or liability, assuming that market participants act in their economic best interest.
A fair value measurement of a non-financial asset takes into account a market participant’s ability to generate economic benefits by using the asset in its highest and best use or by selling it to another market participant that would use the asset in its highest and best use.
The Group uses valuation techniques that are appropriate in the circumstances and for which sufficient data are available to measure fair value, maximising the use of relevant observable inputs and minimising the use of unobservable inputs
All assets and liabilities for which fair value is measured or disclosed in the consolidated financial statements are categorised within the fair value hierarchy, described as follows, based on the lowest level input that is significant to the fair value measurement as a whole:
Level 1 : Quoted (unadjusted) market prices in active markets for identical assets or liabilities
Level 2 : Valuation techniques for which the lowest level input that is significant to the fair value measurement is directly or indirectly observable
Level 3 : Valuation techniques for which the lowest level input that is significant to the fair value measurement is unobservable
For assets and liabilities that are recognised in the consolidated financial statements on a recurring basis, the Group determines whether transfers have occurred between levels in the hierarchy by re-assessing categorisation (based on the lowest level input that is significant to the fair value measurement as a whole) at the end of each reporting period.
The Company's chief financial officer determines the appropriate valuation techniques and inputs for fair value measurements. In estimating the fair value of an asset or a liability, the Group uses market-observable data to the extent it is available. Where level 1 inputs are not available, the Group engages third party qualified valuers to perform the valuation. Any change in the fair value of each asset and liability is also compared with relevant external sources to determine whether the change is reasonable.
For the purpose of fair value disclosures, the Group has determined classes of assets and liabilities on the basis of the nature, characteristics and risks of the asset or liability and the level of the fair value hierarchy as explained above.
(e) Revenue recognition Revenue is recognised to the extent that it is probable
that the economic benefits will flow to the Group and the revenue can be reliably measured, regardless of when the payment is being made. Revenue is measured at the fair value of the consideration received or receivable, taking into account contractually defined terms of payment and excluding taxes or duties collected on behalf of the government. The Group has concluded that it is the principal in all of its revenue arrangements since it is the primary obligor in all the revenue arrangements as it has pricing latitude and is also exposed to inventory and credit risks
The specific recognition criteria described below must also be met before revenue is recognised.
Sale of products Revenue from sale of goods is recognised when all the
significant risks and rewards of ownership of the goods have been passed to the buyer, usually on delivery of the goods and acceptance by the buyer and any the additional amount is recognised based on the terms of the agreement entered into with customers, in the period when the collectability of the profit share becomes probable and a reliable measure of the profit
Laurus Labs Limited
Annual Report 2017-18150

(All amounts in Million Rupees except for share data or as otherwise stated)
NOTES to Consolidated financial statements for the year ended March 31, 2018
share is available. Revenue from the sale of goods is measured at the fair value of the consideration received or receivable, net of returns and allowances, trade discounts and volume rebates.
Based on the Educational Material on Ind AS 18 issued by the ICAI, the Group has assumed that recovery of excise duty flows to the Group on its own account. This is for the reason that it is a liability of the manufacturer which forms part of the cost of production, irrespective of whether the goods are sold or not. Since the recovery of excise duty flows to the Group on its own account, revenue includes excise duty.
However, sales tax/ value added tax (VAT) is not received by the Group on its own account. Rather, it is tax collected on value added to the commodity by the seller on behalf of the government. Accordingly, it is excluded from revenue.
The Government of India introduced the Goods and Services Tax (GST) with effect from July 01, 2017. Accordingly, in compliance with Indian Accounting Standard (Ind AS) 18 - 'Revenue', Revenue from operations for for the year ended March 31, 2018 includes Excise duty up to June 30, 2017. Revenue from operations of earlier periods included Excise duty which is now subsumed in GST.
Sale of services Revenue from contract research operations is
recognised based on services performed till date as a percentage of total services. The agreed milestones are specified in the contracts with customers which determine the total services to be performed.
Interest income For all debt financial instruments measured either
at amortised cost or at fair value through other comprehensive income, interest income is recorded using the effective interest rate (EIR). EIR is the rate that exactly discounts the estimated future cash payments or receipts over the expected life of the financial instrument or a shorter period, where appropriate, to the gross carrying amount of the financial asset or to the amortised cost of a financial liability. Interest income is included in other income in the Statement of Profit and Loss.
Dividends Revenue is recognised when the Group’s right to
receive the payment is established, which is generally when shareholders approve the dividend.
Government grants Government grants are recognised where there is
reasonable assurance that the grant will be received
and all attached conditions will be complied with. When the grant relates to an expense item, it is recognised as income on a systematic basis over the periods that the related costs, for which it is intended to compensate, are expensed. When the grant relates to an asset, it is recognised as income in equal amounts over the expected useful life of the related asset.
Export incentives are recognised as income when the right to receive credit as per the terms of the scheme is established in respect of the exports made and where there is no significant uncertainty regarding the ultimate collection of the relevant export proceeds.
(f) Taxes Current income tax Current income tax assets and liabilities are measured
at the amount expected to be recovered from or paid to the taxation authorities. The tax rates and tax laws used to compute the amount are those that are enacted or substantively enacted, at the reporting date in the countries where the Group operates and generates taxable income. Current income tax relating to items recognised outside profit or loss is recognised outside profit or loss (either in other comprehensive income or in equity). Current tax items are recognised in correlation to the underlying transaction either in OCI or directly in equity.
Management periodically evaluates positions taken in the tax returns with respect to situations in which applicable tax regulations are subject to interpretation and establishes provision where appropriate.
Deferred tax Deferred tax is provided using the liability method on
temporary differences between the tax bases of assets and liabilities and their carrying amounts for financial reporting purposes at the reporting date.
Deferred tax liabilities are recognised for all taxable temporary differences, except:
When the deferred tax liability arises from the initial recognition of goodwill or an asset or liability in a transaction that is not a business combination and, at the time of the transaction, affects neither the accounting profit nor taxable profit or loss.
In respect of taxable temporary differences associated with investments in subsidiaries and associate, when the timing of the reversal of the temporary differences can be controlled and it is probable that the temporary differences will not reverse in the foreseeable future.
151Building Momentum
The Year in Review Statutory Reports Financial Statements

(All amounts in Million Rupees except for share data or as otherwise stated)
NOTES to Consolidated financial statements for the year ended March 31, 2018
Deferred tax assets are recognised for all deductible temporary differences, the carry forward of unused tax credits (MAT Credit) and any unused tax losses. Deferred tax assets are recognised to the extent that it is probable that taxable profit will be available against which the deductible temporary differences, and the carry forward of unused tax credits and unused tax losses can be utilized, except:
When the deferred tax asset relating to the deductible temporary difference arises from the initial recognition of an asset or liability in a transaction that is not a business combination and, at the time of the transaction, affects neither the accounting profit nor taxable profit or loss.
In respect of deductible temporary differences associated with investments in subsidiaries and associate, deferred tax assets are recognised only to the extent that it is probable that the temporary differences will reverse in the foreseeable future and taxable profit will be available against which the temporary differences can be utilised.
The carrying amount of deferred tax assets is reviewed at each reporting date and reduced to the extent that it is no longer probable that sufficient taxable profit will be available to allow all or part of the deferred tax asset to be utilised. Unrecognised deferred tax assets are re-assessed at each reporting date and are recognised to the extent that it has become probable that future taxable profits will allow the deferred tax asset to be recovered.
Deferred tax assets and liabilities are measured at the tax rates that are expected to apply in the period/ year when the asset is realised or the liability is settled, based on tax rates and tax laws that have been enacted or substantively enacted at the reporting date.
Deferred tax relating to items recognised outside profit or loss is recognised outside profit or loss (either in other comprehensive income or in equity). Deferred tax items are recognised in correlation to the underlying transaction either in OCI or directly in equity.
Deferred tax assets and deferred tax liabilities are offset if a legally enforceable right exists to set off current tax assets against current tax liabilities and the deferred taxes relate to the same taxable entity and the same taxation authority.
(g) Property, plant and equipment Under the previous GAAP (Indian GAAP), property,
plant and equipment and capital wok in progress were
carried in the balance sheet at cost of acquisition. The Group has elected to regard those values of property, plant and equipment as deemed cost at the date of the acquisition since there is no change in the functional currency as at April 01, 2015 (date of transition to Ind AS) on the date of transition to Ind AS. The Group has also determined that cost of acquisition or construction at deemed cost as at April 01, 2015 .
Capital work-in-progress, Property, plant and equipment is stated at cost, net of accumulated depreciation and accumulated impairment losses, if any. Such cost includes the cost of replacing part of the plant and equipment and borrowing costs for long-term construction projects if the recognition criteria are met. When significant parts of plant and equipment are required to be replaced at intervals, the Group depreciates them separately based on their specific useful lives. Likewise, when a major inspection is performed, its cost is recognised in the carrying amount of the plant and equipment as a replacement if the recognition criteria are satisfied. All other expenses on existing property, plant and equipment, including day-to-day repair and maintenance expenditure and cost of replacing parts, are charged to the Statement of Profit and Loss for the period during which such expenses are incurred.
Subsequent expenditure related to an item of property, plant and equipment is added to its book value only if it increases the future benefits from the existing asset beyond its previously assessed standard of performance or extends its estimated useful life.
Depreciation is calculated on a straight-line basis over the estimated useful lives of the assets as follows:
Factory buildings : 30 yearsOther buildings : 60 yearsPlant and equipment : 5 to 20 yearsFurniture and fixtures : 10 yearsVehicles : 5 yearsComputers : 3 to 6 years
The Group, based on technical assessment and management estimate, depreciates certain items of plant and equipment and vehicles over estimated useful lives which are different from the useful life prescribed in Schedule II to the Companies Act, 2013. The management believes that these estimated useful lives are realistic and reflect fair approximation of the period over which the assets are likely to be used.
An item of property, plant and equipment and any significant part initially recognised is derecognised upon disposal or when no future economic benefits are expected from its use or disposal. Any gain or
Laurus Labs Limited
Annual Report 2017-18152

(All amounts in Million Rupees except for share data or as otherwise stated)
NOTES to Consolidated financial statements for the year ended March 31, 2018
loss arising on derecognition of the asset (calculated as the difference between the net disposal proceeds and the carrying amount of the asset) is included in the Statement of Profit and Loss when the asset is derecognised.
The residual values, useful lives and methods of depreciation of property, plant and equipment are reviewed at each financial year end and adjusted prospectively, if appropriate.
(h) Intangible assets Intangible assets acquired separately are measured
on initial recognition at cost. The cost of intangible assets acquired in a business combination is their fair value at the date of acquisition. Following initial recognition, intangible assets are carried at cost less any accumulated amortisation and accumulated impairment losses.
Computer Software Costs relating to software, which is acquired, are
capitalised and amortised on a straight-line basis over their estimated useful lives of five years.
Gains or losses arising from derecognition of an intangible asset are measured as the difference between the net disposal proceeds and the carrying amount of the asset and are recognised in the Statement of Profit and Loss when the asset is derecognised.
Amortisation method, useful lives and residual values are reviewed at the end of each financial year and adjusted if appropriate. The amortisation period and the amortisation method for an intangible asset with a finite useful life are reviewed at least at the end of each reporting period. Changes in the expected useful life or the expected pattern of consumption of future economic benefits embodied in the asset are considered to modify the amortisation period or method, as appropriate, and are treated as changes in accounting estimates. The amortisation expense on intangible assets with finite lives is recognised in the Statement of Profit and Loss unless such expenditure forms part of carrying value of another asset.
(i) Leases The determination of whether an arrangement is
(or contains) a lease is based on the substance of the arrangement at the inception of the lease. The arrangement is, or contains, a lease if fulfillment of the arrangement is dependent on the use of a specific asset or assets and the arrangement conveys a right to use the asset or assets, even if that right is not explicitly specified in an arrangement.
Group as a lessee A lease is classified at the inception date as a finance
lease or an operating lease. A lease that transfers substantially all the risks and rewards incidental to ownership to the Group is classified as a finance lease.
Operating lease payments are recognised as an expense in the Statement of Profit and Loss on a straight-line basis over the lease term.
Group as a lessor Leases in which the Group does not transfer
substantially all the risks and rewards of ownership of an asset are classified as operating leases. Rental income from operating lease is recognised on a straight-line basis over the term of the relevant lease. Initial direct costs incurred in negotiating and arranging an operating lease are added to the carrying amount of the leased asset and recognised over the lease term on the same basis as rental income. Contingent rents are recognised as revenue in the period in which they are earned.
Leases are classified as finance leases when substantially all of the risks and rewards of ownership transfer from the Group to the lessee. Amounts due from lessees under finance leases are recorded as receivables at the Group’s net investment in the leases. Finance lease income is allocated to accounting periods so as to reflect a constant periodic rate of return on the net investment outstanding in respect of the lease.
(j) Borrowing costs Borrowing costs directly attributable to the acquisition,
construction or production of an asset that necessarily takes a substantial period of time to get ready for its intended use or sale are capitalised as part of the cost of the asset. All other borrowing costs are expensed in the period in which they occur. Borrowing costs consist of interest and other costs that an entity incurs in connection with the borrowing of funds. Borrowing cost also includes exchange differences to the extent regarded as an adjustment to the borrowing costs.
(k) Inventories Inventories are valued at the lower of cost and net
realisable value. Cost is determined on weighted average basis.
Costs incurred in bringing each product to its present location and condition are accounted for as follows:
Raw materials and packing material: Materials and other items held for use in the production of inventories are not written down below cost
153Building Momentum
The Year in Review Statutory Reports Financial Statements

(All amounts in Million Rupees except for share data or as otherwise stated)
NOTES to Consolidated financial statements for the year ended March 31, 2018
if the finished products in which they will be incorporated are expected to be sold at or above cost. Cost includes cost of purchase and other costs incurred in bringing the inventories to their present location and condition.
Finished goods and work in progress: cost includes cost of direct materials and labour and a proportion of manufacturing overheads based on the normal operating capacity, but excluding borrowing costs.
Traded goods and spare parts: cost includes cost of purchase and other costs incurred in bringing the inventories to their present location and condition.
Stores and spares are valued at the lower of cost and net realisable value.
Net realisable value is the estimated selling price in the ordinary course of business, less estimated costs of completion and the estimated costs necessary to make the sale.
(l) Impairment of non-financial assets The Group assesses, at each reporting date, whether
there is an indication that an asset may be impaired. If any indication exists, or when annual impairment testing for an asset is required, the Group estimates the asset’s recoverable amount. An asset’s recoverable amount is the higher of an asset’s or cash-generating unit’s (CGU) fair value less costs of disposal and its value in use. Recoverable amount is determined for an individual asset, unless the asset does not generate cash inflows that are largely independent of those from other assets or groups of assets. When the carrying amount of an asset or CGU exceeds its recoverable amount, the asset is considered impaired and is written down to its recoverable amount.
In assessing value in use, the estimated future cash flows are discounted to their present value using a pre-tax discount rate that reflects current market assessments of the time value of money and the risks specific to the asset. In determining fair value less costs of disposal, recent market transactions are taken into account. If no such transactions can be identified, an appropriate valuation model is used. These calculations are corroborated by valuation multiples, quoted share prices for publicly traded companies or other available fair value indicators.
The Group bases its impairment calculation on detailed budgets and forecast calculations, which are prepared separately for each of the Group’s CGUs to which the individual assets are allocated.
Impairment losses, including impairment on inventories, are recognised in the Statement of Profit and Loss. For assets excluding goodwill, an assessment is made at each reporting date to determine whether there is an indication that previously recognised impairment losses no longer exist or have decreased. If such indication exists, the Group estimates the asset’s or CGU’s recoverable amount. A previously recognised impairment loss is reversed only if there has been a change in the assumptions used to determine the asset’s recoverable amount since the last impairment loss was recognised. The reversal is limited so that the carrying amount of the asset does not exceed its recoverable amount, nor exceed the carrying amount that would have been determined, net of depreciation, had no impairment loss been recognised for the asset in prior periods/ years. Such reversal is recognised in the statement of profit or loss.
Goodwill is tested for impairment annually and when circumstances indicate that the carrying value may be impaired.
Impairment is determined for goodwill by assessing the recoverable amount of each CGU (or group of CGUs) to which the goodwill relates. When the recoverable amount of the CGU is less than its carrying amount, an impairment loss is recognised. Impairment losses relating to goodwill cannot be reversed in future periods.
(m) Provisions Provisions are recognised when the Group has a
present obligation (legal or constructive) as a result of a past event, it is probable that an outflow of resources embodying economic benefits will be required to settle the obligation and a reliable estimate can be made of the amount of the obligation. When the Group expects some or all of a provision to be reimbursed, for example, under an insurance contract, the reimbursement is recognised as a separate asset, but only when the reimbursement is virtually certain. The expense relating to a provision is presented in the Statement of Profit and Loss net of any reimbursement.
If the effect of the time value of money is material, provisions are discounted using a current pre-tax rate that reflects, when appropriate, the risks specific to the liability. When discounting is used, the increase in the provision due to the passage of time is recognised as a finance cost.
(n) Retirement and other employee benefits Retirement benefit in the form of provident fund is
a defined contribution scheme. The Group has no obligation, other than the contribution payable to the
Laurus Labs Limited
Annual Report 2017-18154

(All amounts in Million Rupees except for share data or as otherwise stated)
NOTES to Consolidated financial statements for the year ended March 31, 2018
provident fund. The Group recognizes contribution payable to the provident fund scheme as an expense, when an employee renders the related service. If the contribution payable to the scheme for service received before the balance sheet date exceeds the contribution already paid, the deficit payable to the scheme is recognized as a liability after deducting the contribution already paid. If the contribution already paid exceeds the contribution due for services received before the balance sheet date, then excess is recognized as an asset to the extent that the pre-payment will lead to, for example, a reduction in future payment or a cash refund.
The Group operates a defined benefit gratuity plan in India, which requires contributions to be made to a separately administered fund by a third party.
The cost of providing benefits under the defined benefit plan is determined based on projected unit credit method.
Remeasurements, comprising of actuarial gains and losses, the effect of the asset ceiling, excluding amounts included in net interest on the net defined benefit liability and the return on plan assets (excluding amounts included in net interest on the net defined benefit liability), are recognised immediately in the Balance Sheet with a corresponding debit or credit to retained earnings through Other comprehensive income ("OCI") in the period in which they occur. Remeasurements are not reclassified to Statement of Profit and Loss in subsequent periods.
Past service costs are recognised in profit or loss on the earlier of:
The date of the plan amendment or curtailment, and
The date that the Group recognises related restructuring costs
Net interest is calculated by applying the discount rate to the net defined benefit liability or asset. The Group recognises the following changes in the net defined benefit obligation as an expense in the Statement of Profit and Loss:
Service costs comprising current service costs, past-service costs, gains and losses on curtailments and non-routine settlements; and
Net interest expense or income
The Group treats accumulated leaves which are to be settled after 12 months as a long-term employee
benefit and accumulated leaves which are to be settled in the next 12 months as a short-term employee benefit for measurement purposes. Such accumulated leaves are provided for based on an actuarial valuation using the projected unit credit method at the year-end. Actuarial gains/losses are immediately taken to the Statement of Profit and Loss and are not deferred. The Group presents the entire liability in respect of leave as a current liability in the balance sheet, since it does not have an unconditional right to defer its settlement beyond 12 months after the reporting date.
(o) Share-based payments Employees of the Group receive remuneration in the
form of share-based payments, whereby employees render services as consideration for equity instruments.
Equity-settled transactions The cost of equity-settled transactions is determined
by the fair value at the date when the grant is made using Black Scholes valuation model.
That cost is recognised, together with a corresponding increase in share-based payment (SBP) reserves in equity, over the period in which the performance and/or service conditions are fulfilled in employee benefits expense. The cumulative expense recognised for equity-settled transactions at each reporting date until the vesting date reflects the extent to which the vesting period has expired and the Group’s best estimate of the number of equity instruments that will ultimately vest. The Statement of Profit and Loss expense or credit for a period represents the movement in cumulative expense recognised as at the beginning and end of that period and is recognised in employee benefits expense.
Service and non-market performance conditions are not taken into account when determining the grant date fair value of awards, but the likelihood of the conditions being met is assessed as part of the Group’s best estimate of the number of equity instruments that will ultimately vest. Market performance conditions are reflected within the grant date fair value.
The dilutive effect of outstanding options is reflected as additional share dilution in the computation of diluted earnings per share.
(p) Financial instruments A financial instrument is any contract that gives rise to
a financial asset of one entity and a financial liability or equity instrument of another entity.
Financial assets: Initial recognition and measurement All financial assets are recognised initially at fair value
plus, in the case of financial assets not recorded at fair
155Building Momentum
The Year in Review Statutory Reports Financial Statements

(All amounts in Million Rupees except for share data or as otherwise stated)
NOTES to Consolidated financial statements for the year ended March 31, 2018
value through profit or loss, transaction costs that are attributable to the acquisition of the financial asset. Purchases or sales of financial assets that require delivery of assets within a time frame established by regulation or convention in the market place (regular way trades) are recognised on the trade date, i.e., the date that the Group commits to purchase or sell the asset.
Subsequent measurement For purposes of subsequent measurement, a ‘debt
instrument’ is measured at the amortised cost if both the following conditions are met:
a) The asset is held within a business model whose objective is to hold assets for collecting contractual cash flows, and
b) Contractual terms of the asset give rise on specified dates to cash flows that are solely payments of principal and interest (SPPI) on the principal amount outstanding.
After initial measurement, such financial assets are subsequently measured at amortised cost using the effective interest rate (EIR) method. Amortised cost is calculated by taking into account any discount or premium on acquisition and fees or costs that are an integral part of the EIR. The EIR amortisation is included in finance income in the profit or loss. This category generally applies to trade and other receivables.
For purposes of subsequent measurement, Any debt instrument, which does not meet the criteria for categorization as at amortized cost or as FVTOCI, is classified as at FVTPL. FVTPL is a residual category for debt instruments.
In addition, the group may elect to designate a debt instrument, which otherwise meets amortized cost or FVTOCI criteria, as at FVTPL. However, such election is allowed only if doing so reduces or eliminates a measurement or recognition inconsistency (referred to as ‘accounting mismatch’). The group has not designated any debt instrument as at FVTPL due to recognition inconsistency.
Debt instruments included within the FVTPL category are measured at fair value with all changes recognized in the Statement of Profit and Loss.
Further, All equity investments in scope of Ind AS 109 are measured at fair value. For equity instruments which are not held for trading, the group may make an irrevocable election to present in other comprehensive income subsequent changes in the fair value. The
group makes such election on an instrument-by-instrument basis. The classification is made on initial recognition and is irrevocable. If the group decides to classify an equity instrument as at FVTOCI, then all fair value changes on the instrument, excluding dividends, are recognized in the OCI. There is no recycling of the amounts from OCI to P&L, even on sale of investment. However, the group may transfer the cumulative gain or loss within equity. Equity instruments included within the FVTPL category are measured at fair value with all changes recognized in the Statement of Profit and Loss.
Derecognition A financial asset (or, where applicable, a part of a
financial asset or part of a group of similar financial assets) is primarily derecognised (i.e. removed from the Group’s balance sheet) when:
a) the rights to receive cash flows from the asset have expired, or
b) the Group has transferred its rights to receive cash flows from the asset or has assumed an obligation to pay the received cash flows in full without material delay to a third party under a 'pass-through' arrangement; and either
i. the Group has transferred substantially all the risks and rewards of the asset, or
ii. the Group has neither transferred nor retained substantially all the risks and rewards of the asset, but has transferred control of the asset.
When the Group has transferred its rights to receive cash flows from an asset or has entered into a pass-through arrangement, it evaluates if and to what extent it has retained the risks and rewards of ownership. When it has neither transferred nor retained substantially all of the risks and rewards of the asset, nor transferred control of the asset, the Group continues to recognise the transferred asset to the extent of the Group’s continuing involvement. In that case, the Group also recognises an associated liability. The transferred asset and the associated liability are measured on a basis that reflects the rights and obligations that the Group has retained.
Continuing involvement that takes the form of a guarantee over the transferred asset is measured at the lower of the original carrying amount of the asset and the maximum amount of consideration that the Group could be required to repay.
Impairment of financial assets In accordance with Ind AS 109, the Group applies
expected credit loss (ECL) model for measurement
Laurus Labs Limited
Annual Report 2017-18156

(All amounts in Million Rupees except for share data or as otherwise stated)
NOTES to Consolidated financial statements for the year ended March 31, 2018
and recognition of impairment loss on the following financial assets and credit risk exposure:
a) Financial assets that are debt instruments, and are measured at amortised cost e.g., loans, deposits and bank balances.
b) Trade receivables that result from transactions that are within the scope of Ind AS 18.
The Group follows ‘simplified approach’ for recognition of impairment loss. The application of simplified approach does not require the Group to track changes in credit risk. Rather, it recognises impairment loss allowance based on lifetime ECLs at each reporting date, right from its initial recognition. For recognition of impairment loss on other financial assets and risk exposure, the Group determines that whether there has been a significant increase in the credit risk since initial recognition. If credit risk has not increased significantly, 12-month ECL is used to provide for impairment loss. However, if credit risk has increased significantly, lifetime ECL is used. If, in a subsequent period, credit quality of the instrument improves such that there is no longer a significant increase in credit risk since initial recognition, then the entity reverts to recognising impairment loss allowance based on 12-month ECL.
Lifetime ECL are the expected credit losses resulting from all possible default events over the expected life of a financial instrument. The 12-month ECL is a portion of the lifetime ECL which results from default events that are possible within 12 months after the reporting date.
ECL is the difference between all contractual cash flows that are due to the Group in accordance with the contract and all the cash flows that the entity expects to receive (i.e., all cash shortfalls), discounted at the original effective interest rate. When estimating the cash flows, an entity is required to consider:
All contractual terms of the financial instrument (including prepayment, extension and similar options) over the expected life of the financial instrument. However, in rare cases when the expected life of the financial instrument cannot be estimated reliably, then the entity is required to use the remaining contractual term of the financial instrument
Cash flows from the sale of collateral held or other credit enhancements that are integral to the contractual terms
As a practical expedient, the Group uses a provision matrix to determine impairment loss allowance on portfolio of its trade receivables. The provision matrix is
based on its historically observed default rates over the expected life of the trade receivables and is adjusted for forward-looking estimates. At every reporting date, the historical observed default rates are updated and changes in the forward-looking estimates are analysed. On that basis, the Group estimates the following provision matrix at the reporting date:
Receivables past due % of allowance
< 1 year 0%> 1 year and < 2 years 25%> 2 years and < 3 years 50%> 3 years 100%
Financial liabilities Initial recognition and measurement Financial liabilities are classified, at initial recognition,
as financial liabilities at fair value through profit or loss, loans and borrowings, payables, or as derivatives designated as hedging instruments in an effective hedge, as appropriate.
All financial liabilities are recognised initially at fair value and, in the case of loans and borrowings and payables, net of directly attributable transaction costs.
The Group’s financial liabilities include trade and other payables, loans and borrowings including bank overdrafts, and derivative financial instruments.
Subsequent measurement The measurement of financial liabilities depends on
their classification, as described below:
Financial liabilities at fair value through profit or loss
Financial liabilities at fair value through profit or loss include financial liabilities designated upon initial recognition as at fair value through profit or loss.
Financial liabilities designated upon initial recognition at fair value through profit or loss are designated as such at the initial date of recognition, and only if the criteria in Ind AS 109 are satisfied. For liabilities designated as FVTPL, fair value gains/ losses attributable to changes in own credit risk are recognized in OCI. These gains/ loss are not subsequently transferred to P&L. However, the Group may transfer the cumulative gain or loss within equity. All other changes in fair value of such liability are recognised in the statement of profit or loss. The Group has not designated any financial liability as at fair value through profit and loss.
Loans and borrowings This is the category most relevant to the group.
After initial recognition, interest-bearing loans and borrowings are
157Building Momentum
The Year in Review Statutory Reports Financial Statements

(All amounts in Million Rupees except for share data or as otherwise stated)
NOTES to Consolidated financial statements for the year ended March 31, 2018
subsequently measured at amortised cost using the EIR method. Gains and losses are recognised in profit or loss when the liabilities are derecognised as well as through the EIR amortisation process.
Amortised cost is calculated by taking into account any discount or premium on acquisition and fees or costs that are an integral part of the EIR. The EIR amortisation is included as finance costs in the Statement of Profit and Loss.
Derecognition A financial liability is derecognised when the obligation
under the liability is discharged or cancelled or expires. When an existing financial liability is replaced by another from the same lender on substantially different terms, or the terms of an existing liability are substantially modified, such an exchange or modification is treated as the derecognition of the original liability and the recognition of a new liability. The difference in the respective carrying amounts is recognised in the Statement of Profit and Loss.
Reclassification of financial assets The group determines classification of financial
assets and liabilities on initial recognition. After initial recognition, no reclassification is made for financial assets which are equity instruments and financial liabilities. For financial assets which are debt instruments, a reclassification is made only if there is a change in the business model for managing those assets. Changes to the business model are expected to be infrequent. The group’s senior management determines change in the business model as a result of external or internal changes which are significant to the group’s operations. Such changes are evident to external parties. A change in the business model occurs when the group either begins or ceases to perform an activity that is significant to its operations. If the group reclassifies financial assets, it applies the reclassification prospectively from the reclassification date which is the first day of the immediately next reporting period following the change in business model. The group does not restate any previously recognised gains, losses (including impairment gains or losses) or interest.
The following table shows various reclassification and how they are accounted for:
Original classification Revised classification Accounting treatment
Amortised cost FVTPL Fair value is measured at reclassification date. Difference between previous amortized cost and fair value is recognised in Statement of Profit and Loss.
FVTPL Amortised Cost Fair value at reclassification date becomes its new gross carrying amount. EIR is calculated based on the new gross carrying amount.
Amortised cost FVTOCI Fair value is measured at reclassification date. Difference between previous amortised cost and fair value is recognised in OCI. No change in EIR due to reclassification.
FVTOCI Amortised cost Fair value at reclassification date becomes its new amortised cost carrying amount. However, cumulative gain or loss in OCI is adjusted against fair value. Consequently, the asset is measured as if it had always been measured at amortised cost.
FVTPL FVTOCI Fair value at reclassification date becomes its new carrying amount. No other adjustment is required.
FVTOCI FVTPL Assets continue to be measured at fair value. Cumulative gain or loss previously recognized in OCI is reclassified to P&L at the reclassification date.
Offsetting of financial instruments Financial assets and financial liabilities are offset
and the net amount is reported in the consolidated balance sheet if there is a currently enforceable legal right to offset the recognised amounts and there is an intention to settle on a net basis, to realise the assets and settle the liabilities simultaneously.
(q) Derivative financial instruments The Group uses derivative financial instruments, such
as forward currency contracts to hedge its foreign currency risks. Such derivative financial instruments are initially recognised at fair value on the date on which a derivative contract is entered into and are subsequently re-measured at fair value. Derivatives are carried as financial assets when the fair value is positive and as financial liabilities when the fair value is negative.
The purchase contracts that meet the definition of a derivative under Ind-AS 109 are recognised in the Statement of Profit and Loss. Any gains or losses arising from changes in the fair value of derivatives are taken directly to profit or loss.
(r) Cash and cash equivalents Cash and cash equivalents in the balance sheet
comprise cash at banks and on hand and short-term deposits with an original maturity of three months or less, which are subject to an insignificant risk of changes in value.
For the purpose of the statement of cash flows, cash and cash equivalents consist of cash and short-term deposits, as defined above, net of outstanding bank overdrafts as they are considered an integral part of the Group’s cash management.
Laurus Labs Limited
Annual Report 2017-18158

(All amounts in Million Rupees except for share data or as otherwise stated)
NOTES to Consolidated financial statements for the year ended March 31, 2018
(s) Research and development Revenue expenditure on research and development is
charged to the Statement of Profit and Loss in the year in which it is incurred. The Group does not generate any intangible asset internally.
(t) Measurement of EBITDA The Group presents EBITDA in the Statement of Profit
and Loss, which is neither specifically required by Ind AS 1 nor defined under Ind AS. Ind AS complaint Schedule III allows companies to present line items, sub-line items and sub-totals shall be presented as an addition or substitution on the face of the financial statements when such presentation is relevant to an understanding of the group’s financial position or performance or to cater to industry/sector-specific disclosure requirements or when required for compliance with the amendments to the Companies Act or under the Indian Accounting Standards. Accordingly, the Group has elected to present EBITDA as a separate line item on the face of the statement of profit and loss and does not include depreciation and amortization expense, finance income, finance costs, share of profit/ loss from associate and tax expense in the measurement of EBITDA.
(u) Standards issued but not yet effective Appendix B to Ind AS 21, Foreign currency
transactions and advance consideration: On March 28, 2018, Ministry of Corporate Affairs
(""MCA"") has notified the Companies (Indian Accounting Standards) Amendment Rules, 2018 containing Appendix B to Ind AS 21, Foreign currency transactions and advance consideration which clarifies the date of the transaction for the purpose of determining the exchange rate to use on initial recognition of the related asset, expense or income, when an entity has received or paid advance consideration in a foreign currency.
The amendment will come into force from April 1, 2018. The Group is evaluating the requirement of the amendment and the effect of the financial statements.
Ind AS 115- Revenue from Contract with Customers:
On March 28, 2018, Ministry of Corporate Affairs (""MCA"") has notified the Ind AS 115, Revenue from Contract with Customers. The core principle of the new standard is that an entity should recognize revenue to depict the transfer of promised goods or services to customers in an amount that reflects the consideration to which the entity expects to be entitled in exchange for those goods or services. Further the new standard requires enhanced disclosures about the nature, amount, timing and uncertainty of revenue and cash flows arising from the entity’s contracts with customers.
The standard permits two possible methods of transition:
(a) Retrospective approach - Under this approach the standard will be applied retrospectively to each prior reporting period presented in accordance with Ind AS 8 - Accounting Policies, Changes in Accounting Estimates and Errors.
(b) Retrospectively with cumulative effect of initially applying the standard recognised at the date of initial application (Cumulative catch - up approach)
The effective date for adoption of Ind AS 115 is financial periods beginning on or after April 1, 2018. The Group is evaluating the requirement of the amendment and the effect of the financial statements.
159Building Momentum
The Year in Review Statutory Reports Financial Statements

(All amounts in Million Rupees except for share data or as otherwise stated)
NOTES to Consolidated financial statements for the year ended March 31, 2018
3. Property, plant and equipment
Particulars Freehold Land Buildings Plant and
Equipment Furniture and
Fixtures Computers Vehicles
Total Property, plant and
equipment
Gross carrying valueAs at April 30, 2016 803.46 3,421.66 6,443.37 172.97 77.25 61.70 10,980.41 Additions - 823.82 1,334.35 97.88 17.56 67.05 2,340.66 Acquisition of a subsidiary (Refer note 39) 68.17 201.33 404.77 0.42 - 1.12 675.81 Disposals - - (9.17) - - (22.04) (31.21)Adjustment- Exchange Difference - - (1.50) (0.10) (0.24) - (1.84)As at March 31, 2017 871.63 4,446.81 8,171.82 271.17 94.57 107.83 13,963.83 Additions 54.08 1,151.61 2,412.26 38.77 28.84 63.93 3,749.49 Disposals (3.37) - (1.94) - - (21.08) (26.39)Adjustment- Exchange Difference - - 0.21 0.01 0.02 - 0.24 As at March 31, 2018 922.34 5,598.42 10,582.35 309.95 123.43 150.68 17,687.17 DepreciationAs at April 30, 2016 - 112.16 670.10 28.98 17.48 5.30 834.02 Charge for the year - 151.85 802.04 36.67 19.69 22.45 1,032.70 Disposals - - (9.04) - - (16.86) (25.90)Adjustment- Exchange difference - - (0.33) (0.03) (0.06) - (0.42)As at March 31, 2017 - 264.01 1,462.77 65.62 37.11 10.89 1,840.40 Charge for the year - 201.07 931.69 34.90 20.41 31.19 1,219.26 Disposals - - - - - (11.60) (11.60)Adjustment - Exchange difference - - 0.10 0.01 0.02 - 0.13 As at March 31, 2018 - 465.08 2,394.56 100.53 57.54 30.48 3,048.19 Net carrying valueAs at March 31, 2016 803.46 3,309.50 5,773.27 143.99 59.77 56.40 10,146.39 As at March 31, 2017 871.63 4,182.80 6,709.05 205.55 57.46 96.94 12,123.43 As at March 31, 2018 922.34 5,133.34 8,187.79 209.42 65.89 120.20 14,638.98
Capital work-in-progress (including expenditure during construction period - note 42) : ` 1,631.80 (March 31, 2017: ` 1,432.56)
Estimated amount of contracts remaining to be executed on capital account and not provided for : ` 732.35 (March 31, 2017: ` 586.86) (Refer note 41(b)).
Includes expenditure during the construction period amounting to ` 0.69 (March 31,2017: ` 18.48(Note 42)).
Pledge on Property, plant and equipment - Laurus Labs Limited: Property, plant and equipment (other than vehicles) with a carrying amount of ` 14,518.78 (March 31, 2017: ` 11,008.18) are
subject to a pari passu first charge on the Company's term loans, except to the extent of plant & machinery exclusively charged towards term loan and buyers credit from ICICI Bank with a carrying amount of ` nil (March 31, 2017: ` 191.49). Further, the property, plant and equipment (other than vehicles) are subject to a pari passu second charge on the Company's current borrowings and SBI buyer's credit. Also, refer note 13A and 13B.
Vehicles with a carrying amount of ` 120.20 (March 31, 2017: ` 96.94) are hypothecated to respective banks against vehicle loans.
Laurus Labs Limited
Annual Report 2017-18160

(All amounts in Million Rupees except for share data or as otherwise stated)
NOTES to Consolidated financial statements for the year ended March 31, 2018
4. Other intangible assets
Particulars Goodwill on
Consolidation Computer Software
purchased Total Intangible
assets
Gross carrying valueAs at March 31, 2016 - 82.85 82.85 Additions - 33.11 33.11 Acquisition of subsidiary 97.39 8.66 106.05 Disposals - - - As at March 31, 2017 97.39 124.62 222.01 Additions - 28.32 28.32 Disposals - - - As at March 31, 2018 97.39 152.94 250.33 AmortisationAs at March 31, 2016 - 18.97 18.97 Charge for the year - 27.12 27.12 Disposals - - - As at March 31, 2017 - 46.09 46.09 Charge for the year - 35.27 35.27 Disposals - - - As at March 31, 2018 - 81.36 81.36 Net carrying valueAs at March 31, 2016 - 63.88 63.88 As at March 31, 2017 97.39 78.53 175.92 As at March 31, 2018 97.39 71.58 168.97
Impairment test of goodwill: Goodwill is tested for impairment on annual basis and whenever there is an indication that the recoverable amount of cash
generating unit is less than its carrying amount based on number of factors including business plan, operating results, future cash flows and economic conditions. The recoverable amount of cash generating units (CGU) is determined based on higher of value in use and fair value less cost to sell.
The Group generally uses discounted cash flow based methods to determine the recoverable amount. These discounted cash flows use five-year projections that are based on financial forecasts. Cash flow projections take into account past experience and management's best estimate about future developments.
Discount rate represent the current market assessment of the risks specific to each CGU, taking into consideration the time value of money and the risks specific to the asset for which specific to the asset for which future cash flow estimates have not been adjusted. The discount rate calculation is derived weighted average cost of capital of specific company. Terminal value growth rates take into consideration of external macroeconomic sources of data and industry specific trends.
The following table presents the key assumptions used to determine value in use/fair value less cost to sell for impairment test purpose:
Particulars March 31, 2018 March 31, 2017
Terminal value growth rate 5% 5%Pre tax discount rate 20% 16%
Based on the above, no impairment was identified as at March 31, 2018 as the recoverable value exceed the carrying value.
161Building Momentum
The Year in Review Statutory Reports Financial Statements

(All amounts in Million Rupees except for share data or as otherwise stated)
NOTES to Consolidated financial statements for the year ended March 31, 2018
5. Financial assets
March 31, 2018 March 31, 2017
A. InvestmentsOthers 34.05 34.05
34.05 34.05 Unquoted investments (valued at fair value through profit and loss) March 31, 2018 March 31, 2017 - 3,405,000 (March 31, 2017: 3,405,000) Equity Shares of `10 each of Atchutapuram Effluent Treatment Limited
34.05 34.05
34.05 34.05 B. Loans
Current (unsecured, considered good unless stated otherwise) Other loans- Loans to employees 8.26 2.77 Total 8.26 2.77
C. Other financial assetsNon-current (unsecured, considered good unless stated otherwise)Security deposits 126.84 109.74 Other balances with banks 0.23 45.95 Export and other incentives receivable * 111.48 53.33 Total 238.55 209.02 Current (unsecured, considered good unless stated otherwise)Security deposits - 30.00 Export and other incentives receivable * 198.72 198.82 Insurance claim receivable 6.43 63.74 Total 205.15 292.56
* Export and other incentives receivable has been recognized on the following: a) Incentive in the form of duty credit scrip upon sale of exports under Merchandise Exports from India Scheme under Foreign Trade Policy of India b) Sales tax incentive and reimbursement of power cost under the Andhra Pradesh state incentives IIPP 2015-20 scheme. There are no unfulfilled conditions or contingencies attached to these incentives.
Breakup of financial assets
March 31, 2018 March 31, 2017
Valued at fair value through profit or lossInvestments 34.05 34.05 Total financial assets carried at fair value through profit or loss 34.05 34.05 Valued at amortised costLoans 8.26 2.77 Deposits and others 443.70 501.58 Trade receivables 5,705.87 5,676.05 Cash and cash equivalents 30.04 24.23 Other balances with banks 0.53 16.68 Total financial assets carried at amortised cost 6,188.40 6,221.31
6. Deferred tax assets (net)
March 31, 2018 March 31, 2017
Deferred tax liability relating to Accelerated depreciation for tax purposes (850.02) (612.50) Deferred revenue on embedded leases (342.75) (396.20)
(A) (1,192.77) (1,008.70)Deferred tax asset relating to MAT credit entitlement 1,552.54 1,473.62 Unused tax losses/depreciation 49.57 - Expenses allowable on payment basis 85.64 221.33 Other items giving rise to temporary differences 33.99 12.61
(B) 1,721.74 1,707.56 Deferred tax assets (net) (A+B) 528.97 698.86
Laurus Labs Limited
Annual Report 2017-18162

(All amounts in Million Rupees except for share data or as otherwise stated)
NOTES to Consolidated financial statements for the year ended March 31, 2018
Deferred tax assets/(liabilities): For the year ended March 31, 2018:
Opening Balance Recognised in profit and loss
Recognised in other comprehensive
income Closing balance
Accelerated depreciation for tax purposes (612.50) (237.52) - (850.02)Deferred revenue on embedded leases (396.20) 53.45 - (342.75)MAT credit entitlement 1,473.62 78.92 - 1,552.54 Unused tax losses/depreciation - 49.57 - 49.57 Expenses allowable on payment basis 221.33 (135.69) - 85.64 Other items giving rise to temporary differences 12.61 21.68 (0.30) 33.99
698.86 (169.59) (0.30) 528.97
For the year ended March 31, 2017:
Opening Balance Recognised in profit and loss
Recognised in other comprehensive
income
Recognised on acquisition of
Subsidiary (refer note 39)
Closing balance
Accelerated depreciation for tax purposes (515.95) (72.99) - (23.56) (612.50)Deferred revenue on embedded leases (114.44) (281.76) - - (396.20)MAT credit entitlement 989.60 477.77 - 6.25 1,473.62 Unused tax losses/ depreciation 121.24 (188.58) - 67.34 - Expenses allowable on payment basis 61.39 157.90 - 2.04 221.33 Other items giving rise to temporary differences 6.88 2.11 3.62 - 12.61
548.72 94.45 3.62 52.07 698.86
The Group has accounted for deferred tax assets (net) of ` 528.97 (March 31, 2017: ` 698.86) based on approval of business plan by board, agreements entered with customers, orders on hand, fresh infusion of funds, successful patent filings and a portfolio of drugs.
During the year ended March 31, 2018, the Group has paid dividend to its shareholders. This has resulted in payment of Dividend Distribution Tax (DDT) to the taxation authorities. The Group believes that DDT represents additional payment to taxation authority on behalf of the shareholders. Hence, DDT paid is charged to equity.
7. Other assets
March 31, 2018 March 31, 2017
A) Non-current (unsecured, considered good unless otherwise stated) Capital advances 132.28 124.02 Advances recoverable in cash and kind 24.29 16.79 Prepayments 283.25 300.34 Balances with statutory/Government authorities 20.00 20.00 Deferred lease expenses - 1.32 Taxes paid under protest 4.44 3.74
464.26 466.21 Less: Allowance for and doubtful advances (24.29) (16.79)Total 439.97 449.42
B) Current (unsecured, considered good unless otherwise stated) Security depositsAdvances recoverable in cash or kind 105.53 78.13 Prepayments 97.92 75.37 Balances with statutory/Government authorities 471.85 138.20 Deferred lease expenses 0.68 0.98 Others 2.26 2.76 Total 678.24 295.44
163Building Momentum
The Year in Review Statutory Reports Financial Statements

(All amounts in Million Rupees except for share data or as otherwise stated)
NOTES to Consolidated financial statements for the year ended March 31, 2018
8. Inventories
March 31, 2018 March 31, 2017
(At lower of cost and net realisable value) Raw materials [including port stock and stock-in-transit:
` 543.32 (March 31, 2017: ` 471.18)] 2,413.90 1,946.39
Work-in-progress 1,755.65 1,528.49 Finished goods 1,516.13 1,496.24 Stores, spares and packing materials 162.14 119.34 Total 5,847.82 5,090.46
9. Trade receivables
March 31, 2018 March 31, 2017
Unsecured Considered good 5,705.87 5,676.05 Considered bad and doubtful 23.29 21.52
5,729.16 5,697.57 Less: Allowance for bad and doubtful receivables (23.29) (21.52)
5,705.87 5,676.05
a) No trade or other receivables are due from directors or other officers of the Company either severally or jointly with any other person. Nor any trade or other receivables are due from firms or private companies respectively in which any director is a partner, a director or a member.
b) Trade receivables are non-interest bearing and are generally on terms of 30 - 90 days.
c) Of the trade receivables balance, ` 2,997.24 in aggregate (as at March 31, 2017: ` 3,380.44) is due from the Company's customers individually representing more than 5 % of the total trade receivables balance.
d) The Group has used practical expedient by computing the expected credit loss allowance for doubtful trade receivables based on a provision matrix. The provision matrix takes into account historical credit loss experience and adjusted for forward-looking estimates. The expected credit loss allowance is based on the ageing of the days the receivables are due.
Movement in the expected credit loss allowance March 31, 2018 March 31, 2017
Balance at the beginning of the year 21.52 - Movement in expected credit loss allowance on trade receivables 1.77 21.52 Balance at the end of the year 23.29 21.52
10. Cash and cash equivalents and other bank balances
March 31, 2018 March 31, 2017
A) Cash and cash equivalents Balances with banks - On current accounts 24.34 19.46 - Deposits with original maturity of less than three months 3.59 2.57 Cash on hand 2.11 2.20
30.04 24.23 B) Other balances with banks On deposit accounts - Remaining maturity for more than twelve months 0.23 45.95 - Remaining maturity for less than twelve months 0.53 16.68
0.76 62.63 Less : Amount disclosed under other assets (Note 5C) (0.23) (45.95)
0.53 16.68
Deposits with a carrying amount of ` 0.76 (March 31, 2017: ` 62.63) are towards margin money given for letter of credit and bank guarantees.
Laurus Labs Limited
Annual Report 2017-18164

(All amounts in Million Rupees except for share data or as otherwise stated)
NOTES to Consolidated financial statements for the year ended March 31, 2018
11. Equity share capital
March 31, 2018 March 31, 2017
Authorised 111,000,000 (March 31, 2017: 111,000,000) Equity shares of ` 10/- each 1,110.00 1,110.00 Total 1,110.00 1,110.00 Issued, Subscribed and Paid Up106,029,749 (March 31, 2017: 105,756,249) Equity share of ` 10/- each fully paid up 1,060.30 1,057.56
1,060.30 1,057.56 Total 1,060.30 1,057.56
11.1. Reconciliation of the shares outstanding at the beginning and at the end of the reporting period
For the year ended March 31, 2018
For the year ended March 31, 2017
Equity Shares of ` 10 Each, Fully paid upBalance as per last financial statements 105,756,249 1,057.56 15,767,255 157.67 Issued during the year - ESOP 273,500 2.74 118,500 1.19 Converted from preference shares to equity shares - - 8,889,846 88.90 Issued during the year - Bonus shares - - 73,971,303 739.71 Issue of equity shares - IPO - - 7,009,345 70.09 Outstanding at the end of the year 106,029,749 1,060.30 105,756,249 1,057.56 0.001% Compulsorily convertible participatory cumulative Preference Shares - Series A of ` 10/- each fully paid up Balance as per last financial statements - - 2,259,060 22.59 Converted from preference shares to equity shares - - (2,259,060) (22.59)Outstanding at the end of the year - - - - 0.001% Compulsorily convertible participatory cumulative Preference shares - Series B of ` 243/- each fully paid up Balance as per last financial statements 2,477,387 602.01 Converted from preference shares to equity shares (2,477,387) (602.01)Outstanding at the end of the year - - - - 0.001% Compulsorily convertible participatory cumulative Preference Shares - Series C of ` 10/- each fully paid up Balance as per last financial statements - - 4,153,399 41.53 Converted from preference shares to equity shares - - (4,153,399) (41.53)Outstanding at the end of the year - - 4,153,399 41.53
11.2. Rights attached to equity shares The Company has only one class of equity shares having a
par value of ` 10/- per share. Each holder of equity shares is entitled to one vote per share at the general meetings of the Company. For liquidation terms and preferential rights refer note 11.3a.
The Company declares and pays dividends in Indian rupees. The dividend proposed by the Board of Directors is subject to the approval of shareholders in the ensuing Annual General Meeting.
For the year ended March 31, 2018, the amount of dividend per share declared as distribution to equity shareholders was ` 1.50 (March 31, 2017: ` 1.50)
11.3. Rights attached to preference shares 0.001% Compulsorily convertible participatory
cumulative Preference Shares - Series A of ` 10/- each fully paid up
During the year ended March 31, 2008, the Company issued 6,800,000 CCPCPS of ` 10/- each fully paid at a premium of ` 140 per share and also during the year ended March 31, 2009, 88,690 CCPCPS had been issued at par as part of the scheme of amalgamation of Aptuit Informatics India Private Limited with the Company. Each CCPCPS at the option of the holder is convertible into one equity share or will automatically be converted into one equity share on the twentieth anniversary of the initial issuance. For Liquidation terms and preferential rights refer note 11.3a.
165Building Momentum
The Year in Review Statutory Reports Financial Statements

(All amounts in Million Rupees except for share data or as otherwise stated)
NOTES to Consolidated financial statements for the year ended March 31, 2018
During the year ended March 31, 2012, the preference share holder converted 4,629,630 CCPCPS into equity shares and the balance of 2,259,060 CCPCPS was renamed as ""Series A Preference Shares"". Each ""Series A Preference Shareholder"" is entitled to cumulative preference dividend equal to 0.001% per financial year and to exercise one vote per one share at the general meetings of the Company. For liquidation terms and preferential rights refer note 11.3a.
During the year ended March 31, 2017, all the 2,259,060 Series A Preference Shares have been converted into equity shares in the ratio of 1:1.
0.001% Compulsorily convertible participatory cumulative Preference shares - Series B of ` 243/- each fully paid up
During the year ended March 31, 2012, the Company had issued Series B Preference Shares of ` 243 each fully paid up aggregating 2,477,387 shares to FIL Capital Management (Mauritius) Limited, Fidelity India Principals and Dr. Satyanarayana Chava(Promoter). Each Series B Preference Share at the option of the holder is convertible into one equity share or will automatically be converted into one equity share after completion of 19 years and 365 days from the date of issue. Each Series B Preference Shareholder is entitled to cumulative preference dividend equal to 0.001% per financial year and to exercise one vote per share at the general meetings of the Company. For liquidation terms and preferential rights refer note 11.3a.
During the year ended March 31, 2017, all the 2,477,387 Series B Preference Shares have been converted into equity shares in the ratio of 1:1.
0.001% Compulsorily convertible participatory cumulative Preference Shares - Series C of ` 10/- each fully paid up
During the year ended March 31, 2015, the Company had issued Series C Preference Shares of ` 10/- each fully paid up aggregating 4,153,399 shares to Bluewater Investment Limited (""Blue Water""). Each Series C Preference Share at the option of the holder is convertible into one equity share or will automatically be converted into one equity share after completion of 19 years and 365 days from the date of issue. Each Series C Preference Shareholder is entitled to cumulative preference dividend equal to 0.001% per financial year and to exercise one vote per share at the general meetings of the Company. For liquidation terms and preferential rights refer note 11.3a.
During the year ended March 31, 2017, all the 4,153,399 Series C Preference Shares have been converted into equity shares in the ratio of 1:1.
11.3a. Liquidation terms and preferential rights In case of winding up or liquidation, if the liquidation
proceeds are adequate to cater to the amount of investment of Bluewater, FIL Capital Management (Mauritius) Limited and Fidelity India Principals as increased by an Internal Rate of Return (IRR) of 18% per annum computed thereon from the date of investment by each of them, then the liquidation proceeds will be shared equally among all the shareholders including preference shareholders proportionate to their holdings.
In the case of winding up or liquidation , if the liquidation proceeds are not adequate to cater to the amount of investment of Bluewater, FIL Capital Management (Mauritius) Limited and Fidelity India Principals, then such proceeds shall be distributed amongst Bluewater, FIL Capital Management (Mauritius) Limited, Fidelity India Principals and Promoter pari passu in proportion to Bluewater Investment Amount, FIL Capital Management (Mauritius) Limited Investment amount, Fidelity India Principals Investment amount and Promoter Investment Amount of Series B Preference Shares respectively. Of the remaining proceeds if any, the preference is defined as under:
- Contracted investment of Series A preference shareholders
- Promoter contracted investment amount of 465,000 equity shares
- Other shareholders including promoter contracted investment amount of equity shares
- Balance distributed to all shareholders in proportion to their shareholding.
However, with effect from December 19, 2016, upon equity shares of the Company becoming listed on the stock exchanges, the liquidation terms are as follows:
(a) If the company shall be wound up, the Liquidator may, with the sanction of a special resolution of the company and any other sanction required by the Act divide amongst the shareholders, in specie or kind the whole or any part of the assets of the company, whether they shall consist of property of the same kind or not.
(b) For the purpose aforesaid, the Liquidator may set such value as he deems fair upon any property to be divided as aforesaid and may determine how such division shall be carried out as between the shareholders or different classes of shareholders.
Laurus Labs Limited
Annual Report 2017-18166

(All amounts in Million Rupees except for share data or as otherwise stated)
NOTES to Consolidated financial statements for the year ended March 31, 2018
11.4. Details of Shareholders holding more than 5 % shares of the Group:
Equity Shares of ` 10/- each Held ByMarch 31, 2018 March 31, 2017
% Holding No. % Holding No.
Blue Water Investment Limited 19.80% 20,989,596 19.85% 20,989,596 FIL Capital Management (Mauritius) Limited 11.54% 12,237,612 11.57% 12,237,612 Dr.C.Satyanarayana 15.83% 16,781,704 15.87% 16,781,704 SBI Magnum Multiplier Fund 4.19% 4,439,877 7.02% 7,427,959 Mrs.C.Naga Rani 5.89% 6,240,000 5.90% 6,240,000
11.5. Details of shares reserved for issue under options For details of shares reserved for issue under Employee Stock Options Scheme plan of the Group, refer Note 29.
11.6. Aggregate number of bonus shares issued, shares issued for consideration other than cash during the period of five years immediately preceding the reporting date:
March 31, 2018 March 31, 2017
No. of equity shares allotted as fully paid bonus shares by capitalization of securities premium - 73,971,303
12. Distributions made and proposed March 31, 2018 March 31, 2017
Cash dividends on equity shares declared and paid: Final dividend for the year ended March 31, 2017 : ` 1.50 per share (March 31, 2016 : ` 2.00 per
share) 158.64 31.53
Dividend distribution tax on final dividend 32.29 6.42 Cash dividends on CCPCPS - Series A, Series B and Series C declared and paid: Final dividend for the year ended March 31, 2017 : ` Nil per share (March 31, 2016: ` 2.00 per
share) (including cumulative preference dividend) (not adjusted for bonus issue) - 17.81
Dividend distribution tax on final dividend - 3.63 190.93 59.39
Proposed dividends on equity shares: Final cash dividend 159.04 158.64 Dividend distribution tax on proposed dividend 32.69 32.29
191.73 190.93
Proposed dividend on Equity shares are subject to approval at the annual general meeting and is not recognised as a liability as at March 31, 2018.
13. Financial liabilities March 31, 2018 March 31, 2017
A) Non-current borrowingsTerm loans Indian rupee loans from banks (Secured) 1,014.87 1,005.62 Foreign currency loans from banks (Secured) 368.00 - Buyer's credit (Secured) - 188.56 Other loans Vehicle loans from banks (Secured) 33.72 51.44 Total 1,416.59 1,245.62 Current maturities of non-current borrowingsTerm loans Indian rupee loans from banks (Secured) 399.61 523.28 Foreign currency loans from banks (Secured) 184.35 42.69 Buyer's credit (Secured) 189.16 138.59 Other loans Vehicle loans from banks (Secured) 24.19 25.58
797.31 730.14 Less: Amount disclosed under the head "other current financial liabilities" (Note 13 D) (797.31) (730.14)Total - -
B) Current borrowingsCash credits and working capital demand loansIndian rupee loans from banks (Secured) 5,073.96 5,329.87 Foreign currency loans from banks (Secured) 1,530.53 129.03 Buyer's credit from banks (Secured) 980.68 982.81 Total 7,585.17 6,441.71
167Building Momentum
The Year in Review Statutory Reports Financial Statements

(All amounts in Million Rupees except for share data or as otherwise stated)
NOTES to Consolidated financial statements for the year ended March 31, 2018
Terms and conditions of borrowings - Laurus Labs Limited: (a) The details of Indian rupee term loans from banks are as under:
Name of the BankOutstanding
as on March 31, 2018
Outstanding as on
March 31, 2017Sanction Amount No. of Installments
Commencement of Installments
Rate of Interest
State Bank of India (SBI)
- 67.02 300.00 8 quarterly Installments ranging from ` 15.00 to ` 22.50
June 2016 MCLR Plus 0.50% p.a (March 31, 2017: MCLR plus 1.90 % p.a.
State Bank of India (SBI)#
- 350.00 490.00 23 quarterly Installments ranging from ` 20.00 to ` 22.50
September 2015 MCLR Plus 0.50% p.a (March 31, 2017: MCLR plus 1.90 % p.a.
State Bank of India (SBI)#
- 377.38 450.00 20 quarterly Installments ranging from ` 18.00 to ` 24.00
June 2016 MCLR Plus 0.50% p.a (March 31, 2017: MCLR plus 1.90 % p.a.
ICICI Bank (ICICI) - 22.57 67.67 20 quarterly Installments of ` 3.38
February 2014 MCLR plus 2.75% p.a. (March 31, 2017 : MCLR plus 2.75% p.a.)
HSBC Bank (HSBC) 199.60 399.15 500.00 10 quarterly Installments of ` 50
December 2016 MCLR plus 0.5% p.a. (March 31, 2017 :MCLR plus 0.5% p.a.)
Andhra Bank (AB)* 214.88 - 231.80 14 quarterly Installments ranging from ` 15.16 to ` 16.67
January 2018 MCLR plus 1.55 p.a. (March 31, 2017 : MCLR plus 1.60% p.a.)
HDFC Bank (HDFC) 1000.00 - 1000.00 15 quarterly Installments of ` 66.67
November 2018 At 1 Year G-Sec plus 155 bps
* Andhra Bank term loan has been taken over from Sriam Labs Private limited as part of slump sale
# Converted to FCNR (B) Term Loan
(b) Foreign Currency loans from banks comprise of Long Term Buyer’s Credit, Foreign Currency Non Resident Term Loan (FCNR TL) and ECB loan:
Name of the Bank & Nature of Loan
Outstanding as on
March 31, 2018
Outstanding as on
March 31, 2017Sanction Amount No. of Installments
Commencement of Installments
Rate of Interest
Bank of Bahrain and Kuwait (BBK) - ECB Loan
- 42.69 US$ 5.40 Mn 16 quarterly Installments ranging from US$ 0.338 to US$ 0.330.
November 2013 6M London Inter -Bank Offered Rate (LIBOR) plus 3.50% p.a. (March 31, 2017 : 6M LIBOR plus 3.50% p.a.)
ICICI Bank (ICICI) - Buyer's Credit
- 138.59 US$ 2.14 Mn Single Installment April 2017 LIBOR plus 0.74% p.a. (March 31, 2017 : LIBOR plus 0.74% p.a.)
State Bank of India (SBI) - Buyer's Credit
189.16 188.56 US$ 2.91 Mn Two Installments April 2018 LIBOR plus 0.56% p.a. (March 31, 2017: LIBOR plus 0.56% p.a.)
State Bank of India (SBI) - FCNR TL
269.54 - US$ 4.764 Mn 14 quarterly Installments
December 2017 6M LIBOR plus 2% p.a. (March 31, 2017: nil)
State Bank of India (SBI) - FCNR TL
282.81 - US$ 5.1 Mn 14 quarterly Installments
December 2017 6M LIBOR plus 2% p.a. (March 31, 2017: nil)
(c) All Term loans (except Andhra Bank & HDFC) are secured by pari passu first charge on the property, plant and equipment (both present and future) except to the extent of assets exclusively charged to banks. It is further secured by pari passu second charge on current assets both present and future. (March 31, 2017 All Term loans (except ICICI) were secured by pari passu first charge on the property, plant and equipment (both present and future) except to the extent of assets exclusively charged to banks. They were further secured by pari passu second charge on current assets both present and future. Also personal guarantees were given by the Chief Executive Officer and one of the Executive Directors of the Company. ICICI Term loan and buyers credit was secured by exclusive charge on the movable machinery/property, plant and equipment procured from the term loan/buyers credit sanctioned by ICICI Bank and also personal guarantees were given by the Chief Executive Officer and one of the Executive Directors of the Company).
Laurus Labs Limited
Annual Report 2017-18168

(All amounts in Million Rupees except for share data or as otherwise stated)
NOTES to Consolidated financial statements for the year ended March 31, 2018
HDFC Term loan is secured by pari passu first charge on the property, plant and equipment (both present and future). Andhra Bank Term loan is secured by an exclusive charge on the present and future assets of Unit VI. State Bank of India (SBI) buyer's credit is secured by pari passu first charge on current assets and pari passu second charge on the fixed assets (both present and future) [March 31, 2017 State Bank of India (SBI) buyer's credit was secured by pari passu first charge on current assets and pari passu second charge on the fixed assets (both present and future) and also personal guarantees were given by the Chief Executive Officer and one of the Executive Directors of the Company].
(d) Vehicle loans from banks are repayable in Installments ranging from 36 to 48 months from the date of the loan and secured by hypothecation of the respective vehicles.
(e) Current borrowings are availed of in both Rupee and Foreign currencies. Interest on rupee loans ranges from MCLR plus 0% to 0 .60%(March 31, 2017: MCLR plus 0% to 1.85%, ). Buyers credit loan interest ranges from LIBOR plus 0.17% to 0.75%(March 31, 2017: LIBOR plus 0.23% to 0.75%, ). These borrowings are secured by pari passu first charge on current assets and pari passu second charge on the fixed assets (both present and future). [March 31, 2017 Current borrowings were secured by pari passu first charge on current assets and pari passu second charge on the fixed assets (both present and future). Also personal guarantees were given by the Chief Executive Officer and one of the Executive Directors of the Company]
Terms and conditions of borrowings - Sriam Labs Private Limited (f) The details of Indian rupee term loans from banks are as under:
Name of the Bank & Nature of Loan
Outstanding as on
March 31, 2018
Outstanding as on
March 31, 2017Sanction Amount No. of Installments
Commencement of Installments
Rate of Interest
Andhra Bank TL2 - 2.94 58.80 20 quarterly Installments of ` 29.40 Lacs each
September 2012 MCLR +1.10%+0.50% p.a. (March 31, 2017: MCLR+1.10%+0.50% p.a.)
Andhra Bank TL3 - 13.99 56.00 20 quarterly Installments of ` 28 Lacs each
September 2013 MCLR +1.05+0.50% p.a. (March 31, 2017: MCLR + 1.10 %+0.50% p.a.)
Andhra Bank TL4 - 262.10 282.30 28 quarterly Installments of ` 100.81 Lacs each
October 2016 MCLR +1.05+0.50% p.a. (March 31, 2017: MCLR + 1.10 %+0.50% p.a.)
Andhra Bank Corporate Loan
- 33.75 60.00 16 quarterly Installments of ` 37.50 Lacs each
June 2015 MCLR +1.05+0.50% p.a. (March 31, 2017: MCLR + 1.10 %+0.50% p.a.)
(g) Vehicle loans from banks are repayable in 60 monthly Installments from the date of the loan and secured by hypothecation of the respective vehicles. This loan was repaid and there is no outstanding as on March 31, 2018.
(h) Current borrowings are availed in Rupee. Interest on rupee loans ranges from MCLR plus 1.05%(March 31, 2017: MCLR plus 1.20%). Buyers credit loan interest ranges from 1.06% to 2.46% . These borrowings are secured by Hypothecation of stocks of raw material, WIP , Consumables, Finished goods, Receivables and all chargeable current assets on first charge basis.
Terms and conditions of borrowings - Laurus Synthesis Inc. (i) Current borrowings are availed in Foreign currency. Interest on foreign currency loans from banks ranges from 2.73% (March 31,
2017: 2.15%). These borrowings are secured in the form of Standby Letter of Credit (SBLC) of the Company to Citi Bank N.A.
C) Trade payables
March 31, 2018 March 31, 2017
Valued at amortised cost - Outstanding dues to creditors other than micro enterprises and small enterprises 3,021.24 2,539.83 - Outstanding dues to micro enterprises and small enterprises (Refer note 30) 27.89 11.46 - Outstanding dues to related parties (Refer note 32) 74.14 79.70
3,123.27 2,630.99
Terms and conditions of the above financial liabilities: Trade payables are non-interest bearing and are normally settled on 30-120 day terms. For explanations on the Group’s credit risk management processes, refer to note 37.
169Building Momentum
The Year in Review Statutory Reports Financial Statements

(All amounts in Million Rupees except for share data or as otherwise stated)
NOTES to Consolidated financial statements for the year ended March 31, 2018
D) Current maturities and other financial liabilities
March 31, 2018 March 31, 2017
Valued at amortised cost Current maturities of non-current borrowings (Note 13 A) 797.31 730.14 Capital creditors 650.17 585.37 Interest accrued 26.72 27.25 Payable to selling shareholders (IPO) - 40.20 Valued at fair value through profit or loss Outstanding derivative contracts 0.73 23.51 Total 1,474.93 1,406.47
Breakup of financial liabilities
March 31, 2018 March 31, 2017
Valued at fair value through profit or loss Outstanding derivate contracts 0.73 23.51 Total financial liabilities carried at fair value through profit or loss 0.73 23.51 Valued at amortised cost Non-current borrowings 1,416.59 1,245.62 Current maturities of non-current borrowings 797.31 730.14 Current borrowings 7,585.17 6,441.71 Interest accrued 26.72 27.25 Trade payables 3,123.27 2,630.99 Capital creditors and others 650.17 625.57 Total financial liabilities carried at amortised cost 13,599.23 11,701.28
14. Other Non-current and current liabilities
March 31, 2018 March 31, 2017
A) Non-current Advances from customers 646.97 630.72
646.97 630.72 B) Current
Advances from customers 742.90 475.10 Unclaimed dividend 0.06 - Statutory dues 94.69 109.56 Total 837.65 584.66
15. Provisions
March 31, 2018 March 31, 2017
A) Non-current provisions Provision for gratuity 116.58 91.72 Provision for compensated absences 91.81 54.16 Total 208.39 145.88
B) Current provisions Provision for gratuity 17.32 7.37 Provision for compensated absences 27.42 39.69 Total 44.74 47.06
Laurus Labs Limited
Annual Report 2017-18170

(All amounts in Million Rupees except for share data or as otherwise stated)
NOTES to Consolidated financial statements for the year ended March 31, 2018
16. Income tax assets / liabilities
March 31, 2018 March 31, 2017
A) Income tax assets Advance tax (net) 2.95 5.70 Tax paid under protest 7.05 7.05
10.00 12.75 B) Income tax liabilities Provision for taxes (net) 3.10 96.61
3.10 96.61
17. Revenue from operations
For the year ended March 31, 2018
For the year ended March 31, 2017
Sale of products Income from sale of API and Intermediates 19,194.79 18,434.58 Income from sale of traded goods 243.86 150.10
(A) 19,438.65 18,584.68 Sale of services Contract research services 660.74 338.15
(B) 660.74 338.15 Other operating revenue Sale of scrap 17.26 17.67 Export and other incentives* 269.64 177.04 Others 303.74 197.95
(C) 590.64 392.66 Revenue from operations (A+B+C) 20,690.03 19,315.49
* Export and other incentives have been recognized on the following: a) Incentive in the form of duty credit scrip upon sale of exports under Merchandise Exports from India Scheme under Foreign Trade Policy of India b) Sales tax incentive under the Andhra Pradesh state incentives IIPP 2015-20 scheme. There are no unfulfilled conditions or contingencies attached to these incentives.
18. Other income
For the year ended March 31, 2018
For the year ended March 31, 2017
Net gain on foreign exchange fluctuations 194.27 238.91 Reversal of provision for insurance claim receivable (net) - 39.35 Reversal of provision for doubtful advance and receivables (net) 37.41 - Bad debts recovered 10.52 9.00 Profit on sale of subsidiary (valued at cost) - 3.19 Lease rental income 38.96 18.48 Miscellaneous income 3.15 10.40 Total 284.31 319.33
19. Cost of materials consumed
For the year ended March 31, 2018
For the year ended March 31, 2017
Raw materials consumed Opening stock at the beginning of the year 1,946.39 2,182.40 Add : Stock acquired upon acquisition of subsidiary - 45.25 Add : Purchases 11,004.60 9,831.01
12,950.99 12,058.66 Less : Closing stock at the end of the year (A) 2,413.90 1,946.39
(B) 10,537.09 10,112.27 Packing materials consumed 76.85 74.78 Total (A+B) 10,613.94 10,187.05
171Building Momentum
The Year in Review Statutory Reports Financial Statements

(All amounts in Million Rupees except for share data or as otherwise stated)
NOTES to Consolidated financial statements for the year ended March 31, 2018
20. Changes in inventories of finished goods, work-in-progress and stock-in-trade
For the year ended March 31, 2018
For the year ended March 31, 2017
Opening stock of inventories Finished goods of API and Intermediates 1,496.24 1,222.06 Work-in-progress of API and Intermediates 1,528.49 1,408.01 Add: Finished goods of API and Intermediates acquired upon acquisition of subsidiary - 25.47 Add: Work-in-Progress of API and Intermediates acquired upon acquisition of subsidiary - 20.19
3,024.73 2,675.73 Closing stock of inventories Finished goods of API and Intermediates 1,516.13 1,496.24 Work-in-Progress of API and Intermediates 1,755.65 1,528.49
3,271.78 3,024.73 Increase in inventories of finished goods and work-in-progress (247.04) (349.00)Increase in finished goods of API and Intermediates (19.89) (248.71)Decrease/(Increase) in Work-in-Progress of API and Intermediates (227.15) (100.29)Increase in inventories of finished goods and work-in-progress (247.04) (349.00)
21. Employee benefits expenses
For the year ended March 31, 2018
For the year ended March 31, 2017
Salaries, allowances and wages 1,937.23 1,679.38 Contribution to provident fund and other funds 115.92 92.17 Gratuity expense 41.16 15.29 Share based payment expense 33.55 37.89 Managerial remuneration 199.03 186.56 Recruitment and training 12.31 20.24 Staff welfare expenses 241.27 202.37 Total 2,580.47 2,233.90
22. Other expenses
For the year ended March 31, 2018
For the year ended March 31, 2017
Consumption of stores and spares 235.17 181.85 Conversion charges 102.99 161.29 Factory maintenance 578.42 453.78 Effluent treatment expenses 163.14 161.09 Power and fuel 942.13 662.74 Repairs and maintenance Plant and machinery 152.05 121.13 Buildings 45.76 39.06 Others 7.26 6.09 Product development 134.49 119.16 Testing and analysis charges 11.62 12.35 Rent 73.13 64.64 Rates and taxes 107.42 87.51 Office maintenance 23.45 22.32 Insurance 73.47 59.82 Printing and stationery 18.84 15.82 Consultancy and other professional charges 90.91 79.58 Membership and subscription 45.35 31.15 Remuneration to auditors * -Audit fee 4.35 4.10 -Tax audit fee 0.55 0.50 -Limited review 3.00 0.80
Laurus Labs Limited
Annual Report 2017-18172
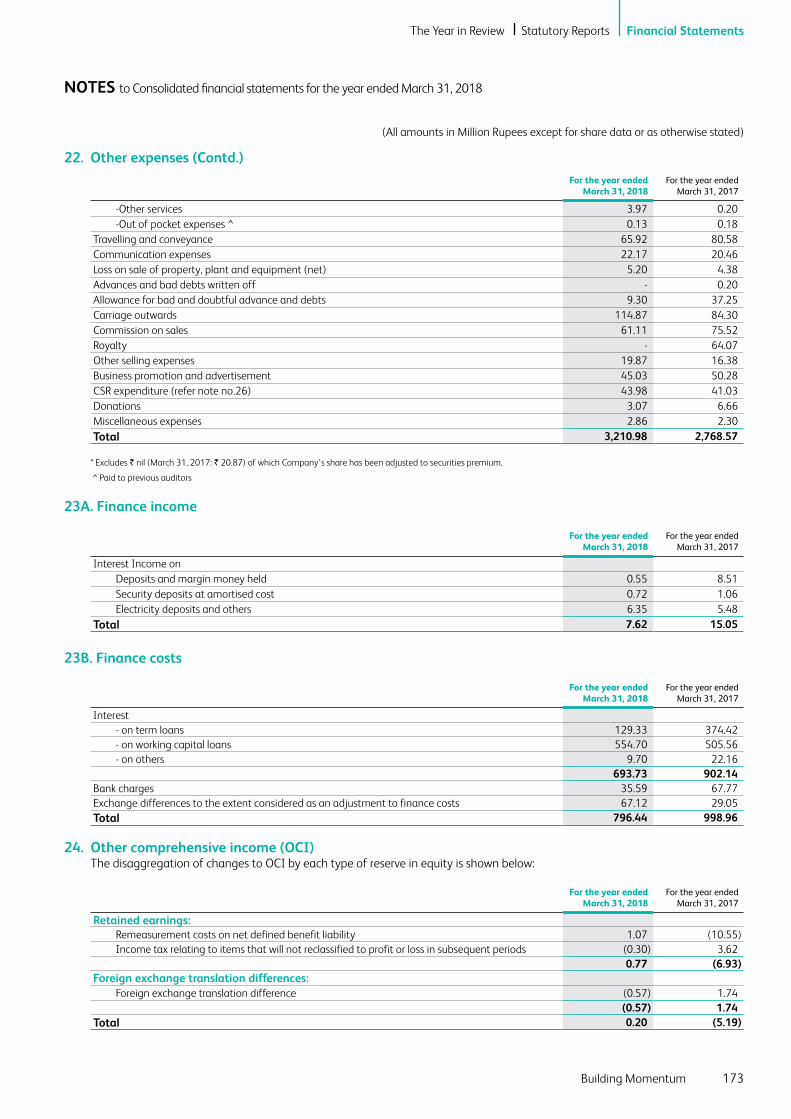
(All amounts in Million Rupees except for share data or as otherwise stated)
NOTES to Consolidated financial statements for the year ended March 31, 2018
For the year ended March 31, 2018
For the year ended March 31, 2017
-Other services 3.97 0.20 -Out of pocket expenses ^ 0.13 0.18 Travelling and conveyance 65.92 80.58 Communication expenses 22.17 20.46 Loss on sale of property, plant and equipment (net) 5.20 4.38 Advances and bad debts written off - 0.20 Allowance for bad and doubtful advance and debts 9.30 37.25 Carriage outwards 114.87 84.30 Commission on sales 61.11 75.52 Royalty - 64.07 Other selling expenses 19.87 16.38 Business promotion and advertisement 45.03 50.28 CSR expenditure (refer note no.26) 43.98 41.03 Donations 3.07 6.66 Miscellaneous expenses 2.86 2.30 Total 3,210.98 2,768.57
* Excludes ` nil (March 31, 2017: ` 20.87) of which Company's share has been adjusted to securities premium.
^ Paid to previous auditors
23A. Finance income
For the year ended March 31, 2018
For the year ended March 31, 2017
Interest Income on Deposits and margin money held 0.55 8.51 Security deposits at amortised cost 0.72 1.06 Electricity deposits and others 6.35 5.48 Total 7.62 15.05
23B. Finance costs
For the year ended March 31, 2018
For the year ended March 31, 2017
Interest - on term loans 129.33 374.42 - on working capital loans 554.70 505.56 - on others 9.70 22.16
693.73 902.14 Bank charges 35.59 67.77 Exchange differences to the extent considered as an adjustment to finance costs 67.12 29.05 Total 796.44 998.96
24. Other comprehensive income (OCI) The disaggregation of changes to OCI by each type of reserve in equity is shown below:
For the year ended March 31, 2018
For the year ended March 31, 2017
Retained earnings: Remeasurement costs on net defined benefit liability 1.07 (10.55) Income tax relating to items that will not reclassified to profit or loss in subsequent periods (0.30) 3.62
0.77 (6.93)Foreign exchange translation differences: Foreign exchange translation difference (0.57) 1.74
(0.57) 1.74 Total 0.20 (5.19)
22. Other expenses (Contd.)
173Building Momentum
The Year in Review Statutory Reports Financial Statements
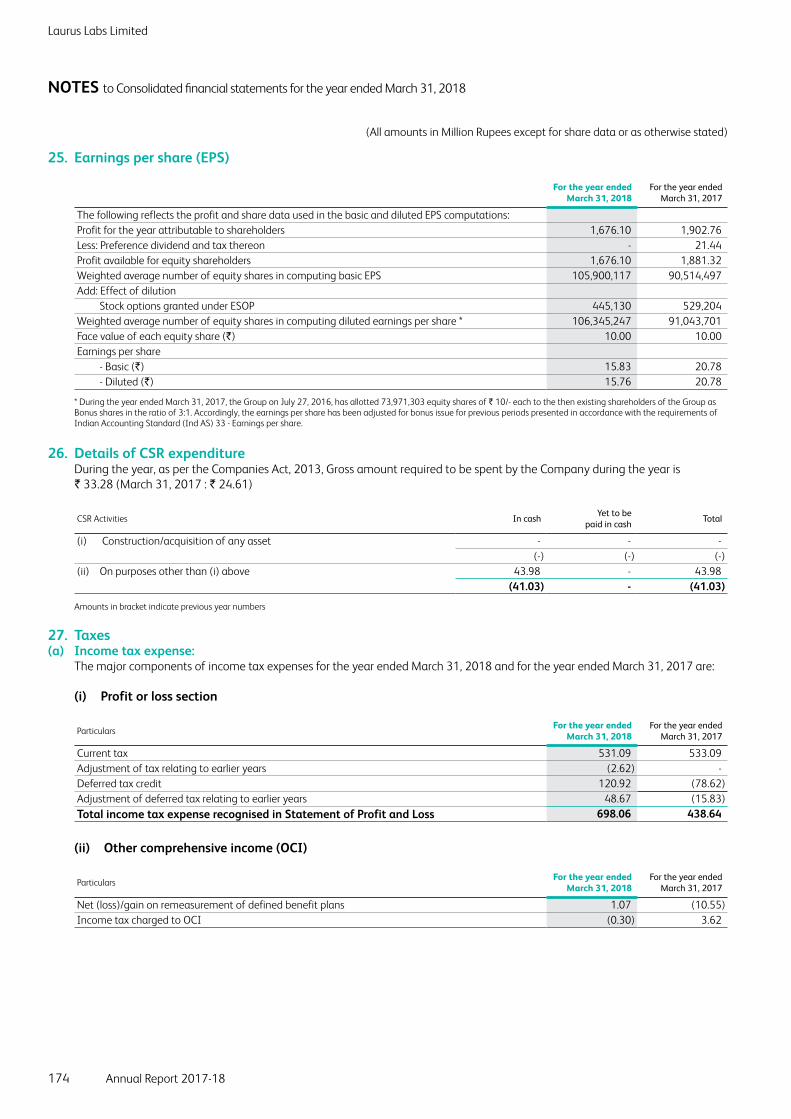
(All amounts in Million Rupees except for share data or as otherwise stated)
NOTES to Consolidated financial statements for the year ended March 31, 2018
25. Earnings per share (EPS)
For the year ended March 31, 2018
For the year ended March 31, 2017
The following reflects the profit and share data used in the basic and diluted EPS computations: Profit for the year attributable to shareholders 1,676.10 1,902.76 Less: Preference dividend and tax thereon - 21.44 Profit available for equity shareholders 1,676.10 1,881.32 Weighted average number of equity shares in computing basic EPS 105,900,117 90,514,497 Add: Effect of dilution Stock options granted under ESOP 445,130 529,204 Weighted average number of equity shares in computing diluted earnings per share * 106,345,247 91,043,701 Face value of each equity share (`) 10.00 10.00 Earnings per share - Basic (`) 15.83 20.78 - Diluted (`) 15.76 20.78
* During the year ended March 31, 2017, the Group on July 27, 2016, has allotted 73,971,303 equity shares of ` 10/- each to the then existing shareholders of the Group as Bonus shares in the ratio of 3:1. Accordingly, the earnings per share has been adjusted for bonus issue for previous periods presented in accordance with the requirements of Indian Accounting Standard (Ind AS) 33 - Earnings per share.
26. Details of CSR expenditure During the year, as per the Companies Act, 2013, Gross amount required to be spent by the Company during the year is
` 33.28 (March 31, 2017 : ` 24.61)
CSR Activities In cash Yet to be
paid in cash Total
(i) Construction/acquisition of any asset - - - (-) (-) (-)
(ii) On purposes other than (i) above 43.98 - 43.98 (41.03) - (41.03)
Amounts in bracket indicate previous year numbers
27. Taxes(a) Income tax expense: The major components of income tax expenses for the year ended March 31, 2018 and for the year ended March 31, 2017 are:
(i) Profit or loss section
Particulars For the year ended
March 31, 2018 For the year ended
March 31, 2017
Current tax 531.09 533.09 Adjustment of tax relating to earlier years (2.62) - Deferred tax credit 120.92 (78.62)Adjustment of deferred tax relating to earlier years 48.67 (15.83)Total income tax expense recognised in Statement of Profit and Loss 698.06 438.64
(ii) Other comprehensive income (OCI)
Particulars For the year ended
March 31, 2018 For the year ended
March 31, 2017
Net (loss)/gain on remeasurement of defined benefit plans 1.07 (10.55)Income tax charged to OCI (0.30) 3.62
Laurus Labs Limited
Annual Report 2017-18174

(All amounts in Million Rupees except for share data or as otherwise stated)
NOTES to Consolidated financial statements for the year ended March 31, 2018
(b) Reconciliation of effective tax rate:
For the year ended March 31, 2018
For the year ended March 31, 2017
Profit before tax (A) 2,374.16 2,351.95 Enacted tax rate in India (B) 34.61% 34.61%Expected tax expenses (C = A*B) 821.65 813.96 Other than temporary differenceWeighted deduction under section 35(2AB) under the Income Tax Act, 1961 (370.06) (829.46)Deduction under section 32AC of the Income Tax Act, 1961 - (236.43)Deduction under section 32AD of the Income Tax Act, 1961 (256.61) (159.43)Expenses disallowed under Income Tax Act, 1961 49.60 56.19 Profit on sale of subsidiary - (3.00)Effect of lower tax rate in subsidiary 13.52 3.91 Results of subsidiary not taxable 44.54 78.85 Adjustment for taxes with respect to earlier years 143.00 2.05 Others 18.88 2.83 Total (D) (357.12) (1,084.50)Profit after adjusting permanent difference 2,017.04 1,267.45 Expected tax expense 698.06 438.64 Actual income tax expense (benefit) 698.06 438.64 Effective tax rate 29.40% 18.65%
(c) The details of component of deferred tax assets are given under note 6.
(d) During the year ended March 31, 2018, the Group has paid dividend to its shareholders. This has resulted in payment of dividend distribution tax (DDT) to the taxation authorities. The Group believes that DDT represents additional payment to taxation authority on behalf of the shareholders. Hence DDT paid is charged to equity.
28. Gratuity Defined benefit plans The Group has a defined benefit gratuity plan and governed by Payment of Gratuity Act, 1972. Every employee who has
completed five years or more of service is entitled to a gratuity on departure at 15 days salary for each completed year of service. The scheme is funded through a policy with SBI Life Insurance Company Limited. The following tables summarise net benefit expenses recognised in the Statement of Profit and Loss, the status of funding and the amount recognised in the Balance sheet for the gratuity plan:
For the year ended March 31, 2018
For the year ended March 31, 2017
A) Net employee benefit expense (recognised in employee benefits expenses)Current service cost 33.41 9.41 Interest cost 7.85 6.00 Expected return on plan assets (0.10) (0.12)Net employee benefit expenses 41.16 15.29 Actual return on plan asset (0.10) (0.12)
B) Amount recognised in the Balance SheetDefined benefit obligation 135.36 100.97 Fair value of plan assets 1.46 1.88
133.90 99.09 C) Changes in the present value of the defined benefit obligation
Opening defined benefit obligation 100.97 74.90 On acqusition of subsidiary - 3.83 Current service cost 33.41 9.41 Interest cost 7.85 6.00 Benefits paid (5.80) (3.72)Net actuarial (gains) / losses on obligation for the year recognised under OCI (1.07) 10.55 Closing defined benefit obligation 135.36 100.97
D) Change in the fair value of plan assetsOpening fair value of plan assets 1.88 0.49 Actual return on plan assets 0.10 0.12 Contributions 4.82 4.99 Benefits paid (5.34) (3.72)Closing fair value of plan assets 1.46 1.88
175Building Momentum
The Year in Review Statutory Reports Financial Statements

(All amounts in Million Rupees except for share data or as otherwise stated)
NOTES to Consolidated financial statements for the year ended March 31, 2018
The Group expects to contribute ` 17.32 to the gratuity fund in the next year (March 31, 2017: ` 8.00) against the short term liability of ` 17.32 (March 31, 2017: ` 8.36) as per the actuarial valuation.
The major categories of plan assets as a percentage of the fair value of total plan assets are as follows:
March 31, 2018 March 31, 2017
Investments with SBI Life Insurance Company Limited 100.00% 100.00%E) Remeasurement adjustments:
Financial loss/ (gain) on plan assets 1.07 10.55 Remeasurement gains/(losses) recognised in other comprehensive income: 1.07 10.55
(i) The principal assumptions used in determining gratuity for the Group’s plans are shown below:
March 31, 2018 March 31, 2017
Discount rate 7.85% 8.00%Expected rate of return on assets 9.05% 8.50%Salary rise 11.00% 16.00%Attrition Rate 14.00% 12.00%
The estimates of future salary increases, considered in the actuarial valuation, take account of inflation, seniority, promotion and other relevant factors, such as supply and demand in the employment market.
The overall expected rate of return on assets is determined based on the actual rate of return during the current year.
(ii) Disclosure related to indication of effect of the defined benefit plan on the entity’s future cashflows: Expected benefit payments for the year ending:
Year ending March 31, 2018 March 31, 2017
Year 1 - 32.66 Year 2 - 34.69 Year 3 0.18 49.27 Year 4 3.80 42.78 Year 5 3.76 - Beyond 5 years 176.92 31.80
The average duration of the defined benefit plan obligation at the end of the reporting period is 25.91 years (March 31, 2017: 26.17 years).
(iii) Sensitivity analysis: A quantitative sensitivity analysis for significant assumption is as shown below:
March 31, 2018 March 31, 2017
(a) Effect of 1% change in assumed discount rate on defined benefit obligation - 1% increase (10.69) (11.58) - 1% decrease 12.45 13.84 (b) Effect of 1% change in assumed salary escalation rate on defined benefit obligation - 1% increase 8.25 0.44 - 1% decrease (7.85) (0.44)(c) Effect of 1% change in assumed attrition rate on defined benefit obligation - 1% increase (4.28) (11.58) - 1% decrease 4.86 13.84
Defined contribution plan
March 31, 2018 March 31, 2017
Contribution to provident fund 101.98 80.82 Contribution to superannuation fund 13.94 11.35
Laurus Labs Limited
Annual Report 2017-18176

(All amounts in Million Rupees except for share data or as otherwise stated)
NOTES to Consolidated financial statements for the year ended March 31, 2018
29. Share based payments - Equity settled ESOP 2011 Scheme The board of directors/ compensation committee has approved the Laurus Employees Stock Option Scheme(ESOP) 2011 for
issue of stock options shares to eligible employees of the Group effective from September 19, 2011. According to the Scheme, the options granted vest within a period of four years, subject to the terms and conditions specified in the scheme. Options granted shall vest so long as the employee continues to be in the employment of the Group as on the date of vesting. Subject to an employee’s continued employment with the Group, options can be exercised any time on or after the date of vesting of options as specified in the respective grants under the Scheme.
ESOP 2016 Scheme The board of directors/ compensation committee has approved the Laurus Employees Stock Option Scheme(ESOP) 2016 for
issue of stock options to eligible employees of the Group effective from July 01, 2016. According to the Scheme, the options granted vest within a period of four years, subject to the terms and conditions specified in the scheme. Options granted shall vest so long as the employee continues to be in the employment of the Group as on the date of vesting. Subject to an employee’s continued employment with the Group, options can be exercised any time on or after the date of vesting of options as specified in the respective grants under the Scheme.
Exercise period
Scheme Grant Number of optionsYear 125%
Year 225%
Year 350%
ESOP 2011 Grant I 553,000 20-Sep-13 20-Sep-14 20-Sep-15ESOP 2011 Grant II 28,000 19-Sep-14 19-Sep-15 19-Sep-16ESOP 2011 Grant III 38,500 19-Sep-15 19-Sep-16 19-Sep-17ESOP 2011 Grant IV 75,500 19-Sep-16 19-Sep-17 19-Sep-18ESOP 2011 Grant V 185,438 19-Sep-17 19-Sep-18 19-Sep-19ESOP 2016 Grant I 178,438 01-Jul-18 01-Jul-19 01-Jul-20
Scheme Date of GrantNumber of options
Granted * Exercise priceWeighted average
fair value of option at grant date
ESOP 2011 September 19, 2011 553,000 10 105.96ESOP 2011 September 19, 2012 28,000 10 163.94ESOP 2011 September 19, 2013 38,500 10 175.94 ESOP 2011 September 19, 2014 75,500 10 262.84 ESOP 2011 September 19, 2015 185,438 10 525.65 ESOP 2016 July 01, 2016 178,438 550 84.45
* The Group issued bonus shares in the ratio of 3 shares for every 1 share held.
The details of activity under the Scheme ESOP 2011 are summarised below :
March 31, 2018 March 31, 2017
No. of options No. of options
Outstanding at the beginning of the year 906,500 260,313 Granted during the year - 8,250 Additional options on adjustment of bonus issue @3:1 on July 15, 2016 - 788,439 Forfeited during the year 34,000 32,002 Exercised during the year 271,500 118,500 Outstanding at the end of the year 601,000 906,500 Exercisable at the end of the year - - Weighted average exercise price for all the above options (not adjusted for bonus issue) 10 10
177Building Momentum
The Year in Review Statutory Reports Financial Statements

(All amounts in Million Rupees except for share data or as otherwise stated)
NOTES to Consolidated financial statements for the year ended March 31, 2018
The details of activity under the Scheme ESOP 2016 are summarised below :
March 31, 2018 March 31, 2017
No. of options No. of options
Outstanding at the beginning of the year 669,500 - Granted during the year - 178,438 Additional options on adjustment of bonus issue @3:1 on July 15, 2016 - 518,064 Forfeited during the year 25,500 27,002 Exercised during the year 2,000 - Outstanding at the end of the year 642,000 669,500 Exercisable at the end of the year - - Weighted average exercise price for all the above options (not adjusted for bonus issue) 550 550
For options exercised during the year, the weighted average share price at the exercise date under ESOP 2011 scheme, was ` 547.65 per share (March 31, 2017: ` 514.79 per share, ) and under ESOP 2016 scheme, was ` 547.65 per share (March 31, 2017: ` Nil per share).
The weighted average remaining contractual life for the stock options outstanding under ESOP 2011 scheme as at March 31, 2018 is 2.31 years (March 31, 2017: 3.19 years) and under ESOP 2016 as at March 31, 2017 is 3.26 years (March 31, 2017: 4.26 years). The range of exercise prices for options outstanding under ESOP 2011 scheme as at March 31, 2018 was ` 10 (March 31, 2017: ` 10) and under ESOP 2016 as at March 31, 2018 was ` 550 (March 31, 2017: ` 550).
The weighted average fair value of stock options granted during the year under ESOP 2011 scheme was ` Nil (March 31, 2017: ` nil) and under ESOP 2016 scheme was ` Nil (March 31, 2017: ` 84.45). The Black Scholes valuation model has been used for computing the weighted average fair value considering the following inputs:
March 31, 2018
ESOP 2011 scheme ESOP 2016
scheme
Grant V Grant IV Grant III Grant II Grant I Grant I
Dividend yield 0.00% 0.00% 0.00% 0.00% 0.00% 0.00%Expected volatility 0.00% 0.00% 0.00% 0.00% 0.00% 0.00%Risk-free interest rate 7.71% 8.56% 8.47% 8.01% 8.34% 7.03%Weighted average share price of ` 533.00 269.97 183.10 171.22 113.15 514.79Exercise price of ` 10.00 10.00 10.00 10.00 10.00 550.00Expected life of options granted in years 3.51 3.50 3.50 3.50 3.51 2.50
March 31, 2017
ESOP 2011 scheme ESOP 2016
scheme
Grant V Grant IV Grant III Grant II Grant I Grant I
Dividend yield 0.00% 0.00% 0.00% 0.00% 0.00% 0.00%Expected volatility 0.00% 0.00% 0.00% 0.00% 0.00% 0.00%Risk-free interest rate 7.71% 8.56% 8.47% 8.01% 8.34% 7.03%Weighted average share price of ` 533.00 269.97 183.10 171.22 113.15 514.79Exercise price of ` 10.00 10.00 10.00 10.00 10.00 550.00Expected life of options granted in years 3.51 3.50 3.50 3.50 3.51 2.50
The expected life of the stock is based on the historical data and current expectations and is not necessarily indicative of exercise pattern that may occur.
Laurus Labs Limited
Annual Report 2017-18178

(All amounts in Million Rupees except for share data or as otherwise stated)
NOTES to Consolidated financial statements for the year ended March 31, 2018
30. Trade payables (Details of dues to Micro, Small and Medium Enterprises as per MSMED Act,2006):
March 31, 2018 March 31, 2017
The principal amount and the interest due thereon (to be shown separately) remaining unpaid to any supplier as at the end of each accounting year
27.89 11.46
The amount of interest paid by the buyer in terms of section 16, of the Micro Small and Medium Enterprise Development Act, 2006 along with the amounts of the payment made to the supplier beyond the appointed day during each accounting year
- -
The amount of interest due and payable for the period of delay in making payment (which have been paid but beyond the appointed day during the year) but without adding the interest specified under Micro Small and Medium Enterprise Development Act, 2006.
- -
The amount of interest accrued and remaining unpaid at the end of each accounting year; and - -The amount of further interest remaining due and payable even in the succeeding years, until such date when the interest dues as above are actually paid to the small enterprise for the purpose of disallowance as a deductible expenditure under section 23 of the Micro Small and Medium Enterprise Development Act, 2006.
- -
Dues to Micro and Small Enterprises have been determined to the extent such parties have been identified on the basis of information collected by the Management. This has been relied upon by the auditors.
31. Segment Reporting A. The Group is engaged in the manufacture of Active Pharmaceutical Ingredients and intermediates and the same
constitutes a single reportable business segment as per Ind AS 108.
B. Segment information for secondary segment reporting (by geographical segment)
The Company has reportable geographical segments based on location of its customers:
(i) Revenue from customers within India – Domestic
(ii) Revenue from customers outside India – Exports
Geographical segments
ParticularsMarch 31, 2018
Outside India Within India Total
Revenue 10,158.62 10,531.41 20,690.03 Carrying amount of assets 94.41 30,072.79 30,167.20 Cost incurred to acquire capital assets 2.36 3,908.76 3,911.12
ParticularsMarch 31, 2017
Outside India Within India Total
Revenue 6,853.69 12,461.80 19,315.49 Carrying amount of assets 95.22 26,438.98 26,534.20 Cost incurred to acquire capital assets 2.35 2,772.64 2,774.99
179Building Momentum
The Year in Review Statutory Reports Financial Statements

(All amounts in Million Rupees except for share data or as otherwise stated)
NOTES to Consolidated financial statements for the year ended March 31, 2018
32 Related party disclosures Names of related parties and description of relationship
Name of the related party Relationship
Company which exercises significant influencei) Bluewater Investment Limited *Associate Companyi) Sriam Labs Private Limited **Enterprise over which Key Management Personnel exercise significant influencei) Laurus Infosystems (India) Private LimitedKey Management Personneli) Dr. C. Satyanarayana Whole-time director & Chief Executive Officerii) Dr. Raju S Kalidindi ^ Executive Directoriii) Mr. V.V. Ravi Kumar Executive Director & Chief Financial Officeriv) Mr. C. Chandrakanth ^^ Executive Directorv) Dr. C.V.Lakshmana Rao ^^^ Executive Directorvi) Mr. Amal Ganguli Independent Director (passed away on May 7, 2017)vii) Mr. Frank J Wright Independent Director (ceased from April 01 2017)viii) Mr. Ramesh Subrahmanian Independent Director (appointed w.e.f. August 09, 2016)ix) Mrs. Aruna Rajendra Bhinge Independent Directorx) Mr. Rajesh Chandy Independent Directorxi) Dr. M.Venu Gopala Rao Independent Director (appointed w.e.f. May 18, 2017)xii) Dr. Ravindranath K Independent Director (appointed w.e.f. May 18, 2017)xiii) Mr. G Venkateswar Reddy Company SecretaryRelatives of Key Management Personneli) Mr. C. Narasimha Rao Brother of Dr. C. Satyanarayanaii) Mr. C. Chandrakanth ^ Son-in-Law of Dr. C. Satyanarayanaiii) Mr. C. Krishna Chaitanya Son of Dr. C. Satyanarayana (appointed w.e.f April 17, 2017)iv) Mrs. C. Soumya Daughter of Dr. C. Satyanarayana
* Cease to exercise significant influence effective from December 15, 2016
** Cease to be an associate and became subsidiary effective from November 01, 2016
^ Resigned with effective from March 08, 2018
^^ Key Management Personnel effective from August 09, 2016
^^^ Key Management Personnel effective from March 08, 2018
Transactions during the year:
For the year ended
March 31, 2018For the year ended
March 31, 2017
a) Company which exercises significant influence i) Bluewater Investment Limited Issue of bonus equity shares - 224.92 Conversion of CCPS - Series B to equity shares - 0.13 Conversion of CCPS - Series C to equity shares - 41.53 b) Associate Company i) Sriam Labs Private Limited Conversion charges - 4.42 Purchase of goods - 121.26 Sale of goods - 22.95 Sale of assets - 12.30 c) Enterprise over which Key Management Personnel exercise significant influence i) Laurus Infosystems (India) Private Limited Purchase of software 2.44 11.59 Software maintenance 12.33 9.51 d) Key Management Personnel i) Dr. C. Satyanarayana Remuneration 118.87 115.93
Laurus Labs Limited
Annual Report 2017-18180
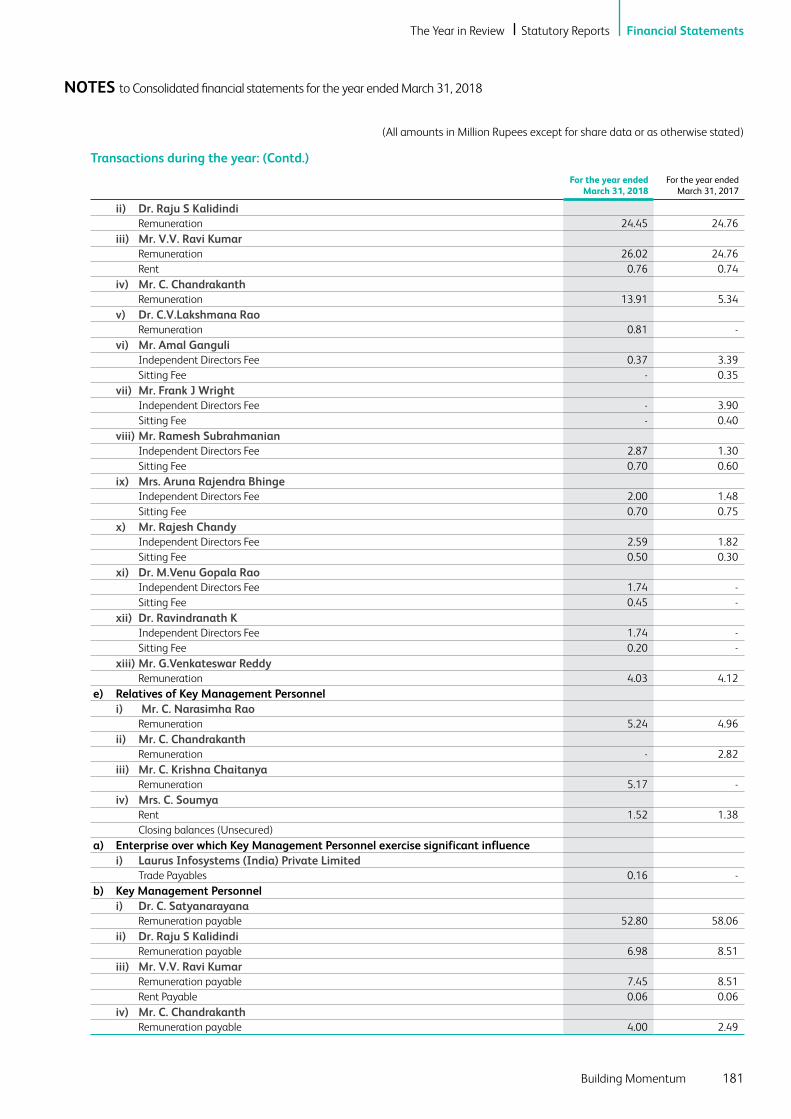
(All amounts in Million Rupees except for share data or as otherwise stated)
NOTES to Consolidated financial statements for the year ended March 31, 2018
For the year ended
March 31, 2018For the year ended
March 31, 2017
ii) Dr. Raju S Kalidindi Remuneration 24.45 24.76 iii) Mr. V.V. Ravi Kumar Remuneration 26.02 24.76 Rent 0.76 0.74 iv) Mr. C. Chandrakanth Remuneration 13.91 5.34 v) Dr. C.V.Lakshmana Rao Remuneration 0.81 - vi) Mr. Amal Ganguli Independent Directors Fee 0.37 3.39 Sitting Fee - 0.35 vii) Mr. Frank J Wright Independent Directors Fee - 3.90 Sitting Fee - 0.40 viii) Mr. Ramesh Subrahmanian Independent Directors Fee 2.87 1.30 Sitting Fee 0.70 0.60 ix) Mrs. Aruna Rajendra Bhinge Independent Directors Fee 2.00 1.48 Sitting Fee 0.70 0.75 x) Mr. Rajesh Chandy Independent Directors Fee 2.59 1.82 Sitting Fee 0.50 0.30 xi) Dr. M.Venu Gopala Rao Independent Directors Fee 1.74 - Sitting Fee 0.45 - xii) Dr. Ravindranath K Independent Directors Fee 1.74 - Sitting Fee 0.20 - xiii) Mr. G.Venkateswar Reddy Remuneration 4.03 4.12 e) Relatives of Key Management Personnel i) Mr. C. Narasimha Rao Remuneration 5.24 4.96 ii) Mr. C. Chandrakanth Remuneration - 2.82 iii) Mr. C. Krishna Chaitanya Remuneration 5.17 - iv) Mrs. C. Soumya Rent 1.52 1.38 Closing balances (Unsecured)a) Enterprise over which Key Management Personnel exercise significant influence i) Laurus Infosystems (India) Private Limited Trade Payables 0.16 - b) Key Management Personnel i) Dr. C. Satyanarayana Remuneration payable 52.80 58.06 ii) Dr. Raju S Kalidindi Remuneration payable 6.98 8.51 iii) Mr. V.V. Ravi Kumar Remuneration payable 7.45 8.51 Rent Payable 0.06 0.06 iv) Mr. C. Chandrakanth Remuneration payable 4.00 2.49
Transactions during the year: (Contd.)
181Building Momentum
The Year in Review Statutory Reports Financial Statements
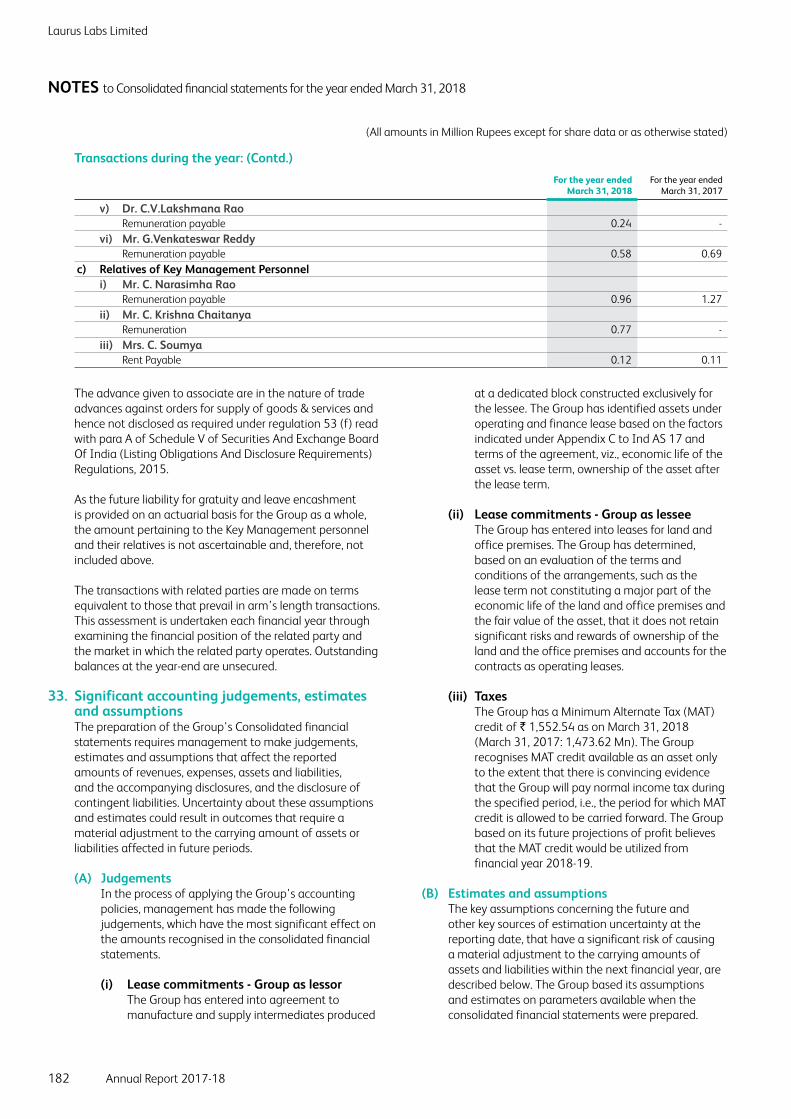
(All amounts in Million Rupees except for share data or as otherwise stated)
NOTES to Consolidated financial statements for the year ended March 31, 2018
For the year ended
March 31, 2018For the year ended
March 31, 2017
v) Dr. C.V.Lakshmana Rao Remuneration payable 0.24 - vi) Mr. G.Venkateswar Reddy Remuneration payable 0.58 0.69 c) Relatives of Key Management Personnel i) Mr. C. Narasimha Rao Remuneration payable 0.96 1.27 ii) Mr. C. Krishna Chaitanya Remuneration 0.77 - iii) Mrs. C. Soumya Rent Payable 0.12 0.11
Transactions during the year: (Contd.)
The advance given to associate are in the nature of trade advances against orders for supply of goods & services and hence not disclosed as required under regulation 53 (f) read with para A of Schedule V of Securities And Exchange Board Of India (Listing Obligations And Disclosure Requirements) Regulations, 2015.
As the future liability for gratuity and leave encashment is provided on an actuarial basis for the Group as a whole, the amount pertaining to the Key Management personnel and their relatives is not ascertainable and, therefore, not included above.
The transactions with related parties are made on terms equivalent to those that prevail in arm’s length transactions. This assessment is undertaken each financial year through examining the financial position of the related party and the market in which the related party operates. Outstanding balances at the year-end are unsecured.
33. Significant accounting judgements, estimates and assumptions
The preparation of the Group's Consolidated financial statements requires management to make judgements, estimates and assumptions that affect the reported amounts of revenues, expenses, assets and liabilities, and the accompanying disclosures, and the disclosure of contingent liabilities. Uncertainty about these assumptions and estimates could result in outcomes that require a material adjustment to the carrying amount of assets or liabilities affected in future periods.
(A) Judgements In the process of applying the Group's accounting
policies, management has made the following judgements, which have the most significant effect on the amounts recognised in the consolidated financial statements.
(i) Lease commitments - Group as lessor The Group has entered into agreement to
manufacture and supply intermediates produced
at a dedicated block constructed exclusively for the lessee. The Group has identified assets under operating and finance lease based on the factors indicated under Appendix C to Ind AS 17 and terms of the agreement, viz., economic life of the asset vs. lease term, ownership of the asset after the lease term.
(ii) Lease commitments - Group as lessee The Group has entered into leases for land and
office premises. The Group has determined, based on an evaluation of the terms and conditions of the arrangements, such as the lease term not constituting a major part of the economic life of the land and office premises and the fair value of the asset, that it does not retain significant risks and rewards of ownership of the land and the office premises and accounts for the contracts as operating leases.
(iii) Taxes The Group has a Minimum Alternate Tax (MAT)
credit of ` 1,552.54 as on March 31, 2018 (March 31, 2017: 1,473.62 Mn). The Group recognises MAT credit available as an asset only to the extent that there is convincing evidence that the Group will pay normal income tax during the specified period, i.e., the period for which MAT credit is allowed to be carried forward. The Group based on its future projections of profit believes that the MAT credit would be utilized from financial year 2018-19.
(B) Estimates and assumptions The key assumptions concerning the future and
other key sources of estimation uncertainty at the reporting date, that have a significant risk of causing a material adjustment to the carrying amounts of assets and liabilities within the next financial year, are described below. The Group based its assumptions and estimates on parameters available when the consolidated financial statements were prepared.
Laurus Labs Limited
Annual Report 2017-18182

(All amounts in Million Rupees except for share data or as otherwise stated)
NOTES to Consolidated financial statements for the year ended March 31, 2018
Existing circumstances and assumptions about future developments, however, may change due to market changes or circumstances arising that are beyond the control of the Group. Such changes are reflected in the assumptions when they occur.
(i) Share-based payments Estimating fair value for share-based payment
transactions requires determination of the most appropriate valuation model, which is dependent on the terms and conditions of the grant. This estimation requires determination of the most appropriate inputs to the valuation model including the expected life of the share option, volatility and dividend yield and making assumptions about them. The Black Scholes valuation model has been used by the Management for share-based payment transactions. The assumptions and models used for estimating fair value for share-based payment transactions are disclosed in Note 29.
(ii) Taxes Deferred tax assets are recognised for unused
tax losses to the extent that it is probable that taxable profit will be available against which the losses can be utilised. Significant management judgement is required to determine the amount of deferred tax assets that can be recognised, based upon the likely timing and the level of future taxable profits together with future tax planning strategies.
(iii) Defined employee benefit plans (Gratuity) The cost of the defined benefit gratuity plan and
the present value of the gratuity obligation are determined using actuarial valuations. An actuarial valuation involves making various assumptions that may differ from actual developments in the future. These include the determination of the discount rate, future salary increases and mortality rates. Due to the complexities involved in the valuation and its long-term nature, a defined benefit obligation is highly sensitive to changes in these assumptions. All assumptions are reviewed at each reporting date.
The parameter most subject to change is the discount rate. In determining the appropriate discount rate for plans operated in India, the management considers the interest rates of government bonds in currencies consistent with the currencies of the post-employment benefit obligation.
The mortality rate is based on publicly available mortality tables for the specific countries. Those mortality tables tend to change only at interval in response to demographic changes. Future salary increases and gratuity increases are based on expected future inflation rates for the respective countries. Further details about gratuity obligations are given in Note 28.
(iv) Fair value measurement of financial instruments
When the fair values of financial assets and financial liabilities recorded in the balance sheet cannot be measured based on quoted prices in active markets, their fair value is measured using valuation techniques including the Discounted Cash Flow ('DCF') model. The inputs to these models are taken from observable markets where possible, but where this is not feasible, a degree of judgement is required in establishing fair values. Judgements include considerations of inputs such as liquidity risk, credit risk and volatility. Changes in assumptions about these factors could affect the reported fair value of financial instruments. See note 35 and 36 for further disclosures.
(v) Depreciation on property, plant and equipment
Depreciation on property, plant and equipment is calculated on a straight-line basis using the rates arrived at based on the useful lives and residual values of all its property, plant and equipment estimated by the management. The management believes that depreciation rates currently used fairly reflect its estimate of the useful lives and residual values of property, plant and equipment, though these rates in certain cases are different from lives prescribed under Schedule II of the Companies Act, 2013.
34. Hedging activities and derivatives Derivatives not designated as hedging instruments The Group uses foreign currency denominated borrowings
and foreign exchange forward contracts to manage some of its transaction exposures. The foreign exchange forward contracts are not designated as cash flow hedges and are entered into for periods consistent with foreign currency exposure of the underlying transactions, generally from one week to twelve months.
183Building Momentum
The Year in Review Statutory Reports Financial Statements
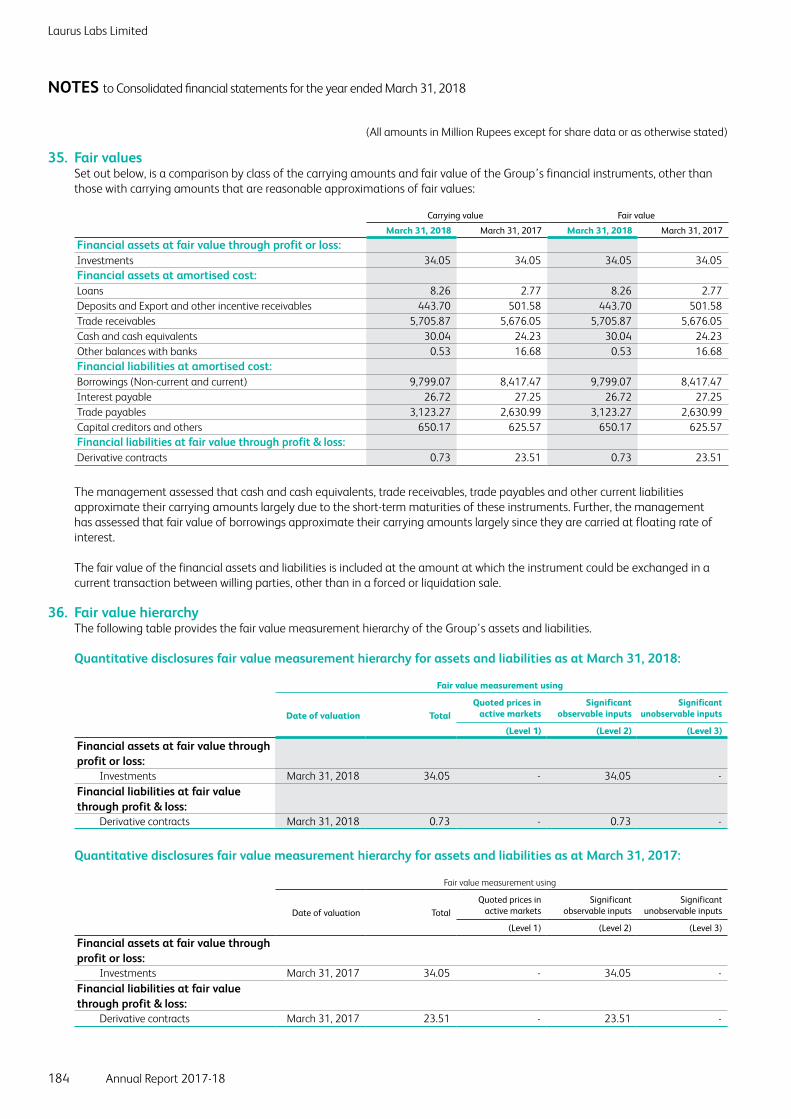
(All amounts in Million Rupees except for share data or as otherwise stated)
NOTES to Consolidated financial statements for the year ended March 31, 2018
35. Fair values Set out below, is a comparison by class of the carrying amounts and fair value of the Group’s financial instruments, other than
those with carrying amounts that are reasonable approximations of fair values:
Carrying value Fair value
March 31, 2018 March 31, 2017 March 31, 2018 March 31, 2017
Financial assets at fair value through profit or loss:Investments 34.05 34.05 34.05 34.05 Financial assets at amortised cost:Loans 8.26 2.77 8.26 2.77 Deposits and Export and other incentive receivables 443.70 501.58 443.70 501.58 Trade receivables 5,705.87 5,676.05 5,705.87 5,676.05 Cash and cash equivalents 30.04 24.23 30.04 24.23 Other balances with banks 0.53 16.68 0.53 16.68 Financial liabilities at amortised cost:Borrowings (Non-current and current) 9,799.07 8,417.47 9,799.07 8,417.47 Interest payable 26.72 27.25 26.72 27.25 Trade payables 3,123.27 2,630.99 3,123.27 2,630.99 Capital creditors and others 650.17 625.57 650.17 625.57 Financial liabilities at fair value through profit & loss:Derivative contracts 0.73 23.51 0.73 23.51
The management assessed that cash and cash equivalents, trade receivables, trade payables and other current liabilities approximate their carrying amounts largely due to the short-term maturities of these instruments. Further, the management has assessed that fair value of borrowings approximate their carrying amounts largely since they are carried at floating rate of interest.
The fair value of the financial assets and liabilities is included at the amount at which the instrument could be exchanged in a current transaction between willing parties, other than in a forced or liquidation sale.
36. Fair value hierarchy The following table provides the fair value measurement hierarchy of the Group's assets and liabilities.
Quantitative disclosures fair value measurement hierarchy for assets and liabilities as at March 31, 2018:
Fair value measurement using
Date of valuation TotalQuoted prices in
active markets Significant
observable inputsSignificant
unobservable inputs
(Level 1) (Level 2) (Level 3)
Financial assets at fair value through profit or loss: Investments March 31, 2018 34.05 - 34.05 - Financial liabilities at fair value through profit & loss: Derivative contracts March 31, 2018 0.73 - 0.73 -
Quantitative disclosures fair value measurement hierarchy for assets and liabilities as at March 31, 2017:
Fair value measurement using
Date of valuation TotalQuoted prices in
active markets Significant
observable inputsSignificant
unobservable inputs
(Level 1) (Level 2) (Level 3)
Financial assets at fair value through profit or loss: Investments March 31, 2017 34.05 - 34.05 - Financial liabilities at fair value through profit & loss: Derivative contracts March 31, 2017 23.51 - 23.51 -
Laurus Labs Limited
Annual Report 2017-18184

(All amounts in Million Rupees except for share data or as otherwise stated)
NOTES to Consolidated financial statements for the year ended March 31, 2018
Measurement of Fair Value Valuation techniques The following table shows the valuation techniques used in measuring Level 2 fair values for assets and liabilities carried at fair
value through profit or loss.
Type Valuation Technique
Assets measured at fair value:Investments The fair value is determined based on value per share derived from net
worth of the Company as at the reporting date.
Liabilities measured at fair value:Derivative contracts The fair value is determined using quoted forward exchange rates at the
reporting date.
37. Financial risk management objectives and policies
Financial Risk Management Framework The Group is exposed primarily to Credit risk, liquidity risk
and market risk (fluctuations in foreign currency exchange rates and interest rate), which may adversely impact the fair value of its financial instruments. The Group assesses the unpredictability of the financial environment and seeks to mitigate potential adverse effects on the financial performance of the Group.
Credit risk Credit risk is the risk that counterparty will not meet its
obligations under a financial instrument or customer contract, leading to a financial loss. Credit risk encompasses of both, the direct risk of default and the risk of deterioration of creditworthiness as well as concentration of risks. Credit risk is controlled by analysing credit limits and creditworthiness of customers on a continuous basis to whom the credit has been granted after obtaining necessary approvals for credit. Financial instruments that are subject to concentrations of credit risk principally consist of trade receivables, investments, derivative financial instruments, cash and cash equivalents, bank deposits and other financial assets. None of the financial instruments of the Group result in material concentration of credit risk, except for trade receivables.
Trade receivables: The customer credit risk is managed by the Group’s
established policy, procedures and control relating to customer credit risk management. Credit quality of a customer is assessed based on the individual credit limits are defined in accordance with this assessment and outstanding customer receivables are regularly monitored. Of the trade receivables balance, ` 2,997.24 in aggregate (as at March 31, 2017 ` 3,380.44) is due from the Group's customers individually representing more than 5 % of the total trade receivables balance and accounted for approximately 54% (March 31, 2017: 60%) of all the receivables outstanding. The Group' receivables turnover is quick and historically, there was no significant defaults on account of those customer in the past. Ind AS requires an
entity to recognise in profit or loss, the amount of expected credit losses (or reversal) that is required to adjust the loss allowance at the reporting date to the amount that is required to be recognised in accordance with Ind AS 109. The Group assesses at each date of statements of financial position whether a financial asset or a group of financial assets is impaired. Expected credit losses are measured at an amount equal to the 12 month expected credit losses or at an amount equal to the life time expected credit losses if the credit risk on the financial asset has increased significantly since initial recognition. The Group has used a practical expedient by computing the expected credit loss allowance for trade receivables based on a provision matrix. The provision matrix takes into account historical credit loss experience and adjusted for forward-looking information.
Before accepting any new customer, the Group uses an internal credit scoring system to assess the potential customer's credit quality and defines credit limits by customer. Limits and scoring attributed to customers are reviewed on periodic basis. The expected credit loss allowance is based on the ageing of the days the receivables are due and the rates as given in the provision matrix.
Exposure to credit risk: The carrying amount of financial assets represents the
maximum credit exposure. The maximum exposure to credit risk was ` 5,705.87 and ` 5,676.05 as of March 31, 2018 and March 31, 2017 respectively, being the total of the carrying amount of balances with trade receivables.
Liquidity risk Liquidity risk refers to the risk that the Group cannot meet
its financial obligations. The objective of liquidity risk management is to maintain sufficient liquidity and ensure that funds are available for use as per requirements. The Group manages liquidity risk by maintaining adequate reserves, banking facilities and reserve borrowing facilities, by continuously monitoring forecast and actual cash flows, and by matching the maturity profiles of financial assets and liabilities.
185Building Momentum
The Year in Review Statutory Reports Financial Statements

(All amounts in Million Rupees except for share data or as otherwise stated)
NOTES to Consolidated financial statements for the year ended March 31, 2018
The table below summarises the maturity profile of the Group’s financial liabilities based on contractual undiscounted payments:
Up to 1 Year 1 to 3 years 3 to 5 years > 5 years Total
March 31, 2018:Non-current borrowings (including current maturities)
797.31 1,069.31 347.28 - 2,213.90
Current borrowings 7,585.17 - - - 7,585.17 Interest payable 26.72 - - - 26.72 Trade payables 3,123.27 - - - 3,123.27 Other payables 650.17 - - - 650.17
12,182.64 1,069.31 347.28 - 13,599.23 March 31, 2017:Non-current borrowings (including current maturities)
730.14 911.99 273.14 60.49 1,975.76
Current borrowings 6,441.71 - - - 6,441.71 Interest payable 27.25 - - - 27.25 Trade payables 2,630.99 - - - 2,630.99 Other payables 625.57 - - - 625.57
10,455.66 911.99 273.14 60.49 11,701.28
Market Risk Market risk is the risk that the fair value or future cash flows of a financial instrument will fluctuate because of changes in market
prices. Such changes in the values of financial instruments may result from changes in the foreign currency exchange rates, interest rates, credit, liquidity and other market changes. The Group’s exposure to market risk is primarily on account of foreign currency exchange rate risk.
Interest rate risk Interest rate risk is the risk that the fair value or future cash flows of a financial instrument will fluctuate because of change
in market interest rates. In order to optimize the Group’s position with regards to interest income and interest expenses and to manage the interest rate risk, treasury performs a comprehensive corporate interest risk management by balancing the proportion of fixed rate and floating rate financial instruments in its total portfolio.
Interest rate sensitivity The following table demonstrates the sensitivity to a reasonably possible change in interest rates on that portion of borrowings
affected, after the impact of hedge accounting. With all other variables held constant, the Group’s profit before tax is affected through the impact on borrowings, as follows:
Change in basis points Effect on profit before tax
Increase Decrease Decrease Increase
March 31, 2018 Indian Rupees 0.50% 0.50% (37.90) 37.90 US Dollars 0.50% 0.50% (11.31) 11.31 March 31, 2017 Indian Rupees 0.50% 0.50% (42.81) 42.81 US Dollars 0.50% 0.50% (6.48) 6.48
The assumed movement in basis points for the interest rate sensitivity analysis is based on the currently observable market environment.
Foreign Currency exchange rate risk The fluctuation in foreign currency exchange rates may have potential impact on the statement of profit or loss and other
comprehensive income and equity, where any transaction references more than one currency or where assets / liabilities are denominated in a currency other than the functional currency of the respective entities. Considering the countries and economic environment in which the Group operates, its operations are subject to risks arising from fluctuations in exchange rates in those countries. The risks primarily relate to fluctuations in US Dollar against the functional currencies of the Group. The Group, as per its risk management policy, uses derivative instruments primarily to hedge foreign exchange. The Group evaluates the impact of foreign exchange rate fluctuations by assessing its exposure to exchange rate risks. It hedges a part of these risks by using derivative financial instruments in line with its risk management policies. The information on derivative instruments is as follows:
Laurus Labs Limited
Annual Report 2017-18186

(All amounts in Million Rupees except for share data or as otherwise stated)
NOTES to Consolidated financial statements for the year ended March 31, 2018
a) Forward Contract (Derivatives): Forward contract outstanding as at Balance Sheet date:
March 31, 2018 Buy US $ 91,81,381 Hedging of borrowingsMarch 31, 2018 Sell US $ 950,000 Hedging of receivablesMarch 31, 2017 Buy US $ 17,245,117 Hedging of borrowings and creditors
b) Details of Unhedged Foreign Currency Exposure: The year end foreign currency exposures that have not been hedged by a derivative instrument or otherwise are as under -
Currency
March 31, 2018 March 31, 2017
Amount in Foreign Currency
Amount in `Conversion
Rate
Amount in Foreign Currency
Amount in `Conversion
Rate
Secured loans USD 34,646,809 2,253.57 65.04 4,861,278 315.20 64.84 EURO 5,000,000 403.11 80.62 - - -
Interest accrued but not due on borrowings
USD 79,174 5.15 65.04 93,408 6.06 64.84 EURO 877 0.07 80.62 - - -
Trade payables USD 18,796,382 1,222.59 65.04 17,823,054 1,155.62 64.84 EURO 221,217 17.84 80.62 418,643 28.99 69.25 GBP 5,156 0.48 92.28 2,802 0.23 80.88 CAD - - 50.82 19,687 1.00 50.82 CHF 25,192 1.72 68.34 - - - CNY 54,907 0.57 10.31 - - -
Capital creditors USD 179,327 11.66 65.04 87,600 5.68 64.84 GBP 26,971 2.49 92.28 21 0.00 80.88 EURO 43,759 3.53 80.62 388,226 26.88 69.25
Trade receivables USD 29,615,264 1,926.30 65.04 20,444,085 1,325.57 64.84 EURO 3,124,351 251.89 80.62 3,012,737 208.62 69.25 GBP 4,250 0.39 92.28 199,013 16.10 80.88 CAD 37,000 1.88 50.82 - - -
Cash and cash equivalents USD 1,245 0.08 65.04 2,840 0.18 64.84 AED - - - 20 - 17.62 BRL - - - 249 0.01 20.70 SGD 5,000 0.25 49.83 - - -
Advances from customers USD 9,885,382 642.99 65.04 6,594,669 427.59 64.84 EURO 9,113,455 734.75 80.62 9,670,637 669.67 69.25
Advances recoverable in cash or kind
USD 520,084 33.83 65.04 516,479 33.49 64.84 EURO 81,777 6.59 80.62 235,381 16.30 69.25 GBP 3,752 0.35 92.28 54,829 4.43 80.88 CHF 1,750 0.12 68.34 3,664 0.24 64.91 JPY 36,500 0.02 0.62 77,310 0.04 0.58 CNY 46,164 0.48 10.31 - - -
* Amount less than Indian Rupees 10,000
c) Foreign currency sensitivity: The following tables demonstrate the sensitivity to a reasonably possible change in USD and EURO exchange rates, with all other
variables held constant. The impact on the Group’s profit before tax is due to changes in the fair value of monetary assets and liabilities including foreign currency derivatives. The Group’s exposure to foreign currency changes for all other currencies is not material.
Change in USD rate Effect on profit before tax
Increase Decrease Increase/(Decrease)
March 31, 2018USD 1.00% 1.00% (21.76) 21.76 EURO 1.00% 1.00% (4.98) 4.98 March 31, 2017USD 1.00% 1.00% (5.51) 5.51 EURO 1.00% 1.00% (5.01) 5.01
187Building Momentum
The Year in Review Statutory Reports Financial Statements

(All amounts in Million Rupees except for share data or as otherwise stated)
NOTES to Consolidated financial statements for the year ended March 31, 2018
38. Group Information Information about subsidiaries The consolidated financial statements of the Group includes subsidiaries listed in the table below:
Name Principal activitiesCountry of incorporation
% of equity interest
March 31, 2018 March 31, 2017
Laurus Synthesis Inc. Chemistry, IP Development and related services to the global Pharmaceutical community
USA 100% 100%
Sriam Labs Private Limited (refer note 1) Active Pharmaceutical Ingredients (APIs) and Intermediates
India 100% 100%
Laurus Holdings Limited (refer note 2) Business support services in the fields of pharmaceuticals
UK 100% -
Laurus Generics Inc. (refer note 3) Pharmaceutical and related services USA 100% - Laurus Generics GmbH (refer note 4) Pharmaceutical and related services Germany 100% -
1) Till October 31, 2016, the entity was an associate, with the Company having a share of 27%. With effect from November 01, 2016, the Company acquired the remaining 73% stake in the equity shares thereby making it a wholly owned subsidiary from that date.
2) The Company incorporated wholly owned subsidiary, Laurus Holdings Limited in UK on July 10, 2017 and consolidated the same with effect from January 01, 2018 as the transactions between the period July 10, 2017 to December 31, 2017 were not material.
3) The Company, through its wholly owned subsidiary, Laurus Holdings Limited, incorporated step down subsidiary, Laurus Generics Inc., USA on August 07, 2017 and consolidated the same with effect from January 01, 2018 as the transactions between the period August 07, 2017 to December 31, 2017 were not material.
4) The Company, through its wholly owned subsidiary, Laurus Holdings Limited, incorporated step down subsidiary, Laurus Generics GmbH., Germany. The incorporation was finalised on April 06, 2018.
39. Business combination Acquisitions during the year ended March 31, 2017 Acquisition of Sriam Labs Private Limited On November 01, 2016, the Group had acquired additional stake in shares of Sriam Labs Private Limited making it a
wholly owned subsidiary (100% voting equity interests have been acquired). Sriam Labs Private Limited is a private limited company based in India and engaged in design, development and manufacture of Active pharmaceutical intermediates and Intermediates to cater to the needs of pharmaceutical industry, in exchange for cash. The Group acquired Sriam Labs Private Limited because it will help realize the anticipated growth opportunities and synergies from combining these businesses
Laurus Labs Limited
Annual Report 2017-18188

(All amounts in Million Rupees except for share data or as otherwise stated)
NOTES to Consolidated financial statements for the year ended March 31, 2018
Assets acquired and liabilities assumed The fair values of the identifiable assets and liabilities of Sriam Labs Private Limited as at the date of acquisition were:
November 01, 2016
Non current assetsProperty, plant and equipment 675.81 Capital work-in-progress 67.50 Intangible assets 8.66 Financial assets Loans 5.75 Others 1.63 Other non-current assetsDeferred tax assets (net) 52.07
811.42 Current assetsInventories 96.40 Financial assets Loans 0.17 Trade receivables 80.49 Cash and cash equivalents 6.82 Others 39.39 Current tax assets 5.31 Other current assets 54.00
282.58 1,094.00
November 01, 2016
Non-current liabilitiesFinancial liabilities Borrowings 263.01 Provisions 5.06
268.07 Current liabilitiesFinancial liabilities Borrowings 163.57 Trade payables 287.36 Current maturities and other liabilities 180.51 Current tax liabilities 4.77 Other current liabilities 17.07 Provisions 0.18
653.46 Total liabilities (B) 921.53 Total identifiable net assets at fair value (C=A-B) 172.47 Add: Share of profits considered as an associate 12.08 Add: Goodwill arising on acquisition (Note 4) 97.39 Less: Investment held (71.98)Total purchase consideration transferred 209.96
The fair value and the gross amount of trade receivables amounts to ` 80.49. However, none of the trade receivables is credit impaired and it is expected that the full contractual amounts can be collected.
The deferred tax asset mainly comprises the tax effect of the unused tax losses and accelerated depreciation for tax purposes of tangible and intangible assets. Such deferred tax assets have been recognised based on approval of business plan by subsidiary's board, agreements entered with customers, orders on hand, fresh infusion of funds, successful patent filings and a portfolio of drugs.
189Building Momentum
The Year in Review Statutory Reports Financial Statements

(All amounts in Million Rupees except for share data or as otherwise stated)
NOTES to Consolidated financial statements for the year ended March 31, 2018
The goodwill of ` 97.39 comprises the value of expected synergies arising from the acquisition. None of the goodwill recognised is expected to be deductible for income tax purposes.
From the date of acquisition, Sriam Labs Private Limited has contributed ` 230.02 of revenue from operations (gross) and reported a loss before tax of ` 36.46. If the combination had taken place at the beginning of the year, revenue from operations (gross) would have been ` 19,583.58 and the profit before tax for the Group would have been ` 2,274.37.
Purchase consideration
March 31, 2017
Cash paid (included in cash flows from investing activities) 209.96Total consideration 209.96Analysis of cash flows on acquisition:Transaction costs of the acquisition (included in cash flows from operating activities) 0.42 Net cash acquired with the subsidiary (included in cash flows from investing activities) 6.82 Net cash flow on acquisition 7.24
The Group has issued cash consideration for the additional stake interest in Sriam Labs Private Limited. Transaction costs of ` 0.42 have been expensed and are included in other expenses. There is no contingent consideration in the business combination.
40. Capital management For the purpose of the Group's capital management, capital includes issued equity capital, compulsorily convertible preference
shares, share premium and all other equity reserves attributable to the equity holders. The primary objective of the Group’s capital management is to maximise the shareholder value.
The Group manages its capital structure in consideration to the changes in economic conditions and the requirements of the financial covenants. The Group monitors capital using a gearing ratio, which is net debt divided by total capital plus net debt. The Group intends to keep the gearing ratio between 0.5 to 1.5.The Group includes within net debt, borrowings including interest accrued on borrowings, less cash and short-term deposits.
March 31, 2018 March 31, 2017
Borrowings including interest accrued on borrowings (Note 13) 9,825.79 8,444.72 Less: cash and cash equivalents; other balances with banks (Note 10A and 10B) (30.57) (40.91)Net debt 9,795.22 8,403.81Equity 1,060.30 1,057.56Other Equity 13,766.09 12,246.92 Total Equity 14,826.39 13,304.48Gearing ratio (Net debt/ Total equity) 0.66 0.63
In order to achieve this overall objective, the Group’s capital management, amongst other things, aims to ensure that it meets financial covenants attached to the interest-bearing loans and borrowings that define capital structure requirements. Breaches in meeting the financial covenants would permit the bank to immediately call loans and borrowings. There have been no breaches in the financial covenants of any interest-bearing loans and borrowing in the current year.
No changes were made in the objectives, policies or processes for managing capital during the year ended March 31, 2018.
41. Commitments and Contingencies a. Leases Operating and finance lease commitments - Group as lessor The Group has entered into agreement to manufacture and supply intermediates produced at a dedicated block constructed
exclusively for the lessee. The Group has identified assets under operating and finance lease based on the factors indicated under Appendix C to Ind AS 17 and terms of the agreement, viz., economic life of the asset vs. lease term, ownership of the asset after the lease term. This lease term of assets under operating lease is upto 10 years.
Laurus Labs Limited
Annual Report 2017-18190

(All amounts in Million Rupees except for share data or as otherwise stated)
NOTES to Consolidated financial statements for the year ended March 31, 2018
Future minimum rentals receivable under non-cancellable operating leases are as follows:
March 31, 2018 March 31, 2017
Within one year 38.96 39.24After one year but not more than five years 155.85 156.97More than five years 677.51 720.77
872.32 916.98
Future minimum rentals receivable under non-cancellable finance leases are as follows:
March 31, 2018 March 31, 2017
Within one year 163.47 163.47After one year but not more than five years 607.65 438.00More than five years 209.74 542.85
980.86 1144.32
Operating lease commitments - Group as lessee The Group has entered into operating leases agreement on Land, with lease terms between 33-51 years. Also, the Group has
taken certain office premises on leases, with lease term of 5 years and is renewable for further periods. There are escalation clauses in the office premises lease agreement to enable upward revision of the rental charge on an annual basis according to prevailing market conditions.
March 31, 2018 March 31, 2017
In case of land taken on leaseLease payment recognised in the Statement of Profit and Loss 10.56 10.50 Minimum lease payments under non cancellable operating leases payable: Within one year 10.92 10.81 After one year but not more than five years 43.69 43.23 More than five years 255.44 254.62
320.61 319.15
b. Commitments
March 31, 2018 March 31, 2017
Estimated amount of contracts remaining to be executed on capital account and not provided for 732.35 586.86
c. Contingent Liabilities
March 31, 2018 March 31, 2017
(i) Outstanding bank guarantees (excluding performance obligations) 192.86 111.34 (ii) Bills discounted 455.96 257.25 (iii) Demand for direct taxes under appeal 10.10 10.10 (iv) Demand for indirect taxes under appeal 265.28 101.03
42. Expenditure during construction period (pending allocation)
March 31, 2018 March 31, 2017
Opening balance 0.69 3.67 Add: Rates and taxes - Power and fuel - 9.27 Rent - 0.55 Factory maintenance - 4.34 Insurance - 0.84 Others - 0.50 Less: Capitalised during the year 0.69 18.48
- 0.69
191Building Momentum
The Year in Review Statutory Reports Financial Statements

(All amounts in Million Rupees except for share data or as otherwise stated)
NOTES to Consolidated financial statements for the year ended March 31, 2018
43. The Group has completed the Initial Public Offer (IPO) of 31,116,785 equity shares of ` 10 each at an issue price of ` 428 per share (` 388 per share for eligible employees), consisting of fresh issue of 7,009,345 equity shares and an offer for sale of 24,107,440 equity shares by selling shareholders. The equity shares of the Group were listed on BSE Limited ('BSE') and National Stock Exchange of India Limited ('NSE'), w.e.f from December 19, 2016.
The details of utilisation of IPO proceeds - ` 2,859.24 (net off IPO related expenses including service tax - ` 137.86) are as follows:
ParticularsAs per
ProspectusUtilised upto
March 31, 2017
Unutilised amount as at March
31, 2017
Pre-payment of term loans 2,262.90 2,262.90 - General corporate purposes 596.34 596.34 - Total 2,859.24 2,859.24 -
The Group had originally estimated ` 644.00 (inclusive of service tax) as IPO related expenses. Of such IPO related expenses, certain expenses (such as listing fee) aggregating to ` 5.78 are directly attributable to the Group. Remaining IPO related expenses aggregating to ` 638.22, have been allocated between the Group (` 143.77) and the selling shareholders (` 494.45) in proportion to the equity shares allotted to the public as fresh issue by the Group and under offer for sale by the selling shareholders. The Group has incurred an amount of ` 592.11 (inclusive of service tax) towards IPO related expenses and does not expect any further expenditure. The remaining unspent amount of ` 51.89 has been re-allocated between the Group and the selling shareholders in the originally apportioned manner. Accordingly, an amount of ` 11.69 has been credited to securities premium and an amount of ` 40.20 is paid to the selling shareholders.
Laurus Labs Limited
Annual Report 2017-18192
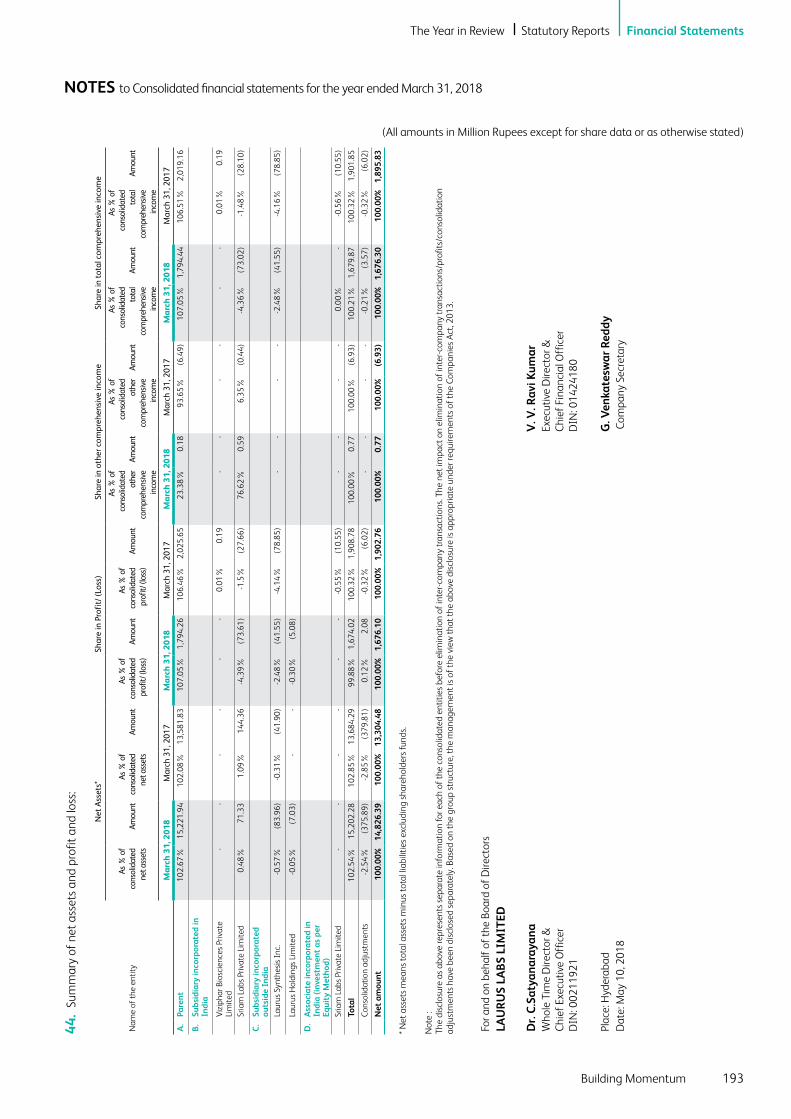
(All amounts in Million Rupees except for share data or as otherwise stated)
NOTES to Consolidated financial statements for the year ended March 31, 2018
44.
Sum
mar
y of
net
ass
ets
and
prof
it an
d lo
ss:
Nam
e of
the
entit
y
Net
Ass
ets*
Shar
e in
Pro
fit/
(Los
s)Sh
are
in o
ther
com
preh
ensi
ve in
com
eSh
are
in t
otal
com
preh
ensi
ve in
com
e
As %
of
cons
olid
ated
ne
t ass
ets
Amou
ntAs
% o
f co
nsol
idat
ed
net a
sset
sAm
ount
As %
of
cons
olid
ated
pr
ofit/
(los
s)Am
ount
As %
of
cons
olid
ated
pr
ofit/
(los
s)Am
ount
As %
of
cons
olid
ated
ot
her
com
preh
ensiv
e in
com
e
Amou
nt
As %
of
cons
olid
ated
ot
her
com
preh
ensiv
e in
com
e
Amou
nt
As %
of
cons
olid
ated
to
tal
com
preh
ensiv
e in
com
e
Amou
nt
As %
of
cons
olid
ated
to
tal
com
preh
ensiv
e in
com
e
Amou
nt
Mar
ch 3
1, 2
018
Mar
ch 3
1, 2
017
Mar
ch 3
1, 2
018
Mar
ch 3
1, 2
017
Mar
ch 3
1, 2
018
Mar
ch 3
1, 2
017
Mar
ch 3
1, 2
018
Mar
ch 3
1, 2
017
A.
Pare
nt10
2.67
% 1
5,22
1.94
10
2.08
% 1
3,58
1.83
10
7.05
% 1
,794
.26
106.
46%
2,0
25.6
5 23
.38%
0.1
8 93
.65%
(6.4
9)10
7.05
% 1
,794
.44
106.
51%
2,0
19.1
6
B.
Subs
idia
ry in
corp
orat
ed in
In
dia
Viz
ipha
r Bio
scie
nces
Priv
ate
Lim
ited
- -
- -
- -
0.01
% 0
.19
- -
- -
- -
0.01
% 0
.19
Sria
m L
abs
Priv
ate
Lim
ited
0.48
% 7
1.33
1.
09%
144
.36
-4.3
9% (7
3.61
)-1
.5%
(27.
66)
76.6
2% 0
.59
6.35
% (0
.44)
-4.3
6% (7
3.02
)-1
.48%
(28.
10)
C.
Subs
idia
ry in
corp
orat
ed
outs
ide
Indi
aLa
urus
Syn
thes
is I
nc.
-0.5
7% (8
3.96
)-0
.31%
(41.
90)
-2.4
8% (4
1.55
)-4
.14%
(78.
85)
- -
- -
-2.4
8% (4
1.55
)-4
.16%
(78.
85)
Laur
us H
oldi
ngs
Lim
ited
-0.0
5% (7
.03)
- -
-0.3
0% (5
.08)
D.
Ass
ocia
te in
corp
orat
ed in
In
dia
(inv
estm
ent
as p
er
Equi
ty M
etho
d)Sr
iam
Lab
s Pr
ivat
e Li
mite
d -
- -
- -
- -0
.55%
(10.
55)
- -
- -
0.00
% -
-0.5
6% (1
0.55
)
Tota
l10
2.54
% 1
5,20
2.28
10
2.85
% 1
3,68
4.29
99
.88%
1,6
74.0
2 10
0.32
% 1
,908
.78
100.
00%
0.7
7 10
0.00
% (6
.93)
100.
21%
1,6
79.8
7 10
0.32
% 1
,901
.85
Cons
olid
atio
n ad
just
men
ts-2
.54%
(375
.89)
-2.8
5% (3
79.8
1)0.
12%
2.0
8 -0
.32%
(6.0
2) -
- -
- -0
.21%
(3.5
7)-0
.32%
(6.0
2)
Net
am
ount
100.
00%
14,
826.
39
100.
00%
13,
304.
48
100.
00%
1,6
76.1
0 10
0.00
% 1
,902
.76
100.
00%
0.7
7 10
0.00
% (6
.93)
100.
00%
1,6
76.3
0 10
0.00
% 1
,895
.83
* Net
ass
ets
mea
ns to
tal a
sset
s m
inus
tota
l lia
bilit
ies
excl
udin
g sh
areh
olde
rs fu
nds.
Not
e :
The
disc
losu
re a
s ab
ove
repr
esen
ts s
epar
ate
info
rmat
ion
for e
ach
of th
e co
nsol
idat
ed e
ntiti
es b
efor
e el
imin
atio
n of
inte
r-com
pany
tran
sact
ions
. The
net
impa
ct o
n el
imin
atio
n of
inte
r-com
pany
tran
sact
ions
/pro
fits/
cons
olid
atio
n ad
just
men
ts h
ave
been
dis
clos
ed s
epar
atel
y. B
ased
on
the
grou
p st
ruct
ure,
the
man
agem
ent i
s of
the
view
that
the
abov
e di
sclo
sure
is a
ppro
pria
te u
nder
requ
irem
ents
of t
he C
ompa
nies
Act
, 201
3.
For a
nd o
n be
half
of th
e Bo
ard
of D
irect
ors
LAU
RU
S LA
BS
LIM
ITED
Dr.
C.S
atya
nara
yana
V
. V. R
avi K
umar
W
hole
Tim
e D
irect
or &
C
hief
Exe
cutiv
e O
ffic
er
DIN
: 002
1192
1
Exec
utiv
e D
irect
or &
C
hief
Fin
anci
al O
ffic
er
DIN
: 014
2418
0
Plac
e: H
yder
abad
G. V
enka
tesw
ar R
eddy
D
ate:
May
10,
201
8 C
ompa
ny S
ecre
tary
193Building Momentum
The Year in Review Statutory Reports Financial Statements

Laurus Labs LimitedRegd. Office: Plot No.21, Jawaharlal Nehru Pharma City, Parawada, Visakhapatnam – 531 021
Corp. Office: 2nd Floor, Serene Chambers, Road No.7, Banjara Hills, Hyderabad – 500 034CIN No: L24239AP2005PLC047518
Notice
Notice is hereby given that the 13th Annual General Meeting of the Members of Laurus Labs Limited (the Company) will be held at Oyster Hall, Waltair Club, Opposite Government Circuit House, Siripuram, Visakhapatnam – 530003, Andhra Pradesh at 3.00 p.m. on Thursday the 05th day of July, 2018, to transact the following business:
ORDINARY BUSINESS :1. To consider and adopt the audited Standalone Financial
Statements of the Company for the Financial Year ended March 31, 2018, the reports of Board of Directors and Auditors thereon
2. To consider and adopt the audited Consolidated Financial Statements of the Company for the Financial Year ended March 31, 2018 and report of Auditors thereon.
3. To declare dividend on equity shares of the Company for the Financial Year 2017-18.
4. To appoint a Director in place of Dr. Satyanarayana Chava (DIN 00211921) who retires by rotation and, being eligible, offers himself, for re-appointment.
5. To appoint a Director in place of Mr. V.V.Ravi Kumar (DIN 01424180) who retires by rotation and, being eligible, offers himself, for re-appointment.
6. To consider, and if thought fit, to pass, with or without modifications, the following resolution as an Ordinary Resolution:
”RESOLVED THAT pursuant to the provisions of Section 139 and all other applicable provisions, if any, of the Companies Act, 2013 (“Act”) and the Companies (Audit and Auditors) Rules, 2014 as amended from time to time, the Company hereby ratifies the appointment of Deloitte Haskins & Sells LLP, Chartered Accountants (Firm Registration No. 117366W/W–100018), as Auditors of the Company to hold office from the conclusion of this Annual General Meeting (AGM) till the conclusion of the Fourteenth (14th) Annual General Meeting to be held in 2019 to examine and audit the accounts of the Company for the financial year 2018-19 at such remuneration as may be mutually agreed between the Board of Directors of the Company and the Auditors.
7. To consider, and if thought fit, to pass, with or without modification(s) the following resolution as an Ordinary Resolution:
“RESOLVED THAT pursuant to the provisions of Section 148 and other applicable provisions, if any, of the Companies Act, 2013 and rules made thereunder the re-appointment of M/s. Bharathula & Associates, Cost Accountants, as Cost Auditors for the financial year 2018-19 by the Board of Directors at a remuneration not exceeding 3,50,000/- (Rupees three lakhs and fifty thousand only) per annum excluding out of pocket & other expenses and service tax, as may be incurred in the course of Audit, be and is hereby ratified”
SPECIAL BUSINESS:8. APPOINTMENT OF DR. VENKATA LAKSHMANA RAO
CHUNDURU (DIN 06885453) AS DIRECTOR OF THE COMPANY
To consider and, if thought fit, to pass the following resolution with or without modifications, as Ordinary Resolution:
“RESOLVED THAT pursuant to Sections 160 & 161 of the Companies Act, 2013 and any other applicable provisions, Dr. Venkata Lakshmana Rao Chunduru, who was appointed by the Board of Directors of the Company as an Additional Director on March 08, 2018 be and is hereby appointed as a Director of the Company who is liable to retire by rotation.”
“RESOLVED FURTHER THAT Mr. Ravi Kumar V V, Executive Director & CFO and Mr. G. Venkateswar Reddy, Company Secretary be and are hereby severally authorized to make necessary entries in the statutory registers of the Company, sign and file necessary forms and documents with the jurisdictional Registrar of Companies and to do all other necessary acts and deeds with respect to appointment of Dr. Venkata Lakshmana Rao Chunduru.”
9. APPOINTMENT OF DR. VENKATA LAKSHMANA RAO CHUNDURU (DIN 06885453) AS EXECUTIVE DIRECTOR OF THE COMPANY
To consider and, if thought fit, to pass the following resolution with or without modifications, as Ordinary Resolution:
Laurus Labs Limited
Annual Report 2017-18194

“RESOLVED THAT pursuant to Section 196, 197 and Schedule V and all other applicable provisions, rules, schedules of the Companies Act 2013 Dr.Venkata Lakshmana Rao Chunduru, having Director Identification Number 06885453, be and is hereby appointed as whole-time director in the capacity and designation of Executive Director of the Company for a period of five (05) years effective from March 8, 2018 on the following remuneration terms and conditions:
(a) Salary: The Executive Director’s aggregate salary shall be
Rs. 9,000,000 (rupees nine million only) per annum payable in 12 (twelve) monthly instalments (“Annual Salary”). The aforesaid salary shall be subject to deductions for income tax, contributions to provident fund, gratuity fund or superannuation fund and all other statutory deductions required to be made by the Company in accordance with applicable Laws. The Annual Salary shall stand increased by 10% every financial year (effective from 1st April of each year and the first due date for such increment shall be 1st April 2019).
(b) Business Expenses: The Executive Director shall be reimbursed by the
Company for all reasonable out of pocket expenses incurred pertaining to or in connection with the performance of his duties under this Agreement in line with the Company’s expenses policy. In the event, the Executive Director is required to travel, whether within India or abroad in relation to the obligations imposed on the Executive Director, such travel shall be in accordance with the Company travel policy.
(c) Annual Bonus: (i) The Company shall pay the Executive Director
a bonus of such amount as may be determined in accordance with (ii) below, based upon achievement of performance criteria in respect of each completed financial year with effect from April 1, 2018. For the sake of clarity, this section (c) shall also be applicable for the period from 8th March 2018 to 31st March 2018.
(ii) For every financial year, the Executive Director shall be eligible to receive a bonus (which shall be paid immediately upon the Board approving the audited accounts of the Company for the corresponding financial year) based upon the Company’s achievement of the consolidated EBITDA projection for a financial year (on the basis that the consolidated non-interest financial charges are deducted while calculating the consolidated EBITDA and any EBITDA from acquisitions during the year be excluded, if it is so included in the consolidated EBITDA) (“Target”) in the following manner:
(A) Less than 75% of the Target = zero bonus;
(B) 75% or more of the Target = bonus equal to the percentage of the Target achieved multiplied by the 50% of Annual Salary (as increased on a yearly basis),
provided that the amount of bonus paid pursuant to this clause will not exceed 60% of the Annual Salary.
(d) Leave entitlement During the Term, the Executive Director shall be
entitled (in addition to the usual public and bank holidays) to 20 (twenty) calendar days’ of paid leave in each year as per the Company policy.
(e) Benefits The Executive Director shall be entitled to participate,
along with the other employees of the Company, in any of the employee benefit and compensation plans, whether statutory or otherwise, as may be generally available to employees of the Company including car, leave travel allowance, gratuity, medical, health, insurance plans but excluding employee stock option plans. The Executive Director shall be provided with one recognized club membership of his choice for himself and his family at Hyderabad and the Executive Director shall inform the Board of his choice.”
10. LAURUS EMPLOYEES STOCK OPTION SCHEME 2018 To consider and, if thought fit, to pass the following
resolutions with or without modifications, as a Special Resolution:
“RESOLVED THAT pursuant to the provisions of Section 62 and all other applicable provisions, if any, of the Companies Act 2013, the Memorandum and Articles of Association of the Company, Securities and Exchange Board of India (Share Based Employee Benefits) Regulations, 2014 (the “SBEB Regulations”) (including any statutory modification(s) or re-enactment of the Act or the SBEB Regulations, for the time being in force) and subject to such other approvals, permissions and sanctions as may be necessary and subject to such conditions and modifications as may be prescribed or imposed while granting such approvals, permissions and sanctions which may be agreed to by the Board of Directors of the Company (hereinafter referred to as the “Board” which term shall be deemed to include any Committee, including Nomination and Remuneration Committee, which may exercise its powers, including the powers conferred by this resolution), consent of the Company be and is hereby accorded to the Board to create, offer, issue and allot at any time to or for the benefit of such person(s) who are in the employment of the Company, including Directors of the Company whether whole time or otherwise whether working in India or out of India, excluding Independent Directors, under a Scheme titled “LAURUS LABS EMPLOYEE
195Building Momentum

STOCK OPTION SCHEME 2018” (hereinafter referred as the “ESOP Scheme, 2018” or “Scheme”), options exercisable into equity shares being not more than 300,000 equity shares of Rs.10 each of the Company at an exercise price of 25% discount on the Fair Market Value of Share on the date of Grant of Options under ESOP Scheme 2018, in one or more tranches and on such terms and conditions as may be fixed or determined by the Board/Committee in accordance with the provisions of the Companies Act 2013 or SBEB Regulations or other provisions of the laws as may be prevailing and applicable at that time, each option granted being exercisable for one equity share of the Company.”
“RESOLVED FURTHER THAT the Board be and is hereby authorised to issue and allot Equity shares upon exercise of such options from time to time in accordance with ESOP Scheme, 2018 and such equity shares shall rank pari passu in all respects with the existing Equity Shares of the Company.”
“RESOLVED FURTHER THAT in case of any corporate action(s) such as rights issue, bonus issues, stock split, merger and sale of division and others, if any additional stock options are issued by the Board to the option grantees for the purpose of making a fair and reasonable adjustment to the options granted earlier, the above ceiling of 300,000 stock options shall be deemed to be increased/adjusted to the extent of such additional options issued”
“RESOLVED FURTHER THAT for the purpose of giving effect to any creation, offer, issue, allotment of equity shares, the Board/Committee be and is hereby authorized on behalf of the Company, to evolve, decide upon and bring in to effect the Scheme and make any modifications, changes, variations, alterations, or revisions in the said Scheme from time to time or to suspend, withdraw or revive the Scheme from time to time as may be specified by any statutory authority and to do all such acts, deeds, matters and things as it may in its absolute discretion deem fit or necessary or desirable for such purpose and with power on behalf of the Company to settle any questions, difficulties, or doubts that may arise in this regard without requiring the Board to secure any further consent or approval of the members of the Company.”
11. APPOINTMENT OF Dr. M. VENU GOPALA RAO AS NON-EXECUTIVE INDEPENDENT DIRECTOR OF THE COMPANY
To consider and, if thought fit, to pass the following resolution with or without modifications, as a Special Resolution:
“RESOLVED THAT, in supersession of the earlier ordinary resolution passed by the members at their 12th Annual General Meeting held on 12th July, 2017, and pursuant to the SEBI (LODR) Amendment Regulations, 2018, the appointment of Dr. M. Venu Gopala Rao as Non-Executive Independent Director of the Company for a period of five years (w.e.f.18.05.2017 as approved by the Members of
the Company in the previous annual general meeting of the Company held on 12th July 2017) be and is hereby approved by way of special resolution.”
“RESOLVED FURTHER THAT the Board of Directors of the Company be and is hereby authorized to file necessary forms with the concerned authorities and to do all acts, deeds and things required to give effect to this Resolution”
By order of the BoardLaurus Labs Limited
G. Venkateswar ReddyCompany Secretary
Regd. Office:Plot No.21, Jawaharlal Nehru Pharma City, Parawada, Visakhapatnam – 531 021E-mail:[email protected]
Place: HyderabadDate: May 31, 2018
Notes:1. A member entitled to attend and vote at the meeting is
entitled to appoint a proxy to attend and vote instead of himself/herself and the proxy need not be a member of the Company. The proxies to be effective should be deposited at the Corporate Office of the Company not later than 48 hours before the commencement of the meeting. Blank proxy form is attached.
2. A person can act as proxy on behalf of Members not exceeding fifty (50) and holding in the aggregate not more than ten percent of the total share capital of the Company.
3. The Explanatory Statement pursuant to Section 102 of the Companies Act, 2013 in respect of Special Business set out above is annexed hereto and forms part of the Notice.
4. Brief resume of Directors proposed to be appointed/re-appointed, nature of their expertise in specific functional areas, name of companies in which they hold directorships and membership/chairmanships of Board Committees and shareholding in the Company as stipulated under SEBI (LODR) Regulations, 2015 are provided in the Report on Corporate Governance forming part of the Annual Report.
5. Members/Proxies are requested to hand over the enclosed Attendance Slip duly filled in, at the entrance for attending the meeting.
6. Corporate Members intending to send their authorized representatives to attend the meeting are requested to send a certified copy of Board Resolution authorizing their representatives to attend and vote on their behalf in the meeting.
Laurus Labs Limited
Annual Report 2017-18196

7. The Register of Members and Share Transfer Books of the Company will remain closed from July 02, 2018 to July 05, 2018 (both days inclusive) for the Annual General Meeting and for payment of dividend.
8. Documents referred to in the accompanying Notice and Explanatory Statement are available for inspection at the Corporate Office of the Company during office hours between 11 am and 5 pm on all working days prior to the date of the Annual General Meeting.
9. Members are requested to notify immediately any change of address to their Depository Participants (DPs) in respect of their holdings in electronic form and to the Registrars of the Company i.e. Karvy Computershare Private Limited, Karvy Selenium Tower B, Plot 31-32, Gachibowli Financial District, Nanakramguda, Hyderabad – 500032 in respect of their physical share folios, if any.
10. Shareholders are requested to bring their copies of Annual Report to the Annual General Meeting.
11. Members who hold shares in dematerialised form are requested to write their Client ID and DP ID and those who hold shares in physical form are requested to write their Folio Number in the attendance slip for attending the Meeting.
12. Members may also note that the Notice of the 13th Annual General Meeting and the Annual Report for 2017-18 will also be available on the Company’s website www.lauruslabs.com for their download. The physical copies of the aforesaid documents will also be available at the Company’s Corporate Office in Hyderabad for inspection during normal business hours on working days. Even after registering for e-communication, members are entitled to receive such communication in physical form, upon making a request for the same, by post free of cost. For any communication, the shareholders may also send requests to the Company’s investor email id: [email protected].
13. In case of joint holders attending the Meeting, only such joint holder who is higher in the order of names will be entitled to vote.
14. The Securities and Exchange Board of India (SEBI) has mandated the submission of Permanent Account Number (PAN) by every participant in securities market. Members holding shares in electronic form are, therefore, requested to submit their PAN to their depository participants with whom they are maintaining their demat accounts. Members holding shares in physical form can submit their PAN to the Company/Karvy.
15. Members who have not registered their e-mail addresses so far are requested to register their email address for receiving all communication including Annual Report, Notices, Circulars, etc. from the Company electronically.
16. Procedure of E-Voting – In compliance with provisions of Section 108 of the Companies Act, 2013 and Rule 20 of the Companies (Management and Administration) Rules, 2014, as amended and as per the requirements of the SEBI (LODR) Regulations 2015, your Company is pleased to provide members facility to exercise their right to vote at the 13th Annual General Meeting (AGM) by electronic means and the business may be transacted through e-Voting Services provided by Karvy Computershare Private Limited.
The instructions for E-voting are as follows:i. To use the following URL for e-voting:
https://evoting.karvy.com
ii. Shareholders of the Company holding shares either in physical form or in dematerialized form, as on the cut-off date, may cast their vote electronically.
iii. Enter the login credentials. The E-Voting Event Number + Folio No. or DP ID Client ID will be your User ID. However, if you are already registered with Karvy for e-voting, you can use your existing User ID and password for casting your vote. If required, please visit https://evoting.karvy.com or contact toll free number 1-800-3454-001 for your existing password.
iv. After entering the details appropriately, click on LOGIN.
v. You will reach the Password change menu wherein you are required to mandatorily change your password. The new password shall comprise of minimum 8 characters with at least one upper case (A-Z), one lower case (e-z), one numeric value (0-9) and a special character. The system will prompt you to change your password and update any contact details like mobile, email etc. on first login. You may also enter the secret question and answer of your choice to retrieve your password in case you forget it. It is strongly recommended not to share your password with any other person and take utmost care to keep your password confidential.
vi. You need to login again with the new credentials.
vii. On successful login, the system will prompt you to select the EVENT i.e., Laurus Labs Limited.
viii. On the voting page, enter the number of shares as on the cut-off date under FOR/AGAINST or alternately you may enter partially any number in FOR and partially in AGAINST but the total number in FOR/AGAINST taken together should not exceed the total shareholding. You may also choose the option ABSTAIN.
ix. Shareholders holding multiple folios / demat account shall choose the voting process separately for each folios / demat account.
x. Cast your vote by selecting an appropriate option and click on SUBMIT. A confirmation box will be displayed. Click OK
197Building Momentum

to confirm else CANCEL to modify. Once you confirm, you will not be allowed to modify your vote. During the voting period, shareholders can login any number of times till they have voted on the resolution.
xi. Once the vote on the resolution is cast by the shareholder, he shall not be allowed to change it subsequently.
xii. The Portal will be open for voting from 9.00 a.m. on July 02, 2018 to 5.00 p.m. on July 04, 2018.
xiii. In case of any queries, you may refer the Frequently Asked Questions (FAQs) for shareholders and e-voting User Manual for shareholders available at the download section of http://evoting.karvy.com or contact Toll Free No. 18003454001.
xiv. Corporate / Institutional Members (i.e. other than Individuals, HUF, NRI, etc.) are also required to send scanned certified true copy (PDF Format) of the Board Resolution / Power of Attorney / Authority Letter, etc., together with attested specimen signature(s) of the duly authorized representative(s), to the Scrutinizer at e-mail ID: [email protected]. They may also upload the same in the e-voting module in their login. The scanned image of the above mentioned documents should be in the naming format “Corporate Name_EVENT NO.”
17. The facility for voting through polling paper shall be made available at the Annual General Meeting (the “meeting”) and the members attending the meeting who have not cast their votes by remote e-voting shall be able to exercise their right to vote at the meeting.
18. The members who have cast their vote by remote e-voting may also attend the meeting but shall not be entitled to cast their vote again.
19. The Board of Directors of the Company has appointed Mr.Y.Ravi Prasada Reddy, Proprietor of RPR & Associates, a Practicing Company Secretary, as scrutinizer to scrutinize the remote e-voting process and voting at the meeting in a fair and transparent manner and he has communicated his willingness to be appointed and will be available for the said purpose.
20. The voting rights shall be reckoned on the paid-up value of shares registered in the name of the member/ beneficial owner (in case of electronic shareholding) as on the cut-off date i.e. 29th June 2018.
21. A person, whose name is recorded in the register of members or in the register of beneficial owners maintained by the depositories as on the cut-off date i.e. 29th June 2018 only shall be entitled to avail the facility of remote e-voting/ voting at the meeting.
22. Any person who becomes a member of the Company after dispatch of the Notice of the meeting and holding shares as on the cut-off date may obtain the USER ID and Password in the manner as mentioned below:
a. If the mobile number of the member is registered against Folio No. / DP ID Client ID, the member may send SMS : MYEPWD <space> E-Voting Event number+ Folio No. or DP ID Client ID to 9212993399
Example for NSDL : MYEPWD <SPACE> IN12345612345678
Example for CDSL : MYEPWD <SPACE> 1402345612345678
Example for Physical : MYEPWD <SPACE> XXX1234567890
b. If e-mail address or mobile number of the member is registered against Folio No./ DP ID Client ID, then on the home page of https://evoting.karvy.com, the member may click “forgot password” and enter Folio No. or DP ID Client ID and PAN to generate a password.
c. Member may call Karvy’s toll free number 1-800- 3454-001
d. Member may send an e-mail request to [email protected]
If the member is already registered with Karvy e-voting platform then he can use his existing User ID and password for casting the vote through remote e-voting.
24. The Scrutinizer, after scrutinizing the votes cast at the meeting and through remote e-voting, will, not later than three days of conclusion of the meeting, make a consolidated Scrutinizer’s Report and submit the same to the Chairman. The results declared along with the consolidated scrutinizer’s report shall be placed on the website of the Company www.lauruslabs.com and on the website of the Karvy https://evoting.karvy.com. The results shall simultaneously be communicated to the Stock Exchanges.
EXPLANATORY STATEMENT UNDER SECTION 102 OF THE COMPANIES ACT 2013Item Nos. 8&9:Dr. Venkata Lakshmana Rao Chunduru was appointed as additional director under the Companies Act, 2013 on March 08, 2018, to hold office upto the date of this Annual General Meeting.
Pursuant to Articles of Association Dr. Venkata Lakshmana Rao Chunduru is being proposed to be appointed as director liable to retire by rotation.
Laurus Labs Limited
Annual Report 2017-18198

Dr.Lakshmana Rao has joined in the Company in February 2007 and has been involved in formulating and executing the core strategy of your Company. He has several years of experience in quality control, quality assurance and regulatory affairs. Prior to joining the Company in February 2007, he was associated with Mayne Health Pty Ltd., Australia. Dr. Lakshmana Rao is not a relative of any of the existing directors of the Company.
None of the directors, except Dr. Venkata Lakshmana Rao Chunduru, is in any way concerned or interested in these resolutions. Hence, the board recommends to the members to pass these resolutions as ordinary resolutions.
Item No.10In the past, the Company has approved two Employee Stock Option Schemes i.e. Laurus Employees Stock Option Scheme 2011 (ESOP 2011) and Laurus Employees Stock Option Scheme 2016 (ESOP 2016). Under ESOP 2011, only few Options are left and hence the Management has decided not to grant any options from ESOP 2011. Under ESOP 2016, 694,252options have already been granted and 505,748 options are the balance available for grant to the employees.
The Company has more than 3,000 employees and most of them have joined last two to three years. In order to attract and retain the talented employees, ESOP Scheme is considered to be one of the best tools.
To achieve the above objectives, the balance options left in ESOP 2016 would not be sufficient. Therefore, the Board of Directors in their Meeting held on May 10, 2018 had resolved to initiate a new ESOP Scheme in addition to the ESOP 2016 Scheme and similar to ESOP 2016 Scheme to be known as Employee Stock Option Scheme, 2018 (ESOP 2018 Scheme). Under the proposed ESOP 2018 Scheme, it was proposed to issue 300,000 stock options to the eligible employees at an exercise price of a 25% discounted price over the Fair Market Value of the share of the Company at the time of granting options. The ESOP 2018 Scheme shall be implemented and administered directly by the Company and the Company shall conform to the accounting policies specified in Regulation 15 of the Securities and Exchange Board of India (Share Based Employee Benefits) Regulations, 2014.
Explanation as per Rule 12 of Companies (Share Capital and Debentures) Rules, 2014:
(a) The total number of stock options to be granted 300,000(b) Identification of classes of employees entitled to Participate in the ESOP Scheme As per the Scheme(c) The appraisal process for determining the eligibility of employees to the ESOP
SchemeTo be decided by the Nomination and Remuneration Committee
(d) The requirements of vesting and period of vesting As per the Scheme(e) The maximum period within which the option shall be vested 4 Years(f) The Exercise Price or the formula for arriving at the same 25% less than the Fair Market Value of share as on the
date of Grant(g) The exercise period and process of exercise As per Scheme(h) The lock-in period, if any Nil(i) The maximum number of options to be granted Per employee and in aggregate 5,000 and 300,000(j) The method which the company shall use to value its options Fair Value Method(k) The conditions under which options vested in Employees lapse e.g. in case of
termination of Employment for misconductAs per the Scheme
(l) The specific time period within which the Employees shall exercise the vested options In the event of a proposed termination of Employment or resignation of employee
As per the Scheme
(m) A statement to the effect that the Company Shall comply with the applicable accounting Standards
The Company shall comply with the applicable accounting Standards
A copy of the Scheme is available at the Corporate Office of the Company for inspection by the members.
Your Directors recommend this resolution for your approval as a Special Resolution.
None of the Directors or Key Managerial Personnel or relatives of Directors and Key Managerial Persons are concerned or interested in this resolution.
199Building Momentum

Item No.11As per SEBI (LODR) Amendment Regulations, 2018, no listed entity shall appoint a person or continue the directorship of any person as non-executive director who has attained the age of seventy five years unless a special resolution is passed to that effect.
Dr. M. Venu Gopala Rao, 77 years, was appointed as Non-Executive Independent Director of the Company for a period of 5 years with effect from May 18, 2017, in the 12th Annual General Meeting of the Company held on July 12, 2017. Dr. MVG Rao was granted with a B.Sc (Hons) in Chemical Engineering from the Andhra University. He also holds a post-graduation degree in Pulp and Paper Technology from the Forest Research Institute, Dehradun. Dr. Rao has a rich and varied industry experience in the Pulp and Paper and Bulk Drug industries. Dr. Rao was the Founder Chairman and Managing Director of Veera Laboratories, an USFDA approved Bulk Drug Manufacturing Unit which got merged with Matrix Laboratories Limited (currently Mylan Laboratories). He is the director on various Boards of Navabharat group of companies and also member and chairman of various committees in these companies. The Board of Directors of your Company appointed him as Chairman of the Board for a period of two years in their meeting held on May 10, 2018. The Board believes that his experience and vision will contribute to the growth of the Company and also in steering the Company with best Corporate Governance practices.
None of the directors, except Dr. MVG Rao, is in any way concerned or interested in this resolution. Hence, the board recommends to the members to pass this resolution as Special Resolution.
By order of the BoardLaurus Labs Limited
G. Venkateswar ReddyCompany Secretary
Regd. Office:Plot No.21, Jawaharlal Nehru Pharma City, Parawada, Visakhapatnam – 531 021E-mail:[email protected]
Place: HyderabadDate: May 31, 2018
Laurus Labs Limited
Annual Report 2017-18200

ROUTE MAP FOR THE VENUE OF 13TH ANNUAL GENERAL MEETINGVizag Airport to Waltair Club
Vizag railway Station to Waltair Club

Notes

Notes

Notes

Laurus Labs LimitedCIN: L24239AP2005PLC047518
Registered Office: Plot No.21, Jawaharlal Nehru Pharma City, Visakhapatnam – 531 021
Attendance Slip
I/We ............................................................................................ hereby record my/our presence at the 13th Annual General Meeting being held on Thursday, July 05, 2018 at 3.00 PM at Waltair Club, Opp. Government Circuit House, Siripuram, Visakhapatnam – 530003.
Name of the shareholder/proxy*........................................................................ No. of shares held ..............................................................................
* Strikeout whichever is not applicable
Note:1. Shareholder/Proxy intending to attend the meeting must bring the duly signed Attendance Slip to the Meeting and handover at
the entrance.
2. Shareholder/Proxy should bring his/her copy of the Annual Report
Folio No.: Client Id:DP Id:
Signature of Shareholder


Laurus Labs LimitedCIN: L24239AP2005PLC047518
Registered Office: Plot No.21, Jawaharlal Nehru Pharma City, Visakhapatnam – 531 021
Form No. MGT-11Proxy form
[Pursuant to section 105(6) of the Companies Act, 2013 and rule 19(3) of the Companies (Management and Administration) Rules, 2014]
CIN: L24239AP2005PLC047518Name of the Company: Laurus Labs LimitedRegistered office: Plot No.21, Jawaharlal Nehru Pharma City, Parawada, Visakhapatnam – 531 021
Name of the member (s): ..............................................................................................................................................................................................................................
Registered address: ...........................................................................................................................................................................................................................................
E-mail Id: : .............................................................................................................. Folio No/ Client Id: ......................................................................................................
I/We, being the member (s) of ................................................................................. shares of the above named company, hereby appoint
1. Name: ...............................................................................................................................................................................................................................................................
Address: .................................................................................................................................................................................................................................................................
E-mail Id: .................................................................................................................... Signature:......................................................................................., or failing him
2. Name: ...............................................................................................................................................................................................................................................................
Address: .................................................................................................................................................................................................................................................................
E-mail Id: .....................................................................................................................Signature:......................................................................................., or failing him
3. Name: ...............................................................................................................................................................................................................................................................
Address: .................................................................................................................................................................................................................................................................
E-mail Id: .................................................................................................................... Signature: ......................................................................................, or failing him
And whose signature(s) are appended below as my/our proxy to attend and vote (on a poll) for me/us and on my/our behalf at the 13th Annual General Meeting of the Company, to be held on Thursday, July 05, 2018 at 3.00 PM at Waltair Club, Opp. Government Circuit House, Siripuram, Visakhapatnam – 530003 and at any adjournment thereof in respect of such resolutions as are indicated below:
Resolution For Against1.2.3.4.5.6.7.8.9.10.11.
Signed this ..................... day of ....................... 2018
Signature of Shareholder Signature of first proxy holder
Signature of second proxy holder Signature of third proxy holder
Notes:1) This form of proxy in order to be effective should be duly completed and deposited at the Registered Office of the Company not
less than 48 hours before the commencement of the meeting.
Affix a `1/-
Revenue Stamp


Corporate Information
Directors Dr. Venu Gopala Rao M Dr. Satyanarayana C Mr. Venkata Ravi Kumar V Mr. Chandrakanth C Dr. Venkata Lakshmana Rao CMr. Narendra Ostawal Ms. Aruna Rajendra Bhinge Dr. Rajesh Koshy Chandy Mr. Ramesh Subrahmanian Dr. Ravindranath K
Auditors M/s. Deloitte Haskins & Sells LLP Chartered Accountants KRB Towers, Plot No. 1 to 4 & 4A 1st, 2nd & 3rd Floor, Jubilee Enclave Madhapur, Hyderabad – 500 081
Bankers State Bank of India ICICI Bank Limited Bank of Bahrain & Kuwait B.S.C.CITI Bank NA HDFC Bank Limited Hongkong and Shanghai BankingCorporation Ratnakar Bank Limited Axis Bank Limited Andhra Bank
Registered Office and Unit 01Drug Substance Facility Plot No.21 Jawaharlal Nehru Pharma City, Parawada Visakhapatnam – 531 021, India
Unit 02Integrated FacilityPlot Nos. 19, 20 & 21 Gurjapalem, APSEZ Atchutapuram Visakhapatnam – 531 011, India
Unit 03Drug Substance FacilityPlot No.18 Jawaharlal Nehru Pharma City, Parawada Visakhapatnam – 531 021, India
Unit 04Drug Substance FacilityPlot No.25, Lalamkoduru Atchutapuram Visakhapatnam – 531 011, India
Unit 05Drug Substance FacilityPlot Nos.102 & 103, SEZ Lemarthi, Parawada Visakhapatnam – 531 021, India
Unit 06Drug Substance FacilityPlot No.22, D&E, APSEZ de-notified area Atchutapuram, Rambilli Mandal Visakhapatnam – 531 011, India
Research & Development CentrePlot No.DS1 & DS2 IKP Knowledge Park Turkapally, Shameerpet Hyderabad – 560 066, India
SubsidiariesLaurus Synthesis Inc.160, Greentree Drive Suite 101, Dover, County of Kent State of Delaware, DE 19904 United State of America
Sriam Labs Private Limited3rd Floor, SDE Serene Chambers Road No.5, Banjara Hills Hyderabad – 500 034, India
Laurus Holdings LimitedSouth Gate Chambers, 37/39 South Gate Street, Winchester, Hants United Kingdom, SO23 9EH
Step-down SubsidiariesLaurus Generics Inc.200 Bellevue Parkway, Suite 210 Wilmington, County of New Castle United States of America, 19809
Laurus Generics GmbHC/o. Alfred E. Tiefenbacher Van-Der-Smissen-Strasse 1 Hamburg, DE, 22767
Disclaimer
In this Annual Report, we have disclosed forward looking information to enable investors to comprehend our prospects and take investment decisions. This report and other statements - written and oral - that we periodically make contain forward looking statements that set out anticipated results based on the management’s plans and assumptions. We have tried, wherever possible, to identify such statements by using words such as ‘anticipate’, ‘estimate’, ‘expects’, ‘projects’, ‘intends’, ‘plans’, ‘believes’, and words of similar substance in connection with any discussion of future performance. We cannot guarantee that these forward looking statements will be realised, although we believe we have been prudent in our assumptions. The achievements of results are subject to risks, uncertainties and even inaccurate assumptions. Should known or unknown risks or uncertainties materialize, or should underlying assumptions prove inaccurate, actual results could vary materially from those anticipated, estimated or projected. Readers should keep this in mind. We undertake no obligation to publicly update any forward looking statement, whether as a result of new information, future events or otherwise.

Corporate Office2nd floor, Serene Chambers, Road No. 7, Banjara Hills, Hyderabad - 500 034, India Phone: +91 40 3980 4333 Fax: +91 40 3980 4320 Email: [email protected] Website: www.lauruslabs.com CIN:L24239AP2005PLC047518


![(Encl 3) History of the NCO[1]](https://img.dokumen.tips/doc/110x75/5695d30f1a28ab9b029cb330/encl-3-history-of-the-nco1.jpg)

