Embed Size (px)
DESCRIPTION
Annual Report Services 2010
Citation preview

l oked Have you
at us lately?
www.laurentianbank.ca
ISBN 978-2-9809746-9-4Legal Deposit – Bibliothèque et Archives nationales du Québec, 2011
Legal Deposit – Library and Archives Canada, 2011995309A
LAu
reN
tIAN
BA
NK
2010 Annual Report
2010 Annual Report
WWith 157 branches, 413 automated banking machines, more than $23 billion in assets, and over 3,600 employees, Laurentian Bank is firmly rooted in Québec, where it operates the third largest branch network. Elsewhere in Canada, the Bank has secured a choice position in certain specific market segments. Moreover, with 37% of its loans originating from other provinces, the Bank enjoys the benefits of nationwide geographic diversification.
Established in 1846, Laurentian Bank is widely recognized today for its excep-tional service, simplicity and proximity. The Bank offers varied financial services to individuals and to Small and Medium-Sized Enterprises. It also provides products to an extensive external network of independent financial advisors through B2B Trust, as well as full-service brokerage services via Laurentian Bank Securities. Stock symbol: LB on TSX
contents 2 Keynumbersofthelast3years 3 Businesssegments 4 2010Performance 5 FinancialHighlights 6-9 MessagefromthePresident andchiefexecutiveofficer 10-11 MessagefromthechairmanoftheBoard
Business Review 12-13 RetailandsMeQuébec 14-15 Realestateandcommercial 16-17 B2Btrust 18 LaurentianBanksecurities andcapitalMarkets 19 corporateservices 20-21 ourpeople
22 ManageMent’s Discussion anD analysis
65 consoliDateD financial stateMents
115 statisticalReview–consolidatedBalancesheet 116 statisticalReview–consolidatedstatementofIncome 117 QuarterlyHighlights 118-119 corporateGovernance 120 BoardofDirectors 121 Managementcommittee 122 Planningcommittee 123 Branches 124 officesandsubsidiaries 125 shareholdersInformation
CAUTION REGARDING FORWARD-LOOKING STATEMENTS
In this document and in other documents filed with Canadian regulatory authorities or in other communications, Laurentian Bank of Canada may from time to time make written or oral forward-looking statements within the meaning of applicable securities legislation. Forward-looking statements include, but are not limited to, statements regarding the Bank’s business plan and financial objectives. The forward-looking statements contained in this document are used to assist the Bank’s security holders and financial analysts in obtaining a better understanding of the Bank’s financial position and the results of operations as at and for the periods ended on the dates presented and may not be appropriate for other purposes. Forward-looking statements typically use the conditional, as well as words such as prospects, believe, estimate, forecast, project, expect, anticipate, plan, may, should, could and would, or the negative of these terms, variations thereof or similar terminology.
By their very nature, forward-looking statements are based on assumptions and involve inherent risks and uncertainties, both general and specific in nature. It is therefore possible that the forecasts, projections and other forward-looking statements will not be achieved or will prove to be inaccurate. Although the Bank believes that the expectations reflected in these forward-looking statements are reasonable, it can give no assurance that these expectations will prove to have been correct.
The Bank cautions readers against placing undue reliance on forward-looking statements when making decisions, as the actual results could differ considerably from the opinions, plans, objectives, expectations, forecasts, estimates and intentions expressed in such forward-looking statements due to various material factors. Among other things, these factors include capital market activity, changes in government monetary, fiscal and economic policies, changes in interest rates, inflation levels and general economic conditions, legislative and regulatory developments, competition, credit ratings, scarcity of human resources and technological environment. The Bank further cautions that the foregoing list of factors is not exhaustive. For more information on the risks, uncertainties and assumptions that would cause the Bank’s actual results to differ from current expectations, please also refer to the Bank’s public filings available at www.sedar.com.
The Bank does not undertake to update any forward-looking statements, whether oral or written, made by itself or on its behalf, except to the extent required by securities regulations.

Jing Xu is one of 3,600 employees who are delivering on the transformation of Laurentian Bank to an even more solid and profitable financial institution. Find out more in this report and meet Jing and her award-winning colleagues. Look cLoser.
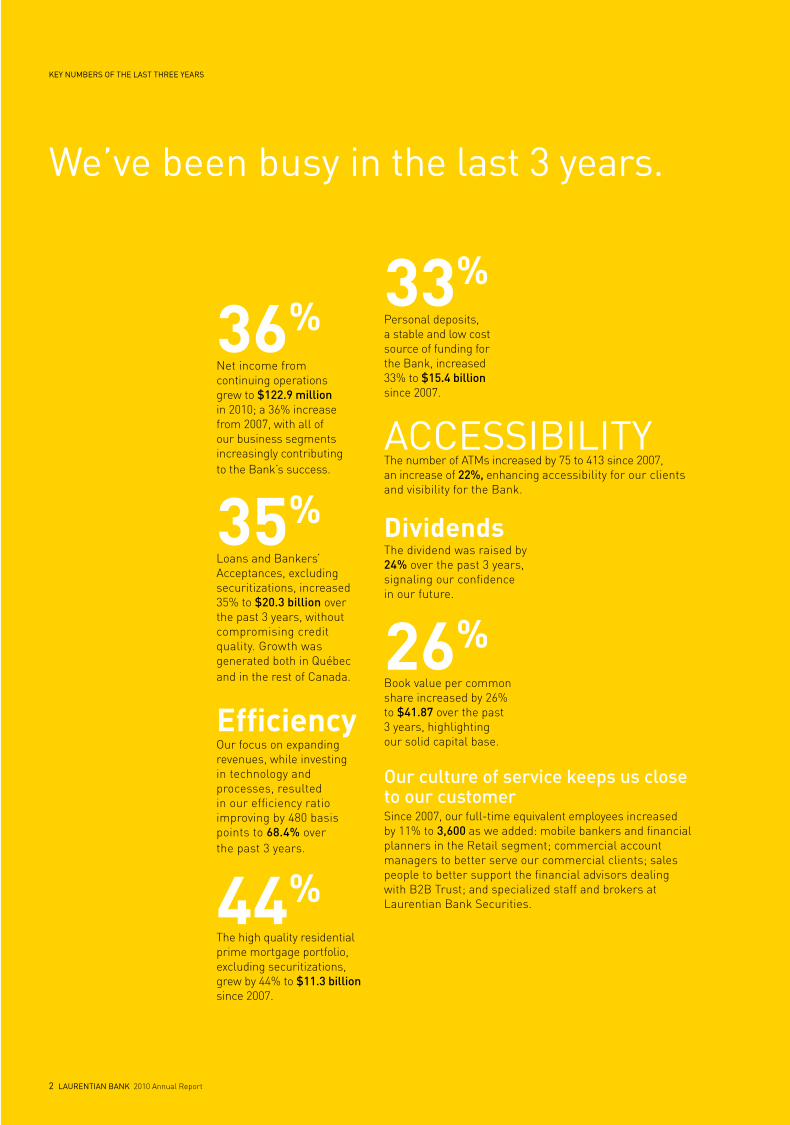
We’ve been busy in the last 3 years.
AccessibilityThe number of ATMs increased by 75 to 413 since 2007, an increase of 22%, enhancing accessibility for our clients and visibility for the Bank.
our culture of service keeps us close to our customerSince 2007, our full-time equivalent employees increased by 11% to 3,600 as we added: mobile bankers and financial planners in the Retail segment; commercial account managers to better serve our commercial clients; sales people to better support the financial advisors dealing with B2B Trust; and specialized staff and brokers at Laurentian Bank Securities.
33%Personal deposits, a stable and low cost source of funding for the Bank, increased 33% to $15.4 billion since 2007.
36%Net income from continuing operations grew to $122.9 million in 2010; a 36% increase from 2007, with all of our business segments increasingly contributing to the Bank’s success.
35%Loans and Bankers’ Acceptances, excluding securitizations, increased 35% to $20.3 billion over the past 3 years, without compromising credit quality. Growth was generated both in Québec and in the rest of Canada.
EfficiencyOur focus on expanding revenues, while investing in technology and processes, resulted in our efficiency ratio improving by 480 basis points to 68.4% over the past 3 years.
44%The high quality residential prime mortgage portfolio, excluding securitizations, grew by 44% to $11.3 billion since 2007.
DividendsThe dividend was raised by 24% over the past 3 years, signaling our confidence in our future.
26%Book value per common share increased by 26% to $41.87 over the past 3 years, highlighting our solid capital base.
2 lAurentiAn bAnK 2010 Annual Report
Key numbers Of the lAst three yeArs
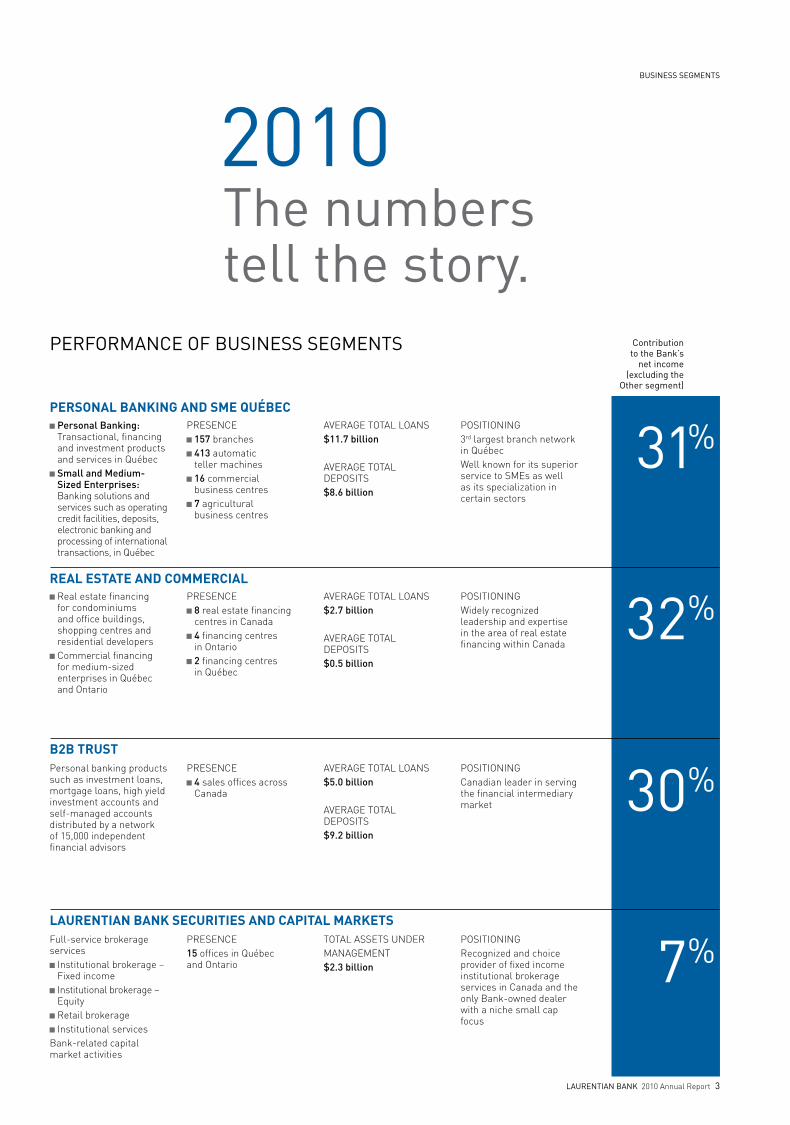
Full-service brokerage services
Institutional brokerage –Fixed income Institutional brokerage – Equity Retail brokerage Institutional services
Bank-related capital market activities
PRESENCE15 offices in Québecand Ontario
TOTAL ASSETS UNdERMANAGEMENT$2.3 billion
POSITIONINGRecognized and choice provider of fixed income institutional brokerage services in Canada and the only Bank-owned dealer with a niche small cap focus
7%LaurEntian Bank SEcuritiES anD caPitaL MarkEtS
Personal Banking: Transactional, financing and investment products and services in Québec small and Medium-sized enterprises: Banking solutions and services such as operating credit facilities, deposits, electronic banking and processing of international transactions, in Québec
PRESENCE 157 branches 413 automatic teller machines
16 commercial business centres
7 agricultural business centres
AvERAGE TOTAL LOANS$11.7 billion
AvERAGE TOTAL dEPOSITS$8.6 billion
POSITIONING3rd largest branch network in QuébecWell known for its superior service to SMEs as well as its specialization in certain sectors
31% PErSonaL Banking anD SME QuéBEc
Personal banking products such as investment loans, mortgage loans, high yield investment accounts and self-managed accounts distributed by a network of 15,000 independent financial advisors
PRESENCE 4 sales offices across Canada
AvERAGE TOTAL LOANS$5.0 billion
AvERAGE TOTAL dEPOSITS$9.2 billion
POSITIONINGCanadian leader in serving the financial intermediary market 30%
B2B truSt
Real estate financing for condominiums and office buildings, shopping centres and residential developers Commercial financing for medium-sized enterprises in Québec and Ontario
PRESENCE 8 real estate financing centres in Canada
4 financing centres in Ontario
2 financing centres in Québec
AvERAGE TOTAL LOANS$2.7 billion
AvERAGE TOTAL dEPOSITS$0.5 billion
POSITIONINGWidely recognized leadership and expertise in the area of real estate financing within Canada
32%rEaL EStatE anD coMMErciaL
contribution to the bank’s
net income (excluding the
Other segment)
PerfOrmAnce Of business segments
business segments
the numbers tell the story.
2010
lAurentiAn bAnK 2010 Annual Report 3
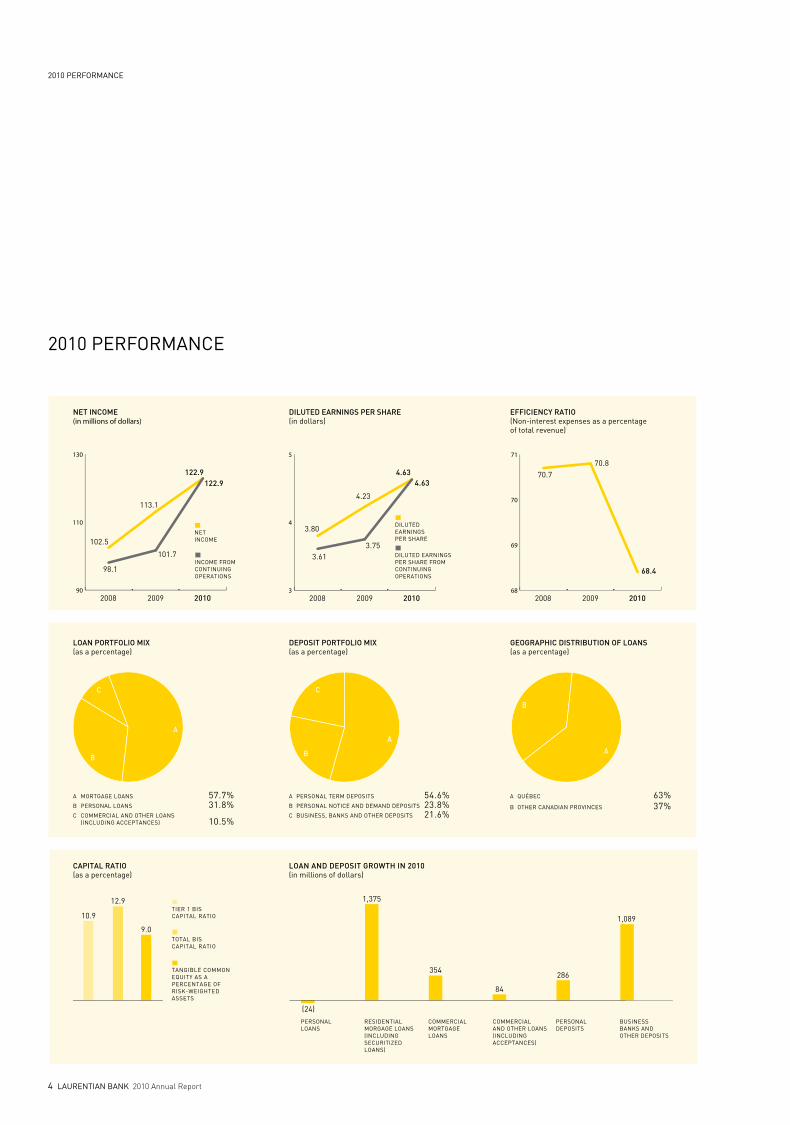
2010 PerfOrmAnce
NET INCOME(in millions of dollars)
DILUTED EARNINGS PER SHARE(in dollars)
EFFICIENCY RATIO(Non-interest expenses as a percentage of total revenue)
LOAN PORTFOLIO MIX(as a percentage)
A MORTGAGE LOANS 57.7%B PERSONAL LOANS 31.8%C COMMERCIAL AND OTHER LOANS (INCLUDING ACCEPTANCES) 10.5%
C
A
B
DEPOSIT PORTFOLIO MIX(as a percentage)
A PERSONAL TERM DEPOSITS 54.6%B PERSONAL NOTICE AND DEMAND DEPOSITS 23.8%C BUSINESS, BANKS AND OTHER DEPOSITS 21.6%
GEOGRAPHIC DISTRIBUTION OF LOANS(as a percentage)
A QUÉBEC 63%B OTHER CANADIAN PROVINCES 37%
C
A
A
B
B
CAPITAL RATIO(as a percentage)
LOAN AND DEPOSIT GROWTH IN 2010(in millions of dollars)
PERSONALLOANS
RESIDENTIALMORGAGE LOANS(INCLUDINGSECURITIZEDLOANS)
COMMERCIALMORTGAGE LOANS
COMMERCIAL AND OTHER LOANS(INCLUDING ACCEPTANCES)
PERSONALDEPOSITS
BUSINESS BANKS AND OTHER DEPOSITS
2009 20102008
68.4
70.870.7
68
69
70
71
2009 20102008
4.634.63
4.23
3.80
3.613.75
3
4
5
2009 20102008
122.9122.9
113.1
102.5
98.1
101.7
90
110
130
9.0
12.9 1,375
(24)
354
84
286
1,08910.9
TANGIBLE COMMON EQUITY AS A PERCENTAGE OF RISK-WEIGHTED ASSETS
TOTAL BIS CAPITAL RATIO
TIER 1 BIS CAPITAL RATIO
NET INCOME
INCOME FROMCONTINUING OPERATIONS
DILUTEDEARNINGS PER SHARE
DILUTED EARNINGS PER SHARE FROMCONTINUING OPERATIONS
2010 PerfOrmAnce
4 lAurentiAn bAnK 2010 Annual Report
lAurentiAn bAnK 2010 Annual Report 5
finAnciAl highlights
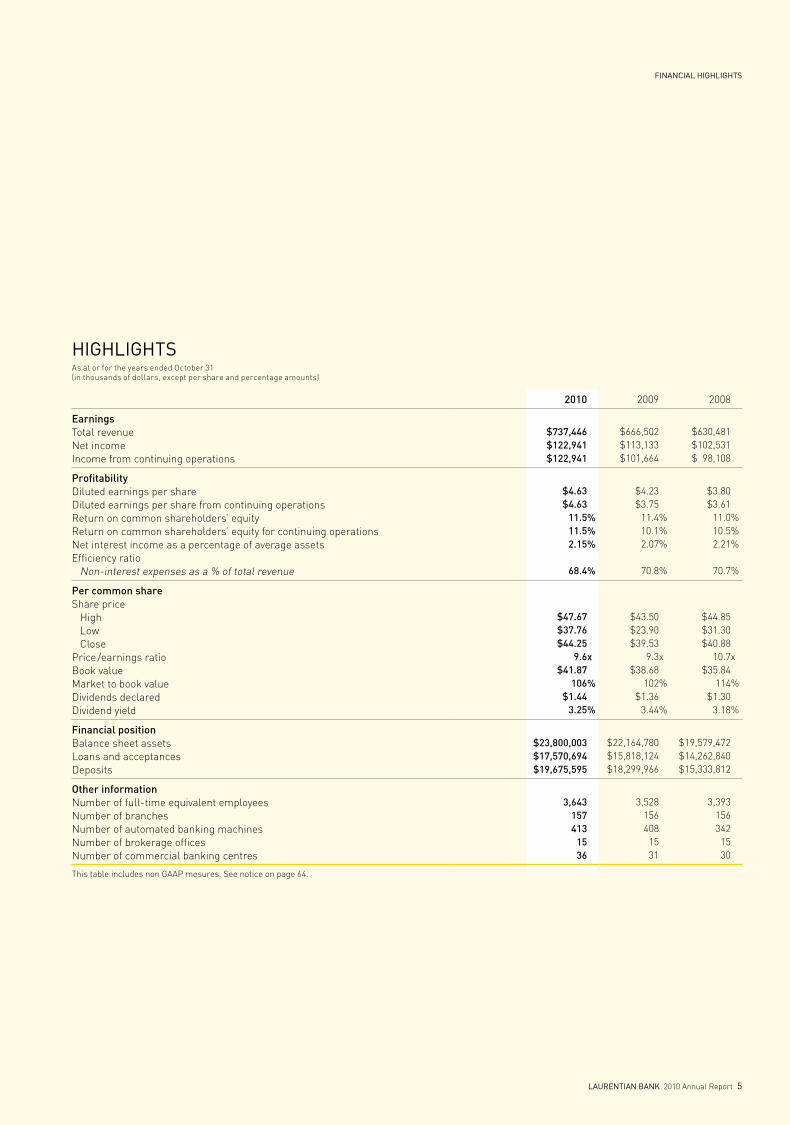
highlightsAs at or for the years ended October 31(in thousands of dollars, except per share and percentage amounts)
2010 2009 2008
earningsTotal revenueNet incomeIncome from continuing operations
$737,446
$122,941 $122,941
$666,502 $113,133 $101,664
$630,481 $102,531 $ 98,108
Profitabilitydiluted earnings per sharediluted earnings per share from continuing operationsReturn on common shareholders’ equityReturn on common shareholders’ equity for continuing operationsNet interest income as a percentage of average assetsEfficiency ratio Non-interest expenses as a % of total revenue
$4.63 $4.63
11.5 11.5 2.15
68.4
% % % %
$4.23 $3.75
11.4 10.1 2.07
70.8
% % %
%
$3.80 $3.61
11.0 10.5 2.21
70.7
% % %
%
Per common shareShare price High Low ClosePrice /earnings ratioBook valueMarket to book valuedividends declareddividend yield
$47.67 $37.76 $44.25
9.6 $41.87
106 $1.44
3.25
x
%
%
$43.50 $23.90 $39.53
9.3 $38.68
102 $1.36
3.44
x
%
%
$44.85 $31.30 $40.88
10.7 $35.84
114 $1.30
3.18
x
%
%
Financial positionBalance sheet assetsLoans and acceptancesdeposits
$23,800,003 $17,570,694 $19,675,595
$22,164,780 $15,818,124 $18,299,966
$19,579,472 $14,262,840 $15,333,812
other informationNumber of full-time equivalent employeesNumber of branchesNumber of automated banking machinesNumber of brokerage officesNumber of commercial banking centres
3,643 157 413
15 36
3,528 156 408
15 31
3,393 156 342
15 30
This table includes non GAAP mesures. See notice on page 64.
6 lAurentiAn bAnK 2010 Annual Report
messAge frOm the PresiDent AnD chief eXecutiVe Officer
LLaurentian Bank continues to go through an extraordinary evolution.
The Bank has delivered record profitability for five consecutive years. It has delivered record growth in loans and deposits for four of those five years. And for six years it has consistently recorded increased earnings per share, the only Canadian bank to do so.
it is a remarkable progressionMore specifically in 2010, total revenues were up 11% and earnings per share up 9% compared to 2009. These are satisfying gains. But measured on the basis of continuing operations, the improvement is much stronger: earnings per share increased by 23% and return on common shareholders’ equity improved by 140 basis points, from 10.1% last year to 11.5% in 2010. (details are in the Md&A.)
We also grew our loans and bankers’ acceptances by $1.8 billion in 2010, an increase of 11%.
Our solid performance resulted in the Bank once again meeting the financial objectives that we established at the beginning of the year, as can be seen from the table on page 7.
A continuing period of strong growth and innovation is changing the face of the Bank.
“ it’s not the same bank anymore”
réjean robitaille President and chief executive Officer
“ The growth drivers will likely remain the same in 2011: maximizing the returns on our recent investments and excellence in execution.”
LAURENTIAN BANK 2010 Annual Report 7
MESSAGE FROM THE PRESIDENT AND CHIEF EXECUTIVE OFFICER
Our geographic profile is also strong. Although about 63% of our loan portfolio was in Québec in 2010, approximately half of our profitability came from activities in the rest of Canada.
Over the past three years, which include the worst economic conditions in many decades, we have grown revenues by 26%, diluted earnings per share by 33%, loans and bankers’ accep-tances by 35% (before securitization), and we have improved the efficiency ratio from 73.2% to 68.4%.
I am getting used to opening any conversation on the Bank with the words: “You know, it’s not the same Bank anymore.”
Can we keep it up? At Laurentian Bank, we believe in continuous improvement. It is our ongoing effort to improve products, services, and processes that has played a large role in the transformation of the Bank. Each year we get better: our people become more skilled, our systems more effective, our methods better targeted and our processes more efficient.
We’ve accomplished a lot over the last few years. And, we are committed to ensuring growth will be ongoing and profits sustainable. Our view forward promises much of the same, based on the strength of our business plan, our financial management and a dedication to good execution.
The Plan – three growth enginesThe Bank’s operations are carried out through four well targeted, well functioning and diversified business segments, three of which account for more than 90% of our profitability and which we consider to be the growth engines of the Bank. All four segments had strong years in 2010.
RETAIL AND SME QUÉBEC, under Luc Bernard, contributed $47.0 million in net income, an increase of 19% from continuing operations.
Retail banking is bene-fitting from ongoing investment in its three-network strategy: it has the third largest branch network in Québec with 157 branches; it has a mobile network of 95 “suitcase bankers” who visit customers in their home and have spurred strong growth in new residential mortgages; and it has a rapidly growing virtual network.
Our network of ATMs has grown to 413 and includes 81 located within the Greater Montréal’s transit systems, for which the Bank has signed exclusive agreements. It gives the Bank a competitive advantage, both in terms of the visibility gained and the greater accessibility offered to our clients.
The SME activities – servicing Small and Medium-Sized Enterprises – are also meeting with considerable success with financing offers developed for specific business niches such as pharmacies and day-care centres.
I’m pleased to note that the success of Retail and SME Québec played a part in the recent award to Luc from the L’Université du Québec à Montréal. He is a recent recipient of UQAM’s Manager Performance Prize which recognizes leadership and professional achievement.
The B2B TRUST business segment, led by François Desjar-dins, delivered net income of $46.4 million, an exceptional 45% increase over 2009. B2B Trust is being rewarded for an unre-lenting focus on execution and is looking forward to continued growth.
Through B2B Trust we are the country’s largest supplier of financial products to independent financial independant advisors. Our relationships with over 15,000 advisors in 2010 produced 17% growth both in loans and in average deposits.
“ We are committed to ensuring growth will be ongoing and profits sustainable.”
2010 OBJECTIVES AND RESULTS2010 OBJECTIVES 2010 RESULTS
Revenue growth 5% to 10% 11%
Efficiency ratio 70% to 67% 68.4%
Return on common shareholders’ equity 10.0% to 12.0% 11.5%
Diluted earnings per share $4.00 to $4.70 $4.63
Tier I BIS capital ratio minimum of 9.5% 10.9%
8 LAURENTIAN BANK 2010 Annual Report
MESSAGE FROM THE PRESIDENT AND CHIEF EXECUTIVE OFFICER
The success of B2B Trust gives me an opportunity to congratulate François, who was recently a re-cipient of Canada’s “Top 40 under 40tm” award. This is representative of the very talented management at the Bank today.
REAL ESTATE AND COMMERCIAL is our third growth engine and run by Paul Hurtubise. The segment also had an exceptional year and grew net income by 43%, contributing $49.1 million to the Bank’s bottom line. Real estate financing accounts for 70% of the business segment’s activities. The focus is on construction project financing where Paul’s team has established a high level of credibility, expertise and adherence to prudent risk management processes. We successfully set up a syndication desk in Toronto at the start of the year which is enabling us to take on bigger projects without adding to our exposure.
Our fourth business unit is LAURENTIAN BANK SECURITIES AND CAPITAL MARKETS, managed by Michel C. Trudeau. It continues to develop, and contributed $10.0 million in 2010 to the Bank’s net income. At the beginning of the year, we transferred Capital Markets from Treasury into this segment.
While the Institutional Fixed Income division remained a bright spot in a challenging year, other divisions within the business segment are gradually being built out to take on more activity. Both the Institutional Equity and Retail Brokerage teams are working closer to the critical mass that will make them important contributors to our success.
More details on the operations of our four business units can be found in this report.
Sound financial managementOn the financial management side, our first priority is to have a strong capital base. Events in 2010 attest to the improved stability of the Bank and enhanced it still further.
Net interest income grew substantially, largely as a result of higher net interest margins and loan and deposit growth.
We have sound risk management practices. I believe one of the reasons we have been able to perform well during the economic crisis is because we were pro-active on the risk management side ahead of the problems. However, the lingering effect of the recession on our commercial loan portfolio resulted in higher loan loss provisions, but at 0.29% of average assets, it is still considered to be relatively low. Credit quality in our retail loan portfolios improved and reflects our rigorous and disciplined risk management process.
We continued to focus on a well diversified asset mix in 2010, both by sector and location. It was a strong year for residential mortgages and nearly 50% of our mortgages are insured. Another 30% are personal loans, many of which are guaran-teed, and we have 20% of total loans in commercial loans.
Our Tier I capital ratio is 10.9% and our tangible common equity ratio is 9.0%, providing a solid base for growth and development.
And I am pleased to point out that the ongoing profitability and growth of the Bank was recognized during the year by an upgrade of our credit rating from Standard & Poor’s. We are the first North American bank to be upgraded by S&P since the financial crisis.
“ Our exclusive ATM network within Montréal’s transit systems gives us a competitive advantage, both in visibility and accessibility.”

LAURENTIAN BANK 2010 Annual Report 9
MESSAGE FROM THE PRESIDENT AND CHIEF EXECUTIVE OFFICER
ExecutionFine execution is not only a reason why we are enjoying good results but also contributes to why we are perceived favorably. For the past two years, third-party surveys rank Laurentian Bank as the second most admired financial institution in Québec.
Our focus on execution has been rigorous and across the board. We have a strong legacy of customer service on which to build.
One of our flagship assets is the Laurentian Bank Academy, our own employee training and development center. We have now had three full years of experience with the Laurentian Bank Academy which has quickly become established as a model of its kind. The purpose is to continuously improve the competencies of our employees and managers.
Our high level of execution is also the direct result of a constructive working climate and harmonious labor relations with our partners.
Tomorrow’s challengesThe transformation of the Bank is not based solely on five successful years, but on our positioning for continued momentum.
The growth drivers will likely remain the same in 2011. We will be focused on maximizing the returns on our recent investments and excellence in execution, just as we will continue to make new strategic investments in our business development as opportunities arise.
However, challenges remain. We face new capital require-ments affecting all banks which are being finalized by the Basel Committee. While we await the global guidelines, we believe that we are well positioned to meet future requirements.
Our strategy will be to pursue our growth and development through investments and initiatives, as we have done over the last few years. Focusing on our key growth engines and good execution, we remain committed to improve the Bank’s performance.
Given our confidence in the Bank’s future and our solid balance sheet and capital ratios, the Board approved an 8% increase in the quarterly dividend, corresponding to $0.03 per common share, to $0.39. Over the last three years, the dividend was raised by 24%.
AcknowledgementsIn addition to my profound gratitude to our great employee family, I wish also to recognize the support and contribution of all our stakeholders.
These include our customers who continue to drive our progress with their ongoing trust in the Bank and appreciation of our staff.
They include the Management Committee who represent an exceptional management team, responsible for the planning and strategizing that has brought us this far.
And we are fortunate to have an outstanding Board of Directors which provides solid guidance and governance to management.
ConclusionThis fiscal year we will celebrate the 165th anniversary of the Bank’s founding.
I can think of no finer way to mark this significant milestone than by sustaining and accelerating the growth that has raised our profile and energized our entire staff. We all look forward to sharing in the continuation of our transformation.
“ Over the last three years, the dividend was raised by 24%.”
Réjean Robitaille, FCAPresident and Chief Executive Officer

10 LAURENTIAN BANK 2010 Annual Report
MESSAGE FROM THE CHAIRMAN OF THE BOARD
WWe talk a lot about sustainable growth and one of the most rewarding aspects of the Bank’s recent performance is the ongoing progression of the results. Not only do we have a consistent record of earnings per share growth over the past six years – as Réjean points out in his Message from the President and Chief Executive Officer – but our goal is for continuing improvement year over year.
These have not been small improvements. Financially, our growth even during the very challenging recent past, has been at record levels. In addition to financial strength, we have been building a Bank better able to serve its customers, thanks to constant attention to service quality.
This is a tribute to the strategic mindset of both senior man-agement and the Board of Directors. Above all, it is a tribute to the excellent execution and dedication of all our employees.
As our economic recovery still remains elusive, other econo-mies both in Europe and next door to us remain under signifi-cant threat. We have much to be grateful for in Canada.
Strength and reliability need to be tested to be appreciated. When the world’s financial systems were under pressure, Canada was one of the few countries which did not have to invest in the Banks’ capital. Canada was in good shape when the crisis occurred, which allowed our governments to pursue pro-active financial strategies.
Laurentian Bank recorded its strongest results ever while the banking industry was going through a historical financial and economic crisis.
A strong bank in a strong system
Denis Desautels Chairman of the Board
LAURENTIAN BANK 2010 Annual Report 11
MESSAGE FROM THE CHAIRMAN OF THE BOARD
We have three elements which displayed a remarkable resilience to adversity: the country, the Canadian banking system, and our Bank. I think we can all find in that a great source comfort and satisfaction.
That being said, and considering the ongoing climate, it is critical that the banking industry continues its strategies of prudence and mitigated risk. That is certainly the prevailing thought here at Laurentian Bank. Both the Senior Management and the Board are committed to ensuring the Bank remains capable of weathering any fluctuations in these uncertain conditions.
An effective partnershipThis is a good time to comment on the highly effective partnership shared by senior management and the Board.
First, I believe sincerely that we have a strong Board of Directors. Each person is a source of relevant expertise that makes the full board a repository of valuable knowledge and competence that is at the service of the company. I am also proud to say that all but the President and Chief Executive Officer are independents and that five of those members are women, representing the highest female representation among Canadian banks.
We also have a superb and dynamic senior management team. Banking is a complex endeavour which juxtaposes a higher-than-normal understanding of risk and responsibility, with the innovation and entrepreneurial spirit required to profit in a sea of regulation.
At Laurentian Bank, these two entities – Board and Senior Management – work together in a remarkably synergistic and fruitful manner. The Board regularly acts as a sounding board and is an active participant in strategy formulation and discussion. I believe that this exemplary partnership has been an important component in the Bank’s recent success.
New regulations aheadThe most important role of the Board is ensuring effective governance. Among other duties, it is an impartial arbiter of corporate conduct and compliance. In this context, we are facing some uncertainty with the implementation of new regulations and, in particular, new capital requirements.
To reduce the risk of another financial crisis such as we have just had, the world’s banks are going to have to meet tougher requirements governing capital and liquidity. Laurentian Bank is well capitalized and based on the information that is available now, we are well positioned to meet future requirements.
Denis Desautels, O.C., FCA Chairman of the Board
“ We have seen a remarkable resilience to adversity in the country, the Canadian banking system, and our Bank. I think we can all find in that a great source comfort.”
Another challenge lies in preparing for our conversion to the new International Financial Reporting Standards (IFRS) on Nov 1, 2011. This project is being managed in a very competent manner. An important issue will be to explain clearly the impact of these changes in accounting rules so that shareholders can continue to make fully informed decisions.
Executive compensationFor some time now, the subject of executive remuneration has been of mounting interest among shareholders. This time last year I commented on the work of the Board’s Human Resources Committee in making our decisions regarding executive compensation at the Bank.
This was submitted to the Annual Meeting and received strong support from our shareholders. I would like to thank both the Committee for its excellent work and our shareholders for their strong support of management. This will continue to be an active subject for consideration by the Board as we continue to refine our compensation practices. We intend that these should continue to be straightforward, readily under-stood by shareholders and ensure a fair balance between the interests of the Bank, our shareholders and management.
AcknowledgmentsI would like to express my thanks to the many, many people who are contributing to this exceptional period of growth. This includes our 3,600 employees who have earned a well- deserved feeling of achievement. It includes the members of the Management Committee as well as other executives and managers in positions of leadership. And it includes the members of the Board of Directors who continue to contribute meaningfully to the Bank’s success as strategists, guardians and guides.
By no means least, I thank you, our shareholders, for your ongoing support and confidence.
12 LAURENTIAN BANK 2010 Annual Report
BUSINESS REVIEW
TStaff training and systems convert growing customer interest in services and products.
RET
AIL
AN
D
SME
QU
ÉBEC
Record deposits fuel retail growth
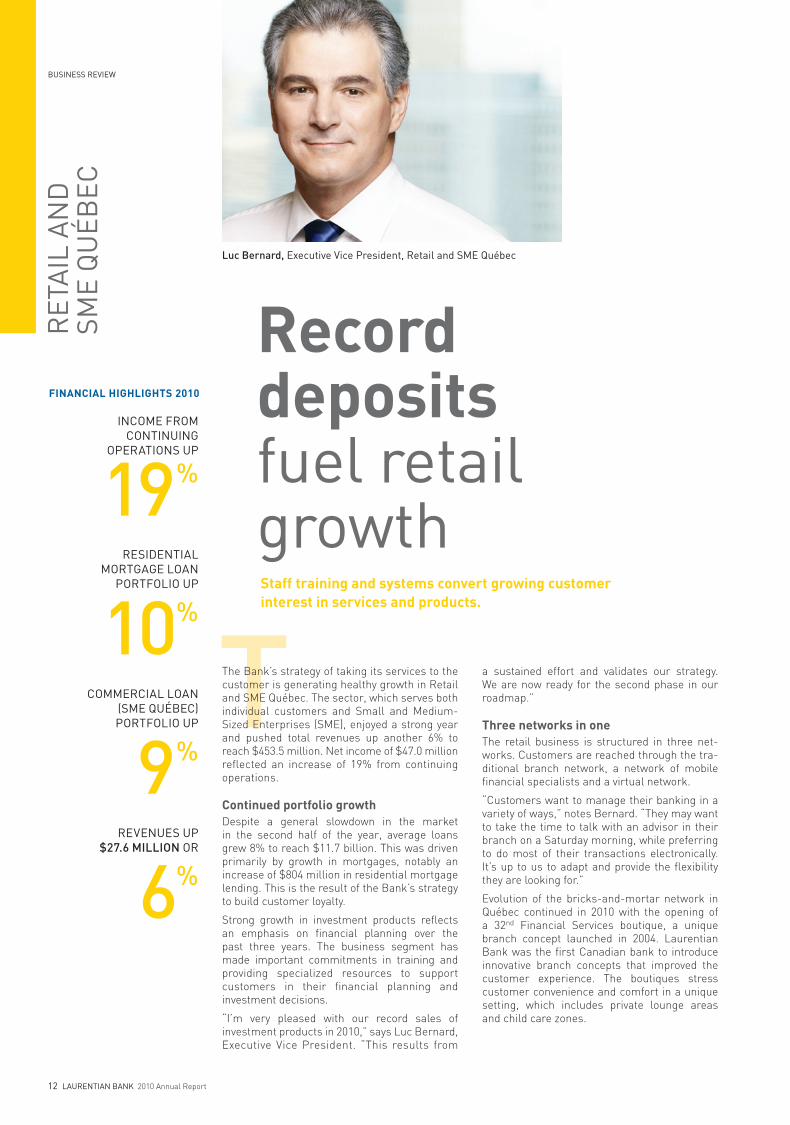
Luc Bernard, Executive Vice President, Retail and SME Québec
The Bank’s strategy of taking its services to the customer is generating healthy growth in Retail and SME Québec. The sector, which serves both individual customers and Small and Medium-Sized Enterprises (SME), enjoyed a strong year and pushed total revenues up another 6% to reach $453.5 million. Net income of $47.0 million reflected an increase of 19% from continuing operations.
Continued portfolio growthDespite a general slowdown in the market in the second half of the year, average loans grew 8% to reach $11.7 billion. This was driven primarily by growth in mortgages, notably an increase of $804 million in residential mortgage lending. This is the result of the Bank’s strategy to build customer loyalty.
Strong growth in investment products reflects an emphasis on financial planning over the past three years. The business segment has made important commitments in training and providing specialized resources to support customers in their financial planning and investment decisions.
“I’m very pleased with our record sales of investment products in 2010,” says Luc Bernard, Executive Vice President. “This results from
a sustained effort and validates our strategy. We are now ready for the second phase in our roadmap.”
Three networks in oneThe retail business is structured in three net-works. Customers are reached through the tra-ditional branch network, a network of mobile financial specialists and a virtual network.
“Customers want to manage their banking in a variety of ways,” notes Bernard. “They may want to take the time to talk with an advisor in their branch on a Saturday morning, while preferring to do most of their transactions electronically. It’s up to us to adapt and provide the flexibility they are looking for.”
Evolution of the bricks-and-mortar network in Québec continued in 2010 with the opening of a 32nd Financial Services boutique, a unique branch concept launched in 2004. Laurentian Bank was the first Canadian bank to introduce innovative branch concepts that improved the customer experience. The boutiques stress customer convenience and comfort in a unique setting, which includes private lounge areas and child care zones.
INCOME FROM CONTINUING OPERATIONS UP
19%
RESIDENTIAL MORTGAGE LOAN PORTFOLIO UP
10%
COMMERCIAL LOAN (SME QUÉBEC)
PORTFOLIO UP
9%
REVENUES UP $27.6 MILLION OR
6%
FINANCIAL HIGHLIGHTS 2010

In November, 2010 the Bank launched its second generation of branch upgrades. With their lounge style, these branches contribute to an even more pleasant client experience for making the important decisions that the customer comes to the branch to make.
Renovations and relocations are also part of the strategy. Since 2004, more than 30% of our branches have benefitted from significant in-vestments. The best elements of the boutique model are being incorporated in the renovations to keep branches in line with changing custom-er patterns.
Launched only four years ago, the mobile bank-ing network in 2010 accounted approximately 40% of new residential mortgages. Some 95 “suitcase bankers” cover the majority of the Québec market and provide a complete mort-gage service in the customer’s home.
Out-of-branch convenience for customers is enhanced by a virtual network which includes having advisors available over the phone. The Bank is the only institution to provide customers with access by phone and email to a financial consultant assigned to them – an option greatly appreciated by customers.
More ATMs on transit systemAt the end of the year, the Bank signed a second exclusive agreement for installation of automated banking machines in the Montréal area public transit network. The agreement with the Agence Métropolitaine de Transport places nine new ATM’s at high traffic locations within the Greater Montréal commuter train and bus system.
Under an earlier agreement, the Bank oper-ates 72 ATMs in the Montréal subway system. The machines provide high visibility given the 1.2 million daily trips on the system and have resulted in a high number of transactions. Laurentian is the only Canadian bank with an exclusive agreement of this nature.
Capitalizing on the high profile of the underground ATMs, the Bank will open a recruitment centre in the subway system by the end of December 2010. To be called Career Station, the centre will be literally a store for shopping for a job, illustrating again how the Bank’s accessibility sets it apart.
Changing the customer experienceAnother major milestone was the launch in mid-year of a leading-edge customer relation-ship management system which enhances still further the level of service to clients throughout the branch network. This follows several years of major investments in database management of client information as well as in leading-edge software for understanding the behavior and needs of clients.
“We want to provide our customers with a different experience,” says Bernard. “This is the core component of our distribution strategy and the focus of our investments in business intelligence systems.”
Advanced Customer Relationship Management (CRM) systems have been adopted by other Canadian banks, but Laurentian Bank will have an advantage over its immediate competitors in the Québec market.
Specialized services to SMEsSmall and Medium-Sized Enterprises are an important component of Retail and SME Québec. With an increase of 9.5% in average loans in 2010, the segment has seen its book of business grow by 45% over the last three years. Some 50 account directors deal with clients having financing needs of up to $3 million, working out of 16 commercial offices across Québec.
The unit pursues a niche strategy for growth, built around customized solutions for spe-cific market niches and has created a highly specialized sales force fully conversant with the challenges of each sector.
Currently there are three niches – pharmacies, farm lending and private daycares. These are areas with strong potential for development and acceptable risk levels. Developing these niches will be the main growth strategy for the SME team in the years ahead.
In addition to short and long-term financing solutions, the Bank offers a range of services and tools in each niche, including deposits, processing of international transactions, com-mercial credit cards and payroll management services.
Specialized business services help pharmaciesTwo of the most important barriers to providing value to Small and Medium-Sized Enterprises (SME) are the highly diverse nature of the businesses and the specialized needs of each. Laurentian Bank over-comes both with its niche strategy.
“You can’t be everything to everyone,” says Luc Bernard, Executive Vice President, Retail and SME Québec. “That is especially true when the thing that small business managers need most is someone who understands their business. So we’ve created exclusive and highly competitive solutions for entrepreneurs in specific niches.”
One program performing strongly is aimed at pharmacists. A team of specialists has extensive expertise and a well developed knowledge of the issues and environment in the sector.
An example of niche-thinking and expertise is the ability to value goodwill both in assessing the worth of an establishment and in offering pharmacists an improved option for loans on equity.
Pharmacists also benefit from an exclusive program for their personal finances as well as private banking.
The Bank currently has similar teams operating in the agricul-ture sector and in daycare businesses.
LAURENTIAN BANK 2010 Annual Report 13
BUSINESS REVIEW
“ The mobile banking network in 2010 accounted for approximately 40% of new residential mortgages.”
“ Customers want to manage their banking in a variety of ways. It’s up to us to adapt and provide the flexibility they are looking for.”

14 LAURENTIAN BANK 2010 Annual Report
BUSINESS REVIEWR
EAL
ESTA
TE A
ND
C
OM
MER
CIA
L
TThe Bank’s Real Estate and Commercial unit made a record contribution to profits in 2010 for the third consecutive year.
Real Estate and Commercial contributed $49.1 million of net income, an increase of $14.7 million over 2009. Total revenue increased by $25.8 million, or 28%, to reach $119,3 million, mainly as a result of the successful outcome of the strategies aimed at growing the business and achieving higher net interest income.
As of November 1, 2009, Foreign Exchange and International Services, formerly reported under ‘Other’, are reported in this business segment.
The Real Estate and Commercial segment is now comprised of Real Estate Financing, Commercial Financing and International Services. This segment is comprised of a total of 120 people.
Real Estate Financing pursues its growthReal Estate Financing accounts for about 70% of the unit’s business, with a loan portfolio of $2.2 billion at the end of fiscal 2010.
“It’s a small team, but one that is very experi-enced and highly effective,” says Paul Hurtubise, Senior Vice President. “This is a world where you are as good as your last deal. We are successful because we get it right the first time and we deliver quickly.”
Project financing is pan-Canadian with offices in British Columbia, Alberta, Ontario and Québec. More than half of the business is written in Ontario.
After record growth in 2009, construction project financing continued to grow in 2010 with a 6% increase in new business. The group has built a reputation for its ability to quickly assess the needs of borrowers and to deliver on their offers of financing.
“Loan duration in real estate construction financ-ing averages about 18 months per project, so we have to write a lot of business in order to grow,” says Hurtubise. “Turn-around time on term sheet approvals is rated the best in the industry.”
Credit quality is solid and risk management mitigation measures include capping single loans at $30 million per project with a maximum aggregate of $65 million per client.
Small team posts large contribution
Paul Hurtubise, Senior Vice President, Real Estate and Commercial
Real Estate and Commercial across Canada delivers another record year.
NET INCOME UP
43%
REVENUES UP $25.8 MILLION OR
28%
GOOD CREDIT QUALITY, DESPITE
INCREASE IN LOAN LOSSES
FINANCIAL HIGHLIGHTS 2010

LAURENTIAN BANK 2010 Annual Report 15
BUSINESS REVIEW
An objective of the Real Estate Finance Group is to increase its market share in term loans. This focus met with success in 2009 and continued with portfolio growth of nearly 50% in 2010.
Commercial portfolio shows strong growthThe second component of the Real Estate and Commercial segment concentrates on providing commercial clients with banking products and services, including credit operating facilities, oper-ating accounts and interna-tional transactions. These activities are in Québec and Ontario only and represent a portfolio of $800 million, with roughly 75% of the loans based in Québec.
The group continued its strong growth, particu-larly in Québec. Several new clients contributed to the portfolio growth in the past four years.
Real Estate and Commercial as a segment performed well against 2010 objectives. A prior-ity to invest in human capital resulted in a 15% increase in the workforce. This included the hiring of an Assistant Vice President in Vancouver and two in Québec, the addition of more Commercial Account Managers and sup-port employees to provide improved and more specialized services to facilitate ongoing growth.
The segment is also diversifying its funding sources by growing commercial deposits. Average deposits grew by more than 60%.
“ A focus to increase the amount of term loans continued in 2010 with a nearly 50% increase in this portfolio.”
Syndication team off to a strong startA testimony to the success of the Bank’s Real Estate Financing sector is a high level of repeat customers. But you have to be able to evolve with those clients as they grow.
The core activity of the Bank’s real estate financing business is construction project financing in the $2-$30 million range. There are additional aggregate limits per borrower and per loan type. Sometimes, clients have projects that surpass the Banks’ limits.
The Bank is happy with its existing risk management. So, in order to be able to support these larger projects, the solution was to create a formal syndication process.
“We had done the occasional syndication, but at the start of this year we opened our own syndication desk in Toronto,” says Rick Lane, Vice President, Real Estate Financing. “We’re very pleased with the first year’s results.”
The syndication desk is managed by Tony Da Silva, Vice President, Loan Syndications and a Bank veteran who rejoined real estate four years ago after running the Toronto credit department. In its first year, the desk did 19 transactions for three-quarters of a billion dollars.
The larger scale projects also tend to be more diversified. One mixed use site is integrating prime retail, office, medical and restaurant space with town homes and a condo tower in a total of some 500,000 square feet.
Thirteen of the syndicated loans were for the Bank’s own customers, totaling just under $400 million.
Charles and David Mady (centre and right) of the Mady Development Corporation look over a model of a major, 500,000 square foot, mixed use site with the Bank’s Rick Lane, Vice President, Real Estate Financing. The Madys are long-standing clients who have grown with the Bank, just as the Bank’s Real Estate Financing sector has grown with them.

16 LAURENTIAN BANK 2010 Annual Report
BUSINESS REVIEWB
2B T
RU
ST
CContinuing momentum propelled the B2B Trust unit to another year of record growth in 2010.
The business segment grew net income by $14.3 million to reach $46.4 million, an in-crease of 45% over 2009. Revenues increased by $24.0 million to $124.6 million, largely from higher net interest income.
“Just like other sectors of the Bank, we’re seeing very strong results of strategies and decisions made earlier,” says François Desjardins, Presi-dent and Chief Executive Officer of B2B Trust. “We are in the process of a major expansion which has seen very strong growth in deposits, investment loans and residential mortgages while holding our credit risk to extremely low levels.”
Residential mortgages grew by $614 million during the year. Total loans now stand at $5.2 bil-lion and deposits at $9.2 billion. With efficiency ratios remaining under 45%, the increase in busi-ness has translated into net income growth of 52% over the past three years.
This improvement goes back to a commitment made a few years ago to build the business line as a core engine of growth. The subsequent financial turmoil created opportunities that served as a springboard: proactive risk manage-ment strategies implemented well in advance of the financial crisis allowed B2B Trust to pro-mote growth at a time when some competitors retreated into a defensive mode.
Past decisions build best-ever year
François Desjardins, President and Chief Executive Officer of B2B Trust
Evolution of its unique product distribution strategy pushes B2B Trust to highest earnings.
NET INCOME UP
45%
REVENUE GROWTH OF $24.3 MILLION OR
24%
RESIDENTIAL MORTGAGE LOANS UP
$0.6 BILLION OR
37%
EXCELLENT CREDIT QUALITY,
DESPITE THE RECENT ECONOMIC
SLOWDOWN
FINANCIAL HIGHLIGHTS 2010

LAURENTIAN BANK 2010 Annual Report 17
BUSINESS REVIEW
Understanding B2B TrustB2B Trust’s business model is quite distinct from its peers. It is a wholesale manufacturer of banking products distributed to independent financial advisors in Canada for their clients. It offers high quality products in five categories: Investment and RRSP loans, Mortgage loans, Banking accounts – High Interest Investment Account and High Interest Savings Account – GIC deposits and Self-Directed Investment Accounts.
B2B Trust markets exclusively through this network, now over 15,000 independent financial advisors across Canada. It does not sell directly to end-customers and therefore does not com-pete with the advisors. Instead, it has made the advisor its sole focus.
This model has made B2B Trust the national leader in serving the financial intermediary community and created a key source of future growth. There are many opportunities for B2B Trust for deepening relationships with each advisor and reaching more of their customers.
B2B Trust is expanding its product channels and is currently making new inroads into the insur-ance business. A trend by insurers to outsource distribution has augmented the role of Manag-ing General Agencies (MGA), creating a new opportunity for B2B Trust’s business model.
Error-free, hassle-freeB2B Trust continues to develop high quality, competitive products and is currently heavily invested in providing “error-free, hassle-free” product support. This orientation is aimed at improving client satisfaction by moving from responsive customer service to pro-active com-plaint prevention.
“Our goal is not to have a perfect issue response, it is to take away the issue in the first place,” says Desjardins. “This means proving fast, error-free service. It’s a tougher challenge, but a better solution.”
To reduce opportunities for error, and simplify the life of the advisor, the business segment’s objective is to simplify its processes. In one ex-ample during 2010, an end-to-end review of one application procedure succeeded in reducing the required steps from over 25 to three – giv-ing advisors more time to concentrate on what’s important to them – their clients.
B2B Trust is backing up this streamlining with continuing emphasis on people and people skills. Banking is a people business and B2B Trust counts on the dedication and talent of its employees to continue to grow the business segment.
“ Our goal is not to have a perfect issue response, it is to take away the issue in the first place.”
Charlene helps to build B.C. businessInvestment loans are a core product at B2B Trust. With a portfolio of $3 billion, B2B Trust is a leader in Canada in this field, requiring a deep understanding of the financial intermediary market.
People like Charlene Ray are key to the Bank’s understanding of the evolving needs of the independent financial advisors. Charlene is Senior Manager, Business Development for Metro Vancouver and Vancouver Island. She is also a west coast native with 33 years of banking service, 16 of them specifically with financial planning advisors.
In 2010, despite the challenges in the marketplace, she closed important new accounts and surpassed her objectives for investment loans development.
“ The increase in business has translated into net income growth of 52% over the past three years.”
Charlene Ray, Senior Manager, Business Development, Metro Vancouver & Vancouver Island, B2B Trust
BUSINESS REVIEW

18 LAURENTIAN BANK 2010 Annual Report
BUSINESS REVIEWLA
UR
ENTI
AN B
ANK
SE
CU
RIT
IES
AND
C
APIT
AL M
ARK
ETS
AAgainst a back drop of weaker markets in the second half of the year, Laurentian Bank Secu-rities and Capital Markets posted net income of $10.0 million, down from $12.0 million in 2009.
“I’m satisfied with our performance in a year that was challenging,” says CEO Michel C. Trudeau. “We continued to take measured steps to build the business for future growth.”
The growth strategy of Laurentian Bank Securi-ties and Capital Markets is based on a business model that provides brokerage services to insti-tutional, government and retail clients, as well as to corporations. Thanks to its targeted invest-ments and long-term strategic vision, this business segment represents an important component of the overall operations of the Bank.
Increased participation in syndicatesThe largest division, Institutional Fixed Income, is solidly established across the country. Laurentian Bank Securities is playing a progressively more senior role in several provincial syndicates and has a growing presence in the corporate sector. It is actively participating in the debt issues of every province and in an increasing number of municipal borrowings.
Development activity in 2010 continued to build stronger businesses for the Institutional Equity and Retail Brokerage divisions.
The Retail Brokerage division, with 14 offices mainly in Québec, has grown from 30 brokers five years ago to 85 today. Providing a full suite of investment products to its clients, this division offers a lot of potential growth and development as it further builds and strengthens its foundation.
The Institutional Equity division, formed in 2006, transitioned from being a start-up operation to being profitable in 2010. The sector now includes nine analysts providing research coverage of over 50 small cap companies. Laurentian Bank Securities is the only bank-owned investment dealer to specialize in this fast-growing niche.
“We’re moving carefully and being selective,” says Trudeau. “With our solid execution and limited appetite for risk, we are positioned to take advantage of attractive growth opportunities.”
Building on our future Fixed Income delivers another solid year, while other divisions continue to build their franchise.
Michel C. Trudeau, Senior Vice President Capital Markets for the Bank and CEO, Laurentian Bank Securities
REVENUE INCREASES IN RETAIL AND
INSTITUTIONAL EQUITY DIVISIONS
SOLID PERFORMANCE OF
THE INSTITUTIONAL FIXED INCOME
DIVISION
FINANCIAL HIGHLIGHTS 2010
“We are actively participating in the debt issues
of every province and in a growing
number of municipal borrowings.”

LAURENTIAN BANK 2010 Annual Report 19
CO
RP
OR
ATE
SE
RVI
CES
TThe Corporate Services sector is made up of the following groups: Treasury, Finance and Tech-nology, Corporate Affairs, Human Resources and Integrated Risk Management. These groups support the business units and ensure that all basic requirements are in place to allow the Bank to grow.
Corporate AffairsA primary task of Corporate Affairs, under the responsibility of Lorraine Pilon, Executive Vice President, Corporate Affairs and Secretary, is to maintain an impeccable reputation for Laurentian Bank. It is involved in the Bank’s reputation in three ways: through Communica-tions, Public Affairs and Investor Relations; Legal Affairs and the supervision of regulatory risk; and through Internal Audit and corporate security.
“Banking depends upon trust and maintaining your reputation is absolutely critical”, says Lorraine Pilon.
Treasury, Finance and TechnologyMichel C. Lauzon, Executive Vice President and the Bank’s Chief Financial Officer, has a broad mandate. In addition to Finance and Corporate Treasury, he is responsible for Information Technology and Real Estate.
Raising and managing the Bank’s capital and funding needs means Corporate Treasury is always ensuring that the Bank has relationships with other banks and institutional counterparties. These relationships ensure that the Bank has access to funds at competitive rates as the need for liquidity arises.
This was an active sector for the Bank in 2010, with the issue of a new $250 million series of debentures at the beginning of November. As
such, the Bank maintains very solid levels of capital and liquidity.
The group is currently engaged in converting to the forthcoming new International Financial Reporting Standards. Canada moves to IFRS in 2011 and the Banks will implement the new standards as of November 1.
Another challenging sector is Information Tech-nology. “We have to strike the right balance between the need for solid corporate standards in IT and the need to stay agile in order to minimize costs and time-to-market,” says Lauzon.
Human Resources and Integrated Risk Management Over the years, the Bank has developed a unique approach to Human Resources. A feature of the sector, under the responsibility of Denise Brise-bois, Senior Vice President, Human Resources, is the Laurentian Bank Academy which consoli-dates the development programs offered to the Bank’s employees. Other approaches include on-line training, interactive coaching and class-room sessions.
A leadership program called Leaders in Action is offered to all of the Bank’s managers in order to develop a common management culture and improve management skills.
Risk management is always at the very core of any bank’s operations, a position familiar to Senior Vice President and Chief Risk Officer Pierre Minville and his team. Whether the issues are with credit risk, financial risk, market or operational risk, they are carefully and skillfully managed in order to limit potentially negative impacts while enabling the organization to continue its growth.
Corporate groups support growth Finance prepares for new reporting standards in 2011.
Lorraine Pilon, Executive Vice President, Corporate Affairs and Secretary, with Michel C. Lauzon, Executive Vice President and Chief Financial Officer. Both are members of the Management Committee.
“We have to strike the right balance
between the need for solid corporate
standards in IT and the need to be
as agile as possible in terms of time-
to-market.”
“Banking depends upon trust and
maintaining your reputation is
absolutely critical.”

20 LAURENTIAN BANK 2010 Annual Report
BUSINESS REVIEW
Bank’s reputation starts with its people
A group of award winners symbolizes the 3,600 employees who build our reputation each year.Reputations have to be earned. Or, as Henry Ford put it, you can’t build a reputation on what you are going to do. Laurentian Bank has estab-lished an enviable reputation, and it has taken many years and the efforts of thousands of people to do so. In fact, for the past two years, independent surveys have ranked the Bank as the second most admired financial institution in Québec.
Reputations are tested thousands of times each and every working day, and great employees ensure that they remain intact. At Laurentian Bank, it could be when Francine Bédard greets a client in the Lanaudière region or when Jing Xu accelerates a process in Toronto.
Francine and Jing are but two of more than 3,600 employees who work conscientiously to ensure that the Bank’s reputation remains as good or grows even stronger as a result of their respective efforts. Francine and Jing are also among a select group singled out for recogni-tion this past year with five individual annual Guy-Vanier Awards and one Ray McManus Team Award. They would be the first to confirm that they represent the entire workforce at the Bank
because their every action and every client contact has an impact on the reputation of the organization as a whole.
Six products per clientIt is unlikely that anyone knows her customers better than Francine Bédard, a Personal Bank-ing Advisor in Lanaudière, northwest of Québec. Her clients – who average six Laurentian Bank products in their portfolios – are totally loyal to her.
Not only is she regularly among the top three sales performers at the Bank but she is also one of those people who will always find time to take on a worthy cause or project.
Jing Xu is another one of these people who can’t stay away from a challenge. When she first joined the fast-developing B2B Trust unit she found she had lots of company.
“I was inspired by the people I was working with as soon as I joined the Bank,” says Jing Xu. “Everyone tried to contribute a little bit more every day. It made you want to come to work.”
Jing has a computer science degree and a knack of being able to setup systems and databases to make processes more efficient. It wasn’t long before she was doing more than her share of inspiring her colleagues.
Francine BédardAnnie DufourDenis L’HostieDonate St-LaurentJing Xu
The five 2009 Guy-Vanier Award winners

22 laurentian banK 2010 Annual Report
ManaGeMent’S DiSCuSSiOn anD analYSiS
ManaGeMent’S DiSCuSSiOn anD analYSiSFOR THE YEAR ENDED OCTOBER 31, 2010
OVERVIEW OF FISCAL 2010
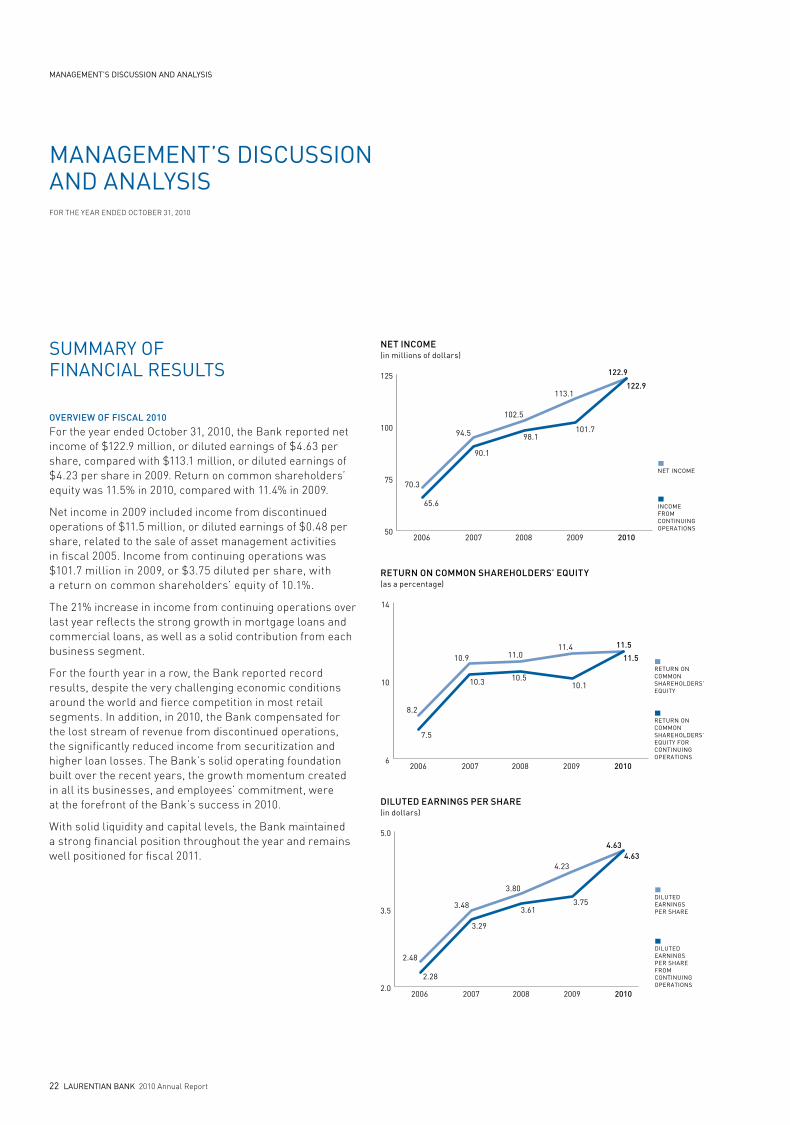
For the year ended October 31, 2010, the Bank reported net income of $122.9 million, or diluted earnings of $4.63 per share, compared with $113.1 million, or diluted earnings of $4.23 per share in 2009. Return on common shareholders’ equity was 11.5% in 2010, compared with 11.4% in 2009.
Net income in 2009 included income from discontinued operations of $11.5 million, or diluted earnings of $0.48 per share, related to the sale of asset management activities in fiscal 2005. Income from continuing operations was $101.7 million in 2009, or $3.75 diluted per share, with a return on common shareholders’ equity of 10.1%.
The 21% increase in income from continuing operations over last year reflects the strong growth in mortgage loans and commercial loans, as well as a solid contribution from each business segment.
For the fourth year in a row, the Bank reported record results, despite the very challenging economic conditions around the world and fierce competition in most retail segments. In addition, in 2010, the Bank compensated for the lost stream of revenue from discontinued operations, the significantly reduced income from securitization and higher loan losses. The Bank’s solid operating foundation built over the recent years, the growth momentum created in all its businesses, and employees’ commitment, were at the forefront of the Bank’s success in 2010.
With solid liquidity and capital levels, the Bank maintained a strong financial position throughout the year and remains well positioned for fiscal 2011.
SuMMarY OF FinanCial reSultS
RETURN ON COMMON SHAREHOLDERS’ EQUITY(as a percentage)
RETURN ON COMMON SHAREHOLDERS’EQUITY FOR CONTINUING OPERATIONS
RETURN ON COMMONSHAREHOLDERS’EQUITY
2006 2007 2008 2009 20106
10
14
7.5
10.3 10.510.1
11.411.010.9
8.2
11.5
11.5
NET INCOME(in millions of dollars)
INCOME FROM CONTINUING OPERATIONS
NET INCOME
2006 2007 2008 2009 201050
75
100
125
65.6
70.3
90.1
94.5 98.1
102.5
101.7
113.1122.9
122.9
DILUTED EARNINGS PER SHARE(in dollars)
DILUTED EARNINGS PER SHARE FROM CONTINUING OPERATIONS
DILUTED EARNINGS PER SHARE
2006 2007 2008 2009 20102.0
3.5
5.0
2.28
2.48
3.48
3.80
4.23
3.29
3.613.75
4.634.63
laurentian banK 2010 Annual Report 21
buSineSS review
Social Responsability
Annie Dufour celebrated her quarter century with the Bank in 2010. She’s another award win-ner and a person passionate about “her Bank”.
Annie is a Manager in Direct Sales, a unique sector of the Bank which provides clients with access to experienced financial advisors over the phone. Building relationships over the phone is challenging but the service has become well appreciated by customers and a source of differentiation for the Bank.
Optimizing skills of othersContributing to the Bank’s success and teaching others how to do it are two sides of the same coin. Donate St-Laurent, as a Senior Manager of Human Capital Development, is one of those influencing the Bank’s success by optimizing skills and aptitudes.
Donate is responsible for developing the skills of personnel. She has upgraded course content and doesn’t hesitate to introduce new solutions. When instruction was needed for the launch of new software to facilitate client investments, she led the team which not only provided the course but met a tough deadline by introducing an e-learning program. Over 1,000 employees were able to complete the training in matter of a few weeks while minimizing participants’ travel time and expenses.
Another winner of the Guy-Vanier Award for individual excellence, Denis l’Hostie is a “lifer”. He is a man with 28 years of service who still expects to learn something new on the job every day. As Senior Manager of Financial Planning, he and his team are at the centre of the strategic “Focus on Investment” that the Bank introduced in 2008.
He is also responsible for the remarkably successful “Retirement Projections” program offered in the branches. The number of financial analyses completed has doubled in each of five years.
“Financial planners can have a major influence on the lives of their clients,” he says. “These clients bring their dreams to us and we help to make them come true. I love that part of the job.”
Impressive team successThe Ray McManus Team Award acknowledged a high-profile group success. When the Bank had the chance to bid on installing 34 ATM machines in the Montréal subway, the devil was indeed in the details. The Bank had 15 days to prepare and cost the proposal and a five-week window to in-stall the systems.
First, the team won the bid with an innovative proposal that boosted the number of installed cash machines to 44. Then they mapped out the installation program and lined up suppliers and network providers. Working only when the subway was closed, they installed the new ATMs in 25 nights.
Finally, teams from marketing and public affairs promoted an impressive achievement which has raised the Bank’s profile, increased ATM transactions and led to new accounts.
With this calibre of employee support, the Bank’s reputation remains in strong hands.
Committed to CaringMore companies each year are reporting non-financial and financial information in the same document, recognizing that investors today want to consider environmental, social and governance information in their decisions.
we will continue to report on issues relating to management, employees and customers, the environment and our community involvement. each March, we issue a comprehensive Social responsibility report which is posted on our web site at www.laurentianbank.ca
we are committed to the principles of transparency, integrity and ethical behaviour in our business practices.
Development of the bank’s human resources has been focused around the laurentian bank academy which opened three years ago. in 2010, 35,000 hours of training were given at the academy and 6,500 online training modules were completed for a total of 42,000 hours of instruction.
we are dedicated to being an integral part of the communities in which we do business. the bank supports more than 200 organizations and events.
The Ray McManus Team Award
22 laurentian banK 2010 Annual Report
ManaGeMent’S DiSCuSSiOn anD analYSiS
ManaGeMent’S DiSCuSSiOn anD analYSiSFOR THE YEAR ENDED OCTOBER 31, 2010
Our people
OVERVIEW OF FISCAL 2010
For the year ended October 31, 2010, the Bank reported net income of $122.9 million, or diluted earnings of $4.63 per share, compared with $113.1 million, or diluted earnings of $4.23 per share in 2009. Return on common shareholders’ equity was 11.5% in 2010, compared with 11.4% in 2009.
Net income in 2009 included income from discontinued operations of $11.5 million, or diluted earnings of $0.48 per share, related to the sale of asset management activities in fiscal 2005. Income from continuing operations was $101.7 million in 2009, or $3.75 diluted per share, with a return on common shareholders’ equity of 10.1%.
The 21% increase in income from continuing operations over last year reflects the strong growth in mortgage loans and commercial loans, as well as a solid contribution from each business segment.
For the fourth year in a row, the Bank reported record results, despite the very challenging economic conditions around the world and fierce competition in most retail segments. In addition, in 2010, the Bank compensated for the lost stream of revenue from discontinued operations, the significantly reduced income from securitization and higher loan losses. The Bank’s solid operating foundation built over the recent years, the growth momentum created in all its businesses, and employees’ commitment, were at the forefront of the Bank’s success in 2010.
With solid liquidity and capital levels, the Bank maintained a strong financial position throughout the year and remains well positioned for fiscal 2011.
SuMMarY OF FinanCial reSultS
buSineSS review
laurentian banK 2010 Annual Report 21
RETURN ON COMMON SHAREHOLDERS’ EQUITY(as a percentage)
RETURN ON COMMON SHAREHOLDERS’EQUITY FOR CONTINUING OPERATIONS
RETURN ON COMMONSHAREHOLDERS’EQUITY
2006 2007 2008 2009 20106
10
14
7.5
10.3 10.510.1
11.411.010.9
8.2
11.5
11.5
NET INCOME(in millions of dollars)
INCOME FROM CONTINUING OPERATIONS
NET INCOME
2006 2007 2008 2009 201050
75
100
125
65.6
70.3
90.1
94.5 98.1
102.5
101.7
113.1122.9
122.9
DILUTED EARNINGS PER SHARE(in dollars)
DILUTED EARNINGS PER SHARE FROM CONTINUING OPERATIONS
DILUTED EARNINGS PER SHARE
2006 2007 2008 2009 20102.0
3.5
5.0
2.28
2.48
3.48
3.80
4.23
3.29
3.613.75
4.634.63
business segments For the years ended october 31 (in thousands oF dollars, except percentage amounts)
29 rapport annuel 2010 banque laurentienne
rapport de gestion
Corporate priorities for 2011
1 3the bank’s three main priorities will again remain at the forefront of strategic development for 2011. these priorities have provided the bank with a framework in the operational decision-making process.
reVieW of 2010 business segment operations and 2011 priorities
2 IncreaseourprofItabIlIty ensure sustained growth in each business segment, by focusing on markets in which we have strong competitive advantages
continue implementing strategies to develop our sales culture, while maintaining excellence in customer service—the cornerstone of our reputation
ImproveoureffIcIency continue optimizing key processes
ensure excellence in execution
DevelopourhumancapItal reinforce hiring strategies and talent management to support sustained growth
support business segment initiatives to enhance employee performance
this section outlines the bank’s operations according to its organizational structure. services to individuals, businesses, financial intermediaries and institutional clients are offered through the following business segments:
retaIl&smeQuébec
realestate&commercIal
b2btrust
laurentIanbanksecurItIes&capItalmarkets
other
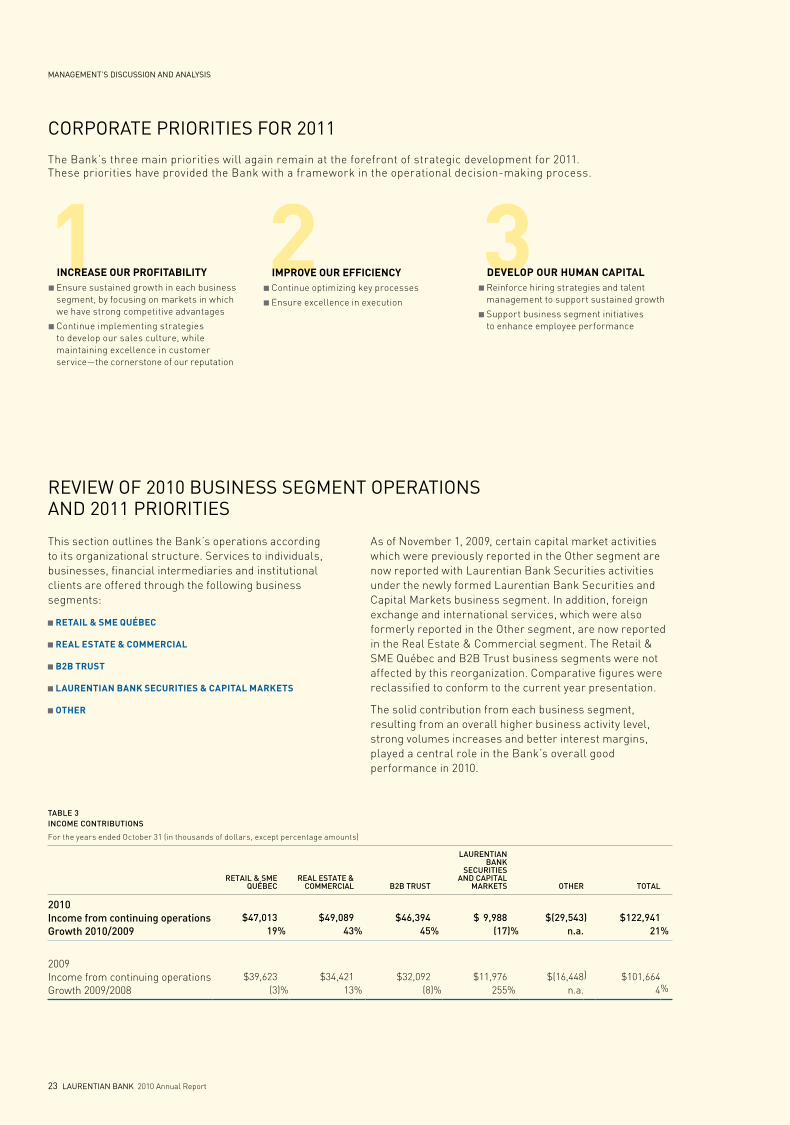
as of november 1, 2009, certain capital market activities which were previously reported in the other segment are now reported with laurentian bank securities activities under the newly formed laurentian bank securities and capital markets business segment. in addition, foreign exchange and international services, which were also formerly reported in the other segment, are now reported in the real estate & commercial segment. the retail & sme Québec and b2b trust business segments were not affected by this reorganization. comparative figures were reclassified to conform to the current year presentation.
the solid contribution from each business segment, resulting from an overall higher business activity level, strong volumes increases and better interest margins, played a central role in the bank’s overall good performance in 2010.
Table 3INCOMe CONTRIbUTIONS
For the years ended october 31 (in thousands of dollars, except percentage amounts)
ReTaIl & SMeQUébeC
Real eSTaTe & COMMeRCIal b2b TRUST
laUReNTIaN baNk
SeCURITIeS aNd CapITal
MaRkeTS OTheR TOTal
2010 Income from continuing operations Growth 2010/2009
$47,013 19%
$49,089 43%
$46,394 45%
$ 9,988(17 )%
$(29,543
n.a. )
$122,941
21%
2009income from continuing operationsgrowth 2009/2008
$39,623 (3)%
$34,42113%
$32,092(8)%
$11,976 255%
$(16,448n.a.
) $101,664 4
%
retaIl&smeQuébec
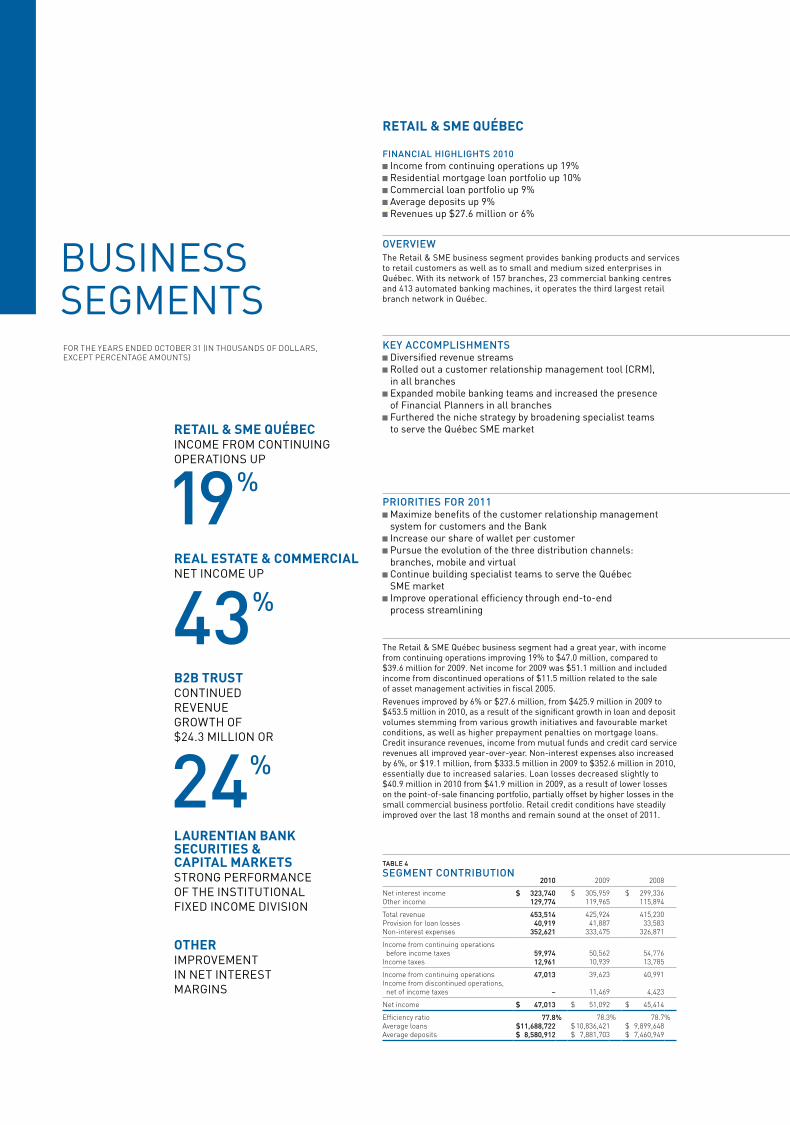
FINaNCIal hIGhlIGhTS 2010 income from continuing operations up 19% residential mortgage loan portfolio up 10% Commercial loan portfolio up 9% average deposits up 9% revenues up $27.6 million or 6%
OveRvIewthe retail & sme business segment provides banking products and services to retail customers as well as to small and medium sized enterprises in québec. With its network of 157 branches, 23 commercial banking centres and 413 automated banking machines, it operates the third largest retail branch network in québec.
key aCCOMplIShMeNTS diversified revenue streams rolled out a customer relationship management tool (Crm), in all branches expanded mobile banking teams and increased the presence of financial planners in all branches furthered the niche strategy by broadening specialist teams to serve the québec sme market
pRIORITIeS FOR 2011 maximize benefits of the customer relationship management system for customers and the bank increase our share of wallet per customer pursue the evolution of the three distribution channels: branches, mobile and virtual Continue building specialist teams to serve the québec sme market improve operational efficiency through end-to-end process streamlining
the retail & sme québec business segment had a great year, with income from continuing operations improving 19% to $47.0 million, compared to $39.6 million for 2009. net income for 2009 was $51.1 million and included income from discontinued operations of $11.5 million related to the sale of asset management activities in fiscal 2005. revenues improved by 6% or $27.6 million, from $425.9 million in 2009 to $453.5 million in 2010, as a result of the significant growth in loan and deposit volumes stemming from various growth initiatives and favourable market conditions, as well as higher prepayment penalties on mortgage loans. Credit insurance revenues, income from mutual funds and credit card service revenues all improved year-over-year. non-interest expenses also increased by 6%, or $19.1 million, from $333.5 million in 2009 to $352.6 million in 2010, essentially due to increased salaries. loan losses decreased slightly to $40.9 million in 2010 from $41.9 million in 2009, as a result of lower losses on the point-of-sale financing portfolio, partially offset by higher losses in the small commercial business portfolio. retail credit conditions have steadily improved over the last 18 months and remain sound at the onset of 2011.
Table 4
SeGMeNT CONTRIbUTION2010 2009 2008
net interest incomeother income
$ 323,740 129,774
$ 305,959 119,965
$ 299,336 115,894
total revenueprovision for loan lossesnon-interest expenses
453,514 40,919
352,621
425,924 41,887
333,475
415,230 33,583
326,871
income from continuing operations before income taxesincome taxes
59,974 12,961
50,562 10,939
54,776 13,785
income from continuing operationsincome from discontinued operations, net of income taxes
47,013
–
39,623
11,469
40,991
4,423
net income $ 47,013 $ 51,092 $ 45,414
efficiency ratioaverage loansaverage deposits
77.8 $11,688,722
$ 8,580,912
% 78.3 $ 10,836,421 $ 7,881,703
% 78.7 $ 9,899,648 $ 7,460,949
%
retaIl&smeQuébec inCome from Continuing operations up
19%
realestate&commercIal net inCome up
43%
b2btrust Continued reVenue groWth of $24.3 million or
24%
otherimproVement in net interest margins
laurentIanbanksecurItIes&capItalmarketsstrong performanCe of the institutional fixed inCome diVision
23 laurentian banK 2010 annual report
management’s disCussion and analYsis
RETAIL & SME QuébEc
Financial HigHligHts 2010 Income from continuing operations up 19% Residential mortgage loan portfolio up 10% Commercial loan portfolio up 9% Average deposits up 9% Revenues up $27.6 million or 6%
OverviewThe Retail & SME business segment provides banking products and services to retail customers as well as to small and medium sized enterprises in Québec. With its network of 157 branches, 23 commercial banking centres and 413 automated banking machines, it operates the third largest retail branch network in Québec.
Key accOmplisHments Diversified revenue streams Rolled out a customer relationship management tool (CRM), in all branches
Expanded mobile banking teams and increased the presence of Financial Planners in all branches
Furthered the niche strategy by broadening specialist teams to serve the Québec SME market
priOrities FOr 2011 Maximize benefits of the customer relationship management system for customers and the Bank
Increase our share of wallet per customer Pursue the evolution of the three distribution channels: branches, mobile and virtual
Continue building specialist teams to serve the Québec SME market
Improve operational efficiency through end-to-end process streamlining
The Retail & SME Québec business segment had a great year, with income from continuing operations improving 19% to $47.0 million, compared to $39.6 million for 2009. Net income for 2009 was $51.1 million and included income from discontinued operations of $11.5 million related to the sale of asset management activities in fiscal 2005. Revenues improved by 6% or $27.6 million, from $425.9 million in 2009 to $453.5 million in 2010, as a result of the significant growth in loan and deposit volumes stemming from various growth initiatives and favourable market conditions, as well as higher prepayment penalties on mortgage loans. Credit insurance revenues, income from mutual funds and credit card service revenues all improved year-over-year. Non-interest expenses also increased by 6%, or $19.1 million, from $333.5 million in 2009 to $352.6 million in 2010, essentially due to increased salaries. Loan losses decreased slightly to $40.9 million in 2010 from $41.9 million in 2009, as a result of lower losses on the point-of-sale financing portfolio, partially offset by higher losses in the small commercial business portfolio. Retail credit conditions have steadily improved over the last 18 months and remain sound at the onset of 2011.
table 4
segment cOntributiOn2010 2009 2008
Net interest incomeOther income
$ 323,740 129,774
$ 305,959 119,965
$ 299,336 115,894
Total revenueProvision for loan lossesNon-interest expenses
453,514 40,919
352,621
425,924 41,887
333,475
415,230 33,583
326,871
Income from continuing operations before income taxesIncome taxes
59,974 12,961
50,562 10,939
54,776 13,785
Income from continuing operationsIncome from discontinued operations, net of income taxes
47,013
–
39,623
11,469
40,991
4,423
Net income $ 47,013 $ 51,092 $ 45,414
Efficiency ratioAverage loansAverage deposits
77.8 $11,688,722
$ 8,580,912
% 78.3 $ 10,836,421 $ 7,881,703
% 78.7 $ 9,899,648 $ 7,460,949
%
BuSINESS SEgMENTS FOr ThE yEArs ENdEd OcTObEr 31 (IN ThOusANds OF dOllArs, ExcEPT PErcENTAgE AmOuNTs)
RETAIL & SME QuébEc INCoME FRoM CoNTINuINg oPERATIoNS uP
19%
REAL ESTATE & cOMMERcIAL NET INCoME uP
43%
b2b TRuST CoNTINuED REvENuE gRoWTh oF $24.3 MILLIoN oR
24%
OThERIMPRovEMENT IN NET INTEREST MARgINS
LAuRENTIAN bANK SEcuRITIES & cAPITAL MARKETSSTRoNg PERFoRMANCE oF ThE INSTITuTIoNAL FIxED INCoME DIvISIoN
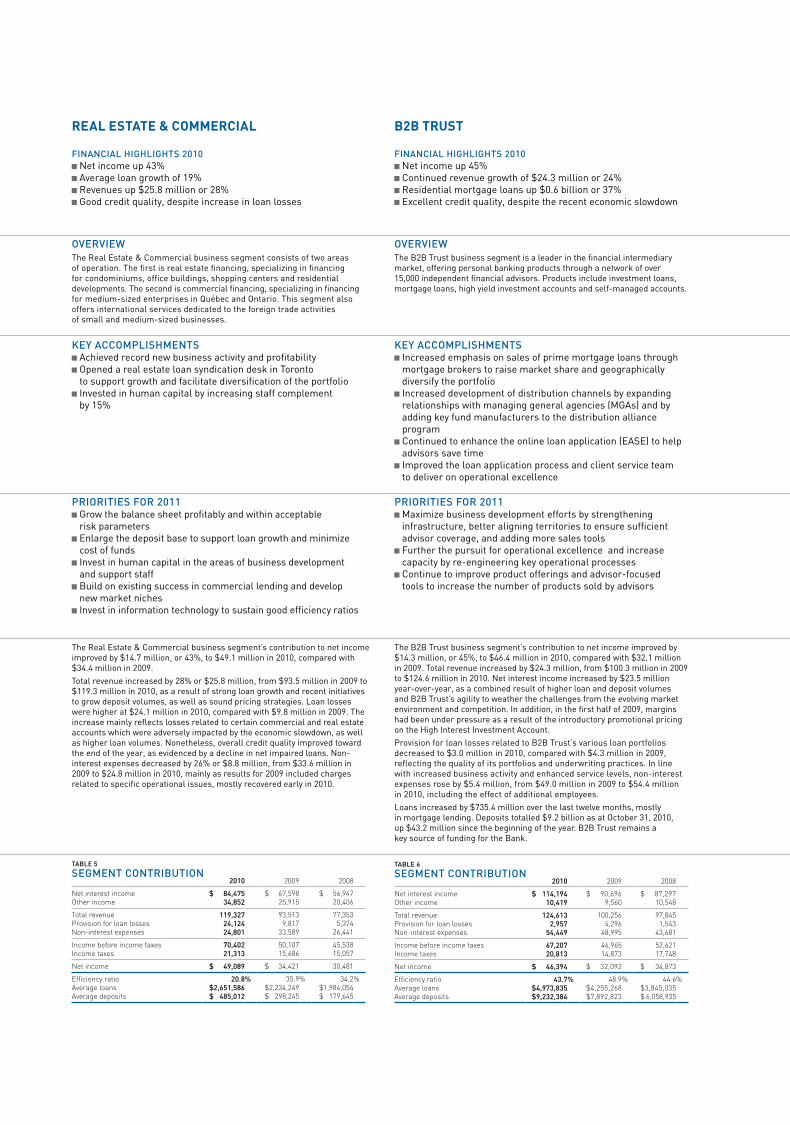
REAL ESTATE & cOMMERcIAL
Financial HigHligHts 2010 Net income up 43% Average loan growth of 19% Revenues up $25.8 million or 28% good credit quality, despite increase in loan losses
OverviewThe Real Estate & Commercial business segment consists of two areas of operation. The first is real estate financing, specializing in financing for condominiums, office buildings, shopping centers and residential developments. The second is commercial financing, specializing in financing for medium-sized enterprises in Québec and ontario. This segment also offers international services dedicated to the foreign trade activities of small and medium-sized businesses.
Key accOmplisHments Achieved record new business activity and profitability opened a real estate loan syndication desk in Toronto to support growth and facilitate diversification of the portfolio Invested in human capital by increasing staff complement by 15%
priOrities FOr 2011 grow the balance sheet profitably and within acceptable risk parameters Enlarge the deposit base to support loan growth and minimize cost of funds Invest in human capital in the areas of business development and support staff Build on existing success in commercial lending and develop new market niches Invest in information technology to sustain good efficiency ratios
The Real Estate & Commercial business segment’s contribution to net income improved by $14.7 million, or 43%, to $49.1 million in 2010, compared with $34.4 million in 2009. Total revenue increased by 28% or $25.8 million, from $93.5 million in 2009 to $119.3 million in 2010, as a result of strong loan growth and recent initiatives to grow deposit volumes, as well as sound pricing strategies. Loan losses were higher at $24.1 million in 2010, compared with $9.8 million in 2009. The increase mainly reflects losses related to certain commercial and real estate accounts which were adversely impacted by the economic slowdown, as well as higher loan volumes. Nonetheless, overall credit quality improved toward the end of the year, as evidenced by a decline in net impaired loans. Non-interest expenses decreased by 26% or $8.8 million, from $33.6 million in 2009 to $24.8 million in 2010, mainly as results for 2009 included charges related to specific operational issues, mostly recovered early in 2010.
table 5
segment cOntributiOn2010 2009 2008
Net interest incomeOther income
$ 84,475 34,852
$ 67,598 25,915
$ 56,947 20,406
Total revenueProvision for loan lossesNon-interest expenses
119,327 24,124 24,801
93,513 9,817
33,589
77,353 5,374
26,441
Income before income taxes Income taxes
70,402 21,313
50,107 15,686
45,538 15,057
Net income $ 49,089 $ 34,421 30,481
Efficiency ratioAverage loansAverage deposits
20.8 $2,651,586 $ 485,012
% 35.9 $2,234,249 $ 298,245
% 34.2 $1,984,054 $ 179,645
%
b2b TRuST
Financial HigHligHts 2010 Net income up 45% Continued revenue growth of $24.3 million or 24% Residential mortgage loans up $0.6 billion or 37% Excellent credit quality, despite the recent economic slowdown
OverviewThe B2B Trust business segment is a leader in the financial intermediary market, offering personal banking products through a network of over 15,000 independent financial advisors. Products include investment loans, mortgage loans, high yield investment accounts and self-managed accounts.
Key accOmplisHments Increased emphasis on sales of prime mortgage loans through mortgage brokers to raise market share and geographically diversify the portfolio
Increased development of distribution channels by expanding relationships with managing general agencies (MgAs) and by adding key fund manufacturers to the distribution alliance program Continued to enhance the online loan application (EASE) to help advisors save time
Improved the loan application process and client service team to deliver on operational excellence
priOrities FOr 2011 Maximize business development efforts by strengthening infrastructure, better aligning territories to ensure sufficient advisor coverage, and adding more sales tools
Further the pursuit for operational excellence and increase capacity by re-engineering key operational processes
Continue to improve product offerings and advisor-focused tools to increase the number of products sold by advisors
The B2B Trust business segment’s contribution to net income improved by $14.3 million, or 45%, to $46.4 million in 2010, compared with $32.1 million in 2009. Total revenue increased by $24.3 million, from $100.3 million in 2009 to $124.6 million in 2010. Net interest income increased by $23.5 million year-over-year, as a combined result of higher loan and deposit volumes and B2B Trust’s agility to weather the challenges from the evolving market environment and competition. In addition, in the first half of 2009, margins had been under pressure as a result of the introductory promotional pricing on the high Interest Investment Account.Provision for loan losses related to B2B Trust’s various loan portfolios decreased to $3.0 million in 2010, compared with $4.3 million in 2009, reflecting the quality of its portfolios and underwriting practices. In line with increased business activity and enhanced service levels, non-interest expenses rose by $5.4 million, from $49.0 million in 2009 to $54.4 million in 2010, including the effect of additional employees.Loans increased by $735.4 million over the last twelve months, mostly in mortgage lending. Deposits totalled $9.2 billion as at october 31, 2010, up $43.2 million since the beginning of the year. B2B Trust remains a key source of funding for the Bank.
table 6
segment cOntributiOn2010 2009 2008
Net interest incomeOther income
$ 114,194 10,419
$ 90,696 9,560
$ 87,297 10,548
Total revenueProvision for loan lossesNon-interest expenses
124,613 2,957
54,449
100,256 4,296
48,995
97,845 1,543
43,681
Income before income taxes Income taxes
67,207 20,813
46,965 14,873
52,621 17,748
Net income $ 46,394 $ 32,092 $ 34,873
Efficiency ratioAverage loansAverage deposits
43.7 $4,973,835 $9,232,384
% 48.9 $4,255,268 $7,892,823
% 44.6 $3,845,035 $ 6,058,935
%
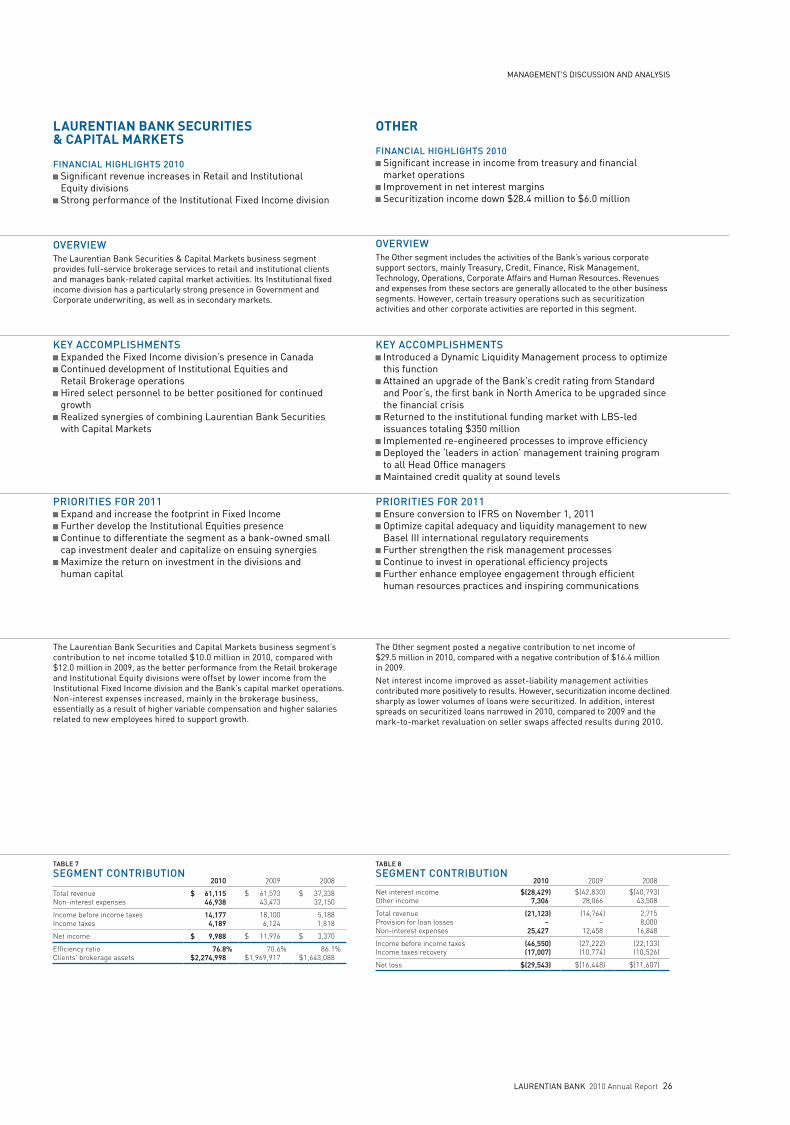
MANAgEMENT’S DISCuSSIoN AND ANALYSIS
LAuRENTIAN bANK SEcuRITIES & cAPITAL MARKETS
Financial HigHligHts 2010 Significant revenue increases in Retail and Institutional Equity divisions Strong performance of the Institutional Fixed Income division
OverviewThe Laurentian Bank Securities & Capital Markets business segment provides full-service brokerage services to retail and institutional clients and manages bank-related capital market activities. Its Institutional fixed income division has a particularly strong presence in government and Corporate underwriting, as well as in secondary markets.
Key accOmplisHments Expanded the Fixed Income division’s presence in Canada Continued development of Institutional Equities and Retail Brokerage operations hired select personnel to be better positioned for continued growth Realized synergies of combining Laurentian Bank Securities with Capital Markets
priOrities FOr 2011 Expand and increase the footprint in Fixed Income Further develop the Institutional Equities presence Continue to differentiate the segment as a bank-owned small cap investment dealer and capitalize on ensuing synergies Maximize the return on investment in the divisions and human capital
The Laurentian Bank Securities and Capital Markets business segment’s contribution to net income totalled $10.0 million in 2010, compared with $12.0 million in 2009, as the better performance from the Retail brokerage and Institutional Equity divisions were offset by lower income from the Institutional Fixed Income division and the Bank’s capital market operations. Non-interest expenses increased, mainly in the brokerage business, essentially as a result of higher variable compensation and higher salaries related to new employees hired to support growth.
table 7
segment cOntributiOn2010 2009 2008
Total revenueNon-interest expenses
$ 61,115 46,938
$ 61,573 43,473
$ 37,338 32,150
Income before income taxes Income taxes
14,177 4,189
18,100 6,124
5,188 1,818
Net income $ 9,988 $ 11,976 $ 3,370
Efficiency ratioclients' brokerage assets
76.8 $2,274,998
% 70.6 $1,969,917
% 86.1 $1,643,088
%
OThER
Financial HigHligHts 2010 Significant increase in income from treasury and financial market operations
Improvement in net interest margins Securitization income down $28.4 million to $6.0 million
OverviewThe other segment includes the activities of the Bank’s various corporate support sectors, mainly Treasury, Credit, Finance, Risk Management, Technology, operations, Corporate Affairs and human Resources. Revenues and expenses from these sectors are generally allocated to the other business segments. however, certain treasury operations such as securitization activities and other corporate activities are reported in this segment.
Key accOmplisHments Introduced a Dynamic Liquidity Management process to optimize this function
Attained an upgrade of the Bank’s credit rating from Standard and Poor’s, the first bank in North America to be upgraded since the financial crisis
Returned to the institutional funding market with LBS-led issuances totaling $350 million
Implemented re-engineered processes to improve efficiency Deployed the ‘leaders in action’ management training program to all head office managers
Maintained credit quality at sound levels
priOrities FOr 2011 Ensure conversion to IFRS on November 1, 2011 optimize capital adequacy and liquidity management to new Basel III international regulatory requirements
Further strengthen the risk management processes Continue to invest in operational efficiency projects Further enhance employee engagement through efficient human resources practices and inspiring communications
The other segment posted a negative contribution to net income of $29.5 million in 2010, compared with a negative contribution of $16.4 million in 2009. Net interest income improved as asset-liability management activities contributed more positively to results. however, securitization income declined sharply as lower volumes of loans were securitized. In addition, interest spreads on securitized loans narrowed in 2010, compared to 2009 and the mark-to-market revaluation on seller swaps affected results during 2010.
table 8
segment cOntributiOn2010 2009 2008
Net interest incomeOther income
$(28,429 7,306
) $(42,830 28,066
) $(40,793 43,508
)
Total revenueProvision for loan lossesNon-interest expenses
(21,123 –
25,427
) (14,764 –
12,458
) 2,715 8,000
16,848
Income before income taxes Income taxes recovery
(46,550 (17,007
))
(27,222 (10,774
))
(22,133 (10,526
))
Net loss $(29,543 ) $(16,448) $(11,607)
LAuRENTIAN BANK 2010 Annual report 26
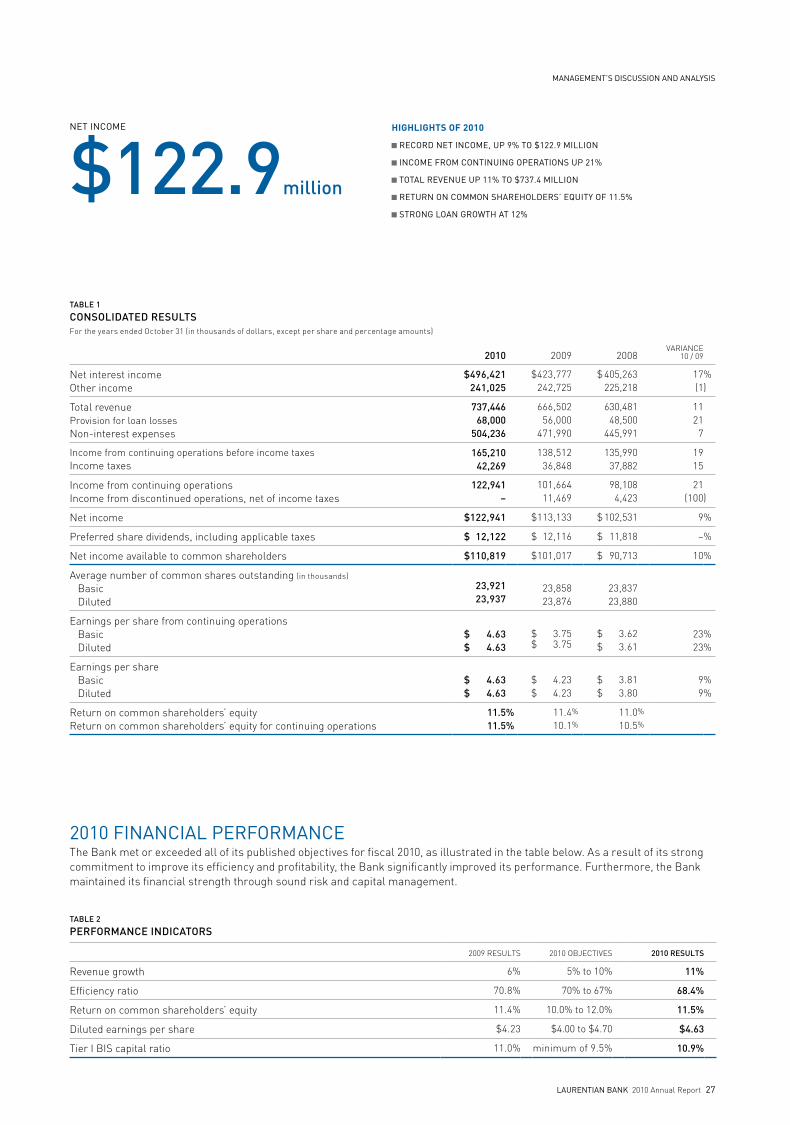
28 laurentian banK 2010 Annual Report
ManaGeMent’S DiSCuSSiOn anD analYSiS
the relatively weak domestic demand in the U.S. will hinder the growth of exports. Elsewhere globally, particularly in Asia, economic growth should remain quite strong, thereby exerting upward pressure on the price of raw materials and, indirectly, on the Canadian dollar. Lastly, the risk of global financial instability remains high due to concerns over the public debt of the euro zone’s peripheral countries, the current account imbalances among the large trading blocs (USD-EUR-JPY-CNY), and the less than traditional monetary policies of the U.S. and Japan.
Despite a reduced contribution from households and governments in 2011, and the risk of financial instability, the Bank does not believe that the Canadian economy is at risk of falling back into a recession. Other factors are expected to improve, contributing thereby to support economic growth to a larger degree. Specifically, Canadian businesses, particularly in industries exporting outside North America, well profitable as a whole, are in a good position to stimulate private investments and thereby support job creation.
All things considered, economic growth (real GDP) in Canada should reach 2.5% in 2011 and 2012, which should bring about a very slight reduction in the unemployment rate (from 8% in the fourth quarter of 2010 to 7.8% in 2011 and 7.6% in 2012) and in Québec (from 7.9% to 7.8% and 7.7% respectively). From June to September 2010, the Bank of Canada increased its key interest rate three times, in 25 basis points tranches, to 1.00%. Presently, a pause, lasting 6 to 9 months at least, is expected, given the cooling of the economic outlook, particularly in the United States. The situation in the U.S. presents so many difficulties that, in November 2010, the Federal Reserve initiated a new quantitative easing program (QE2) to ward off a deflationary spiral. In general, short- and medium-term interest rates should remain very low throughout most of 2011. Interest rates should return to normal levels only in 2012, depending on the outcome of QE2.
In Québec, as in Canada, 2011 will be a more complex year. The economic recovery will slow down in part due to the higher taxes and tariffs announced at both the provincial and municipal levels.
ECONOMIC OUTLOOK: AN UNEVEN AND FRAGILE RECOVERY
In June 2009, the “Great Recession” came to an end in the United States according to the National Bureau of Economic Research. In all likelihood, the recession also came to an end in Canada at around the same time. Normally, a strong recovery should therefore be in progress. That is not the case however. The least that can be said is that, less than a year after it started, the economic recovery in North America is slowing down. For the United States, which remains Canada’s foremost commercial partner, the risk of falling back into a recession is even relatively significant.
The Bank considers that a double-dip recession and deflation in the U.S., while possible, is still quite unlikely, mostly because the Federal Reserve would not “allow” it, meaning that successive waves of quantitative easing would be launched. However, economic growth should not exceed 2% to 2.5% in 2011 and 2012, which is clearly not sufficient to lower unemployment in any significant way. In Canada, the direct implication of this situation is that U.S. domestic demand will remain very weak for at least two years. The Canadian economy is thus entering a transition period under ongoing difficult external conditions.
As for domestic demand, the Bank notes that, during 2009 and 2010, households have reacted well to expansionist policies, thus rapidly reviving economic activities. Extremely low interest rates have encouraged Canadians to increase their use of credit, as opposed to income, to finance their expenses, which contributed to a marked increase of their indebtedness in proportion to their disposable income. It does not come as a surprise therefore that consumer credit, in proportion to consumption expenditures, has increased during the recession, which is unusual.
In the future, the contribution of households to the economic recovery is bound to decrease, considering that their level of indebtedness is rather high, that interest levels will not remain at such a low level and that the value of assets will not increase as rapidly, as was the case in 2010. Moreover,
ManaGeMent’S DiSCuSSiOn anD analYSiS
laurentian banK 2010 Annual Report 27
-2.5
0.0
2.5
5.0
7.5
10.0
12.5
CREDIT GROWTH IN CANADA (Year over year change in %)
HOUSEHOLD CREDIT
BUSINESS CREDIT
20062005 2007 2008 2009 2010 2011
Source: Bank of Canada/Haver Analytics
-2.5
0.0
2.5
5.0
7.5
10.0
12.5
CREDIT GROWTH IN CANADA (Credit growth in Canada)
HOUSEHOLD CREDIT
BUSINESS CREDIT
2006 2007 2008 2009 2010 2011
Source: Bank of Canada/Haver Analytics
UNEMPLOYMENT RATES (as a percentage)
Source: Statistics Canada/Haver Analytics
2001 2003 2005 2007 2009 2011CANADA
QUÉBEC
ONTARIO
5
6
7
8
9
10
HIGHLIGHTS OF 2010
reCOrD net inCOMe, up 9% tO $122.9 MilliOn
inCOMe frOM COntinuinG OperatiOnS up 21%
tOtal revenue up 11% tO $737.4 MilliOn
return On COMMOn SharehOlDerS’ equitY Of 11.5%
StrOnG lOan GrOwth at 12%
net inCOMe
$122.9 million
TAbLE 1
CONSOLIDATED RESULTSFor the years ended October 31 (in thousands of dollars, except per share and percentage amounts)
2010 2009 2008 VARIANCE
10 / 09
Net interest incomeOther income
$496,421 241,025
$423,777 242,725
$ 405,263 225,218
17 (1
%)
Total revenueProvision for loan lossesNon-interest expenses
737,446 68,000
504,236
666,502 56,000
471,990
630,481 48,500
445,991
11 21
7
Income from continuing operations before income taxes Income taxes
165,210 42,269
138,512 36,848
135,990 37,882
19 15
Income from continuing operationsIncome from discontinued operations, net of income taxes
122,941 –
101,664 11,469
98,108 4,423
21 (100)
Net income $122,941 $113,133 $ 102,531 9%
Preferred share dividends, including applicable taxes $ 12,122 $ 12,116 $ 11,818 –%
Net income available to common shareholders $110,819 $101,017 $ 90,713 10%
Average number of common shares outstanding (in thousands)
Basic Diluted
23,921 23,937
23,858 23,876
23,837 23,880
Earnings per share from continuing operations Basic Diluted
$ 4.63 $ 4.63
$ 3.75 $ 3.75
$ 3.62 $ 3.61
2323
%%
Earnings per share Basic Diluted
$ 4.63 $ 4.63
$ 4.23 $ 4.23
$ 3.81 $ 3.80
99
%%
Return on common shareholders’ equityReturn on common shareholders’ equity for continuing operations
11.5 11.5
%%
11.4 10.1
%
% 11.0 10.5
%
%
2010 finanCial perfOrManCeThe Bank met or exceeded all of its published objectives for fiscal 2010, as illustrated in the table below. As a result of its strong commitment to improve its efficiency and profitability, the Bank significantly improved its performance. Furthermore, the Bank maintained its financial strength through sound risk and capital management.
TAbLE 2
PERFORMANCE INDICATORS
2009 RESULTS 2010 OBJECTIVES 2010 RESULTS
Revenue growth 6% 5% to 10% 11%
Efficiency ratio 70.8% 70% to 67% 68.4%
Return on common shareholders’ equity 11.4% 10.0% to 12.0% 11.5%
Diluted earnings per share $4.23 $4.00 to $4.70 $4.63
Tier I BIS capital ratio 11.0% minimum of 9.5% 10.9%
OutlOOK anD ObJeCtiveS fOr 2011
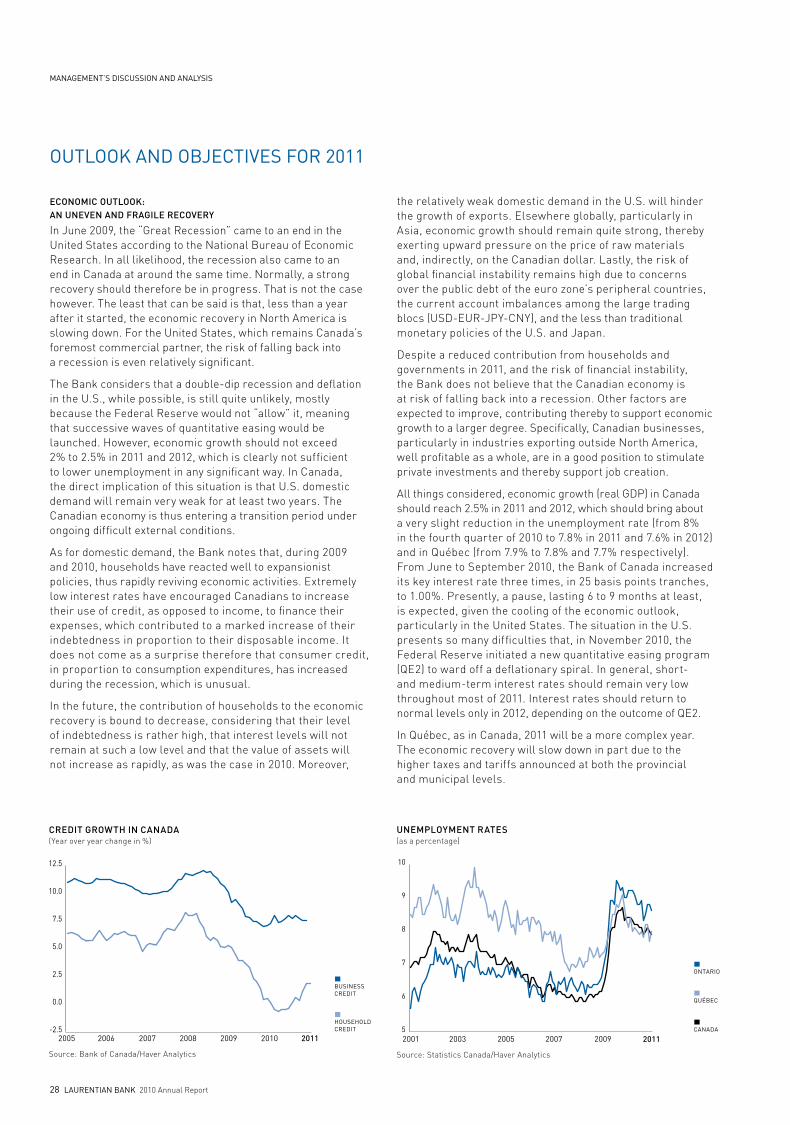
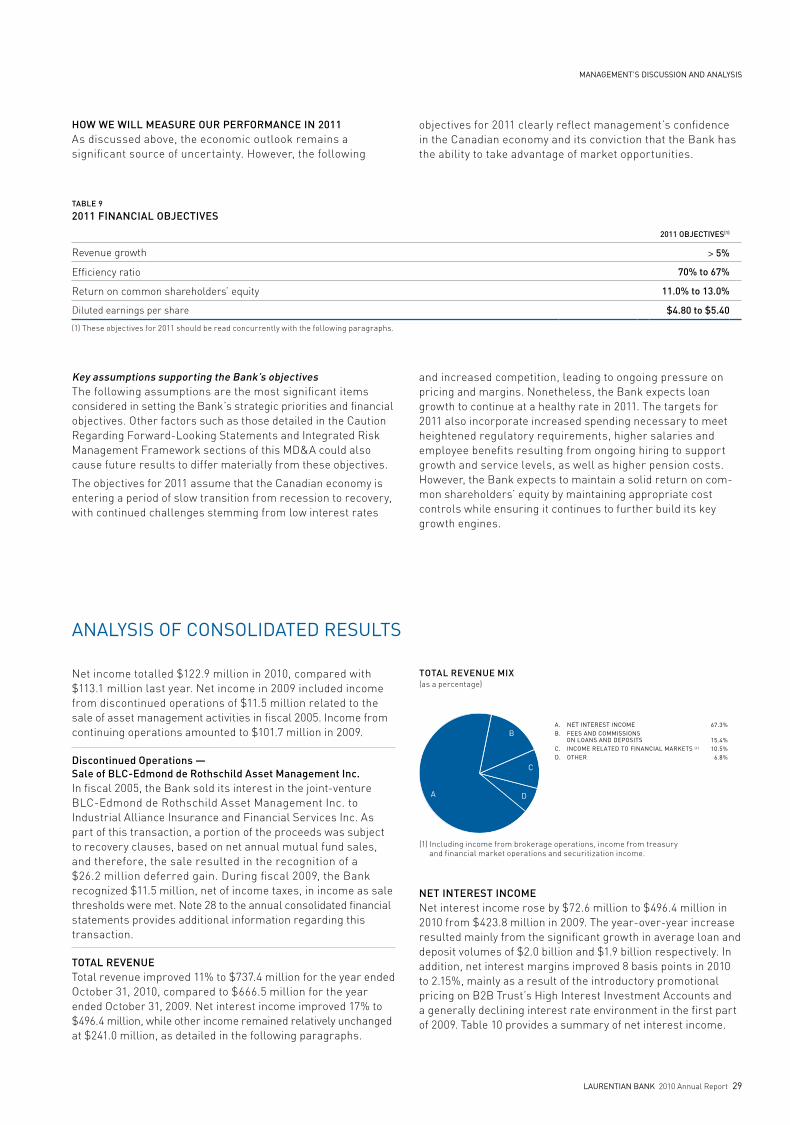
management’s discussion and analysis
laurentian banK 2010 Annual Report 29
Key assumptions supporting the Bank’s objectivesThe following assumptions are the most significant items considered in setting the Bank’s strategic priorities and financial objectives. Other factors such as those detailed in the Caution Regarding Forward-Looking Statements and Integrated Risk Management Framework sections of this MD&A could also cause future results to differ materially from these objectives.
The objectives for 2011 assume that the Canadian economy is entering a period of slow transition from recession to recovery, with continued challenges stemming from low interest rates
and increased competition, leading to ongoing pressure on pricing and margins. Nonetheless, the Bank expects loan growth to continue at a healthy rate in 2011. The targets for 2011 also incorporate increased spending necessary to meet heightened regulatory requirements, higher salaries and employee benefits resulting from ongoing hiring to support growth and service levels, as well as higher pension costs. However, the Bank expects to maintain a solid return on com-mon shareholders’ equity by maintaining appropriate cost controls while ensuring it continues to further build its key growth engines.
Net income totalled $122.9 million in 2010, compared with $113.1 million last year. Net income in 2009 included income from discontinued operations of $11.5 million related to the sale of asset management activities in fiscal 2005. Income from continuing operations amounted to $101.7 million in 2009.
Discontinued Operations — Sale of BLC-Edmond de Rothschild Asset Management Inc.In fiscal 2005, the Bank sold its interest in the joint-venture BLC-Edmond de Rothschild Asset Management Inc. to Industrial Alliance Insurance and Financial Services Inc. As part of this transaction, a portion of the proceeds was subject to recovery clauses, based on net annual mutual fund sales, and therefore, the sale resulted in the recognition of a $26.2 million deferred gain. During fiscal 2009, the Bank recognized $11.5 million, net of income taxes, in income as sale thresholds were met. Note 28 to the annual consolidated financial statements provides additional information regarding this transaction.
TOTAL REvEnuETotal revenue improved 11% to $737.4 million for the year ended October 31, 2010, compared to $666.5 million for the year ended October 31, 2009. Net interest income improved 17% to $496.4 million, while other income remained relatively unchanged at $241.0 million, as detailed in the following paragraphs.
A. NET INTEREST INCOME B. FEES AND COMMISSIONS ON LOANS AND DEPOSITS C. INCOME RELATED TO FINANCIAL MARKETS (1) D. OTHER
A
B
TOTAL REVENUE MIX(as a percentage)
(1) Including income from brokerage operations, income from treasury and financial market operations and securitization income.
C
D
67.3%
15.4%10.5%
6.8%
nET InTEREST InCOMENet interest income rose by $72.6 million to $496.4 million in 2010 from $423.8 million in 2009. The year-over-year increase resulted mainly from the significant growth in average loan and deposit volumes of $2.0 billion and $1.9 billion respectively. In addition, net interest margins improved 8 basis points in 2010 to 2.15%, mainly as a result of the introductory promotional pricing on B2B Trust’s High Interest Investment Accounts and a generally declining interest rate environment in the first part of 2009. Table 10 provides a summary of net interest income.
analysis oF consolidated results
HOW WE WILL MEASuRE OuR PERFORMAnCE In 2011As discussed above, the economic outlook remains a significant source of uncertainty. However, the following
objectives for 2011 clearly reflect management’s confidence in the Canadian economy and its conviction that the Bank has the ability to take advantage of market opportunities.
TABLE 9
2011 FInAnCIAL OBJECTIvES
2011 OBJECTIvES(1)
Revenue growth > 5%
Efficiency ratio 70% to 67%
Return on common shareholders’ equity 11.0% to 13.0%
Diluted earnings per share $4.80 to $5.40
(1) These objectives for 2011 should be read concurrently with the following paragraphs.
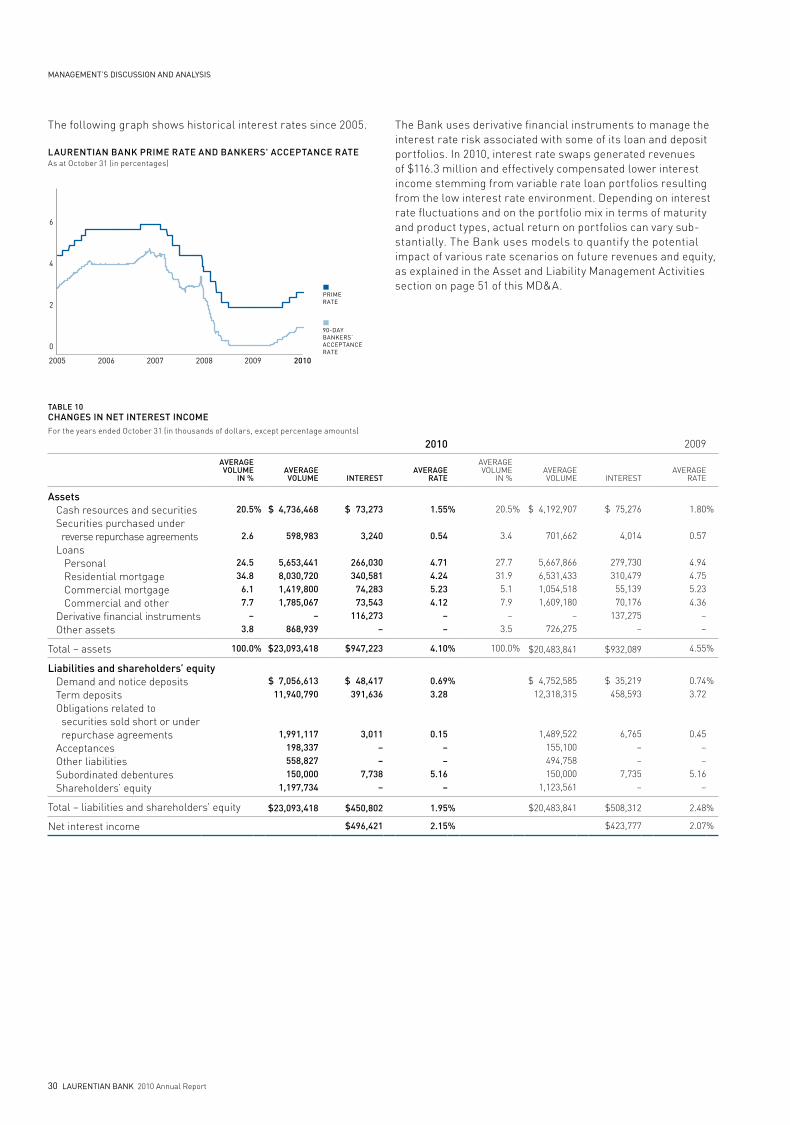
30 laurentian banK 2010 Annual Report
management’s discussion and analysis
The following graph shows historical interest rates since 2005.
0
2
4
6
LAURENTIAN BANK PRIME RATE AND BANKERS' ACCEPTANCE RATEAs at October 31 (in percentages)
90-DAYBANKERS’ACCEPTANCE RATE
PRIMERATE
20062005 2007 2008 2009 2010
The Bank uses derivative financial instruments to manage the interest rate risk associated with some of its loan and deposit portfolios. In 2010, interest rate swaps generated revenues of $116.3 million and effectively compensated lower interest income stemming from variable rate loan portfolios resulting from the low interest rate environment. Depending on interest rate fluctuations and on the portfolio mix in terms of maturity and product types, actual return on portfolios can vary sub-stantially. The Bank uses models to quantify the potential impact of various rate scenarios on future revenues and equity, as explained in the Asset and Liability Management Activities section on page 51 of this MD&A.
TABLE 10CHAnGES In nET InTEREST InCOMEFor the years ended October 31 (in thousands of dollars, except percentage amounts)
2010 2009
AvERAGEvOLuME
In %AvERAGEvOLuME InTEREST
AvERAGE RATE
AvERAgEvOLuME
IN %AvERAgEvOLuME INTEREST
AvERAgE RATE
Assets Cash resources and securities Securities purchased under reverse repurchase agreements Loans Personal Residential mortgage Commercial mortgage Commercial and other Derivative financial instruments Other assets
20.5
2.6
24.5 34.8
6.1 7.7
– 3.8
% $ 4,736,468
598,983
5,653,441 8,030,720 1,419,800 1,785,067
– 868,939
$ 73,273
3,240
266,030 340,581
74,283 73,543
116,273 –
1.55
0.54
4.71 4.24 5.23 4.12
– –
%
20.5
3.4
27.7 31.9
5.1 7.9
– 3.5
%
$ 4,192,907
701,662
5,667,866 6,531,433 1,054,518 1,609,180
– 726,275
$ 75,276
4,014
279,730 310,479
55,139 70,176
137,275 –
1.80
0.57
4.94 4.75 5.23 4.36
– –
%
Total – assets 100.0% $23,093,418 $947,223 4.10% 100.0 % $20,483,841 $ 932,089 4.55 %
Liabilities and shareholders’ equity Demand and notice deposits Term deposits Obligations related to securities sold short or under repurchase agreements Acceptances Other liabilities Subordinated debentures Shareholders’ equity
$ 7,056,613 11,940,790
1,991,117 198,337 558,827 150,000
1,197,734
$ 48,417 391,636
3,011 – –
7,738 –
0.69 3.28
0.15 – –
5.16 –
%
$ 4,752,585 12,318,315
1,489,522 155,100 494,758 150,000
1,123,561
$ 35,219
458,593
6,765 – –
7,735 –
0.74 3.72
0.45 – –
5.16 –
%
Total – liabilities and shareholders’ equity $23,093,418 $450,802 1.95 % $20,483,841 $508,312 2.48 %
Net interest income $496,421 2.15 % $423,777 2.07 %
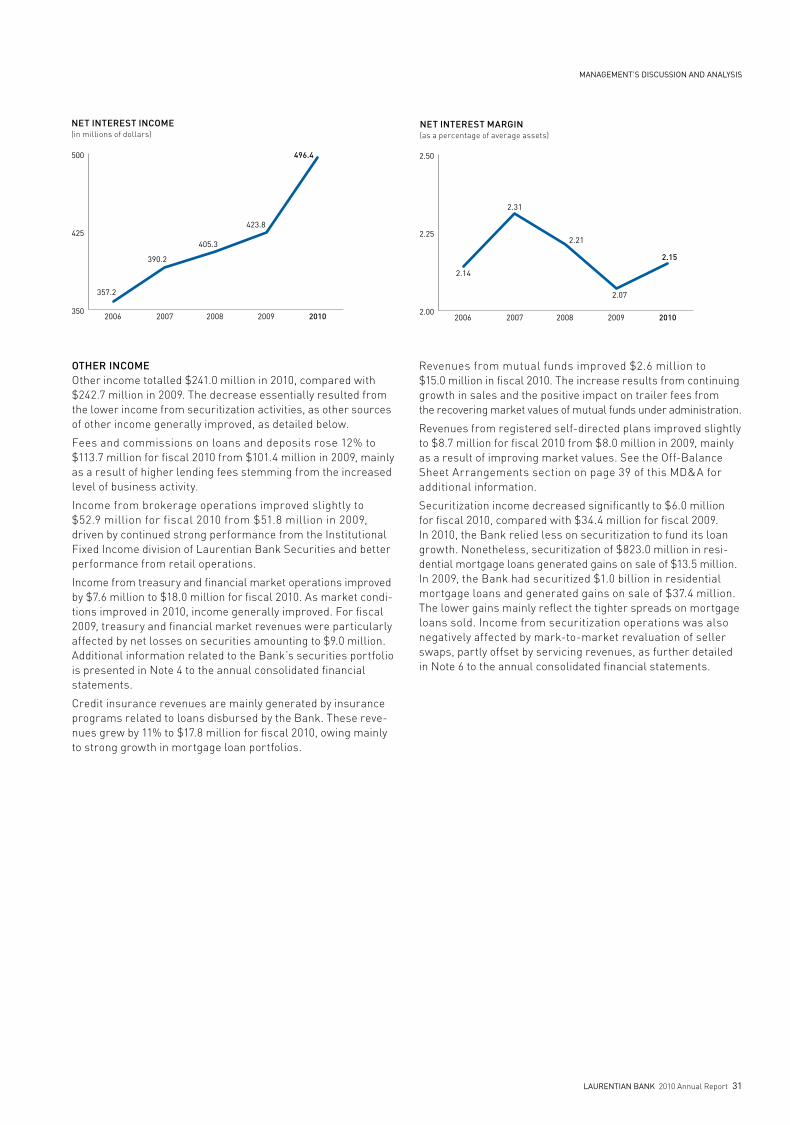
management’s discussion and analysis
laurentian banK 2010 Annual Report 31
OTHER InCOMEOther income totalled $241.0 million in 2010, compared with $242.7 million in 2009. The decrease essentially resulted from the lower income from securitization activities, as other sources of other income generally improved, as detailed below.
Fees and commissions on loans and deposits rose 12% to $113.7 million for fiscal 2010 from $101.4 million in 2009, mainly as a result of higher lending fees stemming from the increased level of business activity.
Income from brokerage operations improved slightly to $52.9 million for fiscal 2010 from $51.8 million in 2009, driven by continued strong performance from the Institutional Fixed Income division of Laurentian Bank Securities and better performance from retail operations.
Income from treasury and financial market operations improved by $7.6 million to $18.0 million for fiscal 2010. As market condi-tions improved in 2010, income generally improved. For fiscal 2009, treasury and financial market revenues were particularly affected by net losses on securities amounting to $9.0 million.Additional information related to the Bank’s securities portfolio is presented in Note 4 to the annual consolidated financial statements.
Credit insurance revenues are mainly generated by insurance programs related to loans disbursed by the Bank. These reve-nues grew by 11% to $17.8 million for fiscal 2010, owing mainly to strong growth in mortgage loan portfolios.
Revenues from mutual funds improved $2.6 million to $15.0 million in fiscal 2010. The increase results from continuing growth in sales and the positive impact on trailer fees from the recovering market values of mutual funds under administration.
Revenues from registered self-directed plans improved slightly to $8.7 million for fiscal 2010 from $8.0 million in 2009, mainly as a result of improving market values. See the Off-Balance Sheet Arrangements section on page 39 of this MD&A for additional information.
Securitization income decreased significantly to $6.0 million for fiscal 2010, compared with $34.4 million for fiscal 2009. In 2010, the Bank relied less on securitization to fund its loan growth. Nonetheless, securitization of $823.0 million in resi-dential mortgage loans generated gains on sale of $13.5 million. In 2009, the Bank had securitized $1.0 billion in residential mortgage loans and generated gains on sale of $37.4 million. The lower gains mainly reflect the tighter spreads on mortgage loans sold. Income from securitization operations was also negatively affected by mark-to-market revaluation of seller swaps, partly offset by servicing revenues, as further detailed in Note 6 to the annual consolidated financial statements.
NET INTEREST INCOME(in millions of dollars)
2006 2007 2008 2009 2010350
425
500
357.2
390.2
405.3
423.8
496.4
2.14
2.21
2.07
2.15
2.31
NET INTEREST MARGIN(as a percentage of average assets)
2006 2007 2008 2009 20102.00
2.25
2.50
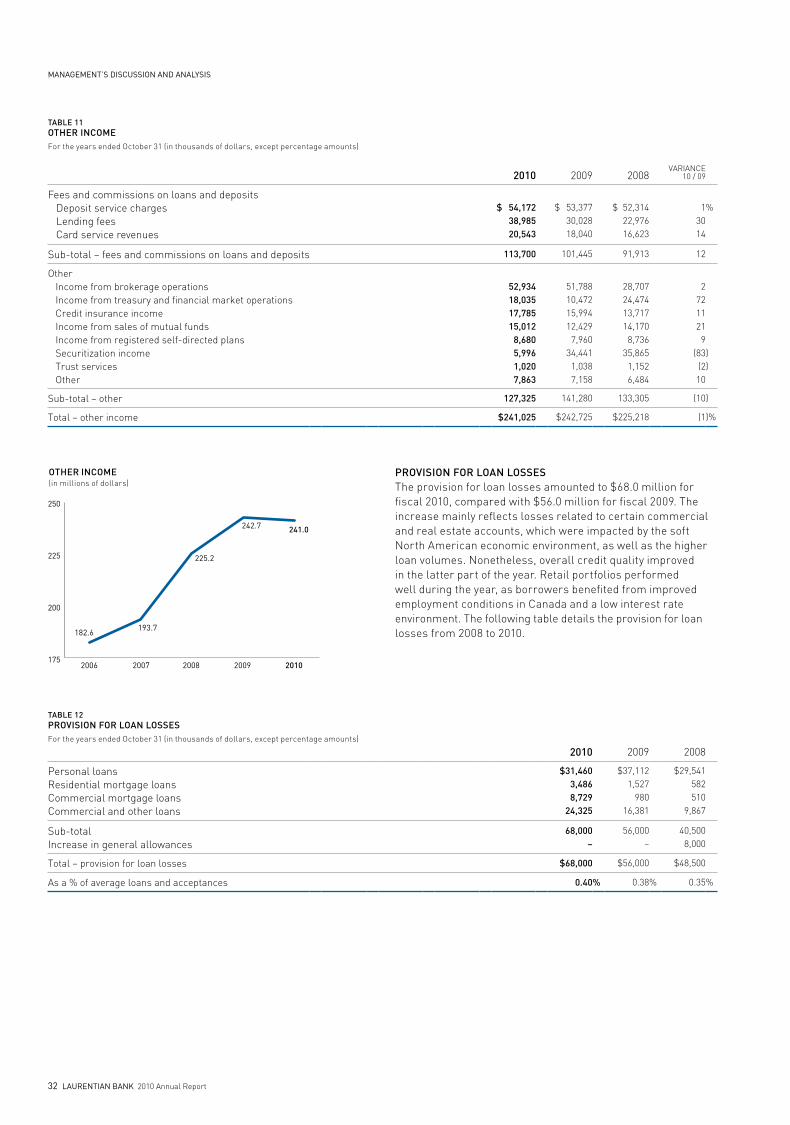
32 laurentian banK 2010 Annual Report
management’s discussion and analysis
TABLE 11OTHER InCOMEFor the years ended October 31 (in thousands of dollars, except percentage amounts)
2010 2009 2008vARIANCE
10 / 09
Fees and commissions on loans and deposits Deposit service charges Lending fees Card service revenues
$ 54,172
38,985 20,543
$ 53,377 30,028 18,040
$ 52,314
22,976 16,623
1
30 14
%
Sub-total – fees and commissions on loans and deposits 113,700 101,445 91,913 12
Other Income from brokerage operations Income from treasury and financial market operations Credit insurance income Income from sales of mutual funds Income from registered self-directed plans Securitization income Trust services Other
52,934 18,035 17,785 15,012
8,680 5,996 1,020 7,863
51,788 10,472 15,994 12,429
7,960 34,441
1,038 7,158
28,707 24,474 13,717 14,170 8,736
35,865 1,152 6,484
2 72 11 21
9 (83
(2 10
))
Sub-total – other 127,325 141,280 133,305 (10)
Total – other income $241,025 $242,725 $225,218 (1)%
182.6
225.2
242.7
193.7
241.0
OTHER INCOME(in millions of dollars)
2006 2007 2008 2009 2010175
200
225
250
PROvISIOn FOR LOAn LOSSESThe provision for loan losses amounted to $68.0 million for fiscal 2010, compared with $56.0 million for fiscal 2009. The increase mainly reflects losses related to certain commercial and real estate accounts, which were impacted by the soft North American economic environment, as well as the higher loan volumes. Nonetheless, overall credit quality improved in the latter part of the year. Retail portfolios performed well during the year, as borrowers benefited from improved employment conditions in Canada and a low interest rate environment. The following table details the provision for loan losses from 2008 to 2010.
TABLE 12PROvISIOn FOR LOAn LOSSES For the years ended October 31 (in thousands of dollars, except percentage amounts)
2010 2009 2008
Personal loansResidential mortgage loansCommercial mortgage loansCommercial and other loans
$31,460 3,486 8,729
24,325
$37,112 1,527
980 16,381
$29,541 582 510
9,867
Sub-totalIncrease in general allowances
68,000
–
56,000 –
40,500 8,000
Total – provision for loan losses $68,000 $56,000 $48,500
As a % of average loans and acceptances 0.40% 0.38% 0.35%
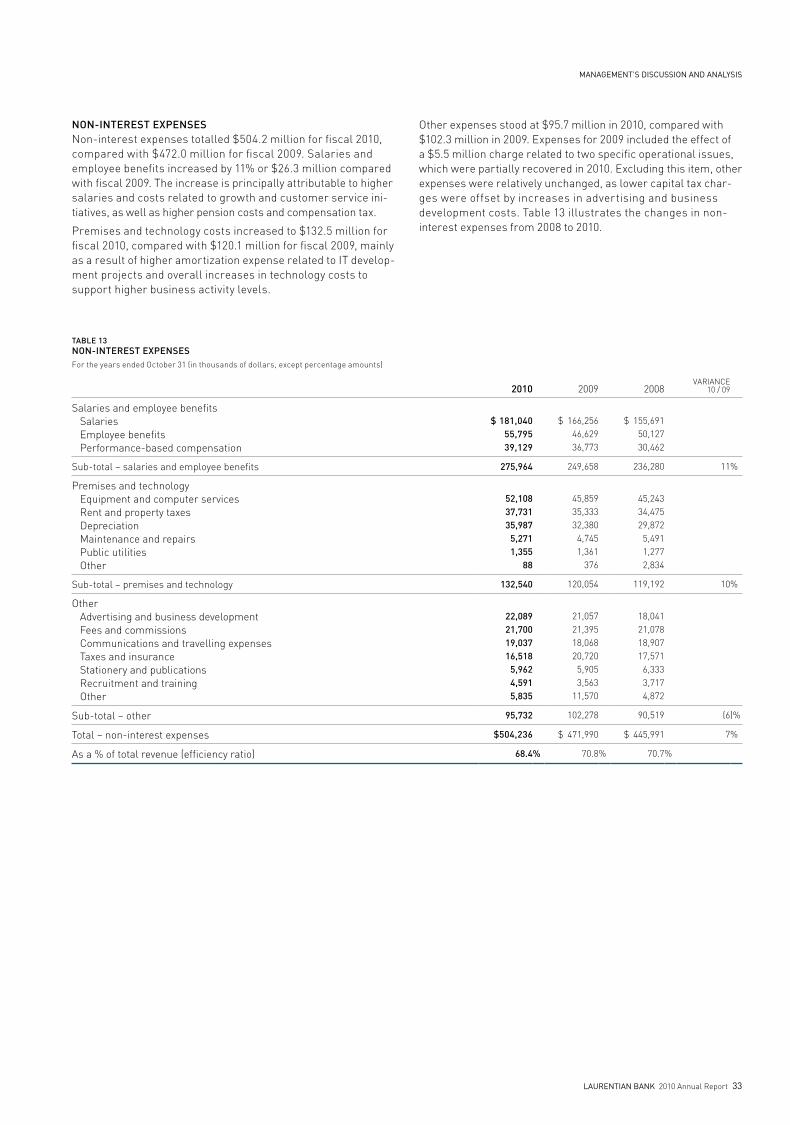
management’s discussion and analysis
laurentian banK 2010 Annual Report 33
nOn-InTEREST ExPEnSES Non-interest expenses totalled $504.2 million for fiscal 2010, compared with $472.0 million for fiscal 2009. Salaries and employee benefits increased by 11% or $26.3 million compared with fiscal 2009. The increase is principally attributable to higher salaries and costs related to growth and customer service ini-tiatives, as well as higher pension costs and compensation tax.
Premises and technology costs increased to $132.5 million for fiscal 2010, compared with $120.1 million for fiscal 2009, mainly as a result of higher amortization expense related to IT develop - ment projects and overall increases in technology costs to support higher business activity levels.
Other expenses stood at $95.7 million in 2010, compared with $102.3 million in 2009. Expenses for 2009 included the effect of a $5.5 million charge related to two specific operational issues, which were partially recovered in 2010. Excluding this item, other expenses were relatively unchanged, as lower capital tax char-ges were offset by increases in advertising and business development costs. Table 13 illustrates the changes in non- interest expenses from 2008 to 2010.
TABLE 13nOn-InTEREST ExPEnSESFor the years ended October 31 (in thousands of dollars, except percentage amounts)
2010 2009 2008 vARIANCE
10 / 09
Salaries and employee benefits Salaries Employee benefits Performance-based compensation
$ 181,040 55,795 39,129
$ 166,256
46,629 36,773
$ 155,691
50,127 30,462
Sub-total – salaries and employee benefits 275,964 249,658 236,280 11 %
Premises and technology Equipment and computer services Rent and property taxes Depreciation Maintenance and repairs Public utilities Other
52,108 37,731 35,987
5,271 1,355
88
45,859 35,333 32,380
4,745 1,361
376
45,243 34,475 29,872
5,491 1,277 2,834
Sub-total – premises and technology 132,540 120,054 119,192 10%
Other Advertising and business development Fees and commissions Communications and travelling expenses Taxes and insurance Stationery and publications Recruitment and training Other
22,089 21,700 19,037 16,518
5,962 4,591 5,835
21,057 21,395 18,068
20,720 5,905 3,563
11,570
18,041 21,078 18,907
17,571 6,333 3,717 4,872
Sub-total – other 95,732 102,278 90,519 (6)%
Total – non-interest expenses $504,236 $ 471,990 $ 445,991 7%
As a % of total revenue (efficiency ratio) 68.4 % 70.8 % 70.7 %
34 laurentian banK 2010 Annual Report
management’s discussion and analysis
EFFICIEnCy RATIO The efficiency ratio (non-interest expenses divided by total revenue) improved markedly to 68.4% for fiscal 2010, compared with 70.8% for fiscal 2009, driven by strong revenue growth. This translated into a 3.8% positive operating leverage (percentage growth in total revenues, less percentage growth in non-interest expenses).
The accompanying graph shows the Bank’s performance in this regard over the last five years.
InCOME TAx ExPEnSEFor fiscal 2010, income tax expense totalled $42.3 million and the effective income tax rate stood at 25.6%, compared with $36.8 million and 26.6%, respectively, for fiscal 2009. Note 17 to the annual consolidated financial statements provides further information on income tax expense.
TABLE 14RECOnCILIATIOn OF THE InCOME TAx ExPEnSE FROM COnTInuInG OPERATIOnS TO THE DOLLAR AMOunT OF InCOME TAx uSInG THE STATuTORy RATEFor the years ended October 31 (in thousands of dollars, except percentage amounts)
2010 2009
Income taxes at statutory rates Change resulting from: Income related to foreign credit insurance operations Dividends and tax-exempt gains
$50,027
(4,891 (1,919
))
30.3
(3.0 (1.2
%
))
$43,312
(4,471 (1,626
))
31.3
(3.2 (1.2
%
))
Resolution of income tax exposuresTax rate changesOther
43,217 (1,010
587 (525
)
)
26.1 (0.6 0.4
(0.3
)
)
37,215 (2,418
– 2,051
) 26.9 (1.7
– 1.4
)
Income taxes from continuing operations, as reported in the consolidated statement of income and effective tax rate $42,269 25.6% $36,848 26.6%
TRAnSACTIOnS WITH RELATED PARTIESThe Bank provides loans to directors and officers and their related companies. Loans to directors are granted under market condi-tions for similar risks and are measured at the exchanged amount. Loans to officers consist mostly of residential mortgage loans at posted rates less 2%, as well as personal loans and personal lines of credit at market rates less a discount based on the type and amount of the loan. Loans to related companies are granted under terms similar to those offered to arm’s length parties. The interest earned on these loans is recorded under interest income in the consolidated statement of income. In the normal course of business, the Bank also provides usual banking services to certain directors and officers, including bank accounts (deposits) under terms similar to those offered to arm’s length parties. The Bank also offers employees a subsidy on annual credit card fees. See Note 19 to the annual consolidated financial statements for additional information on related party transactions.
OvERvIEW OF FISCAL 2009For the year ended October 31, 2009, the Bank reported net income of $113.1 million, or diluted earnings of $4.23 per share, compared with $102.5 million, or diluted earnings of $3.80 per share in 2008. Return on common shareholders’ equity was 11.4% in 2009, compared with 11.0% in 2008.
Net income in 2009 includes income from discontinued operations of $11.5 million, or $0.48 diluted per share, related to the sale of asset management activities in fiscal 2005. Net income in 2008 included income from discontinued operations of $4.4 million, or $0.19 diluted per share. Income from continuing operations was $101.6 million in 2009, or $3.75 diluted per share, compared with $98.1 million, or $3.61 diluted per share in 2008.
The Bank delivered a solid performance in 2009. Record growth in personal and commercial loan and deposit portfolios signifi-cantly improved revenues, while tight cost control contributed to improve efficiency. However, higher loan losses resulting from poor economic conditions throughout the year and losses on securities dampened the Bank’s results.
76.1
70.7 70.8
73.2
68.4
EFFICIENCY RATIO(Non-interest expenses as a percentage of total revenue)
2006 2007 2008 2009 201065
70
75
80
management’s discussion and analysis
laurentian banK 2010 Annual Report 35
analysis oF quarterly results
SuMMARy AnALySIS OF RESuLTS FOR THE FOuRTH QuARTER OF FISCAL 2010Net income for the fourth quarter ended October 31, 2010 was $32.5 million, compared with $38.2 million for the same period last year. Net income for the fourth quarter of 2009 included income from discontinued operations of $11.5 million related to the sale of asset management activities in fiscal 2005. Income from continuing operations amounted to $26.8 million for the fourth quarter of 2009.
Total revenueTotal revenue increased by 6% to $190.1 million in the fourth quarter of 2010, compared with $178.5 million in the fourth quarter of 2009. Net interest income increased to $128.2 million in the fourth quarter of 2010 from $118.2 million in the fourth quarter of 2009, mainly attributable to the strong loan and deposit growth year-over-year. Interest margins decreased slightly in the fourth quarter of 2010, when compared to the fourth quarter of 2009 as interest margins remained under pressure, because of sustained competition for retail customers, a flatter yield curve and the continued low interest rate environment.
Other income improved to $61.9 million in the fourth quarter of 2010, compared to $60.3 million in the fourth quarter of 2009. Overall retail business growth contributed to higher fees and commissions on loans and deposits, as well as to the increase in credit insurance income. In addition, income from treasury and financial market operations improved by more than $5.0 million in the fourth quarter of 2010, when compared to the fourth quarter of 2009, as results for 2009 were hampered by net losses on securi - ties of $3.5 million. Securitization income decreased by $5.0 million compared to the same quarter a year ago, as a result of lower gains on reduced level of mortgage loan securitization and tighter spreads on mortgage loans sold. Income from brokerage opera-tions decreased by $2.0 million in the fourth quarter of 2010, when compared to the fourth quarter of 2009. Results from these operations, for the fourth quarter of 2009, benefitted from the recovering equity markets, as well as from the particularly good quarter for the Institutional Fixed Income division of Laurentian Bank Securities. At $14.9 million for the fourth quarter of 2010, brokerage revenues were nonetheless satisfactory.
Provision for loan lossesThe provision for loan losses amounted to $16.0 million in the fourth quarter of 2010, unchanged from the fourth quarter of 2009, as lower losses on retail portfolios were offset by in-creases in commercial portfolios. This level of losses is in line with the overall good credit quality of the Bank’s loan portfolio given the current soft North American economic conditions.
non-interest expensesNon-interest expenses totalled $132.5 million for the fourth quarter of 2010, compared with $128.1 million for the fourth quarter of 2009. Salaries and employee benefits rose by $6.1 million, mainly as a result of higher salary charges, compen-sation tax and pension costs. Over the last twelve months, headcount has increased by more than one hundred mainly to support growth and service quality initiatives. Premises and technology costs rose from $31.9 million for the fourth quarter of 2009 to $35.2 million for the fourth quarter of 2010, mainly as a result of higher amortization expenses related to recently completed IT development projects, technology costs to support business growth and rental costs. Other non-interest expenses decreased from $30.2 million for the fourth quarter of 2009 to $25.2 million for the fourth quarter of 2010. Other expenses for 2009 included the effect of a $5.5 million charge related to two specific operational issues. Excluding this item, other expenses were relatively stable as a result of sustained cost control.
The efficiency ratio improved to 69.7% in the fourth quarter of 2010, compared with 71.8% in the fourth quarter of 2009; reflecting a 3.1% positive operating leverage.
Income taxesFor the quarter ended October 31, 2010, income tax expense was $9.1 million and the effective tax rate was 21.8%. The lower tax rate, compared to the statutory rate, mainly resulted from the favourable effect of holding investments in Canadian secu-rities that generate non-taxable dividend income and the lower taxation level on revenues from credit insurance operations. Results for the fourth quarter also include year-end favourable adjustments of $2.2 million to future income taxes. For the quarter ended October 31, 2009, the income tax expense related to continuing operations was $7.6 million and the effective tax rate was 22.1%.
AnALySIS OF THE EvOLuTIOn OF THE QuARTERLy RESuLTSThe Bank’s intermediation business provides a relatively steady source of income, stemming from large volumes of loans and deposits not likely to experience significant fluctua-tions in the short term. However, treasury operations and certain activities related to financial markets, such as securi-tization operations and trading activities, may result in significant volatility. In addition, sharp variations in market interest rates or equity markets may also influence operating results. Other transactions, specific events or regulatory developments may also influence the Bank’s results. given that the second quarter usually consists of only 89 days, compared with 92 days for the other quarters, net interest income for that quarter is generally lower. Table 15 summarizes quarterly results for fiscal 2010 and 2009.
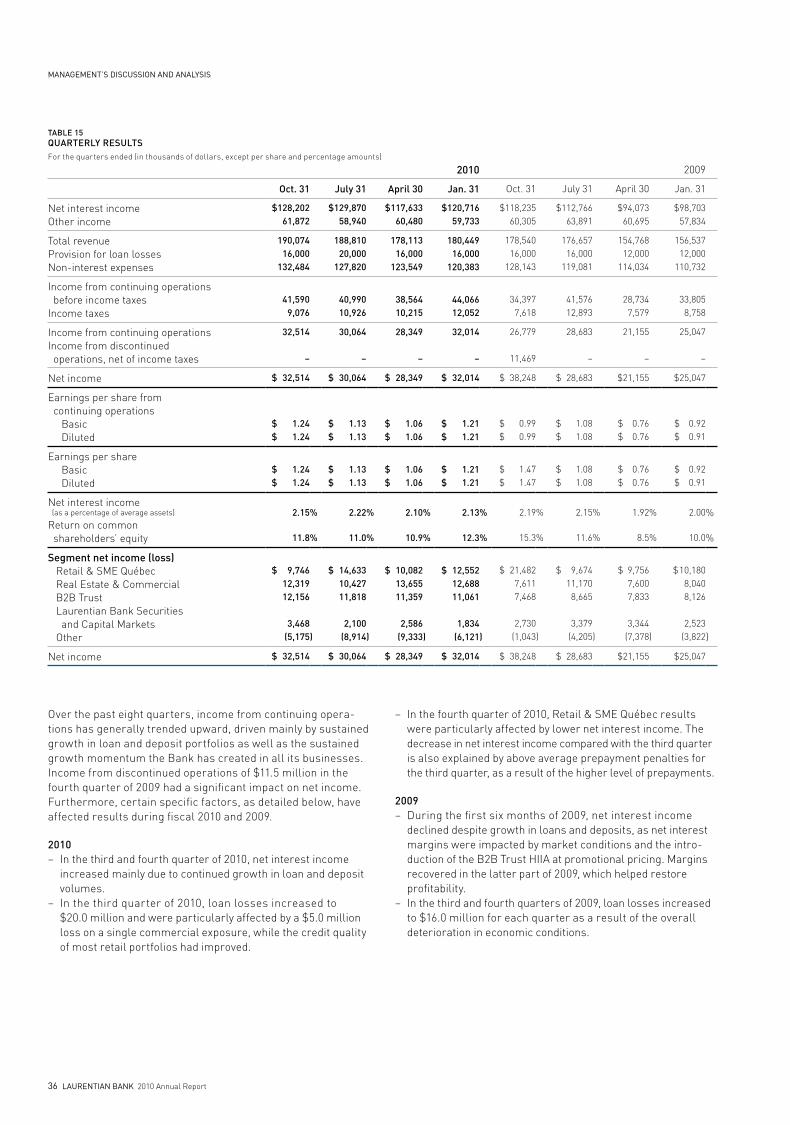
36 laurentian banK 2010 Annual Report
management’s discussion and analysis
TABLE 15QuARTERLy RESuLTSFor the quarters ended (in thousands of dollars, except per share and percentage amounts)
2010 2009
Oct. 31 July 31 April 30 Jan. 31 Oct. 31 July 31 April 30 Jan. 31
Net interest incomeOther income
$128,202 61,872
$129,870 58,940
$117,633 60,480
$120,716 59,733
$118,235 60,305
$112,766 63,891
$94,073 60,695
$98,703 57,834
Total revenueProvision for loan lossesNon-interest expenses
190,074 16,000
132,484
188,810 20,000
127,820
178,113 16,000
123,549
180,449 16,000
120,383
178,540 16,000
128,143
176,657 16,000
119,081
154,768 12,000
114,034
156,537 12,000
110,732
Income from continuing operations before income taxesIncome taxes
41,590 9,076
40,990 10,926
38,564 10,215
44,066 12,052
34,397 7,618
41,576 12,893
28,734 7,579
33,805 8,758
Income from continuing operationsIncome from discontinued operations, net of income taxes
32,514
–
30,064
–
28,349
–
32,014
–
26,779
11,469
28,683
–
21,155
–
25,047
–
Net income $ 32,514 $ 30,064 $ 28,349 $ 32,014 $ 38,248 $ 28,683 $21,155 $25,047
Earnings per share from continuing operations Basic Diluted
$ 1.24 $ 1.24
$ 1.13 $ 1.13
$ 1.06 $ 1.06
$ 1.21 $ 1.21
$ 0.99 $ 0.99
$ 1.08 $ 1.08
$ 0.76 $ 0.76
$ 0.92 $ 0.91
Earnings per share Basic Diluted
$ 1.24 $ 1.24
$ 1.13 $ 1.13
$ 1.06 $ 1.06
$ 1.21 $ 1.21
$ 1.47 $ 1.47
$ 1.08 $ 1.08
$ 0.76 $ 0.76
$ 0.92 $ 0.91
Net interest income (as a percentage of average assets)
Return on common shareholders’ equity
2.15
11.8
%
%
2.22
11.0
%
%
2.10
10.9
%
%
2.13
12.3
%
%
2.19
15.3
%
%
2.15
11.6
%
%
1.92
8.5
%
%
2.00
10.0
%
%
Segment net income (loss) Retail & SME Québec Real Estate & Commercial B2B Trust Laurentian Bank Securities and Capital Markets Other
$ 9,746 12,319 12,156
3,468 (5,175)
$ 14,633 10,427 11,818
2,100 (8,914
)
$ 10,082 13,655 11,359
2,586 (9,333)
$ 12,552 12,688 11,061
1,834 (6,121)
$ 21,482 7,611 7,468
2,730 (1,043)
$ 9,674 11,170
8,665
3,379 (4,205)
$ 9,756 7,600 7,833
3,344 (7,378)
$ 10,180 8,040 8,126
2,523 (3,822)
Net income $ 32,514 $ 30,064 $ 28,349 $ 32,014 $ 38,248 $ 28,683 $21,155 $25,047
Over the past eight quarters, income from continuing opera-tions has generally trended upward, driven mainly by sustained growth in loan and deposit portfolios as well as the sustained growth momentum the Bank has created in all its businesses. Income from discontinued operations of $11.5 million in the fourth quarter of 2009 had a significant impact on net income. Furthermore, certain specific factors, as detailed below, have affected results during fiscal 2010 and 2009.
2010– In the third and fourth quarter of 2010, net interest income
increased mainly due to continued growth in loan and deposit volumes.
– In the third quarter of 2010, loan losses increased to $20.0 million and were particularly affected by a $5.0 million loss on a single commercial exposure, while the credit quality of most retail portfolios had improved.
– In the fourth quarter of 2010, Retail & SME Québec results were particularly affected by lower net interest income. The decrease in net interest income compared with the third quarter is also explained by above average prepayment penalties for the third quarter, as a result of the higher level of prepayments.
2009– During the first six months of 2009, net interest income
declined despite growth in loans and deposits, as net interest margins were impacted by market conditions and the intro-duction of the B2B Trust HIIA at promotional pricing. Margins recovered in the latter part of 2009, which helped restore profitability.
– In the third and fourth quarters of 2009, loan losses increased to $16.0 million for each quarter as a result of the overall deterioration in economic conditions.
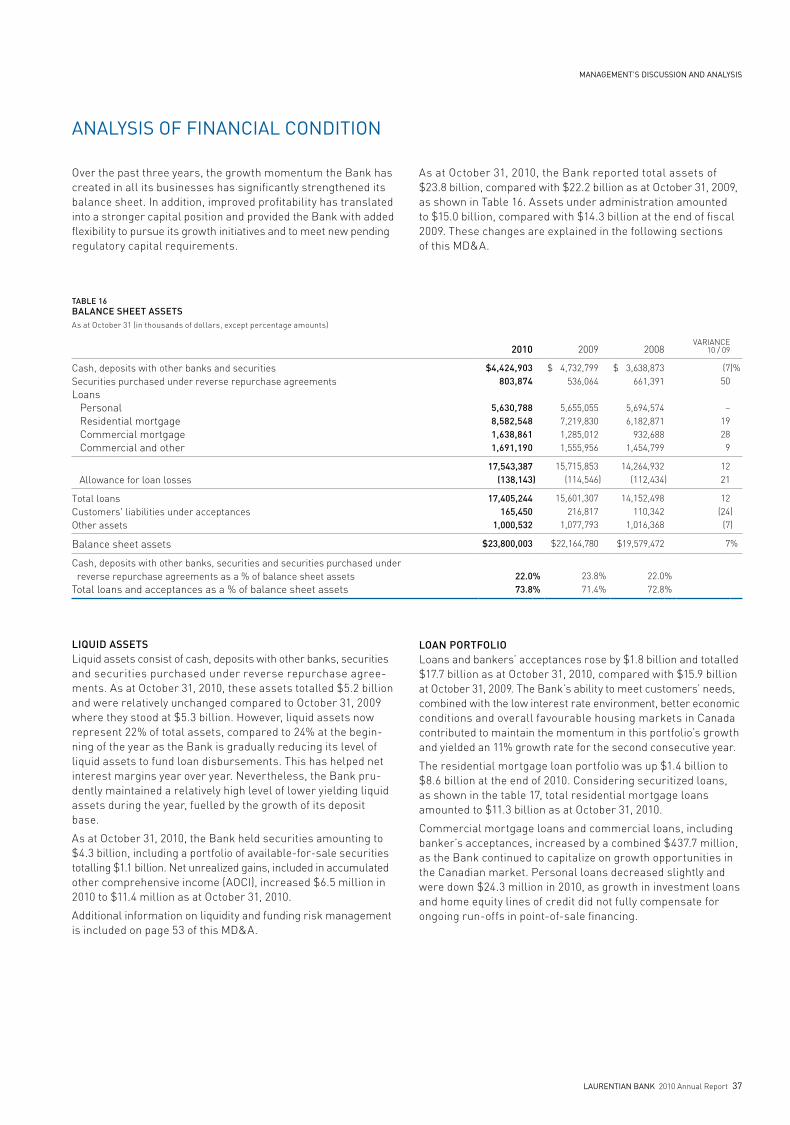
management’s discussion and analysis
laurentian banK 2010 Annual Report 37
analysis oF Financial condition
Over the past three years, the growth momentum the Bank has created in all its businesses has significantly strengthened its balance sheet. In addition, improved profitability has translated into a stronger capital position and provided the Bank with added flexibility to pursue its growth initiatives and to meet new pending regulatory capital requirements.
As at October 31, 2010, the Bank reported total assets of $23.8 billion, compared with $22.2 billion as at October 31, 2009, as shown in Table 16. Assets under administration amounted to $15.0 billion, compared with $14.3 billion at the end of fiscal 2009. These changes are explained in the following sections of this MD&A.
TABLE 16BALAnCE SHEET ASSETSAs at October 31 (in thousands of dollars, except percentage amounts)
2010 2009 2008 vARIANCE
10 / 09
Cash, deposits with other banks and securitiesSecurities purchased under reverse repurchase agreementsLoans Personal Residential mortgage Commercial mortgage Commercial and other
$4,424,903 803,874
5,630,788 8,582,548 1,638,861 1,691,190
$ 4,732,799 536,064
5,655,055 7,219,830 1,285,012 1,555,956
$ 3,638,873 661,391
5,694,574 6,182,871
932,688 1,454,799
(7 50
– 19 28
9
)%
Allowance for loan losses 17,543,387
(138,143) 15,715,853
(114,546) 14,264,932
(112,434) 12 21
Total loansCustomers' liabilities under acceptancesOther assets
17,405,244 165,450
1,000,532
15,601,307 216,817
1,077,793
14,152,498 110,342
1,016,368
12 (24
(7))
Balance sheet assets $23,800,003 $22,164,780 $19,579,472 7%
Cash, deposits with other banks, securities and securities purchased under reverse repurchase agreements as a % of balance sheet assetsTotal loans and acceptances as a % of balance sheet assets
22.0 73.8
%%
23.8 71.4
%%
22.0 72.8
%%
LIQuID ASSETSLiquid assets consist of cash, deposits with other banks, securities and securities purchased under reverse repurchase agree-ments. As at October 31, 2010, these assets totalled $5.2 billion and were relatively unchanged compared to October 31, 2009 where they stood at $5.3 billion. However, liquid assets now represent 22% of total assets, compared to 24% at the begin-ning of the year as the Bank is gradually reducing its level of liquid assets to fund loan disbursements. This has helped net interest margins year over year. Nevertheless, the Bank pru-dently maintained a relatively high level of lower yielding liquid assets during the year, fuelled by the growth of its deposit base.
As at October 31, 2010, the Bank held securities amounting to $4.3 billion, including a portfolio of available-for-sale securities totalling $1.1 billion. Net unrealized gains, included in accumulated other comprehensive income (AOCI), increased $6.5 million in 2010 to $11.4 million as at October 31, 2010.
Additional information on liquidity and funding risk management is included on page 53 of this MD&A.
LOAn PORTFOLIOLoans and bankers’ acceptances rose by $1.8 billion and totalled $17.7 billion as at October 31, 2010, compared with $15.9 billion at October 31, 2009. The Bank’s ability to meet customers’ needs, combined with the low interest rate environment, better economic conditions and overall favourable housing markets in Canada contributed to maintain the momentum in this portfolio’s growth and yielded an 11% growth rate for the second consecutive year.
The residential mortgage loan portfolio was up $1.4 billion to $8.6 billion at the end of 2010. Considering securitized loans, as shown in the table 17, total residential mortgage loans amounted to $11.3 billion as at October 31, 2010.
Commercial mortgage loans and commercial loans, including banker’s acceptances, increased by a combined $437.7 million, as the Bank continued to capitalize on growth opportunities in the Canadian market. Personal loans decreased slightly and were down $24.3 million in 2010, as growth in investment loans and home equity lines of credit did not fully compensate for ongoing run-offs in point-of-sale financing.
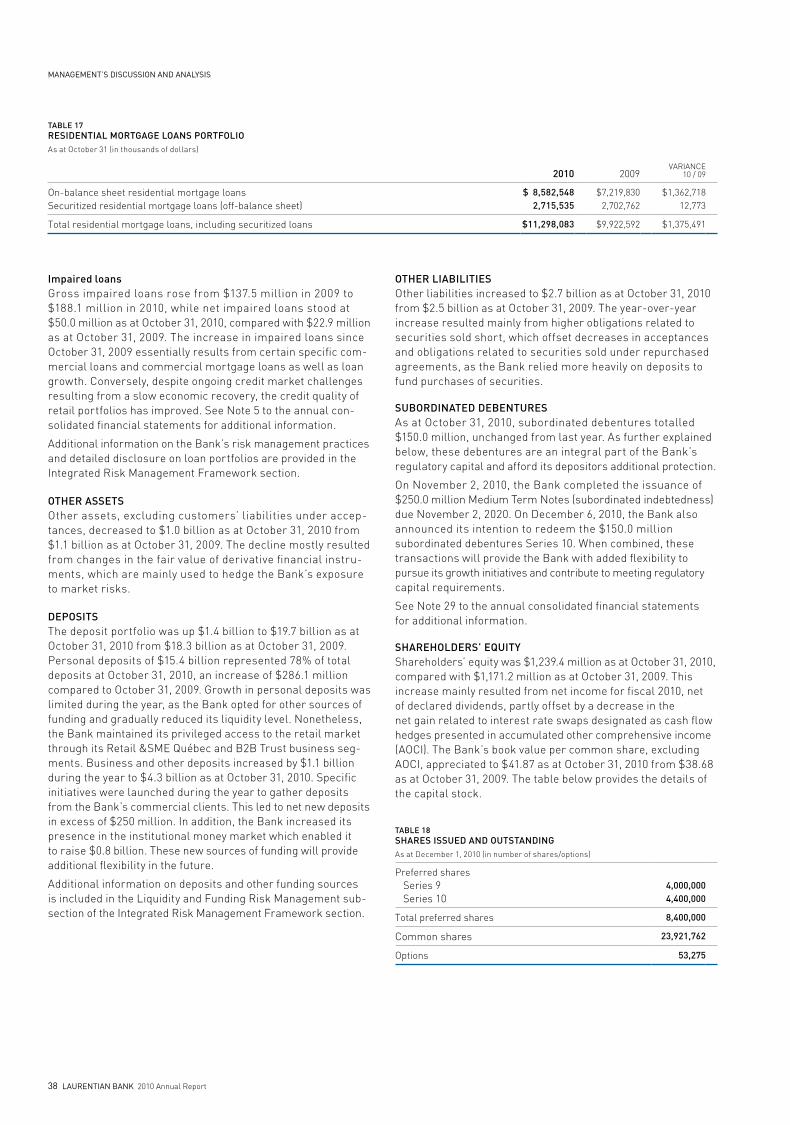
38 laurentian banK 2010 Annual Report
management’s discussion and analysis
TABLE 17RESIDEnTIAL MORTGAGE LOAnS PORTFOLIOAs at October 31 (in thousands of dollars)
2010 2009 vARIANCE
10 / 09
On-balance sheet residential mortgage loansSecuritized residential mortgage loans (off-balance sheet)
$ 8,582,548 2,715,535
$7,219,830 2,702,762
$1,362,718 12,773
Total residential mortgage loans, including securitized loans $11,298,083 $9,922,592 $1,375,491
Impaired loansgross impaired loans rose from $137.5 million in 2009 to $188.1 million in 2010, while net impaired loans stood at $50.0 million as at October 31, 2010, compared with $22.9 million as at October 31, 2009. The increase in impaired loans since October 31, 2009 essentially results from certain specific com-mercial loans and commercial mortgage loans as well as loan growth. Conversely, despite ongoing credit market challenges resulting from a slow economic recovery, the credit quality of retail portfolios has improved. See Note 5 to the annual con-solidated financial statements for additional information.
Additional information on the Bank’s risk management practices and detailed disclosure on loan portfolios are provided in the Integrated Risk Management Framework section.
OTHER ASSETS Other assets, excluding customers’ liabilities under accep-tances, decreased to $1.0 billion as at October 31, 2010 from $1.1 billion as at October 31, 2009. The decline mostly resulted from changes in the fair value of derivative financial instru-ments, which are mainly used to hedge the Bank’s exposure to market risks.
DEPOSITSThe deposit portfolio was up $1.4 billion to $19.7 billion as at October 31, 2010 from $18.3 billion as at October 31, 2009. Personal deposits of $15.4 billion represented 78% of total deposits at October 31, 2010, an increase of $286.1 million compared to October 31, 2009. growth in personal deposits was limited during the year, as the Bank opted for other sources of funding and gradually reduced its liquidity level. Nonetheless, the Bank maintained its privileged access to the retail market through its Retail &SME Québec and B2B Trust business seg-ments. Business and other deposits increased by $1.1 billion during the year to $4.3 billion as at October 31, 2010. Specific initiatives were launched during the year to gather deposits from the Bank’s commercial clients. This led to net new deposits in excess of $250 million. In addition, the Bank increased its presence in the institutional money market which enabled it to raise $0.8 billion. These new sources of funding will provide additional flexibility in the future.
Additional information on deposits and other funding sources is included in the Liquidity and Funding Risk Management sub-section of the Integrated Risk Management Framework section.
OTHER LIABILITIES Other liabilities increased to $2.7 billion as at October 31, 2010 from $2.5 billion as at October 31, 2009. The year-over-year increase resulted mainly from higher obligations related to securities sold short, which offset decreases in acceptances and obligations related to securities sold under repurchased agreements, as the Bank relied more heavily on deposits to fund purchases of securities.
SuBORDInATED DEBEnTuRES As at October 31, 2010, subordinated debentures totalled $150.0 million, unchanged from last year. As further explained below, these debentures are an integral part of the Bank’s regulatory capital and afford its depositors additional protection.
On November 2, 2010, the Bank completed the issuance of $250.0 million Medium Term Notes (subordinated indebtedness) due November 2, 2020. On December 6, 2010, the Bank also announced its intention to redeem the $150.0 million subordinated debentures Series 10. When combined, these transactions will provide the Bank with added flexibility to pursue its growth initiatives and contribute to meeting regulatory capital requirements.
See Note 29 to the annual consolidated financial statements for additional information.
SHAREHOLDERS’ EQuITy Shareholders’ equity was $1,239.4 million as at October 31, 2010, compared with $1,171.2 million as at October 31, 2009. This increase mainly resulted from net income for fiscal 2010, net of declared dividends, partly offset by a decrease in the net gain related to interest rate swaps designated as cash flow hedges presented in accumulated other comprehensive income (AOCI). The Bank’s book value per common share, excluding AOCI, appreciated to $41.87 as at October 31, 2010 from $38.68 as at October 31, 2009. The table below provides the details of the capital stock.
TABLE 18SHARES ISSuED AnD OuTSTAnDInGAs at December 1, 2010 (in number of shares/options)
Preferred shares Series 9 Series 10
4,000,0004,400,000
Total preferred shares 8,400,000
Common shares 23,921,762
Options 53,275

management’s discussion and analysis
laurentian banK 2010 Annual Report 39
oFF-balance sHeet arrangements
In the normal course of its operations, the Bank makes ample use of off-balance sheet arrangements. In particular, the Bank manages or administers clients’ assets that are not reported on the balance sheet. Moreover, off-balance sheet items include derivative instruments, as well as assets and liabilities arising from the utilization of special purpose entities set up for financing purposes.
ASSETS unDER ADMInISTRATIOn AnD ASSETS unDER MAnAGEMEnT Assets under administration and assets under management mainly include assets of clients to whom the Bank provides various administrative services, as well as residential mortgage
loans under management related to securitization operations. Through its subsidiary Laurentian Bank Securities, the Bank also manages retail and institutional investment portfolios. Table 19 below summarizes assets under administration and assets under management. As at October 31, 2010, these items totalled $15.0 billion, up $784.9 million compared with October 31, 2009. Fees, commissions and other income related to these assets contribute significantly to the Bank’s profit-ability. Certain fees, commissions and other income related to these assets are shown in Table 11.
TABLE 19ASSETS unDER ADMInISTRATIOn AnD ASSETS unDER MAnAGEMEnTAs at October 31 (in thousands of dollars)
2010 2009
Self-directed RRSPs and RRIFsMortgage loans under managementClients' brokerage assetsMutual fundsInstitutional assetsOther – Personal
$ 7,820,707 2,923,236
2,274,998 1,697,377
299,927 25,034
$ 7,599,034 2,876,695 1,969,917 1,440,852
341,628 28,299
Total – assets under administration and assets under management $15,041,279 $14,256,425
Assets related to self-directed plans grew $221.7 million compared with last year owing to recovering markets, partially offset by increased competition. Helped by a favourable regulatory environment, financial institutions are motivated to manage their own clients’ self-directed plans themselves. As a result, over the medium term, these activities should continue to be impacted negatively, regardless of market valuations.
Mortgage loans under management were up $46.5 million, as securitization operations carried out during fiscal 2010 more than offset maturities and pre-payments on mortgage loans sold in prior years.
Clients’ brokerage assets rose by more than 15%, driven by solid organic growth and a good market performance in 2010.
Mutual fund assets under administration increased by $256.5 million or 18% during fiscal 2010, owing to favourable market conditions and strong net annual sales of mutual funds.
Institutional assets related to trust services were relatively unchanged at $300.0 million, compared with the October 31, 2009 level.
DERIvATIvE FInAnCIAL InSTRuMEnTS In the normal course of its operations, the Bank enters into various contracts and commitments to protect itself against the risk of fluctuations in interest rates, foreign exchange rates and indices on which returns of index-linked deposits are based, as well as to provide protection against the risk of
fluctuations in interest rates to special purpose entities with regard to the Bank’s securitization transactions, meet clients’ requirements and generate revenues from trading activities. These contracts and commitments constitute derivatives. The Bank does not enter into any credit default swaps.
All derivatives are recorded in the balance sheet at fair value. Derivative values are calculated using notional amounts. However, these amounts are not recorded in the balance sheet, as they do not represent the actual amounts exchanged. Likewise, notional amounts do not reflect the credit risk related to derivative financial instruments, although they serve as a reference for calculating payments.
The notional amounts of the Bank’s derivatives totalled $19.0 billion as at October 31, 2010, compared with $19.9 billion as at October 31, 2009. The net negative fair value of derivative financial instruments stood at $51.1 million as at October 31, 2010, compared with a net positive fair value of $43.1 million as at October 31, 2009, resulting in a net decrease in fair value of $94.2 million. The year-over-year decrease resulted mainly from interest receipts totalling $116.3 million during the year relating to interest rate swaps held for hedging purposes, partly compensated by the effect of changes in interest rates in 2010, as well as the decline in value of seller swaps.
Notes 20 to 22 to the annual consolidated financial statements provide further information on the various types of derivative products and their recognition.
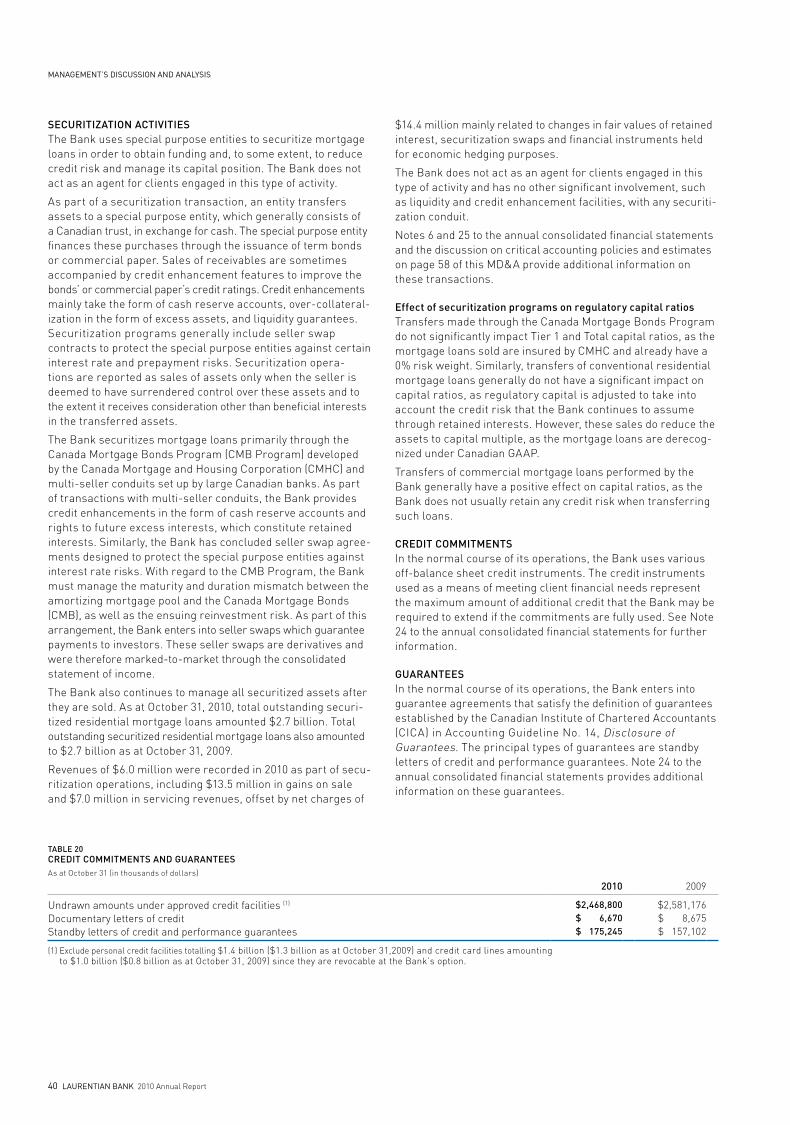
40 laurentian banK 2010 Annual Report
management’s discussion and analysis
SECuRITIZATIOn ACTIvITIESThe Bank uses special purpose entities to securitize mortgage loans in order to obtain funding and, to some extent, to reduce credit risk and manage its capital position. The Bank does not act as an agent for clients engaged in this type of activity.
As part of a securitization transaction, an entity transfers assets to a special purpose entity, which generally consists of a Canadian trust, in exchange for cash. The special purpose entity finances these purchases through the issuance of term bonds or commercial paper. Sales of receivables are sometimes accompanied by credit enhancement features to improve the bonds’ or commercial paper’s credit ratings. Credit enhancements mainly take the form of cash reserve accounts, over-collateral-ization in the form of excess assets, and liquidity guarantees. Securitization programs generally include seller swap contracts to protect the special purpose entities against certain interest rate and prepayment risks. Securitization opera - tions are reported as sales of assets only when the seller is deemed to have surrendered control over these assets and to the extent it receives consideration other than beneficial interests in the transferred assets.
The Bank securitizes mortgage loans primarily through the Canada Mortgage Bonds Program (CMB Program) developed by the Canada Mortgage and Housing Corporation (CMHC) and multi-seller conduits set up by large Canadian banks. As part of transactions with multi-seller conduits, the Bank provides credit enhancements in the form of cash reserve accounts and rights to future excess interests, which constitute retained interests. Similarly, the Bank has concluded seller swap agree-ments designed to protect the special purpose entities against interest rate risks. With regard to the CMB Program, the Bank must manage the maturity and duration mismatch between the amortizing mortgage pool and the Canada Mortgage Bonds (CMB), as well as the ensuing reinvestment risk. As part of this arrangement, the Bank enters into seller swaps which guarantee payments to investors. These seller swaps are derivatives and were therefore marked-to-market through the consolidated statement of income.
The Bank also continues to manage all securitized assets after they are sold. As at October 31, 2010, total outstanding securi-tized residential mortgage loans amounted $2.7 billion. Total outstanding securitized residential mortgage loans also amounted to $2.7 billion as at October 31, 2009.
Revenues of $6.0 million were recorded in 2010 as part of secu-ritization operations, including $13.5 million in gains on sale and $7.0 million in servicing revenues, offset by net charges of
$14.4 million mainly related to changes in fair values of retained interest, securitization swaps and financial instruments held for economic hedging purposes.
The Bank does not act as an agent for clients engaged in this type of activity and has no other significant involvement, such as liquidity and credit enhancement facilities, with any securiti-zation conduit.
Notes 6 and 25 to the annual consolidated financial statements and the discussion on critical accounting policies and estimates on page 58 of this MD&A provide additional information on these transactions.
Effect of securitization programs on regulatory capital ratiosTransfers made through the Canada Mortgage Bonds Program do not significantly impact Tier 1 and Total capital ratios, as the mortgage loans sold are insured by CMHC and already have a 0% risk weight. Similarly, transfers of conventional residential mortgage loans generally do not have a significant impact on capital ratios, as regulatory capital is adjusted to take into account the credit risk that the Bank continues to assume through retained interests. However, these sales do reduce the assets to capital multiple, as the mortgage loans are derecog-nized under Canadian gAAP.
Transfers of commercial mortgage loans performed by the Bank generally have a positive effect on capital ratios, as the Bank does not usually retain any credit risk when transferring such loans.
CREDIT COMMITMEnTSIn the normal course of its operations, the Bank uses various off-balance sheet credit instruments. The credit instruments used as a means of meeting client financial needs represent the maximum amount of additional credit that the Bank may be required to extend if the commitments are fully used. See Note 24 to the annual consolidated financial statements for further information.
GuARAnTEES In the normal course of its operations, the Bank enters into guarantee agreements that satisfy the definition of guarantees established by the Canadian Institute of Chartered Accountants (CICA) in Accounting guideline No. 14, Disclosure of guarantees. The principal types of guarantees are standby letters of credit and performance guarantees. Note 24 to the annual consolidated financial statements provides additional information on these guarantees.
TABLE 20CREDIT COMMITMEnTS AnD GuARAnTEESAs at October 31 (in thousands of dollars)
2010 2009
undrawn amounts under approved credit facilities (1)
Documentary letters of creditStandby letters of credit and performance guarantees
$2,468,800 $ 6,670 $ 175,245
$2,581,176 $ 8,675 $ 157,102
(1) Exclude personal credit facilities totalling $1.4 billion ($1.3 billion as at October 31,2009) and credit card lines amounting to $1.0 billion ($0.8 billion as at October 31, 2009) since they are revocable at the Bank’s option.
management’s discussion and analysis
laurentian banK 2010 Annual Report 41
caPital management
Management’s objective is to maintain an adequate level of capi - tal, in line with its risk profile, to support the Bank’s activities while enhancing shareholder value.
The Bank has an Internal Capital Adequacy Assessment Process (ICAAP) in place, which forms an integral part of the capital management planning process. Capital adequacy depends on various internal and external factors. The Bank’s capital level underscores its solvency and capacity to cover risks related to its operations while providing depositors and creditors with the safeguards they seek. Moreover, capital requirements are aligned with its Strategic Plan, industry capitalization levels and investors’ and shareholders’ expecta-tions. While rating agencies do not assign credit ratings to the Bank based solely on capital levels, the Bank’s capital must be consistent with the credit rating sought. As a result, the Bank’s capital adequacy targets vary over time in line with these factors. The ICAAP starts with strategic planning, which sets main targets and priorities for the Bank. The guidelines ensuing from the ICAAP, combined with a report assessing capital adequacy relative to the Bank’s objectives, serve as inputs to the Capital Plan, which itself defines guidelines governing proactive capital management.
As shown in the following diagram, capital adequacy is influenced by various factors.
Each year, the Board of Directors reviews and approves several capital-related documents, including the Capital Management and Adequacy Policy, the Business and Financial Three-Year Plan and the Capital Plan. Management monitors capital ratios on a monthly basis, while the Board’s Risk Management Committee reviews capital adequacy on a quarterly basis. The Integrated Risk Management group oversees the Bank’s capital management framework, particularly through the Capital Management and Adequacy Policy. The group also monitors capital limits and adequacy. The Bank’s Treasury Department reviews the Capital Plan and manages capital on an ongoing basis.
REGuLATORy CAPITALRegulatory capital calculation is determined based on the guidelines issued by the Office of the Superintendent of Financial Institutions Canada (OSFI) originating from the Basel Committee on Banking Supervision (BCBS) regulatory risk-based capital framework. Tier 1 capital represents more permanent forms of capital, is free of mandatory fixed charges against earnings and has a subordinate legal position to the rights of depositors and other creditors of the financial institution. Tier 2 capital consists of supplementary capital instruments that contribute to the overall strength of a financial institution as a going concern. Total capital is defined as the sum of Tier 1 and Tier 2 capital.
Regulatory capital requirements impose minimum levels of capital that have to be taken into consideration with the other factors mentioned above when assessing the Bank’s capital adequacy. under BCBS standards, banks must maintain a mini - mum Tier 1 capital ratio of 4% and a total capital ratio of at least 8%. OSFI requires that Canadian deposit-taking financial institutions maintain a minimum Tier 1 capital ratio of 7% and a total capital ratio of at least 10%. The Bank opted for the stan-dardized approach in determining credit risk capital and used the basic indicator approach in determining operational risk capital. Tables 21 and 22 outline the risk-weighted assets and regulatory capital used to calculate BCBS ratios. The Bank and its subsidiaries were in compliance with OSFI’s capital require-ments throughout the year.
PROPOSAL FOR nEW CAPITAL AnD LIQuIDITy REGuLATORy MEASuRESIn December 2009, the BCBS published proposals on new capital and liquidity requirements. updates were also published in July and September 2010, providing additional information. The proposals introduce new global liquidity standards and provide more stringent capital adequacy standards. More information regarding these new regulatory requirements is expected over the coming months. At this stage, it is still too early to deter-mine the definitive impact on capital ratios and liquidity requirements, considering the proposals are yet to be finalized at both the international (BCBS) and national (OSFI) levels and may further change between now and when the final rules take effect. Nonetheless, considering the Bank’s strong capital position and the nature of its operations, and based on available information, management believes that the Bank is well posi-tioned to meet upcoming capital requirements.
RATINGAGENCIES
INDUSTRYCAPITALIZATION
LEVELCA
PIT
AL
LE
VEL
REGULATORS
STRATEGICPLAN
INHERENT RISKS OF THE BANK
INVESTORS
FACTORS INFLUENCING CAPITAL ADEQUACY
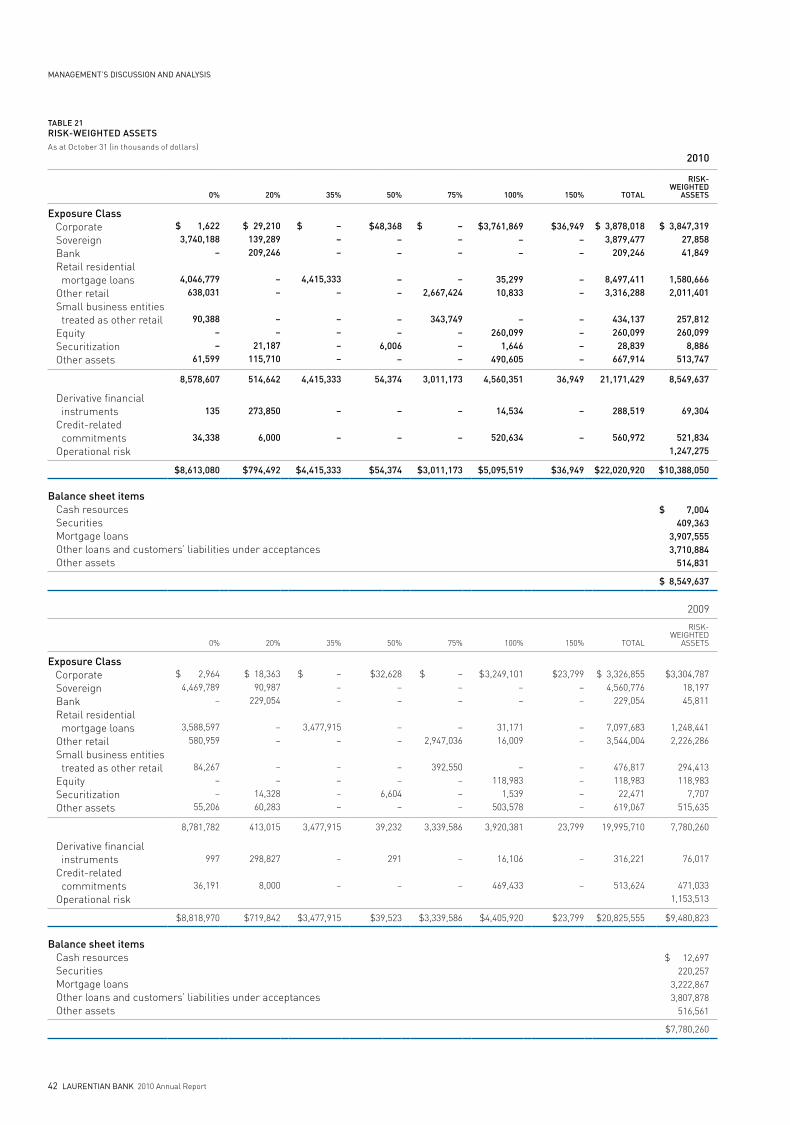
42 laurentian banK 2010 Annual Report
management’s discussion and analysis
TABLE 21RISK-WEIGHTED ASSETSAs at October 31 (in thousands of dollars)
2010
0% 20% 35% 50% 75% 100% 150% TOTAL
RISK- WEIGHTED
ASSETS
Exposure Class Corporate Sovereign Bank Retail residential mortgage loans Other retail Small business entities treated as other retail Equity Securitization Other assets
$ 1,622 3,740,188
–
4,046,779 638,031
90,388 – –
61,599
$ 29,210 139,289 209,246
– –
– –
21,187 115,710
$ – – –
4,415,333 –
– – – –
$48,368 – –
– –
– –
6,006 –
$ – – –
– 2,667,424
343,749 – – –
$3,761,869 – –
35,299 10,833
– 260,099
1,646 490,605
$36,949 – –
– –
– – – –
$ 3,878,018 3,879,477
209,246
8,497,411 3,316,288
434,137 260,099
28,839 667,914
$ 3,847,319 27,858 41,849
1,580,666 2,011,401
257,812 260,099
8,886 513,747
8,578,607 514,642 4,415,333 54,374 3,011,173 4,560,351 36,949 21,171,429 8,549,637
Derivative financial instruments Credit-related commitments Operational risk
135
34,338
273,850
6,000
–
–
–
–
–
–
14,534
520,634
–
–
288,519
560,972
69,304
521,834 1,247,275
$8,613,080 $794,492 $4,415,333 $54,374 $3,011,173 $5,095,519 $36,949 $22,020,920 $10,388,050
Balance sheet items Cash resources Securities Mortgage loans Other loans and customers’ liabilities under acceptances Other assets
$ 7,004 409,363
3,907,555 3,710,884
514,831
$ 8,549,637
2009
0% 20% 35% 50% 75% 100% 150% TOTAL
RISk- WEIgHTED
ASSETS
Exposure Class Corporate Sovereign Bank Retail residential mortgage loans Other retail Small business entities treated as other retail Equity Securitization Other assets
$ 2,9644,469,789
–
3,588,597580,959
84,267––
55,206
$ 18,36390,987
229,054
––
––
14,32860,283
$ –––
3,477,915–
––––
$32,628––
––
––
6,604–
$ –––
–2,947,036
392,550–––
$ 3,249,101––
31,17116,009
–118,983
1,539503,578
$23,799––
––
––––
$ 3,326,8554,560,776
229,054
7,097,6833,544,004
476,817118,983
22,471619,067
$3,304,78718,19745,811
1,248,4412,226,286
294,413118,983
7,707515,635
8,781,782 413,015 3,477,915 39,232 3,339,586 3,920,381 23,799 19,995,710 7,780,260
Derivative financial instruments Credit-related commitments Operational risk
997
36,191
298,827
8,000
–
–
291
–
–
–
16,106
469,433
–
–
316,221
513,624
76,017
471,0331,153,513
$8,818,970 $719,842 $3,477,915 $39,523 $3,339,586 $4,405,920 $23,799 $20,825,555 $9,480,823
Balance sheet items Cash resources Securities Mortgage loans Other loans and customers’ liabilities under acceptances Other assets
$ 12,697220,257
3,222,8673,807,878
516,561
$7,780,260
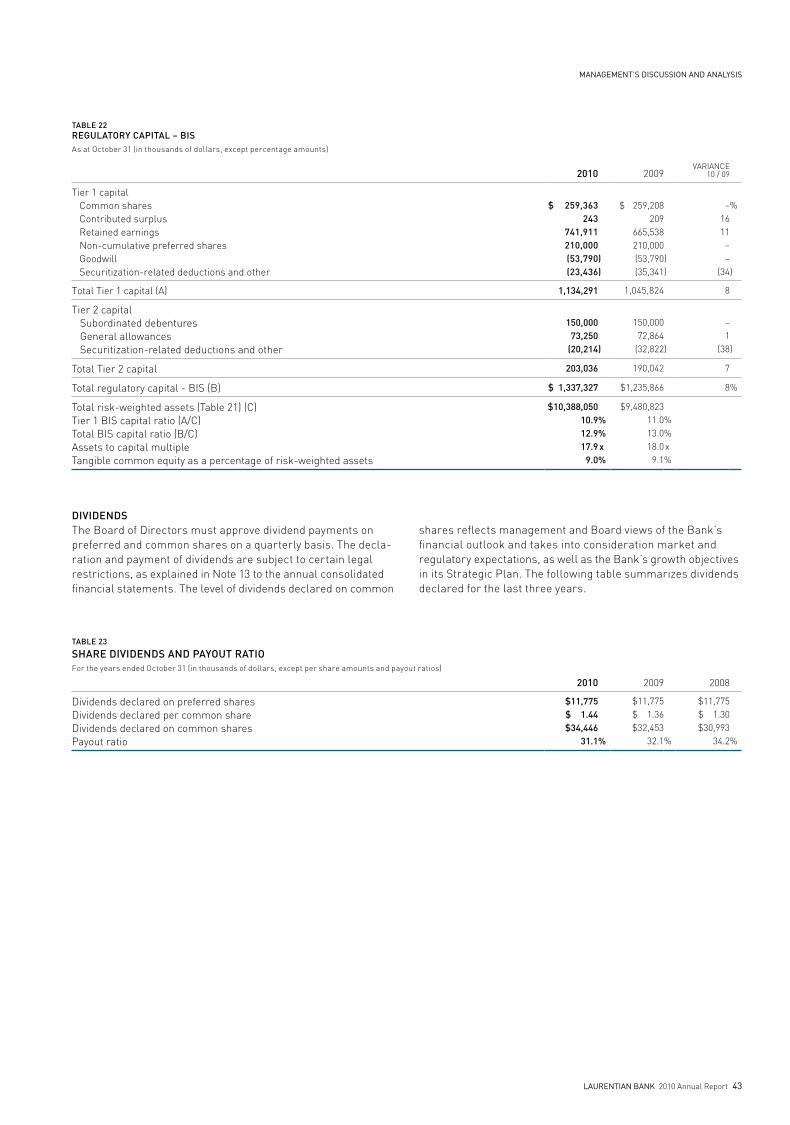
management’s discussion and analysis
laurentian banK 2010 Annual Report 43
TABLE 22REGuLATORy CAPITAL – BISAs at October 31 (in thousands of dollars, except percentage amounts)
2010 2009 vARIANCE
10 / 09
Tier 1 capital Common shares Contributed surplus Retained earnings Non-cumulative preferred shares goodwill Securitization-related deductions and other
$ 259,363 243
741,911 210,000 (53,790 (23,436
))
$ 259,208 209
665,538 210,000 (53,790 (35,341
))
– 16 11
– –
(34
%
)
Total Tier 1 capital (A) 1,134,291 1,045,824 8
Tier 2 capital Subordinated debentures general allowances Securitization-related deductions and other
150,000 73,250
(20,214)
150,000 72,864
(32,822)
– 1
(38)
Total Tier 2 capital 203,036 190,042 7
Total regulatory capital - BIS (B) $ 1,337,327 $1,235,866 8 %
Total risk-weighted assets (Table 21) (C)Tier 1 BIS capital ratio (A/C)Total BIS capital ratio (B/C)Assets to capital multipleTangible common equity as a percentage of risk-weighted assets
$10,388,050 10.9 12.9 17.9
9.0
%% x%
$9,480,823 11.0 13.0 18.0
9.1
%% x%
DIvIDEnDSThe Board of Directors must approve dividend payments on preferred and common shares on a quarterly basis. The decla-ration and payment of dividends are subject to certain legal restrictions, as explained in Note 13 to the annual consolidated financial statements. The level of dividends declared on common
shares reflects management and Board views of the Bank’s financial outlook and takes into consideration market and regulatory expectations, as well as the Bank’s growth objectives in its Strategic Plan. The following table summarizes dividends declared for the last three years.
TABLE 23
SHARE DIvIDEnDS AnD PAyOuT RATIOFor the years ended October 31 (in thousands of dollars, except per share amounts and payout ratios)
2010 2009 2008
Dividends declared on preferred sharesDividends declared per common shareDividends declared on common sharesPayout ratio
$11,775 $ 1.44
$34,446 31.1 %
$11,775 $ 1.36
$32,453 32.1 %
$11,775 $ 1.30
$30,993 34.2%
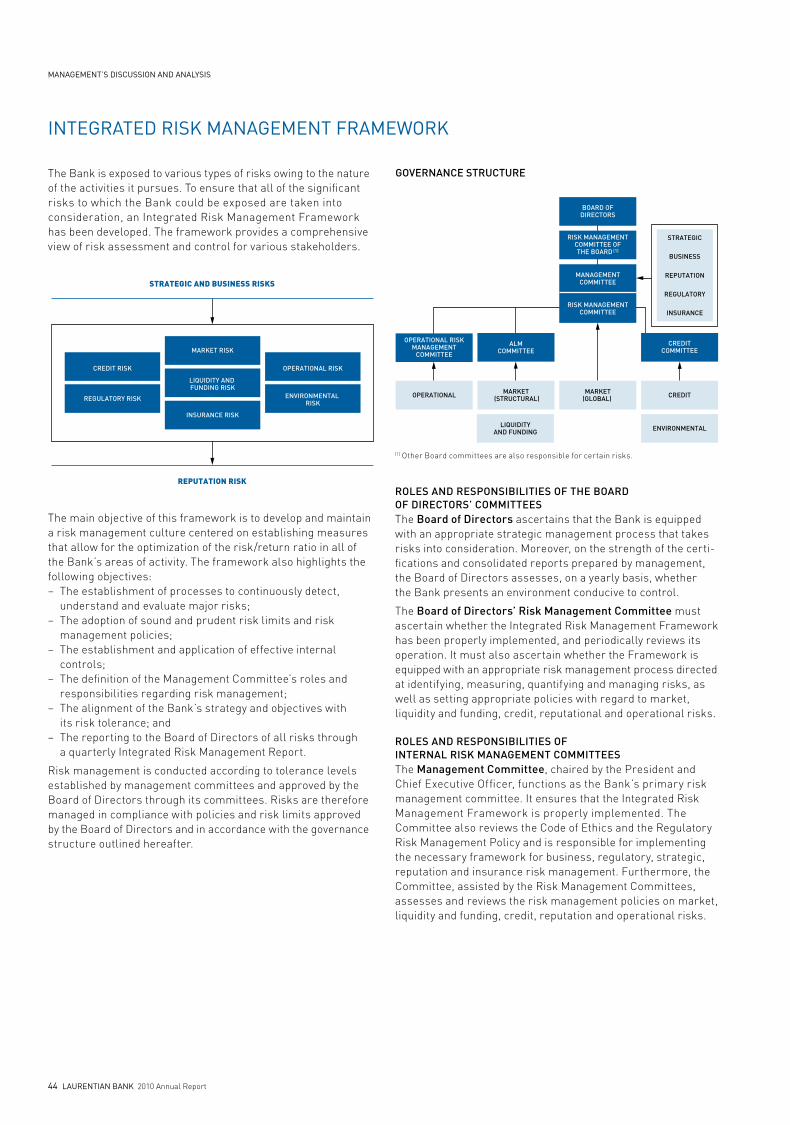
44 laurentian banK 2010 Annual Report
management’s discussion and analysis
integrated risK management FrameWorK
The Bank is exposed to various types of risks owing to the nature of the activities it pursues. To ensure that all of the significant risks to which the Bank could be exposed are taken into consideration, an Integrated Risk Management Framework has been developed. The framework provides a comprehensive view of risk assessment and control for various stakeholders.
The main objective of this framework is to develop and maintain a risk management culture centered on establishing measures that allow for the optimization of the risk/return ratio in all of the Bank’s areas of activity. The framework also highlights the following objectives:– The establishment of processes to continuously detect,
understand and evaluate major risks; – The adoption of sound and prudent risk limits and risk
management policies; – The establishment and application of effective internal
controls;– The definition of the Management Committee’s roles and
responsibilities regarding risk management;– The alignment of the Bank’s strategy and objectives with
its risk tolerance; and– The reporting to the Board of Directors of all risks through
a quarterly Integrated Risk Management Report.
Risk management is conducted according to tolerance levels established by management committees and approved by the Board of Directors through its committees. Risks are therefore managed in compliance with policies and risk limits approved by the Board of Directors and in accordance with the governance structure outlined hereafter.
ROLES AnD RESPOnSIBILITIES OF THE BOARD OF DIRECTORS’ COMMITTEES The Board of Directors ascertains that the Bank is equipped with an appropriate strategic management process that takes risks into consideration. Moreover, on the strength of the certi-fications and consolidated reports prepared by management, the Board of Directors assesses, on a yearly basis, whether the Bank presents an environment conducive to control.
The Board of Directors’ Risk Management Committee must ascertain whether the Integrated Risk Management Framework has been properly implemented, and periodically reviews its operation. It must also ascertain whether the Framework is equipped with an appropriate risk management process directed at identifying, measuring, quantifying and managing risks, as well as setting appropriate policies with regard to market, liquidity and funding, credit, reputational and operational risks.
ROLES AnD RESPOnSIBILITIES OF InTERnAL RISK MAnAGEMEnT COMMITTEESThe Management Committee, chaired by the President and Chief Executive Officer, functions as the Bank’s primary risk management committee. It ensures that the Integrated Risk Management Framework is properly implemented. The Committee also reviews the Code of Ethics and the Regulatory Risk Management Policy and is responsible for implementing the necessary framework for business, regulatory, strategic, reputation and insurance risk management. Furthermore, the Committee, assisted by the Risk Management Committees, assesses and reviews the risk management policies on market, liquidity and funding, credit, reputation and operational risks.
STRATEGIC AND BUSINESS RISKS
LIQUIDITY AND FUNDING RISK
INSURANCE RISK
REGULATORY RISK
OPERATIONAL RISK
ENVIRONMENTAL RISK
CREDIT RISK
REPUTATION RISK
MARKET RISK
BOARD OFDIRECTORS
RISK MANAGEMENTCOMMITTEE OFTHE BOARD (1)
MANAGEMENTCOMMITTEE
RISK MANAGEMENTCOMMITTEE
OPERATIONAL RISKMANAGEMENT
COMMITTEE
ALMCOMMITTEE
CREDITCOMMITTEE
OPERATIONAL MARKET (STRUCTURAL)
MARKET(GLOBAL) CREDIT
LIQUIDITYAND FUNDING ENVIRONMENTAL
STRATEGIC
BUSINESS
REPUTATION
REGULATORY
INSURANCE
GOVERNANCE STRUCTURE
(1) Other Board committees are also responsible for certain risks.
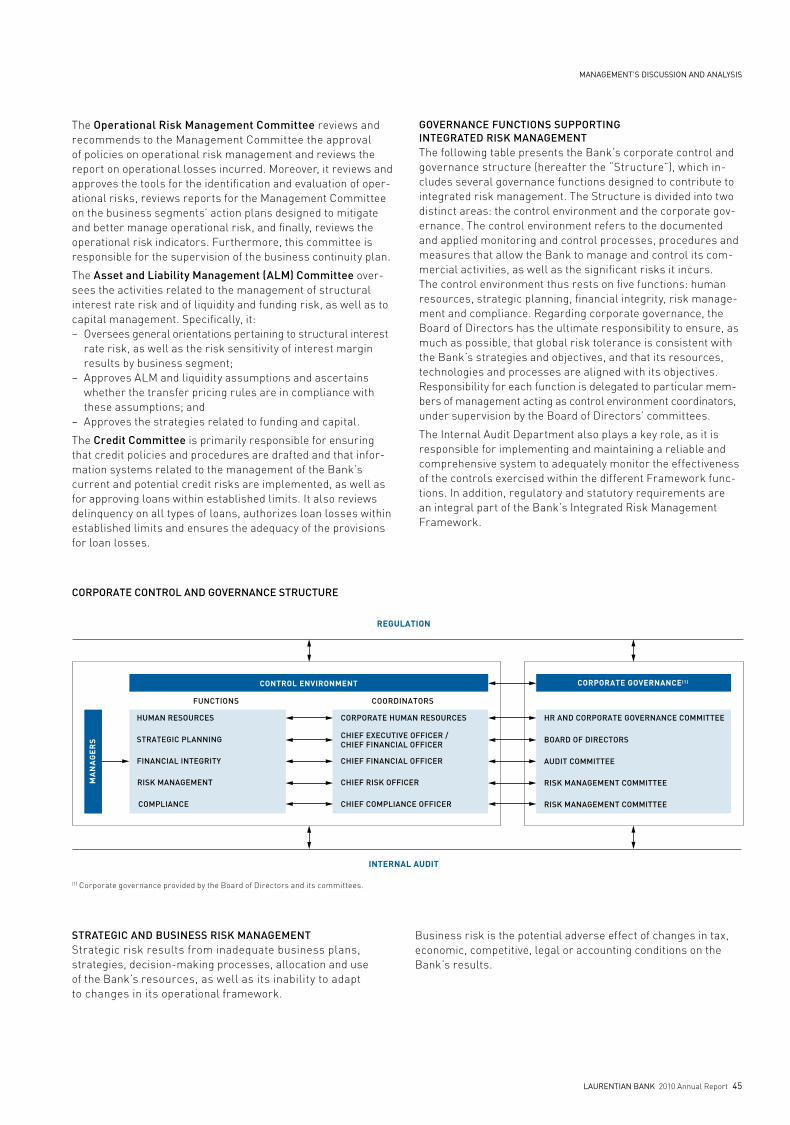
management’s discussion and analysis
laurentian banK 2010 Annual Report 45
The Operational Risk Management Committee reviews and recommends to the Management Committee the approval of policies on operational risk management and reviews the report on operational losses incurred. Moreover, it reviews and approves the tools for the identification and evaluation of oper-ational risks, reviews reports for the Management Committee on the business segments’ action plans designed to mitigate and better manage operational risk, and finally, reviews the operational risk indicators. Furthermore, this committee is responsible for the supervision of the business continuity plan.
The Asset and Liability Management (ALM) Committee over-sees the activities related to the management of structural interest rate risk and of liquidity and funding risk, as well as to capital management. Specifically, it:– Oversees general orientations pertaining to structural interest
rate risk, as well as the risk sensitivity of interest margin results by business segment;
– Approves ALM and liquidity assumptions and ascertains whether the transfer pricing rules are in compliance with these assumptions; and
– Approves the strategies related to funding and capital.
The Credit Committee is primarily responsible for ensuring that credit policies and procedures are drafted and that infor-mation systems related to the management of the Bank’s current and potential credit risks are implemented, as well as for approving loans within established limits. It also reviews delinquency on all types of loans, authorizes loan losses within established limits and ensures the adequacy of the provisions for loan losses.
GOvERnAnCE FunCTIOnS SuPPORTInG InTEGRATED RISK MAnAGEMEnT The following table presents the Bank’s corporate control and governance structure (hereafter the “Structure”), which in-cludes several governance functions designed to contribute to integrated risk management. The Structure is divided into two distinct areas: the control environment and the corporate gov-ernance. The control environment refers to the documented and applied monitoring and control processes, procedures and measures that allow the Bank to manage and control its com-mercial activities, as well as the significant risks it incurs. The control environment thus rests on five functions: human resources, strategic planning, financial integrity, risk manage-ment and compliance. Regarding corporate governance, the Board of Directors has the ultimate responsibility to ensure, as much as possible, that global risk tolerance is consistent with the Bank’s strategies and objectives, and that its resources, technologies and processes are aligned with its objectives. Responsibility for each function is delegated to particular mem-bers of management acting as control environment coordinators, under supervision by the Board of Directors’ committees.
The Internal Audit Department also plays a key role, as it is responsible for implementing and maintaining a reliable and comprehensive system to adequately monitor the effectiveness of the controls exercised within the different Framework func-tions. In addition, regulatory and statutory requirements are an integral part of the Bank’s Integrated Risk Management Framework.
STRATEGIC AnD BuSInESS RISK MAnAGEMEnTStrategic risk results from inadequate business plans, strategies, decision-making processes, allocation and use of the Bank’s resources, as well as its inability to adapt to changes in its operational framework.
Business risk is the potential adverse effect of changes in tax, economic, competitive, legal or accounting conditions on the Bank’s results.
REGULATION
CONTROL ENVIRONMENT CORPORATE GOVERNANCE(1)
HR AND CORPORATE GOVERNANCE COMMITTEE
BOARD OF DIRECTORS
AUDIT COMMITTEE
RISK MANAGEMENT COMMITTEE
RISK MANAGEMENT COMMITTEE
COORDINATORS
CHIEF EXECUTIVE OFFICER / CHIEF FINANCIAL OFFICER
CHIEF FINANCIAL OFFICER
CHIEF RISK OFFICER
CHIEF COMPLIANCE OFFICER
FUNCTIONS
MA
NA
GE
RS STRATEGIC PLANNING
FINANCIAL INTEGRITY
RISK MANAGEMENT
COMPLIANCE
INTERNAL AUDIT
CORPORATE CONTROL AND GOVERNANCE STRUCTURE
(1) Corporate governance provided by the Board of Directors and its committees.
HUMAN RESOURCES CORPORATE HUMAN RESOURCES
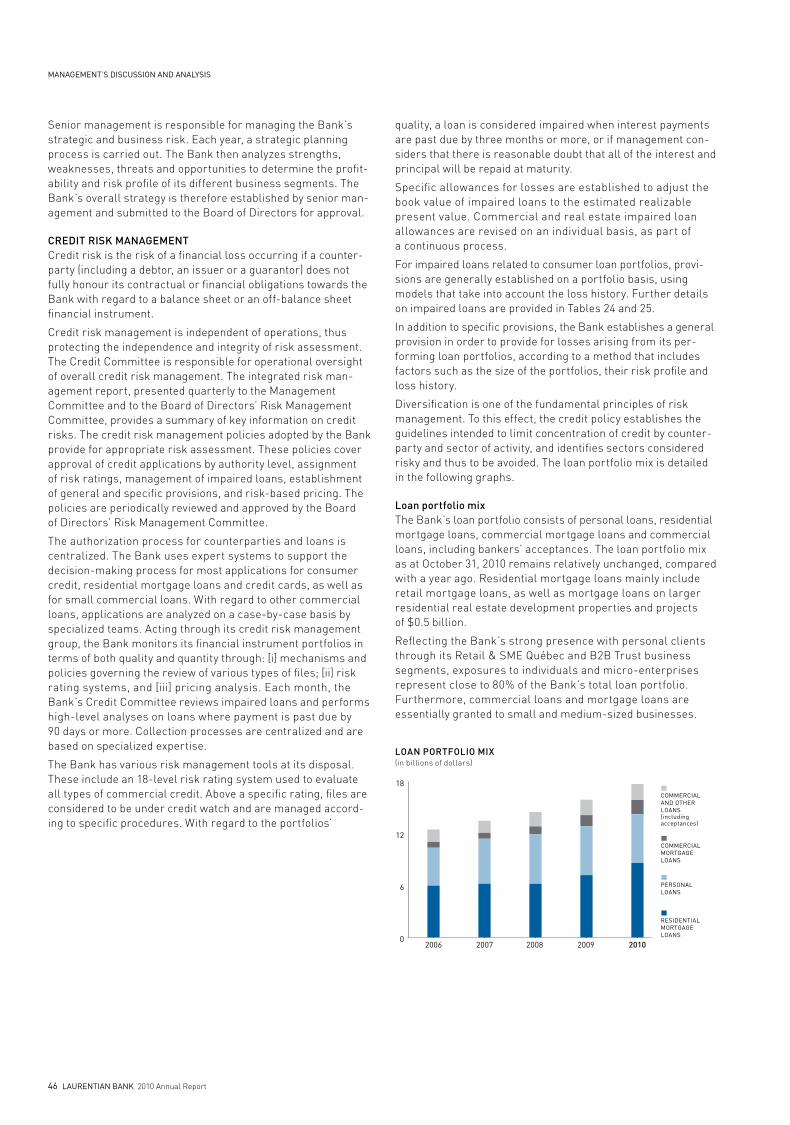
46 laurentian banK 2010 Annual Report
management’s discussion and analysis
Senior management is responsible for managing the Bank’s strategic and business risk. Each year, a strategic planning process is carried out. The Bank then analyzes strengths, weaknesses, threats and opportunities to determine the profit-ability and risk profile of its different business segments. The Bank’s overall strategy is therefore established by senior man-agement and submitted to the Board of Directors for approval.
CREDIT RISK MAnAGEMEnT Credit risk is the risk of a financial loss occurring if a counter-party (including a debtor, an issuer or a guarantor) does not fully honour its contractual or financial obligations towards the Bank with regard to a balance sheet or an off-balance sheet financial instrument.
Credit risk management is independent of operations, thus protecting the independence and integrity of risk assessment. The Credit Committee is responsible for operational oversight of overall credit risk management. The integrated risk man-agement report, presented quarterly to the Management Committee and to the Board of Directors’ Risk Management Committee, provides a summary of key information on credit risks. The credit risk management policies adopted by the Bank provide for appropriate risk assessment. These policies cover approval of credit applications by authority level, assignment of risk ratings, management of impaired loans, establishment of general and specific provisions, and risk-based pricing. The policies are periodically reviewed and approved by the Board of Directors’ Risk Management Committee.
The authorization process for counterparties and loans is centralized. The Bank uses expert systems to support the decision-making process for most applications for consumer credit, residential mortgage loans and credit cards, as well as for small commercial loans. With regard to other commercial loans, applications are analyzed on a case-by-case basis by specialized teams. Acting through its credit risk management group, the Bank monitors its financial instrument portfolios in terms of both quality and quantity through: [i] mechanisms and policies governing the review of various types of files; [ii] risk rating systems, and [iii] pricing analysis. Each month, the Bank’s Credit Committee reviews impaired loans and performs high-level analyses on loans where payment is past due by 90 days or more. Collection processes are centralized and are based on specialized expertise.
The Bank has various risk management tools at its disposal. These include an 18-level risk rating system used to evaluate all types of commercial credit. Above a specific rating, files are considered to be under credit watch and are managed accord-ing to specific procedures. With regard to the portfolios’
quality, a loan is considered impaired when interest payments are past due by three months or more, or if management con-siders that there is reasonable doubt that all of the interest and principal will be repaid at maturity.
Specific allowances for losses are established to adjust the book value of impaired loans to the estimated realizable present value. Commercial and real estate impaired loan allowances are revised on an individual basis, as part of a continuous process.
For impaired loans related to consumer loan portfolios, provi-sions are generally established on a portfolio basis, using models that take into account the loss history. Further details on impaired loans are provided in Tables 24 and 25.
In addition to specific provisions, the Bank establishes a general provision in order to provide for losses arising from its per-forming loan portfolios, according to a method that includes factors such as the size of the portfolios, their risk profile and loss history.
Diversification is one of the fundamental principles of risk management. To this effect, the credit policy establishes the guidelines intended to limit concentration of credit by counter-party and sector of activity, and identifies sectors considered risky and thus to be avoided. The loan portfolio mix is detailed in the following graphs.
Loan portfolio mix The Bank’s loan portfolio consists of personal loans, residential mortgage loans, commercial mortgage loans and commercial loans, including bankers’ acceptances. The loan portfolio mix as at October 31, 2010 remains relatively unchanged, compared with a year ago. Residential mortgage loans mainly include retail mortgage loans, as well as mortgage loans on larger residential real estate development properties and projects of $0.5 billion.
Reflecting the Bank’s strong presence with personal clients through its Retail & SME Québec and B2B Trust business segments, exposures to individuals and micro-enterprises represent close to 80% of the Bank’s total loan portfolio. Furthermore, commercial loans and mortgage loans are essentially granted to small and medium-sized businesses.
LOAN PORTFOLIO MIX(in billions of dollars)
RESIDENTIALMORTGAGE LOANS
PERSONALLOANS
COMMERCIALMORTGAGELOANS
COMMERCIALAND OTHERLOANS (including acceptances)
2006 2007 2008 2009 20100
6
12
18

management’s discussion and analysis
laurentian banK 2010 Annual Report 47
Geographic distributionThe Bank operates across Canada. In Québec, it offers most of its lending products mainly through its retail branch network and commercial banking centers. Throughout Canada, the Bank extends its operations through several other commercial banking centers. The Bank also offers its products to a wide network of independent financial intermediaries through B2B Trust. As of October 31, 2010, the proportion of loans granted in Québec represented 63% of total loans while loans granted outside of Québec stood at 37% (unchanged from October 31, 2009).
Insurance and guaranteesA significant proportion of the Bank’s loan portfolio is insured by Canada Mortgage and Housing Corporation (CMHC), or secured by assets pledged as collateral by borrowers.
CMHC offers a mortgage loan insurance program which ulti-mately aims to improve access to affordable mortgage loan financing for Canadians. As an approved lender under the program, the Bank benefits from insurance coverage, thereby reducing its global credit risk and improving its capital ratios. Moreover, by maintaining a high proportion of insured residential mortgage loans, the Bank retains its capacity to engage in securitization operations to finance its activities at optimal cost and manage its cash resources. By the end of fiscal 2010, 47% of residential mortgage loans were insured by CMHC, compared with 48% in 2009. The Bank considers that it holds excellent guarantees for the other conventional mortgage loans whose loan value never exceeds 80% of the initially estimated value of the property, in accordance with legal requirements.
Commercial mortgage loans are further secured by specific assets, including construction projects, commercial properties, shopping centers, office buildings, plants, warehouses and industrial condominiums. In general, the value of these loans does not exceed 60% to 75% of the initially estimated value of the property, depending on the nature of the loan.
B2B Trust’s investment loan portfolio consists mainly of mutual fund loans. Loan underwriting is subject to a rigorous process which allows for the efficient assessment of client credit risk. Authorizations are heavily based on clients’ loan servicing ability and overall financial strength, mainly based on credit scoring. Moreover, the portfolio is periodically analyzed to identify potential credit issues. In addition, loans are collateralized by a comprehensive list of eligible mutual and segregated funds. Stricter credit criteria must be met as loan-to-value ratios increase. For loans where disbursements are significant, addi-tional personal income and net worth information are usually required. Loan underwriting for home equity lines of credit and point-of-sale financing loans allows for the assessment of client credit risk. In addition, these loans are collateralized by real estate assets and other assets. Also, more than 10% of the Bank’s personal loan portfolio consists of student loans and loans granted under the Immigrant Investor program, which are guaranteed by the federal or provincial government.
Changes in loan portfolio mix Personal loans As at October 31, 2010, the personal loan portfolio was $5.6 billion, a slight decrease of $24.3 million compared to October 31, 2009. This resulted mainly from the decline in the point-of-sale financing portfolio, reflecting management’s decision to gradually reduce the risk related to these operations. Home equity lines of credit and B2B Trust’s investment loan portfolio rose by $74.4 million and $95.8 million respectively during the year.
QUÉBEC
GEOGRAPHIC DISTRIBUTION OF LOANS(in billions of dollars)
2008 2009 2010
PERSONALLOANS
RESIDENTIALMORTGAGE LOANS
COMMERCIALMORTGAGELOANS
COMMERCIALAND OTHERLOANS(including acceptances)
OTHER CANADIAN PROVINCES
2008 2009 20100
3
6
9
12
0
3
6
9
12
(1) Including credit card loans, student loans, loans granted under the Immigrant Investor program and other loans.
PERSONAL LOAN PORTFOLIO MIX(in billions of dollars)
INVESTMENTLOANS
LINESOF CREDIT
POINT-OF-SALEFINANCING
OTHERLOANS (1)
2006 2007 2008 2009 20100
2
4
6
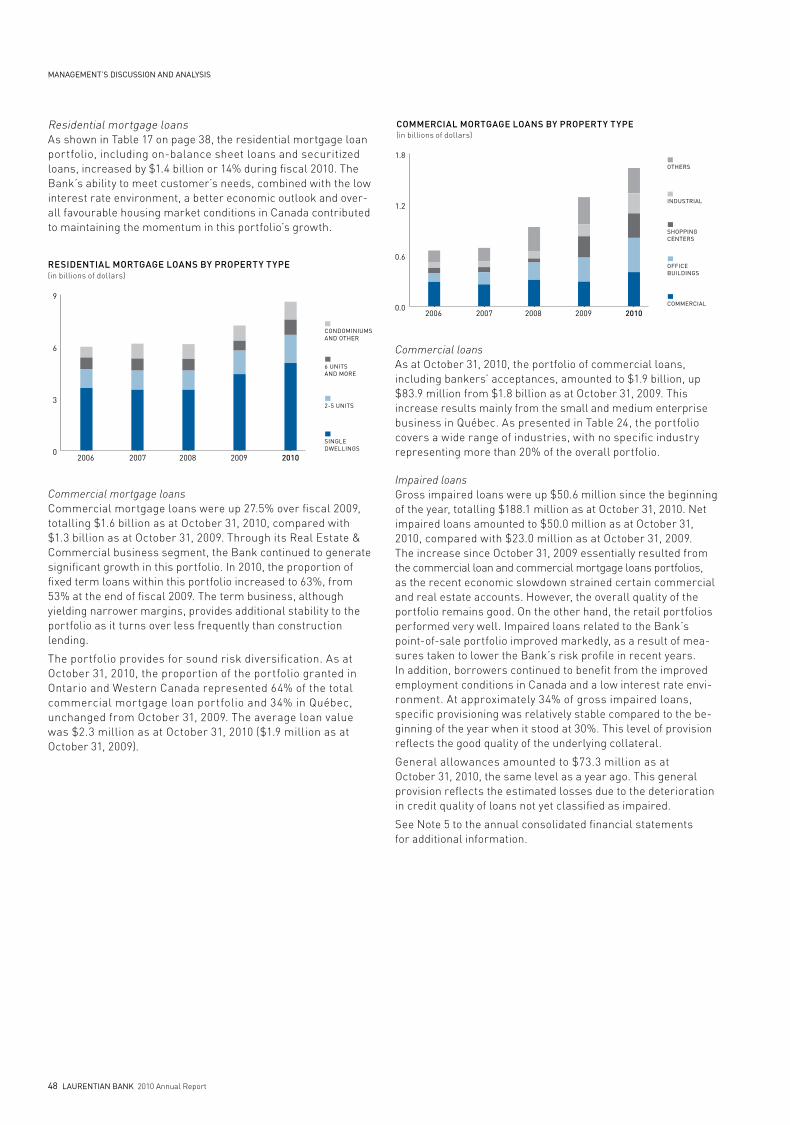
48 laurentian banK 2010 Annual Report
management’s discussion and analysis
Residential mortgage loansAs shown in Table 17 on page 38, the residential mortgage loan portfolio, including on-balance sheet loans and securitized loans, increased by $1.4 billion or 14% during fiscal 2010. The Bank’s ability to meet customer’s needs, combined with the low interest rate environment, a better economic outlook and over-all favourable housing market conditions in Canada contributed to maintaining the momentum in this portfolio’s growth.
Commercial mortgage loansCommercial mortgage loans were up 27.5% over fiscal 2009, totalling $1.6 billion as at October 31, 2010, compared with $1.3 billion as at October 31, 2009. Through its Real Estate & Commercial business segment, the Bank continued to generate significant growth in this portfolio. In 2010, the proportion of fixed term loans within this portfolio increased to 63%, from 53% at the end of fiscal 2009. The term business, although yielding narrower margins, provides additional stability to the portfolio as it turns over less frequently than construction lending.
The portfolio provides for sound risk diversification. As at October 31, 2010, the proportion of the portfolio granted in Ontario and Western Canada represented 64% of the total commercial mortgage loan portfolio and 34% in Québec, unchanged from October 31, 2009. The average loan value was $2.3 million as at October 31, 2010 ($1.9 million as at October 31, 2009).
COMMERCIAL MORTGAGE LOANS BY PROPERTY TYPE(in billions of dollars)
2006 2007 2008 2009 20100.0
0.6
1.2
1.8
INDUSTRIAL
OTHERS
SHOPPINGCENTERS
OFFICEBUILDINGS
COMMERCIAL
Commercial loans As at October 31, 2010, the portfolio of commercial loans, including bankers’ acceptances, amounted to $1.9 billion, up $83.9 million from $1.8 billion as at October 31, 2009. This increase results mainly from the small and medium enterprise business in Québec. As presented in Table 24, the portfolio covers a wide range of industries, with no specific industry representing more than 20% of the overall portfolio.
Impaired loansgross impaired loans were up $50.6 million since the beginning of the year, totalling $188.1 million as at October 31, 2010. Net impaired loans amounted to $50.0 million as at October 31, 2010, compared with $23.0 million as at October 31, 2009. The increase since October 31, 2009 essentially resulted from the commercial loan and commercial mortgage loans portfolios, as the recent economic slowdown strained certain commercial and real estate accounts. However, the overall quality of the portfolio remains good. On the other hand, the retail portfolios performed very well. Impaired loans related to the Bank’s point-of-sale portfolio improved markedly, as a result of mea-sures taken to lower the Bank’s risk profile in recent years. In addition, borrowers continued to benefit from the improved employment conditions in Canada and a low interest rate envi-ronment. At approximately 34% of gross impaired loans, specific provisioning was relatively stable compared to the be-ginning of the year when it stood at 30%. This level of provision reflects the good quality of the underlying collateral.
general allowances amounted to $73.3 million as at October 31, 2010, the same level as a year ago. This general provision reflects the estimated losses due to the deterioration in credit quality of loans not yet classified as impaired.
See Note 5 to the annual consolidated financial statements for additional information.
RESIDENTIAL MORTGAGE LOANS BY PROPERTY TYPE(in billions of dollars)
SINGLEDWELLINGS
2-5 UNITS
6 UNITSAND MORE
CONDOMINIUMSAND OTHER
2006 2007 2008 2009 20100
3
6
9
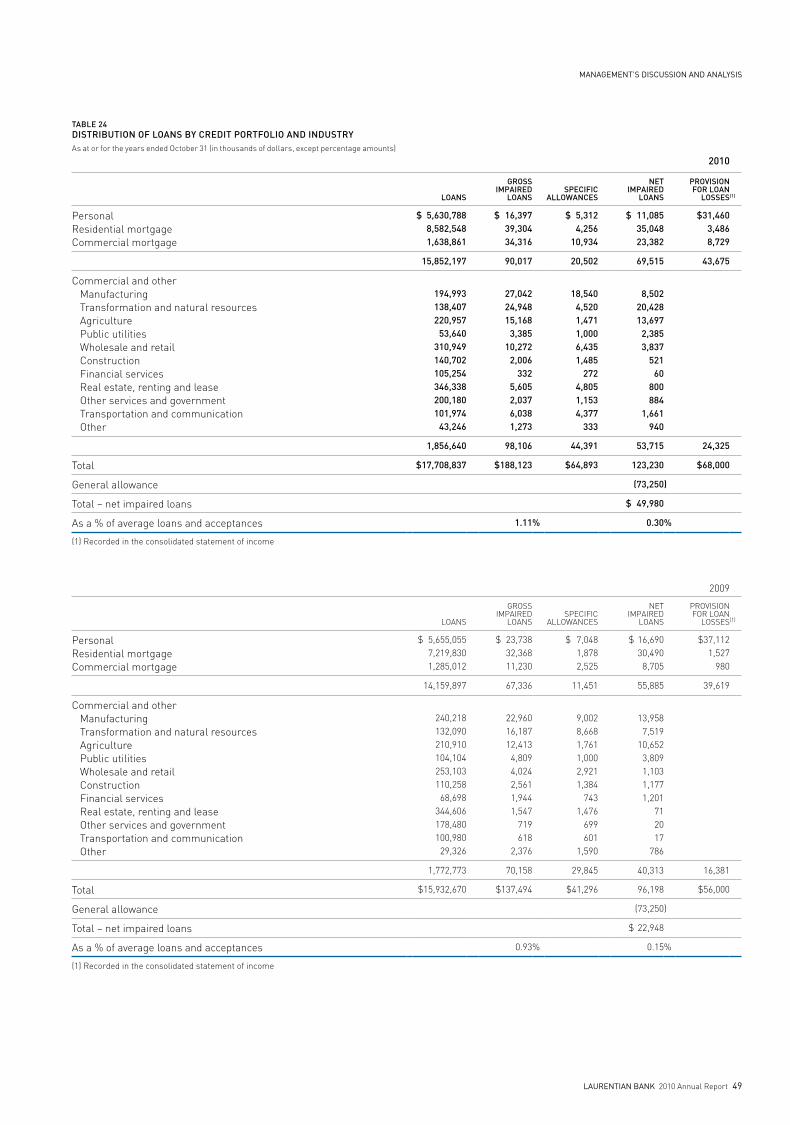
management’s discussion and analysis
laurentian banK 2010 Annual Report 49
TABLE 24DISTRIBuTIOn OF LOAnS By CREDIT PORTFOLIO AnD InDuSTRyAs at or for the years ended October 31 (in thousands of dollars, except percentage amounts)
2010
LOAnS
GROSSIMPAIRED
LOAnSSPECIFIC
ALLOWAnCES
nETIMPAIRED
LOAnS
PROvISIOnFOR LOAn
LOSSES(1)
PersonalResidential mortgageCommercial mortgage
$ 5,630,7888,582,5481,638,861
$ 16,39739,30434,316
$ 5,3124,256
10,934
$ 11,08535,04823,382
$31,4603,4868,729
15,852,197 90,017 20,502 69,515 43,675
Commercial and other Manufacturing Transformation and natural resources Agriculture Public utilities Wholesale and retail Construction Financial services Real estate, renting and lease Other services and government Transportation and communication Other
194,993138,407220,957
53,640310,949140,702105,254346,338200,180101,974
43,246
27,04224,94815,168
3,38510,272
2,006332
5,6052,0376,0381,273
18,5404,5201,4711,0006,4351,485
2724,8051,1534,377
333
8,50220,42813,697
2,3853,837
52160
800884
1,661940
1,856,640 98,106 44,391 53,715 24,325
Total $17,708,837 $188,123 $64,893 123,230 $68,000
general allowance (73,250)
Total – net impaired loans $ 49,980
As a % of average loans and acceptances 1.11 % 0.30 %
(1) Recorded in the consolidated statement of income
2009
LOANS
gROSSIMPAIRED
LOANSSPECIFIC
ALLOWANCES
NETIMPAIRED
LOANS
PROvISIONFOR LOAN
LOSSES(1)
PersonalResidential mortgageCommercial mortgage
$ 5,655,055 7,219,830 1,285,012
$ 23,738 32,368 11,230
$ 7,048 1,878 2,525
$ 16,690 30,490
8,705
$37,112 1,527
980
14,159,897 67,336 11,451 55,885 39,619
Commercial and other Manufacturing Transformation and natural resources Agriculture Public utilities Wholesale and retail Construction Financial services Real estate, renting and lease Other services and government Transportation and communication Other
240,218 132,090 210,910 104,104 253,103 110,258
68,698 344,606 178,480 100,980
29,326
22,960 16,187 12,413
4,809 4,024 2,561 1,944 1,547
719 618
2,376
9,002 8,668 1,761 1,000 2,921 1,384
743 1,476
699 601
1,590
13,958 7,519
10,652 3,809 1,103 1,177 1,201
71 20 17
786
1,772,773 70,158 29,845 40,313 16,381
Total $15,932,670 $137,494 $41,296 96,198 $56,000
general allowance (73,250)
Total – net impaired loans $ 22,948
As a % of average loans and acceptances 0.93% 0.15%
(1) Recorded in the consolidated statement of income
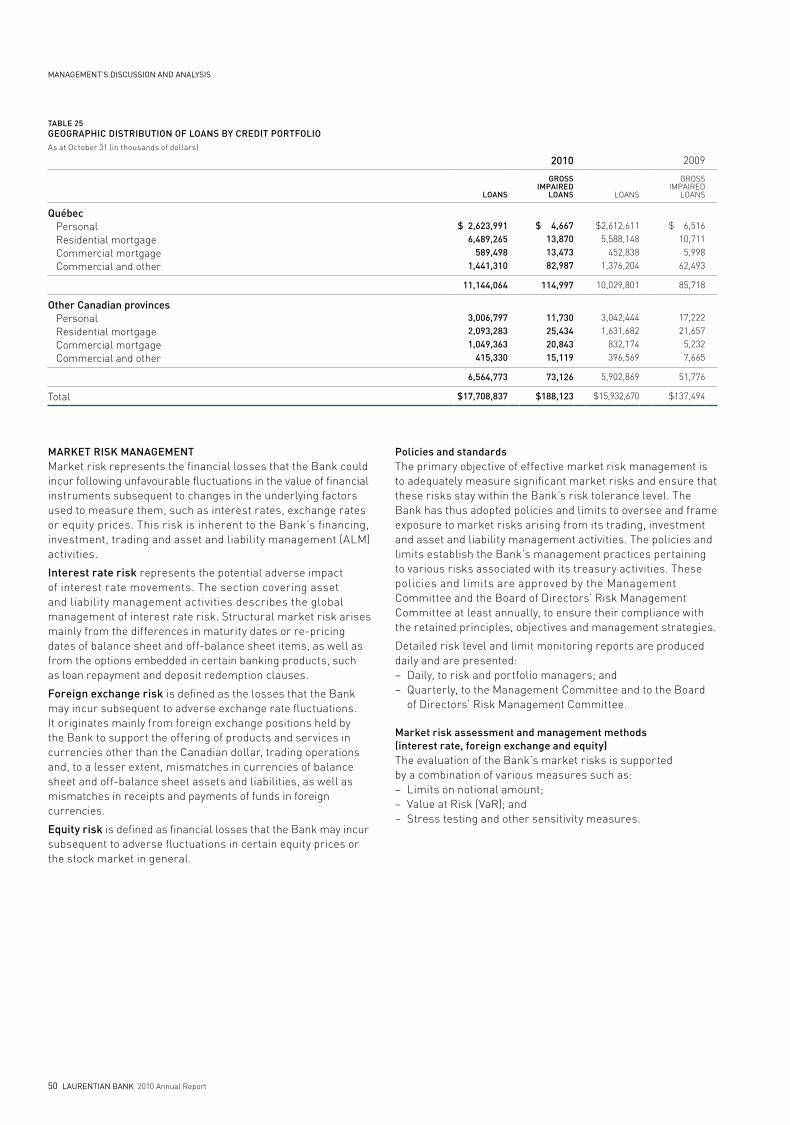
50 laurentian banK 2010 Annual Report
management’s discussion and analysis
TABLE 25GEOGRAPHIC DISTRIBuTIOn OF LOAnS By CREDIT PORTFOLIOAs at October 31 (in thousands of dollars)
2010 2009
LOAnS
GROSSIMPAIRED
LOAnS LOANS
gROSSIMPAIRED
LOANS
Québec Personal Residential mortgage Commercial mortgage Commercial and other
$ 2,623,991 6,489,265
589,498 1,441,310
$ 4,667 13,870 13,473 82,987
$2,612,611
5,588,148 452,838
1,376,204
$ 6,516 10,711
5,998 62,493
11,144,064 114,997 10,029,801 85,718
Other Canadian provinces Personal Residential mortgage Commercial mortgage Commercial and other
3,006,797 2,093,283 1,049,363
415,330
11,730 25,434 20,843 15,119
3,042,444 1,631,682
832,174 396,569
17,222 21,657
5,232 7,665
6,564,773 73,126 5,902,869 51,776
Total $17,708,837 $188,123 $15,932,670 $137,494
MARKET RISK MAnAGEMEnT Market risk represents the financial losses that the Bank could incur following unfavourable fluctuations in the value of financial instruments subsequent to changes in the underlying factors used to measure them, such as interest rates, exchange rates or equity prices. This risk is inherent to the Bank’s financing, investment, trading and asset and liability management (ALM) activities.
Interest rate risk represents the potential adverse impact of interest rate movements. The section covering asset and liability management activities describes the global management of interest rate risk. Structural market risk arises mainly from the differences in maturity dates or re-pricing dates of balance sheet and off-balance sheet items, as well as from the options embedded in certain banking products, such as loan repayment and deposit redemption clauses.
Foreign exchange risk is defined as the losses that the Bank may incur subsequent to adverse exchange rate fluctuations. It originates mainly from foreign exchange positions held by the Bank to support the offering of products and services in currencies other than the Canadian dollar, trading operations and, to a lesser extent, mismatches in currencies of balance sheet and off-balance sheet assets and liabilities, as well as mismatches in receipts and payments of funds in foreign currencies.
Equity risk is defined as financial losses that the Bank may incur subsequent to adverse fluctuations in certain equity prices or the stock market in general.
Policies and standards The primary objective of effective market risk management is to adequately measure significant market risks and ensure that these risks stay within the Bank’s risk tolerance level. The Bank has thus adopted policies and limits to oversee and frame exposure to market risks arising from its trading, investment and asset and liability management activities. The policies and limits establish the Bank’s management practices pertaining to various risks associated with its treasury activities. These policies and limits are approved by the Management Committee and the Board of Directors’ Risk Management Committee at least annually, to ensure their compliance with the retained principles, objectives and management strategies.
Detailed risk level and limit monitoring reports are produced daily and are presented: – Daily, to risk and portfolio managers; and– Quarterly, to the Management Committee and to the Board
of Directors’ Risk Management Committee.
Market risk assessment and management methods (interest rate, foreign exchange and equity)The evaluation of the Bank’s market risks is supported by a combination of various measures such as:– Limits on notional amount; – value at Risk (vaR); and– Stress testing and other sensitivity measures.
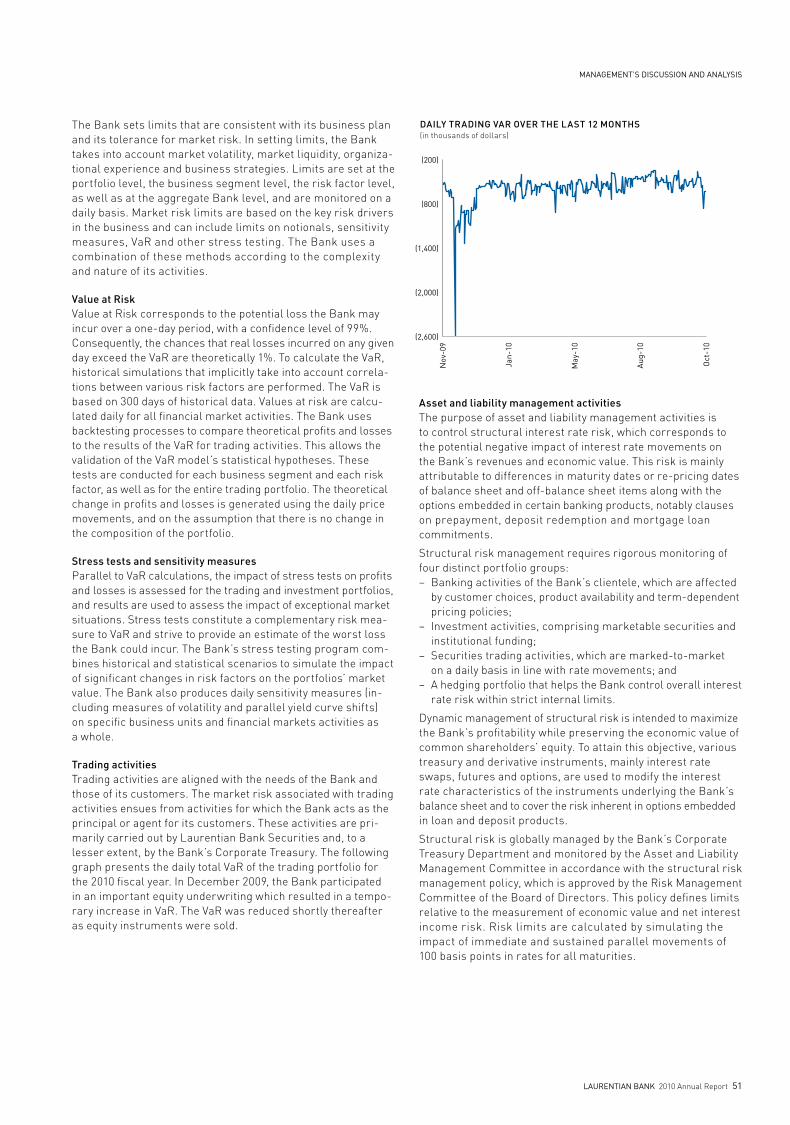
management’s discussion and analysis
laurentian banK 2010 Annual Report 51
The Bank sets limits that are consistent with its business plan and its tolerance for market risk. In setting limits, the Bank takes into account market volatility, market liquidity, organiza-tional experience and business strategies. Limits are set at the portfolio level, the business segment level, the risk factor level, as well as at the aggregate Bank level, and are monitored on a daily basis. Market risk limits are based on the key risk drivers in the business and can include limits on notionals, sensitivity measures, vaR and other stress testing. The Bank uses a combination of these methods according to the complexity and nature of its activities.
value at Risk value at Risk corresponds to the potential loss the Bank may incur over a one-day period, with a confidence level of 99%. Consequently, the chances that real losses incurred on any given day exceed the vaR are theoretically 1%. To calculate the vaR, historical simulations that implicitly take into account correla-tions between various risk factors are performed. The vaR is based on 300 days of historical data. values at risk are calcu-lated daily for all financial market activities. The Bank uses backtesting processes to compare theoretical profits and losses to the results of the vaR for trading activities. This allows the validation of the vaR model’s statistical hypotheses. These tests are conducted for each business segment and each risk factor, as well as for the entire trading portfolio. The theoretical change in profits and losses is generated using the daily price movements, and on the assumption that there is no change in the composition of the portfolio.
Stress tests and sensitivity measuresParallel to vaR calculations, the impact of stress tests on profits and losses is assessed for the trading and investment portfolios, and results are used to assess the impact of exceptional market situations. Stress tests constitute a complementary risk mea-sure to vaR and strive to provide an estimate of the worst loss the Bank could incur. The Bank’s stress testing program com-bines historical and statistical scenarios to simulate the impact of significant changes in risk factors on the portfolios’ market value. The Bank also produces daily sensitivity measures (in-cluding measures of volatility and parallel yield curve shifts) on specific business units and financial markets activities as a whole.
Trading activitiesTrading activities are aligned with the needs of the Bank and those of its customers. The market risk associated with trading activities ensues from activities for which the Bank acts as the principal or agent for its customers. These activities are pri-marily carried out by Laurentian Bank Securities and, to a lesser extent, by the Bank’s Corporate Treasury. The following graph presents the daily total vaR of the trading portfolio for the 2010 fiscal year. In December 2009, the Bank participated in an important equity underwriting which resulted in a tempo-rary increase in vaR. The vaR was reduced shortly thereafter as equity instruments were sold.
Asset and liability management activitiesThe purpose of asset and liability management activities is to control structural interest rate risk, which corresponds to the potential negative impact of interest rate movements on the Bank’s revenues and economic value. This risk is mainly attributable to differences in maturity dates or re-pricing dates of balance sheet and off-balance sheet items along with the options embedded in certain banking products, notably clauses on prepayment, deposit redemption and mortgage loan commitments.
Structural risk management requires rigorous monitoring of four distinct portfolio groups:– Banking activities of the Bank’s clientele, which are affected
by customer choices, product availability and term-dependent pricing policies;
– Investment activities, comprising marketable securities and institutional funding;
– Securities trading activities, which are marked-to-market on a daily basis in line with rate movements; and
– A hedging portfolio that helps the Bank control overall interest rate risk within strict internal limits.
Dynamic management of structural risk is intended to maximize the Bank’s profitability while preserving the economic value of common shareholders’ equity. To attain this objective, various treasury and derivative instruments, mainly interest rate swaps, futures and options, are used to modify the interest rate characteristics of the instruments underlying the Bank’s balance sheet and to cover the risk inherent in options embedded in loan and deposit products.
Structural risk is globally managed by the Bank’s Corporate Treasury Department and monitored by the Asset and Liability Management Committee in accordance with the structural risk management policy, which is approved by the Risk Management Committee of the Board of Directors. This policy defines limits relative to the measurement of economic value and net interest income risk. Risk limits are calculated by simulating the impact of immediate and sustained parallel movements of 100 basis points in rates for all maturities.
DAILY TRADING VAR OVER THE LAST 12 MONTHS (in thousands of dollars)
Nov
-09
Jan-
10
May
-10
Aug
-10
Oct
-10
(2,600)
(2,000)
(1,400)
(800)
(200)
(2,600)
(2,000)
(1,400)
(800)
(200)
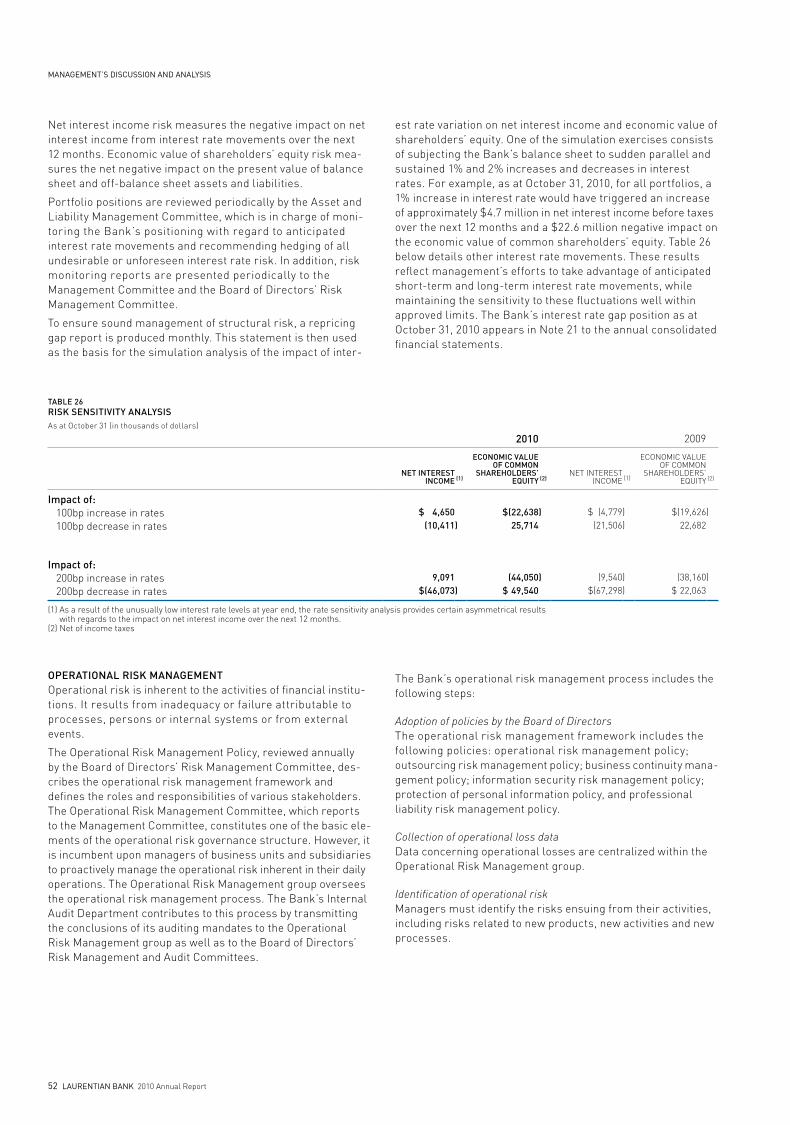
52 laurentian banK 2010 Annual Report
management’s discussion and analysis
Net interest income risk measures the negative impact on net interest income from interest rate movements over the next 12 months. Economic value of shareholders’ equity risk mea-sures the net negative impact on the present value of balance sheet and off-balance sheet assets and liabilities.
Portfolio positions are reviewed periodically by the Asset and Liability Management Committee, which is in charge of moni-toring the Bank’s positioning with regard to anticipated interest rate movements and recommending hedging of all undesirable or unforeseen interest rate risk. In addition, risk monitoring reports are presented periodically to the Management Committee and the Board of Directors’ Risk Management Committee.
To ensure sound management of structural risk, a repricing gap report is produced monthly. This statement is then used as the basis for the simulation analysis of the impact of inter-
est rate variation on net interest income and economic value of shareholders’ equity. One of the simulation exercises consists of subjecting the Bank’s balance sheet to sudden parallel and sustained 1% and 2% increases and decreases in interest rates. For example, as at October 31, 2010, for all portfolios, a 1% increase in interest rate would have triggered an increase of approximately $4.7 million in net interest income before taxes over the next 12 months and a $22.6 million negative impact on the economic value of common shareholders’ equity. Table 26 below details other interest rate movements. These results reflect management’s efforts to take advantage of anticipated short-term and long-term interest rate movements, while maintaining the sensitivity to these fluctuations well within approved limits. The Bank’s interest rate gap position as at October 31, 2010 appears in Note 21 to the annual consolidated financial statements.
TABLE 26RISK SEnSITIvITy AnALySISAs at October 31 (in thousands of dollars)
2010 2009
nET InTERESTInCOME (1)
ECOnOMIC vALuE OF COMMOn
SHAREHOLDERS’ EQuITy (2)
NET INTERESTINCOME (1)
ECONOMIC vALuE OF COMMON
SHAREHOLDERS’ EQuITY (2)
Impact of: 100bp increase in rates 100bp decrease in rates
$ 4,650 (10,411)
$ (22,638 25,714
)
$ (4,779 (21,506
))
$(19,626 22,682
)
Impact of: 200bp increase in rates 200bp decrease in rates
9,091 $(46,073)
(44,050 $ 49,540
)
(9,540$(67,298
))
(38,160 $ 22,063
)
(1) As a result of the unusually low interest rate levels at year end, the rate sensitivity analysis provides certain asymmetrical results with regards to the impact on net interest income over the next 12 months.
(2) Net of income taxes
OPERATIOnAL RISK MAnAGEMEnT Operational risk is inherent to the activities of financial institu-tions. It results from inadequacy or failure attributable to processes, persons or internal systems or from external events.
The Operational Risk Management Policy, reviewed annually by the Board of Directors’ Risk Management Committee, des-cribes the operational risk management framework and defines the roles and responsibilities of various stakeholders. The Operational Risk Management Committee, which reports to the Management Committee, constitutes one of the basic ele - ments of the operational risk governance structure. However, it is incumbent upon managers of business units and subsidiaries to proactively manage the operational risk inherent in their daily operations. The Operational Risk Management group oversees the operational risk management process. The Bank’s Internal Audit Department contributes to this process by transmitting the conclusions of its auditing mandates to the Operational Risk Management group as well as to the Board of Directors’ Risk Management and Audit Committees.
The Bank’s operational risk management process includes the following steps:
Adoption of policies by the Board of DirectorsThe operational risk management framework includes the following policies: operational risk management policy; outsourcing risk management policy; business continuity mana - gement policy; information security risk management policy; protection of personal information policy, and professional liability risk management policy.
Collection of operational loss dataData concerning operational losses are centralized within the Operational Risk Management group.
Identification of operational riskManagers must identify the risks ensuing from their activities, including risks related to new products, new activities and new processes.
management’s discussion and analysis
laurentian banK 2010 Annual Report 53
Evaluation of operational risks All of the Bank’s activities are grouped within large processes. Following any significant change to these processes or to the implementation of a new process, managers must perform an assessment to assign appropriate risk ratings to each of their processes. If necessary, action plans are designed to minimize any significant detected risks.
Management of operational riskOperational risk management means, among other things, deciding to accept, reduce, avoid or transfer certain risks and put in place appropriate procedures and control measures. The Bank uses several means to minimize or transfer its risks, including participation in a corporate insurance program and elaboration of a global and integrated plan for business conti-nuity. Furthermore, a Fraud Prevention Committee, composed of security specialists and business unit representatives meets periodically to analyze fraud trends and continuously improve the Bank’s methods and means of preventing fraud.
Production of operational risk reportsThe Operational Risk Management group produces reports that are sent to managers, members of the senior management team and the Risk Management Committee of the Board. These reports include information on operational losses per risk category and major business segment.
Outsourcing managementThe Bank has to rely on strategies to maintain a competitive cost structure and product diversification. Outsourcing consti-tutes one of these important strategies. It facilitates access to state-of-the-art technologies, fosters economies of scale and allows for process efficiency improvements. An outsourcing agreement will be deemed acceptable if it provides short- and long-term advantages to the Bank and involves an acceptable level of risk. The Bank has implemented an outsourcing risk management policy covering all of the Bank’s businesses. It is designed to oversee outsourcing activities and ensure that the major agreements are managed in a prudent manner and that their monitoring and supervision are adequate in accordance with their significance.
LIQuIDITy AnD FunDInG RISK MAnAGEMEnT Liquidity and funding risk represents the possibility that the Bank may not be able to gather sufficient cash resources when required and on reasonable conditions, to meet its financial obligations.
The Bank’s overall liquidity risk is managed by Corporate Treasury with oversight by a management committee in charge of asset and liability management, in accordance with the policies governing cash resources, financing and collateral manage-ment. The main purpose of these policies is to ensure that the Bank has sufficient cash resources to meet its current and future financial obligations, under both normal and stressed conditions.
The Bank monitors cash resources daily and ensures that liquidity indicators are within established limits. Liquidity management pays particular attention to deposit and loan maturities, as well as to funding availability and demand when planning financing. The Bank maintains a reserve of unencum-bered liquid assets that are readily available to face contin - gencies. It defines its cash requirements based on scenarios evaluating survival horizons that measure the period during which liquid assets could cover the withdrawal of wholesale financing and retail deposits. The Bank strives to maintain a stable volume of base deposits originating from its retail and brokerage clientele, as well as well-diversified financing sources. The Bank monitors guidelines on funding sources at the mana-gement and board level. Financing strategies also include loan securitization and the issuance of equity or debt instruments through capital markets. A liquidity contingency plan is pre-pared and reviewed on a regular basis. It provides a detailed action plan that would enable the Bank to fulfill its obligations in the event of an internal or external liquidity crisis.
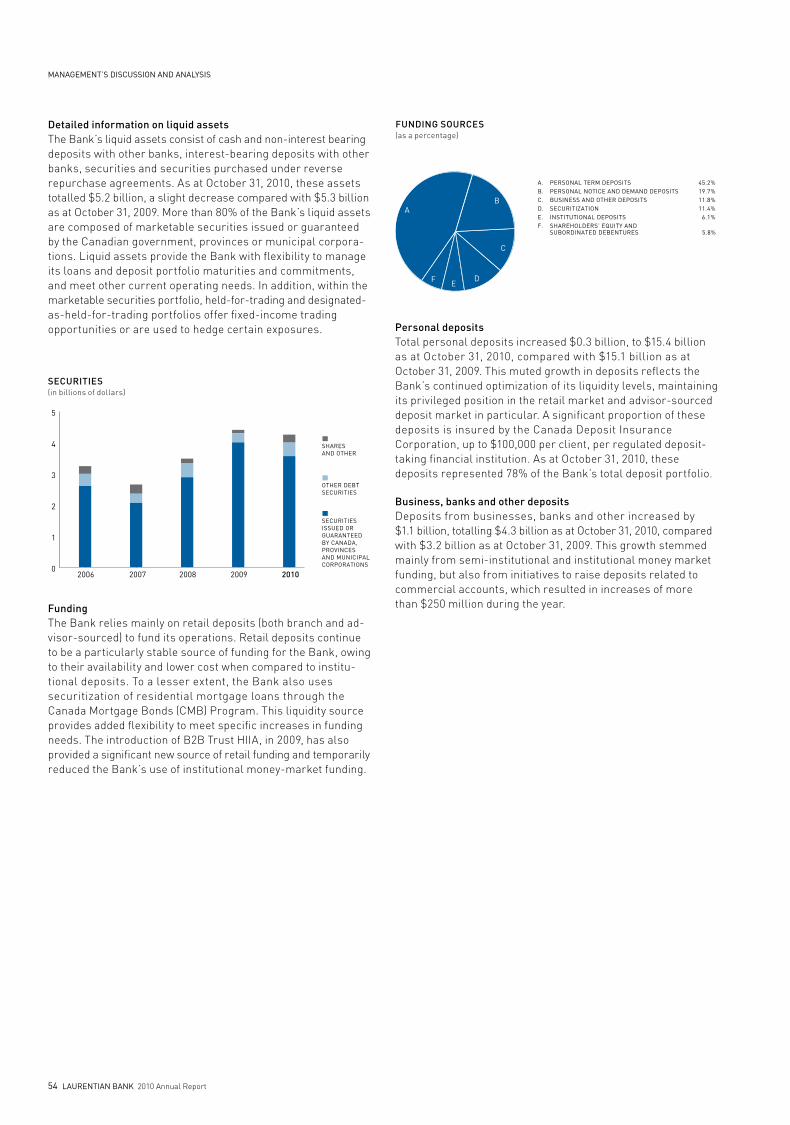
54 laurentian banK 2010 Annual Report
management’s discussion and analysis
Detailed information on liquid assetsThe Bank’s liquid assets consist of cash and non-interest bearing deposits with other banks, interest-bearing deposits with other banks, securities and securities purchased under reverse repurchase agreements. As at October 31, 2010, these assets totalled $5.2 billion, a slight decrease compared with $5.3 billion as at October 31, 2009. More than 80% of the Bank’s liquid assets are composed of marketable securities issued or guaranteed by the Canadian government, provinces or municipal corpora-tions. Liquid assets provide the Bank with flexibility to manage its loans and deposit portfolio maturities and commitments, and meet other current operating needs. In addition, within the marketable securities portfolio, held-for-trading and designated-as-held-for-trading portfolios offer fixed-income trading opportunities or are used to hedge certain exposures.
Funding The Bank relies mainly on retail deposits (both branch and ad-visor-sourced) to fund its operations. Retail deposits continue to be a particularly stable source of funding for the Bank, owing to their availability and lower cost when compared to institu-tional deposits. To a lesser extent, the Bank also uses securitization of residential mortgage loans through the Canada Mortgage Bonds (CMB) Program. This liquidity source provides added flexibility to meet specific increases in funding needs. The introduction of B2B Trust HIIA, in 2009, has also provided a significant new source of retail funding and temporarily reduced the Bank’s use of institutional money-market funding.
A. PERSONAL TERM DEPOSITS 45.2%B. PERSONAL NOTICE AND DEMAND DEPOSITS 19.7%C. BUSINESS AND OTHER DEPOSITS 11.8%D. SECURITIZATION 11.4%E. INSTITUTIONAL DEPOSITS 6.1%F. SHAREHOLDERS’ EQUITY AND SUBORDINATED DEBENTURES 5.8%
AB
C
DEF
FUNDING SOURCES(as a percentage)
Personal depositsTotal personal deposits increased $0.3 billion, to $15.4 billion as at October 31, 2010, compared with $15.1 billion as at October 31, 2009. This muted growth in deposits reflects the Bank’s continued optimization of its liquidity levels, maintaining its privileged position in the retail market and advisor-sourced deposit market in particular. A significant proportion of these deposits is insured by the Canada Deposit Insurance Corporation, up to $100,000 per client, per regulated deposit-taking financial institution. As at October 31, 2010, these deposits represented 78% of the Bank’s total deposit portfolio.
Business, banks and other depositsDeposits from businesses, banks and other increased by $1.1 billion, totalling $4.3 billion as at October 31, 2010, compared with $3.2 billion as at October 31, 2009. This growth stemmed mainly from semi-institutional and institutional money market funding, but also from initiatives to raise deposits related to commercial accounts, which resulted in increases of more than $250 million during the year.
SECURITIES(in billions of dollars)
SECURITIES ISSUED OR GUARANTEED BY CANADA, PROVINCES AND MUNICIPAL CORPORATIONS
OTHER DEBTSECURITIES
SHARESAND OTHER
2006 2007 2008 2009 20100
1
2
3
4
5
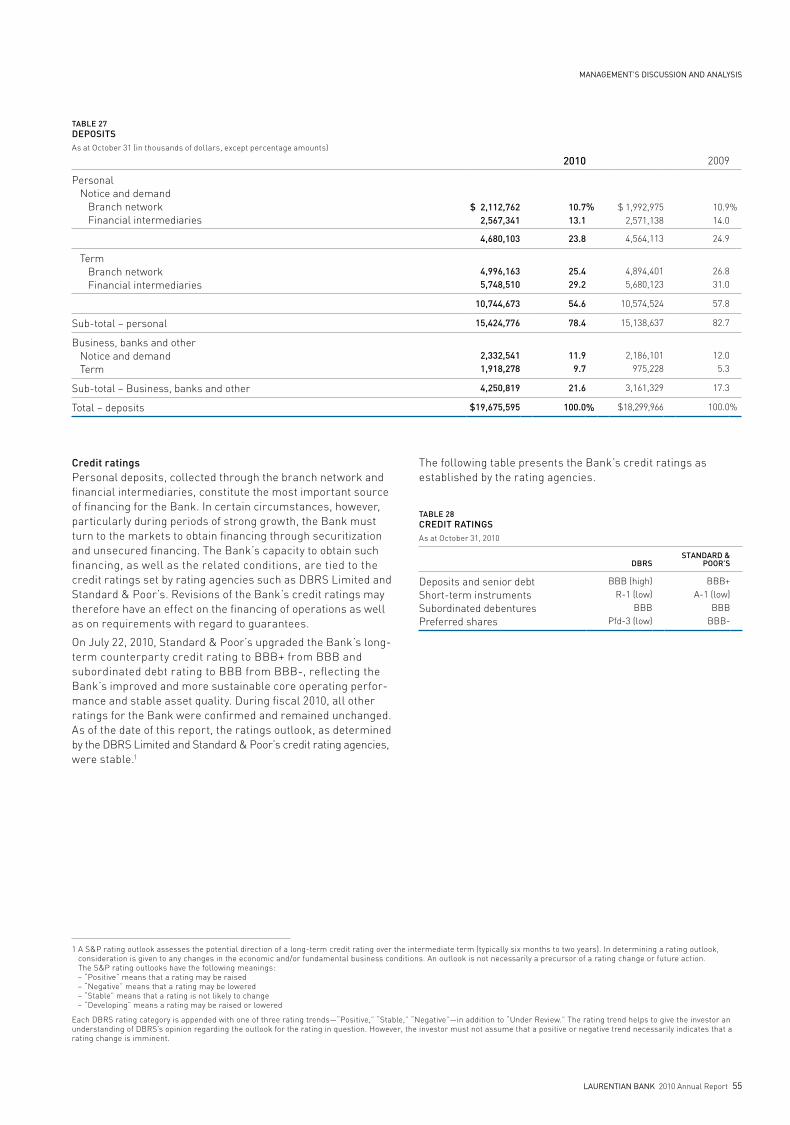
management’s discussion and analysis
laurentian banK 2010 Annual Report 55
TABLE 27DEPOSITSAs at October 31 (in thousands of dollars, except percentage amounts)
2010 2009
Personal Notice and demand Branch network Financial intermediaries
$ 2,112,762 2,567,341
10.7 13.1
% $ 1,992,975 2,571,138
10.9 14.0
%
4,680,103 23.8 4,564,113 24.9
Term Branch network Financial intermediaries
4,996,163 5,748,510
25.4 29.2
4,894,401
5,680,123 26.8 31.0
10,744,673 54.6 10,574,524 57.8
Sub-total – personal 15,424,776 78.4 15,138,637 82.7
Business, banks and other Notice and demand Term
2,332,541 1,918,278
11.9 9.7
2,186,101 975,228
12.0 5.3
Sub-total – Business, banks and other 4,250,819 21.6 3,161,329 17.3
Total – deposits $19,675,595 100.0 % $18,299,966 100.0 %
Credit ratingsPersonal deposits, collected through the branch network and financial intermediaries, constitute the most important source of financing for the Bank. In certain circumstances, however, particularly during periods of strong growth, the Bank must turn to the markets to obtain financing through securitization and unsecured financing. The Bank’s capacity to obtain such financing, as well as the related conditions, are tied to the credit ratings set by rating agencies such as DBRS Limited and Standard & Poor’s. Revisions of the Bank’s credit ratings may therefore have an effect on the financing of operations as well as on requirements with regard to guarantees.
On July 22, 2010, Standard & Poor’s upgraded the Bank’s long-term counterparty credit rating to BBB+ from BBB and subordinated debt rating to BBB from BBB-, reflecting the Bank’s improved and more sustainable core operating perfor-mance and stable asset quality. During fiscal 2010, all other ratings for the Bank were confirmed and remained unchanged. As of the date of this report, the ratings outlook, as determined by the DBRS Limited and Standard & Poor’s credit rating agencies, were stable.1
The following table presents the Bank’s credit ratings as established by the rating agencies.
TABLE 28CREDIT RATInGSAs at October 31, 2010
DBRSSTAnDARD &
POOR’S
Deposits and senior debtShort-term instrumentsSubordinated debenturesPreferred shares
BBB (high) R-1 (low)
BBB Pfd-3 (low)
BBB+ A-1 (low)
BBB BBB-
1 A S&P rating outlook assesses the potential direction of a long-term credit rating over the intermediate term (typically six months to two years). In determining a rating outlook, consideration is given to any changes in the economic and/or fundamental business conditions. An outlook is not necessarily a precursor of a rating change or future action. The S&P rating outlooks have the following meanings:– “Positive” means that a rating may be raised– “Negative” means that a rating may be lowered– “Stable” means that a rating is not likely to change– “Developing” means a rating may be raised or lowered
Each DBRS rating category is appended with one of three rating trends—“Positive,” “Stable,” “Negative”—in addition to “under Review.” The rating trend helps to give the investor an understanding of DBRS’s opinion regarding the outlook for the rating in question. However, the investor must not assume that a positive or negative trend necessarily indicates that a rating change is imminent.
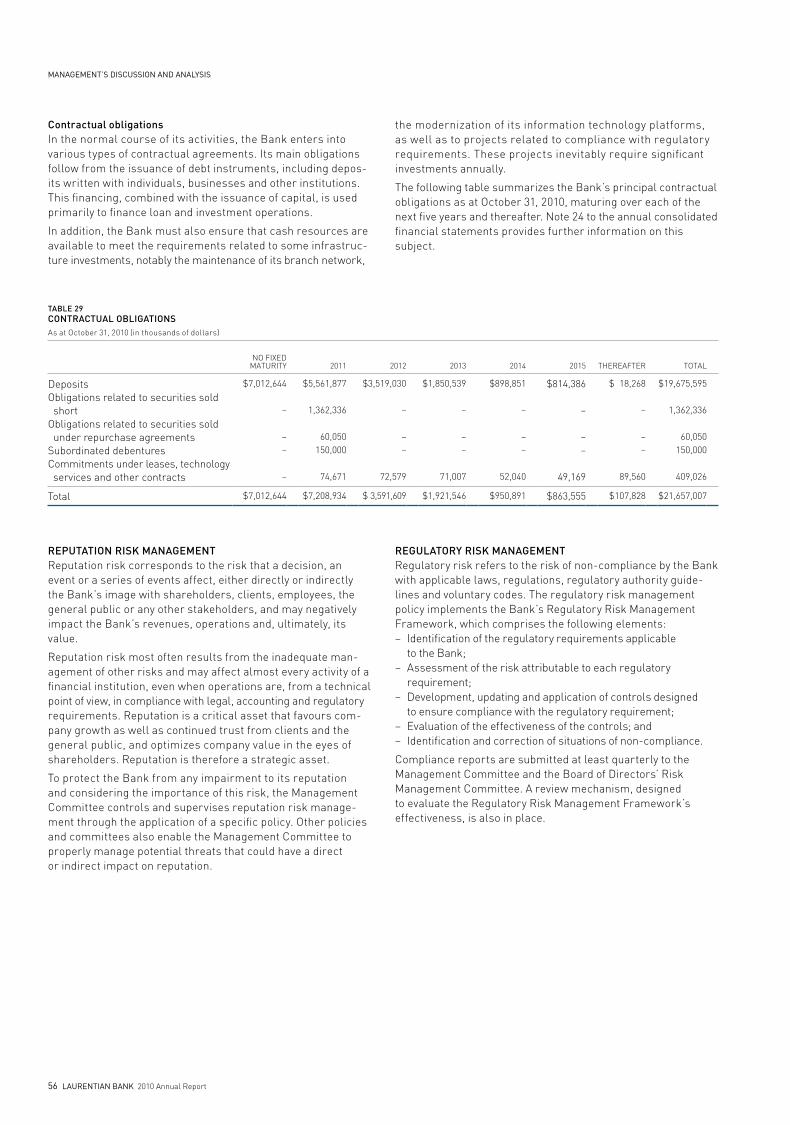
56 laurentian banK 2010 Annual Report
management’s discussion and analysis
Contractual obligations In the normal course of its activities, the Bank enters into various types of contractual agreements. Its main obligations follow from the issuance of debt instruments, including depos-its written with individuals, businesses and other institutions. This financing, combined with the issuance of capital, is used primarily to finance loan and investment operations.
In addition, the Bank must also ensure that cash resources are available to meet the requirements related to some infrastruc-ture investments, notably the maintenance of its branch network,
the modernization of its information technology platforms, as well as to projects related to compliance with regulatory requirements. These projects inevitably require significant investments annually.
The following table summarizes the Bank’s principal contractual obligations as at October 31, 2010, maturing over each of the next five years and thereafter. Note 24 to the annual consolidated financial statements provides further information on this subject.
TABLE 29COnTRACTuAL OBLIGATIOnSAs at October 31, 2010 (in thousands of dollars)
NO FIxED
MATuRITY 2011 2012 2013 2014 2015 THEREAFTER TOTAL
DepositsObligations related to securities sold shortObligations related to securities sold under repurchase agreementsSubordinated debenturesCommitments under leases, technology services and other contracts
$7,012,644
–
– –
–
$5,561,877
1,362,336
60,050150,000
74,671
$3,519,030
–
– –
72,579
$1,850,539
–
– –
71,007
$898,851
–
– –
52,040
$814,386
–
– –
49,169
$ 18,268
–
– –
89,560
$19,675,595
1,362,336
60,050 150,000
409,026
Total $7,012,644 $7,208,934 $ 3,591,609 $1,921,546 $950,891 $863,555 $107,828 $21,657,007
REPuTATIOn RISK MAnAGEMEnT Reputation risk corresponds to the risk that a decision, an event or a series of events affect, either directly or indirectly the Bank’s image with shareholders, clients, employees, the general public or any other stakeholders, and may negatively impact the Bank’s revenues, operations and, ultimately, its value.
Reputation risk most often results from the inadequate man-agement of other risks and may affect almost every activity of a financial institution, even when operations are, from a technical point of view, in compliance with legal, accounting and regulatory requirements. Reputation is a critical asset that favours com-pany growth as well as continued trust from clients and the general public, and optimizes company value in the eyes of shareholders. Reputation is therefore a strategic asset.
To protect the Bank from any impairment to its reputation and considering the importance of this risk, the Management Committee controls and supervises reputation risk manage-ment through the application of a specific policy. Other policies and committees also enable the Management Committee to properly manage potential threats that could have a direct or indirect impact on reputation.
REGuLATORy RISK MAnAGEMEnT Regulatory risk refers to the risk of non-compliance by the Bank with applicable laws, regulations, regulatory authority guide-lines and voluntary codes. The regulatory risk management policy implements the Bank’s Regulatory Risk Management Framework, which comprises the following elements:– Identification of the regulatory requirements applicable
to the Bank;– Assessment of the risk attributable to each regulatory
requirement;– Development, updating and application of controls designed
to ensure compliance with the regulatory requirement;– Evaluation of the effectiveness of the controls; and– Identification and correction of situations of non-compliance.
Compliance reports are submitted at least quarterly to the Management Committee and the Board of Directors’ Risk Management Committee. A review mechanism, designed to evaluate the Regulatory Risk Management Framework’s effectiveness, is also in place.
management’s discussion and analysis
laurentian banK 2010 Annual Report 57
InSuRAnCE RISK MAnAGEMEnTInsurance risk is the risk of loss that may occur when hypothe-ses related to creditor insurance products offered by the Bank, notably with regard to the determination of assumptions used to set premiums or for valuation of reserves, differ from actual insurance underwriting results.
Insurance risk is managed within an independently managed program overseen by experts in the insurance field and by Bank representatives. Reinsurance protections are underwritten to reduce the Bank’s exposure that would arise from significant claims and catastrophes, including terrorist events. In addition, design and pricing of insurance products distributed by the Bank are reviewed by actuarial consultants, based on best practices.
EnvIROnMEnTAL RISK MAnAGEMEnTEnvironmental risk is the risk of financial loss when restoring the assets of the Bank or those seized from clients to a sound environmental state.
Environmental risk related to financing activities is managed within the loan approval process, while risks related to the Bank’s assets, although limited, are mainly managed by the Real Estate segment.
ADDITIOnAL RISKS THAT COuLD POTEnTIALLy AFFECT FuTuRE RESuLTSThe major business risks that may affect the Bank’s results are detailed in the previous sections. This section describes other factors that could have a significant impact on the Bank’s results and cause these results to differ materially from our forward-looking statements as described at the beginning of this Annual Report. Although the Bank maintains comprehen-sive controls and processes to mitigate the risks associated with these factors, by their very nature, they may significantly impact the Bank’s performance.
Economic climate in CanadaThe Bank operates mainly in Québec and Ontario but also, to a lesser extent, in the rest of Canada. Consequently, its earnings are particularly sensitive to the economic and commercial cli-mate in Canada. Major factors include interest rates, inflation, capital market fluctuations, the strength of the economy and the Bank’s volume of business in certain key regions. A pro-longed deterioration in the Canadian economic climate could therefore adversely affect the Bank’s activities.
Monetary policies and other policiesThe monetary policies adopted by the Bank of Canada and the u.S. Federal Reserve’s Board of governors, as well as other measures adopted by central banks, have a major impact on several variables, such as interest rates, exchange rates and bond markets, that can have an impact on the Bank’s earnings. The Bank has no control, however, on changes in monetary policies, nor on capital markets fluctuations.
CompetitionThe Bank’s performance is affected by the level of competition in its markets. The intense competition in the financial services industry could interfere with the Bank’s capacity to reach its objectives. Several factors, including the price of products and services, their quality and variety, and also the actions taken by its competitors, could negatively impact the Bank’s positioning.
Legislative and regulatory amendments and legal proceedingsLegislative and regulatory amendments could affect the Bank by impacting its product and service offering and modifying the financial industry’s competitiveness. Moreover, the Bank’s fail-ure to comply with applicable legislation and regulations could result in sanctions and financial penalties that would have a negative impact on its earnings and reputation. As well, legal proceedings could affect the Bank negatively. Further details are provided in Note 26 to the annual consolidated financial statements.
Ability to attract and retain key employeesThe Bank’s future performance is largely dependent on its ability to attract and retain key employees. Within the financial industry, competition for employees and executives is quite in-tense, and there can be no assurance that the Bank will be able to attract and retain these individuals, which could significantly impact its operations and competitiveness.
Business infrastructureThe Bank deals with third parties to secure the components essential to its business infrastructure, such as Internet connections and various communication and database ser-vices. Disruption of such services could adversely affect the Bank’s capacity to provide its products and services to its various clienteles, and ensure the continuity of its ongoing operations.
Other factorsOther factors, which are not under the Bank’s control, could affect results, as discussed in the Caution Regarding Forward-Looking Statements at the beginning of this Annual Report. It should be noted that the foregoing list of factors is not exhaustive.
58 laurentian banK 2010 Annual Report
management’s discussion and analysis
disclosure controls and Procedures and internal control oVer Financial rePorting
Disclosure controls and procedures (DC&P) are designed to provide reasonable assurance that all relevant information has been collected and submitted to the Bank’s senior management which ensures adequate disclosure of such information. Internal control over financial reporting (ICFR) is a process designed to provide reasonable assurance regarding the reliability of financial reporting and the preparation of financial statements in accor-dance with the Canadian gAAP.
The President and Chief Executive Officer, and the Executive vice-President and Chief Financial Officer are responsible for the implementation and maintenance of DC&P and ICFR, as set out in Multilateral Instrument 52-109 regarding the Certifi-cation of Disclosure in Issuers’ Annual and Interim Filings. They are assisted in this task by the Disclosure Committee, which is comprised of members of the Bank’s senior management.
The President and Chief Executive Officer and the Executive vice-President and Chief Financial Officer caused to be evalu-ated under their supervision the effectiveness of DC&P as at October 31, 2010 and, based on that evaluation, concluded that they were effective at that date and adequately designed.
Also as at October 31, 2010, the President and Chief Executive Officer and the Executive vice-President and Chief Financial Officer caused to be evaluated under their supervision the effectiveness of ICFR and, based on that evaluation, concluded that it was effective at that date and adequately designed.
The DC&P evaluation was performed using the control framework established by the Committee of Sponsoring Organizations of the Treadway Commission (COSO). The evalu-ation of the design and effectiveness of internal control over financial reporting was performed in accordance with the COSO control framework for entity level and financial controls, and Control Objectives for Information and Related Techno-logies (COBIT) for general IT controls.
given the inherent limitations of any control systems, ma-nagement’s evaluation of controls can only provide reasonable, not absolute assurance that all control issues that may result in material misstatement, if any, have been detected.
Changes to Internal Control over Financial Reporting During the year ended October 31, 2010, no changes to internal control over financial reporting affected materially, or are rea-sonably likely to materially affect, internal control over financial reporting.
critical accounting Policies and estimates
The significant accounting policies followed by the Bank are outlined in Notes 2 and 3 to the annual consolidated financial statements. Some of these accounting policies are deemed critical as they require management to make estimates that, by their very nature, involve uncertainties. Changes in these estimates could materially affect the Bank’s consolidated financial statements. The critical accounting policies that require management’s judgment and estimates are described below.
ALLOWAnCE FOR LOAn LOSSES The allowance for loan losses reflects management’s estimate of losses related to the loan portfolios. Management regularly reviews the portfolios’ credit quality to ensure the adequacy of the allowance for loan losses. This allowance is dependent upon the evaluation of the amounts and dates of future cash flows, the fair value of guarantees and realization costs, and the interpretation of the impact of market and economic conditions.
Considering the materiality of the amounts and their inherent uncertainty, the use of estimates and assumptions that differ from those used in determining the allowance for loan losses could produce significantly different levels of allowances. Changes in circumstances may cause future assessments of credit risk to be materially different from current assessments and may consequently entail a significant increase or a decrease in the allowance for loan losses in the consolidated statement of income for a given fiscal year. A detailed description of the methods used to determine the allowance for loan losses can be found in Note 3 to the annual consolidated financial statements, and in the Credit Risk Management section on page 46 of this MD&A.
Management has developed a valuation model for the general allowance, based on the historical losses of the various portfolios. This model validates the $73.3 million allowance as at October 31, 2010. Changes in assumptions and parameters to this model could have produced different valuations.
This critical accounting estimate affects all business segments.
management’s discussion and analysis
laurentian banK 2010 Annual Report 59
FAIR vALuE OF FInAnCIAL InSTRuMEnTSThe Bank reports most of its financial instruments, including derivative financial instruments, at fair value. Fair value is defined as the amount of consideration that would be agreed upon in an arm’s length transaction between knowledgeable, willing parties who are under no compulsion to act. Changes in the fair value of the Bank’s trading book’s securities and obligations related to assets sold short, as well as derivatives not designated in hedge relationships, are generally recognized under other income.
Management uses quoted market prices in active markets, when available, as the best evidence of fair value of its financial instruments as it requires minimal subjectivity. Quoted prices include those obtained from an exchange, a broker, dealer, industry group or from pricing services. If quoted market prices are not available, the Bank typically uses pricing models based on the discounted value of future cash flows. These models may include observable or unobservable market parameters.
Management’s judgment is required when observable market prices do not exist or when only prices from inactive markets are available. Judgment may also be required to develop valua-tion techniques and determine parameters that are not readily observable on the market. Additional information on fair value is presented in Note 20 to the annual consolidated financial statements.
Available-for-sale financial assets are assessed for impair-ment periodically, and management must examine various factors to determine whether a decline in fair value is other than temporary. These factors include the type of investment as well as the length of time and extent by which fair value is below amortized cost. In addition, management considers other factors such as bankruptcy, capital restructuring or dilution, significant modifications in the issuer’s operations or other uncertainties. Management must also assert its intent and ability to hold the securities until recovery.
The use of other alternative assumptions could translate into significantly different income recognition.
These critical accounting estimates mainly affect the Laurentian Bank Securities & Capital Markets and Other segments. Addi-tional information on the calculation of fair value is provided in Note 20 to the annual consolidated financial statements.
SECuRITIZATIOnSecuritization is a process whereby financial assets, essentially mortgage loans for the Bank, are converted into securities and sold to investors. When the Bank surrenders control over the receivables sold and receives a consideration other than a beneficial interest in the transferred assets, the transaction is accounted for as a sale.
The determination of the initial gain, in such circumstances, depends on the fair value attributed to certain retained inter-ests, mainly rights to future excess interest spreads and cash reserve accounts, as well as to seller swaps. Since quoted market prices generally do not exist for these financial instru-ments, management estimates their fair value based on the present value of expected future cash flows. Management must therefore use best estimates with respect to key assumptions, particularly for expected credit losses, anticipated prepayment rates, risk-adjusted discount rates and other factors that influ-ence the value of these instruments. Moreover, these fair values must be reviewed periodically thereafter.
The fair value of retained interests for securitized mortgage loans was $97.1 million as at October 31, 2010. Note 6 to the annual consolidated financial statements presents a sensitivity analysis of the current fair value of these retained interests to immediate 10% and 20% adverse changes in key assumptions. The fair value of seller swaps was –$81.9 million as at October 31, 2010. Different assumptions with regard to anti-cipated prepayment rates and risk-adjusted discount rates could translate into significantly different fair values for these instruments.
This critical accounting estimate mainly affects the Other segment.
The Off-Balance Sheet Arrangements section on page 39 of this MD&A provides further information on these transactions.
EMPLOyEE FuTuRE BEnEFITSvaluation of employee future benefits for defined benefit plans and other post-employment benefits is based on a number of assumptions such as discount rates, expected returns on plan assets, future salary levels, health-care cost escalation, em-ployee turnover rate and retirement age of employees. These assumptions are reviewed annually in accordance with accepted actuarial practice and approved by management.
The discount rate used in determining the actual costs and obligations related to pension plans and other future benefits reflects the market yields, as at the measurement date, on high-quality debt instruments with cash flows matching ex-pected benefit payments. The expected rate of return on the plans’ assets corresponds to the expected returns on various asset categories, weighted by the portfolio’s allocation during the fiscal year. Anticipated future long-term performance of individual asset categories is taken into account, according to the expected future inflation rate and the effective yields on fixed income securities and equities. Other assumptions are based on the plans’ actual results and management’s best estimates.
60 laurentian banK 2010 Annual Report
management’s discussion and analysis
In accordance with Canadian gAAP, actual results that differ from the expected results as determined using the assump-tions are accumulated and amortized over future periods and therefore affect actual costs for these periods. As at October 31, 2010, the net amount of the unamortized actuarial losses was $116.9 million ($84.5 million in 2009) for pension plans, and $13.9 million ($12.9 million in 2009) for other benefits.
Discount rates stood at 5.40% as at October 31, 2010 and 6.50% as at October 31, 2009. The expected long-term rate of return on plan assets was unchanged at 7.25% for fiscal 2010 and 2009. The trend rate of the estimated annual growth of health-care costs covered, per participant, has been set at 9.4% for 2010 (10.0% for 2009). According to the accepted assumption, this rate should decrease progressively, reaching 4.0% in 2019 and remaining at that level thereafter.
Considering the importance of accrued benefit obligations and plan assets, changes in assumptions could have a significant impact on the accrued benefit assets (liabilities), as well as on pension plan and other employee future benefit expenses. Table 30 summarizes the impact of a 0.25% increase or de-crease in the key assumptions on accrued benefit obligations as at October 31, 2010 and related defined benefit pension plan costs for 2011.
TABLE 30SEnSITIvITy AnALySIS(in millions of dollars)
POTENTIAL IMPACT
OF CHANgES OF 0.25%
OBLIgATION COST
Discount rateExpected long-term rate of return of plan assets
$13.5
n.a.
$1.5
$1.0
The sensitivities presented in this table should be used with caution, as the effects are hypothetical and changes in assumptions may not be linear.
This critical accounting estimate affects all business segments. Further information on the Bank’s pension plans and other fu-ture benefits can be found in Note 16 to the annual consolidated financial statements.
InCOME TAx Future income tax assets and liabilities reflect management’s estimate of the value of loss carry-forwards, minimum tax carry-overs and other temporary differences. Asset value is determined using assumptions regarding the results of opera-tions of future fiscal years, timing of reversal of temporary differences and tax rates on the date of reversals, which may well change depending on governments’ fiscal policies. Moreover, management must assess whether it is more likely than not that future income tax assets will be realized prior to their expiration and, based on all available evidence, determine whether a valuation allowance is required on all or a portion of future income tax assets. The use of different assumptions could translate into significantly different income tax expenses.
This critical accounting estimate affects all business segments. Further information on income tax expense can be found in Note 17 to the annual consolidated financial statements.
GOODWILL, OTHER InTAnGIBLE ASSETS AnD OTHER ASSETS Goodwill As at October 31, 2010, the balance of goodwill stood at $53.8 million and this amount was entirely allocated to Retail & SME Québec. goodwill is subject to an impairment test annually, unless certain specific criteria are met, as described in Note 3 to the annual consolidated financial statements.
The impairment test initially compares the fair value of the reporting unit, to which goodwill relates, to its carrying amount. When potential impairment is identified, the fair value of goodwill is compared to its carrying amount. Management mainly uses the discounted cash flow method to determine the fair value of its reporting units. The impairment assessment process includes a number of significant estimates, including projected net income growth rates, future cash flows, the number of years used in the cash flow model and the discount rate of future cash flows. Management considers that all estimates are reasonable and consistent with the Bank’s financial objec-tives. They reflect management’s best estimates but include inherent uncertainties that are not under its control.
Changes made to one or any of these estimates may significantly impact the calculation of fair value and the resulting impair-ment charge. Consequently, management cannot reasonably quantify the effect of the use of different assumptions on the Bank’s overall financial performance. Moreover, it is impossible to predict whether an event that triggers an impairment will occur, nor when it will occur or how this will affect the asset values reported by the Bank.
No impairment charge was reported in fiscal 2010 or in fiscal 2009. If need be, the amount of the losses in value would be recorded as a non-interest expense for Retail & SME Québec, under Other.
Further information on goodwill can be found in Note 8 to the annual consolidated financial statements.
management’s discussion and analysis
laurentian banK 2010 Annual Report 61
Other intangible assets and other assets Other intangible assets with finite lives are also tested for impairment when events or changes in circumstances indicate that the carrying value may not be fully recoverable. As it con-ducts this test, management evaluates the future cash flows it expects to realize from these assets, along with their possible disposition. An impairment loss is recognized if the sum of the expected future undiscounted cash flows is less than the car-rying amount of the asset. No significant impairment charge was reported in fiscal 2010 or in fiscal 2009.
Management also periodically reviews the value of the Bank’s other assets, such as fixed assets and other deferred charges, in order to identify potential losses in value and to validate the related amortization periods. Changes in estimates and assumptions could significantly impact results.
Future cHanges to accounting Policies
BuSInESS COMBInATIOn On January 5, 2009, three new sections of the CICA Handbook were issued: Section 1582, Business Combinations, Section 1601, Consolidated Financial Statements, and Section 1602, Non-controlling Interests. These new standards are applicable to the Bank effective November 1, 2011. Earlier application is permitted provided Section 1582 is applied at the same time. However, to date, the Bank has not opted to early adopt these new sections.
The new sections retain the fundamental requirements in Section 1581 that require the acquisition method of accounting for all business combinations and for an acquirer to be identified for every business combination. They also retain the guidance in Section 1581 for identifying and recognizing intangible assets separately from goodwill. Additionally, the new sections mainly: i) require the acquirer to account for acquisition-related costs incurred in connection with the business combination sepa-rately from the business combination (generally as expenses); ii) require the acquirer to measure and recognize the fair value of the assets acquired and liabilities assumed as part of the business combination, with limited exceptions; iii) modify the accounting related to future income tax benefits that are recog-nizable as a result of that business combination; and iv) modify the accounting and presentation of non-controlling interests subsequent to a business combination.
InTERnATIOnAL FInAnCIAL REPORTInG STAnDARDS In February 2008, the Accounting Standards Board confirmed the convergence of financial reporting standards for Canadian public companies with International Financial Reporting Standards (IFRS). As a result, the Bank will adopt IFRS commencing on November 1, 2011 and will publish its first consolidated financial statements, prepared in accordance with IFRS, for the quarter ending January 31, 2012. Comparative financial information for fiscal 2011 will be provided at that time, prepared in accordance with IFRS, including an opening balance sheet as at November 1, 2010.
The Bank has prepared a conversion plan and assembled a project team, including both internal and external resources, to coordinate and execute the conversion to IFRS. The Bank considers having the appropriate resources to finalize the IFRS conversion plan on schedule. The key elements of the IFRS transition plan include developing a project governance frame-work, updating accounting policies, preparing financial statements, building financial reporting expertise, identifying impact on business processes and information technology; implementing internal control over financial reporting (ICFR), and implementing appropriate disclosure controls and proce-dures (DC&P), including investor relations and communication plans.
The conversion plan consists of the following phases:– Preliminary assessment – This phase served to heighten
management’s awareness of the key conversion issues and establish a timeline mapping out the Bank’s priorities with regard to analyses and significant issues.
– Financial standards analysis – This phase consists of a detailed assessment of the quantitative, qualitative and technological impact of IFRS implementation.
– Selection of key accounting policies – The initial adoption of IFRS will require the Bank to make certain elections.
– Implementation – This phase consists of implementing the necessary information systems to comply with the new IFRS requirements.
62 laurentian banK 2010 Annual Report
management’s discussion and analysis
The Bank completed its preliminary assessment of the IFRS impact during the planning stage of the project in early 2009. Work on the financial standards analysis is nearly completed as at the end of the fourth quarter of 2010, subject to changes to IFRS by the International Accounting Standards Board (IASB). key differences between IFRS and Canadian gAAP have been summarized below. The impact of certain key differences is still being evaluated. The selection of key accounting policies is currently being assessed concurrently with standards analysis. The Bank is now progressing to the implementation of the nec-essary changes to processes and systems. The implementation phase is expected to be completed by the end of fiscal 2011. The Bank has therefore not finalized the estimation and analysis of the expected financial impact of its IFRS conversion as at the end of the year 2010.
Governance of the IFRS conversion planThe Bank has put in place a Steering Committee that is respon-sible for ensuring the conversion plan is adequately followed. The Bank’s Board of Directors, mainly through its Audit Committee, is also involved in the IFRS conversion plan. They receive quarterly updates of the timeline for implementation, the implications of IFRS standards on the business and an overview of the impact on the financial statements. The Audit Committee will continue to receive quarterly project status updates to ensure proper oversight of the conversion project. Another important component of the IFRS conversion plan con-sists of training key finance and operational staff. This ongoing process was initiated in 2008. As the Bank progresses in its conversion plan in 2011, it will also, together with other members of the banking community, communicate IFRS implications to the various interested stakeholders.
Progress to dateThe following project statuses have been presented to the Audit Committee in 2010:
First quarter– A preliminary IFRS analysis, which consisted of an assessment
of the quantitative, qualitative and technological impact of IFRS implementation;
– A list of potential transition date and ongoing accounting policy choices;
– A list of technological changes which have been identified with respect to certain items, namely hedging, securitization, im-paired loans, share-based compensation and customer loyalty programs. The necessary adjustments to the information system supporting these items are expected to be completed before the end of 2010.
Second quarter– An assessment of the main IFRS disclosure impacts based
on the October 31, 2009 year end financial statements. This exercise was aimed at identifying the areas where additional disclosure is required.
– A communication plan highlighting the impact for all known stakeholders.
Third quarter – A summary of the main findings from a pro forma conversion
of the 2009 year-end financial statements to IFRS. This exercise allowed the Bank to better assess the workload and potential impact of first-time adoption and future accounting policy choices under IFRS, as well as to evaluate the potential impact on capital and other financial ratios.
– An update of certain IFRS analyses pursuant to new develop-ments published by the IASB. The Bank will continue to monitor future developments.
– An IT strategy defined to appropriately manage the dual- accounting period in fiscal 2011.
Fourth quarter – A summary of the potential impact of IFRS on the Bank’s financial
forecasts for the next three years.– A pro forma conversion of the third quarter financial statements
under IFRS. Similar to the work done for the 2009 year-end financial statements, this exercise allowed the Bank to assess the workload and prepare the supporting documents for the up-coming reporting in the dual-accounting period in fiscal 2011.
– updated status regarding IFRS conversion plan, specifically related to securitization, loan provisioning, hedge accounting and employee benefits.
Analysis of key differencesIFRS were developed using a conceptual framework similar to Canadian gAAP, although significant differences exist in certain areas including recognition, measurement and disclosures. The following key differences between the Bank’s current accounting practices and the corresponding accounting treat-ment under IFRS have been identified:
a) Loan provisioningIn line with current Canadian gAAP, the Bank’s provisioning for impaired loans is designed to take into account incurred losses in the Bank’s loan portfolio. This principle will not change as IFRS also currently require that provisioning be based on incurred losses. However, under IFRS, loan losses and allow-ances will be presented based on whether they are assessed individually or collectively for groups of similar loans. The methodologies to calculate these provisions are still being de-veloped. As a result, there may be changes in the amount of the Bank’s collective provisioning, mainly for loans which are not classified as impaired.
Specific provisions for loan losses must be based on the dis-counted values of estimated future cash flows. This amount is accreted over the period from the initial recognition of the provision to the eventual recovery of the present value of the loan, resulting in the recording of interest in the statement of income, within interest income. under Canadian gAAP, the accretion amount is generally presented as a reduction of the provision for credit losses.
management’s discussion and analysis
laurentian banK 2010 Annual Report 63
b) SecuritizationThe combined effect of financial asset derecognition rules and the consolidation of special purpose entity rules will impact securitization arrangements involving the Bank’s off balance sheet loans. The rules provide more stringent criteria for the derecognition of financial assets. Based on the financial stan-dards analysis, the criteria would not be met. This should lead to a gross-up of the Bank’s balance sheet of approximately $2.7 billion at transition. In addition, prior net unrealized gains related to these transactions would be eliminated and the corresponding net interest income recorded in future period earnings. In July, the IFRS Interpretations Committee issued an Exposure Draft which would modify guidance applicable on transition (IFRS 1) with regard to the derecognition exemption. The revised IFRS 1 would provide the option to grandfather cer-tain securitization transactions up to October 31, 2010, instead of January 1, 2004. The Bank will closely monitor this proposed change and reassess its choices accordingly.
c) Employee benefitsAt transition, IFRS generally provide for a retrospective adoption of the Employee Benefits standard (IAS 19). To date, the Bank has not determined its potential impact given the significant challenge posed by the complexity of pension benefit plans and the fact that the Bank has been offering pension plans for more than 30 years. However, IFRS provide the option of not retro-spectively applying IAS 19. If this election is made, gains and losses accumulated to the date of transition amounting to $130.7 million would be charged to retained earnings. This may have a significant effect on shareholders’ equity. Actuarial gains or losses post transition to IFRS could be recognized in income immediately, amortized to income using a “Corridor Method” similar to Canadian gAAP, or directly in equity (the “SORIE Method”). The Bank is currently assessing its options and will make its election in 2011, mainly based on regulatory capital requirements.
d) Share-based paymentsIFRS introduce a new requirement for the Bank to recognize as an expense the fair value of stock appreciation rights. under Canadian gAAP, these rights are presently accounted for using the intrinsic value method. This should lead to an adjustment of the Bank’s financial liabilities and shareholders’ equity. With respect to stock option awards granted prior to November 1, 2002, the Bank is not required to apply IFRS 2 – Share-based Payment retrospectively, therefore, the Bank will continue to apply the previous Canadian gAAP under which no compensation cost is recognized for these options. In the second quarter of 2010, a new software application was implemented that will allow the Bank to automate the calculations and ensure appropriate internal controls.
e) Business combinationsIFRS 3 and Section 1582 of the CICA Handbook have been harmonized since January 2009. Henceforth, there will be no accounting differences beyond the IFRS transition date. However, at the transition date, the Bank has to make an elec-tion to either apply IFRS 3 retrospectively to all past business acquisitions before a chosen date or apply it prospectively from the transition date. The Bank is currently analyzing the impact of the two options and will make an election in the coming months.
f) Earnings per shareIAS 33 is similar to Section 3500 of the CICA Handbook in many regards. However, based on its financial standards analysis, the Bank concluded that, in their current form, its perpetual preferred shares would have been included in the calculation of the diluted earnings per share as they may have been con-verted into common shares; even though the conversion option was up to the Bank. As a result, in order to increase consistency in the Bank’s diluted earnings per share calculation under current gAAP and IFRS and avoid irrelevant dilution, the Bank waived its conversion right on November 17, 2010.
The differences identified in the above discussion on IFRS tran-sition should not be regarded as an exhaustive list and other changes may result from the transition to IFRS. Furthermore, the disclosed impacts of the transition to IFRS reflect the most recent assumptions, estimates and expectations, including the assessment of IFRS expected to be applicable at the time of transition. As a result of changes in circumstances, such as economic conditions or operations, and the inherent uncertainty from the use of assumptions, the actual impacts of the transi-tion to IFRS may be different from those presented above.
64 laurentian banK 2010 Annual Report
management’s discussion and analysis
Throughout the current year and the period leading up to the transition to IFRS in 2012, the Bank will continue to monitor the above-mentioned accounting policies and finalize its assess-ment of policy decisions available under IFRS in order to prepare the Bank for an orderly transition to IFRS. The evolving nature of IFRS will also likely result in additional accounting changes, some of which may be significant, in the years following the initial conversion. The Bank will continue to actively monitor all of the IASB’s projects that are relevant to the Bank’s financial reporting and accounting policies and adjust its IFRS conversion project accordingly.
Furthermore, the Bank is specifically addressing internal controls, lending practices and capital issues, as summarized below, as well as all other matters to ensure an orderly transition.
Internal control over financial reporting (ICFR)As the review of accounting policies is completed, appropriate changes to ensure the integrity of internal control over financial reporting and disclosure controls and procedures will be made. Based on existing IFRS, the Bank has not identified the need for any significant modifications to its financial information technology architecture or to existing internal control over financial reporting and disclosure controls. ICFR will be appro-priately addressed as processes and system assessments are finalized in the upcoming periods.
Lending practicesThe transition to IFRS will not only impact the Bank’s financial statements, but also some of its clients’ financial statements. This will have repercussions on the various loan covenants monitored by underwriting groups and the credit department. The Bank has met with commercial account managers as well as credit analysts, to foster a better internal understanding of IFRS to properly analyze the clients’ IFRS financial statements and the impacts on ratios and covenants.
Capital implicationsThe Bank is closely monitoring the potential impact of IFRS conversion on capital requirements. Securitization and employee benefits are the two main areas which could have a significant impact on capital.
The Office of the Superintendent of Financial Institutions (OSFI) has issued an IFRS advisory that permits a five-quarter phase-in of the adjustment to retained earnings arising from the first time adoption of certain IFRS changes for purposes of calculating certain ratios. Transitional relief for the impact to the asset to capital multiple will also be provided in the form of exclusion of the effect of any on-balance sheet recognition of mortgage loans sold through CMHC programs up to March 31, 2010, that under current practice are not reported on the Bank’s balance sheet.
The potential implications of the proposed capital and liquidity requirements issued by the Basel Committee on Banking Supervision in December 2009 and further detailed in July and September 2010 are also being considered closely as part of the IFRS transition plan.
Other considerationsThe Bank is also assessing the impact of the IFRS conversion on its performance measurement processes, including planning and budgeting.
BASIS OF PRESEnTATIOnThis Management’s Discussion and Analysis (MD&A) refers to the results of operations and financial condition of the Bank for the year ended October 31, 2010 and presents the views of the Bank’s management as at December 8, 2010. The information is presented on the same basis as in the annual consolidated financial statements and has been prepared in accordance with Canadian generally accepted accounting principles (“gAAP”) and the accounting requirements of the Office of the Superintendent of Financial Institutions Canada.
Additional information on Laurentian Bank of Canada, including the Annual Information Form for the year ended October 31, 2010, can be found on the Bank’s website at www.laurentianbank.ca and on SEDAR at www.sedar.com.
METHODOLOGy FOR THE AnALySIS OF RESuLTSDiscontinued operationsManagement generally evaluates the Bank’s performance as reported in the consolidated financial statements. The financial statements present results from continuing operations and results from discontinued operations arising from the disposal of the wealth management operations associated with the BLC-Edmond de Rothschild Asset Management Inc. joint venture in 2005.
non-GAAP Financial Measures The Bank uses both gAAP and certain non-gAAP measures to assess performance, such as return on common shareholders’ equity, tangible common equity ratio, net interest margin and efficiency ratios. With regard to the calculation of the return on common shareholders’ equity, the Bank considers that net income is the best measure of profitability and that common shareholders’ equity, excluding accumulated other comprehensive income, should be used as a measure of capital. The calculation of the Bank’s book value per share is also based on common shareholders’ equity, excluding accumulated other comprehensive income. Tangible common equity is defined as common shareholders’ equity, excluding accumulated other comprehensive income, less goodwill and contractual and customer relationship intangible assets. The tangible common equity ratio is defined as the tangible common equity divided by the risk-weighted assets.
Non-gAAP measures do not have any standardized meaning prescribed by gAAP and are unlikely to be comparable to any similar measures presented by other companies. The Bank believes that these non-gAAP financial measures provide investors and analysts with useful information so that they can better understand financial results and analyze the Bank’s growth and profit potential more effectively.
Certain comparative figures for fiscal 2009 have been reclassified to conform to the current year presentation.
CONSOLIDATED FINANCIAL STATEMENTS
LAurENTIAN bANK 2010 Annual Report 65
CONSOLIDATED FINANCIAL STATEMENTS AT A GLANCE
66 Management’s Responsibility for Financial Reporting67 Auditors’ Report to the Shareholders68 Consolidated Balance Sheet69 Consolidated Statement of Income70 Consolidated Statement of Comprehensive Income70 Consolidated Statement of Changes in Shareholders’ Equity71 Consolidated Statement of Cash Flows72 Notes to Consolidated Financial Statements
These consolidated financial statements present a recent financial history of the financial condition, results of operations and cash flows of Laurentian Bank of Canada.
The accompanying notes include important disclosures that are useful in understanding the Bank’s operations. They provide information on how amounts presented in the consolidated financial statements were determined, describe significant events or changes that affect these amounts and explain certain line items in the consolidated financial statements. They also include details about the financial results that are not shown in the body of the consolidated financial statements.
CONSOLIDATED FINANCIAL STATEMENTS AS AT OCTOBER 31, 2010 ANd 2009
CONSOLIDATED FINANCIAL STATEMENTS
66 LAurENTIAN bANK 2010 Annual Report
MANAGEMENT’S rESpONSIbILITy FOr FINANCIAL rEpOrTING
The consolidated financial statements of Laurentian Bank of Canada and the other financial information contained in the Annual Report have been prepared by management, which is responsible for the integrity and fairness of the financial information presented. The financial statements have been prepared in accordance with Canadian generally accepted accounting principles (GAAP) pursuant to the requirements of the Bank Act and reflect amounts that must, of necessity, be based on the best estimates and judgment of management. The financial information presented in the Annual Report is consistent with that in the financial statements.
Management is responsible for the implementation of the financial information accounting systems, which support, among others, the preparation of financial statements in accordance with Canadian GAAP. In discharging its responsibilities, management maintains the necessary internal control systems designed to provide assurance that transactions are properly authorized, assets are safeguarded and proper accounting records are held. The controls include, among other things, quality standards in hiring and training of employees, written policies, compliance with authorized limits for managers, procedure manuals, a corporate code of conduct, budgetary controls and appropriate management information systems.
The internal control systems are further supported by a regulatory compliance function, which ensures that the Bank and its employees comply with all regulatory requirements, as well as by a function of integrated risk management and an operating risk management function that ensures proper risk control, related documentation and the measurement of the financial impact of risks. In addition, the internal auditors periodically assess various aspects of the Bank’s operations and make recommendations to management for, among other things, improvements to the internal control systems.
Every year, the Superintendent of Financial Institutions of Canada makes such examinations and inquiries as deemed necessary to satisfy itself that the Bank is in a sound financial position and that it complies with the provisions of the Bank Act, particularly those regarding the safety of the depositors and shareholders of the Bank.
Ernst & Young LLP, independent auditors, appointed by the shareholders, audit the Bank’s consolidated financial statements and their report follows.
The internal auditors, the external auditors and the Superintendent of Financial Institutions of Canada meet periodically with the Audit Committee, in the presence or absence of management, to discuss all aspects of their duties and matters arising therefrom.
The Board of directors is responsible for reviewing and approving the financial statements and management’s discussion and analysis of results of operations and financial condition appearing in the Annual Report. It oversees the manner in which management discharges its responsibilities for the preparation and presentation of the consolidated financial statements, the maintenance of appropriate internal controls and risk management, as well as the assessment of significant transactions through its Audit Committee and its Risk Management Committee. Both Board committees are composed solely of directors who are not officers or employees of the Bank.
Réjean RobitaillePresident and Chief Executive Officer
Montréal, Canada december 7, 2010
Michel c. lauzonExecutive Vice-President and Chief Financial Officer
CONSOLIDATED FINANCIAL STATEMENTS
LAurENTIAN bANK 2010 Annual Report 67
AuDITOrS’ rEpOrT TO ThE ShArEhOLDErS OF LAurENTIAN bANK OF CANADA
We have audited the consolidated balance sheet of Laurentian Bank of Canada “the Bank” as at October 31, 2010 and 2009 and the consolidated statements of income, comprehensive income, changes in shareholders’ equity and cash flows for the years then ended. These financial statements are the responsibility of the Bank’s management. Our responsibility is to express an opinion on these financial statements based on our audits.
We conducted our audits in accordance with Canadian generally accepted auditing standards. Those standards require that we plan and perform an audit to obtain reasonable assurance whether the financial statements are free of material misstatement. An audit includes examining, on a test basis, evidence supporting the amounts and disclosures in the financial statements. An audit also includes assessing the accounting principles used and significant estimates made by management, as well as evaluating the overall financial statement presentation.
In our opinion, these consolidated financial statements present fairly, in all material respects, the financial position of the Bank as at October 31, 2010 and 2009 and the results of its operations and its cash flows for the years then ended in accordance with Canadian generally accepted accounting principles.
chaRteRed accountantsMontréal, Canada december 7, 2010
1 CA auditor permit no. 17959
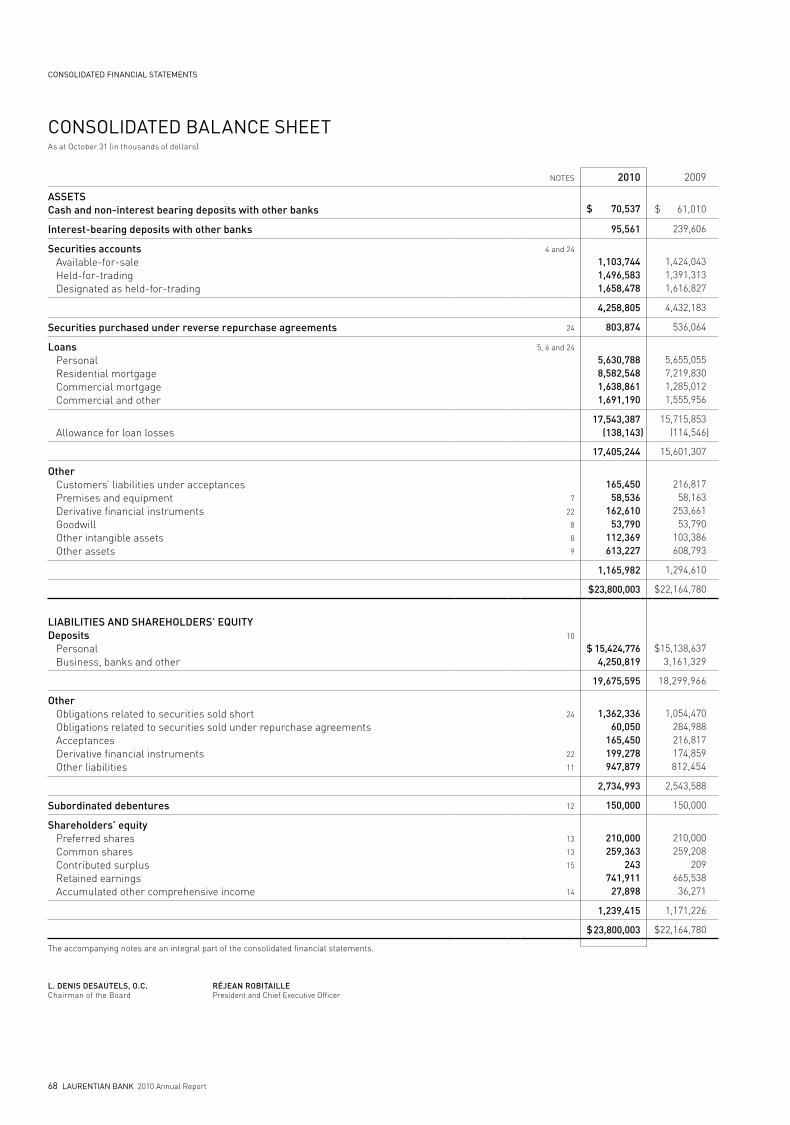
CONSOLIDATED FINANCIAL STATEMENTS
68 LAurENTIAN bANK 2010 Annual Report
CONSOLIDATED bALANCE ShEETAs at October 31 (in thousands of dollars)
NOTES 2010 2009
assetscash and non-interest bearing deposits with other banks
$ 70,537
$ 61,010
interest-bearing deposits with other banks 95,561 239,606
securities accounts Available-for-sale Held-for-trading designated as held-for-trading
4 and 24
1,103,7441,496,5831,658,478
1,424,043 1,391,313 1,616,827
4,258,805 4,432,183
securities purchased under reverse repurchase agreements 24 803,874 536,064
loans Personal Residential mortgage Commercial mortgage Commercial and other
5, 6 and 24
5,630,7888,582,5481,638,8611,691,190
5,655,055 7,219,830 1,285,012 1,555,956
Allowance for loan losses17,543,387
(138,143)15,715,853
(114,546)
17,405,244 15,601,307
other Customers’ liabilities under acceptances Premises and equipment derivative financial instruments Goodwill Other intangible assets Other assets
7
22
8
8
9
165,45058,536
162,61053,790
112,369613,227
216,817 58,163
253,661 53,790
103,386 608,793
1,165,982 1,294,610
$23,800,003 $22,164,780
liabilities and shaReholdeRs’ eQuitYdeposits Personal Business, banks and other
10
$ 15,424,7764,250,819
$15,138,637 3,161,329
19,675,595 18,299,966
other Obligations related to securities sold short Obligations related to securities sold under repurchase agreements Acceptances derivative financial instruments Other liabilities
24
22
11
1,362,336
60,050165,450199,278947,879
1,054,470 284,988 216,817 174,859 812,454
2,734,993 2,543,588
subordinated debentures 12 150,000 150,000
shareholders’ equity Preferred shares Common shares Contributed surplus Retained earnings Accumulated other comprehensive income
13
13
15
14
210,000259,363
243741,911
27,898
210,000 259,208
209 665,538
36,271
1,239,415 1,171,226
$ 23,800,003 $22,164,780
The accompanying notes are an integral part of the consolidated financial statements.
l. denis desautels, o.c.Chairman of the Board
Réjean RobitaillePresident and Chief Executive Officer
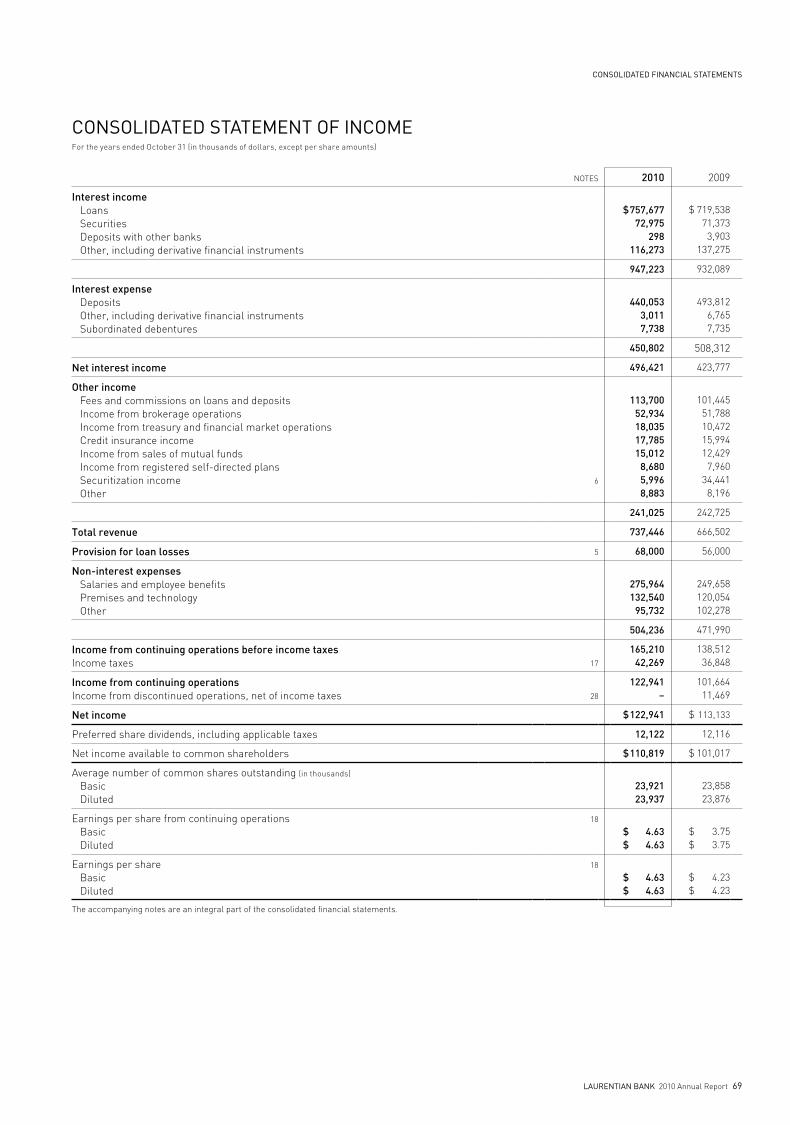
CONSOLIDATED FINANCIAL STATEMENTS
LAurENTIAN bANK 2010 Annual Report 69
CONSOLIDATED STATEMENT OF INCOMEFor the years ended October 31 (in thousands of dollars, except per share amounts)
NOTES 2010 2009
interest income Loans Securities deposits with other banks Other, including derivative financial instruments
$ 757,677
72,975298
116,273
$ 719,538
71,373 3,903
137,275
947,223 932,089
interest expense deposits Other, including derivative financial instruments Subordinated debentures
440,0533,0117,738
493,812 6,765 7,735
450,802 508,312
net interest income 496,421 423,777
other income Fees and commissions on loans and deposits Income from brokerage operations Income from treasury and financial market operations Credit insurance income Income from sales of mutual funds Income from registered self-directed plans Securitization income Other
6
113,70052,93418,03517,78515,012
8,6805,9968,883
101,445 51,788 10,472 15,99412,429
7,96034,441
8,196
241,025 242,725
total revenue 737,446 666,502
Provision for loan losses 5 68,000 56,000
non-interest expenses Salaries and employee benefits Premises and technology Other
275,964132,540
95,732
249,658 120,054 102,278
504,236 471,990
income from continuing operations before income taxes Income taxes 17
165,21042,269
138,512 36,848
income from continuing operations Income from discontinued operations, net of income taxes 28
122,941–
101,664 11,469
net income $ 122,941 $ 113,133
Preferred share dividends, including applicable taxes 12,122 12,116
Net income available to common shareholders $ 110,819 $ 101,017
Average number of common shares outstanding (in thousands) Basic diluted
23,92123,937
23,858 23,876
Earnings per share from continuing operations Basic diluted
18
$ 4.63 $ 4.63
$ 3.75 $ 3.75
Earnings per share Basic diluted
18
$ 4.63 $ 4.63
$ 4.23 $ 4.23
The accompanying notes are an integral part of the consolidated financial statements.
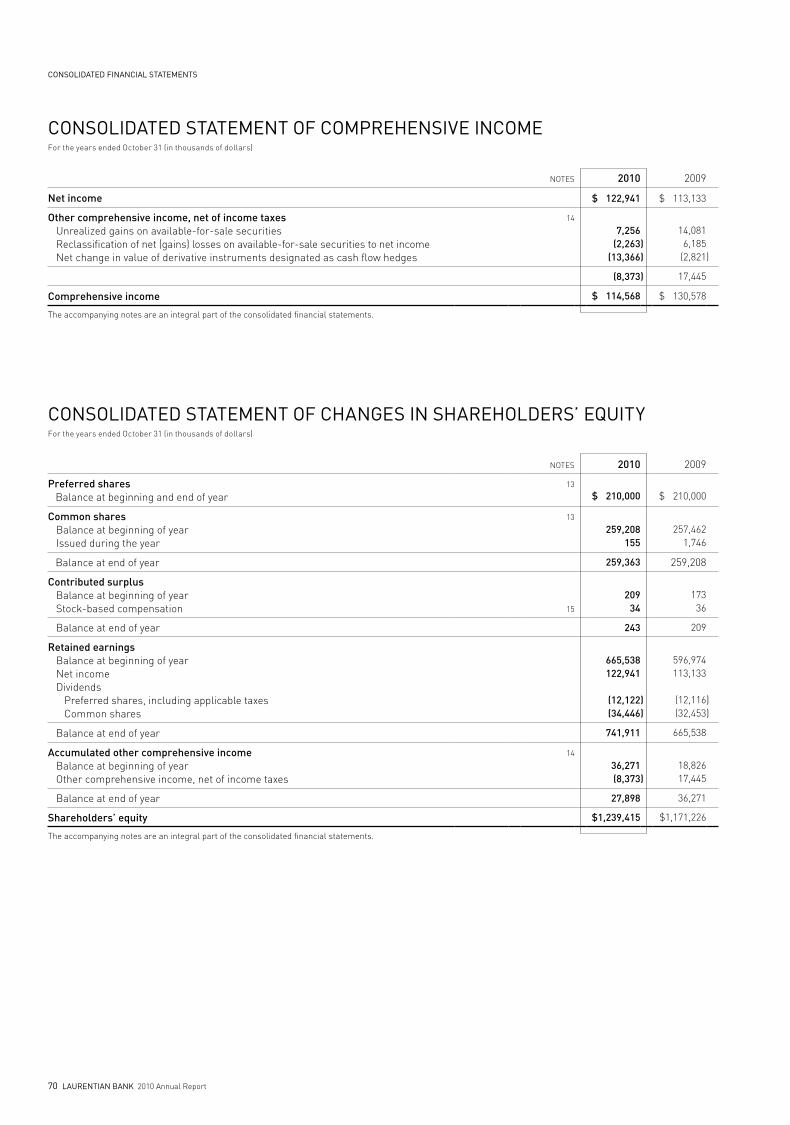
CONSOLIDATED FINANCIAL STATEMENTS
70 LAurENTIAN bANK 2010 Annual Report
CONSOLIDATED STATEMENT OF COMprEhENSIVE INCOMEFor the years ended October 31 (in thousands of dollars)
NOTES 2010 2009
net income $ 122,941 $ 113,133
other comprehensive income, net of income taxes Unrealized gains on available-for-sale securities Reclassification of net (gains) losses on available-for-sale securities to net income Net change in value of derivative instruments designated as cash flow hedges
14
7,256 (2,263
(13,366))
14,081 6,185
(2,821)
(8,373 ) 17,445
comprehensive income $ 114,568 $ 130,578
The accompanying notes are an integral part of the consolidated financial statements.
CONSOLIDATED STATEMENT OF ChANGES IN ShArEhOLDErS’ EQuITyFor the years ended October 31 (in thousands of dollars)
NOTES 2010 2009
Preferred shares Balance at beginning and end of year
13
$ 210,000 $ 210,000
common shares Balance at beginning of year Issued during the year
13
259,208 155
257,462 1,746
Balance at end of year 259,363 259,208
contributed surplus Balance at beginning of year Stock-based compensation 15
209 34
173 36
Balance at end of year 243 209
Retained earnings Balance at beginning of year Net income dividends Preferred shares, including applicable taxes Common shares
665,538 122,941
(12,122(34,446
))
596,974 113,133
(12,116(32,453
))
Balance at end of year 741,911 665,538
accumulated other comprehensive income Balance at beginning of year Other comprehensive income, net of income taxes
14
36,271 (8,373)
18,826 17,445
Balance at end of year 27,898 36,271
shareholders’ equity $1,239,415 $1,171,226
The accompanying notes are an integral part of the consolidated financial statements.

CONSOLIDATED FINANCIAL STATEMENTS
LAurENTIAN bANK 2010 Annual Report 71
CONSOLIDATED STATEMENT OF CASh FLOWSFor the years ended October 31 (in thousands of dollars)
NOTES 2010 2009
cash flows relating to operating activities Net income Adjustments to determine net cash flows relating to operating activities: Provision for loan losses Gains on securitization operations Net gain from discontinued operations Net loss (net gain) on disposal of non-trading securities Future income taxes depreciation Amortization of other intangible assets Net change in held-for-trading securities Change in accrued interest receivable Change in assets relating to derivative financial instruments Change in accrued interest payable Change in liabilities relating to derivative financial instruments Other, net
28
$ 122,941
68,000
(13,471 –
(3,24524,340 10,868 26,338
(105,270(1,21691,051 33,745 24,419 47,197
)
)
))
$ 113,133
56,000 (37,380(13,49312,146 28,943 11,216 22,383
(322,116(12,793(15,957(31,28727,390 13,728
))
))))
325,697 (148,087 )
cash flows relating to financing activities Net change in deposits Change in obligations related to securities sold short Change in obligations related to securities sold under repurchase agreements Issuance of common shares dividends, including applicable income taxes
1,375,629 307,866
(224,938155
(46,568
)
)
2,966,154 235,234
(851,1081,746
(44,569
)
)
1,412,144 2,307,457
cash flows relating to investing activities Change in securities available-for-sale and designated as held-for-trading Acquisitions Proceeds on sale and at maturities Change in loans Change in securities purchased under reverse repurchase agreements Proceeds from mortgage loan securitizations Additions to premises and equipment and software Change in interest- bearing deposits with other banks Net cash flows from discontinued operations 28
(3,614,5803,920,820
(2,696,044(267,810823,512 (46,565144,045
8,308
)
))
)
(6,164,8585,576,044
(2,511,422125,327
1,005,647 (38,193
(145,315 –
)
)
))
(1,728,314) (2,152,770)
Net change in cash and non-interest-bearing deposits with other banks Cash and non-interest-bearing deposits with other banks at beginning of year
9,527 61,010
6,600 54,410
cash and non-interest-bearing deposits with other banks at end of year $ 70,537 $ 61,010
supplemental disclosure relating to cash flows: Interest paid during the year Income taxes paid during the year
$ 416,374 $ 14,856
$ 537,988 $ 12,275
The accompanying notes are an integral part of the consolidated financial statements.
CONSOLIDATED FINANCIAL STATEMENTS
72 LAurENTIAN bANK 2010 Annual Report
1 GENErALLaurentian Bank of Canada and its subsidiaries (“Laurentian Bank” or the “Bank”) provide banking services to individuals and small and medium-sized enterprises, as well as to independent advisors across Canada, and operate as a full-service brokerage firm. The Bank is a chartered bank under Schedule 1 of the Bank Act (Canada) and has its head office in Montréal, Canada. The common shares of Laurentian Bank (stock symbol: LB) are listed on the Toronto Stock Exchange.
2 bASIS OF prESENTATIONThe consolidated financial statements of the Bank have been prepared in accordance with the Bank Act, which states that, except as otherwise specified by the Superintendent of Financial Institutions Canada (OSFI), the financial statements are to be prepared in accordance with Canadian generally accepted accounting principles (GAAP). These financial statements are in accordance with GAAP.
Certain comparative figures have been reclassified to conform to current year presentation.
2.1 basis of consolidationThe consolidated financial statements include the assets, liabilities and results of operations of the Bank and all of its subsidiaries after elimination of intercompany balances and transactions.
The Bank also consolidates variable interest entities (VIEs) when it is the primary beneficiary. Generally, VIEs are entities that are subject to control on a basis other than ownership of voting interests. The primary beneficiary consolidates the VIE. The primary beneficiary is the enterprise that has the variable interests that will absorb the majority of expected losses or receive the majority of residual returns, as defined. Variable interests are defined as contractual, ownership or other financial interests in an entity that change with fluctuations in the entity’s net asset value.
2.2 futuRe accounting PolicY changesbusiness combinationOn January 5, 2009, three new sections of the CICA Handbook were issued: Section 1582, Business Combinations, Section 1601, Consolidated Financial Statements, and Section 1602, Non-controlling Interests. These new standards replace Section 1581, Business Combinations and Section 1600 Consolidated Financial Statements and are effective for the Bank on November 1, 2011. Earlier adoption is permitted provided that all three sections are adopted at the same time. However, to date, the Bank has not elected to early adopt these new sections.
The new recommendations in Section 1582 require measuring business acquisitions at the fair value of the acquired business, including the measurement at fair value of items such as non-controlling interests and contingent payment considerations. Also, the previously unrecognized future income tax assets related to the acquiree subsequent to the business combination are recognized in the statements of income rather than as a reduction in goodwill. In addition, business acquisition related costs are expensed as incurred.
Section 1601 establishes standards for the preparation of consolidated financial statements and is aligned with the corresponding provisions of Section 1600.
Section 1602 establishes standards for accounting for non-controlling interests in a subsidiary subsequent to a business combination.
international financial Reporting standards In February 2008, the Accounting Standards Board confirmed the convergence of financial reporting standards for Canadian public companies with International Financial Reporting Standards (IFRS). As a result, the Bank will adopt IFRS commencing on November 1, 2011 and will issue its first consolidated financial statements, prepared in accordance with IFRS, for the quarter ending January 31, 2012. Comparative financial information for fiscal 2011 will be provided at that time, prepared in accordance with IFRS, including an opening balance sheet as at November 1, 2010.
NOTES TO CONSOLIDATED FINANCIAL STATEMENTS October 31, 2010 and 2009 ( All tabular amounts are in thousands of dollars, unless otherwise indicated.)

CONSOLIDATED FINANCIAL STATEMENTS
LAurENTIAN bANK 2010 Annual Report 73
2.3 use of estiMates and assuMPtionsThe preparation of consolidated financial statements in accordance with GAAP requires the Bank to make estimates and assumptions that affect the carrying amounts of assets and liabilities on the balance sheet date, income and other related information. The most significant areas for which the Bank has prepared estimates and assumptions are the allowance for credit losses, the fair value of financial instruments, securitization, pension plans and other employee future benefits, and income taxes. Accordingly, actual results could differ from these estimates, in which case the impact would be recognized in the consolidated financial statements in future periods.
3 SuMMAry OF SIGNIFICANT ACCOuNTING pOLICIES3.1 financial instRuMentsheld-for-trading financial instrumentsFinancial instruments purchased for resale over a short period of time, obligations related to securities sold short, and derivatives not designated in hedge relationships are classified as held-for-trading.
Held-for-trading financial instruments are initially recorded at fair value on the settlement date in the consolidated balance sheet. Subsequently, these financial assets are remeasured at fair value and the realized and unrealized gains and losses are immediately recognized in the consolidated statement of income under income from treasury and financial market operations. Interest income earned, amortization of premiums and discounts as well as dividends received are included in interest income using the accrual basis of accounting. Transaction costs, and loan origination and other fees associated with held-for-trading financial instruments are expensed as incurred.
financial instruments designated as held-for-tradingFinancial instruments, other than those held for trading, may be designated on a voluntary and irrevocable basis as held-for-trading provided that such designation:– Eliminates or significantly reduces a measurement or recognition inconsistency that would otherwise arise from measuring assets
or liabilities or recognizing the related gains and losses on different bases; or– Pertains to an asset or liability that is managed and whose performance is evaluated on a fair value basis, in accordance with
a documented risk management or investment strategy, and information about such items is provided internally on that basis to the entity’s key management personnel; or
– Pertains to a contract containing one or more embedded derivatives that significantly modify the cash flows that otherwise would be required by the contract; and
– Allows for reliable measurement of the fair value of the financial instruments designated as held-for-trading.
Financial instruments designated as held-for-trading are initially recorded at fair value on the settlement date in the consolidated balance sheet. Subsequently, they are remeasured at fair value and the realized and unrealized gains and losses are immediately recognized in the consolidated statement of income under income from treasury and financial market operations, or in securitization income when arising from financial instruments related to securitization transactions. Interest income earned, amortization of premiums and discounts as well as dividends received are included in interest income using the accrual basis of accounting. Transaction costs, and loan origination and other fees associated with financial instruments designated as held-for-trading are expensed as incurred.
CONSOLIDATED FINANCIAL STATEMENTS
74 LAurENTIAN bANK 2010 Annual Report
available-for-sale assetsAvailable-for-sale financial assets are those non-derivative financial assets that are designated as available-for-sale, or that are not classified as loans and receivables, held-to-maturity investments, held-for-trading or designated as held-for-trading. Available-for-sale assets are acquired for an indefinite period and may be sold to meet liquidity requirements or in response to changes in interest rates, exchange rates or equity instrument prices.
These assets are initially recorded at fair value on the settlement date in the consolidated balance sheet. Except for equity instruments that do not have a quoted market price in an active market, available-for-sale assets are remeasured at fair value and unrealized gains and losses are recorded in other comprehensive income. When realized, unrealized gains and losses are recognized in the consolidated statement of income in other income under income from treasury and financial market operations. Where there is objective evidence that the asset is impaired and the decline in fair value of the available-for-sale asset is other than temporary, the unrealized loss is immediately recognized in the consolidated statement of income. In certain circumstances, particularly where the issuer’s financial position subsequently recovers from a particular event, previously recognized impairment losses are reversed. Equity instruments that do not have a quoted market price in an active market are recorded at cost. Interest income earned, amortization of premiums and discounts as well as dividends received are included in interest income using the accrual basis of accounting. Transaction costs, and loan origination and other fees associated with the acquisition of available-for-sale financial instruments and other financial liabilities are initially deferred and subsequently amortized using the effective interest method according to the instrument to which they relate.
held-to-maturity financial assets Held-to-maturity financial assets are non-derivative financial assets with fixed or determinable payments and fixed maturity, other than loans and receivables that an entity has the clear intention and ability to hold to maturity. These financial assets are recorded at amortized cost on the settlement date. As at October 31, 2010, the Bank had not designated any financial assets as held-to-maturity.
securities purchased under reverse repurchase agreements and obligations related to securities sold under repurchase agreementsThe Bank enters into short-term purchases of securities under agreements to resell as well as short-term sales of securities under agreements to repurchase at predetermined prices and dates. Given the low risk transfer associated with these purchases and sales, these agreements are treated as collateralized lending and borrowing transactions and are carried in the consolidated balance sheet at the amounts at which the securities were initially acquired or sold, plus accrued interest. Accordingly, securities purchased under reverse repurchase agreements are classified as loans and receivables and obligations related to securities sold under repurchase agreements are classified as other liabilities. Interest earned on reverse repurchase agreements and interest incurred on repurchase agreements are reported as interest income and interest expense, respectively.
loansLoans are non-derivative financial assets with fixed or determinable payments and are therefore classified as loans and receivables. However, financial assets quoted in an active market do not meet the necessary conditions to be classified as loans and receivables and must be classified as held-for-trading, available-for-sale or held-to-maturity. Moreover, loans that the Bank intends to sell immediately or in the near term are classified as held-for-trading.Loans are initially recorded at fair value on the settlement date in the consolidated balance sheet. They are subsequently recorded at amortized cost using the effective interest method in the balance sheet, net of the allowance for loan losses and any unearned interest. Interest income related to loans is accounted for using the accrual basis of accounting. Commissions received and origination fees in respect of loans, including restructuring and renegotiation charges, are recorded in interest income over the term of the loans. Loan origination and other fees paid are charged to interest income over the term of the loans. Fees received for loan prepayments are included in interest income upon prepayment.
impaired loansLoans, except credit card balances, are classified as impaired when, in management’s opinion, there is a reasonable doubt as to the timely recovery of the principal or interest. Loans are classified as impaired when payment of principal or interest is 90 days past due, unless they are well secured or in the process of recovery.
All loans which are 180 days past due are classified as impaired except when they are guaranteed or insured by the Canadian government, a provincial government or a Canadian government agency; such loans are classified as impaired loans if they are in arrears for 365 days. Credit card balances are fully written off when payments are 180 days in arrears or when management assesses the likelihood of collection to be nil.
3 SuMMAry OF SIGNIFICANT ACCOuNTING pOLICIES (CONT’D)
CONSOLIDATED FINANCIAL STATEMENTS
LAurENTIAN bANK 2010 Annual Report 75
When loans are classified as impaired, the accrual of interest income ceases. The carrying amount of these loans is then adjusted to their estimated realizable value by way of a total or partial write-off and/or an allowance for loan losses.
Subsequent recoveries of interest on impaired loans are recognized in income only if there is no specific allowance and if, in management’s opinion, there is no reasonable doubt as to the ultimate recovery of the total principal.
An impaired loan cannot return to an accrual status unless all principal and interest payments are current and management has no reasonable doubt as to the recovery of the total principal and interest.
When a portion of the loan is written off and the balance is restructured, the new loan is recorded on the accrual basis of accounting where there is no longer any reasonable doubt as to the recovery of capital and interest and where payments are not 90 days past due.
foreclosed assetsAssets acquired by way of settlement of a loan and held for sale are initially measured at fair value less estimated costs to sell, under other assets. The difference between the carrying amount of the loan prior to foreclosure and the amount at which the foreclosed assets are initially measured is recognized in the provision for loan losses.
Any future change in their fair value, but not in excess of the cumulative losses recognized subsequent to the foreclosure date, is recognized as other income in the consolidated statement of income. The revenues generated by foreclosed assets and operating expenses are included in other income and non-interest expenses. If the assets are to be held and used, they are initially measured at fair value and then accounted for in the same manner as similar assets acquired in the normal course of business.
allowances for lossesThe Bank maintains allowances for losses at amounts deemed adequate to absorb all estimated incurred losses in its portfolios. Allowances are mainly related to loans, but may also apply to other assets.
The allowance for loan losses is increased by the amount charged to the provision for loan losses in the statement of income and reduced by the amount of the write-offs, net of recoveries. Loans are written off when all possible restructuring or recovery activities have been completed and the recovery of other amounts is unlikely.
specific allowances for loan lossesSpecific allowances are maintained to absorb losses on both specifically identified borrowers and other homogeneous loans classified as impaired. Losses relating to loans included in the commercial loan and mortgage loan portfolios and to investment loans included in the personal loan portfolio are determined on a loan-by-loan basis during periodic portfolio reviews. These losses are established by estimating the amounts recoverable in relation to the loan amounts using expected future cash flows discounted at the effective interest rate inherent in the loans.
When these amounts cannot be reasonably estimated, the fair value of the underlying collateral or the observable market price of the loans is used. Losses relating to other personal loans classified as impaired, other than losses arising from credit card balances, are determined based on the write-off experience of the past few years when payments are more than 90 days in arrears. For credit card balances, no specific allowance is maintained; however, outstanding balances are fully written off when payments are 180 days in arrears or when management assesses the likelihood of recovery to be nil.
general allowances for loan lossesThe general allowance reflects the best estimate of losses incurred in the portfolios in respect of loans that have yet to be identified as impaired.
The general allowance, established based on the historical loss experience and adjusted to reflect changes in the portfolios and credit policies, is maintained for each pool of loans with shared risk characteristics. This estimate includes consideration of economic and business conditions, management’s judgment and the risks related to the model.
acceptances and customers’ liabilities under acceptancesAcceptances represent an obligation for the Bank with respect to short-term negotiable instruments issued by the Bank’s customers to third parties and guaranteed by the Bank. Acceptances are classified as other liabilities. The recourse against the customer in the event that these obligations give rise to a cash outlay is reported as a corresponding asset and classified as loans and receivables. Commissions earned are recorded under other income in the consolidated statement of income.
CONSOLIDATED FINANCIAL STATEMENTS
76 LAurENTIAN bANK 2010 Annual Report
loan securitizationThe Bank transfers pools of residential and commercial mortgages to special purpose entities or trusts. These transfers are accounted for as sales when the Bank is deemed to have surrendered control over these assets and has received consideration other than beneficial interests in these assets. At the transfer date, the Bank derecognizes all assets sold, recognizes at fair value the assets received and the liabilities assumed and recognizes the gain or loss on the sale in other income.
In connection with these transactions, the Bank retains, in some instances, interests in securitized receivables such as cash reserve accounts, subordinated securities and excess interest spreads. The gain or loss realized on the sale depends partly on the fair value of the retained interests at the date of sale. Fair value is based on market prices when they are available. However, since prices for retained interests generally do not exist, the Bank normally uses the discounted value of expected future cash flows. These calculations are based on management’s best estimates with respect to key assumptions: credit losses, rate of prepayment, interest-rate curve and risk-adjusted discount rates.
Cash reserve accounts and excess interest spreads related to these transactions are initially recorded at fair value under available-for-sale assets or assets designated as held-for-trading.
In such cases, the retained tranches of subordinated securities are recorded in securities, depending on the Bank’s intentions, under available-for-sale assets, held-to-maturity assets or assets designated as held-for-trading.
The Bank generally transfers receivables on a fully serviced basis. On the transfer date, a servicing liability is recognized at fair value and presented in other liabilities. This liability is amortized to other income under securitization income over the term of the transferred loans.
derivative financial instruments and hedgesderivative financial instruments are primarily used to manage the Bank’s exposure to interest rate and currency risks and, occasionally, in trading activities or to serve the needs of customers.
All derivative financial instruments are recognized at fair value in other assets or liabilities, including derivatives embedded in financial instruments or other contracts that are not closely related to the financial instrument or to the host contract. Changes in fair value of derivative financial instruments are immediately recognized in income from treasury and financial market operations, except for derivative financial instruments designated as cash flow hedges as described below. Interest income and costs related to derivatives are recognized in net interest income in the consolidated statement of income.
When using derivative financial instruments to manage its own risks, the Bank determines for each derivative financial instrument whether hedge accounting is appropriate. If deemed appropriate, the Bank formally documents the hedging relationship, detailing among other things the type of hedge—fair value or cash flow hedge, the item being hedged, the risk management objective, the hedging strategy and the method used to measure its effectiveness. Hedge accounting is deemed appropriate where the derivative financial instrument is highly effective in offsetting changes in the hedged item’s fair value attributed to the hedged risk, both at hedge’s inception and on an ongoing basis. Effectiveness is generally reviewed every month using statistical regression models.
fair value hedgesFair value hedge transactions predominantly use interest rate swaps to hedge changes in fair value of assets, liabilities or firm commitments.
For these hedging relationships, the changes in the hedged items’ fair value attributable to the hedged risk are recognized in the consolidated statement of income in other income under income from treasury and financial market operations with a corresponding adjustment to the carrying amount of the hedged items in the consolidated balance sheet. Changes in fair value of the hedged items, to the extent that the hedging relationship is effective, are offset by changes in fair value of the hedging derivative. When the derivative financial instrument no longer qualifies as an effective hedge or the derivative financial instrument is terminated or sold, hedge accounting is discontinued prospectively. The cumulative adjustment to the carrying amount of the hedged item linked to a hedging relationship that ceases to be effective is recognized in net interest income in the periods during which the hedged item affects income. Hedge accounting is also discontinued on the sale or early termination of the hedged item, whereupon the cumulative adjustment to the hedged item’s carrying amount is immediately recognized in other income.
cash flow hedgesCash flow hedge transactions predominantly use interest rate swaps to hedge the variability in cash flows related to a variable rate asset or liability.
For these hedging relationships, the changes in fair value related to the effective portion of the hedge are recognized in other comprehensive income. Changes in fair value related to the ineffective portion of the hedge are immediately recognized in the consolidated statement of income. Changes in fair value recognized in other comprehensive income are reclassified in the consolidated statement of income under net interest income in the periods during which the cash flows comprising the hedged item affect income.
3 SuMMAry OF SIGNIFICANT ACCOuNTING pOLICIES (CONT’D)

CONSOLIDATED FINANCIAL STATEMENTS
LAurENTIAN bANK 2010 Annual Report 77
When the hedging relationship ceases to be effective or the hedging instrument is sold or terminated early, hedge accounting is discontinued prospectively. Changes in fair value recognized in other comprehensive income in respect of a cash flow hedging relationship that ceases to be effective are reclassified in the consolidated statement of income under net interest income in the periods during which the cash flows comprising the hedged item affect income. Furthermore, on the sale or early termination of the hedged item, hedge accounting is also discontinued and the changes in fair value recognized in other comprehensive income are then immediately reclassified in the consolidated statement of income under other income.
depositsdeposits are generally accounted for at amortized cost using the effective interest method and are classified as other liabilities. Interest expense on deposits is recorded on the accrual basis of accounting. The commissions paid and other fees are added to interest expense over the term of the deposits.
indexed deposit contracts Certain deposit obligations, such as equity-linked guaranteed investment certificates where the deposit obligation varies according to the performance of certain stock market indexes, may be subject to a guaranteed minimum redemption amount, such as the obligation to return the investor’s initial investment at maturity. These obligations include an embedded derivative instrument that has to be accounted for separately. Accordingly, like all derivative financial instruments, it is recorded at fair value and changes in fair value are recognized in the consolidated statement of income in other income under income from treasury and financial market operations. The deposit obligation, excluding the embedded derivative, is recorded at amortized cost using the effective interest method. The deposit obligation, including the embedded derivative, is reported in the consolidated balance sheet under personal deposits.
subordinated debenturesSubordinated debentures are accounted for at amortized cost using the effective interest method and are classified as other liabilities. Interest expense on subordinated debentures is recorded on the accrual basis of accounting. The commissions paid and other fees are added to interest expense over the term of the subordinated debentures.
Measuring the fair value of financial instrumentsFair value is defined as the amount of consideration that would be agreed upon in an arm’s length transaction between knowledgeable, willing parties who are under no compulsion to act.
The fair value of a financial instrument on initial recognition is normally the transaction price, that is, the fair value of the consideration given or received. In certain circumstances, the initial fair value may be based on other observable market transactions for the same instrument or on a valuation technique whose variables include only data from observable markets. With regard to financial instruments related to securitization transactions, valuation techniques include unobservable data related to rate of prepayment and rate of credit losses.
Subsequent to initial recognition, the fair values of financial instruments that have a quoted market price in an active market are generally based on bid prices for financial assets held and offer prices for financial liabilities. Where financial instruments have no quoted prices in active markets, fair values are determined using valuation techniques incorporating, among other things, current market prices for financial instruments with similar characteristics and risk profiles, contractual prices of the underlying instruments, yield curves and volatility factors. In certain cases, parameters not based on observable market data must also be used. The valuations may also be adjusted to reflect the uncertainty in these parameters. In particular, valuation adjustments may be made with respect to the liquidity or counterparty credit risk of financial instruments that have no available quoted market prices in an active market.
Fair values of derivative financial instruments are generally determined using valuation techniques incorporating certain observable data, such as current market prices and the contractual prices of the underlying instruments, yield curves and volatility factors. The determination of the fair value of derivative financial instruments related to securitization transactions also involves unobservable data.
Measurement of the fair value of financial instruments is described in greater detail in note 20.
offsetting of financial assets and liabilitiesFinancial assets and liabilities are offset and the net amount is presented in the consolidated balance sheet when the Bank has a legally enforceable right to set off the recognized amounts and intends to settle on a net basis or to realize the asset and settle the liability simultaneously.
CONSOLIDATED FINANCIAL STATEMENTS
78 LAurENTIAN bANK 2010 Annual Report
3.2 PReMises and eQuiPMentLand is carried at cost. Other premises and equipment are recorded at cost less accumulated depreciation and are depreciated over their estimated useful lives using the following methods and rates.
Method Rate/PeRiod
PremisesLeasehold improvements
Equipment and furnitureComputer hardware
declining balanceStraight-line
declining balanceStraight-line
5%Term of the lease, plus
initial renewal option20%
5–10 years
Gains and losses on the disposal of premises and equipment are recognized in other income.
3.3 goodwill and otheR intangible assetsGoodwill from business combinations is tested for impairment annually, unless there is clear evidence that, based on the most recent valuation and the current circumstances, the fair value of the reporting unit to be tested significantly exceeds its carrying amount.
The impairment test initially compares the fair value of the reporting unit to which the goodwill relates to its carrying amount. When potential impairment is identified, the fair value of goodwill is compared to its carrying amount. The Bank mainly uses the discounted cash flow method to determine the fair value of its reporting units.
Intangible assets with a finite life are amortized on a straight-line basis over their estimated useful life, which is 15 years for contractual relationships with financial intermediaries and customer relationships and ranges from five to seven years for software, and are also tested for impairment whenever circumstances indicate that the carrying value may not be fully recoverable. When the net carrying amount exceeds the estimated future net cash flows, intangible assets with finite lives are considered impaired and are written down to their fair value.
Any impairment arising from a decline in value of goodwill or intangible assets is charged to income in the period in which the losses are incurred.
3.4 eMPloYee futuRe benefitsPension plansThe Bank maintains defined benefit pension plans for its employees. One of these plans also includes a defined contribution portion. Funding is provided by both the Bank and the members of the plans.
Under the defined benefit plans, the Bank records its benefit obligation under employee pension plans and the related costs net of plan assets. An actuarial valuation is performed periodically to determine the present value of accrued pension obligations. The pension obligations of the defined benefit pension plans are actuarially determined using the projected benefit method prorated on services, which incorporates management’s best estimate of future salary levels, other cost escalation, retirement ages of employees and other actuarial factors. The obligation for accrued benefits is measured using market interest rates at the valuation date. Pension plan assets are measured at fair value. The expected return on plan assets is calculated using a market-related value approach under which changes in the fair value of plan assets are taken into account over a three-year period. defined benefit costs recognized consist of: [a] the cost for the current year’s service, [b] interest expense on the accrued benefit obligation, [c] expected long-term return on plan assets, [d] amortization of the transitional obligation, past service costs and actuarial gains or losses, [e] gains or losses arising from special events, and [f] the change in the valuation allowance.
Actuarial gains or losses arise, in particular, from the difference between the actual long-term rate of return on plan assets and the expected rate of return on such assets, based on management’s best-estimate assumptions, as well as from changes in actuarial assumptions used to determine the accrued benefit obligation. Net actuarial gains or losses are amortized when, at the beginning of the year, the unamortized balance of the gain or loss exceeds 10% of the greater of the accrued benefit obligation or the market value of plan assets. This excess is amortized on a straight-line basis over the expected average remaining service life of the employee groups covered by the plans which varied from 8 to 11 years in 2010 under the plans (from 8 to 11 years in 2009).
The past service cost resulting from changes to the defined benefit plans is amortized on a straight-line basis over the expected average remaining service life of the employee groups covered by the defined benefit plans. The transitional obligation resulting from the initial application of the accounting standard with respect to employee future benefits, on November 1, 2000, is amortized on a straight-line basis over the expected average remaining service life of the employee groups on that date, ranging from 10 to 16 years.
Accrued benefit assets or liabilities represent the cumulative variance between pension expense and contributions paid and are included in other assets or other liabilities.
For the defined contribution portion, the expense corresponds to the contributions the Bank is required to make during the year.
3 SuMMAry OF SIGNIFICANT ACCOuNTING pOLICIES (CONT’D)
CONSOLIDATED FINANCIAL STATEMENTS
LAurENTIAN bANK 2010 Annual Report 79
other plansThe Bank offers its employees certain post-employment benefits. The Bank also provides certain health care and life insurance benefits for its employees upon retirement. The costs related to these benefits are recognized during the employees’ service life according to accounting policies similar to those applied to defined benefit pension plans. The transitional obligation resulting from the initial application of the accounting standard with respect to employee future benefits, on November 1, 2000, is amortized on a straight-line basis over the remaining life expectancy of retirees for post-retirement benefits, which equals 20 years, and over the expected average remaining service life of the employee groups covered for the post-employment benefits, which was 13 years.
3.5 incoMe taxesThe Bank uses the liability method of tax allocation and accounts for the future income tax assets and liabilities related to loss carryforwards and other temporary differences between the carrying amounts and the tax bases of assets and liabilities, in accordance with tax laws and rates enacted or substantively enacted on the date the differences are expected to reverse. A valuation allowance is established, as needed, to reduce the future income tax asset to the amount that is more likely than not to be realized.
3.6 eaRnings PeR shaReThe Bank calculates its basic earnings per share by dividing net income for the year, after deduction of preferred share dividends, including applicable income taxes, as well as premiums on redemption of preferred shares, by the weighted average number of common shares outstanding for the year.
diluted earnings per share is calculated assuming that the proceeds received from the exercise of share purchase options, whose exercise price is lower than the average price of the common shares for the year, are used to repurchase common shares at that average market price.
3.7 insuRanceThrough an agreement with an unrelated insurance company, the Bank is engaged mainly in credit life and disability insurance activities. Insurance premiums are recognized as revenue, net of reinsurance, on a pro rata basis over the terms of the underlying policies. Insurance claims and changes in policy holder benefits estimates are recorded as incurred. These activities are presented in other income under credit insurance income.
3.8 stock-based coMPensationSince November 1, 2002, the Bank has used the fair-value method of accounting for share purchase options granted to senior management. For these awards, the Bank recognizes the fair value of the options granted as an increase in the related compensation expense and contributed surplus during the option vesting period. When the options are exercised, the proceeds received and the amount of the contributed surplus are credited to common shares. The value of the options granted is determined using the Black and Scholes option-pricing model using management’s best estimates.
With respect to awards granted prior to November 1, 2002, the Bank continues to apply the previous standards under which no compensation cost is recognized when share purchase options are awarded to employees and the consideration paid by the employees who exercise their options is credited to common shares.
For the stock appreciation rights settled in cash, the excess of the share price over the exercise price, reviewed on an ongoing basis, is recognized in income during the rights’ vesting period.
Compensation expense in respect of the restricted share unit plan and in respect of the performance-based share plan is recognized during the rights’ vesting period, based on the Bank’s market share price and on defined performance criteria.
The Bank’s contributions related to the employee share purchase program are recognized as compensation expense.
3.9 assets undeR adMinistRation and assets undeR ManageMentThe Bank administers and manages assets held by customers that are not recognized in the consolidated balance sheet. Revenues derived from the administration and management of these assets are recorded in other income, as the service is provided.
3.10 tRanslation of foReign cuRRenciesFinancial assets and financial liabilities denominated in foreign currencies are translated into Canadian dollars at the prevailing year-end exchange rates. Income and expenses are translated at the average monthly exchange rates. Realized or unrealized gains and losses resulting from the translation of foreign currencies are included in other income, with the exception of unrealized gains and losses arising from the translation of available-for-sale financial instruments, which are included in other comprehensive income.
3.11 cash and cash eQuivalentsCash and cash equivalents consist of cash and non-interest-bearing deposits with other banks, and are classified in the loans and receivables category. Cash comprises bank notes and coins.
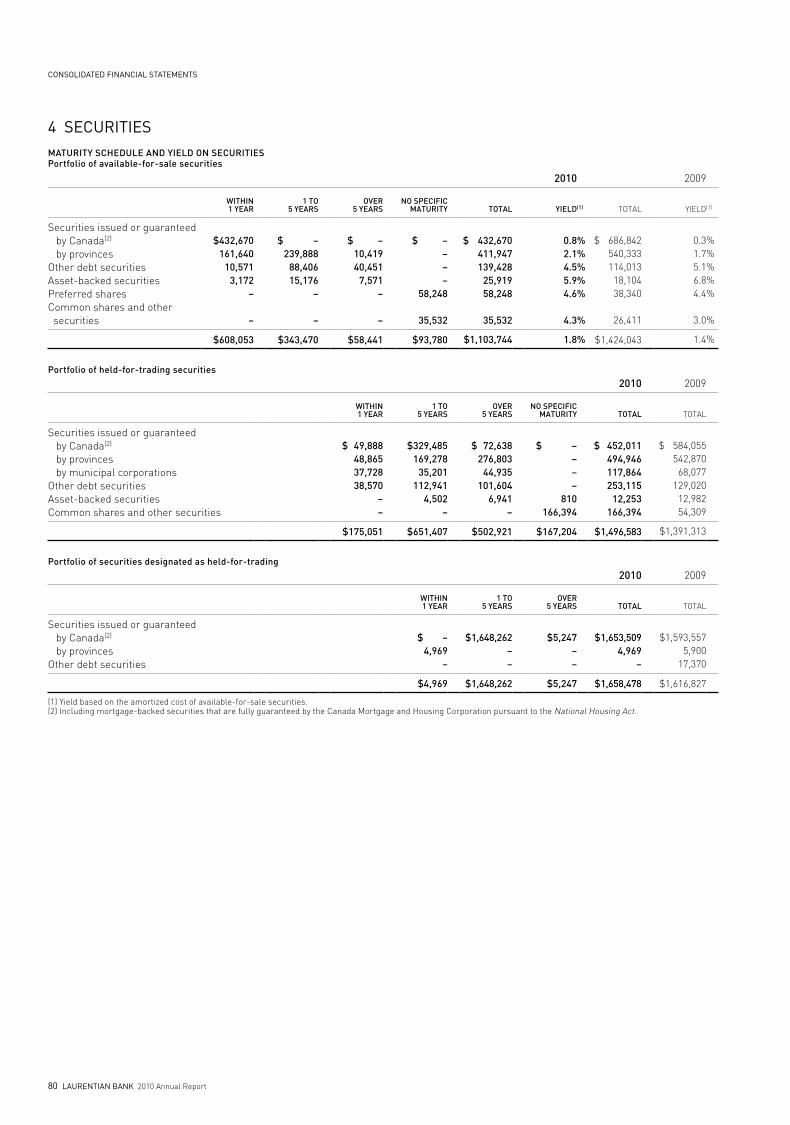
CONSOLIDATED FINANCIAL STATEMENTS
80 LAurENTIAN bANK 2010 Annual Report
4 SECurITIES MatuRitY schedule and Yield on secuRitiesPortfolio of available-for-sale securities
2010 2009
within1 YeaR
1 to5 YeaRs
oveR5 YeaRs
no sPecificMatuRitY total Yield(1) TOTAL YIELd(1)
Securities issued or guaranteed by Canada(2) by provinces Other debt securities Asset-backed securities Preferred shares Common shares and other securities
$432,670
161,640 10,571
3,172 –
–
$ –
239,888 88,406 15,176
–
–
$ –
10,419 40,451
7,571–
–
$ –
–––
58,248
35,532
$ 432,670
411,947 139,428
25,919 58,248
35,532
0.82.14.55.94.6
4.3
%%%%%
%
$ 686,842
540,333 114,013
18,104 38,340
26,411
0.31.75.16.84.4
3.0
%%%%%
%
$608,053 $343,470 $58,441 $93,780 $1,103,744 1.8% $1,424,043 1.4 %
Portfolio of held-for-trading securities
2010 2009
within1 YeaR
1 to5 YeaRs
oveR5 YeaRs
no sPecificMatuRitY total TOTAL
Securities issued or guaranteed by Canada(2) by provinces by municipal corporations Other debt securities Asset-backed securities Common shares and other securities
$ 49,888
48,865 37,728 38,570
––
$329,485
169,278 35,201
112,941 4,502
–
$ 72,638
276,803 44,935
101,604 6,941
–
$ –
–––
810 166,394
$ 452,011
494,946117,864253,115
12,253166,394
$ 584,055
542,870 68,077
129,02012,98254,309
$175,051 $651,407 $502,921 $167,204 $1,496,583 $1,391,313
Portfolio of securities designated as held-for-trading
2010 2009
within1 YeaR
1 to5 YeaRs
oveR5 YeaRs total TOTAL
Securities issued or guaranteed by Canada(2)
by provincesOther debt securities
$ –
4,969–
$1,648,262
––
$5,247
––
$1,653,509
4,969 –
$1,593,557
5,900 17,370
$4,969 $1,648,262 $5,247 $1,658,478 $1,616,827
(1) Yield based on the amortized cost of available-for-sale securities.(2) Including mortgage-backed securities that are fully guaranteed by the Canada Mortgage and Housing Corporation pursuant to the National Housing Act.
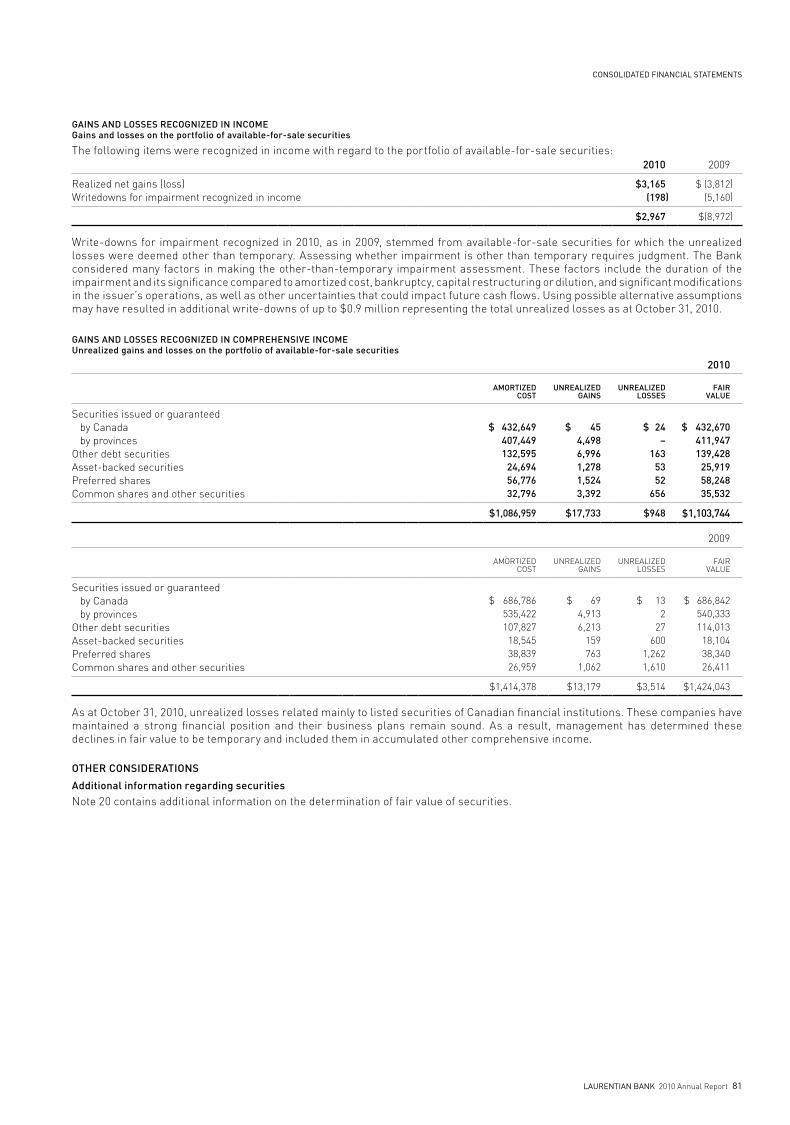
CONSOLIDATED FINANCIAL STATEMENTS
LAurENTIAN bANK 2010 Annual Report 81
gains and losses Recognized in incoMe gains and losses on the portfolio of available-for-sale securities
The following items were recognized in income with regard to the portfolio of available-for-sale securities:2010 2009
Realized net gains (loss) Writedowns for impairment recognized in income
$3,165 (198
)
$ (3,812 (5,160
))
$2,967 $(8,972 )
Write-downs for impairment recognized in 2010, as in 2009, stemmed from available-for-sale securities for which the unrealized losses were deemed other than temporary. Assessing whether impairment is other than temporary requires judgment. The Bank considered many factors in making the other-than-temporary impairment assessment. These factors include the duration of the impairment and its significance compared to amortized cost, bankruptcy, capital restructuring or dilution, and significant modifications in the issuer’s operations, as well as other uncertainties that could impact future cash flows. Using possible alternative assumptions may have resulted in additional write-downs of up to $0.9 million representing the total unrealized losses as at October 31, 2010.
gains and losses Recognized in coMPRehensive incoMeunrealized gains and losses on the portfolio of available-for-sale securities
2010
aMoRtizedcost
unRealizedgains
unRealizedlosses
faiRvalue
Securities issued or guaranteed by Canada by provinces Other debt securities Asset-backed securities Preferred sharesCommon shares and other securities
$ 432,649
407,449 132,595
24,694 56,776 32,796
$ 454,4986,9961,2781,5243,392
$ 24 –
163 53 52
656
$ 432,670 411,947 139,428
25,919 58,248 35,532
$1,086,959 $17,733 $948 $1,103,744
2009
AMORTIzEdCOST
UNREALIzEdGAINS
UNREALIzEdLOSSES
FAIRVALUE
Securities issued or guaranteed by Canada by provinces Other debt securities Asset-backed securities Preferred sharesCommon shares and other securities
$ 686,786 535,422 107,827
18,545 38,839 26,959
$ 69 4,913 6,213
159 763
1,062
$ 13
2 27
600 1,262 1,610
$ 686,842
540,333 114,013
18,104 38,340 26,411
$1,414,378 $13,179 $3,514 $1,424,043
As at October 31, 2010, unrealized losses related mainly to listed securities of Canadian financial institutions. These companies have maintained a strong financial position and their business plans remain sound. As a result, management has determined these declines in fair value to be temporary and included them in accumulated other comprehensive income.
otheR consideRations
additional information regarding securitiesNote 20 contains additional information on the determination of fair value of securities.
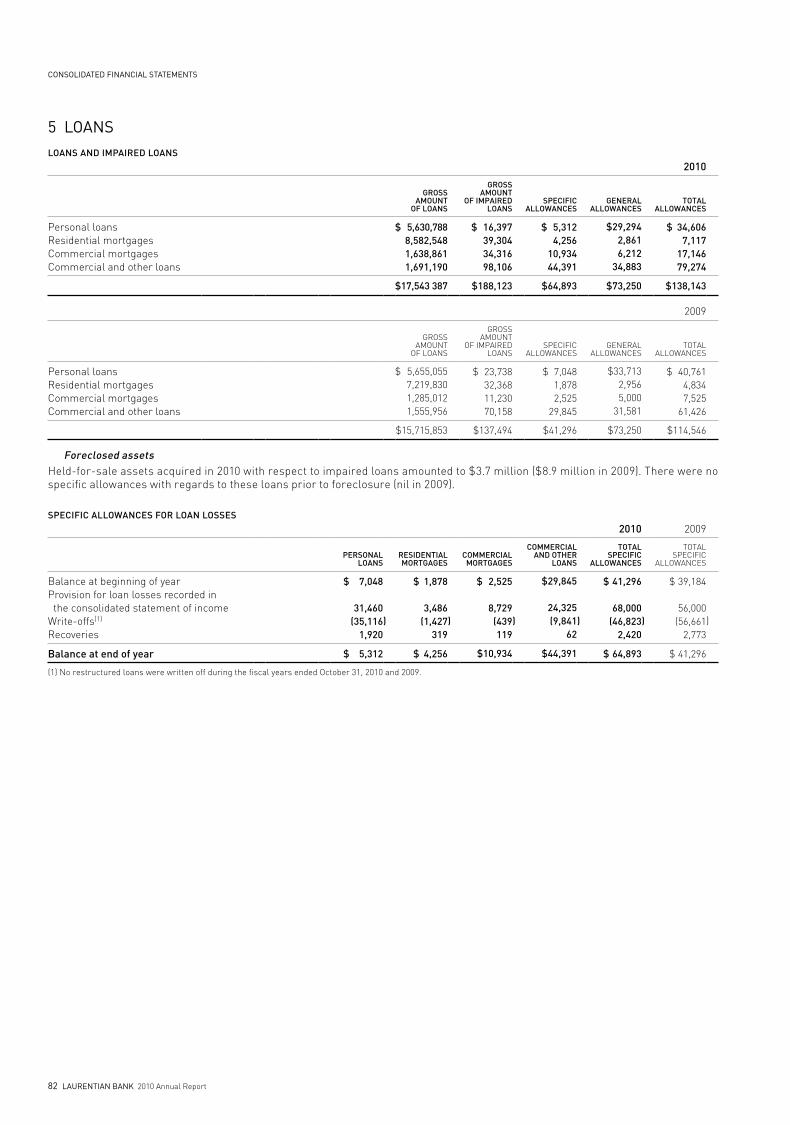
CONSOLIDATED FINANCIAL STATEMENTS
82 LAurENTIAN bANK 2010 Annual Report
5 LOANSloans and iMPaiRed loans
2010
gRoss aMount
of loans
gRoss aMount
of iMPaiRed loans
sPecificallowances
geneRalallowances
totalallowances
Personal loansResidential mortgagesCommercial mortgagesCommercial and other loans
$ 5,630,788 8,582,548 1,638,861 1,691,190
$ 16,397 39,304 34,316 98,106
$ 5,312 4,256
10,934 44,391
$29,294 2,861 6,212
34,883
$ 34,606 7,117
17,146 79,274
$17,543 387 $188,123 $64,893 $73,250 $138,143
2009
GROSS AMOUNT
OF LOANS
GROSS AMOUNT
OF IMPAIREd LOANS
SPECIFICALLOWANCES
GENERALALLOWANCES
TOTALALLOWANCES
Personal loansResidential mortgagesCommercial mortgagesCommercial and other loans
$ 5,655,055 7,219,830 1,285,012 1,555,956
$ 23,738 32,368 11,230 70,158
$ 7,048 1,878 2,525
29,845
$33,713 2,956 5,000
31,581
$ 40,761 4,834 7,525
61,426
$15,715,853 $137,494 $41,296 $73,250 $114,546
foreclosed assetsHeld-for-sale assets acquired in 2010 with respect to impaired loans amounted to $3.7 million ($8.9 million in 2009). There were no specific allowances with regards to these loans prior to foreclosure (nil in 2009).
sPecific allowances foR loan losses
2010 2009
PeRsonalloans
ResidentialMoRtgages
coMMeRcialMoRtgages
coMMeRcialand otheR
loans
totalsPecific
allowances
TOTALSPECIFIC
ALLOWANCES
Balance at beginning of yearProvision for loan losses recorded in the consolidated statement of incomeWrite-offs(1)
Recoveries
$ 7,048
31,460 (35,116
1,920)
$ 1,878
3,486 (1,427
319 )
$ 2,525
8,729 (439 119
)
$29,845
24,325 (9,841
62 )
$ 41,296
68,000 (46,823
2,420 )
$ 39,184
56,000 (56,661
2,773 )
balance at end of year $ 5,312 $ 4,256 $10,934 $44,391 $ 64,893 $ 41,296
(1) No restructured loans were written off during the fiscal years ended October 31, 2010 and 2009.
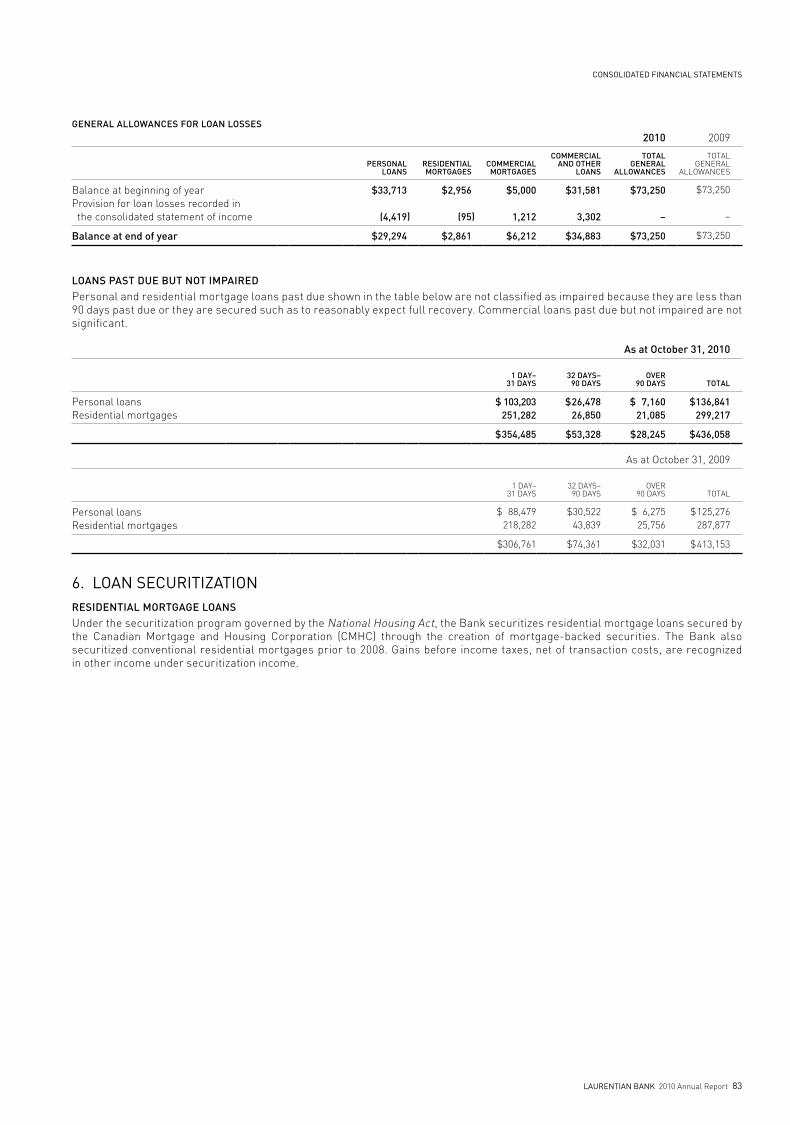
CONSOLIDATED FINANCIAL STATEMENTS
LAurENTIAN bANK 2010 Annual Report 83
geneRal allowances foR loan losses
2010 2009
PeRsonalloans
ResidentialMoRtgages
coMMeRcialMoRtgages
coMMeRcialand otheR
loans
totalgeneRal
allowances
TOTALGENERAL
ALLOWANCES
Balance at beginning of yearProvision for loan losses recorded in the consolidated statement of income
$33,713
(4,419)
$2,956
(95 )
$5,000
1,212
$31,581
3,302
$73,250
–
$73,250
–
balance at end of year $29,294 $2,861 $6,212 $34,883 $73,250 $73,250
loans Past due but not iMPaiRedPersonal and residential mortgage loans past due shown in the table below are not classified as impaired because they are less than 90 days past due or they are secured such as to reasonably expect full recovery. Commercial loans past due but not impaired are not significant.
as at october 31, 2010
1 daY–31 daYs
32 daYs–90 daYs
oveR90 daYs total
Personal loansResidential mortgages
$ 103,203 251,282
$ 26,478 26,850
$ 7,160 21,085
$ 136,841 299,217
$ 354,485 $53,328 $28,245 $ 436,058
As at October 31, 2009
1 dAY–31 dAYS
32 dAYS–90 dAYS
OVER90 dAYS TOTAL
Personal loansResidential mortgages
$ 88,479 218,282
$30,522 43,839
$ 6,275 25,756
$ 125,276 287,877
$306,761 $74,361 $32,031 $ 413,153
6. LOAN SECurITIzATIONResidential MoRtgage loansUnder the securitization program governed by the National Housing Act, the Bank securitizes residential mortgage loans secured by the Canadian Mortgage and Housing Corporation (CMHC) through the creation of mortgage-backed securities. The Bank also securitized conventional residential mortgages prior to 2008. Gains before income taxes, net of transaction costs, are recognized in other income under securitization income.
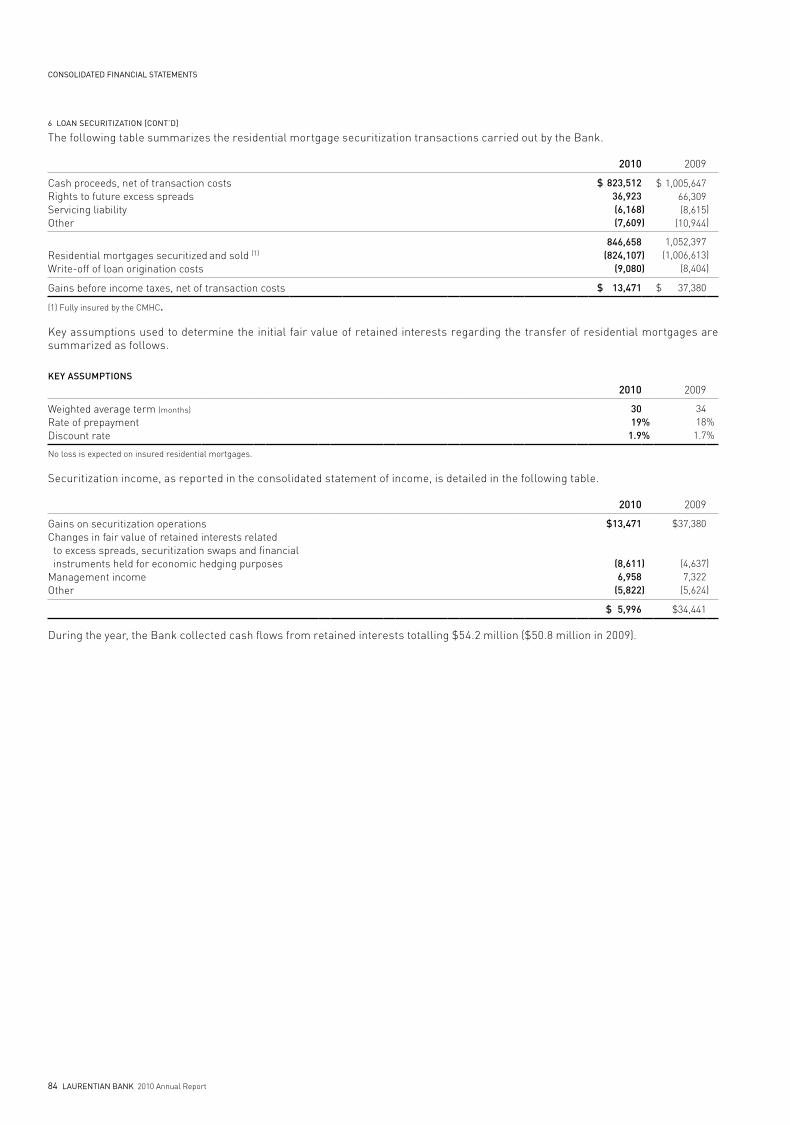
CONSOLIDATED FINANCIAL STATEMENTS
84 LAurENTIAN bANK 2010 Annual Report
The following table summarizes the residential mortgage securitization transactions carried out by the Bank.
2010 2009
Cash proceeds, net of transaction costsRights to future excess spreadsServicing liabilityOther
$ 823,512 36,923 (6,168(7,609
))
$ 1,005,647 66,309 (8,615
(10,944))
Residential mortgages securitized and sold (1)
Write-off of loan origination costs
846,658(824,107
(9,080))
1,052,397(1,006,613
(8,404))
Gains before income taxes, net of transaction costs $ 13,471 $ 37,380
(1) Fully insured by the CMHC.
Key assumptions used to determine the initial fair value of retained interests regarding the transfer of residential mortgages are summarized as follows.
keY assuMPtions
2010 2009
Weighted average term (months)
Rate of prepaymentdiscount rate
3019
1.9%%
3418
1.7 %%
No loss is expected on insured residential mortgages.
Securitization income, as reported in the consolidated statement of income, is detailed in the following table.
2010 2009
Gains on securitization operationsChanges in fair value of retained interests related to excess spreads, securitization swaps and financial instruments held for economic hedging purposesManagement incomeOther
$13,471
(8,6116,958
(5,822
)
)
$37,380
(4,6377,322
(5,624
)
)
$ 5,996 $34,441
during the year, the Bank collected cash flows from retained interests totalling $54.2 million ($50.8 million in 2009).
6 LOAN SECurITIzATION [CONT’D]
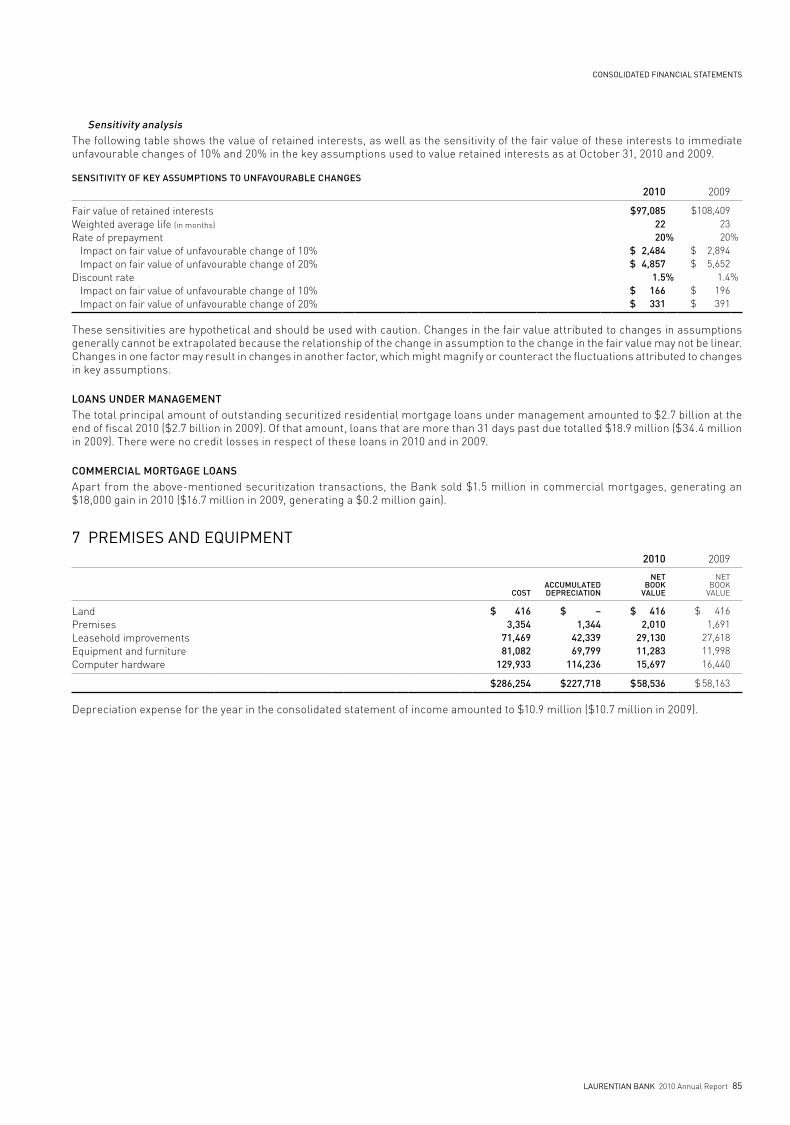
CONSOLIDATED FINANCIAL STATEMENTS
LAurENTIAN bANK 2010 Annual Report 85
sensitivity analysisThe following table shows the value of retained interests, as well as the sensitivity of the fair value of these interests to immediate unfavourable changes of 10% and 20% in the key assumptions used to value retained interests as at October 31, 2010 and 2009.
sensitivitY of keY assuMPtions to unfavouRable changes
2010 2009
Fair value of retained interestsWeighted average life (in months)
Rate of prepayment Impact on fair value of unfavourable change of 10% Impact on fair value of unfavourable change of 20%discount rate Impact on fair value of unfavourable change of 10% Impact on fair value of unfavourable change of 20%
$97,085 22 20
$ 2,484 $ 4,857
1.5 $ 166 $ 331
%
%
$108,409 23 20
$ 2,894 $ 5,652
1.4 $ 196 $ 391
%
%
These sensitivities are hypothetical and should be used with caution. Changes in the fair value attributed to changes in assumptions generally cannot be extrapolated because the relationship of the change in assumption to the change in the fair value may not be linear. Changes in one factor may result in changes in another factor, which might magnify or counteract the fluctuations attributed to changes in key assumptions.
loans undeR ManageMentThe total principal amount of outstanding securitized residential mortgage loans under management amounted to $2.7 billion at the end of fiscal 2010 ($2.7 billion in 2009). Of that amount, loans that are more than 31 days past due totalled $18.9 million ($34.4 million in 2009). There were no credit losses in respect of these loans in 2010 and in 2009.
coMMeRcial MoRtgage loansApart from the above-mentioned securitization transactions, the Bank sold $1.5 million in commercial mortgages, generating an $18,000 gain in 2010 ($16.7 million in 2009, generating a $0.2 million gain).
7 prEMISES AND EQuIpMENT 2010 2009
cost accuMulateddePReciation
netbook
value
NETBOOK
VALUE
LandPremisesLeasehold improvementsEquipment and furnitureComputer hardware
$ 416 3,354
71,469 81,082
129,933
$ – 1,344
42,339 69,799
114,236
$ 416 2,010
29,130 11,283 15,697
$ 416 1,691
27,618 11,998 16,440
$286,254 $227,718 $ 58,536 $ 58,163
depreciation expense for the year in the consolidated statement of income amounted to $10.9 million ($10.7 million in 2009).
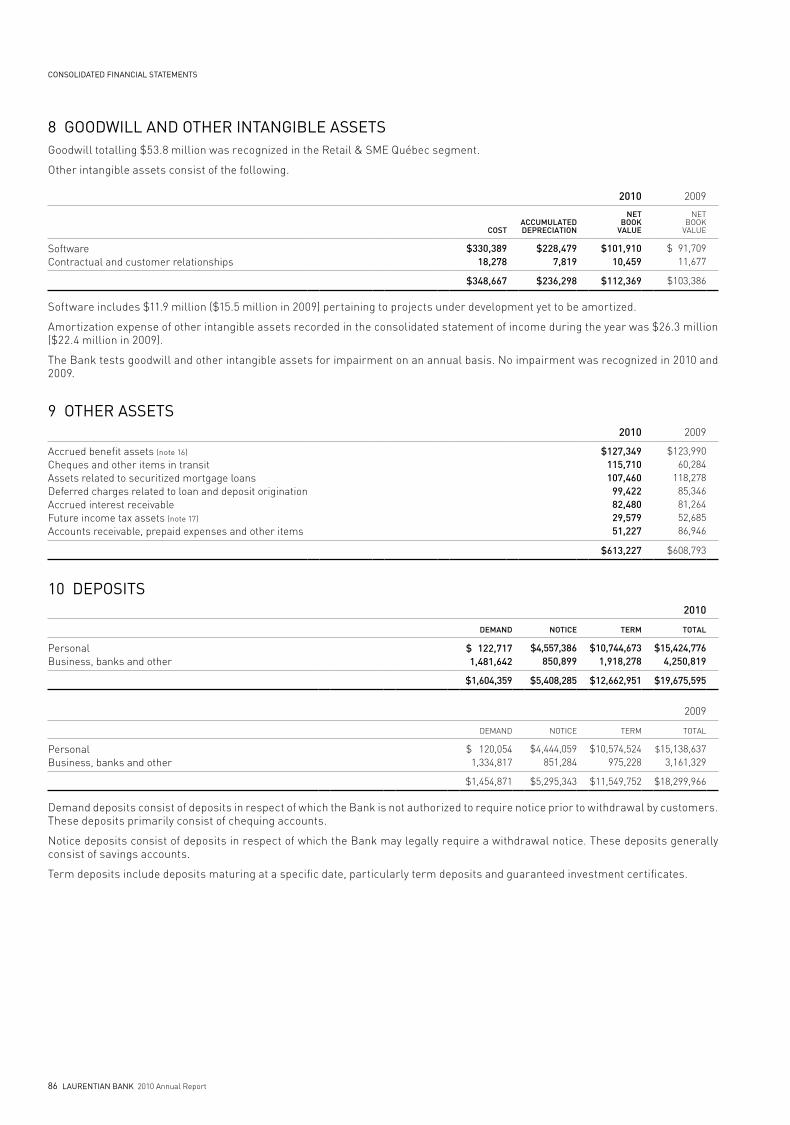
CONSOLIDATED FINANCIAL STATEMENTS
86 LAurENTIAN bANK 2010 Annual Report
8 GOODWILL AND OThEr INTANGIbLE ASSETSGoodwill totalling $53.8 million was recognized in the Retail & SME Québec segment.
Other intangible assets consist of the following.
2010 2009
cost accuMulateddePReciation
netbook
value
NETBOOK
VALUE
SoftwareContractual and customer relationships
$330,389 18,278
$228,479 7,819
$101,910 10,459
$ 91,709 11,677
$348,667 $236,298 $112,369 $103,386
Software includes $11.9 million ($15.5 million in 2009) pertaining to projects under development yet to be amortized.
Amortization expense of other intangible assets recorded in the consolidated statement of income during the year was $26.3 million ($22.4 million in 2009).
The Bank tests goodwill and other intangible assets for impairment on an annual basis. No impairment was recognized in 2010 and 2009.
9 OThEr ASSETS2010 2009
Accrued benefit assets (note 16)
Cheques and other items in transitAssets related to securitized mortgage loansdeferred charges related to loan and deposit originationAccrued interest receivableFuture income tax assets (note 17)
Accounts receivable, prepaid expenses and other items
$127,349 115,710 107,460
99,422 82,480 29,579 51,227
$123,990 60,284
118,278 85,346 81,264 52,685 86,946
$613,227 $608,793
10 DEpOSITS2010
deMand notice teRM total
PersonalBusiness, banks and other
$ 122,717 1,481,642
$4,557,386 850,899
$10,744,673 1,918,278
$15,424,776 4,250,819
$1,604,359 $5,408,285 $12,662,951 $19,675,595
2009
dEMANd NOTICE TERM TOTAL
PersonalBusiness, banks and other
$ 120,054 1,334,817
$4,444,059 851,284
$10,574,524 975,228
$15,138,637 3,161,329
$1,454,871 $5,295,343 $11,549,752 $18,299,966
demand deposits consist of deposits in respect of which the Bank is not authorized to require notice prior to withdrawal by customers. These deposits primarily consist of chequing accounts.
Notice deposits consist of deposits in respect of which the Bank may legally require a withdrawal notice. These deposits generally consist of savings accounts.
Term deposits include deposits maturing at a specific date, particularly term deposits and guaranteed investment certificates.

CONSOLIDATED FINANCIAL STATEMENTS
LAurENTIAN bANK 2010 Annual Report 87
11 OThEr LIAbILITIES 2010 2009
Accrued interest payableCheques and other items in transitFuture income tax liabilities (note 17)
Liabilities related to securitized mortgage loansAccrued benefit liabilities (note 16)
Accounts payable, accrued expenses and other items
$465,637 244,342
41,520 33,190 17,874
145,316
$431,892 153,615
45,171 47,394 16,194
118,188
$947,879 $812,454
12 SubOrDINATED DEbENTurES [SEE NOTE 29]
The subordinated debentures are direct unsecured obligations of the Bank and are subordinated in right of payment to the claims of depositors and certain other creditors of the Bank. Any repurchase or cancellation of subordinated debentures must be approved by OSFI.
issued and outstanding
MatuRitY seRiesinteRest
Rate sPecial teRMs 2010 2009
January 2016 10 4.90% Redeemable at par as of January 25, 2011; rate to be revised on January 25, 2011 and set at the 90-day bankers’ acceptance rate plus 1.65%
$150,000 $150,000
13 CApITAL STOCK authoRized caPital stockPreferred shares – Unlimited number of Class A Preferred Shares, without par value, issuable in series.
Common shares – Unlimited number of common shares, without par value.
issued and outstanding
2010 2009
dividendsPeR shaRe(1)
nuMbeRof shaRes aMount
declaReddividends
NUMBEROF SHARES AMOUNT
dECLAREddIVIdENdS
Class A Preferred SharesSeries 9Series 10
$1.5001.312
4,000,000 4,400,000
$100,000 110,000
$ 6,000 5,775
4,000,000 4,400,000
$100,000 110,000
$ 6,000 5,775
Total preferred shares 8,400,000 $210,000 $11,775 8,400,000 $210,000 $11,775
Common shares $1.440 23,920,962 $259,363 $34,446 23,913,963 $259,208 $32,453
(1) Non-cumulative dividends on preferred shares.
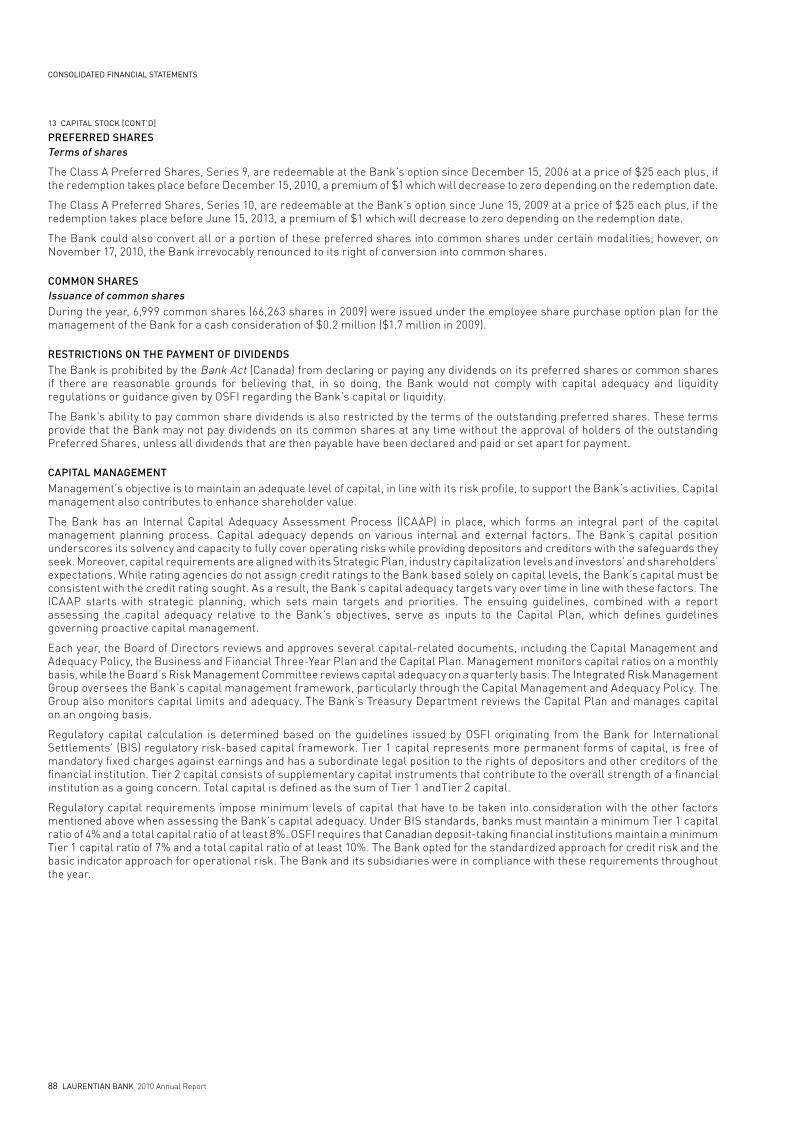
CONSOLIDATED FINANCIAL STATEMENTS
88 LAurENTIAN bANK 2010 Annual Report
PRefeRRed shaResterms of shares
The Class A Preferred Shares, Series 9, are redeemable at the Bank’s option since december 15, 2006 at a price of $25 each plus, if the redemption takes place before december 15, 2010, a premium of $1 which will decrease to zero depending on the redemption date.
The Class A Preferred Shares, Series 10, are redeemable at the Bank’s option since June 15, 2009 at a price of $25 each plus, if the redemption takes place before June 15, 2013, a premium of $1 which will decrease to zero depending on the redemption date.
The Bank could also convert all or a portion of these preferred shares into common shares under certain modalities; however, on November 17, 2010, the Bank irrevocably renounced to its right of conversion into common shares.
coMMon shaResissuance of common sharesduring the year, 6,999 common shares (66,263 shares in 2009) were issued under the employee share purchase option plan for the management of the Bank for a cash consideration of $0.2 million ($1.7 million in 2009).
RestRictions on the PaYMent of dividendsThe Bank is prohibited by the Bank Act (Canada) from declaring or paying any dividends on its preferred shares or common shares if there are reasonable grounds for believing that, in so doing, the Bank would not comply with capital adequacy and liquidity regulations or guidance given by OSFI regarding the Bank’s capital or liquidity.
The Bank’s ability to pay common share dividends is also restricted by the terms of the outstanding preferred shares. These terms provide that the Bank may not pay dividends on its common shares at any time without the approval of holders of the outstanding Preferred Shares, unless all dividends that are then payable have been declared and paid or set apart for payment.
caPital ManageMentManagement’s objective is to maintain an adequate level of capital, in line with its risk profile, to support the Bank’s activities. Capital management also contributes to enhance shareholder value.
The Bank has an Internal Capital Adequacy Assessment Process (ICAAP) in place, which forms an integral part of the capital management planning process. Capital adequacy depends on various internal and external factors. The Bank’s capital position underscores its solvency and capacity to fully cover operating risks while providing depositors and creditors with the safeguards they seek. Moreover, capital requirements are aligned with its Strategic Plan, industry capitalization levels and investors’ and shareholders’ expectations. While rating agencies do not assign credit ratings to the Bank based solely on capital levels, the Bank’s capital must be consistent with the credit rating sought. As a result, the Bank’s capital adequacy targets vary over time in line with these factors. The ICAAP starts with strategic planning, which sets main targets and priorities. The ensuing guidelines, combined with a report assessing the capital adequacy relative to the Bank’s objectives, serve as inputs to the Capital Plan, which defines guidelines governing proactive capital management.
Each year, the Board of directors reviews and approves several capital-related documents, including the Capital Management and Adequacy Policy, the Business and Financial Three-Year Plan and the Capital Plan. Management monitors capital ratios on a monthly basis, while the Board’s Risk Management Committee reviews capital adequacy on a quarterly basis. The Integrated Risk Management Group oversees the Bank’s capital management framework, particularly through the Capital Management and Adequacy Policy. The Group also monitors capital limits and adequacy. The Bank’s Treasury department reviews the Capital Plan and manages capital on an ongoing basis.
Regulatory capital calculation is determined based on the guidelines issued by OSFI originating from the Bank for International Settlements’ (BIS) regulatory risk-based capital framework. Tier 1 capital represents more permanent forms of capital, is free of mandatory fixed charges against earnings and has a subordinate legal position to the rights of depositors and other creditors of the financial institution. Tier 2 capital consists of supplementary capital instruments that contribute to the overall strength of a financial institution as a going concern. Total capital is defined as the sum of Tier 1 andTier 2 capital.
Regulatory capital requirements impose minimum levels of capital that have to be taken into consideration with the other factors mentioned above when assessing the Bank’s capital adequacy. Under BIS standards, banks must maintain a minimum Tier 1 capital ratio of 4% and a total capital ratio of at least 8%. OSFI requires that Canadian deposit-taking financial institutions maintain a minimum Tier 1 capital ratio of 7% and a total capital ratio of at least 10%. The Bank opted for the standardized approach for credit risk and the basic indicator approach for operational risk. The Bank and its subsidiaries were in compliance with these requirements throughout the year.
13 CApITAL STOCK [CONT’D]
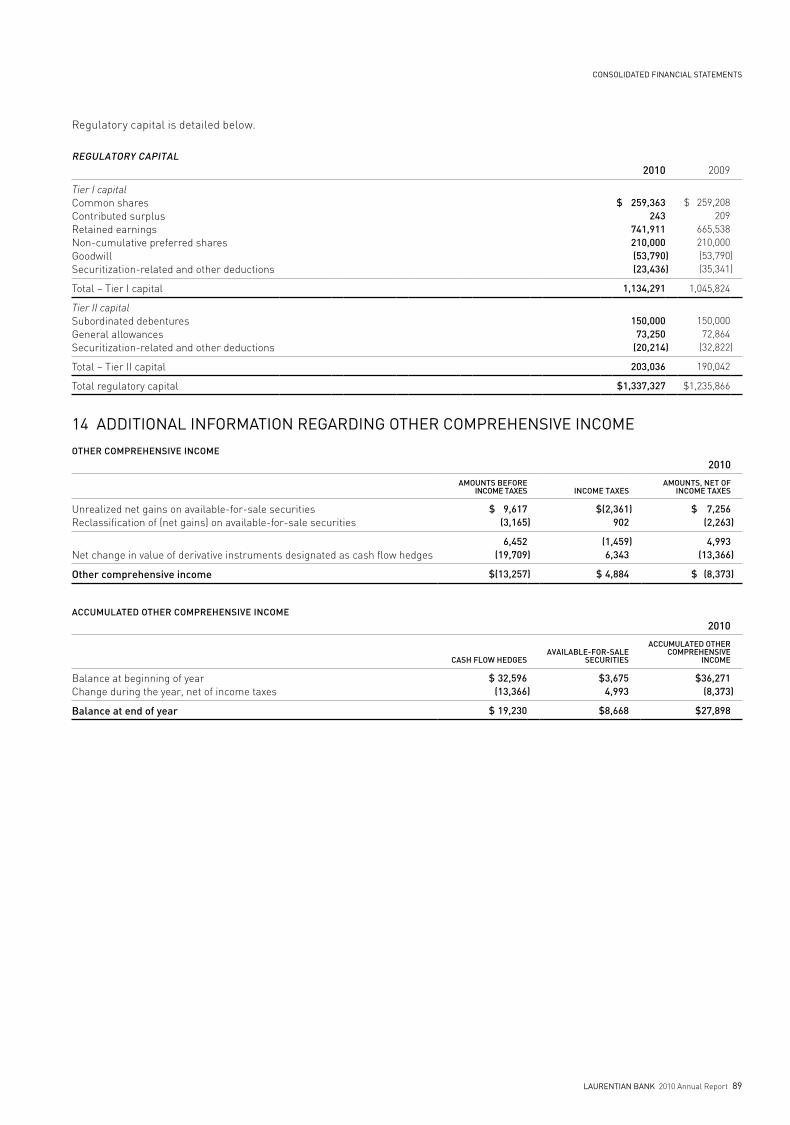
CONSOLIDATED FINANCIAL STATEMENTS
LAurENTIAN bANK 2010 Annual Report 89
Regulatory capital is detailed below.
RegulatoRY caPital2010 2009
Tier I capitalCommon sharesContributed surplusRetained earningsNon-cumulative preferred sharesGoodwillSecuritization-related and other deductions
$ 259,363
243 741,911 210,000 (53,790(23,436
))
$ 259,208 209
665,538 210,000 (53,790(35,341
))
Total – Tier I capital 1,134,291 1,045,824
Tier II capitalSubordinated debenturesGeneral allowancesSecuritization-related and other deductions
150,000 73,250
(20,214)
150,000 72,864
(32,822)
Total – Tier II capital 203,036 190,042
Total regulatory capital $1,337,327 $1,235,866
14 ADDITIONAL INFOrMATION rEGArDING OThEr COMprEhENSIVE INCOME
otheR coMPRehensive incoMe
2010
aMounts befoReincoMe taxes incoMe taxes
aMounts, net ofincoMe taxes
Unrealized net gains on available-for-sale securitiesReclassification of (net gains) on available-for-sale securities
$ 9,617 (3,165)
$(2,361902
) $ 7,256 (2,263)
Net change in value of derivative instruments designated as cash flow hedges6,452
(19,709)(1,4596,343
) 4,993 (13,366)
other comprehensive income $(13,257) $ 4,884 $ (8,373)
accuMulated otheR coMPRehensive incoMe
2010
cash flow hedgesavailable-foR-sale
secuRities
accuMulated otheRcoMPRehensive
incoMe
Balance at beginning of yearChange during the year, net of income taxes
$ 32,596(13,366)
$3,6754,993
$36,271(8,373)
balance at end of year $ 19,230 $8,668 $27,898
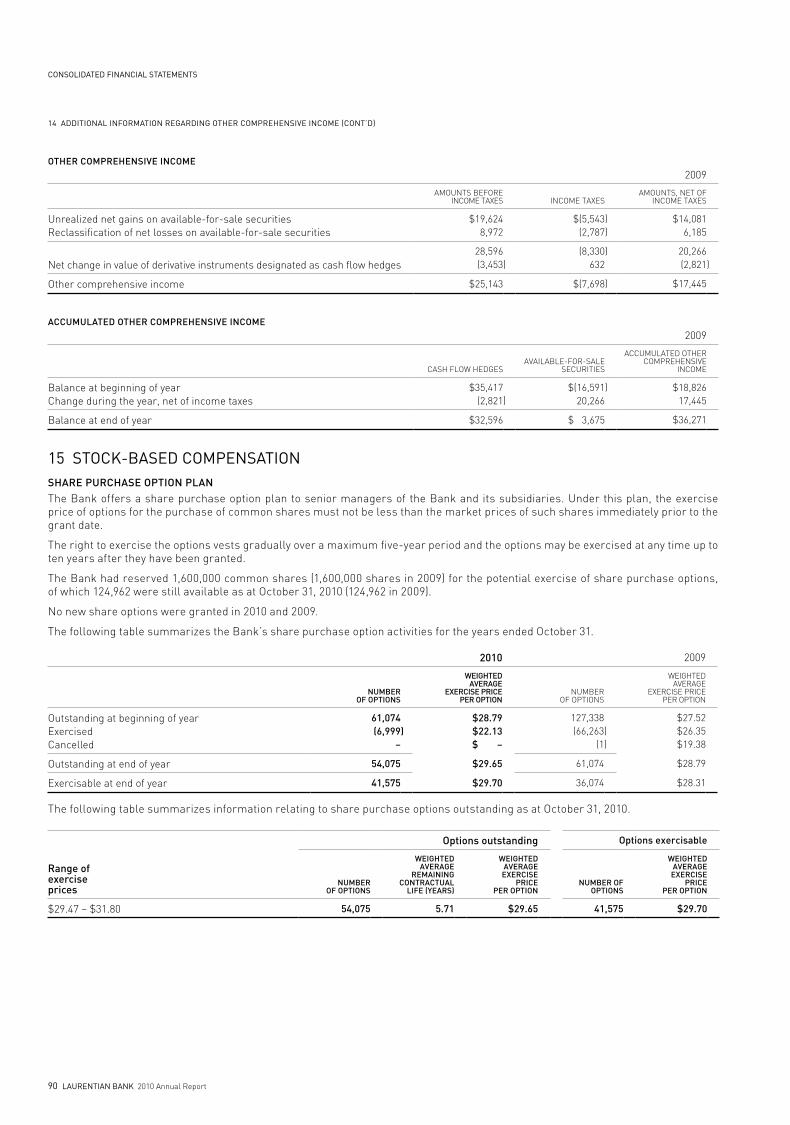
CONSOLIDATED FINANCIAL STATEMENTS
90 LAurENTIAN bANK 2010 Annual Report
accuMulated otheR coMPRehensive incoMe2009
CASH FLOW HEdGESAVAILABLE-FOR-SALE
SECURITIES
ACCUMULATEd OTHERCOMPREHENSIVE
INCOME
Balance at beginning of year Change during the year, net of income taxes
$35,417(2,821)
$(16,59120,266
) $18,826 17,445
Balance at end of year $32,596 $ 3,675 $36,271
15 STOCK-bASED COMpENSATIONshaRe PuRchase oPtion PlanThe Bank offers a share purchase option plan to senior managers of the Bank and its subsidiaries. Under this plan, the exercise price of options for the purchase of common shares must not be less than the market prices of such shares immediately prior to the grant date.
The right to exercise the options vests gradually over a maximum five-year period and the options may be exercised at any time up to ten years after they have been granted.
The Bank had reserved 1,600,000 common shares (1,600,000 shares in 2009) for the potential exercise of share purchase options, of which 124,962 were still available as at October 31, 2010 (124,962 in 2009).
No new share options were granted in 2010 and 2009.
The following table summarizes the Bank’s share purchase option activities for the years ended October 31.
2010 2009
nuMbeRof oPtions
weightedaveRage
exeRcise PRicePeR oPtion
NUMBEROF OPTIONS
WEIGHTEdAVERAGE
ExERCISE PRICEPER OPTION
Outstanding at beginning of yearExercisedCancelled
61,074 (6,999
– )
$28.79 $22.13 $ –
127,338 (66,263
(1))
$27.52 $26.35 $19.38
Outstanding at end of year 54,075 $29.65 61,074 $28.79
Exercisable at end of year 41,575 $29.70 36,074 $28.31
The following table summarizes information relating to share purchase options outstanding as at October 31, 2010.
options outstanding options exercisable
Range ofexerciseprices
nuMbeRof oPtions
weighted aveRage ReMaining contRactual life (YeaRs)
weightedaveRageexeRcise
PRice PeR oPtion
nuMbeR ofoPtions
weightedaveRageexeRcise
PRicePeR oPtion
$29.47 – $31.80 54,075 5.71 $29.65 41,575 $29.70
14 ADDITIONAL INFOrMATION rEGArDING OThEr COMprEhENSIVE INCOME (CONT’D)
otheR coMPRehensive incoMe2009
AMOUNTS BEFOREINCOME TAxES INCOME TAxES
AMOUNTS, NET OFINCOME TAxES
Unrealized net gains on available-for-sale securitiesReclassification of net losses on available-for-sale securities
$19,624 8,972
$(5,543(2,787
) )
$14,081 6,185
Net change in value of derivative instruments designated as cash flow hedges28,596(3,453)
(8,330632
) 20,266(2,821)
Other comprehensive income $25,143 $(7,698) $17,445
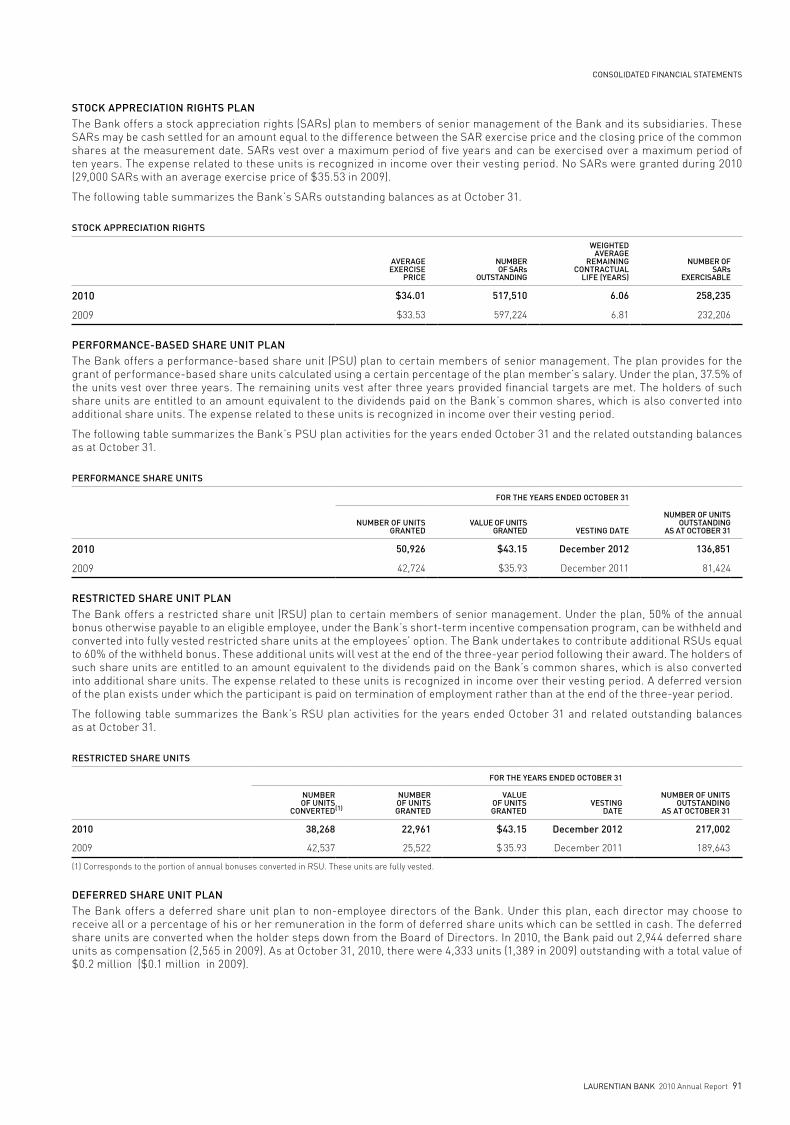
CONSOLIDATED FINANCIAL STATEMENTS
LAurENTIAN bANK 2010 Annual Report 91
stock aPPReciation Rights PlanThe Bank offers a stock appreciation rights (SARs) plan to members of senior management of the Bank and its subsidiaries. These SARs may be cash settled for an amount equal to the difference between the SAR exercise price and the closing price of the common shares at the measurement date. SARs vest over a maximum period of five years and can be exercised over a maximum period of ten years. The expense related to these units is recognized in income over their vesting period. No SARs were granted during 2010 (29,000 SARs with an average exercise price of $35.53 in 2009).
The following table summarizes the Bank’s SARs outstanding balances as at October 31.
stock aPPReciation Rights
aveRageexeRcise
PRice
nuMbeRof saRs
outstanding
weightedaveRage
ReMainingcontRactual
life (YeaRs)
nuMbeR ofsaRs
exeRcisable
2010 $34.01 517,510 6.06 258,235
2009 $33.53 597,224 6.81 232,206
PeRfoRMance-based shaRe unit PlanThe Bank offers a performance-based share unit (PSU) plan to certain members of senior management. The plan provides for the grant of performance-based share units calculated using a certain percentage of the plan member’s salary. Under the plan, 37.5% of the units vest over three years. The remaining units vest after three years provided financial targets are met. The holders of such share units are entitled to an amount equivalent to the dividends paid on the Bank’s common shares, which is also converted into additional share units. The expense related to these units is recognized in income over their vesting period.
The following table summarizes the Bank’s PSU plan activities for the years ended October 31 and the related outstanding balances as at October 31.
PeRfoRMance shaRe units
foR the YeaRs ended octobeR 31
nuMbeR of unitsgRanted
value of unitsgRanted vesting date
nuMbeR of unitsoutstanding
as at octobeR 31
2010 50,926 $43.15 december 2012 136,851
2009 42,724 $35.93 december 2011 81,424
RestRicted shaRe unit PlanThe Bank offers a restricted share unit (RSU) plan to certain members of senior management. Under the plan, 50% of the annual bonus otherwise payable to an eligible employee, under the Bank’s short-term incentive compensation program, can be withheld and converted into fully vested restricted share units at the employees’ option. The Bank undertakes to contribute additional RSUs equal to 60% of the withheld bonus. These additional units will vest at the end of the three-year period following their award. The holders of such share units are entitled to an amount equivalent to the dividends paid on the Bank’s common shares, which is also converted into additional share units. The expense related to these units is recognized in income over their vesting period. A deferred version of the plan exists under which the participant is paid on termination of employment rather than at the end of the three-year period.
The following table summarizes the Bank’s RSU plan activities for the years ended October 31 and related outstanding balances as at October 31.
RestRicted shaRe units
foR the YeaRs ended octobeR 31
nuMbeRof units
conveRted(1)
nuMbeRof unitsgRanted
value of units
gRanted vesting
date
nuMbeR of unitsoutstanding
as at octobeR 31
2010 38,268 22,961 $43.15 december 2012 217,002
2009 42,537 25,522 $ 35.93 december 2011 189,643
(1) Corresponds to the portion of annual bonuses converted in RSU. These units are fully vested.
defeRRed shaRe unit PlanThe Bank offers a deferred share unit plan to non-employee directors of the Bank. Under this plan, each director may choose to receive all or a percentage of his or her remuneration in the form of deferred share units which can be settled in cash. The deferred share units are converted when the holder steps down from the Board of directors. In 2010, the Bank paid out 2,944 deferred share units as compensation (2,565 in 2009). As at October 31, 2010, there were 4,333 units (1,389 in 2009) outstanding with a total value of $0.2 million ($0.1 million in 2009).
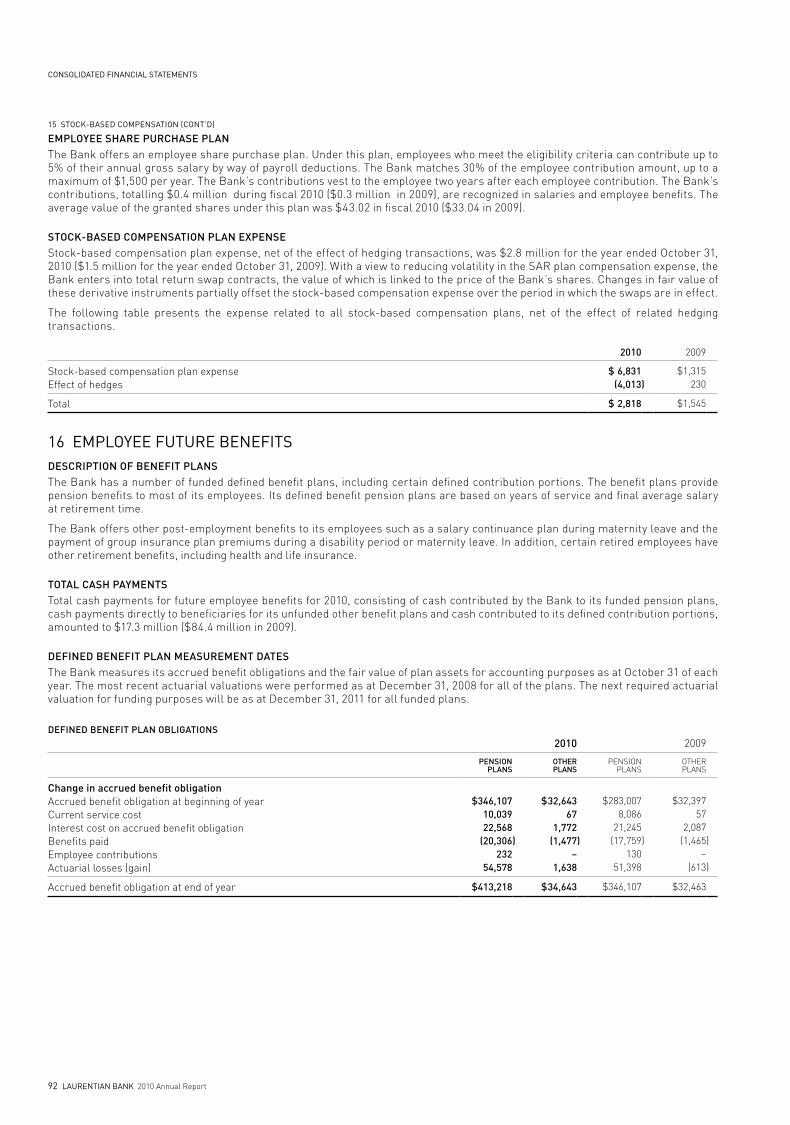
CONSOLIDATED FINANCIAL STATEMENTS
92 LAurENTIAN bANK 2010 Annual Report
eMPloYee shaRe PuRchase PlanThe Bank offers an employee share purchase plan. Under this plan, employees who meet the eligibility criteria can contribute up to 5% of their annual gross salary by way of payroll deductions. The Bank matches 30% of the employee contribution amount, up to a maximum of $1,500 per year. The Bank’s contributions vest to the employee two years after each employee contribution. The Bank’s contributions, totalling $0.4 million during fiscal 2010 ($0.3 million in 2009), are recognized in salaries and employee benefits. The average value of the granted shares under this plan was $43.02 in fiscal 2010 ($33.04 in 2009).
stock-based coMPensation Plan exPenseStock-based compensation plan expense, net of the effect of hedging transactions, was $2.8 million for the year ended October 31, 2010 ($1.5 million for the year ended October 31, 2009). With a view to reducing volatility in the SAR plan compensation expense, the Bank enters into total return swap contracts, the value of which is linked to the price of the Bank’s shares. Changes in fair value of these derivative instruments partially offset the stock-based compensation expense over the period in which the swaps are in effect.
The following table presents the expense related to all stock-based compensation plans, net of the effect of related hedging transactions.
2010 2009
Stock-based compensation plan expenseEffect of hedges
$ 6,831 (4,013)
$1,315 230
Total $ 2,818 $1,545
16 EMpLOyEE FuTurE bENEFITS descRiPtion of benefit PlansThe Bank has a number of funded defined benefit plans, including certain defined contribution portions. The benefit plans provide pension benefits to most of its employees. Its defined benefit pension plans are based on years of service and final average salary at retirement time.
The Bank offers other post-employment benefits to its employees such as a salary continuance plan during maternity leave and the payment of group insurance plan premiums during a disability period or maternity leave. In addition, certain retired employees have other retirement benefits, including health and life insurance.
total cash PaYMentsTotal cash payments for future employee benefits for 2010, consisting of cash contributed by the Bank to its funded pension plans, cash payments directly to beneficiaries for its unfunded other benefit plans and cash contributed to its defined contribution portions, amounted to $17.3 million ($84.4 million in 2009).
defined benefit Plan MeasuReMent datesThe Bank measures its accrued benefit obligations and the fair value of plan assets for accounting purposes as at October 31 of each year. The most recent actuarial valuations were performed as at december 31, 2008 for all of the plans. The next required actuarial valuation for funding purposes will be as at december 31, 2011 for all funded plans.
defined benefit Plan obligations
2010 2009
PensionPlans
otheRPlans
PENSIONPLANS
OTHERPLANS
change in accrued benefit obligationAccrued benefit obligation at beginning of yearCurrent service costInterest cost on accrued benefit obligationBenefits paidEmployee contributionsActuarial losses (gain)
$346,107 10,039 22,568
(20,306232
54,578
)
$ 32,643 67
1,772 (1,477
– 1,638
)
$283,007 8,086
21,245 (17,759
130 51,398
)
$32,397 57
2,087 (1,465
–(613
)
)
Accrued benefit obligation at end of year $413,218 $ 34,643 $346,107 $32,463
15 STOCK-bASED COMpENSATION (CONT’D)
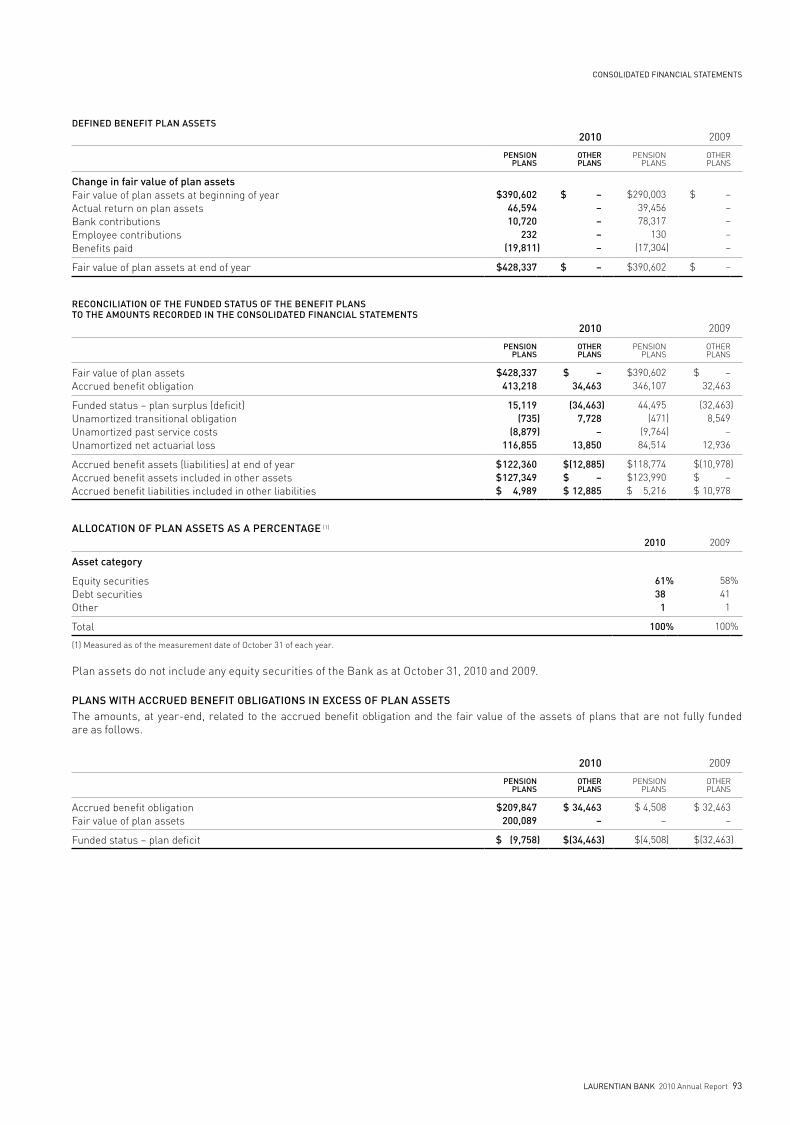
CONSOLIDATED FINANCIAL STATEMENTS
LAurENTIAN bANK 2010 Annual Report 93
defined benefit Plan assets
2010 2009
PensionPlans
otheRPlans
PENSIONPLANS
OTHERPLANS
change in fair value of plan assetsFair value of plan assets at beginning of yearActual return on plan assetsBank contributionsEmployee contributionsBenefits paid
$390,602 46,594 10,720
232 (19,811)
$ – ––––
$290,003 39,456 78,317
130 (17,304)
$ – ––––
Fair value of plan assets at end of year $428,337 $ – $390,602 $ –
Reconciliation of the funded status of the benefit Plans to the aMounts RecoRded in the consolidated financial stateMents
2010 2009
PensionPlans
otheRPlans
PENSIONPLANS
OTHERPLANS
Fair value of plan assetsAccrued benefit obligation
$428,337 413,218
$ – 34,463
$390,602 346,107
$ – 32,463
Funded status – plan surplus (deficit)Unamortized transitional obligationUnamortized past service costsUnamortized net actuarial loss
15,119 (735
(8,879116,855
))
(34,4637,728
–13,850
) 44,495 (471
(9,76484,514
))
(32,4638,549
–12,936
)
Accrued benefit assets (liabilities) at end of yearAccrued benefit assets included in other assetsAccrued benefit liabilities included in other liabilities
$ 122,360 $ 127,349 $ 4,989
$(12,885 $ – $ 12,885
) $118,774 $123,990 $ 5,216
$(10,978 $ – $ 10,978
)
allocation of Plan assets as a PeRcentage (1)
2010 2009
asset category
Equity securitiesdebt securitiesOther
6138
1
% 5841
1
%
Total 100 % 100%
(1) Measured as of the measurement date of October 31 of each year.
Plan assets do not include any equity securities of the Bank as at October 31, 2010 and 2009.
Plans with accRued benefit obligations in excess of Plan assetsThe amounts, at year-end, related to the accrued benefit obligation and the fair value of the assets of plans that are not fully funded are as follows.
2010 2009
PensionPlans
otheRPlans
PENSIONPLANS
OTHERPLANS
Accrued benefit obligationFair value of plan assets
$209,847 200,089
$ 34,463 –
$ 4,508 –
$ 32,463 –
Funded status – plan deficit $ (9,758) $(34,463) $(4,508) $(32,463)
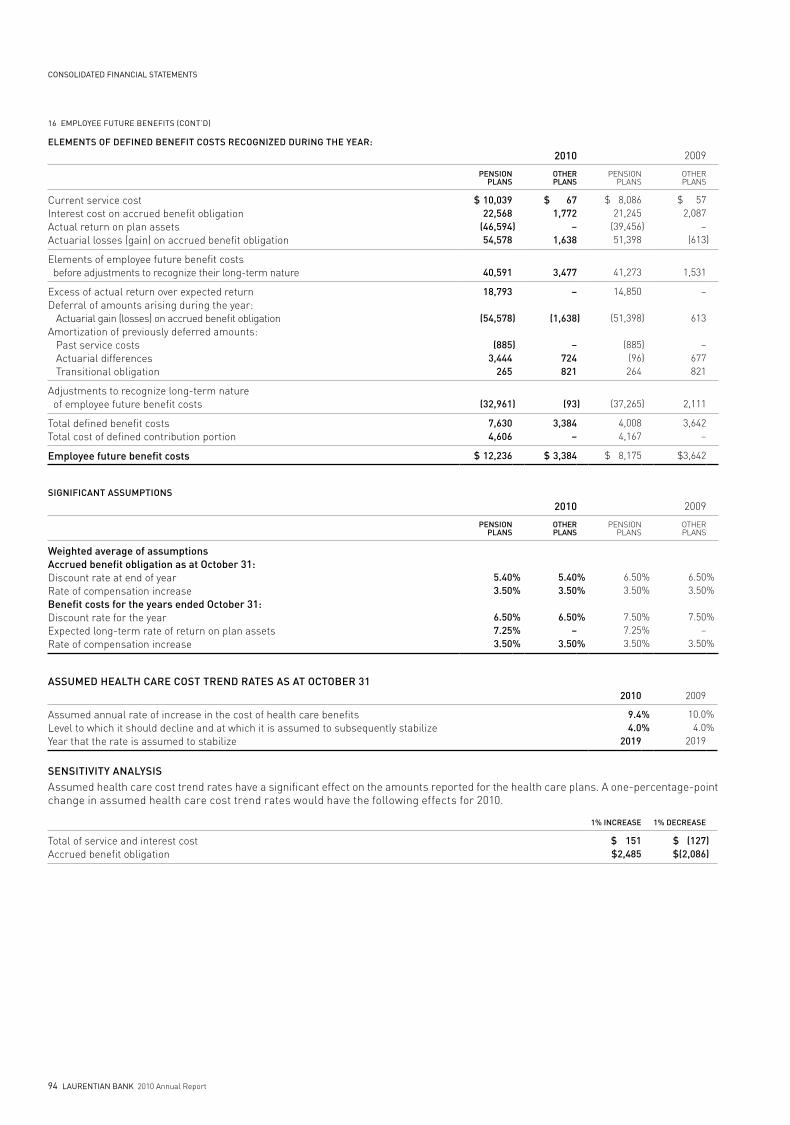
CONSOLIDATED FINANCIAL STATEMENTS
94 LAurENTIAN bANK 2010 Annual Report
eleMents of defined benefit costs Recognized duRing the YeaR:
2010 2009
PensionPlans
otheRPlans
PENSIONPLANS
OTHERPLANS
Current service costInterest cost on accrued benefit obligationActual return on plan assetsActuarial losses (gain) on accrued benefit obligation
$ 10,03922,568
(46,59454,578
)
$ 67 1,772
–1,638
$ 8,086 21,245
(39,45651,398
)
$ 57 2,087
–(613)
Elements of employee future benefit costs before adjustments to recognize their long-term nature 40,591 3,477 41,273 1,531
Excess of actual return over expected returndeferral of amounts arising during the year: Actuarial gain (losses) on accrued benefit obligationAmortization of previously deferred amounts: Past service costs Actuarial differences Transitional obligation
18,793
(54,578
(8853,444
265
)
)
–
(1,638
–724 821
)
14,850
(51,398
(885(96264
)
))
–
613
–677 821
Adjustments to recognize long-term nature of employee future benefit costs (32,961) (93) (37,265) 2,111
Total defined benefit costsTotal cost of defined contribution portion
7,6304,606
3,384 –
4,008 4,167
3,642 –
employee future benefit costs $ 12,236 $ 3,384 $ 8,175 $3,642
significant assuMPtions
2010 2009
PensionPlans
otheRPlans
PENSIONPLANS
OTHERPLANS
weighted average of assumptionsaccrued benefit obligation as at october 31: discount rate at end of yearRate of compensation increasebenefit costs for the years ended october 31:discount rate for the yearExpected long-term rate of return on plan assetsRate of compensation increase
5.403.50
6.507.253.50
%%
%%%
5.403.50
6.50–
3.50
%%
%
%
6.503.50
7.507.253.50
%%
%%%
6.503.50
7.50–
3.50
%%
%
%
assuMed health caRe cost tRend Rates as at octobeR 312010 2009
Assumed annual rate of increase in the cost of health care benefitsLevel to which it should decline and at which it is assumed to subsequently stabilizeYear that the rate is assumed to stabilize
9.44.0
2019
%%
10.04.0
2019
%%
sensitivitY analYsisAssumed health care cost trend rates have a significant effect on the amounts reported for the health care plans. A one-percentage-point change in assumed health care cost trend rates would have the following effects for 2010.
1% incRease 1% decRease
Total of service and interest costAccrued benefit obligation
$ 151 $2,485
$ (127 $(2,086
))
16 EMpLOyEE FuTurE bENEFITS (CONT’D)
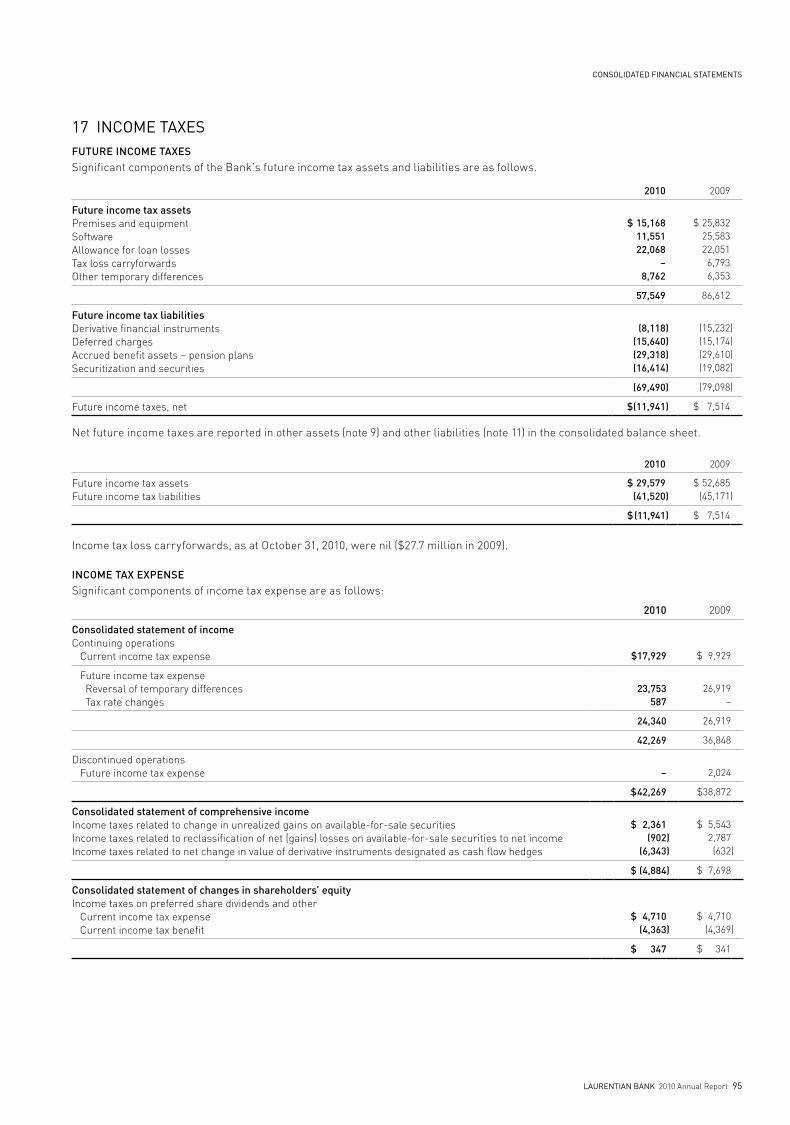
CONSOLIDATED FINANCIAL STATEMENTS
LAurENTIAN bANK 2010 Annual Report 95
17 INCOME TAxES futuRe incoMe taxesSignificant components of the Bank’s future income tax assets and liabilities are as follows.
2010 2009
future income tax assetsPremises and equipmentSoftwareAllowance for loan lossesTax loss carryforwardsOther temporary differences
$ 15,16811,55122,068
–8,762
$ 25,832 25,583 22,051
6,793 6,353
57,549 86,612
future income tax liabilitiesderivative financial instrumentsdeferred chargesAccrued benefit assets – pension plansSecuritization and securities
(8,118(15,640(29,318(16,414
))))
(15,232(15,174(29,610(19,082
))))
(69,490) (79,098)
Future income taxes, net $(11,941) $ 7,514
Net future income taxes are reported in other assets (note 9) and other liabilities (note 11) in the consolidated balance sheet.
2010 2009
Future income tax assetsFuture income tax liabilities
$ 29,579 (41,520)
$ 52,685 (45,171)
$ (11,941) $ 7,514
Income tax loss carryforwards, as at October 31, 2010, were nil ($27.7 million in 2009).
incoMe tax exPenseSignificant components of income tax expense are as follows:
2010 2009
consolidated statement of incomeContinuing operations Current income tax expense $17,929
$ 9,929
Future income tax expense Reversal of temporary differences Tax rate changes
23,753 587
26,919–
24,340 26,919
42,269 36,848
discontinued operations Future income tax expense – 2,024
$ 42,269 $38,872
consolidated statement of comprehensive incomeIncome taxes related to change in unrealized gains on available-for-sale securitiesIncome taxes related to reclassification of net (gains) losses on available-for-sale securities to net incomeIncome taxes related to net change in value of derivative instruments designated as cash flow hedges
$ 2,361
(902(6,343
))
$ 5,543
2,787 (632)
$ (4,884) $ 7,698
consolidated statement of changes in shareholders’ equityIncome taxes on preferred share dividends and other Current income tax expense Current income tax benefit
$ 4,710
(4,363)
$ 4,710
(4,369)
$ 347 $ 341
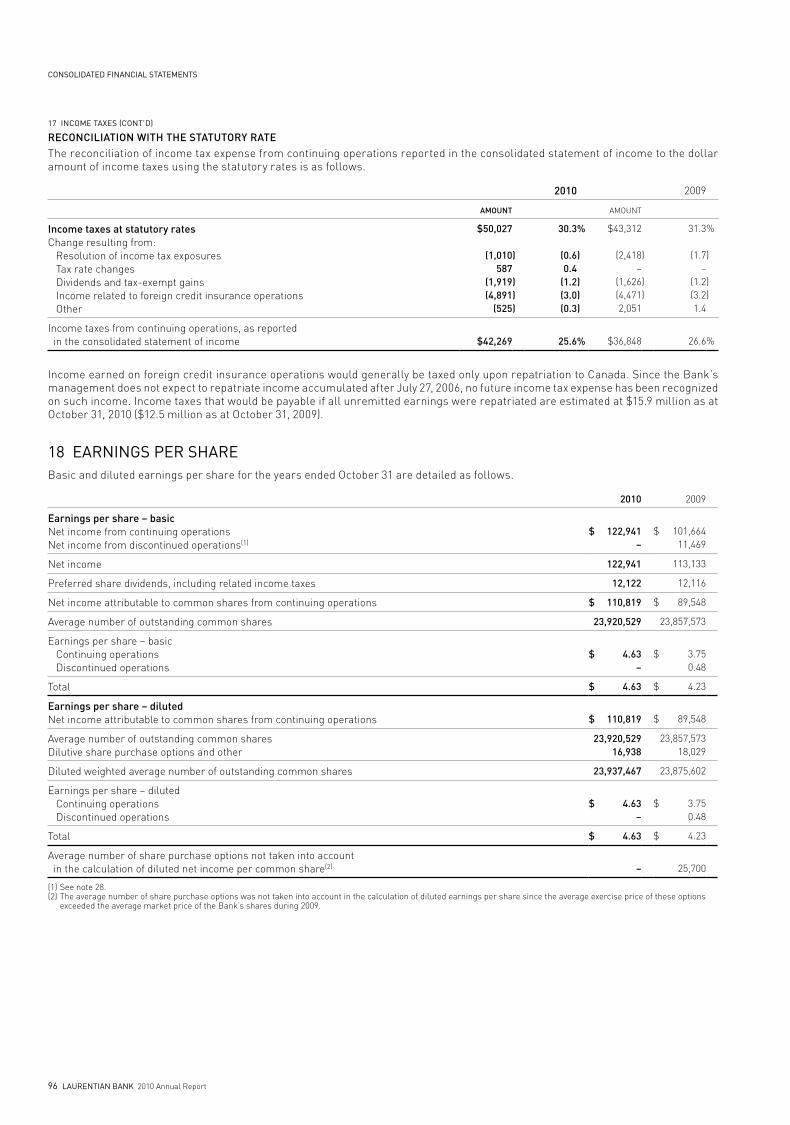
CONSOLIDATED FINANCIAL STATEMENTS
96 LAurENTIAN bANK 2010 Annual Report
Reconciliation with the statutoRY RateThe reconciliation of income tax expense from continuing operations reported in the consolidated statement of income to the dollar amount of income taxes using the statutory rates is as follows.
2010 2009
aMount AMOUNT
income taxes at statutory rates Change resulting from: Resolution of income tax exposures Tax rate changes dividends and tax-exempt gains Income related to foreign credit insurance operations Other
$50,027
(1,010 587
(1,919(4,891
(525
)
)))
30.3
(0.60.4
(1.2(3.0(0.3
%
)
)))
$43,312
(2,418–
(1,626(4,4712,051
)
))
31.3
(1.7 –
(1.2(3.21.4
%
)
))
Income taxes from continuing operations, as reported in the consolidated statement of income $42,269 25.6
% $36,848 26.6 %
Income earned on foreign credit insurance operations would generally be taxed only upon repatriation to Canada. Since the Bank’s management does not expect to repatriate income accumulated after July 27, 2006, no future income tax expense has been recognized on such income. Income taxes that would be payable if all unremitted earnings were repatriated are estimated at $15.9 million as at October 31, 2010 ($12.5 million as at October 31, 2009).
18 EArNINGS pEr ShArE Basic and diluted earnings per share for the years ended October 31 are detailed as follows.
2010 2009
earnings per share – basicNet income from continuing operationsNet income from discontinued operations(1)
$ 122,941 –
$ 101,664 11,469
Net income 122,941 113,133
Preferred share dividends, including related income taxes 12,122 12,116
Net income attributable to common shares from continuing operations $ 110,819 $ 89,548
Average number of outstanding common shares 23,920,529 23,857,573
Earnings per share – basic Continuing operations discontinued operations
$ 4.63–
$ 3.750.48
Total $ 4.63 $ 4.23
earnings per share – dilutedNet income attributable to common shares from continuing operations $ 110,819 $ 89,548
Average number of outstanding common sharesdilutive share purchase options and other
23,920,529 16,938
23,857,573 18,029
diluted weighted average number of outstanding common shares 23,937,467 23,875,602
Earnings per share – diluted Continuing operations discontinued operations
$ 4.63–
$ 3.750.48
Total $ 4.63 $ 4.23
Average number of share purchase options not taken into account in the calculation of diluted net income per common share(2) – 25,700
(1) See note 28.(2) The average number of share purchase options was not taken into account in the calculation of diluted earnings per share since the average exercise price of these options
exceeded the average market price of the Bank’s shares during 2009.
17 INCOME TAxES (CONT’D)
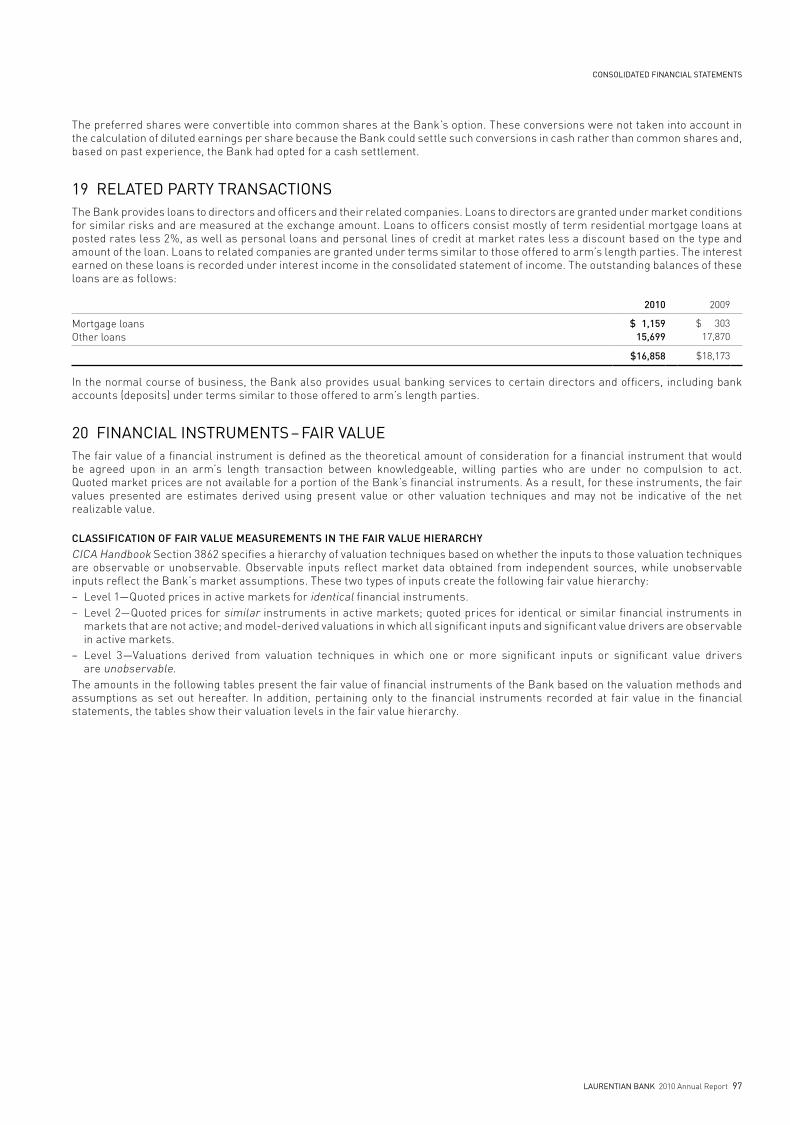
CONSOLIDATED FINANCIAL STATEMENTS
LAurENTIAN bANK 2010 Annual Report 97
The preferred shares were convertible into common shares at the Bank’s option. These conversions were not taken into account in the calculation of diluted earnings per share because the Bank could settle such conversions in cash rather than common shares and, based on past experience, the Bank had opted for a cash settlement.
19 rELATED pArTy TrANSACTIONSThe Bank provides loans to directors and officers and their related companies. Loans to directors are granted under market conditions for similar risks and are measured at the exchange amount. Loans to officers consist mostly of term residential mortgage loans at posted rates less 2%, as well as personal loans and personal lines of credit at market rates less a discount based on the type and amount of the loan. Loans to related companies are granted under terms similar to those offered to arm’s length parties. The interest earned on these loans is recorded under interest income in the consolidated statement of income. The outstanding balances of these loans are as follows:
2010 2009
Mortgage loansOther loans
$ 1,159 15,699
$ 303 17,870
$16,858 $18,173
In the normal course of business, the Bank also provides usual banking services to certain directors and officers, including bank accounts (deposits) under terms similar to those offered to arm’s length parties.
20 FINANCIAL INSTruMENTS – FAIr VALuEThe fair value of a financial instrument is defined as the theoretical amount of consideration for a financial instrument that would be agreed upon in an arm’s length transaction between knowledgeable, willing parties who are under no compulsion to act. Quoted market prices are not available for a portion of the Bank’s financial instruments. As a result, for these instruments, the fair values presented are estimates derived using present value or other valuation techniques and may not be indicative of the net realizable value.
classification of faiR value MeasuReMents in the faiR value hieRaRchYCICA Handbook Section 3862 specifies a hierarchy of valuation techniques based on whether the inputs to those valuation techniques are observable or unobservable. Observable inputs reflect market data obtained from independent sources, while unobservable inputs reflect the Bank’s market assumptions. These two types of inputs create the following fair value hierarchy:– Level 1—Quoted prices in active markets for identical financial instruments.– Level 2—Quoted prices for similar instruments in active markets; quoted prices for identical or similar financial instruments in
markets that are not active; and model-derived valuations in which all significant inputs and significant value drivers are observable in active markets.
– Level 3—Valuations derived from valuation techniques in which one or more significant inputs or significant value drivers are unobservable.
The amounts in the following tables present the fair value of financial instruments of the Bank based on the valuation methods and assumptions as set out hereafter. In addition, pertaining only to the financial instruments recorded at fair value in the financial statements, the tables show their valuation levels in the fair value hierarchy.
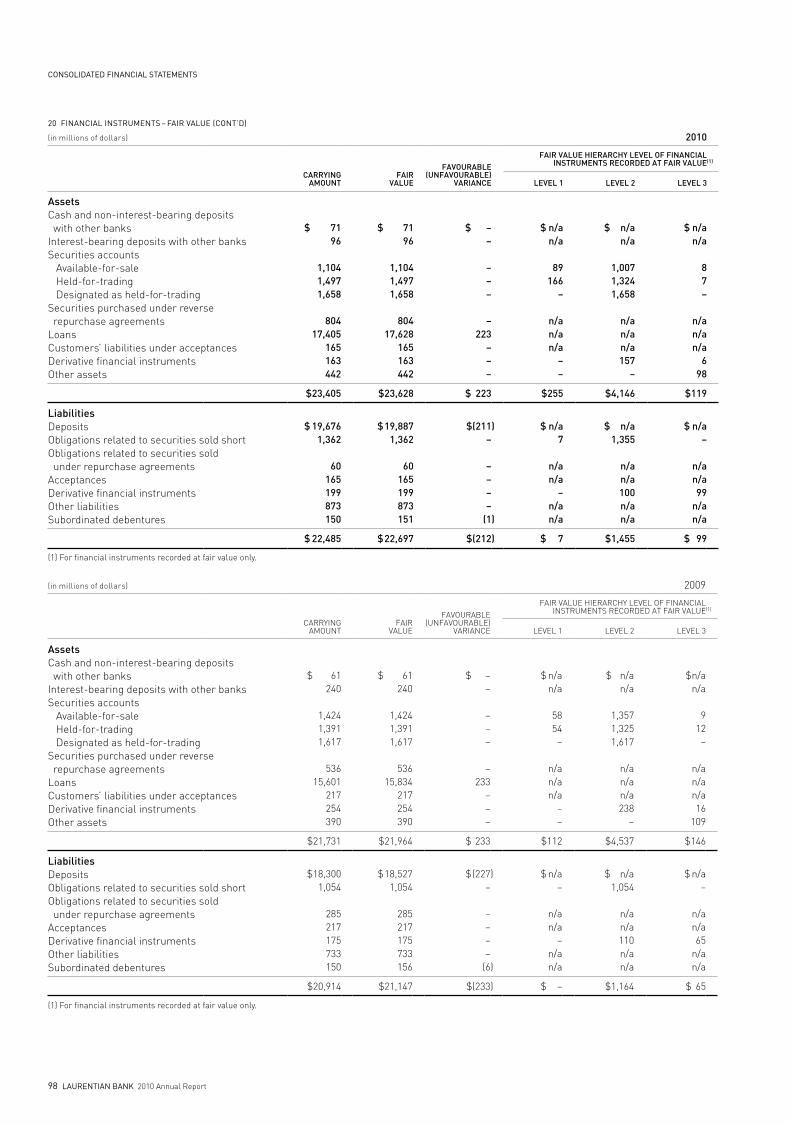
CONSOLIDATED FINANCIAL STATEMENTS
98 LAurENTIAN bANK 2010 Annual Report
(in millions of dollars) 2010
caRRYingaMount
faiRvalue
favouRable(unfavouRable)
vaRiance
faiR value hieRaRchY level of financialinstRuMents RecoRded at faiR value(1)
level 1 level 2 level 3
assetsCash and non-interest-bearing deposits with other banksInterest-bearing deposits with other banksSecurities accounts Available-for-sale Held-for-trading designated as held-for-tradingSecurities purchased under reverse repurchase agreementsLoansCustomers’ liabilities under acceptancesderivative financial instrumentsOther assets
$ 7196
1,1041,4971,658
80417,405
165163442
$ 71 96
1,104 1,497 1,658
804 17,628
165 163 442
$ ––
–––
–223
–––
$ n/an/a
89166
–
n/an/an/a
––
$ n/an/a
1,007 1,324 1,658
n/an/an/a157
–
$ n/an/a
8 7 –
n/an/an/a
6 98
$23,405 $23,628 $ 223 $255 $4,146 $119
liabilitiesdepositsObligations related to securities sold shortObligations related to securities sold under repurchase agreementsAcceptancesderivative financial instrumentsOther liabilitiesSubordinated debentures
$ 19,6761,362
60165199873150
$ 19,887 1,362
60 165 199 873 151
$(211–
––––
(1
)
)
$ n/a7
n/an/a
–n/a n/a
$ n/a 1,355
n/an/a100n/a n/a
$ n/a–
n/an/a99
n/a n/a
$ 22,485 $ 22,697 $(212) $ 7 $1,455 $ 99
(1) For financial instruments recorded at fair value only.
(in millions of dollars) 2009
CARRYINGAMOUNT
FAIRVALUE
FAVOURABLE(UNFAVOURABLE)
VARIANCE
FAIR VALUE HIERARCHY LEVEL OF FINANCIALINSTRUMENTS RECORdEd AT FAIR VALUE(1)
LEVEL 1 LEVEL 2 LEVEL 3
assetsCash and non-interest-bearing deposits with other banksInterest-bearing deposits with other banksSecurities accounts Available-for-sale Held-for-trading designated as held-for-tradingSecurities purchased under reverse repurchase agreementsLoansCustomers’ liabilities under acceptancesderivative financial instrumentsOther assets
$ 61 240
1,424 1,391 1,617
536 15,601
217 254 390
$ 61 240
1,424 1,391 1,617
536 15,834
217 254 390
$ ––
–––
–233
–––
$ n/an/a
5854
–
n/an/an/a
––
$ n/an/a
1,357 1,325 1,617
n/an/an/a238
–
$ n/an/a
9 12
–
n/an/an/a16
109
$21,731 $21,964 $ 233 $112 $4,537 $146
liabilitiesdepositsObligations related to securities sold shortObligations related to securities sold under repurchase agreementsAcceptancesderivative financial instrumentsOther liabilitiesSubordinated debentures
$ 18,300 1,054
285 217 175 733 150
$ 18,527 1,054
285 217 175 733 156
$ (227–
––––
(6
)
)
$ n/a–
n/an/a
–n/an/a
$ n/a1,054
n/an/a110 n/an/a
$ n/a–
n/an/a65
n/an/a
$20,914 $21,147 $(233) $ – $1,164 $ 65
(1) For financial instruments recorded at fair value only.
20 FINANCIAL INSTruMENTS – FAIr VALuE (CONT’D)
CONSOLIDATED FINANCIAL STATEMENTS
LAurENTIAN bANK 2010 Annual Report 99
deteRMining faiR valueFor assets and liabilities carried at fair value, the Bank measures such value as follows.
When available, the Bank generally uses quoted market prices to determine fair value and classifies such items in Level 1.
If quoted market prices are not available, fair value is based on internally developed valuation techniques that use, where possible, current market-based or independently sourced market inputs, such as interest rates, exchange rates and option volatility. Instruments valued using internal valuation techniques are classified according to the lowest level input or value driver that is significant to the fair value measurement. Thus, an instrument may be classified in Level 3 even though some significant inputs may be observable.
Where available, the Bank may also make use of quoted prices for recent trading activity in positions with the same or similar characteristics to that being valued. The frequency and size of transactions and the amount of the bid-ask spread are among the factors considered in determining the liquidity of markets and the relevance of observed prices from those markets. If relevant and observable prices are available, those valuations would be classified in Level 2. If prices are not available, other valuation techniques are used and items are classified in Level 3. For these assets and liabilities, the inputs used in determining fair value may require significant management judgment. due to the inherent uncertainty in these estimates, the values may differ significantly from those that would have been used if an active market had existed for the financial instruments.
The following section describes the valuation methodologies used by the Bank to measure certain significant financial instruments at fair value, including an indication of the level in the fair value hierarchy in which each instrument is generally classified. Where appropriate, the description includes details of the valuation models, the key inputs to those models as well as any significant assumptions.
securities purchased under reverse repurchase agreements and obligations related to securities sold under repurchase agreements
Given that quoted prices are not available for such financial instruments, fair value is determined using a discounted cash flow technique. Cash flows are estimated based on the terms of the contract and discounted using appropriate market rates. Since these instruments are recorded at amortized cost, they are not classified in the fair value hierarchy.
securities accountsWhen available, the Bank uses quoted market prices to determine the fair value of securities; such instruments are classified in Level 1 of the fair value hierarchy; for example exchange-traded equity securities. For bonds traded over the counter, the Bank generally determines fair value using internal valuation techniques or prices obtained from independent vendors. Where available, the Bank may also use quoted prices for recent trading activity of assets with similar characteristics to the bond being valued. Securities priced using such methods are generally classified in Level 2. However, less liquid securities may be classified in Level 3 given that the Bank must then determine the parameters related to certain significant value drivers, including liquidity premiums and credit spreads.
loansQuoted market prices in an active market are not available for these financial instruments. As a result, the fair value of loans is estimated by discounting cash flows adjusted to reflect prepayments, if any, at the prevailing market interest rates for new loans with substantially similar terms. For certain variable rate loans subject to frequent rate revisions and loans with indeterminate maturities, the fair value is deemed to represent the carrying amount. Since these instruments are recorded at amortized cost, they are not classified in the fair value hierarchy.
other assetsOther assets consist primarily of cheques and other items in transit, accrued interest receivable and certain retained interests related to securitization transactions. Quoted market prices in an active market are not available for these financial instruments.
The fair value of cheques and other items in transit and accrued interest receivable is determined using the discounted cash flow method. Since these instruments are all recorded at amortized cost, they are not classified in the fair value hierarchy.
The fair value of retained interest related to securitization transactions is calculated based on a discounted net value analysis that factors in the time value of money and anticipated rates of prepayment. The retained interests are classified in Level 3. More details regarding these interests are provided in note 6, including sensitivity analysis.
derivative financial instrumentsThe fair value of over-the-counter derivative financial instruments is calculated using prevailing market prices for instruments with similar characteristics and maturities, based on a discounted net value analysis or an appropriate pricing model that factors in the current and contractual prices of the underlying instruments, the time value of money, the yield curve and volatility factors. These derivatives are classified in Level 2 or Level 3 depending on whether the significant inputs to those pricing models include observable or unobservable inputs. Also, certain exchange-traded derivative financial instruments, whose fair value is based on quoted market prices, are classified in Level 1 of the fair value hierarchy.
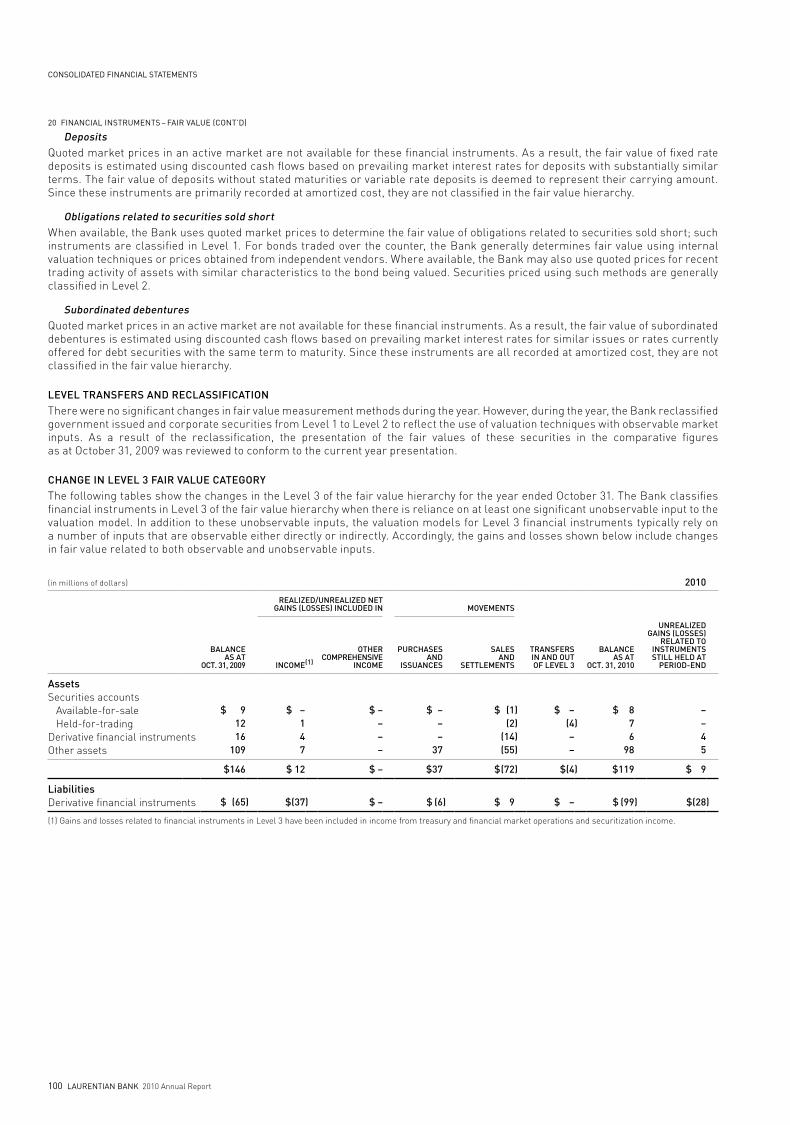
CONSOLIDATED FINANCIAL STATEMENTS
100 LAurENTIAN bANK 2010 Annual Report
depositsQuoted market prices in an active market are not available for these financial instruments. As a result, the fair value of fixed rate deposits is estimated using discounted cash flows based on prevailing market interest rates for deposits with substantially similar terms. The fair value of deposits without stated maturities or variable rate deposits is deemed to represent their carrying amount. Since these instruments are primarily recorded at amortized cost, they are not classified in the fair value hierarchy.
obligations related to securities sold shortWhen available, the Bank uses quoted market prices to determine the fair value of obligations related to securities sold short; such instruments are classified in Level 1. For bonds traded over the counter, the Bank generally determines fair value using internal valuation techniques or prices obtained from independent vendors. Where available, the Bank may also use quoted prices for recent trading activity of assets with similar characteristics to the bond being valued. Securities priced using such methods are generally classified in Level 2.
subordinated debenturesQuoted market prices in an active market are not available for these financial instruments. As a result, the fair value of subordinated debentures is estimated using discounted cash flows based on prevailing market interest rates for similar issues or rates currently offered for debt securities with the same term to maturity. Since these instruments are all recorded at amortized cost, they are not classified in the fair value hierarchy.
level tRansfeRs and ReclassificationThere were no significant changes in fair value measurement methods during the year. However, during the year, the Bank reclassified government issued and corporate securities from Level 1 to Level 2 to reflect the use of valuation techniques with observable market inputs. As a result of the reclassification, the presentation of the fair values of these securities in the comparative figures as at October 31, 2009 was reviewed to conform to the current year presentation.
change in level 3 faiR value categoRYThe following tables show the changes in the Level 3 of the fair value hierarchy for the year ended October 31. The Bank classifies financial instruments in Level 3 of the fair value hierarchy when there is reliance on at least one significant unobservable input to the valuation model. In addition to these unobservable inputs, the valuation models for Level 3 financial instruments typically rely on a number of inputs that are observable either directly or indirectly. Accordingly, the gains and losses shown below include changes in fair value related to both observable and unobservable inputs.
(in millions of dollars) 2010
Realized/unRealized net gains (losses) included in MoveMents
balanceas at
oct. 31, 2009 incoMe (1)
otheRcoMPRehensive
incoMe
PuRchases and
issuances
salesand
settleMents
tRansfeRsin and outof level 3
balanceas at
oct. 31, 2010
unRealizedgains (losses)
Related toinstRuMentsstill held at
PeRiod-end
assetsSecurities accounts Available-for-sale Held-for-tradingderivative financial instrumentsOther assets
$ 9 12 16
109
$ – 1 4 7
$ ––––
$ – – –
37
$ (1(2
(14(55
))))
$ – (4––
) $ 8
7 6
98
– – 4 5
$146 $ 12 $ – $37 $ (72 ) $(4) $119 $ 9
liabilitiesderivative financial instruments $ (65) $(37) $ – $ (6) $ 9 $ – $ (99) $(28)
(1) Gains and losses related to financial instruments in Level 3 have been included in income from treasury and financial market operations and securitization income.
20 FINANCIAL INSTruMENTS – FAIr VALuE (CONT’D)
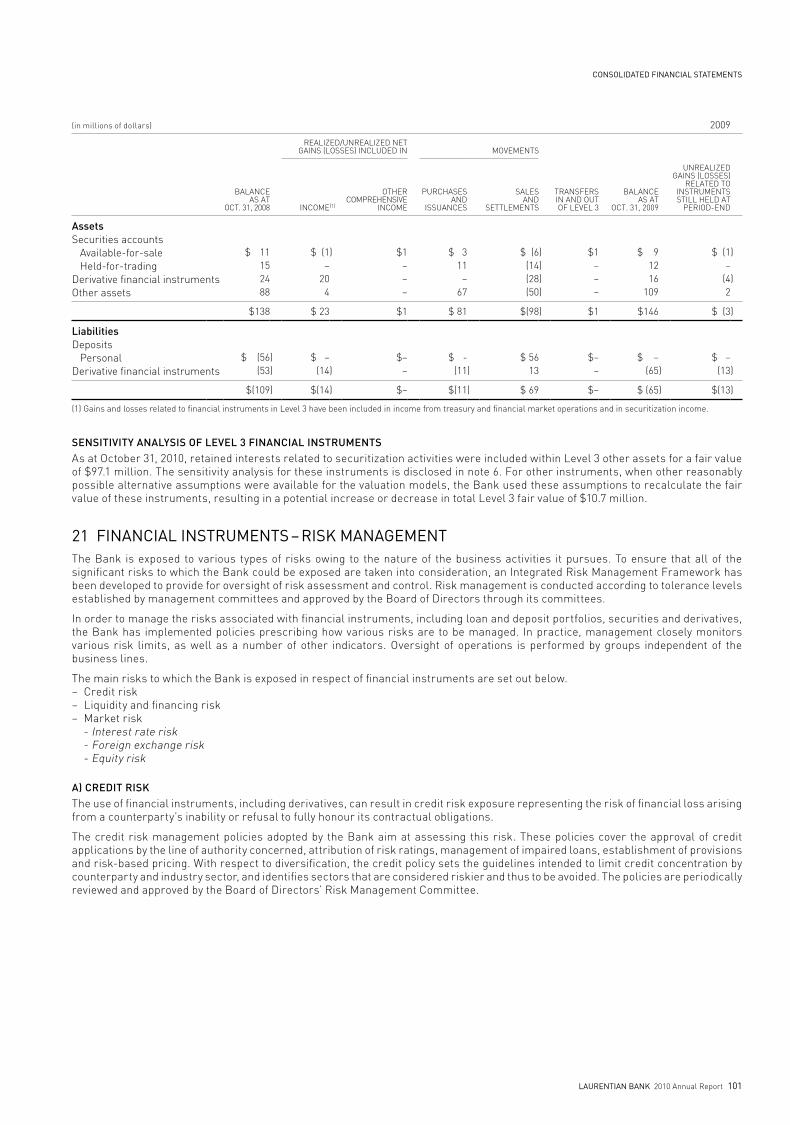
CONSOLIDATED FINANCIAL STATEMENTS
LAurENTIAN bANK 2010 Annual Report 101
(in millions of dollars) 2009
REALIzEd/UNREALIzEd NET GAINS (LOSSES) INCLUdEd IN MOVEMENTS
BALANCEAS AT
OCT. 31, 2008 INCOME (1)
OTHERCOMPREHENSIVE
INCOME
PURCHASES ANd
ISSUANCES
SALESANd
SETTLEMENTS
TRANSFERSIN ANd OUTOF LEVEL 3
BALANCEAS AT
OCT. 31, 2009
UNREALIzEdGAINS (LOSSES)
RELATEd TOINSTRUMENTSSTILL HELd AT
PERIOd-ENd
assetsSecurities accounts Available-for-sale Held-for-tradingderivative financial instrumentsOther assets
$ 11 15 24 88
$ (1–
20 4
) $1 –––
$ 3
11–
67
$ (6
(14(28(50
))))
$1 –––
$ 9
1216
109
$ (1–
(42
)
)
$138 $ 23 $1 $ 81 $(98) $1 $146 $ (3)
liabilitiesdeposits Personalderivative financial instruments
$ (56 (53
))
$ –(14 )
$––
$ -
(11)
$ 56
13$–
–
$ –
(65) $ –
(13)
$(109 ) $(14 ) $– $(11) $ 69 $– $ (65 ) $(13)
(1) Gains and losses related to financial instruments in Level 3 have been included in income from treasury and financial market operations and in securitization income.
sensitivitY analYsis of level 3 financial instRuMentsAs at October 31, 2010, retained interests related to securitization activities were included within Level 3 other assets for a fair value of $97.1 million. The sensitivity analysis for these instruments is disclosed in note 6. For other instruments, when other reasonably possible alternative assumptions were available for the valuation models, the Bank used these assumptions to recalculate the fair value of these instruments, resulting in a potential increase or decrease in total Level 3 fair value of $10.7 million.
21 FINANCIAL INSTruMENTS – rISK MANAGEMENTThe Bank is exposed to various types of risks owing to the nature of the business activities it pursues. To ensure that all of the significant risks to which the Bank could be exposed are taken into consideration, an Integrated Risk Management Framework has been developed to provide for oversight of risk assessment and control. Risk management is conducted according to tolerance levels established by management committees and approved by the Board of directors through its committees.
In order to manage the risks associated with financial instruments, including loan and deposit portfolios, securities and derivatives, the Bank has implemented policies prescribing how various risks are to be managed. In practice, management closely monitors various risk limits, as well as a number of other indicators. Oversight of operations is performed by groups independent of the business lines.
The main risks to which the Bank is exposed in respect of financial instruments are set out below. – Credit risk – Liquidity and financing risk – Market risk - Interest rate risk - Foreign exchange risk - Equity risk
a) cRedit RiskThe use of financial instruments, including derivatives, can result in credit risk exposure representing the risk of financial loss arising from a counterparty’s inability or refusal to fully honour its contractual obligations.
The credit risk management policies adopted by the Bank aim at assessing this risk. These policies cover the approval of credit applications by the line of authority concerned, attribution of risk ratings, management of impaired loans, establishment of provisions and risk-based pricing. With respect to diversification, the credit policy sets the guidelines intended to limit credit concentration by counterparty and industry sector, and identifies sectors that are considered riskier and thus to be avoided. The policies are periodically reviewed and approved by the Board of directors’ Risk Management Committee.
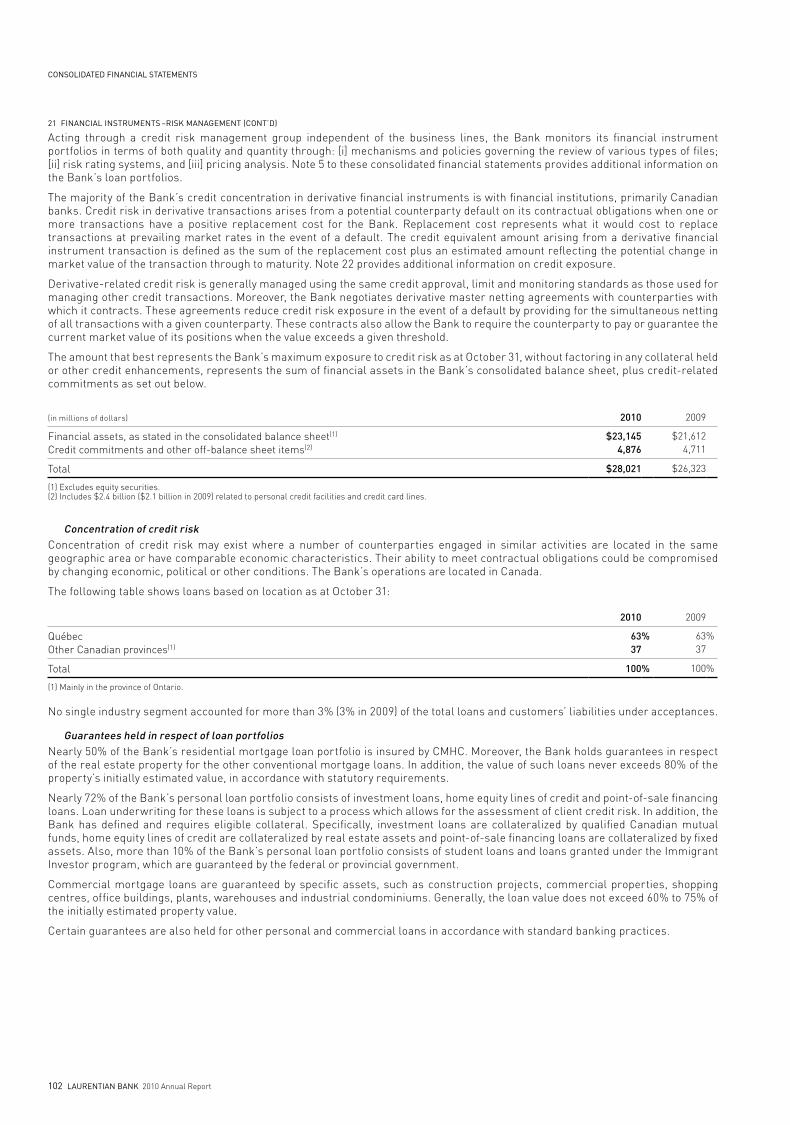
CONSOLIDATED FINANCIAL STATEMENTS
102 LAurENTIAN bANK 2010 Annual Report
Acting through a credit risk management group independent of the business lines, the Bank monitors its financial instrument portfolios in terms of both quality and quantity through: [i] mechanisms and policies governing the review of various types of files; [ii] risk rating systems, and [iii] pricing analysis. Note 5 to these consolidated financial statements provides additional information on the Bank’s loan portfolios.
The majority of the Bank’s credit concentration in derivative financial instruments is with financial institutions, primarily Canadian banks. Credit risk in derivative transactions arises from a potential counterparty default on its contractual obligations when one or more transactions have a positive replacement cost for the Bank. Replacement cost represents what it would cost to replace transactions at prevailing market rates in the event of a default. The credit equivalent amount arising from a derivative financial instrument transaction is defined as the sum of the replacement cost plus an estimated amount reflecting the potential change in market value of the transaction through to maturity. Note 22 provides additional information on credit exposure.
derivative-related credit risk is generally managed using the same credit approval, limit and monitoring standards as those used for managing other credit transactions. Moreover, the Bank negotiates derivative master netting agreements with counterparties with which it contracts. These agreements reduce credit risk exposure in the event of a default by providing for the simultaneous netting of all transactions with a given counterparty. These contracts also allow the Bank to require the counterparty to pay or guarantee the current market value of its positions when the value exceeds a given threshold.
The amount that best represents the Bank’s maximum exposure to credit risk as at October 31, without factoring in any collateral held or other credit enhancements, represents the sum of financial assets in the Bank’s consolidated balance sheet, plus credit-related commitments as set out below.
(in millions of dollars) 2010 2009
Financial assets, as stated in the consolidated balance sheet(1)
Credit commitments and other off-balance sheet items(2)$23,145
4,876 $21,612
4,711
Total $28,021 $26,323
(1) Excludes equity securities.(2) Includes $2.4 billion ($2.1 billion in 2009) related to personal credit facilities and credit card lines.
concentration of credit riskConcentration of credit risk may exist where a number of counterparties engaged in similar activities are located in the same geographic area or have comparable economic characteristics. Their ability to meet contractual obligations could be compromised by changing economic, political or other conditions. The Bank’s operations are located in Canada.
The following table shows loans based on location as at October 31:
2010 2009
QuébecOther Canadian provinces(1)
6337
% 6337
%
Total 100% 100%
(1) Mainly in the province of Ontario.
No single industry segment accounted for more than 3% (3% in 2009) of the total loans and customers’ liabilities under acceptances.
guarantees held in respect of loan portfoliosNearly 50% of the Bank’s residential mortgage loan portfolio is insured by CMHC. Moreover, the Bank holds guarantees in respect of the real estate property for the other conventional mortgage loans. In addition, the value of such loans never exceeds 80% of the property’s initially estimated value, in accordance with statutory requirements.
Nearly 72% of the Bank’s personal loan portfolio consists of investment loans, home equity lines of credit and point-of-sale financing loans. Loan underwriting for these loans is subject to a process which allows for the assessment of client credit risk. In addition, the Bank has defined and requires eligible collateral. Specifically, investment loans are collateralized by qualified Canadian mutual funds, home equity lines of credit are collateralized by real estate assets and point-of-sale financing loans are collateralized by fixed assets. Also, more than 10% of the Bank’s personal loan portfolio consists of student loans and loans granted under the Immigrant Investor program, which are guaranteed by the federal or provincial government.
Commercial mortgage loans are guaranteed by specific assets, such as construction projects, commercial properties, shopping centres, office buildings, plants, warehouses and industrial condominiums. Generally, the loan value does not exceed 60% to 75% of the initially estimated property value.
Certain guarantees are also held for other personal and commercial loans in accordance with standard banking practices.
21 FINANCIAL INSTruMENTS –rISK MANAGEMENT (CONT’D)
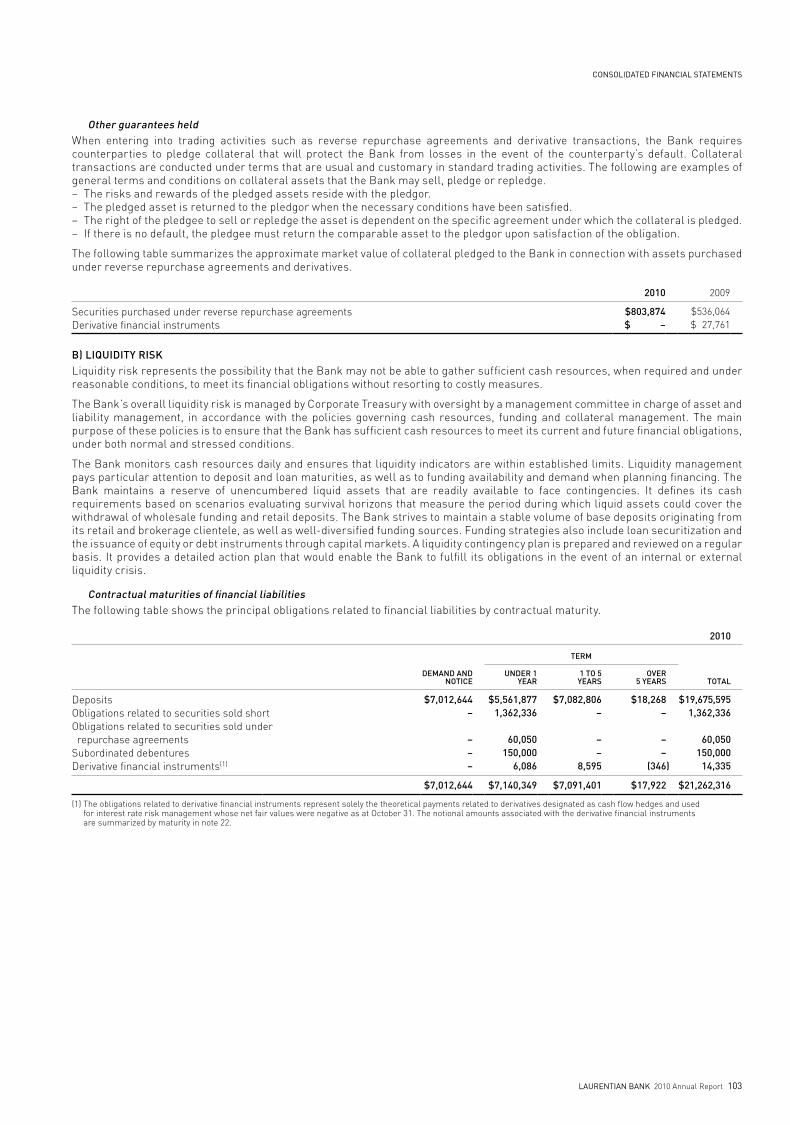
CONSOLIDATED FINANCIAL STATEMENTS
LAurENTIAN bANK 2010 Annual Report 103
other guarantees heldWhen entering into trading activities such as reverse repurchase agreements and derivative transactions, the Bank requires counterparties to pledge collateral that will protect the Bank from losses in the event of the counterparty’s default. Collateral transactions are conducted under terms that are usual and customary in standard trading activities. The following are examples of general terms and conditions on collateral assets that the Bank may sell, pledge or repledge.– The risks and rewards of the pledged assets reside with the pledgor.– The pledged asset is returned to the pledgor when the necessary conditions have been satisfied.– The right of the pledgee to sell or repledge the asset is dependent on the specific agreement under which the collateral is pledged.– If there is no default, the pledgee must return the comparable asset to the pledgor upon satisfaction of the obligation.
The following table summarizes the approximate market value of collateral pledged to the Bank in connection with assets purchased under reverse repurchase agreements and derivatives.
2010 2009
Securities purchased under reverse repurchase agreementsderivative financial instruments
$803,874 $ –
$536,064 $ 27,761
b) liQuiditY RiskLiquidity risk represents the possibility that the Bank may not be able to gather sufficient cash resources, when required and under reasonable conditions, to meet its financial obligations without resorting to costly measures.
The Bank’s overall liquidity risk is managed by Corporate Treasury with oversight by a management committee in charge of asset and liability management, in accordance with the policies governing cash resources, funding and collateral management. The main purpose of these policies is to ensure that the Bank has sufficient cash resources to meet its current and future financial obligations, under both normal and stressed conditions.
The Bank monitors cash resources daily and ensures that liquidity indicators are within established limits. Liquidity management pays particular attention to deposit and loan maturities, as well as to funding availability and demand when planning financing. The Bank maintains a reserve of unencumbered liquid assets that are readily available to face contingencies. It defines its cash requirements based on scenarios evaluating survival horizons that measure the period during which liquid assets could cover the withdrawal of wholesale funding and retail deposits. The Bank strives to maintain a stable volume of base deposits originating from its retail and brokerage clientele, as well as well-diversified funding sources. Funding strategies also include loan securitization and the issuance of equity or debt instruments through capital markets. A liquidity contingency plan is prepared and reviewed on a regular basis. It provides a detailed action plan that would enable the Bank to fulfill its obligations in the event of an internal or external liquidity crisis.
contractual maturities of financial liabilitiesThe following table shows the principal obligations related to financial liabilities by contractual maturity.
2010
teRM
deMand andnotice
undeR 1 YeaR
1 to 5 YeaRs
oveR 5 YeaRs total
depositsObligations related to securities sold shortObligations related to securities sold under repurchase agreementsSubordinated debenturesderivative financial instruments(1)
$7,012,644 –
– – –
$5,561,877 1,362,336
60,050 150,000
6,086
$7,082,806 –
– –
8,595
$18,268 –
– –
(346)
$19,675,595 1,362,336
60,050 150,000
14,335
$7,012,644 $7,140,349 $7,091,401 $17,922 $21,262,316
(1) The obligations related to derivative financial instruments represent solely the theoretical payments related to derivatives designated as cash flow hedges and used for interest rate risk management whose net fair values were negative as at October 31. The notional amounts associated with the derivative financial instruments are summarized by maturity in note 22.
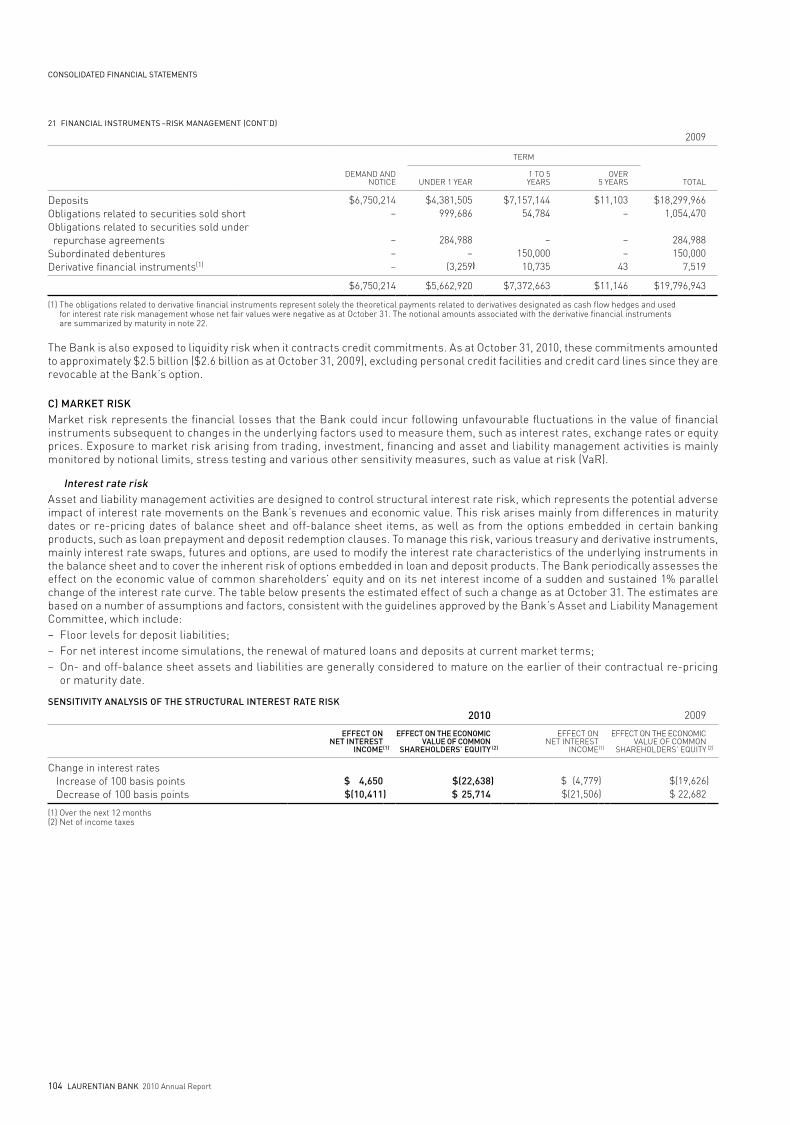
CONSOLIDATED FINANCIAL STATEMENTS
104 LAurENTIAN bANK 2010 Annual Report
2009
TERM
dEMANd ANdNOTICE UNdER 1 YEAR
1 TO 5 YEARS
OVER 5 YEARS TOTAL
depositsObligations related to securities sold shortObligations related to securities sold under repurchase agreementsSubordinated debenturesderivative financial instruments(1)
$6,750,214 –
–––
$4,381,505 999,686
284,988 –
(3,259
)
$7,157,144 54,784
– 150,000
10,735
$11,103 –
––
43
$18,299,966 1,054,470
284,988 150,000
7,519
$6,750,214 $5,662,920 $7,372,663 $11,146 $19,796,943
(1) The obligations related to derivative financial instruments represent solely the theoretical payments related to derivatives designated as cash flow hedges and used for interest rate risk management whose net fair values were negative as at October 31. The notional amounts associated with the derivative financial instruments are summarized by maturity in note 22.
The Bank is also exposed to liquidity risk when it contracts credit commitments. As at October 31, 2010, these commitments amounted to approximately $2.5 billion ($2.6 billion as at October 31, 2009), excluding personal credit facilities and credit card lines since they are revocable at the Bank’s option.
c) MaRket RiskMarket risk represents the financial losses that the Bank could incur following unfavourable fluctuations in the value of financial instruments subsequent to changes in the underlying factors used to measure them, such as interest rates, exchange rates or equity prices. Exposure to market risk arising from trading, investment, financing and asset and liability management activities is mainly monitored by notional limits, stress testing and various other sensitivity measures, such as value at risk (VaR).
interest rate riskAsset and liability management activities are designed to control structural interest rate risk, which represents the potential adverse impact of interest rate movements on the Bank’s revenues and economic value. This risk arises mainly from differences in maturity dates or re-pricing dates of balance sheet and off-balance sheet items, as well as from the options embedded in certain banking products, such as loan prepayment and deposit redemption clauses. To manage this risk, various treasury and derivative instruments, mainly interest rate swaps, futures and options, are used to modify the interest rate characteristics of the underlying instruments in the balance sheet and to cover the inherent risk of options embedded in loan and deposit products. The Bank periodically assesses the effect on the economic value of common shareholders’ equity and on its net interest income of a sudden and sustained 1% parallel change of the interest rate curve. The table below presents the estimated effect of such a change as at October 31. The estimates are based on a number of assumptions and factors, consistent with the guidelines approved by the Bank’s Asset and Liability Management Committee, which include:– Floor levels for deposit liabilities;– For net interest income simulations, the renewal of matured loans and deposits at current market terms;– On- and off-balance sheet assets and liabilities are generally considered to mature on the earlier of their contractual re-pricing
or maturity date.
sensitivitY analYsis of the stRuctuRal inteRest Rate Risk
2010 2009
effect onnet inteRest
incoMe(1)
effect on the econoMicvalue of coMMon
shaReholdeRs’ eQuitY (2)
EFFECT ONNET INTEREST
INCOME(1)
EFFECT ON THE ECONOMIC VALUE OF COMMON
SHAREHOLdERS’ EQUITY (2)
Change in interest rates Increase of 100 basis points decrease of 100 basis points
$ 4,650 $(10,411)
$(22,638 $ 25,714
)
$ (4,779 $(21,506
))
$(19,626 $ 22,682
)
(1) Over the next 12 months(2) Net of income taxes
21 FINANCIAL INSTruMENTS –rISK MANAGEMENT (CONT’D)
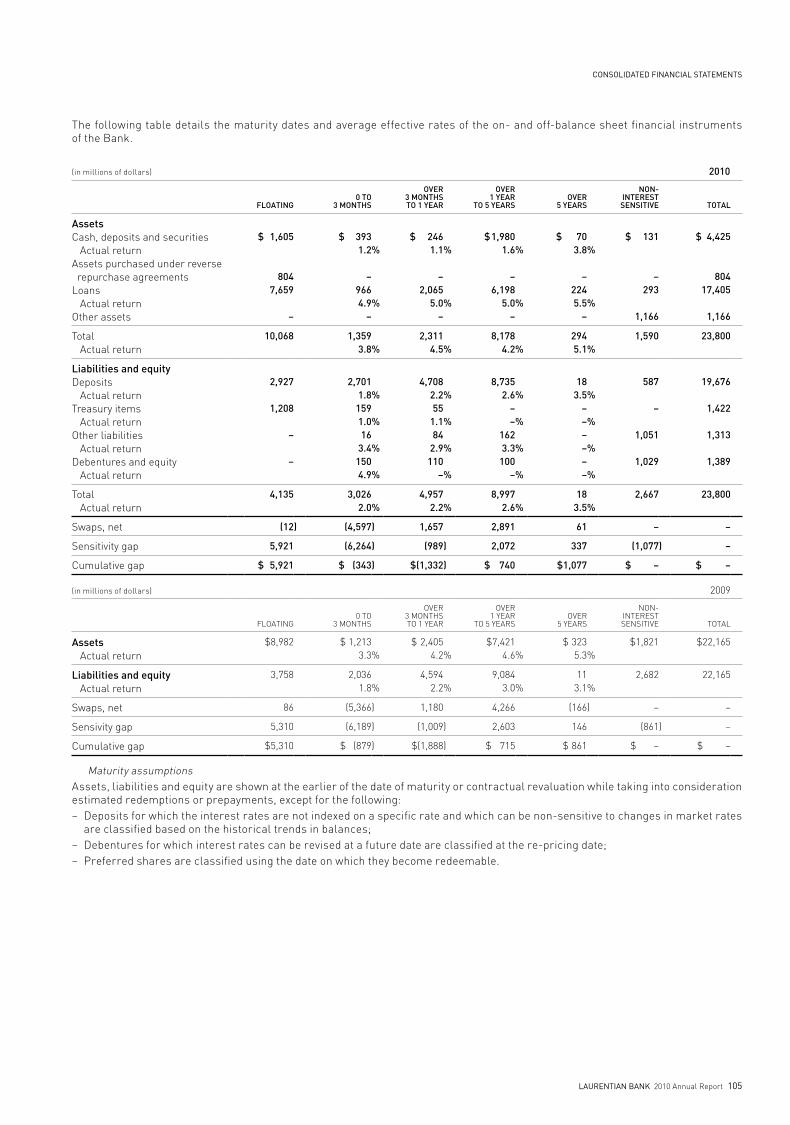
CONSOLIDATED FINANCIAL STATEMENTS
LAurENTIAN bANK 2010 Annual Report 105
The following table details the maturity dates and average effective rates of the on- and off-balance sheet financial instruments of the Bank.
(in millions of dollars) 2010
floating 0 to
3 Months
oveR3 Monthsto 1 YeaR
oveR1 YeaR
to 5 YeaRsoveR
5 YeaRs
non-inteRestsensitive total
assetsCash, deposits and securities Actual returnAssets purchased under reverse repurchase agreementsLoans Actual returnOther assets
$ 1,605
804 7,659
–
$ 393 1.2
– 966 4.9
–
%
%
$ 246 1.1
– 2,065
5.0 –
%
%
$ 1,980 1.6
– 6,198
5.0 –
%
%
$ 70 3.8
– 224 5.5
–
%
%
$ 131
– 293
1,166
$ 4,425
804 17,405
1,166
Total Actual return
10,068 1,359 3.8 %
2,311 4.5 %
8,178 4.2 %
294 5.1 %
1,590 23,800
liabilities and equitydeposits Actual returnTreasury items Actual returnOther liabilities Actual returndebentures and equity Actual return
2,927
1,208
–
–
2,701 1.8
159 1.0 16
3.4 150 4.9
%
%
%
%
4,708 2.2 55 1.1 84
2.9 110
–
%
%
%
%
8,735 2.6
– –
162 3.3
100 –
%
%
%
%
18 3.5
– – – – – –
%
%
%
%
587
–
1,051
1,029
19,676
1,422
1,313
1,389
Total Actual return
4,135 3,026 2.0 %
4,957 2.2 %
8,997 2.6 %
18 3.5 %
2,667 23,800
Swaps, net (12) (4,597) 1,657 2,891 61 – –
Sensitivity gap 5,921 (6,264) (989) 2,072 337 (1,077) –
Cumulative gap $ 5,921 $ (343) $(1,332) $ 740 $1,077 $ – $ –
(in millions of dollars) 2009
FLOATING 0 TO
3 MONTHS
OVER3 MONTHSTO 1 YEAR
OVER1 YEAR
TO 5 YEARSOVER
5 YEARS
NON-INTERESTSENSITIVE TOTAL
assets Actual return
$8,982 $ 1,213 3.3 %
$ 2,405 4.2 %
$7,421 4.6 %
$ 323 5.3 %
$1,821 $22,165
liabilities and equity Actual return
3,758 2,036 1.8%
4,594 2.2%
9,084 3.0%
11 3.1%
2,682 22,165
Swaps, net 86 (5,366) 1,180 4,266 (166) – –
Sensivity gap 5,310 (6,189) (1,009) 2,603 146 (861) –
Cumulative gap $5,310 $ (879) $(1,888) $ 715 $ 861 $ – $ –
Maturity assumptions Assets, liabilities and equity are shown at the earlier of the date of maturity or contractual revaluation while taking into consideration estimated redemptions or prepayments, except for the following:– deposits for which the interest rates are not indexed on a specific rate and which can be non-sensitive to changes in market rates
are classified based on the historical trends in balances;– debentures for which interest rates can be revised at a future date are classified at the re-pricing date; – Preferred shares are classified using the date on which they become redeemable.
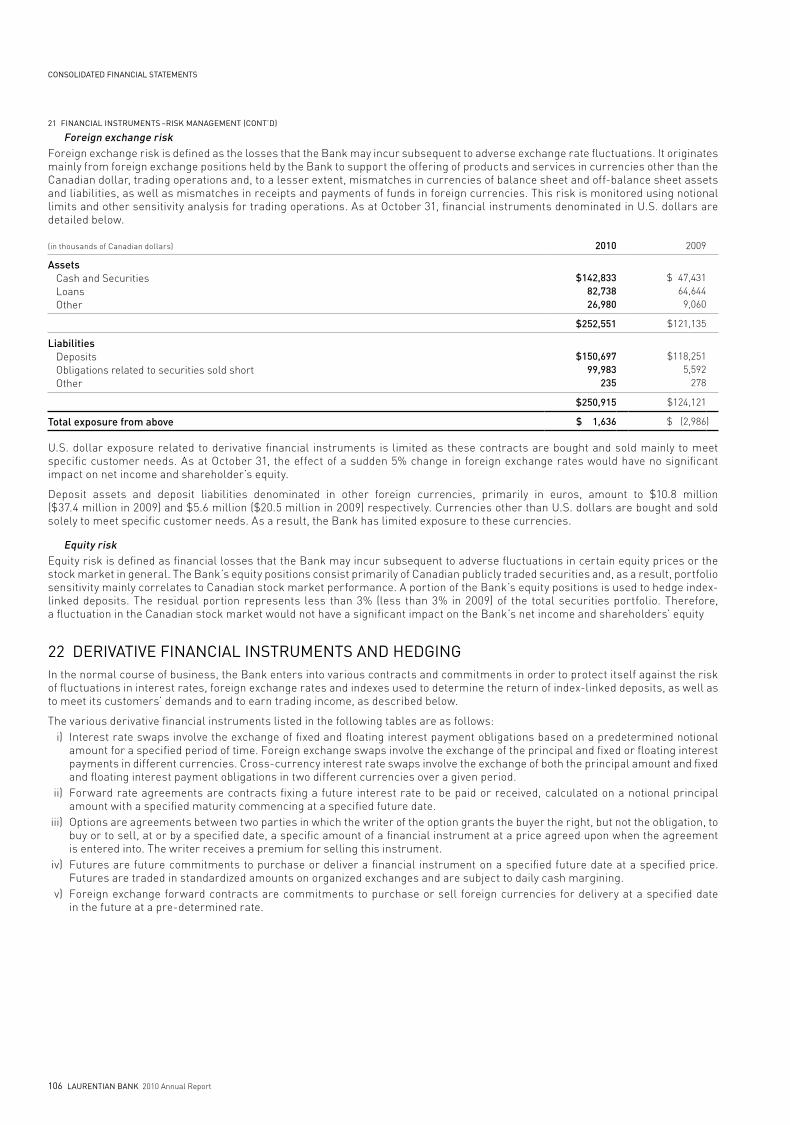
CONSOLIDATED FINANCIAL STATEMENTS
106 LAurENTIAN bANK 2010 Annual Report
foreign exchange risk Foreign exchange risk is defined as the losses that the Bank may incur subsequent to adverse exchange rate fluctuations. It originates mainly from foreign exchange positions held by the Bank to support the offering of products and services in currencies other than the Canadian dollar, trading operations and, to a lesser extent, mismatches in currencies of balance sheet and off-balance sheet assets and liabilities, as well as mismatches in receipts and payments of funds in foreign currencies. This risk is monitored using notional limits and other sensitivity analysis for trading operations. As at October 31, financial instruments denominated in U.S. dollars are detailed below.
(in thousands of Canadian dollars) 2010 2009
assets Cash and Securities Loans Other
$142,833 82,738 26,980
$ 47,431 64,644
9,060
$252,551 $121,135
liabilities deposits Obligations related to securities sold short Other
$150,697 99,983
235
$118,251 5,592
278
$250,915 $124,121
total exposure from above $ 1,636 $ (2,986)
U.S. dollar exposure related to derivative financial instruments is limited as these contracts are bought and sold mainly to meet specific customer needs. As at October 31, the effect of a sudden 5% change in foreign exchange rates would have no significant impact on net income and shareholder’s equity.
deposit assets and deposit liabilities denominated in other foreign currencies, primarily in euros, amount to $10.8 million ($37.4 million in 2009) and $5.6 million ($20.5 million in 2009) respectively. Currencies other than U.S. dollars are bought and sold solely to meet specific customer needs. As a result, the Bank has limited exposure to these currencies.
equity riskEquity risk is defined as financial losses that the Bank may incur subsequent to adverse fluctuations in certain equity prices or the stock market in general. The Bank’s equity positions consist primarily of Canadian publicly traded securities and, as a result, portfolio sensitivity mainly correlates to Canadian stock market performance. A portion of the Bank’s equity positions is used to hedge index-linked deposits. The residual portion represents less than 3% (less than 3% in 2009) of the total securities portfolio. Therefore, a fluctuation in the Canadian stock market would not have a significant impact on the Bank’s net income and shareholders’ equity
22 DErIVATIVE FINANCIAL INSTruMENTS AND hEDGINGIn the normal course of business, the Bank enters into various contracts and commitments in order to protect itself against the risk of fluctuations in interest rates, foreign exchange rates and indexes used to determine the return of index-linked deposits, as well as to meet its customers’ demands and to earn trading income, as described below.
The various derivative financial instruments listed in the following tables are as follows: i) Interest rate swaps involve the exchange of fixed and floating interest payment obligations based on a predetermined notional
amount for a specified period of time. Foreign exchange swaps involve the exchange of the principal and fixed or floating interest payments in different currencies. Cross-currency interest rate swaps involve the exchange of both the principal amount and fixed and floating interest payment obligations in two different currencies over a given period.
ii) Forward rate agreements are contracts fixing a future interest rate to be paid or received, calculated on a notional principal amount with a specified maturity commencing at a specified future date.
iii) Options are agreements between two parties in which the writer of the option grants the buyer the right, but not the obligation, to buy or to sell, at or by a specified date, a specific amount of a financial instrument at a price agreed upon when the agreement is entered into. The writer receives a premium for selling this instrument.
iv) Futures are future commitments to purchase or deliver a financial instrument on a specified future date at a specified price. Futures are traded in standardized amounts on organized exchanges and are subject to daily cash margining.
v) Foreign exchange forward contracts are commitments to purchase or sell foreign currencies for delivery at a specified date in the future at a pre-determined rate.
21 FINANCIAL INSTruMENTS –rISK MANAGEMENT (CONT’D)
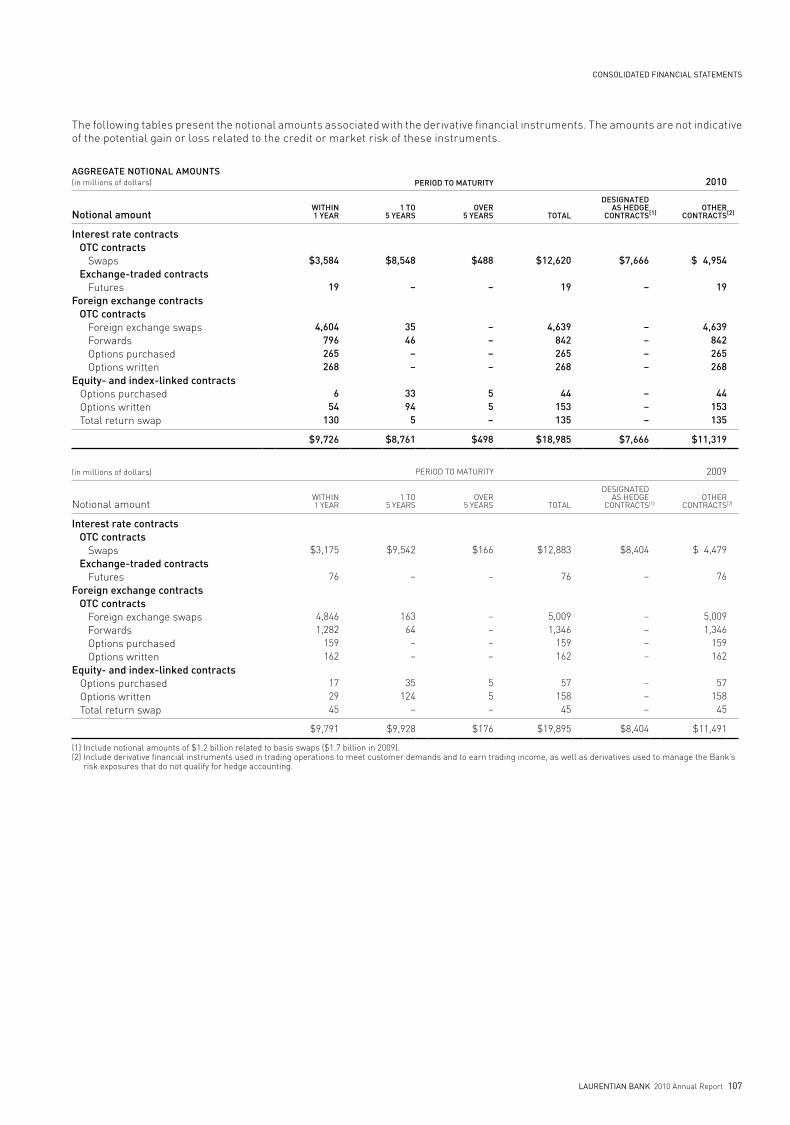
CONSOLIDATED FINANCIAL STATEMENTS
LAurENTIAN bANK 2010 Annual Report 107
The following tables present the notional amounts associated with the derivative financial instruments. The amounts are not indicative of the potential gain or loss related to the credit or market risk of these instruments.
aggRegate notional aMounts(in millions of dollars) 2010
notional amountwithin1 YeaR
1 to5 YeaRs
oveR5 YeaRs total
designated as hedge
contRacts(1)otheR
contRacts(2)
interest rate contracts otc contracts Swaps exchange-traded contracts Futuresforeign exchange contracts otc contracts Foreign exchange swaps Forwards Options purchased Options writtenequity- and index-linked contracts Options purchased Options written Total return swap
$3,584
19
4,604 796 265 268
6 54
130
$8,548
–
35 46 – –
33 94 5
$488
–
– – – –
5 5 –
$12,620
19
4,639 842 265 268
44 153 135
$7,666
–
– – – –
– – –
$ 4,954
19
4,639 842 265 268
44 153 135
$9,726 $8,761 $498 $18,985 $7,666 $11,319
(in millions of dollars) 2009
Notional amountWITHIN1 YEAR
1 TO5 YEARS
OVER5 YEARS TOTAL
dESIGNATEd AS HEdGE
CONTRACTS(1)OTHER
CONTRACTS(2)
interest rate contracts otc contracts Swaps exchange-traded contracts Futuresforeign exchange contracts otc contracts Foreign exchange swaps Forwards Options purchased Options writtenequity- and index-linked contracts Options purchased Options written Total return swap
$3,175
76
4,846 1,282
159 162
17 29 45
$9,542
–
163 64
––
35 124
–
$166
–
––––
5 5 –
$12,883
76
5,009 1,346
159 162
57 158
45
$8,404
–
––––
–––
$ 4,479
76
5,009 1,346
159 162
57 158
45
$9,791 $9,928 $176 $19,895 $8,404 $11,491
(1) Include notional amounts of $1.2 billion related to basis swaps ($1.7 billion in 2009).(2) Include derivative financial instruments used in trading operations to meet customer demands and to earn trading income, as well as derivatives used to manage the Bank’s
risk exposures that do not qualify for hedge accounting.
PeRiod to MatuRitY
PERIOd TO MATURITY
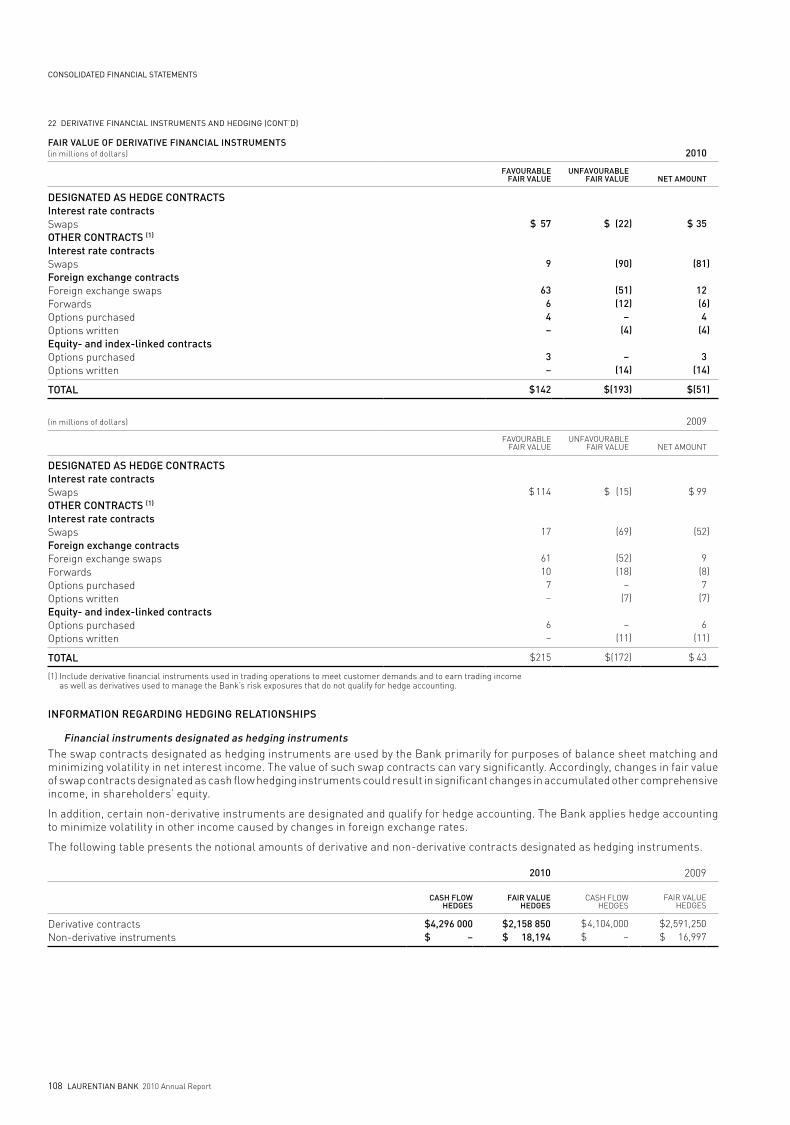
CONSOLIDATED FINANCIAL STATEMENTS
108 LAurENTIAN bANK 2010 Annual Report
faiR value of deRivative financial instRuMents(in millions of dollars) 2010
favouRablefaiR value
unfavouRablefaiR value net aMount
designated as hedge contRactsinterest rate contractsSwapsotheR contRacts (1)
interest rate contractsSwapsforeign exchange contractsForeign exchange swapsForwardsOptions purchasedOptions writtenequity- and index-linked contractsOptions purchasedOptions written
$ 57
9
63 6 4 –
3 –
$ (22
(90
(51(12
– (4
– (14
)
)
))
)
)
$ 35
(81
12 (64
(4
3 (14
)
)
)
)
total $142 $(193) $(51)
(in millions of dollars) 2009
FAVOURABLEFAIR VALUE
UNFAVOURABLEFAIR VALUE NET AMOUNT
designated as hedge contRactsinterest rate contractsSwapsotheR contRacts (1)
interest rate contractsSwapsforeign exchange contractsForeign exchange swapsForwardsOptions purchasedOptions writtenequity- and index-linked contractsOptions purchasedOptions written
$ 114
17
61 10
7 –
6 –
$ (15
(69
(52(18
–(7
– (11
)
)
))
)
)
$ 99
(52
9 (87
(7
6 (11
)
)
)
)
total $215 $(172) $ 43
(1) Include derivative financial instruments used in trading operations to meet customer demands and to earn trading income as well as derivatives used to manage the Bank’s risk exposures that do not qualify for hedge accounting.
infoRMation RegaRding hedging RelationshiPs
financial instruments designated as hedging instrumentsThe swap contracts designated as hedging instruments are used by the Bank primarily for purposes of balance sheet matching and minimizing volatility in net interest income. The value of such swap contracts can vary significantly. Accordingly, changes in fair value of swap contracts designated as cash flow hedging instruments could result in significant changes in accumulated other comprehensive income, in shareholders’ equity.
In addition, certain non-derivative instruments are designated and qualify for hedge accounting. The Bank applies hedge accounting to minimize volatility in other income caused by changes in foreign exchange rates.
The following table presents the notional amounts of derivative and non-derivative contracts designated as hedging instruments.
2010 2009
cash flow hedges
faiR value hedges
CASH FLOW HEdGES
FAIR VALUE HEdGES
derivative contractsNon-derivative instruments
$4,296 000 $ –
$2,158 850 $ 18,194
$ 4,104,000 $ –
$2,591,250 $ 16,997
22 DErIVATIVE FINANCIAL INSTruMENTS AND hEDGING (CONT’D)
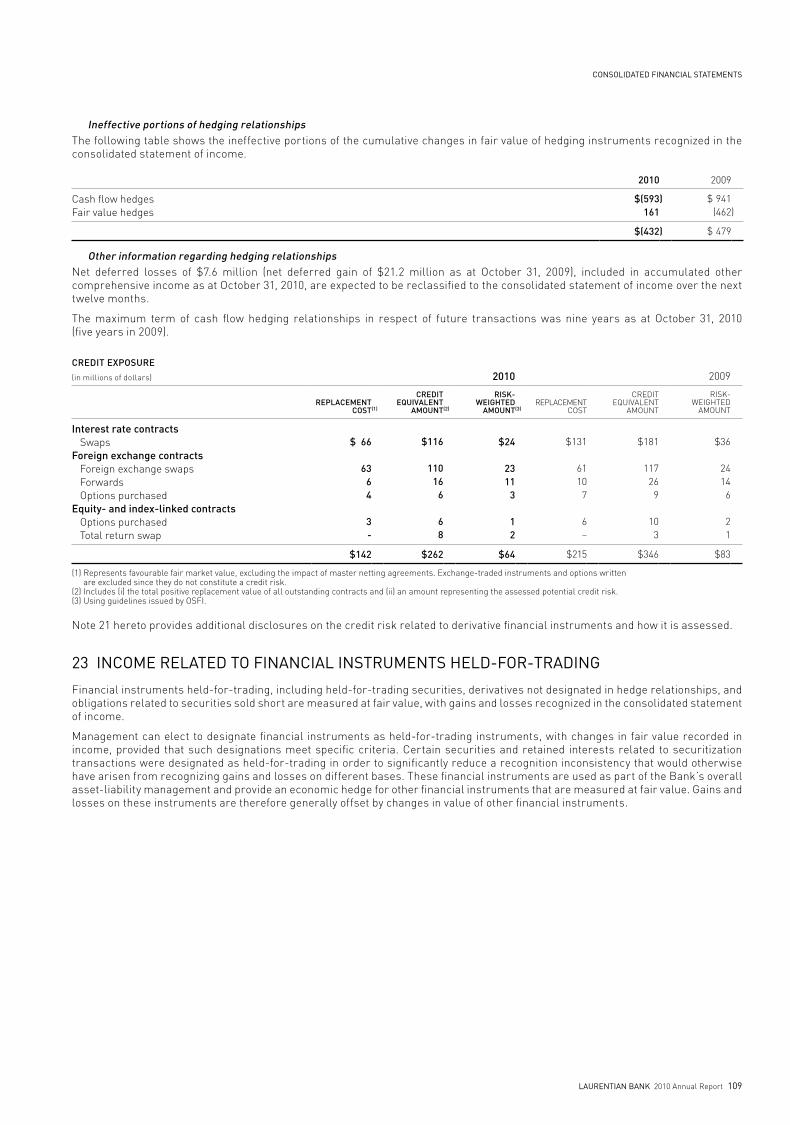
CONSOLIDATED FINANCIAL STATEMENTS
LAurENTIAN bANK 2010 Annual Report 109
ineffective portions of hedging relationshipsThe following table shows the ineffective portions of the cumulative changes in fair value of hedging instruments recognized in the consolidated statement of income.
2010 2009
Cash flow hedgesFair value hedges
$(593161
) $ 941 (462)
$(432) $ 479
other information regarding hedging relationshipsNet deferred losses of $7.6 million (net deferred gain of $21.2 million as at October 31, 2009), included in accumulated other comprehensive income as at October 31, 2010, are expected to be reclassified to the consolidated statement of income over the next twelve months.
The maximum term of cash flow hedging relationships in respect of future transactions was nine years as at October 31, 2010 (five years in 2009).
cRedit exPosuRe
(in millions of dollars) 2010 2009
RePlaceMent cost(1)
cRediteQuivalent
aMount(2)
Risk-weighted
aMount(3)REPLACEMENT
COST
CREdITEQUIVALENT
AMOUNT
RISK-WEIGHTEd
AMOUNT
interest rate contracts Swapsforeign exchange contracts Foreign exchange swaps Forwards Options purchasedequity- and index-linked contracts Options purchased Total return swap
$ 66
63 6 4
3 -
$116
110 16
6
6 8
$24
23 11
3
1 2
$131
6110
7
6–
$181
11726
9
103
$36
2414
6
21
$142 $262 $64 $215 $346 $83
(1) Represents favourable fair market value, excluding the impact of master netting agreements. Exchange-traded instruments and options written are excluded since they do not constitute a credit risk.
(2) Includes (i) the total positive replacement value of all outstanding contracts and (ii) an amount representing the assessed potential credit risk.(3) Using guidelines issued by OSFI.
Note 21 hereto provides additional disclosures on the credit risk related to derivative financial instruments and how it is assessed.
23 INCOME rELATED TO FINANCIAL INSTruMENTS hELD-FOr-TrADING
Financial instruments held-for-trading, including held-for-trading securities, derivatives not designated in hedge relationships, and obligations related to securities sold short are measured at fair value, with gains and losses recognized in the consolidated statement of income.
Management can elect to designate financial instruments as held-for-trading instruments, with changes in fair value recorded in income, provided that such designations meet specific criteria. Certain securities and retained interests related to securitization transactions were designated as held-for-trading in order to significantly reduce a recognition inconsistency that would otherwise have arisen from recognizing gains and losses on different bases. These financial instruments are used as part of the Bank’s overall asset-liability management and provide an economic hedge for other financial instruments that are measured at fair value. Gains and losses on these instruments are therefore generally offset by changes in value of other financial instruments.
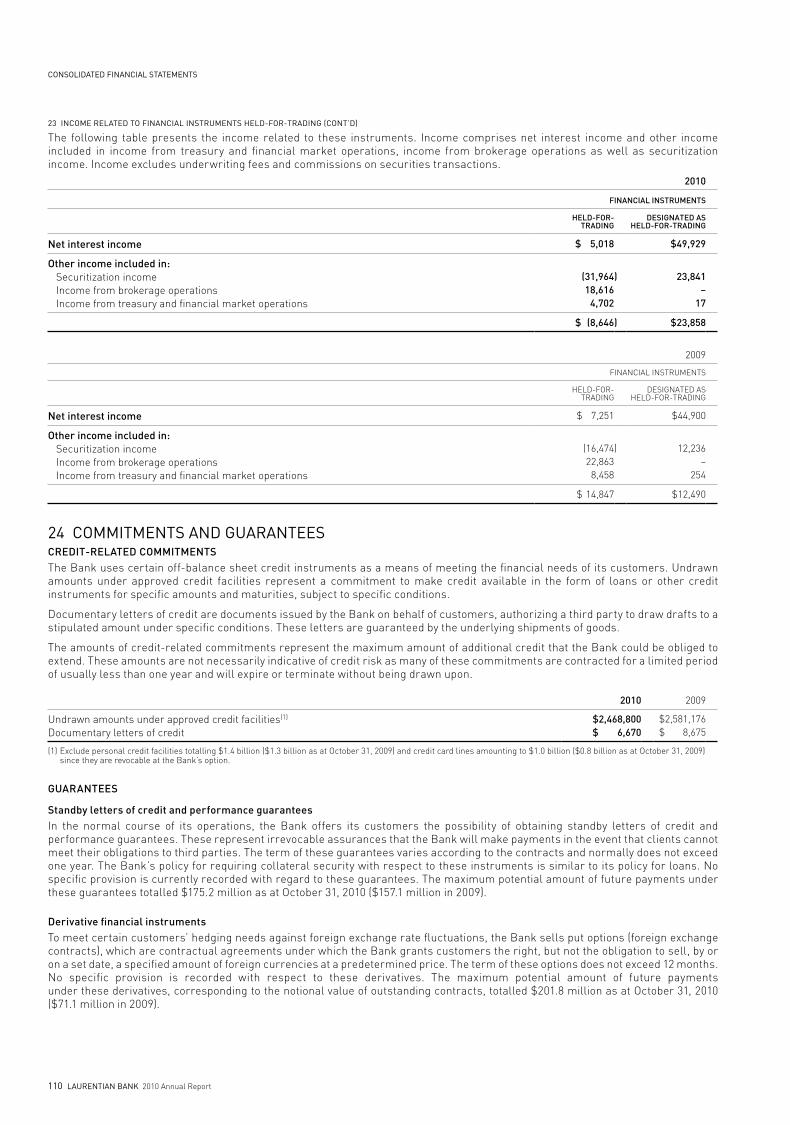
CONSOLIDATED FINANCIAL STATEMENTS
110 LAurENTIAN bANK 2010 Annual Report
The following table presents the income related to these instruments. Income comprises net interest income and other income included in income from treasury and financial market operations, income from brokerage operations as well as securitization income. Income excludes underwriting fees and commissions on securities transactions.
2010
financial instRuMents
held-foR- tRading
designated asheld-foR-tRading
net interest income $ 5,018 $49,929
other income included in: Securitization income Income from brokerage operations Income from treasury and financial market operations
(31,96418,616
4,702
) 23,841 –
17
$ (8,646) $23,858
2009
FINANCIAL INSTRUMENTS
HELd-FOR- TRAdING
dESIGNATEd ASHELd-FOR-TRAdING
net interest income $ 7,251 $44,900
other income included in: Securitization income Income from brokerage operations Income from treasury and financial market operations
(16,47422,863
8,458
) 12,236 –
254
$ 14,847 $12,490
24 COMMITMENTS AND GuArANTEES cRedit-Related coMMitMentsThe Bank uses certain off-balance sheet credit instruments as a means of meeting the financial needs of its customers. Undrawn amounts under approved credit facilities represent a commitment to make credit available in the form of loans or other credit instruments for specific amounts and maturities, subject to specific conditions.
documentary letters of credit are documents issued by the Bank on behalf of customers, authorizing a third party to draw drafts to a stipulated amount under specific conditions. These letters are guaranteed by the underlying shipments of goods.
The amounts of credit-related commitments represent the maximum amount of additional credit that the Bank could be obliged to extend. These amounts are not necessarily indicative of credit risk as many of these commitments are contracted for a limited period of usually less than one year and will expire or terminate without being drawn upon.
2010 2009
Undrawn amounts under approved credit facilities(1)
documentary letters of credit$2,468,800
$ 6,670$2,581,176
$ 8,675
(1) Exclude personal credit facilities totalling $1.4 billion ($1.3 billion as at October 31, 2009) and credit card lines amounting to $1.0 billion ($0.8 billion as at October 31, 2009) since they are revocable at the Bank’s option.
guaRantees
standby letters of credit and performance guaranteesIn the normal course of its operations, the Bank offers its customers the possibility of obtaining standby letters of credit and performance guarantees. These represent irrevocable assurances that the Bank will make payments in the event that clients cannot meet their obligations to third parties. The term of these guarantees varies according to the contracts and normally does not exceed one year. The Bank’s policy for requiring collateral security with respect to these instruments is similar to its policy for loans. No specific provision is currently recorded with regard to these guarantees. The maximum potential amount of future payments under these guarantees totalled $175.2 million as at October 31, 2010 ($157.1 million in 2009).
derivative financial instrumentsTo meet certain customers’ hedging needs against foreign exchange rate fluctuations, the Bank sells put options (foreign exchange contracts), which are contractual agreements under which the Bank grants customers the right, but not the obligation to sell, by or on a set date, a specified amount of foreign currencies at a predetermined price. The term of these options does not exceed 12 months. No specific provision is recorded with respect to these derivatives. The maximum potential amount of future payments under these derivatives, corresponding to the notional value of outstanding contracts, totalled $201.8 million as at October 31, 2010 ($71.1 million in 2009).
23 INCOME rELATED TO FINANCIAL INSTruMENTS hELD-FOr-TrADING (CONT’D)
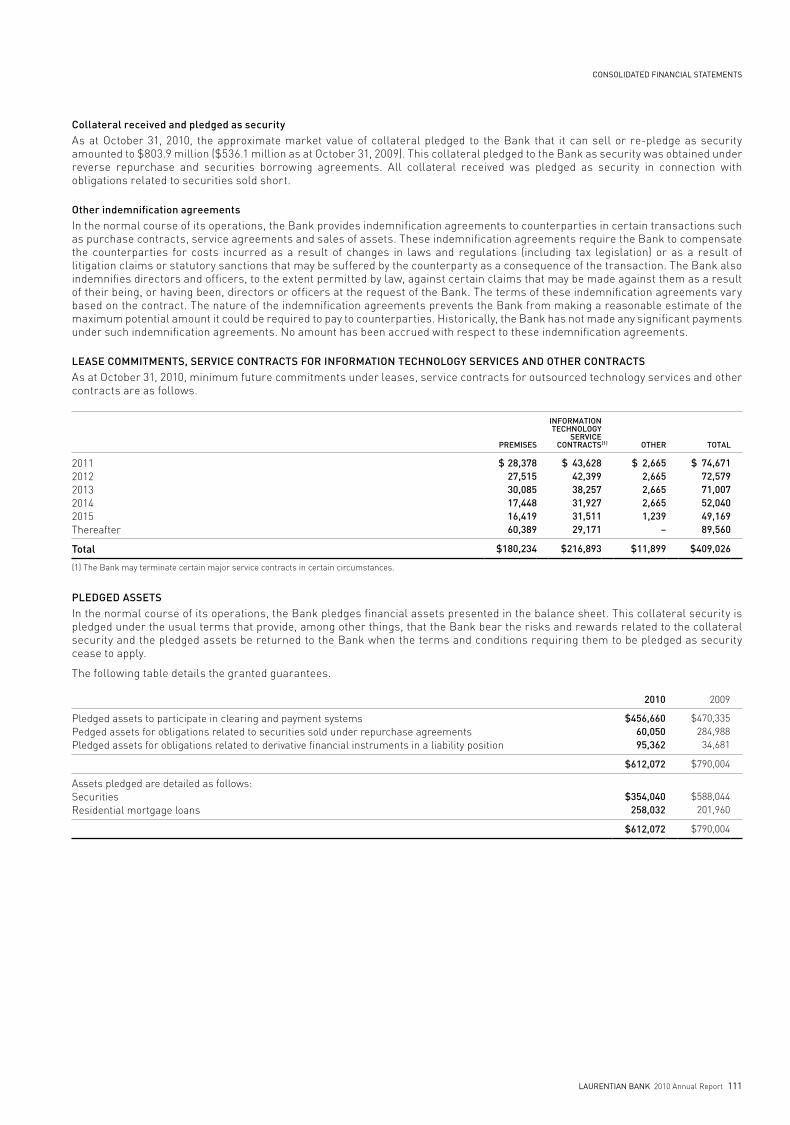
CONSOLIDATED FINANCIAL STATEMENTS
LAurENTIAN bANK 2010 Annual Report 111
collateral received and pledged as securityAs at October 31, 2010, the approximate market value of collateral pledged to the Bank that it can sell or re-pledge as security amounted to $803.9 million ($536.1 million as at October 31, 2009). This collateral pledged to the Bank as security was obtained under reverse repurchase and securities borrowing agreements. All collateral received was pledged as security in connection with obligations related to securities sold short.
other indemnification agreementsIn the normal course of its operations, the Bank provides indemnification agreements to counterparties in certain transactions such as purchase contracts, service agreements and sales of assets. These indemnification agreements require the Bank to compensate the counterparties for costs incurred as a result of changes in laws and regulations (including tax legislation) or as a result of litigation claims or statutory sanctions that may be suffered by the counterparty as a consequence of the transaction. The Bank also indemnifies directors and officers, to the extent permitted by law, against certain claims that may be made against them as a result of their being, or having been, directors or officers at the request of the Bank. The terms of these indemnification agreements vary based on the contract. The nature of the indemnification agreements prevents the Bank from making a reasonable estimate of the maximum potential amount it could be required to pay to counterparties. Historically, the Bank has not made any significant payments under such indemnification agreements. No amount has been accrued with respect to these indemnification agreements.
lease coMMitMents, seRvice contRacts foR infoRMation technologY seRvices and otheR contRacts As at October 31, 2010, minimum future commitments under leases, service contracts for outsourced technology services and other contracts are as follows.
PReMises
infoRMation technologY
seRvice contRacts(1) otheR total
20112012201320142015Thereafter
$ 28,378 27,515 30,085 17,448 16,419 60,389
$ 43,628 42,399 38,257 31,927 31,511 29,171
$ 2,665 2,665 2,665 2,665 1,239
–
$ 74,671 72,579 71,007 52,040 49,169 89,560
total $180,234 $216,893 $11,899 $409,026
(1) The Bank may terminate certain major service contracts in certain circumstances.
Pledged assetsIn the normal course of its operations, the Bank pledges financial assets presented in the balance sheet. This collateral security is pledged under the usual terms that provide, among other things, that the Bank bear the risks and rewards related to the collateral security and the pledged assets be returned to the Bank when the terms and conditions requiring them to be pledged as security cease to apply.
The following table details the granted guarantees.
2010 2009
Pledged assets to participate in clearing and payment systems Pedged assets for obligations related to securities sold under repurchase agreementsPledged assets for obligations related to derivative financial instruments in a liability position
$456,660 60,050 95,362
$470,335284,988
34,681
$612,072 $790,004
Assets pledged are detailed as follows:SecuritiesResidential mortgage loans
$354,040 258,032
$588,044
201,960
$612,072 $790,004
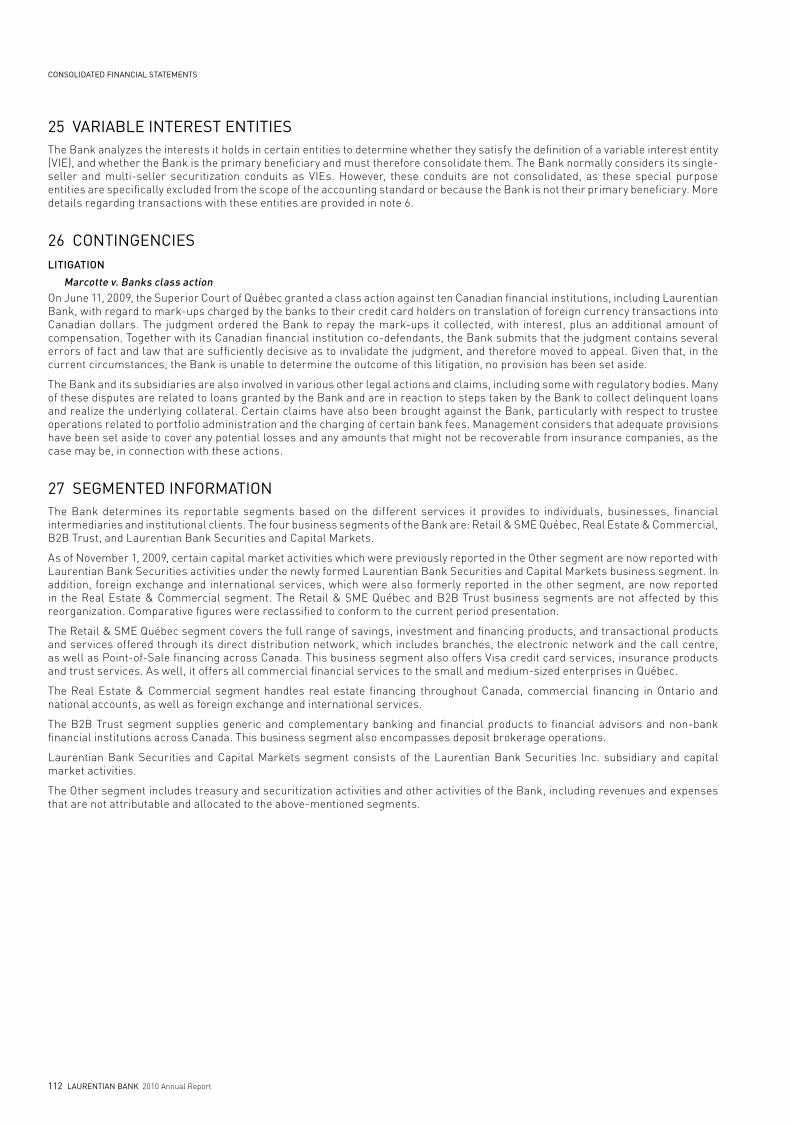
CONSOLIDATED FINANCIAL STATEMENTS
112 LAurENTIAN bANK 2010 Annual Report
25 VArIAbLE INTErEST ENTITIES The Bank analyzes the interests it holds in certain entities to determine whether they satisfy the definition of a variable interest entity (VIE), and whether the Bank is the primary beneficiary and must therefore consolidate them. The Bank normally considers its single-seller and multi-seller securitization conduits as VIEs. However, these conduits are not consolidated, as these special purpose entities are specifically excluded from the scope of the accounting standard or because the Bank is not their primary beneficiary. More details regarding transactions with these entities are provided in note 6.
26 CONTINGENCIESlitigation
Marcotte v. banks class actionOn June 11, 2009, the Superior Court of Québec granted a class action against ten Canadian financial institutions, including Laurentian Bank, with regard to mark-ups charged by the banks to their credit card holders on translation of foreign currency transactions into Canadian dollars. The judgment ordered the Bank to repay the mark-ups it collected, with interest, plus an additional amount of compensation. Together with its Canadian financial institution co-defendants, the Bank submits that the judgment contains several errors of fact and law that are sufficiently decisive as to invalidate the judgment, and therefore moved to appeal. Given that, in the current circumstances, the Bank is unable to determine the outcome of this litigation, no provision has been set aside.
The Bank and its subsidiaries are also involved in various other legal actions and claims, including some with regulatory bodies. Many of these disputes are related to loans granted by the Bank and are in reaction to steps taken by the Bank to collect delinquent loans and realize the underlying collateral. Certain claims have also been brought against the Bank, particularly with respect to trustee operations related to portfolio administration and the charging of certain bank fees. Management considers that adequate provisions have been set aside to cover any potential losses and any amounts that might not be recoverable from insurance companies, as the case may be, in connection with these actions.
27 SEGMENTED INFOrMATIONThe Bank determines its reportable segments based on the different services it provides to individuals, businesses, financial intermediaries and institutional clients. The four business segments of the Bank are: Retail & SME Québec, Real Estate & Commercial, B2B Trust, and Laurentian Bank Securities and Capital Markets.
As of November 1, 2009, certain capital market activities which were previously reported in the Other segment are now reported with Laurentian Bank Securities activities under the newly formed Laurentian Bank Securities and Capital Markets business segment. In addition, foreign exchange and international services, which were also formerly reported in the other segment, are now reported in the Real Estate & Commercial segment. The Retail & SME Québec and B2B Trust business segments are not affected by this reorganization. Comparative figures were reclassified to conform to the current period presentation.
The Retail & SME Québec segment covers the full range of savings, investment and financing products, and transactional products and services offered through its direct distribution network, which includes branches, the electronic network and the call centre, as well as Point-of-Sale financing across Canada. This business segment also offers Visa credit card services, insurance products and trust services. As well, it offers all commercial financial services to the small and medium-sized enterprises in Québec.
The Real Estate & Commercial segment handles real estate financing throughout Canada, commercial financing in Ontario and national accounts, as well as foreign exchange and international services.
The B2B Trust segment supplies generic and complementary banking and financial products to financial advisors and non-bank financial institutions across Canada. This business segment also encompasses deposit brokerage operations.
Laurentian Bank Securities and Capital Markets segment consists of the Laurentian Bank Securities Inc. subsidiary and capital market activities.
The Other segment includes treasury and securitization activities and other activities of the Bank, including revenues and expenses that are not attributable and allocated to the above-mentioned segments.
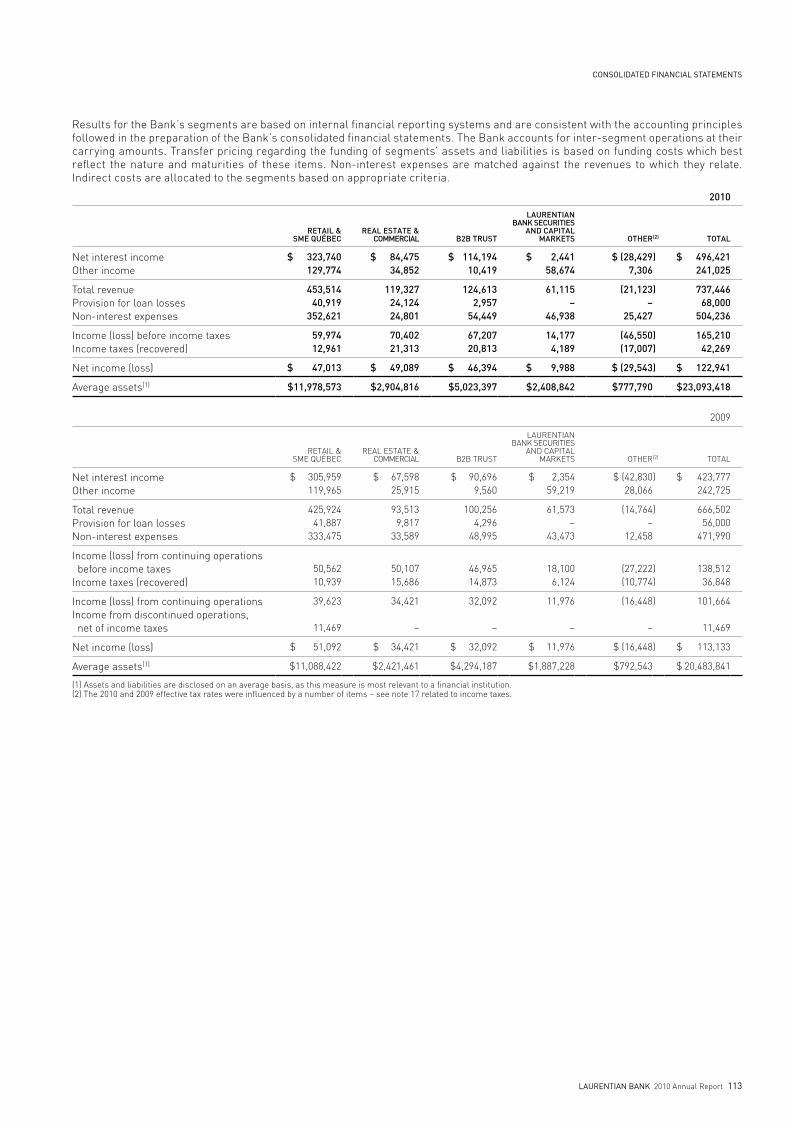
CONSOLIDATED FINANCIAL STATEMENTS
LAurENTIAN bANK 2010 Annual Report 113
Results for the Bank’s segments are based on internal financial reporting systems and are consistent with the accounting principles followed in the preparation of the Bank’s consolidated financial statements. The Bank accounts for inter-segment operations at their carrying amounts. Transfer pricing regarding the funding of segments’ assets and liabilities is based on funding costs which best reflect the nature and maturities of these items. Non-interest expenses are matched against the revenues to which they relate. Indirect costs are allocated to the segments based on appropriate criteria.
2010
Retail &sMe Québec
Real estate & coMMeRcial b2b tRust
lauRentianbank secuRities
and caPital MaRkets otheR(2) total
Net interest incomeOther income
$ 323,740 129,774
$ 84,475 34,852
$ 114,194 10,419
$ 2,441 58,674
$ (28,4297,306
) $ 496,421 241,025
Total revenueProvision for loan lossesNon-interest expenses
453,514 40,919
352,621
119,327 24,124 24,801
124,613 2,957
54,449
61,115 –
46,938
(21,123 –
25,427
) 737,446 68,000
504,236
Income (loss) before income taxesIncome taxes (recovered)
59,974 12,961
70,402 21,313
67,207 20,813
14,177 4,189
(46,550(17,007
))
165,210 42,269
Net income (loss) $ 47,013 $ 49,089 $ 46,394 $ 9,988 $ (29,543) $ 122,941
Average assets(1) $11,978,573 $2,904,816 $5,023,397 $2,408,842 $777,790 $23,093,418
2009
RETAIL & SME QUÉBEC
REAL ESTATE & COMMERCIAL B2B TRUST
LAURENTIANBANK SECURITIES
ANd CAPITAL MARKETS OTHER(2) TOTAL
Net interest incomeOther income
$ 305,959 119,965
$ 67,598 25,915
$ 90,696 9,560
$ 2,354 59,219
$ (42,83028,066
) $ 423,777 242,725
Total revenueProvision for loan lossesNon-interest expenses
425,924 41,887
333,475
93,513 9,817
33,589
100,256 4,296
48,995
61,573 –
43,473
(14,764 –
12,458
)
666,502 56,000
471,990
Income (loss) from continuing operations before income taxesIncome taxes (recovered)
50,562 10,939
50,107 15,686
46,965 14,873
18,100 6,124
(27,222(10,774
))
138,512 36,848
Income (loss) from continuing operationsIncome from discontinued operations, net of income taxes
39,623
11,469
34,421
–
32,092
–
11,976
–
(16,448
–
) 101,664
11,469
Net income (loss) $ 51,092 $ 34,421 $ 32,092 $ 11,976 $ (16,448) $ 113,133
Average assets(1) $11,088,422 $2,421,461 $4,294,187 $1,887,228 $792,543 $ 20,483,841
(1) Assets and liabilities are disclosed on an average basis, as this measure is most relevant to a financial institution.(2) The 2010 and 2009 effective tax rates were influenced by a number of items – see note 17 related to income taxes.

114 laurentian banK 2010 Annual Report
COnSOliDateD FinanCial StateMentS
28 DiSCOntinueD OPeratiOnSSale of the BLC–Edmond de Rothschild Asset Management Inc. joint ventureOn December 31, 2004, Industrial Alliance Insurance and Financial Services Inc. (Industrial Alliance) acquired all of the shares of BLC-Edmond de Rothschild Asset Management Inc. from the Bank. The sale resulted in the recognition of an initial gain of $5.4 million ($5.2 million, net of income taxes) under income from discontinued operations and a deferred gain of $26.2 million related to certain recovery clauses.
Recovery clausesUnder a recovery clause, the Bank was required to repay Industrial Alliance an annual amount of $5.2 million ($4.4 million, net of income taxes) for the five years following the sale if net annual sales of mutual funds did not reach $50.0 million for the 12-month periods ended December 31 of each of these years. At the end of the six-year period ending on December 31, 2010, if cumulative net sales of mutual funds reached $290.0 million, the amounts that would have been repaid to Industrial Alliance under the recovery clause would be reimbursed to the Bank. During fiscal 2009, the Bank recognized the $5.2 million remainder of the selling price in income, in light of net sales to date. Moreover, if cumulative net sales of mutual funds reached $350.0 million for the five-year period ended December 31, 2009, the Bank was eligible to an additional payment. Under this clause, the Bank recognized the final adjustment to the selling price of $8.3 million in 2009 ($7.0 million, net of income taxes), as cumulative net sales of mutual funds significantly exceeded the required minimum level. The recognition of these amounts increased the total selling price in respect of the sale to $76.1 million.
29 SubSeQuent eVentSDebt issuanceOn November 2, 2010, the Bank issued $250.0 million Series 2010-1 Medium Term Notes (Subordinated Indebtedness), for net proceeds of $248.4 million. The contractual maturity of the Series 2010-1 Medium Term Notes is November 2, 2020. Holders of the Series 2010-1 Medium Term Notes are entitled to receive semi-annually fixed interest payments for the initial five-year period ending November 2, 2015 at a rate of 3.70% per annum. The interest rate on the Series 2010-1 Medium Term Notes will reset on November 2, 2015 at the three-month bankers’ acceptance rate plus 1.76% per annum.
The Series 2010-1 Medium Term Notes will not be redeemable prior to November 2, 2015. Subject to the provisions of the Bank Act, to the prior consent of OSFI and to the provisions described in the pricing supplement dated October 25, 2010, at any time on or after November 2, 2015, the Bank may redeem all or any part of the then outstanding Series 2010-1 Medium Term Notes, at the Bank’s option, by the payment of an amount in cash equal to the par value together with unpaid accrued interest.
Subordinated Debenture Redemption NoticeOn December 6, 2010, the Bank announced its intention to redeem, on January 25, 2011, all of its 4.90% Subordinated Debentures, Series 10, maturing in 2016, with an aggregate notional amount of $150.0 million. The Debentures will be redeemed at par plus accrued and unpaid interest to the date of redemption. The Bank obtained from OSFI the required approval to complete this transaction.

LAurENTIAN bANK 2010 Annual Report 115
STATISTICAL rEVIEW – CONSOLIDATED bALANCE ShEET
STATISTICAL rEVIEW – CONSOLIDATED bALANCE ShEET
Unaudited, as at October 31 (in thousands of dollars) 2010 2009 2008 2007 2006
AVERAGEANNUAL
VARIANCE10 / 06
assetscash and non-interest-bearing deposits with other banks $ 70,537 $ 61,010 $ 54,410 $ 65,245
$ 70,907 – %
interest-bearing deposits with other banks 95,561 239,606 94,291 283,255 98,722 (1)
securities Issued or guaranteed by Canada Issued or guaranteed by provinces and municipal corporations Other securities
2,538,189
1,029,726690,890
2,864,454
1,157,180410,549
2,415,863
466,735607,574
1,615,695
446,401612,283
2,019,524
581,384641,372
6
15 2
4,258,805 4,432,183 3,490,172 2,674,379 3,242,280 7
securities purchased under reverse repurchase agreements 803,874 536,064 661,391 540,304 802,546 –
loans Personal Residential mortgage Commercial mortgage Commercial and other
5,630,7888,582,5481,638,8611,691,190
5,655,0557,219,8301,285,0121,555,956
5,694,5746,182,871
932,6881,454,799
5,222,2176,232,778
684,6251,292,790
4,379,0165,985,656
659,0141,265,987
6 9
26 8
Allowance for loan losses17,543,387
(138,143)15,715,853
(114,546)14,264,932
(112,434)13,432,410
(115,322)12,289,673
(125,153) 9 2
17,405,244 15,601,307 14,152,498 13,317,088 12,164,520 9
other Customers’ liability under acceptances Premises and equipment Other assets
165,45058,536
941,996
216,81758,163
1,019,630
110,34259,927
956,441
111,89156,053
738,631
149,81847,520
719,646
3 5 7
1,165,982 1,294,610 1,126,710 906,575 916,984 6
$23,800,003 $22,164,780 $19,579,472 $17,786,846 $17,295,959 8 %
liabilities and shaReholdeRs’ eQuitYdeposits Personal Business, banks and other
$15,424,7764,250,819
$15,138,6373,161,329
$12,430,038 2,903,774
$11,564,5302,314,178
$10,949,4732,145,028
9 19
%
19,675,595 18,299,966 15,333,812 13,878,708 13,094,501 11
other Obligations related to securities sold short or under repurchase agreements Acceptances Other liabilities
1,422,386165,450
1,147,157
1,339,458216,817987,313
1,955,332110,342946,551
1,797,662111,891843,904
2,177,394149,818777,826
(10 3
10
)
2,734,993 2,543,588 3,012,225 2,753,457 3,105,038 (3)
subordinated debentures 150,000 150,000 150,000 150,000 150,000 –
shareholders’ equity Preferred shares Common shares Contributed surplus Retained earnings Treasury shares Accumulated other comprehensive income
210,000259,363
243741,911
–27,898
210,000259,208
209665,538
–36,271
210,000257,462
173596,974
–18,826
210,000256,445
105537,254
–877
210,000251,158
518485,334
(590–
)
– 1
(17 11
(100 n.a.
)
)
1,239,415 1,171,226 1,083,435 1,004,681 946,420 7
$23,800,003 $22,164,780 $19,579,472 $17,786,846 $17,295,959 8 %
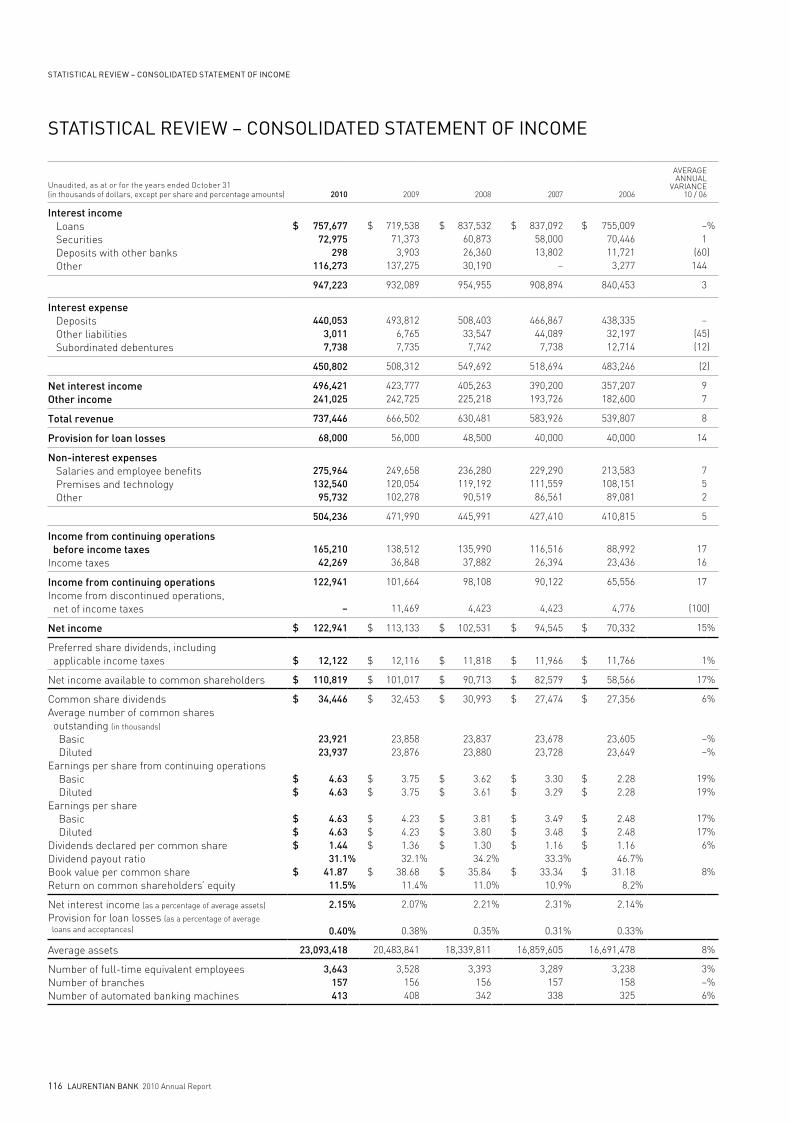
116 LAurENTIAN bANK 2010 Annual Report
STATISTICAL rEVIEW – CONSOLIDATED STATEMENT OF INCOME
STATISTICAL rEVIEW – CONSOLIDATED STATEMENT OF INCOME
Unaudited, as at or for the years ended October 31(in thousands of dollars, except per share and percentage amounts) 2010 2009 2008 2007 2006
AVERAGEANNUAL
VARIANCE10 / 06
interest income Loans Securities deposits with other banks Other
$ 757,67772,975
298116,273
$ 719,53871,373
3,903137,275
$ 837,53260,87326,36030,190
$ 837,09258,00013,802
–
$ 755,00970,44611,721
3,277
– 1
(60 144
%
)
947,223 932,089 954,955 908,894 840,453 3
interest expense deposits Other liabilities Subordinated debentures
440,0533,0117,738
493,8126,7657,735
508,40333,547
7,742
466,86744,089
7,738
438,33532,19712,714
– (45 (12
))
450,802 508,312 549,692 518,694 483,246 (2)
net interest incomeother income
496,421241,025
423,777242,725
405,263225,218
390,200193,726
357,207182,600
9 7
total revenue 737,446 666,502 630,481 583,926 539,807 8
Provision for loan losses 68,000 56,000 48,500 40,000 40,000 14
non-interest expenses Salaries and employee benefits Premises and technology Other
275,964132,540
95,732
249,658120,054102,278
236,280119,192
90,519
229,290111,559
86,561
213,583108,151
89,081
7 5 2
504,236 471,990 445,991 427,410 410,815 5
income from continuing operations before income taxesIncome taxes
165,21042,269
138,51236,848
135,99037,882
116,51626,394
88,99223,436
17 16
income from continuing operationsIncome from discontinued operations, net of income taxes
122,941
–
101,664
11,469
98,108
4,423
90,122
4,423
65,556
4,776
17
(100)
net income $ 122,941 $ 113,133 $ 102,531 $ 94,545 $ 70,332 15 %
Preferred share dividends, including applicable income taxes $ 12,122 $ 12,116 $ 11,818 $ 11,966 $ 11,766 1 %
Net income available to common shareholders $ 110,819 $ 101,017 $ 90,713 $ 82,579 $ 58,566 17 %
Common share dividendsAverage number of common shares outstanding (in thousands)
Basic dilutedEarnings per share from continuing operations Basic dilutedEarnings per share Basic diluteddividends declared per common sharedividend payout ratioBook value per common shareReturn on common shareholders’ equity
$ 34,446
23,92123,937
$ 4.63 $ 4.63
$ 4.63 $ 4.63 $ 1.44
31.1 $ 41.87
11.5
%
%
$ 32,453
23,85823,876
$ 3.75 $ 3.75
$ 4.23 $ 4.23 $ 1.36
32.1 $ 38.68
11.4
%
%
$ 30,993
23,83723,880
$ 3.62 $ 3.61
$ 3.81 $ 3.80 $ 1.30
34.2 $ 35.84
11.0
%
%
$ 27,474
23,67823,728
$ 3.30 $ 3.29
$ 3.49 $ 3.48 $ 1.16
33.3 $ 33.34
10.9
%
%
$ 27,356
23,60523,649
$ 2.28 $ 2.28
$ 2.48 $ 2.48 $ 1.16
46.7 $ 31.18
8.2
%
%
6
– –
19 19
17 17
6
8
%
%%
%%
%%%
%
Net interest income (as a percentage of average assets)
Provision for loan losses (as a percentage of average loans and acceptances)
2.15
0.40
%
%
2.07
0.38
%
%
2.21
0.35
%
%
2.31
0.31
%
%
2.14
0.33
%
%
Average assets 23,093,418 20,483,841 18,339,811 16,859,605 16,691,478 8 %
Number of full-time equivalent employeesNumber of branchesNumber of automated banking machines
3,643157413
3,528156408
3,393156342
3,289157338
3,238158325
3 – 6
%%%
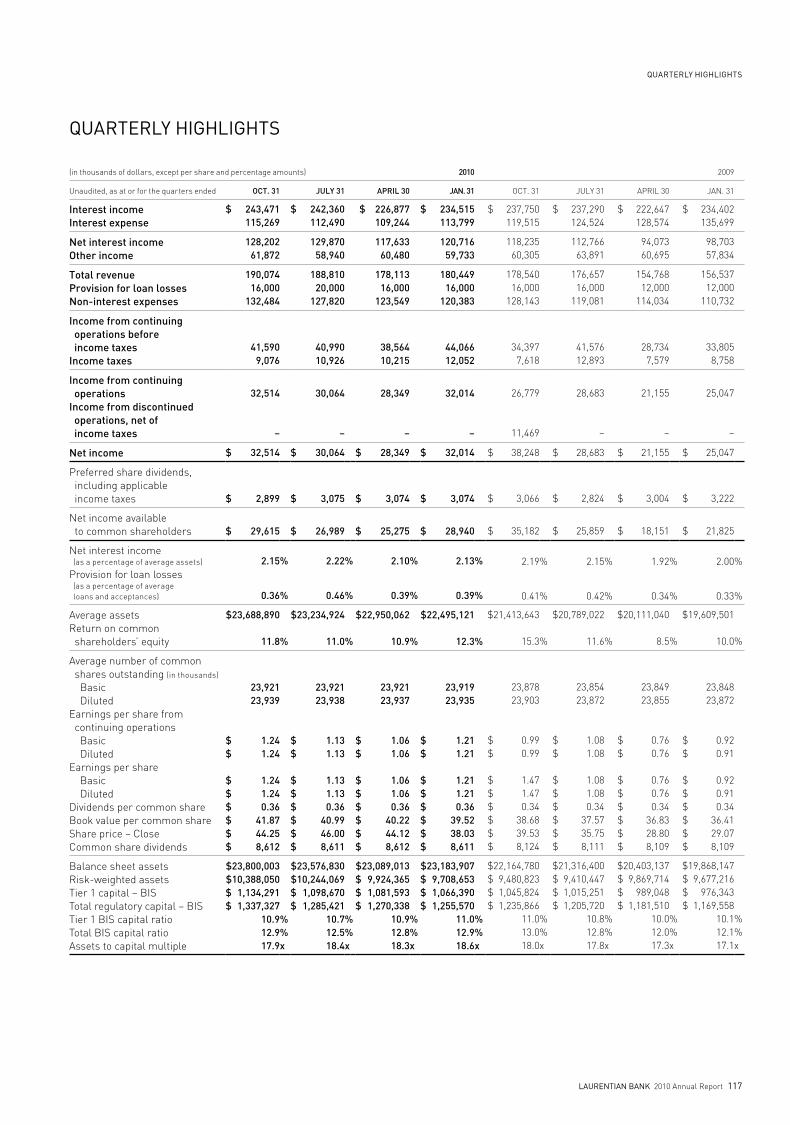
LAurENTIAN bANK 2010 Annual Report 117
QuArTErLy hIGhLIGhTS
QuArTErLy hIGhLIGhTS
(in thousands of dollars, except per share and percentage amounts) 2010 2009
Unaudited, as at or for the quarters ended oct. 31 julY 31 aPRil 30 jan. 31 OCT. 31 JULY 31 APRIL 30 JAN. 31
interest incomeinterest expense
$ 243,471 115,269
$ 242,360 112,490
$ 226,877 109,244
$ 234,515 113,799
$ 237,750 119,515
$ 237,290 124,524
$ 222,647 128,574
$ 234,402 135,699
net interest incomeother income
128,202 61,872
129,870 58,940
117,633 60,480
120,716 59,733
118,235 60,305
112,766 63,891
94,073 60,695
98,703 57,834
total revenueProvision for loan lossesnon-interest expenses
190,074 16,000
132,484
188,810 20,000
127,820
178,113 16,000
123,549
180,449 16,000
120,383
178,540 16,000
128,143
176,657 16,000
119,081
154,768 12,000
114,034
156,537 12,000
110,732
income from continuing operations before income taxesincome taxes
41,590 9,076
40,990 10,926
38,564 10,215
44,066 12,052
34,397 7,618
41,576 12,893
28,734 7,579
33,805 8,758
income from continuing operationsincome from discontinued operations, net of income taxes
32,514
–
30,064
–
28,349
–
32,014
–
26,779
11,469
28,683
–
21,155
–
25,047
–
net income $ 32,514 $ 30,064 $ 28,349 $ 32,014 $ 38,248 $ 28,683 $ 21,155 $ 25,047
Preferred share dividends, including applicable income taxes $ 2,899 $ 3,075 $ 3,074 $ 3,074 $ 3,066 $ 2,824 $ 3,004 $ 3,222
Net income available to common shareholders $ 29,615 $ 26,989 $ 25,275 $ 28,940 $ 35,182 $ 25,859 $ 18,151 $ 21,825
Net interest income (as a percentage of average assets)
Provision for loan losses (as a percentage of average loans and acceptances)
2.15
0.36
%
%
2.22
0.46
%
%
2.10
0.39
%
%
2.13
0.39
%
%
2.19
0.41
%
%
2.15
0.42
%
%
1.92
0.34
%
%
2.00
0.33
%
%
Average assetsReturn on common shareholders’ equity
$23,688,890
11.8 %
$23,234,924
11.0 %
$22,950,062
10.9 %
$22,495,121
12.3 %
$21,413,643
15.3 %
$20,789,022
11.6 %
$20,111,040
8.5%
$19,609,501
10.0%
Average number of common shares outstanding (in thousands)
Basic dilutedEarnings per share from continuing operations Basic dilutedEarnings per share Basic diluteddividends per common shareBook value per common shareShare price – CloseCommon share dividends
23,921 23,939
$ 1.24 $ 1.24
$ 1.24 $ 1.24 $ 0.36 $ 41.87 $ 44.25 $ 8,612
23,921 23,938
$ 1.13 $ 1.13
$ 1.13 $ 1.13 $ 0.36 $ 40.99 $ 46.00 $ 8,611
23,921 23,937
$ 1.06 $ 1.06
$ 1.06 $ 1.06 $ 0.36 $ 40.22 $ 44.12 $ 8,612
23,919 23,935
$ 1.21 $ 1.21
$ 1.21 $ 1.21 $ 0.36 $ 39.52 $ 38.03 $ 8,611
23,878 23,903
$ 0.99 $ 0.99
$ 1.47 $ 1.47 $ 0.34 $ 38.68 $ 39.53 $ 8,124
23,854 23,872
$ 1.08 $ 1.08
$ 1.08 $ 1.08 $ 0.34 $ 37.57 $ 35.75 $ 8,111
23,849 23,855
$ 0.76 $ 0.76
$ 0.76 $ 0.76 $ 0.34 $ 36.83 $ 28.80 $ 8,109
23,848 23,872
$ 0.92 $ 0.91
$ 0.92 $ 0.91 $ 0.34 $ 36.41 $ 29.07 $ 8,109
Balance sheet assetsRisk-weighted assetsTier 1 capital – BISTotal regulatory capital – BISTier 1 BIS capital ratioTotal BIS capital ratioAssets to capital multiple
$23,800,003 $10,388,050 $ 1,134,291 $ 1,337,327
10.9 12.9 17.9
%%x
$23,576,830$10,244,069$ 1,098,670$ 1,285,421
10.7 12.5 18.4
%%x
$23,089,013 $ 9,924,365 $ 1,081,593 $ 1,270,338
10.9 12.8 18.3
%%x
$23,183,907 $ 9,708,653 $ 1,066,390 $ 1,255,570
11.0 12.9 18.6
%%x
$22,164,780 $ 9,480,823 $ 1,045,824 $ 1,235,866
11.0 13.0 18.0
%%x
$21,316,400 $ 9,410,447 $ 1,015,251 $ 1,205,720
10.8 12.8 17.8
%%x
$20,403,137 $ 9,869,714 $ 989,048 $ 1,181,510
10.0 12.0 17.3
%%x
$19,868,147 $ 9,677,216 $ 976,343 $ 1,169,558
10.1 12.1 17.1
%%x
Today, as in the past, strong corporate governance is an important component in managing Laurentian Bank’s activities. In 1987, Laurentian Bank became the first financial institution to separate the roles of Chairman of the Board and of President and CEO. Moreover, its corporate governance practices are among the most exemplary.
All members of the Board of Directors, except the President and Chief Executive Officer, are independent and unrelated to the Bank’s management. The independent status of directors is determined in accordance with criteria defined by the Human Resources and Corporate Governance Committee which are used to evaluate the status of every director on which ever committee he or she sits.
The role of the Board of Directors is essentially to supervise the management of the business and internal affairs of the Bank. Board deliberations generally end with a discussion period held without the presence of management. The members of the Board commit to act in accordance with standards set forth in the Code of Conduct for Directors, which covers issues such as general conduct, contribution to the work of the Board and its committees, insider trading, conflicts of interest and other situations that may affect a director’s independence.
The Board of Directors has delegated some of its responsibilities and functions to three committees whose members are appointed from among the members of the Board. The Audit Committee, the Risk Management Committee and the Human Resources and Corporate Governance Committee provide regular written and verbal updates and reports on their work to the Board of Directors. Furthermore, they present a report to shareholders to be included in the management proxy circular.
AUDIT COMMITTEE
The primary function of the Audit Committee is to support the Board of Directors in overseeing the integrity of the Bank’s financial statements, the relevance and effectiveness of its internal controls, the qualifications and independence of the external auditor and the performance of the internal audit function and of the external auditor. In order to do so, the Board appointed directors meeting the criteria for independence and possessing an appropriate financial literacy level. Furthermore, the Committee meets on a regular basis with the internal and external auditor without the presence of management.
More specifically, its responsibilities include:With respect to the external auditor: recommend the appointment or dismissal of the external auditor; assure itself of its competence, independence and the adequacy of its resources and review its mandate and compensation; oversee its activities and review its performance;With respect to financial statements and reports: oversee the integrity and quality of financial statements and assure itself that the institution’s accounting practices are prudent and appropriate; review the annual and quarterly financial statements, management’s discussion and analysis and press releases regarding annual and quarterly results, the annual information form and any statement required by regulatory authorities prior to their publication;With respect to the internal audit function: assure itself of the competence, independence and the adequacy of the resources of the officer in charge of internal audit and approve his/her mandate as well as the audit plan; follow up on his/her material findings and recommendations;With respect to internal controls: assure itself that Management implements appropriate internal control and management information systems; assure itself of their integrity and effectiveness; assure itself that Management implements procedures regarding the receipt, retention and handling of complaints received with respect to accounting, internal accounting controls or audit;With respect to supervisory agencies: follow up on the findings and recommendations of the regulatory authorities.
RISK MANAGEMENT COMMITTEE
In addition to discharging statutory obligations to review transactions with related parties of the Bank, the Risk Management Committee ensures that the Bank has adopted an adequate and effective risk management process intended to identify, measure and manage risks, and has established relevant policies to manage credit, market, liquidity and financing, operational, capital management, regulatory and reputation risks. In September 2010, the supervision of the regulatory risk was added to the mandate of the Committee. The Committee is composed of independent directors which hold discussions with persons in charge of supervisory activities (the internal auditor as well as the chief risk officer and the chief compliance officer) without the presence of management.
Corporate governanCe
Corporate governanCe
118 laurentian banK 2010 Annual Report
To this end, the Committee must assure itself that Management identifies the business’s principal risks and implements systems to enable to measure and adequately manage them and assure itself of the integrity and effectiveness of such systems; review the overall risk philosophy and risk tolerance; assure itself of the competence, independence and the adequacy of the resources of the officer in charge of integrated risk management and approve his/her mandate; follow up on his/her material findings and recommendations; approve loans which under the credit policies are the responsibility of the Committee and examine the quality of the loan portfolio and the adequacy of allowances for loan losses; assure itself that Management adopts a process to determine the appropriate capital level for the Bank based on assumed risks; review the Code of Ethics and Privacy Code for the Protection of Personal Information applicable to officers and employees and assure itself of their respect; assure itself of the competence, independence and the adequacy of the resources of the officer in charge of compliance and risk management; follow up on their material findings and recommendations; monitor annually, in collaboration with the Human Resources and Corporate Governance Committee, the links between the compensation, the performance and the risk and the Bank’s alignment with the remuneration standards and principles issued by the Financial Stability Board.
HUMAN RESOURCES AND CORPORATE GOVERNANCE COMMITTEE
The Human Resources and Corporate Governance Committee is responsible for human resources and corporate governance matters. The Committee is composed of independent directors of which none heads a public company. Certain elements of its mandate are discussed without the presence of management.
With respect to human resources, the Committee’s duties include:With respect to human resources management: annually review the performance management process and evaluate its effectiveness; assure itself that Management implements a plan to promote the hiring, retention and motivation of qualified personnel; With respect to senior officers: review appointments of senior officers; approve the establishment of objectives for members of the management committee and evaluate their performance; assure itself of the integrity of senior officers and that they create a culture of integrity throughout the Bank;
With respect to compensation: review the overall compensation framework (including incentive compensation, fringe benefits and pension plans) for senior officers, with a view to furthering the Bank’s business objectives, as well as the material terms and conditions of the compensation and employment conditions applicable to the Bank’s other employees and officers; monitor annually, in collaboration with the Risk Management Committee, the links between the compensation, the performance and the risk and of the Bank’s alignment with the remuneration standards and principles issued by the Financial Stability Board;With respect to pension plans: assure itself that Management implements appropriate internal oversight systems with a view to adequately manage pension plans.
With respect to corporate governance, the Committee’s duties include:With respect to the president and Chief executive officer: recommend to the Board the appointment and dismissal of the President and Chief Executive Officer; review in collaboration with the Board, the objectives of the President and Chief Executive, his/her evaluation, compensation and employment conditions; implement a succession plan for the President and Chief Executive Officer;With respect to the board and committees: review corporate governance rules and assure itself of their respect; review the functions of the Board of Directors, its membership, compensation and size; review the constitution, membership and functions of the committees; review the Code of Conduct for the members of the Board and assure itself of its respect; ensure continuing training for the members of the Board; establish criteria to evaluate the independence of the members of the Board and assess their independence periodically; evaluate the Board and its members; ensure the recruitment of new Board members to be submitted to election by the shareholders, and see to their orientation and integration; With respect to public disclosure: assure itself that the shareholders are well informed of the Bank’s state of affairs and deal with all material disagreements between the Bank and its shareholders.
The complete text of the functions of the Board of Directors and the mandates of each Committee as well as the Committees’ report can be found in the management proxy circular.
Corporate governanCe
laurentian banK 2010 Annual Report 119

MeMbers of the board of direCtors
LISE BASTARACHELise Bastarache has worked in the Canadian banking industry for over ten years, holding, among others, the position of Regional Vice President, Québec, Private Banking for a Canadian bank.
Main occupation Economist and Corporate Director
Has served on the Board of Directors since March 2006
– Member of the Risk Management Committee
Boards of directors of publicly traded companies: The Jean Coutu Group (PJC) Inc., Chartwell Seniors Housing Real Estate Investment Trust
Boards and committees of other corporations and organizations: Board of Governors of the Université de Moncton
JEAN BAzIN, C.R. Attorney since 1965, appointed Queen’s Counsel in 1984 and a member of the Senate from 1986 to 1989, Mr. Bazin chaired the Canadian Bar Association and the Québec-Japan Business Forum. He is also Chairman of the Board of the Société générale de financement du Québec.
Main occupation Counsel at Fraser Milner Casgrain LLP
Has served on the board of directors since September 2002
– Member of the Audit Committee Boards of directors of publicly traded
companies: Miranda Technologies Inc. Boards and committees of other
corporations and organizations: Société générale de financement du Québec, Investissement Québec, Canadian Association of Former Parliamentarians and Lambert-Somec inc.
RICHARD BéLANGER, FCAIn 2004, Richard Bélanger was made Fellow and received the Prix Émérite of the Ordre des comptables agréés du Québec.
Main occupation President of Toryvel Group Inc.
Has served on the board of directors since March 2003
– Chair of the Audit Committee – Member of the Risk Management
Committee Boards of directors of publicly traded
companies: Stella-Jones Inc. and Genivar Income Fund
Boards and committees of other corporate and committees of other corporations and organizations: Toryvel Group Inc.
EVE-LyNE BIRONMs. Biron is President and General Manager of a private company of diagnostic and therapeutic services, which ranked 37th among the top 100 Canadian companies managed by women in 2003.
Main occupation President and General Manager of
Biron Health Group Inc. Has served on the board of directors
since March 2003 – Member of the Audit Committee
Boards of directors of publicly traded companies: Ms. Biron does not sit on the board of directors of any publicly traded company other than the Bank
Boards and committees of other corporations and organizations: Biron Health Group Inc., Epiderma, Sainte-Justine UHC Foundation and Orchestre symphonique de Longueuil
ISABELLE COURVILLEMs. Courville is an engineer and a lawyer. Before joining the team at Hydro-Québec, she was President of Bell Enterprise Group and President and General Manager of Bell Nordiq Inc. (Télébec Northern Tel).
Main occupation President of Hydro-Québec TransÉnergie
Has served on the board of directors since March 2007
– Chair of the Human Resources and Corporate Governance Committee
Boards of directors of publicly traded companies: Miranda Technologies Inc.
Boards and committees of other corporations and organizations: NPCC (Northeast Power Coordinating Council), École Polytechnique de Montréal, Board of Trade of Metropolitan Montréal and Asia-Pacific Economic Cooperation Business Advisory Council
L. DENIS DESAUTELS, O.C., FCAOfficer of the Order of Canada, Fellow of the Ordre des comptables agréés du Québec and the Institute of Chartered Accountants of Ontario, Mr. Desautels was Auditor General of Canada from 1991 to 2001. He is renowned as a Canadian authority in matters of governance.
Main occupation Chartered accountant and
Corporate Director Has served on the board of directors
since December 2001 – Chairman of the Board – Member of the Audit Committee – Member of the Human Resources and
Corporate Governance Committee Boards of directors of publicly traded
companies: The Jean Coutu Group (PJC) Inc. and Bombardier Inc.
Boards and committees of other corporations and organizations: Accounting Standards Oversight Council of the Canadian Institute of Chartered Accountants, CARE Canada, International Development Research Centre (IDRC), Fonds Oblat de l’Université Saint-Paul Inc. and Community Foundation of Ottawa
PIERRE GENESTActuary by trade, Pierre Genest was President and Chief Executive Officer of SSQ Financial Group for over 15 years before becoming President and Chief Executive Officer of the Fonds de solidarité des travailleurs du Québec (F.T.Q.) until 2006.
Main occupation Chairman of the Board of SSQ,
Life Insurance Company Inc. Has served on the board of directors
since March 2006 – Chair of the Risk Management
Committee Boards of directors of publicly traded
companies: Mr. Genest does not sit on the board of directors of any publicly traded company other than the Bank
Boards and committees of other corporations and organizations: Manac Inc., Professionals’ Financial Inc., Alemar Inc., and PFT Management Inc.
MICHEL LABONTéMichel Labonté has worked in the banking industry for over 13 years, notably as Senior Vice President, Finance and Control of a Canadian bank.
Main occupation Corporate Director
Has served on the board of directors since March 2009
– Member of the Risk Management Committee
Boards of directors of publicly traded companies: Métro Inc.
Boards and committees of other corporations and organizations: Manac Inc., Novacap Investments Inc., Otéra Capital Inc., Canadian International Organ Competition and Orchestre de la francophonie canadienne
CARMAND NORMANDWith nearly 40 years of experience in finance, Mr. Normand is an excellent investment strategist. Mr. Norman won particular recognition in 2000, when he received the Hermès Award for outstanding career accomplishments, form the Faculty of business Administration of Université Laval.
Main occupation Chairman of the Board of Addenda
Capital Inc. Has served on the board of directors
since July 2004 – Member of the Human Resources and
Corporate Governance Committee Boards of directors of publicly traded
companies: Mr. Norman does not sit on the board of directors of any publicly traded company other than the Bank
Boards and committees of other corporations and organizations: None
JACqUELINE C. ORANGEJacqueline C. Orange has worked in the financial services sector for over 20 years, holding a variety of senior positions in the banking, trust and life insurance industries. From 1996 to 2005, she was President and CEO of Canada Investment and Savings, a special operating agency of Finance Canada.
Main occupation Corporate Director
Has served on the board of directors since March 2008
– Member of the Audit Committee Boards of directors of publicly traded
companies: Ms. Orange does not sit on the board of directors of any publicly traded company other than the Bank
Boards and committees of other corporations and organizations: First Trust Portfolios Canada and Public Accountants Council of the Province of Ontario
MARIE-FRANCE POULINMarie-France Poulin held various positions within the family business, Maax Inc., from 1987 to 2004. She is also Vice President of Kalia Inc.
Main occupation Vice President, Camada Group Inc.
Has served on the board of directors since October 2009
– Member of the Human Resources and Corporate Governance Committee
Boards of directors of publicly traded companies: Ms. Poulin does not sit on the board of directors of any publicly traded company other than the Bank.
Boards and committees of other corporations and organizations: Groupe Camada Inc., Hydro-Québec, Industrial Alliance - Auto and Home Insurance Inc., Kalia Inc., Université Laval and Festival d’été de Québec
RéJEAN ROBITAILLE, FCAA chartered accountant, Réjean Robitaille is a renowned executive. He has in-depth knowledge of the Bank, having held a variety of positions within the management team since 1988.
Main occupation President and Chief Executive Officer
of the Bank Has served on the board of directors
since December 2006 – Mr. Robitaille does not sit on any of
the Bank’s committees Boards of directors of publicly traded
companies: Mr. Robitaille does not sit on the board of directors of any publicly traded company other than the Bank
Boards and committees of other corporations and organizations: Subsidiaries of the Bank
JONATHAN I. WENER, C.M. Member of the Order of Canada, Jonathan I. Wener is a renowned real estate expert with vast experience in the commercial, industrial, residential, recreational and hotel sectors.
Main occupation Chairman of the board at Canderel
Management Inc. Has served on the board of directors
since January 1998 – Member of the Risk Management
Committee Boards of directors of publicly traded
companies: Silanis Technologies Inc. Boards and committees of other
corporations and organizations: Concordia University, The Montréal Museum of Fine Arts Foundation, The Fraser Institute, Goodman Cancer Center, Jewish General Hospital, and The Festival des arts de Saint-Sauveur
120 laurentian banK 2010 Annual Report
board of direCtors

MANAGEMENT COMMITTEE
PREVIOUSPOSITIONSHELDATTHEBANK
June2006–December2006: Senior Executive Vice President and Chief Operating Officer
August2005–June2006: Senior Executive Vice President, Retail and Commercial Financial Services
2003–2005: Executive Vice President, Retail Financial Services
2001–2003: Senior Vice President and Treasurer, Corporate Treasury
2000–2001: Vice President and Treasurer, Corporate Treasury
1988–1998: Various functions within the Bank’s Senior Management Team
EDUCATION Bachelor’s degree in Business
Administration (Accounting specialization), HEC Montréal
Certified Chartered Accountant
SPECIALMENTION
Received the title of Fellow from the Québec Order of Chartered Accountants.
PREVIOUSPOSITIONSHELDATTHEBANK
2005–2007:Executive Vice President, Retail Financial Services
2001–2005:Senior Vice President, Marketing and Product Management
EDUCATION MBA, Université
de Sherbrooke Bachelor’s degree
in Urban Studies, Université du Québec à Montréal
PREVIOUSPOSITIONSHELDATTHEBANK
2004–2005:Senior Vice President, Intermediary Banking Services, and President and Chief Operating Officer of B2B Trust
2002–2004: Vice President, Direct Financial Services
2001–2002: Vice President, Telebanking and Electronic Centres
1999–2001:Vice President, Telebanking Centres
1991–1999:Various functions within the Bank’s Senior Management Team
EDUCATION Bachelor’s degree in
Business Administration, École des Hautes Études Commerciales in Montréal
PREVIOUSPOSITIONSHELDATTHEBANK
2000–2003: Senior Vice President, Legal Affairs and Compliance
1999–2000: Vice President, Legal Affairs and Compliance
1997–1998: Director, Legal Affairs, and Chief Compliance Officer
1990–1997: Various posts in Legal Affairs
EDUCATION
Executive MBA, Université du Québec à Montréal
Specialized diploma in Commercial Law, Université de Montréal
Professional Training Program in Law, École du Barreau du Québec
Bachelor of Law degree in Civil Law, McGill University
Bachelor of Science degree (concentration in Administration), Mississippi University for Women, Columbus, United States
PREVIOUSPOSITIONSHELDATTHEBANK
1996–1998: Vice President and Treasurer
1995–1996: Vice President, Money Market and Foreign Exchange
1993–1995: Vice President, Product Management
1988–1993: Assistant Vice President and Corporate Controller
EDUCATION
MBA, Concordia University Bachelor’s degree in
Economics, University of Montréal
RÉJEANROBITAILLEPresident and Chief Executive OfficerSince 2006
LUCBERNARDExecutive Vice PresidentRetail and SME Financial ServicesSince 2007
FRANÇOISDESJARDINSExecutive Vice President of the Bank and President and Chief Executive Officer of B2B TrustSince 2005
LORRAINEPILONExecutive Vice President, Corporate Affairsand SecretarySince 2003
MICHELC.LAUZONExecutive Vice President and Chief Financial Officer Since 2009
WITHTHEBANKSINCE1988 WITHTHEBANKSINCE2001 WITHTHEBANKSINCE1991 WITHTHEBANKSINCE1990 WITHTHEBANKSINCE2009(ALSOWITHTHEBANKFROM1988TO1998)
MANAGEMENT COMMITTEE
LAURENTIAN BANK 2010 Annual Report 121

planning CoMMittee
DANA ADES-LANDySenior Vice President,Commercial and National Accounts
MARCEL BEAULIEUSenior Vice President,Distribution Networks, Retail Financial Services
GUy BENOITVice President,Retail Financial ServicesMontréal Island Region
yASSIR BERBICHESenior Vice Presidentand Treasurer,Corporate Treasury
DENISE BRISEBOISSenior Vice President,Human Resources
GLADyS CARONVice President, PublicAffairs, Communicationsand Investor Relations
LISE CAzAVice President,Retail Financial ServicesSouthwestern Québec Region
DANIEL DESJARDINSVice President,Commercial Banking,Québec
JEAN-FRANçOIS DOyONVice President,Internal Audit andCorporate Security
PHILIPPE DUBySenior Vice President,Real Estate Managementand Chief Information Officer
RICHARD FABREVice President,Retail Financial Services,Northwest Québec Region
GUy FILIATRAULTVice President,Financing Center
STéPHANE GAGNONSenior Vice President,Marketing and Product Management
MICHEL GARNEAUVice President,Retail Financial Services,Québec and Eastern Québec Region
MICHEL GENDRONVice President,National Accounts,Commercial Banking
NATHALIE GéNéREUxVice President,Operations and Expert Services
PIERRE GODBOUTVice President,Sales Support to Financial Advisors and IntermediariesLaurentian Bank Securities Inc.
PAUL HURTUBISESenior Vice President,Commercial andReal Estate Financing
CLAUDE JOBINVice President,Commercial Credit
DIANE LAFRESNAyEVice President,Finance and Administration and Chief Financial Officer,B2B Trust
RICK C. LANEVice President,Real Estate Financing
ANDRé LOPRESTIVice Presidentand Chief Accountant
SIMON LUSSIERSenior Vice President,Institutional Equity,Laurentian Bank Securities Inc.
SyLVAIN MALOVice President,Direct Financial Services
LOUIS MARqUISSenior Vice President,Credit
SUSI MCCORDSenior Vice President,Marketing and Distribution,B2B Trust
PIERRE MINVILLESenior Vice President and Chief Risk Officer
STéFANIE PELLETIERVice President,Finance
yVES RUESTSenior Vice President,Finance and Administration,Chief Financial Officer andChief Compliance Officer,Laurentian Bank Securities Inc.
EVA STAMADIANOSVice President,Human Resourcesand Chief Risk Officer,B2B Trust
DORIS TOURKOyIANNISVice President,Operations, B2B Trust
MICHEL C. TRUDEAUSenior Vice PresidentCapital Markets of the Bankand President and ChiefExecutive Officer,Laurentian Bank Securities Inc.
CHRISTINE zALzALVice President, Marketing,B2B Trust
MARK zOCHOWSKIVice President, Business Development, B2B Trust
122 laurentian banK 2010 Annual Report
planning CoMMittee

branChes
ALMA500 Sacré-Cœur St. W.
AMOS1 1st Avenue W.
BAIE-COMEAU600 Laflèche Blvd.
BELOEIL546 Sir-Wilfrid-Laurier Blvd.
BLAINVILLE1356 Curé-Labelle Blvd., Suite 2229 de la Seigneurie
BOISBRIAND2250 du Faubourg Blvd.
BOUCHERVILLE999 De Montarville Blvd.
BROSSARD1635 Rome Blvd.
CAMPBELL’S BAy148 Front St., P.O. Box 189
CHAMBLy1495 Brassard St.
CôTE ST-LUC5479 Westminster Ave.
CHâTEAUGUAy111 Saint-Jean Baptiste Blvd.
CHIBOUGAMAU530 3rd Street
DOLBEAU – MISTASSINI1372 Wallberg Blvd.
DOLLARD-DES-ORMEAUx4057 Saint-Jean Hill3500 des Sources Blvd.
DORVAL325 Dorval Ave.
DRUMMONDVILLE571 Saint-Joseph Blvd.
FORT COULONGE532 Baume St.
GATINEAU325 Gréber Blvd, L Unit75 du Plateau, Unit 109770 Saint-Joseph Blvd.
GRANBy40 Évangéline St.
GRAND-MèRE531 6th Avenue
GRENVILLE240 Principale St.
JOLIETTE373 Notre-Dame St.
KIRKLAND3876 Saint-Charles Blvd.
LACHUTE470 Principale St. W.
LA PRAIRIE995 Taschereau Blvd.
LAVAL928 Highway 13, Chomedey W.233 Curé-Labelle Blvd.3387 Dagenais Blvd. W.510 des Laurentides Blvd.5720 des Laurentides Blvd.750 Montrose St.3870 Notre-Dame Blvd.1899 René-Laennec Blvd.1995 Saint-Martin Blvd. W.4600 Samson Blvd., Suite 19
LONGUEUIL2836 chemin Chambly4 Saint-Charles St. E.6250 Cousineau Blvd, Suite 2005925 Payer Blvd.3700 Taschereau Blvd.
MANIWAKI111 Desjardins Blvd.
MASCOUCHE848 Masson Hill
MONT LAURIER476 de la Madone St.
MONTRéAL4945 Beaubien St. E.6593 Beaubien St. E.4155 rue Bélanger E.5900 Bélanger St. E., Saint-Léonard290 Chabanel St. W.8262 Champlain Blvd., LaSalle4135 D’Amiens St., Montréal-Nord6225 Darlington Ave.865 Décarie Blvd., Saint-Laurent5159 Décarie Blvd.88 Don Quichotte Blvd.885 Fleury St. E.2200 Fleury St. E.10451 Gouin Blvd. W., Pierrefonds – Roxboro5501 Henri-Bourassa Blvd. E., Montréal-Nord8595 Hochelaga St.136 Jacques-Bizard Blvd., Bizard Island7050 Jarry St. E., Anjou4725 Jarry St. E., Saint-Léonard10 Jean-Talon St. E.5355 Jean-Talon St. E., Saint-Léonard555 Jean-Talon St. W.6651 Joseph-Renaud Blvd., Anjou9095 Lajeunesse St.8410 Langelier Blvd., Saint-Léonard6525 Léger Blvd., Montréal-Nord6500 de Lorimier Ave.2937 Masson St.8646 Maurice-Duplessis Blvd., Rivière-des-Prairies6270 Monk Blvd.1981 McGill College Ave.1100 du Mont-Royal Ave. E.8787 Newman Blvd., LaSalle1675 Notre-Dame St., Lachine3720 Ontario St. E.7705 Papineau Ave.5059 Park Ave.1430 Poirier St., Saint-Laurent1100 René-Lévesque Blvd. W.1155 Sainte-Catherine St. E.8090 Saint-Denis St.
391 Saint-Jacques St.4080 Saint-Jacques St.3823 Saint-Laurent Blvd.7192 Saint-Michel Blvd.8930 Saint-Michel Blvd.2490 de Salaberry St.1805 Sauvé St. W.6615 Sherbrooke St. E.12050 Sherbrooke St. E.5651 Sherbrooke St. W.1291 Shevchenko Blvd., LaSalle6640 Somerled Ave.1447 Van Horne Ave., Outremont4790 Van Horne Ave.5501 Verdun Ave., Verdun8945 Viau Blvd., Saint-Léonard4214 Wellington St., Verdun
MURDOCHVILLE601, 5th Street, P.O. Box 1210
NEW CARLISLE168 Gérard-D.-Lévesque Blvd.
NEW RICHMOND228 Perron Blvd.
NICOLET92 Place 21-Mars, P.O, Box 1869
OTTAWA1021 Cyrville Road, Unit 9
PASPéBIAC120 Gérard-D.-Lévesque Blvd., P.O. Box 39
PORT DANIEL10 132 Road, P.O. Box 70
qUéBEC999 de Bourgogne St.510 Charest Blvd. E.1221 Charles-Albanel St.580 Grande-Allée E., Suite 308000 Henri-Bourassa Blvd.2600 Laurier Blvd., Suite 252700 Laurier Blvd., Suite 22871275 Sainte-Foy Road3930 Wilfrid-Hamel Blvd. W.3323 du Carrefour Blvd.1350 Lebourgneuf Blvd.
REPENTIGNy150 Iberville Blvd.910A Iberville Blvd.
RIMOUSKI320 Saint-Germain St. E.
ROBERVAL773 Saint-Joseph Blvd., Suite 101
ROSEMèRE401 Labelle Blvd.
ROUyN–NORANDA24 Perreault St. E.
SAGUENAy1611 Talbot Blvd., Suite 100, Chicoutimi3460 Saint-François Blvd., Jonquière1220 du Port Ave., La Baie
SAINT-BRUNO DE MONTARVILLE1354 Roberval St.
SAINT-CONSTANT400 132 Road, Suite 170
SAINTE-MARIE-DE-BEAUCE16 Notre-Dame St. N.
SAINTE-THéRèSE-DE-BLAINVILLE95 Curé-Labelle Blvd.
SAINT-EUSTACHE569 Arthur-Sauvé Blvd.
SAINT-GEORGES11400 1st Avenue, Suite 35
SAINT-HyACINTHE5915 Martineau St.
SAINT-JEAN-SUR-RICHELIEU605 Pierre-Caisse St.
SAINT-JéROME3 de La Salette Blvd.
SAINT-LAMBERT400 Victoria Ave.
SAINT-RAyMOND300 Saint-Joseph St.
SEPT-ÎLES770 Laure Blvd.
SHERBROOKE2637 King St. W.5050 Bourque Blvd., Rock Forest
SOREL – TRACy831 Marie-Victorin Road
TERREBONNE1090 Moody Blvd.
THETFORD MINES222 Frontenac Blvd. W., Suite 101
TROIS-RIVIèRES425 des Forges St.4450 des Forges Blvd.
VAL D’OR872 3rd Avenue
VAUDREUIL – DORION43 Cité-des-Jeunes Blvd.
VALLEyFIELD187 Victoria
VICTORIAVILLE1073 Jutras Blvd. E.
WESTMOUNT4848 Sherbrooke St. W.
laurentian banK 2010 Annual Report 123
branChes
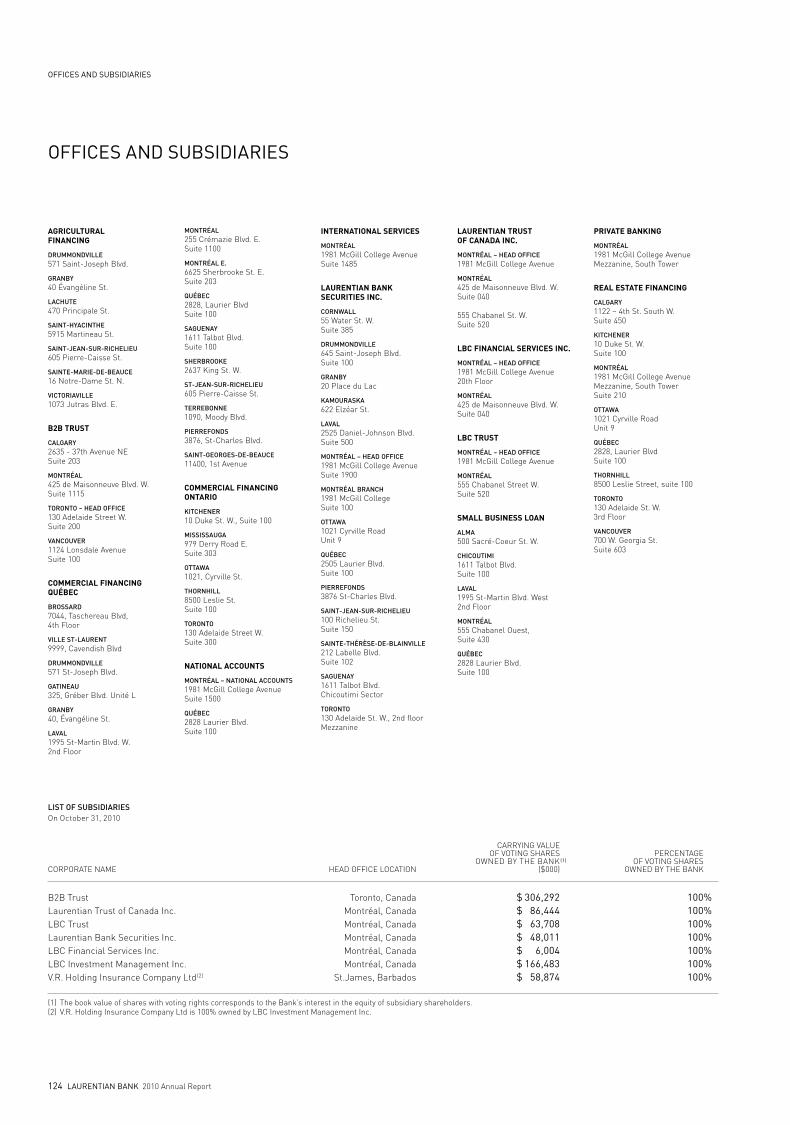
offiCes and subsidiaries
AgriculturAl FinAncing
DRUMMONDVILLE571 Saint-Joseph Blvd.
GRANBy40 Évangéline St.
LACHUTE470 Principale St.
SAINT-HyACINTHE5915 Martineau St.
SAINT-JEAN-SUR-RICHELIEU605 Pierre-Caisse St.
SAINTE-MARIE-DE-BEAUCE16 Notre-Dame St. N.
VICTORIAVILLE1073 Jutras Blvd. E.
B2B trust
CALGARy2635 - 37th Avenue NESuite 203
MONTRéAL425 de Maisonneuve Blvd. W.Suite 1115
TORONTO – HEAD OFFICE130 Adelaide Street W.Suite 200
VANCOUVER1124 Lonsdale AvenueSuite 100
commerciAl FinAncing QuéBec
BROSSARD 7044, Taschereau Blvd, 4th Floor
VILLE ST-LAURENT9999, Cavendish Blvd
DRUMMONDVILLE571 St-Joseph Blvd.
GATINEAU325, Gréber Blvd. Unité L
GRANBy40, Évangéline St.
LAVAL1995 St-Martin Blvd. W.2nd Floor
MONTRéAL255 Crémazie Blvd. E.Suite 1100
MONTRéAL E.6625 Sherbrooke St. E.Suite 203
qUéBEC2828, Laurier BlvdSuite 100
SAGUENAy1611 Talbot Blvd.Suite 100
SHERBROOKE2637 King St. W.
ST-JEAN-SUR-RICHELIEU605 Pierre-Caisse St.
TERREBONNE1090, Moody Blvd.
PIERREFONDS3876, St-Charles Blvd.
SAINT-GEORGES-DE-BEAUCE11400, 1st Avenue
commerciAl FinAncing ontArio
KITCHENER10 Duke St. W., Suite 100
MISSISSAUGA979 Derry Road E.Suite 303
OTTAWA1021, Cyrville St.
THORNHILL8500 Leslie St.Suite 100
TORONTO130 Adelaide Street W.Suite 300
nAtionAl Accounts
MONTRéAL – NATIONAL ACCOUNTS1981 McGill College AvenueSuite 1500
qUéBEC2828 Laurier Blvd.Suite 100
internAtionAl services
MONTRéAL1981 McGill College AvenueSuite 1485
lAurentiAn BAnk securities inc.
CORNWALL55 Water St. W.Suite 385
DRUMMONDVILLE645 Saint-Joseph Blvd.Suite 100
GRANBy20 Place du Lac
KAMOURASKA622 Elzéar St.
LAVAL2525 Daniel-Johnson Blvd.Suite 500
MONTRéAL – HEAD OFFICE1981 McGill College AvenueSuite 1900
MONTRéAL BRANCH1981 McGill College Suite 100
OTTAWA 1021 Cyrville RoadUnit 9
qUéBEC2505 Laurier Blvd.Suite 100
PIERREFONDS3876 St-Charles Blvd.
SAINT-JEAN-SUR-RICHELIEU100 Richelieu St.Suite 150
SAINTE-THéRèSE-DE-BLAINVILLE212 Labelle Blvd.Suite 102
SAGUENAy1611 Talbot Blvd.Chicoutimi Sector
TORONTO130 Adelaide St. W., 2nd floorMezzanine
lAurentiAn trust oF cAnAdA inc.
MONTRéAL – HEAD OFFICE1981 McGill College Avenue
MONTRéAL425 de Maisonneuve Blvd. W.Suite 040
555 Chabanel St. W.Suite 520
lBc FinAnciAl services inc.
MONTRéAL – HEAD OFFICE1981 McGill College Avenue20th Floor
MONTRéAL425 de Maisonneuve Blvd. W.Suite 040
lBc trust
MONTRéAL – HEAD OFFICE1981 McGill College Avenue
MONTRéAL555 Chabanel Street W.Suite 520
smAll Business loAn
ALMA500 Sacré-Coeur St. W.
CHICOUTIMI1611 Talbot Blvd.Suite 100
LAVAL1995 St-Martin Blvd. West2nd Floor
MONTRéAL555 Chabanel Ouest,Suite 430
qUéBEC2828 Laurier Blvd.Suite 100
PrivAte BAnking
MONTRéAL1981 McGill College AvenueMezzanine, South Tower
reAl estAte FinAncing
CALGARy1122 – 4th St. South W.Suite 450
KITCHENER10 Duke St. W.Suite 100
MONTRéAL1981 McGill College AvenueMezzanine, South Tower Suite 210
OTTAWA1021 Cyrville RoadUnit 9
qUéBEC2828, Laurier BlvdSuite 100
THORNHILL8500 Leslie Street, suite 100
TORONTO130 Adelaide St. W.3rd Floor
VANCOUVER700 W. Georgia St.Suite 603
LIST OF SUBSIDIARIES On October 31, 2010
CARRyING VALUE OF VOTING SHARES PERCENTAGE OWNED By THE BANK (1) OF VOTING SHARES CORPORATE NAME HEAD OFFICE LOCATION ($000) OWNED By THE BANK
B2B Trust Toronto, Canada $ 306,292 100%Laurentian Trust of Canada Inc. Montréal, Canada $ 86,444 100%LBC Trust Montréal, Canada $ 63,708 100%Laurentian Bank Securities Inc. Montréal, Canada $ 48,011 100%LBC Financial Services Inc. Montréal, Canada $ 6,004 100%LBC Investment Management Inc. Montréal, Canada $ 166,483 100%V.R. Holding Insurance Company Ltd (2) St.James, Barbados $ 58,874 100%
(1) The book value of shares with voting rights corresponds to the Bank’s interest in the equity of subsidiary shareholders.(2) V.R. Holding Insurance Company Ltd is 100% owned by LBC Investment Management Inc.
124 laurentian banK 2010 Annual Report
offiCes and subsidiaries
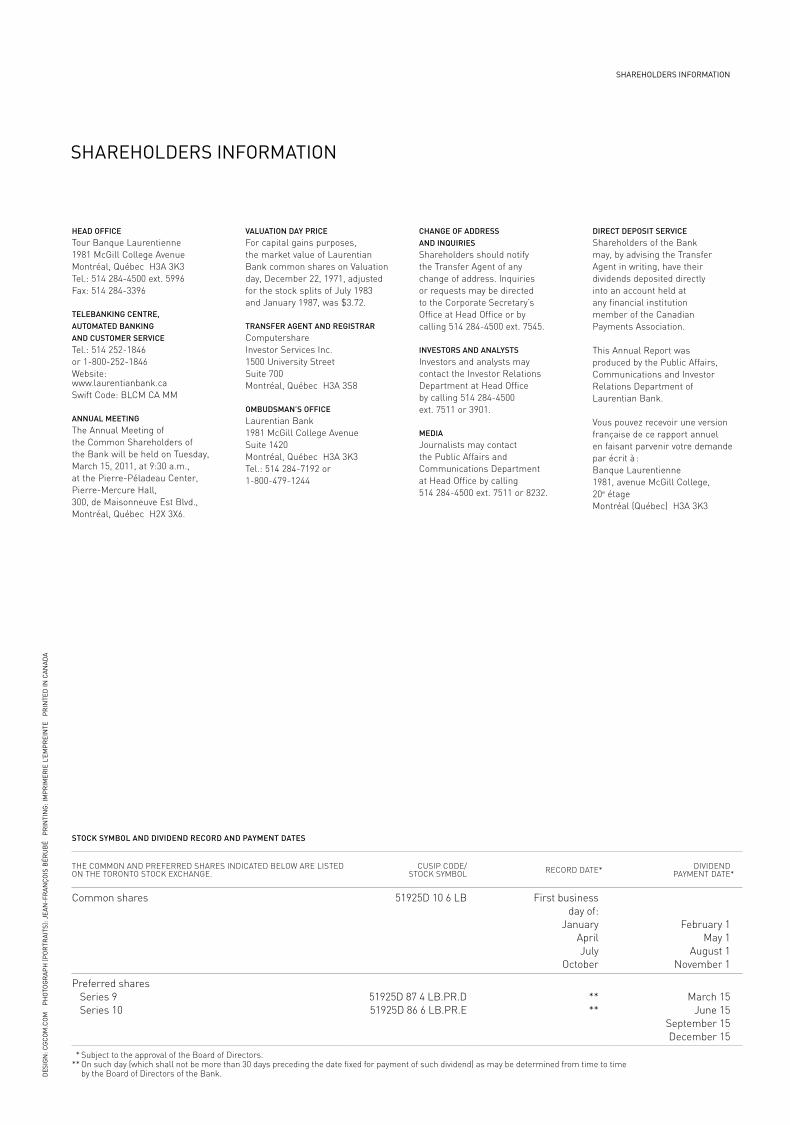
Des
ign
: cg
co
m.c
om
Ph
oto
gr
aP
h (P
or
tra
its)
: jea
n-f
ra
nç
ois
bér
ub
é P
rin
tin
g: i
mP
rim
erie
l’e
mP
rei
nte
P
rin
teD
in c
an
aD
a
shareholDers information
Head officeTour Banque Laurentienne1981 McGill College AvenueMontréal, Québec H3A 3K3Tel.: 514 284-4500 ext. 5996Fax: 514 284-3396
Telebanking cenTre, auTomaTed banking and cusTomer serviceTel.: 514 252-1846 or 1-800-252-1846Website: www.laurentianbank.caSwift Code: BLCM CA MM
annual meeTingThe Annual Meeting ofthe Common Shareholders of the Bank will be held on Tuesday,March 15, 2011, at 9:30 a.m.,at the Pierre-Péladeau Center,Pierre-Mercure Hall,300, de Maisonneuve Est Blvd.,Montréal, Québec H2X 3X6.
valuaTion day priceFor capital gains purposes,the market value of Laurentian Bank common shares on Valuation day, December 22, 1971, adjusted for the stock splits of July 1983 and January 1987, was $3.72.
Transfer agenT and regisTrarComputershareInvestor Services Inc.1500 University StreetSuite 700Montréal, Québec H3A 3S8
ombudsman’s officeLaurentian Bank 1981 McGill College AvenueSuite 1420Montréal, Québec H3A 3K3Tel.: 514 284-7192 or1-800-479-1244
cHange of address and inquiriesShareholders should notifythe Transfer Agent of anychange of address. Inquiriesor requests may be directedto the Corporate Secretary’s Office at Head Office or by calling 514 284-4500 ext. 7545.
invesTors and analysTsInvestors and analysts maycontact the Investor RelationsDepartment at Head Officeby calling 514 284-4500ext. 7511 or 3901.
mediaJournalists may contactthe Public Affairs andCommunications Departmentat Head Office by calling514 284-4500 ext. 7511 or 8232.
direcT deposiT serviceShareholders of the Bankmay, by advising the TransferAgent in writing, have theirdividends deposited directlyinto an account held atany financial institutionmember of the CanadianPayments Association.
This Annual Report wasproduced by the Public Affairs,Communications and InvestorRelations Department ofLaurentian Bank.
Vous pouvez recevoir une versionfrançaise de ce rapport annuelen faisant parvenir votre demandepar écrit à :Banque Laurentienne1981, avenue McGill College,20e étageMontréal (Québec) H3A 3K3
sTock symbol and dividend record and paymenT daTes
THE COMMOn AnD PREFERRED SHARES InDICATED BELOW ARE LISTED On THE TOROnTO STOCK EXCHAnGE.
CUSIP CODE/ STOCK SyMBOL RECORD DATE* DIVIDEnD
PAyMEnT DATE*
Common shares 51925D 10 6 LB First business day of:
JanuaryAprilJuly
October
February 1May 1
August 1november 1
Preferred shares Series 9 Series 10
51925D 87 4 LB.PR.D51925D 86 6 LB.PR.E
****
March 15June 15
September 15December 15
* Subject to the approval of the Board of Directors. ** On such day (which shall not be more than 30 days preceding the date fixed for payment of such dividend) as may be determined from time to time
by the Board of Directors of the Bank.
shareholDers information

l oked Have you
at us lately?
www.laurentianbank.ca
ISBN 978-2-9809746-9-4Legal Deposit – Bibliothèque et Archives nationales du Québec, 2011
Legal Deposit – Library and Archives Canada, 2011995309A
LAu
reN
tIAN
BA
NK
2010 Annual Report
2010 Annual Report


![LBC Q1-2012 Report to Shareholders - Laurentian Bank of Canada · 2012. 3. 7. · 2 Laurentian Bank First Quarter 2012 Report to Shareholders Highlights Net income [1] (in millions](https://img.dokumen.tips/doc/110x75/60b2c927a5f4423d8570d144/lbc-q1-2012-report-to-shareholders-laurentian-bank-of-canada-2012-3-7-2-laurentian.jpg)