Embed Size (px)
Citation preview

Available online at www.sciencedirect.com
5 (2007) 161–186www.elsevier.com/locate/earscirev
Earth-Science Reviews 8
Late Neogene continental stages in NW Europe revisited
Timme H. Donders a,⁎, Marloes L. Kloosterboer-van Hoeve a,b, Wim Westerhoff c,Roel M.C.H. Verreussel c, André F. Lotter a
a Institute of Environmental Biology, Palaeoecology, Laboratory of Palaeobotany and Palynology,Utrecht University, Budapestlaan 4, 3584 CD Utrecht, The Netherlandsb Goois Lyceum, Vossiuslaan 2a, 1401 RT Bussum, The Netherlands
c TNO Geological Survey of The Netherlands, P.O. Box 80015, 3508 TA Utrecht, The Netherlands
Received 22 March 2007; accepted 20 June 2007Available online 1 August 2007
Abstract
Pollen records from fluvial deposits in The Netherlands have traditionally been used to establish continental stages for theNeogene in NW Europe. These stages are still widely used across Europe for stratigraphic correlations and palaeoclimatic studies.Despite their extensive use, the validity of this continental correlation scheme for the Plio- and Pleistocene has never been tested inthe area where they were originally proposed: the Roer Valley Graben (RVG). The fluvial and deltaic depositional setting in thisarea is controlled by a complex pattern of tectonic and climatic processes, which strongly complicates the definition of stages andsub-stages of regional or supra-regional significance.
Here, the original palynological data used to define the Praetiglian, Reuverian, Brunssumian, Susterian, and ‘Linne’ (sub-)stagesare assessed and compared to new borehole data. With a multivariate (Correspondence Analysis) approach we show that most ofthese stages cannot be distinguished by numerical analysis of the pollen assemblages. A tripartition of pollen assemblages ispossible, which results in a cooler Pleistocene cluster, warm-temperate to sub-tropical Pliocene cluster, and a warm and relativelydry Late Miocene to Early Pliocene cluster. However, no further stages, sub-stages or clear climatic phases can be consistentlyrecognized in these data.
A detailed lithostratigraphic framework of the study area allows a correlation of the sections independent of the pollen data. Resultsconfirm the numerical analyses and furthermore point to a strong lithological (depositional) bias on the pollen assemblages. Variationsin the abundance of Sequoia and Taxodium, originally used to define the Brunssumian/Reuverian transition and Brunssumian A–Csub-stages, are shown to represent mostly local changes. The number and absolute percentage of the fluctuations in Sequoia andTaxodium abundances depend largely on the sample resolution and the site location within the RVG.
Our data assessment indicates that long-distance chronostratigraphic correlations based on the original continental Neogene stageslikely are invalid. Furthermore, the palaeoclimatic reconstructions that have been based on the RVG successions are largely over-interpreted. The present palaeoclimate reconstructions from the RVG reflect variations in the highly-dynamic fluvial depositionalsetting, taphonomic effects and environmental conditions, including climate. A sequence-stratigraphic approach combined with theanalysis of interfingering marine sediments is potentially better suited to establish absolute ages and associated climatic conditions ofthe Neogene deposits within the RVG.© 2007 Elsevier B.V. All rights reserved.
Keywords: pollen; Neogene; palaeoclimate; biostratigraphy; lithostratigraphy; fluvial deposits
⁎ Corresponding author. Tel.: +31 30 253 2631.E-mail address: [email protected] (T.H. Donders).
0012-8252/$ - see front matter © 2007 Elsevier B.V. All rights reserved.doi:10.1016/j.earscirev.2007.06.004
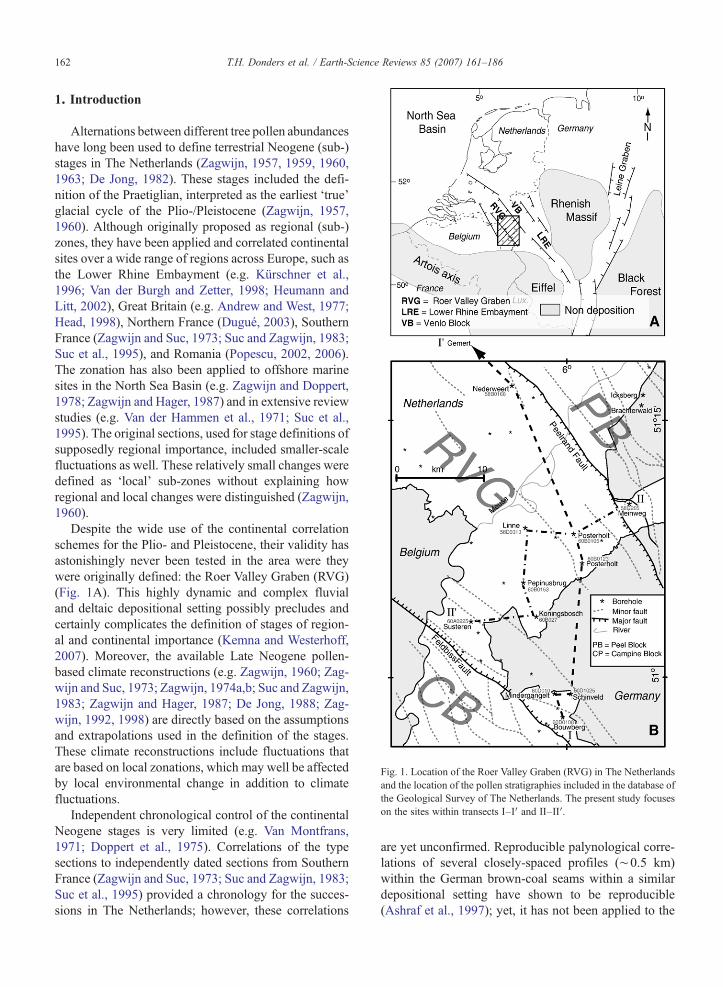
Fig. 1. Location of the Roer Valley Graben (RVG) in The Netherlandsand the location of the pollen stratigraphies included in the database ofthe Geological Survey of The Netherlands. The present study focuseson the sites within transects I–I′ and II–II′.
162 T.H. Donders et al. / Earth-Science Reviews 85 (2007) 161–186
1. Introduction
Alternations between different tree pollen abundanceshave long been used to define terrestrial Neogene (sub-)stages in The Netherlands (Zagwijn, 1957, 1959, 1960,1963; De Jong, 1982). These stages included the defi-nition of the Praetiglian, interpreted as the earliest ‘true’glacial cycle of the Plio-/Pleistocene (Zagwijn, 1957,1960). Although originally proposed as regional (sub-)zones, they have been applied and correlated continentalsites over a wide range of regions across Europe, such asthe Lower Rhine Embayment (e.g. Kürschner et al.,1996; Van der Burgh and Zetter, 1998; Heumann andLitt, 2002), Great Britain (e.g. Andrew and West, 1977;Head, 1998), Northern France (Dugué, 2003), SouthernFrance (Zagwijn and Suc, 1973; Suc and Zagwijn, 1983;Suc et al., 1995), and Romania (Popescu, 2002, 2006).The zonation has also been applied to offshore marinesites in the North Sea Basin (e.g. Zagwijn and Doppert,1978; Zagwijn and Hager, 1987) and in extensive reviewstudies (e.g. Van der Hammen et al., 1971; Suc et al.,1995). The original sections, used for stage definitions ofsupposedly regional importance, included smaller-scalefluctuations as well. These relatively small changes weredefined as ‘local’ sub-zones without explaining howregional and local changes were distinguished (Zagwijn,1960).
Despite the wide use of the continental correlationschemes for the Plio- and Pleistocene, their validity hasastonishingly never been tested in the area were theywere originally defined: the Roer Valley Graben (RVG)(Fig. 1A). This highly dynamic and complex fluvialand deltaic depositional setting possibly precludes andcertainly complicates the definition of stages of region-al and continental importance (Kemna and Westerhoff,2007). Moreover, the available Late Neogene pollen-based climate reconstructions (e.g. Zagwijn, 1960; Zag-wijn and Suc, 1973; Zagwijn, 1974a,b; Suc and Zagwijn,1983; Zagwijn and Hager, 1987; De Jong, 1988; Zag-wijn, 1992, 1998) are directly based on the assumptionsand extrapolations used in the definition of the stages.These climate reconstructions include fluctuations thatare based on local zonations, which may well be affectedby local environmental change in addition to climatefluctuations.
Independent chronological control of the continentalNeogene stages is very limited (e.g. Van Montfrans,1971; Doppert et al., 1975). Correlations of the typesections to independently dated sections from SouthernFrance (Zagwijn and Suc, 1973; Suc and Zagwijn, 1983;Suc et al., 1995) provided a chronology for the succes-sions in The Netherlands; however, these correlations
are yet unconfirmed. Reproducible palynological corre-lations of several closely-spaced profiles (∼0.5 km)within the German brown-coal seams within a similardepositional setting have shown to be reproducible(Ashraf et al., 1997); yet, it has not been applied to the

163T.H. Donders et al. / Earth-Science Reviews 85 (2007) 161–186
Dutch Pliocene type sections that are further apart andhave more variation in lithology and depositional envi-ronment compared to the study of Ashraf et al. (1997).Although some initial work has been performed to in-vestigate the correlation between local lithology and thepollen assemblages (Zagwijn, 1967), an integrated andtransparent assessment of the existing zonation schemeis lacking. Furthermore, the Neogene continental cli-mate reconstructions as summarized in e.g. Zagwijn andHager (1987) need to be reconsidered since they aredirectly based on the unvalidated continental pollenstages from The Netherlands.
In this study, the Late Miocene and Pliocene zonationof The Netherlands, as defined by Zagwijn (1957, 1959,1960) and De Jong (1982), is tested and revised. Anumerical assessment of the existing zonation is madeby comparing the existing stages to a harmonized data-set containing pollen data from all type localities of theDutch continental Mio- and Pliocene. The data aretested for consistency of the zones both within andbetween the different sections. The dataset consists ofthe original type sections and additional data from rela-tively long boreholes from the SE of The Netherlands,including several new unpublished records produced byTNO Geological Survey of The Netherlands.
A revised lithostratigraphic framework on high spa-tial and temporal resolution has recently become avail-able for the Dutch part of the RVG (Fig. 1A). Based onthis lithostratigraphy the boreholes used in this studycan be correlated independently of the pollen stratigra-phy. In this way the pollen zonation can be further testedfor its validity and applicability both in- and outside theregion of definition. Additionally, the lithostratigraphicaldata are used to better understand the relation betweendepositional setting and pollen assemblage changes.Based on these analyses, recommendations for furtheruse of the Pliocene continental stages are made to betterconstrain their applicability for stratigraphical and pa-laeoclimatic purposes.
2. Data and approach
2.1. Geological setting
2.1.1. TectonicsA complex Cenozoic rift system of approximately
1100 km length extends from the west coast of TheNetherlands through western Germany and southeasternFrance towards the western Mediterranean. The riftformed to accommodate stress from the Alpine orogeny,and (in NW Europe) consists of the Roer Valley Graben(RVG), Lower Rhine Embayment (LRE) and Leine
Grabens (Fig. 1A) (Ziegler, 1994; Geluk et al., 1994,Duin et al., 2006). The RVG rift system is the mainstructural-physiographic unit of the LRE. In The Nether-lands the RVG is separated from the Peel Block (part ofthe Venloër Scholle in Germany) by the Peel BoundaryFault in the NE, and from the Eastern Campine Block bythe Feldbiss Fault in the SW (Van den Berg, 1994; Geluket al., 1994, Duin et al., 2006). The majority of the sitesselected for this study are from a single tectonic unit thathas remained largely undisturbed by faulting. The sitesare positioned along two transects through the RVG (I–I′and II–II′, see Fig. 1B).
Significant differential subsidence started in the LateOligocene across the re-activated Peel Boundary Fault(Geluk et al., 1994). Relatively slow stable subsidenceand warm, humid climate led to widespread peat accu-mulation in the vicinity of the coast from the Burdi-galian to the Serravalian or lower Tortonian in parts ofthe LRE (Lücke et al., 1999; Utescher et al., 2000).
2.1.2. LithostratigraphyBased on comparison with the thickness of interca-
lated marine deposits to the NW, 300 m of peat formedabout 100 m lignite-rich deposits in the LRE, known asthe Ville and Inden Formations. Minor coal seamsformed during the Tortonian–Messinian (Zagwijn andHager, 1987; Lücke et al., 1999). During the lateMiocene and Pliocene the progradation of the palaeo-Rhine delta led to deposition of fluvial continental de-posits overlying the glauconitic marine deposits of theBreda Formation. These fluvial deposits interfinger withand partly overlie the marine Oosterhout and MaassluisFormations, and are divided into three lithostratigraphicunits (seeWeerts et al., 2000;Westerhoff et al., 2003): theKieseloolite (KI), Waalre (WA), and Stamproy (SY)Formations (Fig. 2).
The lowermost sequence of fluvial deposits is as-signed to the KI Formation and consists of colouredmedium- to coarse-grained sands with some gravel. Thesediments are characterised by a high percentage ofquartz (N90%) and a dominance of stable heavy mine-rals (e.g. tourmaline, staurolite, metamorphic minerals).Thick sand bodies alternate regularly with 6–10 m thickclay deposits that contain intercalated peat and brown-coal layers (Zagwijn and Hager, 1987). The larger partof the sediments of the KI is derived through the pre-Rhine and Meuse from the strongly weathered overbur-den of the Palaeozoic massif, which confines the south-ern and southeastern side of the LRE (Fig. 1). The KIcan exceed a thickness of more than 300 m in thesouthern part of the RVG and is approximately of Plio-cene age. However, some of the lower parts of the KI
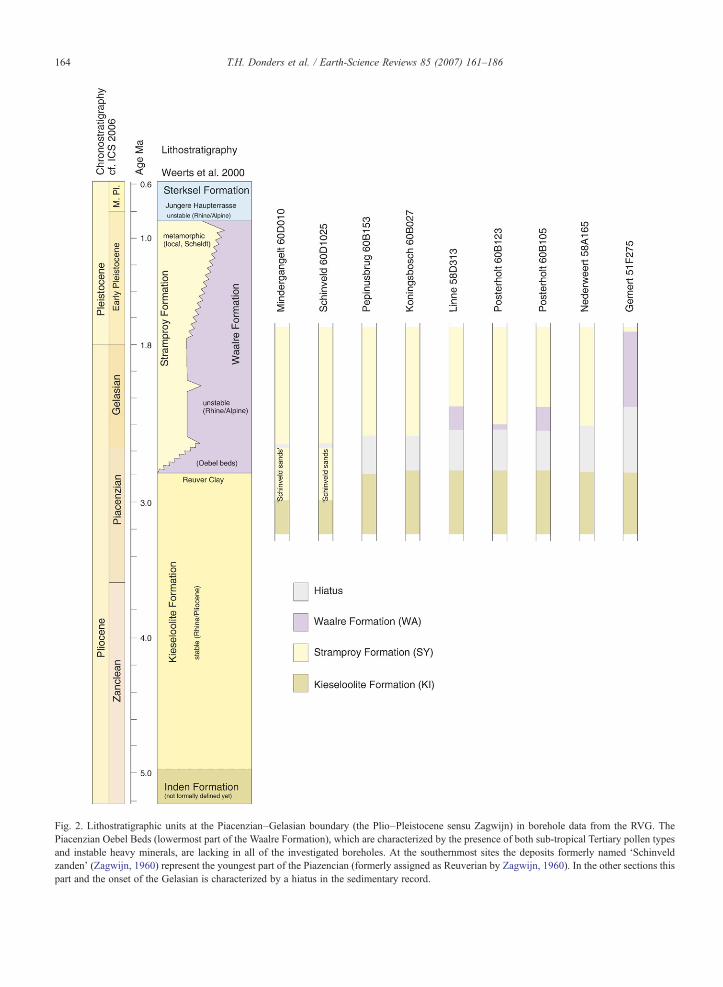
Fig. 2. Lithostratigraphic units at the Piacenzian–Gelasian boundary (the Plio–Pleistocene sensu Zagwijn) in borehole data from the RVG. ThePiacenzian Oebel Beds (lowermost part of the Waalre Formation), which are characterized by the presence of both sub-tropical Tertiary pollen typesand instable heavy minerals, are lacking in all of the investigated boreholes. At the southernmost sites the deposits formerly named ‘Schinveldzanden’ (Zagwijn, 1960) represent the youngest part of the Piazencian (formerly assigned as Reuverian by Zagwijn, 1960). In the other sections thispart and the onset of the Gelasian is characterized by a hiatus in the sedimentary record.
164 T.H. Donders et al. / Earth-Science Reviews 85 (2007) 161–186
165T.H. Donders et al. / Earth-Science Reviews 85 (2007) 161–186
Formation in The Netherlands probably form the north-western continuation of the Miocene Indener Schichtenin Germany (Kemna and Westerhoff, 2007).
The WA Formation consists of a number of stackedfluvial fining-upward cycles. Grain-size variations inthe individual cycles range from coarse gravel-bearingsand in the basal parts to clay in the upper parts. Incontrast to the KI, the heavy mineral content shows a90% dominance of instable minerals (e.g. garnet,epidote, alterite, augite, hornblende). The deposits ofthe WA Formation are supplied by the Rhine–Meusefluvial system. They are Late Pliocene to EarlyPleistocene in age and reach a maximum thicknessof about 100 m in the northern part of the RVG(Weerts et al., 2000; Kemna and Westerhoff, 2007). Inthe study area the WA Formation overlies the depositsof the Kieseloolite Formation.
The SY Formation consists of predominantly fine- tocoarse-grained sand with a relatively high quartz con-tent. Clay layers are less widespread when compared tothe WA Formation and the heavy mineral content isdominantly stable. The deposits were supplied by riversthat formed part of the Late Pliocene and Early Pleis-tocene drainage system of the Scheldt catchment. Theirthickness reaches 100 m in the southern part of the RVG.The SY formation overlies the KI Formation and inter-fingers with theWAFormation. (Westerhoff, unpublisheddata) (Fig 2).
2.2. Late Neogene continental stages in NW Europe
During the 1950s and 1960s a series of clay pits andboreholes within the RVG were investigated by TheNetherlands Geological Survey (RGD, now part ofTNO). Palynological analyses of the sections led to thedefinition of a Neogene pollen zonation, which wascorrelated across the southeastern Netherlands and intowestern Germany (Zagwijn, 1957, 1959, 1960). Subse-quent studies, including internal RGD reports (e.g. DeJong, 1982), have expanded and partly subdivided thiszonation scheme. The zonation was partly based onheavy mineral analyses, although in the definition of thestages by e.g. Zagwijn (1960) these data are not expli-citly used as criteria.
The zonation was primarily based on the relativeabundance changes of thermophilous and sub-tropicalpollen types. Later studies interpreted these abundancechanges as climatic variations based on supposedly re-gional indicator taxa such as Aesculus and Carya (e.g.Zagwijn and Hager, 1987; Zagwijn, 1992). However, noclear criteria for the palaeoclimatic reconstruction meth-od were defined.
Central in the zonation is the pollen abundance of“Tertiary types” (Zagwijn, 1960), of which relict taxapresently occur in warm-temperate to sub-tropical areasof North America and Southeast Asia. These Tertiarypollen are: Sequoia-type, Taxodium-type (includingCunninghamia and Glyptostrobus, Zagwijn, pers. com.),Sciadopitys, Engelhardtia, Aesculus, Nyssa, Symplocos,Liquidambar, Tsuga, Pterocarya, Carya, Eucommia,Ostrya-type, Castanea-type, Rhus and Phellodendron,and also the form taxa Tricolpites librarensis (cf. Litho-carpus), T. microhenrici, Tricolporites edmundi (cf.Mastixia), T. megaexactus (Cyrillaceae), T. exactus(Cyrillaceae) and T. pseudocingulum (see Thomson andPflug, 1953).
Zagwijn (1957, 1959, 1960) distinguished four mainpollen zones for the Late Neogene, approximately equi-valent to the present-day Pliocene of the SE Nether-lands. Already Zagwijn (1960) considered these zonesas of chronostratigraphical significance (Table 1). ThePlio–Pleistocene boundary used in the publications byZagwijn and co-authors (e.g. Zagwijn, 1960) refers tothe current base of the Pliocene Gelasian stage, and notthe GSSP for the base of the Pleistocene at the Vricasection in Southern Italy. The first ‘true’ glacial stage,approximately equivalent to the current base of theGelasian, was formerly proposed as the base of thePleistocene and Quaternary (e.g. Zagwijn, 1992) and isstill in common use in NW Europe (e.g. Heumann andLitt, 2002). This boundary, recently proposed as thebase of the Quaternary sub-Era (Aubry et al., 2005) ishere referred to as the Plio-/Pleistocene boundary sensuZagwijn (s. Z.). We predominantly use the IUGS-approved stage names (e.g. Gelasian, Piacenzian) toavoid confusion with the discussion surrounding thestatus of the Quaternary and possible future lowering ofthe base of the Pleistocene (see discussion in Gradsteinet al., 2007).
Zagwijn (1960) describes and discusses the conti-nental stages (named Praetiglian, Reuverian, Brunssu-mian, and Susterian) from young (uppermost) to old(lowermost), Although somewhat unusual, we heremaintain this reversed order of geological time since itbest reflects the original reasoning and development ofthe zonation. The zones analysed in this study allprecede the Tiglian stage, which is generally consid-ered to be of Gelasian age based on pollen, mammal,mollusc, and heavy mineral stratigraphy (Zagwijn,1960; Gibbard et al., 1991; Kemna and Westerhoff,2007). The exact zonation of the Tiglian stage anddefinition will not be further discussed here in detail.The stages were subdivided into further ‘local’ zones.The sub-zones and their definitions, based on Zagwijn

Table 1Overview of the original (sub-)stage definitions of the Neogene continental deposits of The Netherlands (see also main text). The main type sectionsare printed bold
(sub-)Stage Type section(s) Reference Palynological criteria
Praetiglian Meinweg (Zagwijn, 1957, 1960) Few Tertiary pollen types, ∼50% herbaceous/heathpollen
Reuverian(Stage definition)
Icksberg (Reid and Reid, 1915;Florschütz and VanSomeren, 1950)
(Macrofossils) High Alnus, Pinus Taxodium, Sequoia,Sciadopitys, Liquidambar, Nyssa, Tsuga, Carya,Pterocarya present
Reuverian C Meinweg (Zagwijn, 1959, 1960) Pinus dominance, Ericaceae, AlnusReuverian B Meinweg/Susteren/Icksberg (Zagwijn, 1959, 1960) Alnus and other wetland trees (Taxodium-type,
Nyssa en Sciadopitys) dominate. Sequoia scarce.Nyssa, Sciadopitys, Ulmus and Liquidambar present.
Reuverian A Susteren/Mindergangelt/Brachterwald (Zagwijn, 1959, 1960) Pinus dominance, more Sequoia (max. 15%),Sciadopitys and T.-types (transition from sand to clay)
Brunssumian C Mindergangelt/Bouwberg/Susteren Zagwijn (1960) Large amounts of Sequoia (and Taxodium) (N40%),generally large quantities of Tertiary types
Brunssumian B Mindergangelt/Bouwberg/Susteren Large quantities of Pinus, Ericaceae and Sciatopitys.Less brown coal, and little Sequoia and Tertiary types
Brunsumian A Mindergangelt/Bouwberg/Susteren Large amounts of Sequoia and Taxodium(N40%), relatively more Tertiary types. Symplocosrelatively abundant.
Susterian B Koningsbosch/Susteren/Linne(Sus B)/Schinveld (Sus B)
(Zagwijn, 1959, 1960;De Jong, 1982)
Less Tertiary pollen types, relatively morePinus and more conifers, low values of Fagus.
Susterian A Koningsbosch/Susteren/Linne(Sus A)/Schinveld (Sus A)
Less Tertiary pollen types, more Cathaya,Cedrus, Fagus, Tilia and more deciduous trees.
Presusterian“Linne-beeld”
Linne/Schinveld De Jong (1982) Tertiary pollen types high
166 T.H. Donders et al. / Earth-Science Reviews 85 (2007) 161–186
(1959, 1960 and pers. comm.) and De Jong (1982) aresummarized in Table 1.
2.2.1. PraetiglianA macro-palaeobotanical investigation by Reid and
Reid (1915) marked the first distinction between theTiglian and Reuverian on the basis of a reduction in thenumber of relict sub-tropical plants in the Tegelen clay incomparison to the Reuver clay. Van der Vlerk andFlorschütz (1950) introduced the Praetiglian as com-prising the entire interval between the so-called Tegelenand the Reuver Clay deposits, and considered it a stage ofgradual cooling. Zagwijn (1960) attempted to betterdefine this stage based on the first extended period withhigh abundance of non-arboreal pollen (NAP), followingtypical Pliocene pollen assemblages of the Reuverian,thereby marking the first glacial stage of the Quaternary.
2.2.2. ReuverianThe Reuverian flora of Reid and Reid (1915) based on
plant macrofossils from the Icksberg clay pit North of thePeelrand Fault (Fig. 1B) was later corroborated by pollendata from the same section (Florschütz and Van Some-ren, 1948, 1950). The Reuverian was described in moredetail by Zagwijn (1957, 1959, 1960) in the type sectionsMeinweg, Susteren, and Brachterwald (Fig. 1B) as
having relatively low abundance (10–20%) of Tertiarypollen types. The Meinweg section was also used todefine the Pliocene/Pleistocene transition s. Z. (equiva-lent to present Piacenzian–Gelasian) based on the de-scription of the Praetiglian glacial stage.
2.2.3. BrunssumianThe Brunssumian stage (type section Bouwberg) is
characterized by a high abundance of Sequoia-type(concurrent with abundant Taxodium-type), regularoccurrence of Symplocos, T. edmundi and T. librarensis,and a generally high total sum of Tertiary pollen types,including occasional T. megaexactus, T. microhenrici,and Sapotaceae (Zagwijn, 1960).
2.2.4. SusterianThe Susterian (type section Bouwberg/Susteren,
Zagwijn, 1959, 1960) is characterized by a relativelylow percentage of Tertiary pollen types, dominance ofPinus, Quercus, Alnus, and Ulmus, with increased pre-sence of Pinus haploxylon-type (more frequently thanduring the Brunssumian).
2.2.5. ‘Linne-beeld’A further stage, ‘Linne-beeld’, has not been officially
published, but was first reported in an internal report by
167T.H. Donders et al. / Earth-Science Reviews 85 (2007) 161–186
the Geological Survey of The Netherlands (De Jong,1982). However, the concept has subsequently beenused and referred to in publications (e.g. Zagwijn andHager, 1987; Kürschner et al., 1996). Linne-beeld wascorrelated to the Indener Schichte of the former GermanBrowncoal Formation, and thought to be of upper Mio-cene age on the basis of intercalated sandy marine de-posits (Zagwijn and Hager, 1987). Pollen analysesdemonstrated that the Browncoal Formation (now de-scribed as Ville Formation) is characterised by Engel-hardtia, Sapotaceae, Arecaceae, Symplocos, T. henrici,T. microhenrici, T. villensis, T. edmundi, T. librarensis,T. megaexactus subsp. Bruhlensis, and exactus (Cyrilla-ceae), T. bituitus and T. pseudocingulum. These taxa donot occur or are limited to single grains in the overlying(∼Pliocene) stages (Zagwijn, 1960).
2.2.6. Biostratigraphical eventsBesides the quantitative zonation scheme, a number
of biostratigraphical events (first and last occurrences)were recognized by Zagwijn (1960). These events wereoriginally not used in the stage definition. It was onlylater that the biostratigraphy was expanded for the entirecontinental Neogene of NW Europe (Van der Hammenet al., 1971). The biostratigraphical events mostly con-sisted of last (regional) occurrences (LO) of (sub-)tro-pical relict taxa. In the present study (see below) weselect consistent first and last occurrences and comparethese to biostratigraphical events summarized by Vander Hammen et al. (1971). The most significantbiostratigraphical events of relatively common taxaused by Van der Hammen et al. (1971) are the LOsof T. brühlensis (Cyrilla) at the end of the Susterian,Engelhardtia, T. edmundi and Symplocos in the lateBrunssumian, and of T. librarensis, Sequoia, Taxo-dium, Liquidambar, Nyssa and Sciadopitys at the end ofthe Reuverian.
2.3. Data selection
2.3.1. Pollen dataAll type sections used for the definition of Late
Neogene NW-European continental stages by Zagwijn(1957, 1959, 1960) are included in the present review, aswell as sites that were used to refine or subdivide ex-isting stage concepts (De Jong, 1982). The pollen per-centage data from Bouwberg, Mindergangelt (60D010),Meinweg (58G027), Susteren (60A039), Koningsbosch(60B027), Linne (58D313), and Schinveld (60D1025)(site names follow Zagwijn, 1960; De Jong, 1982; codesare current TNO borehole references) provide the basicdataset with an established zonation to which more
recent and new borehole data from Posterholt (60B0105and 60B0123), Nederweert (58A0166), Pepinusbrug(60B0153), and Gemert (51F0275) are compared. Al-though more pollen records are available (Fig. 1B), weprefer focusing on relatively long continuous and den-sely sampled sections.
Several of the sub-stages, such as the BrunssumianB, were originally defined and recognized based on afew or even on single samples (Zagwijn, 1960). Usingnew high-resolution pollen data from a continuous coreat Pepinusbrug, the variability within single (sub-)stagesis investigated. The Gemert borehole further to the NWis included to test correlations for slightly more distantlocations (Fig. 1A and B). This core consists of marinesediments of the Oosterhout Formation, that are overlainby fluvial deposits of the KI and WA Formations(Fig. 2). Both Posterholt boreholes are located close toeach other and have similar terminal depths, allowing toassess the short-distance (i.e. local) variability in thepollen assemblage patterns.
2.3.2. Lithostratigraphic dataWith the exception of the Gemert borehole, all sites
lie within a geographically restricted part of the RVG ofapprox. 25×40 km (Fig. 1B). Detailed regional geo-hydrological mapping of clay deposits in the KI, WA,and SY Formations has provided lithostratigraphiccorrelations independent of the pollen data. Lateralcorrelation of the clay deposits is based on the localtectonic framework, especially the orientation of tilt foreach fault-bounded structural unit, and comparison ofwell-log data, lithology and mineralogical characteris-tics (Westerhoff, unpublished data). Clay deposits havebeen numbered from the top down for each formation(Figs. 4 and 6), resulting in a highly consistent view onthe distribution and superposition of the discernedlithostratigraphic units (see also the DINOmap pages onwww.dinoloket.nl). We deliberately do not use former‘lithostratigraphic’ units like Brunssum Clay and ReuverClay (cf. Zagwijn, 1960; Doppert et al., 1975) since theirdistinction is based on pollen content rather than onlithostratigraphic concepts.
2.4. Data analysis
All pollen percentage data from the selected sectionswere combined into a single database. The nomencla-ture was harmonized whereby some taxa were grouped(e.g. Cupressaceae, Pinaceae, Quercus, Salix, Ericales)in a few sections to have the same taxonomic resolutionin all the profiles. Taxa occurring in less than two sites,or having less than 5 occurrences at any site, as well as
168 T.H. Donders et al. / Earth-Science Reviews 85 (2007) 161–186
samples with very low (b50) total pollen counts, werenot considered in the numerical analyses.
The pollen sum is based on total trees and herbs,including Poaceae but excluding Cyperaceae and otherlittoral or aquatic taxa. Clearly reworked (e.g. Classo-pollis) and marine or algal palynomorphs were excludedfrom the pollen sum. Since the depositional settingwithin and between the different sections is highly var-iable it is impossible to define a strictly local vegetation.Therefore, we maintain a pollen sum containing pollenfrom all forms of vascular land plants even though insome intervals local vegetation might be represented.Zagwijn (1960 and later publications) excluded Cupres-saceae, Myricaceae, and non-anemophilous taxa fromthe pollen sum. Cupressaceae and Myricaceae pollenwere originally excluded because of possible ambiguityin identification. However, the same uncertainty appliesalso to Taxodium and Sequoia, which were included inthe pollen sum used by Zagwijn (1960). Because theexclusion of Cupressaceae, Myricaceae, and non-ane-mophilous taxa would strongly bias the data. Therefore,we included these taxa in the pollen sum. However,since an unambiguous identification of these pollentypes was not always possible, the data should be treatedwith caution.
Due to the large variations in the quality of the sedi-mentological descriptions, lithological data was simpli-fied and entered as presence/absence of five depositcategories: coarse sand, fine sand, clay, peat (includingbrown coal), and humic (organic-rich) soil.
2.5. Numerical approach
To assess the variation and trends in the harmo-nized dataset a Correspondence Analysis (CA) wasperformed with square-root transformed percentagepollen data and downweighting of rare taxa, using thesoftware CANOCO (Ver. 4.5; Ter Braak and Smilauer,2002). The ordination is based on the data from theoriginal type sections (Zagwijn 1957, 1959, 1960; DeJong, 1982), with all other data points being treated aspassive samples. A unimodal model was chosen sincethe gradient length (3.2) exceeded 3 SD (Ter Braakand Smilauer, 2002). In different biplots, the CAresults were subsequently ordered (labeled) accordingto site, original pollen zone, or new lithologicalzonation (see (Figs. 7, 8, 12), respectively). Toprovide a summary curve for each individual site,new and independent zonations were made bycomparing the output of CONSLINK and CONISSclustering techniques (Birks and Gordon, 1985;Grimm, 1987) as implemented in the program ZONE
(Lotter and Juggins, 1991). Zone boundaries that wereconsistent between both methods were applied to theindividual sites. An average CA score was calculated forall samples within each individual zone, and thesecentroid values were plotted in stratigraphical order astrajectories for each site (Fig. 10). These trajectoriesrepresent a summary of the pollen-compositionalchanges within each site with respect to all other sitesinvestigated. The relation between depositional settingand vegetation changes was investigated by performing aCanonical Correspondence Analysis (CCA) to assesshow much of the variance in the pollen data is explainedby lithological factors.
3. Data synthesis
3.1. Integrating bio- and lithostratigraphy
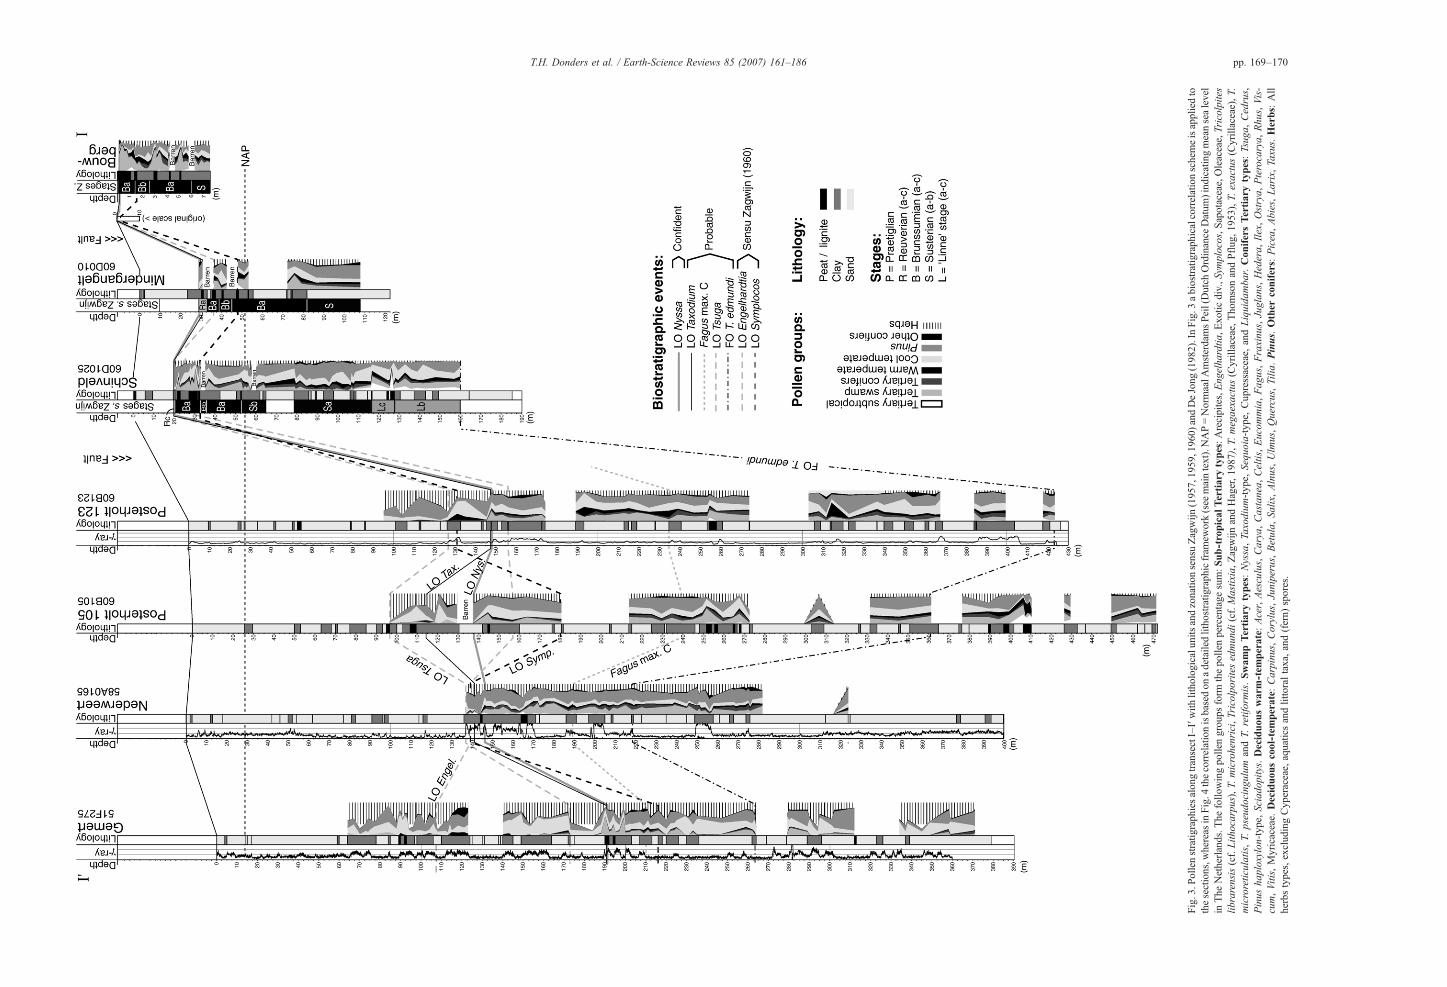
The two transects through the RVG and adjacentareas as shown in Figs. 3–6, summarize the availablelithological (main lithological units and gamma-raylogs) and palynological information of twelve sections.The pollen assemblages, represented by eight ecologicalgroups (see caption Fig. 3), are expressed by relativeabundance changes of taxa within the pollen sum. Theoriginal zonation proposed by Zagwijn (1957, 1959,1960) and De Jong (1982) is given for the profiles whereit was defined or applied (Figs. 3–6). The profiles arecorrelated in two different ways. First, a new biostrati-graphical zonation is made based on consistent first andlast occurrences of taxa and three high-abundance peaksof Fagus pollen (Figs. 3 and 5). The relatively fewbiostratigraphical events are limited to those occurringin the same stratigraphical order in every section. How-ever, these events also occur at the top or bottom sam-ples of some sections, and possibly do not represent thetrue first or last occurrences of taxa at these sites. Forcomparison, two important biostratigraphical markersused by Zagwijn (1960) and Van der Hammen et al.(1971) (i.e. the last occurrences of Engelhardtia in thebase Susterian and Symplocos in the top Brunssumian)are included to assess their validity. Second, both pollenprofiles are correlated by applying the lithostratigraphi-cal framework (see paragraph 2.1.2.) to the sectionsconcerned (Figs. 4 and 6). Correlation of the lithostrati-graphy with the Meinweg and Mindergangelt sectionshas not been possible due to faulting and the distance tothe central RVG. The remaining sections were correlat-ed in considerable detail.
The comparison of both correlation methodsreveals several discrepancies between the bio- andlithostratigraphy of the RVG sections (Figs. 3–6). The
pp. 169–170T.H. Donders et al. / Earth-Science Reviews 85 (2007) 161–186
Fig.3.P
ollenstratig
raphiesalongtransectI–I′with
lithologicalunitsandzonatio
nsensuZagwijn
(1957,1959,1960)
andDeJong
(1982).InFig.3
abiostratigraphicalcorrelationschemeisappliedto
thesections,w
hereas
inFig.4
thecorrelationisbasedon
adetailedlithostratig
raphicfram
ework(see
maintext).NAP=NormaalA
msterdamsPeil(Dutch
Ordinance
Datum
)indicatingmeansealevel
inThe
Netherlands.T
hefollo
wingpollengroups
form
thepollenpercentage
sum:S
ub-tropicalT
ertiarytypes:Arecipites,Eng
elha
rdtia
,Exo
ticdiv.,S
ymplocos,S
apotaceae,Oleaceae,Tricolpites
librarensis(cf.Lith
ocarpu
s),T
.microhenrici,Tricolpo
ritesedmundi
(cf.Mastixia,Z
agwijn
andHager,1
987),T
.megaexactus
(Cyrillaceae,ThomsonandPflug,1
953),T
.exactus
(Cyrillaceae),T
.microreticulatis,T.
pseudo
cing
ulum
andT.
retiformis.Sw
ampTertiarytypes:
Nyssa,Taxodium
-type,
Sequ
oia-type,Cupressaceae,
andLiquida
mbar.Con
ifersTertiarytypes:
Tsug
a,Cedrus,
Pinus
haploxylon
-typ
e,Sciado
pitys.Deciduo
uswarm-tem
perate:Acer,Aesculus,Carya,Castanea,
Celtis,Eucom
mia,Fag
us,Fraxinu
s,Juglan
s,Hedera,
Ilex,Ostrya,
Pterocarya,
Rhu
s,Vis-
cum,Vitis,Myricaceae.
Deciduo
uscool-tem
perate:Carpinu
s,Corylus,Juniperus,Betula,
Salix,Alnus,Ulmus,Quercus,Tilia
.Pinus.Other
conifers:Picea,Abies,Larix,Taxus.Herbs:All
herbstypes,excludingCyperaceae,aquaticsandlittoraltaxa,and(fern)
spores.

pp. 171–172 T.H. Donders et al. / Earth-Science Reviews 85 (2007) 161–186
Fig.4.P
ollenstratig
raphiesalongtransectI–I′with
lithologicalunitsandzonatio
nsensuZagwijn
(1957,1959,1960)
andDeJong
(1982).InFig.3
abiostratigraphicalcorrelationschemeisappliedto
thesections,w
hereas
inFig.4
thecorrelationisbasedon
adetailedlithostratig
raphicfram
ework(see
maintext).NAP=NormaalA
msterdamsPeil(Dutch
Ordinance
Datum
)ind
icatingmeansealevel
inThe
Netherlands.T
hefollo
wingpollengroups
form
thepollenpercentage
sum:S
ub-tropicalT
ertiarytypes:Arecipites,Engelha
rdtia
,Exotic
div.,S
ymplocos,S
apotaceae,Oleaceae,Tricolpites
librarensis(cf.Lith
ocarpu
s),T
.microhenrici,Tricolpo
ritesedmundi
(cf.Mastixia,Z
agwijn
andHager,1
987),T
.megaexactus
(Cyrillaceae,ThomsonandPflug,1
953),T.
exactus(Cyrillaceae),T
.microreticulatis,T.
pseudo
cing
ulum
andT.
retiformis.Sw
ampTertiarytypes:
Nyssa,Taxodium
-typ
e,Sequ
oia-type,Cupressaceae,
andLiquida
mbar.Con
ifersTertiarytypes:
Tsug
a,Cedrus,
Pinus
haploxylon
-typ
e,Sciado
pitys.Deciduo
uswarm-tem
perate:Acer,Aesculus,Carya,Castanea,
Celtis,Eucom
mia,Fag
us,Fraxinu
s,Juglan
s,Hedera,
Ilex,Ostrya,
Pterocarya,
Rhu
s,Vis-
cum,Vitis,Myricaceae.
Deciduo
uscool-tem
perate:Carpinus,Corylus,Juniperus,Betula,
Salix,Alnus,Ulmus,Quercus,Tilia
.Pinus.Other
conifers:Picea,Abies,Larix,Taxus.Herbs:All
herbstypes,excludingCyperaceae,aquaticsandlittoraltaxa,and(fern)
spores.

pp. 173–174T.H. Donders et al. / Earth-Science Reviews 85 (2007) 161–186
Fig.5.P
ollenstratig
raphiesalongtransectII–II′w
ithlithologicalunitsandzonatio
nsensuZagwijn
(1957,1959,1960)
andDeJong
(1982).InFig.5
abiostratigraphicalcorrelationschemeisapplied
tothesections,while
inFig.6thecorrelationisbasedon
adetailedlithostratig
raphic
fram
ework(see
maintext).The
pollenassemblagegroups
arethesameas
definedin
Figs.3and4.

pp. 175–176 T.H. Donders et al. / Earth-Science Reviews 85 (2007) 161–186
Fig.6.P
ollenstratig
raphiesalongtransectII–II′w
ithlithologicalunitsandzonatio
nsensuZagwijn
(1957,1959,1960)
andDeJong
(1982).InFig.5
abiostratigraphicalcorrelationschemeisapplied
tothesections,while
inFig.6
thecorrelationisbasedon
adetailedlithostratig
raphic
fram
ework(see
maintext).The
pollenassemblagegroups
arethesameas
definedin
Figs.3and4.
177T.H. Donders et al. / Earth-Science Reviews 85 (2007) 161–186
most consistent biostratigraphic event is the lastoccurrence (LO) of Nyssa within clay KI-c1 (at thetop of the KI Formation) in all sections. This lastoccurrence is nearly coincident with the LO of Taxo-dium-type, but the latter has several occurrences inclays above KI-c1 (Posterholt 60B0105 and Susteren).Both taxa represent relatively warm, humid swampconditions, also represented by the ‘Tertiary swamp’group in Figs. 3–6, and presently occur in the warm-temperate to sub-tropical SE United States (Thompsonet al., 2000). A second relatively consistent event isthe Fagus maximum C, which follows the lithostrati-graphic correlations between Gemert, Nederweert,Linne, Posterholt (60B0105 and 60B0123), andPepinusbrug, although it shows some offset inKoningsbosch. The LOs of Engelhardtia and Sym-plocos do not provide any consistent correlationpatterns and their order is mostly opposite to thatproposed by Zagwijn (1960). The distribution patternsof Engelhardtia and Symplocos disagree with theother biostratigraphical events. Moreover, their gener-ally low and discontinuous occurrence hampers thedistinction between real occurrence and potentiallyreworked material. The remaining biostratigraphicalcorrelations are reasonably consistent, although theydisagree with the lithostratigraphy in several cases(e.g. T. edmundi). The biostratigraphy is generallycomplicated by low, discontinuous abundances (e.g.Tsuga) and first/last occurrence in the lowermost/uppermost pollen samples, respectively.
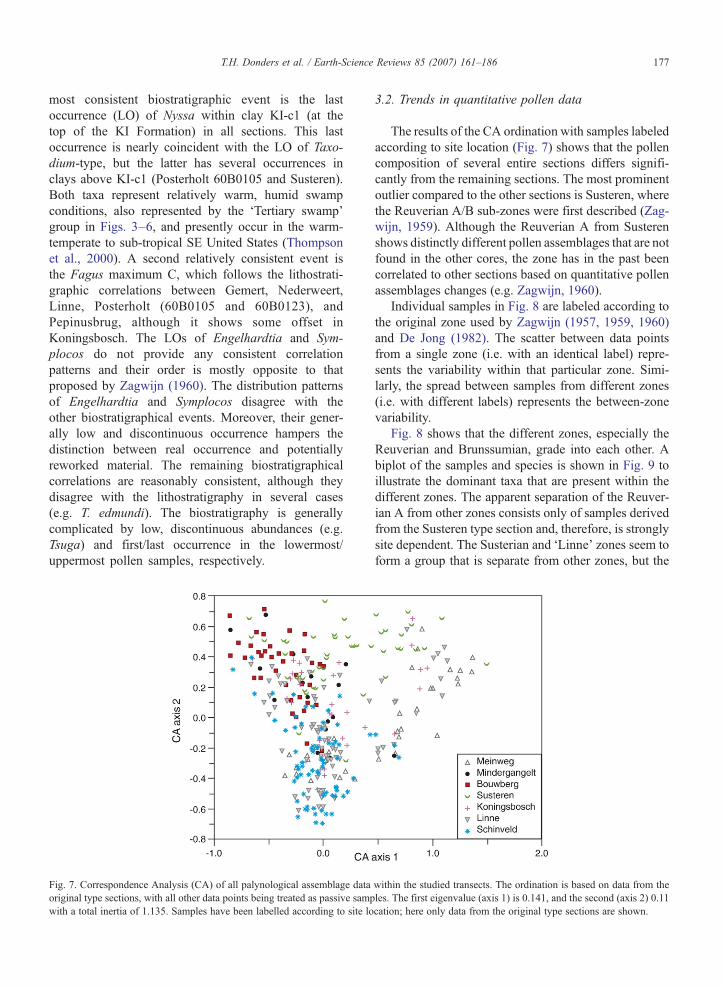
Fig. 7. Correspondence Analysis (CA) of all palynological assemblage dataoriginal type sections, with all other data points being treated as passive sampwith a total inertia of 1.135. Samples have been labelled according to site lo
3.2. Trends in quantitative pollen data
The results of the CA ordination with samples labeledaccording to site location (Fig. 7) shows that the pollencomposition of several entire sections differs signifi-cantly from the remaining sections. The most prominentoutlier compared to the other sections is Susteren, wherethe Reuverian A/B sub-zones were first described (Zag-wijn, 1959). Although the Reuverian A from Susterenshows distinctly different pollen assemblages that are notfound in the other cores, the zone has in the past beencorrelated to other sections based on quantitative pollenassemblages changes (e.g. Zagwijn, 1960).
Individual samples in Fig. 8 are labeled according tothe original zone used by Zagwijn (1957, 1959, 1960)and De Jong (1982). The scatter between data pointsfrom a single zone (i.e. with an identical label) repre-sents the variability within that particular zone. Simi-larly, the spread between samples from different zones(i.e. with different labels) represents the between-zonevariability.
Fig. 8 shows that the different zones, especially theReuverian and Brunssumian, grade into each other. Abiplot of the samples and species is shown in Fig. 9 toillustrate the dominant taxa that are present within thedifferent zones. The apparent separation of the Reuver-ian A from other zones consists only of samples derivedfrom the Susteren type section and, therefore, is stronglysite dependent. The Susterian and ‘Linne’ zones seem toform a group that is separate from other zones, but the
within the studied transects. The ordination is based on data from theles. The first eigenvalue (axis 1) is 0.141, and the second (axis 2) 0.11cation; here only data from the original type sections are shown.

Fig. 8. Correspondence Analysis (CA) as described in Fig. 7. Samples have been labelled according to original (sub-)stage sensu Zagwijn (1959,1960) and De Jong (1982) to assess the spread within and between the original zones. The dashed line delineates the approximate spread taken up bythe pollen sample scores (i.e. sample space) for comparison with the species scores in Fig. 9.
178 T.H. Donders et al. / Earth-Science Reviews 85 (2007) 161–186
distinction is not complete and overlaps slightly withReuverian/Brunssumian samples. The clearest separa-tion is between the Praetiglian and the remaining zones,although also here an overlap with the Reuverian A isvisible. The sub-zones of the Brunssumian have thegreatest overlap and form a single group, which impliesthat the Brunssumian A, B, and C cannot be numerically
Fig. 9. Correspondence Analysis (CA) as described in Fig. 7, showing specFig. 8). Selected important species (black circles) have been labelled to ass(Figs. 7, 8, 10 and 12).
distinguished in the pollen assemblages. Similar to theReuverian A, the Brunssumian A and B occupy a verylarge part of the total spread of data in Fig. 8, whichpoints to large variation in pollen assemblages betweenthe different localities.
In order to include all available data in this zonationanalysis, the CA results are summarized in Fig. 10 by a
ies scores in relation to the sample space (shaded area, for details seeess their distribution with respect to the sample distribution shown in

179T.H. Donders et al. / Earth-Science Reviews 85 (2007) 161–186
Fig. 10. Correspondence Analysis (CA) as described in Fig. 7. New zones have been defined for all sections by applying reproducable numericalzonation methods described in the main text. CA samples scores have been averaged for each zone to provide a summary trajectory curve for eachsection within transects I–I′ and II–II′.
few data points for each section. An individual datapoint in Fig. 10 represents the mean composition (cen-troid) for a newly defined zone within any given section.The new zonation is generated for each section indi-vidually by reproducible methods (see Section 2.5.), andused to calculate the centroid CA scores for each zonewithin a section. If connected, these average scores formtrajectories that represent a summary of the variation foreach individual section in stratigraphical order (see e.g.Birks and Gordon, 1985; Ammann et al., 1993). Similarpollen successions are expected to show comparabletrajectories in the CA plots.
A common feature in all the trajectories is the clearlydifferent values towards the top of the sections (labeled‘T’ in Fig. 8), which correspond to samples above claylayer KI-c1 and the LO of Nyssa. This level is alsocharacterized by general strong decreases in Neogene(swamp) taxa such as Taxodium, Sequoia, and Liqui-dambar. Several Miocene pollen types, which are com-mon in the Miocene Ville and Inden Formations ofGermany are found: Arecipites, Engelhardtia, Symplo-cos, Sciadopitys, T. librarensis (cf. Lithocarpus),T.microhenrici,T. edmundi (cf.Mastixia),T.megaexactus(Cyrillaceae), T. exactus (Cyrillaceae), T. microreticulatis,T. pseudocingulum, and T. retiformis (e.g. Von der Brelieand Rein, 1954; Huhn et al., 1997). Zones with a highcontent of these typical Miocene pollen types show somegrouping in the bottom left of the plot (labeled ‘m’ inFig. 8).
The best overall correspondence concerning the gen-eral trend is between Posterholt boreholes 60B0105 and60B0123 that are located only ∼4 km apart, althoughthe lowermost zone of Posterholt 60B0123 does notcontain the characteristic Miocene flora and thus con-trasts with Posterholt 60B0105. This contrast is possiblydue to local differences in subsidence rate. A relativelygood correspondence is also found between Schinveldand Posterholt 60B0105, but the former does not containsamples above clay KI-c3 and, therefore, does not con-firm the upper part of the trend. The Bouwberg dataclearly deviate from all other sections. Even though allBouwberg samples are within clay KI-c1, which is alsopresent in most other sections (Figs. 4 and 6), theBouwberg pollen assemblages deviate since they con-tain a particularly high amount of Neogene swamp taxa(compare spread of species in Fig. 9 relative to theBouwberg trajectory in Fig. 10). In general, the trajec-tories in Fig. 10 show limited correspondence and thespread between sections is large and comparable inmagnitude to the spread within the stratigraphies, whichis indicative of significant local variability.
3.3. Depositional bias on pollen assemblages
The lithological units are indicative of the past depo-sitional setting. The lignite and humic clays represent low-energy swamp settings with Tertiary swamp taxa clearlymore abundant in these levels (Figs. 3–6). The CCA
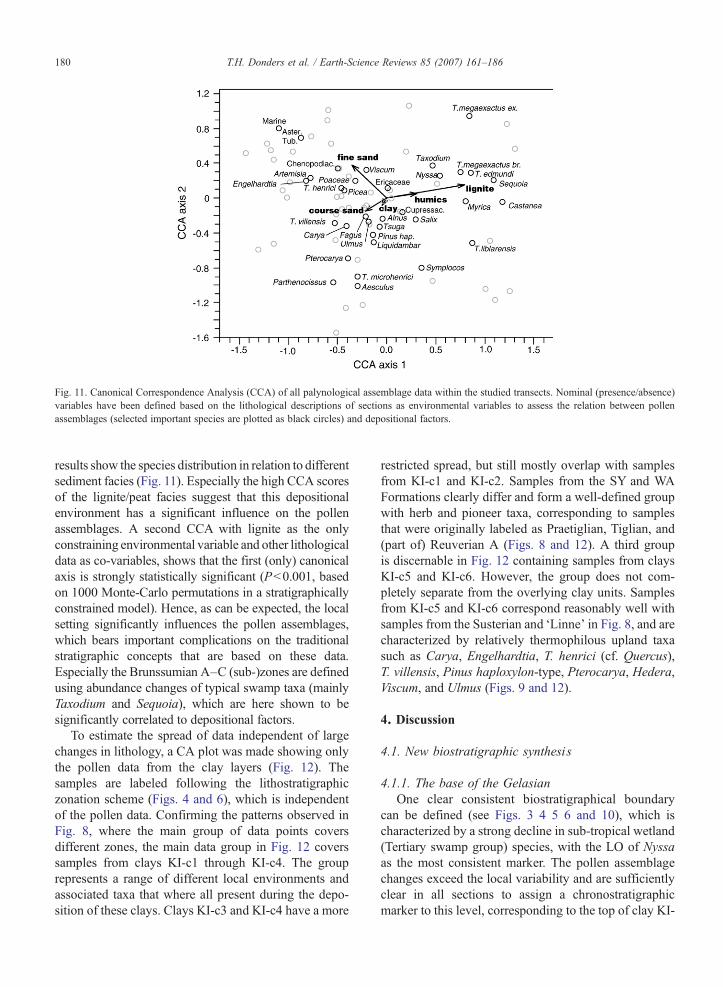
Fig. 11. Canonical Correspondence Analysis (CCA) of all palynological assemblage data within the studied transects. Nominal (presence/absence)variables have been defined based on the lithological descriptions of sections as environmental variables to assess the relation between pollenassemblages (selected important species are plotted as black circles) and depositional factors.
180 T.H. Donders et al. / Earth-Science Reviews 85 (2007) 161–186
results show the species distribution in relation to differentsediment facies (Fig. 11). Especially the high CCA scoresof the lignite/peat facies suggest that this depositionalenvironment has a significant influence on the pollenassemblages. A second CCA with lignite as the onlyconstraining environmental variable and other lithologicaldata as co-variables, shows that the first (only) canonicalaxis is strongly statistically significant (Pb0.001, basedon 1000 Monte-Carlo permutations in a stratigraphicallyconstrained model). Hence, as can be expected, the localsetting significantly influences the pollen assemblages,which bears important complications on the traditionalstratigraphic concepts that are based on these data.Especially the Brunssumian A–C (sub-)zones are definedusing abundance changes of typical swamp taxa (mainlyTaxodium and Sequoia), which are here shown to besignificantly correlated to depositional factors.
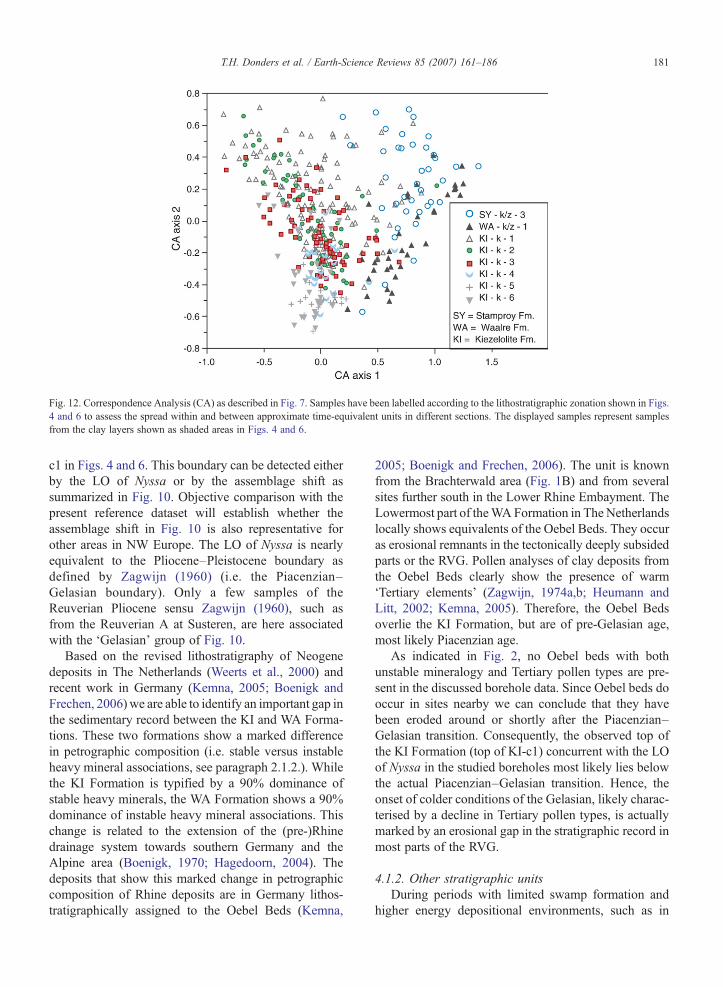
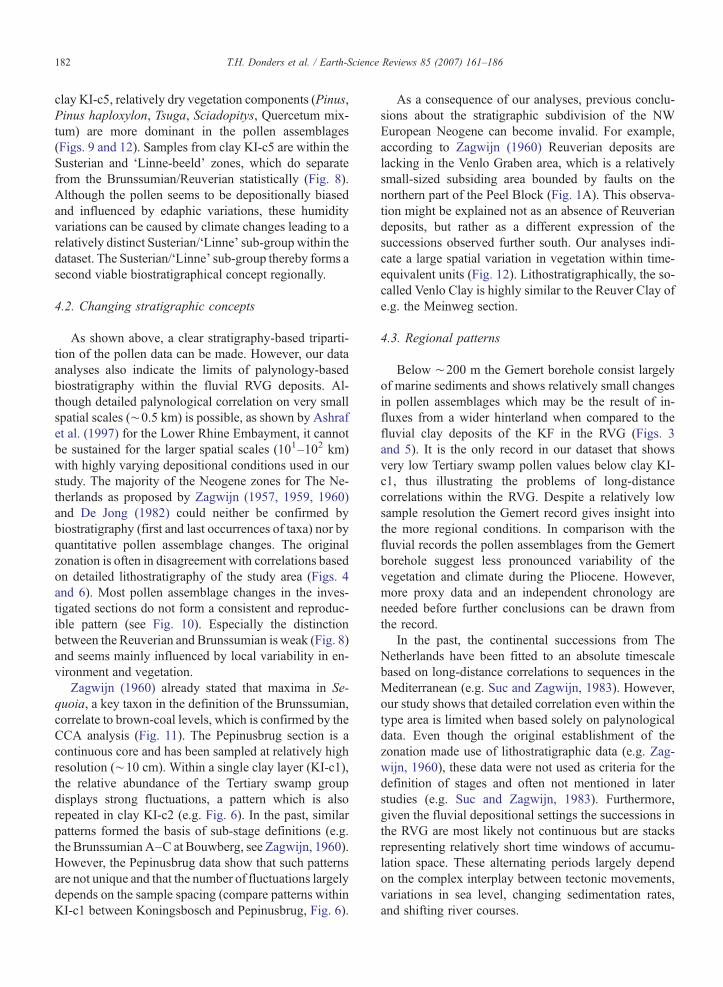
To estimate the spread of data independent of largechanges in lithology, a CA plot was made showing onlythe pollen data from the clay layers (Fig. 12). Thesamples are labeled following the lithostratigraphiczonation scheme (Figs. 4 and 6), which is independentof the pollen data. Confirming the patterns observed inFig. 8, where the main group of data points coversdifferent zones, the main data group in Fig. 12 coverssamples from clays KI-c1 through KI-c4. The grouprepresents a range of different local environments andassociated taxa that where all present during the depo-sition of these clays. Clays KI-c3 and KI-c4 have a more
restricted spread, but still mostly overlap with samplesfrom KI-c1 and KI-c2. Samples from the SY and WAFormations clearly differ and form a well-defined groupwith herb and pioneer taxa, corresponding to samplesthat were originally labeled as Praetiglian, Tiglian, and(part of) Reuverian A (Figs. 8 and 12). A third groupis discernable in Fig. 12 containing samples from claysKI-c5 and KI-c6. However, the group does not com-pletely separate from the overlying clay units. Samplesfrom KI-c5 and KI-c6 correspond reasonably well withsamples from the Susterian and ‘Linne’ in Fig. 8, and arecharacterized by relatively thermophilous upland taxasuch as Carya, Engelhardtia, T. henrici (cf. Quercus),T. villensis, Pinus haploxylon-type, Pterocarya, Hedera,Viscum, and Ulmus (Figs. 9 and 12).
4. Discussion
4.1. New biostratigraphic synthesis
4.1.1. The base of the GelasianOne clear consistent biostratigraphical boundary
can be defined (see Figs. 3 4 5 6 and 10), which ischaracterized by a strong decline in sub-tropical wetland(Tertiary swamp group) species, with the LO of Nyssaas the most consistent marker. The pollen assemblagechanges exceed the local variability and are sufficientlyclear in all sections to assign a chronostratigraphicmarker to this level, corresponding to the top of clay KI-
181T.H. Donders et al. / Earth-Science Reviews 85 (2007) 161–186
Fig. 12. Correspondence Analysis (CA) as described in Fig. 7. Samples have been labelled according to the lithostratigraphic zonation shown in Figs.4 and 6 to assess the spread within and between approximate time-equivalent units in different sections. The displayed samples represent samplesfrom the clay layers shown as shaded areas in Figs. 4 and 6.
c1 in Figs. 4 and 6. This boundary can be detected eitherby the LO of Nyssa or by the assemblage shift assummarized in Fig. 10. Objective comparison with thepresent reference dataset will establish whether theassemblage shift in Fig. 10 is also representative forother areas in NW Europe. The LO of Nyssa is nearlyequivalent to the Pliocene–Pleistocene boundary asdefined by Zagwijn (1960) (i.e. the Piacenzian–Gelasian boundary). Only a few samples of theReuverian Pliocene sensu Zagwijn (1960), such asfrom the Reuverian A at Susteren, are here associatedwith the ‘Gelasian’ group of Fig. 10.
Based on the revised lithostratigraphy of Neogenedeposits in The Netherlands (Weerts et al., 2000) andrecent work in Germany (Kemna, 2005; Boenigk andFrechen, 2006)we are able to identify an important gap inthe sedimentary record between the KI and WA Forma-tions. These two formations show a marked differencein petrographic composition (i.e. stable versus instableheavy mineral associations, see paragraph 2.1.2.). Whilethe KI Formation is typified by a 90% dominance ofstable heavy minerals, the WA Formation shows a 90%dominance of instable heavy mineral associations. Thischange is related to the extension of the (pre-)Rhinedrainage system towards southern Germany and theAlpine area (Boenigk, 1970; Hagedoorn, 2004). Thedeposits that show this marked change in petrographiccomposition of Rhine deposits are in Germany lithos-tratigraphically assigned to the Oebel Beds (Kemna,
2005; Boenigk and Frechen, 2006). The unit is knownfrom the Brachterwald area (Fig. 1B) and from severalsites further south in the Lower Rhine Embayment. TheLowermost part of theWAFormation in TheNetherlandslocally shows equivalents of the Oebel Beds. They occuras erosional remnants in the tectonically deeply subsidedparts or the RVG. Pollen analyses of clay deposits fromthe Oebel Beds clearly show the presence of warm‘Tertiary elements’ (Zagwijn, 1974a,b; Heumann andLitt, 2002; Kemna, 2005). Therefore, the Oebel Bedsoverlie the KI Formation, but are of pre-Gelasian age,most likely Piacenzian age.
As indicated in Fig. 2, no Oebel beds with bothunstable mineralogy and Tertiary pollen types are pre-sent in the discussed borehole data. Since Oebel beds dooccur in sites nearby we can conclude that they havebeen eroded around or shortly after the Piacenzian–Gelasian transition. Consequently, the observed top ofthe KI Formation (top of KI-c1) concurrent with the LOof Nyssa in the studied boreholes most likely lies belowthe actual Piacenzian–Gelasian transition. Hence, theonset of colder conditions of the Gelasian, likely charac-terised by a decline in Tertiary pollen types, is actuallymarked by an erosional gap in the stratigraphic record inmost parts of the RVG.
4.1.2. Other stratigraphic unitsDuring periods with limited swamp formation and
higher energy depositional environments, such as in
182 T.H. Donders et al. / Earth-Science Reviews 85 (2007) 161–186
clay KI-c5, relatively dry vegetation components (Pinus,Pinus haploxylon, Tsuga, Sciadopitys, Quercetum mix-tum) are more dominant in the pollen assemblages(Figs. 9 and 12). Samples from clay KI-c5 are within theSusterian and ‘Linne-beeld’ zones, which do separatefrom the Brunssumian/Reuverian statistically (Fig. 8).Although the pollen seems to be depositionally biasedand influenced by edaphic variations, these humidityvariations can be caused by climate changes leading to arelatively distinct Susterian/‘Linne’ sub-group within thedataset. The Susterian/‘Linne’ sub-group thereby forms asecond viable biostratigraphical concept regionally.
4.2. Changing stratigraphic concepts
As shown above, a clear stratigraphy-based triparti-tion of the pollen data can be made. However, our dataanalyses also indicate the limits of palynology-basedbiostratigraphy within the fluvial RVG deposits. Al-though detailed palynological correlation on very smallspatial scales (∼0.5 km) is possible, as shown by Ashrafet al. (1997) for the Lower Rhine Embayment, it cannotbe sustained for the larger spatial scales (101–102 km)with highly varying depositional conditions used in ourstudy. The majority of the Neogene zones for The Ne-therlands as proposed by Zagwijn (1957, 1959, 1960)and De Jong (1982) could neither be confirmed bybiostratigraphy (first and last occurrences of taxa) nor byquantitative pollen assemblage changes. The originalzonation is often in disagreement with correlations basedon detailed lithostratigraphy of the study area (Figs. 4and 6). Most pollen assemblage changes in the inves-tigated sections do not form a consistent and reproduc-ible pattern (see Fig. 10). Especially the distinctionbetween the Reuverian and Brunssumian is weak (Fig. 8)and seems mainly influenced by local variability in en-vironment and vegetation.
Zagwijn (1960) already stated that maxima in Se-quoia, a key taxon in the definition of the Brunssumian,correlate to brown-coal levels, which is confirmed by theCCA analysis (Fig. 11). The Pepinusbrug section is acontinuous core and has been sampled at relatively highresolution (∼10 cm). Within a single clay layer (KI-c1),the relative abundance of the Tertiary swamp groupdisplays strong fluctuations, a pattern which is alsorepeated in clay KI-c2 (e.g. Fig. 6). In the past, similarpatterns formed the basis of sub-stage definitions (e.g.the BrunssumianA–C at Bouwberg, see Zagwijn, 1960).However, the Pepinusbrug data show that such patternsare not unique and that the number of fluctuations largelydepends on the sample spacing (compare patterns withinKI-c1 between Koningsbosch and Pepinusbrug, Fig. 6).
As a consequence of our analyses, previous conclu-sions about the stratigraphic subdivision of the NWEuropean Neogene can become invalid. For example,according to Zagwijn (1960) Reuverian deposits arelacking in the Venlo Graben area, which is a relativelysmall-sized subsiding area bounded by faults on thenorthern part of the Peel Block (Fig. 1A). This observa-tion might be explained not as an absence of Reuveriandeposits, but rather as a different expression of thesuccessions observed further south. Our analyses indi-cate a large spatial variation in vegetation within time-equivalent units (Fig. 12). Lithostratigraphically, the so-called Venlo Clay is highly similar to the Reuver Clay ofe.g. the Meinweg section.
4.3. Regional patterns
Below ∼200 m the Gemert borehole consist largelyof marine sediments and shows relatively small changesin pollen assemblages which may be the result of in-fluxes from a wider hinterland when compared to thefluvial clay deposits of the KF in the RVG (Figs. 3and 5). It is the only record in our dataset that showsvery low Tertiary swamp pollen values below clay KI-c1, thus illustrating the problems of long-distancecorrelations within the RVG. Despite a relatively lowsample resolution the Gemert record gives insight intothe more regional conditions. In comparison with thefluvial records the pollen assemblages from the Gemertborehole suggest less pronounced variability of thevegetation and climate during the Pliocene. However,more proxy data and an independent chronology areneeded before further conclusions can be drawn fromthe record.
In the past, the continental successions from TheNetherlands have been fitted to an absolute timescalebased on long-distance correlations to sequences in theMediterranean (e.g. Suc and Zagwijn, 1983). However,our study shows that detailed correlation even within thetype area is limited when based solely on palynologicaldata. Even though the original establishment of thezonation made use of lithostratigraphic data (e.g. Zag-wijn, 1960), these data were not used as criteria for thedefinition of stages and often not mentioned in laterstudies (e.g. Suc and Zagwijn, 1983). Furthermore,given the fluvial depositional settings the successions inthe RVG are most likely not continuous but are stacksrepresenting relatively short time windows of accumu-lation space. These alternating periods largely dependon the complex interplay between tectonic movements,variations in sea level, changing sedimentation rates,and shifting river courses.

183T.H. Donders et al. / Earth-Science Reviews 85 (2007) 161–186
4.4. Palaeoclimatological concepts
Since our results show that the general chronologicalcontrol of the continental sediments in the RVG is weakand local variability is high, the pollen-based palaeo-temperature curves based on the fluviatile RVGdeposits (e.g. Van der Hammen et al., 1971; Zagwijnand Hager, 1987) must be regarded as largely unreliableas a sound basis for detailed comparison. Thepalaeoclimatic interpretation is in part questionablesince changes have been mostly interpreted in terms oftemperature (e.g. Zagwijn and Hager, 1987) whilechanges in humidity and water level have been ignored(see e.g. Menke, 1975). The Pliocene deltaic wetlandvegetation has likely been extremely sensitive toperturbations in hydrology, as can be observed in theFlorida Everglades today (Willard et al., 2001; Donderset al., 2005), which is considered to be a modernanalogue for the Pliocene wetland vegetation in Europe(Mosbrugger et al., 1994). Especially the reconstructionof detailed changes, such as the cooling at the end of theBrunssumian and changes between sub-stages (e.g.Zagwijn and Hager, 1987; Zagwijn, 1992) are disput-able since it is shown here that no consistentBrunssumian–Reuverian boundary can be establishedon the basis of pollen evidence alone. Although thereconstruction by Zagwijn and Hager (1987) of a warmMiddle Miocene, followed by cooling in the LateMiocene and Pliocene shows a general correspondencewith a quantitative climate reconstruction from theLower Rhine Embayment based on Nearest LivingRelatives of plant macrofossils (Utescher et al., 2000),any further detailed comparison based on the RVG dataanalysed here is likely invalid.
The large scale changes however, can most likely beattributed to a climatic overprint. Especially the lowabundance of Tertiary (swamp) taxa above KI-c1 (Figs. 4and 6) is certainly related to climatic cooling associatedwith the stepwise intensification of glaciation cyclesaround the Piacenzian/Gelasian boundary. This NorthernHemisphere glaciation around 2.6Ma iswell-documentedin the deep sea δ18O record (e.g. Ruddiman et al., 1986;Tiedemann et al., 1994;Haug et al., 2005). The Praetiglianpollen stage was defined by Zagwijn (1960) as the first‘true’ glacial stage and it was tentatively correlated to thedeep sea δ18O record in later studies (Zagwijn, 1989,1992). However, during full glacial conditions sea levellowers significantly and generally causes erosion ratherthan deposition in coastal areas. The coldest phase of thefirst ‘true’ glacial cycle is, therefore, most likely to bemarked by a significant hiatus in the RVG deposits as canbe seen in Fig. 2. A more complete record of the first
extensive Northern Hemisphere glacial cycle is mostlikely preserved further in the hinterland, or in non-fluvialdeposits such as the Lieth pollen record from northernGermany (Menke, 1975; Pross and Klotz, 2002). Hence,the exact relation between the regional extinction of sub-tropical plant taxa and the global palaeoclimate recordneeds to be studied further, including also shallow marinesettings where a complete sediment record is potentiallypreserved.
4.5. Directions for future study
To improve the understanding and timing of theNeogene vegetation succession a further integration withthe marine record is needed. Preliminary analysis oforganic-walled dinoflagellate cysts (dinocysts) indicatesa middle Tortonian to early Zanclean age at the base ofthe Linne section and an early Zanclean age for clay KI-c2 in Pepinusbrug (Munsterman, TNO Geological Sur-vey of The Netherlands, pers. comm.). Further dinocystanalyses of interfingering marine sediments can providebetter independent chronological control on the conti-nental sediments from the RVG. Since the differentdepositional settings and the long-term vegetation suc-cession in lowlands appear to result from transgressionalcycles (Huhn et al., 1997), a sequence-stratigraphic ap-proach to the near-shore successions can improve theunderstanding of the chronology and possibly link thelong-term insolation cycles to sequence-stratigraphic cy-cles (Donders et al., submitted for publication). Palaeo-magnetic studies in this region are sparse and previousdata, such as a Praetiglian age range of between 2 to 3 Ma(Van Montfrans, 1971) have as yet not been confirmed.Deposits are discontinuous and coarse-grained sedimentsdo not provide reliable measurements. Nonetheless,preliminary palaeomagnetic data on the Pepinusbrugcore (Kloosterboer-Van Hoeve, unpublished data) indi-cate that the KI-c1 clay is consistent with the Gaussnormal chron, which would agree with a late Piacenzianage of these sediments.
Pollen analysis in shallow marine sediments canpotentially establish a standard vegetation successionfor the Neogene in NW Europe, which can subsequent-ly be tied to the terrestrial deposits and well-datedcontinuous marine sediments. Taking taphonomy intoaccount, shallow marine deposits represent a broadercatchment where local fluviatile variability is largelyeliminated and observed changes are more representa-tive of regional and global climate evolution, as illus-trated by a recent marine record of Pliocene terrestrialand marine climate changes in response to orbital forc-ing in the Mediterranean (Klotz et al., 2006). The
184 T.H. Donders et al. / Earth-Science Reviews 85 (2007) 161–186
marine Gemert borehole has at present only yieldedlow-resolution data and is therefore not suited as areference site since the analysis must be on a resolutionsignificant to climate changes, such as orbitally-forcedglacial cycles.
5. Concluding remarks
The palynological zonation of the continental Plio-cene of NW Europe, developed by Zagwijn (1957,1959, 1960) and De Jong (1982), and summarized inZagwijn and Hager (1987) and Zagwijn (1992), has longbeen an important standard in continental Neogenestratigraphy. Although the original concepts and meth-ods were innovative and valuable, the bio- and chrono-stratigraphical framework has been over-interpreted andused for the wrong purposes. Our results show that theoriginal zonation scheme is not consistent and containsmore features than can be substantiated by the data.Most of the (sub-)stages cannot be distinguished withnumerical and biostratigraphical tools and only a divi-sion between (pre-)Piacenzian and (post-)Gelasian sam-ples is evident and consistent. The Susterian/‘Linne’samples separate partly and seem to be consistentlyolder (Late Miocene to early Zanclean) compared to aBrunssumian/Reuverian group.
The different pollen assemblages within the succes-sions show to be significantly correlated to lithology.As can be expected, the depositional setting stronglyinfluences the palynological assemblages. Long-dis-tance palynological correlation of the RVG deposits andassociated Susterian, Brunssumian, and Reuverian(sub-)stages has been widely preformed in Great Britain(Andrew and West, 1977; Head, 1998), France(Zagwijn and Suc, 1973; Suc and Zagwijn, 1983; Sucet al., 1995; Dugué, 2003), and Romania (Popescu,2002, 2006). Based on our results such correlationsmust in the future be avoided as a method of directlydating or comparing sediments.
The Neogene palaeoclimatic reconstructions that arebased on the RVG pollen records provided importantnew insights into the palaeoclimate dynamics and weremore recently interpreted in the light of isotope andsequence-stratigraphical concepts (Zagwijn and Hager,1987; Zagwijn, 1989, 1992). Despite these advances,the detail and chronology of the reconstructions arequestionable as many changes in the pollen assemblageshave been over-interpreted. Factors such as variation inhumidity and water level have been essentially ignored,and the chronostratigraphical framework is here shownto be very weak. The dynamic fluviatile deposits andassociated patchy vegetation composition, combined
with transported and reworked material precluded theformation of a high-resolution continuous palynologicalrecord in the continental RVG. Hence, the successionsdescribed and interpreted in e.g. Suc and Zagwijn(1983), Zagwijn and Hager (1987) and Zagwijn (1992)are not directly representative of climatic conditions inNW Europe during the Neogene. Instead, the presentstudy shows that similar pollen assemblages occur atdistinctly different levels within the RVG sections,which points to a repetition of depositional environ-ments and spatially very variable (local) vegetation thatcannot be directly used as a palaeoclimatic reconstruc-tion for a broad region.
Further insight will have to come from a better in-tegration of palynological and lithostratigraphical data,as well as high-resolution records from shallow marinedeposits, such as the Gemert area, where a land–seacorrelation can be obtained. This view is supported in arecent review of the pollen and sediment provenancedata from Gelasian deposits in the RVG (Kemna andWesterhoff, 2007).
Acknowledgements
Armin Menkovic is thanked for his contribution onthe lithostratigraphic correlation and interpretation ofthe clay beds. Dirk Munsterman provided valuable in-formation on the stratigraphy based on his dinoflagellatestudies. We thank Jan Willem Weegink for assistingwith StrataBugs, and Natasha Welters for processing ofthe Pepinusbrug samples. We are grateful for thedetailed and constructive reviews of the manuscript byJohn Birks and Jörg Pross. Finally, we thank WaldoZagwijn for assisting in gathering all the required datasources and relevant information. This is NetherlandsSchool of Sedimentary Research (NSG) publication nr.20070601.
References
Ammann, B., Birks, H.J.B., Drescher-Schneider, R., Juggins, S., Lang,G., Lotter, A., 1993. Patterns of variation in late-Glacial pollenstratigraphy along a Northwest-Southeast transect through Swit-zerland—a numerical analysis. Quaternary Science Reviews 12,277–286.
Andrew, R., West, R.G., 1977. Pollen spectra from the Pliocene Cragat Orford, Suffolk. New Phytologist 78 (3), 709–714.
Ashraf, A.R., Utescher, T., Mosbrugger, V., 1997. Tertiary palynostrati-graphy: how reproducible are the results?Mededelingen -NederlandsInstituut voor Toegepaste Geowetenschappen TNO 58, 163–170.
Aubry, M.-P., Berggren, W.A., Van Couvering, J., McGowran, B.,Pillans, B., Hilgen, F.J., 2005. Quaternary: status, rank, definition,survival. Episodes 28 (2), 118–120.
Birks, H.J.B., Gordon, A.D., 1985. Numerical Methods in QuaternaryPollen Analysis. Academic Press, London. 317 pp.
185T.H. Donders et al. / Earth-Science Reviews 85 (2007) 161–186
Boenigk, W., 1970. Zur Kenntnise des Altquartärs bei Bruggen (west-liche Niederrheinische Bucht). Sonderveröffentlichungen - Geo-logisches Institut der Universität zu Köln 17, 1–138.
Boenigk, W., Frechen, M., 2006. The Pliocene and Quaternary fluvialarchives of the Rhine system. Quaternary Science Reviews 25(5–6), 550.
De Jong, J., 1982. Pollenanalytisch onderzoek van de boringen Linne58D/313, Schinveld 60D/1025 en Nederweert 58A/89, alsmedeherinterpretatie van de boring Koniningsbosch 60B/27. CenozoicPalaeobotany Report, vol. 919. Geological Survey of The Nether-lands (RGD), Haarlem.
De Jong, J., 1988. Climatic variability during the past three millionyears, as indicated by vegetational evolution in northwestEurope and with emphasis on data from The Netherlands.Philosophical transactions of the Royal Society of London. B318, 603–617.
Donders, T.H., Wagner, F., Visscher, H., 2005. Quantificationstrategies for human-induced and natural hydrological changes insouthern Florida wetland vegetation. Quaternary Research 64,333–342.
Donders, T.H., Munsterman, D.K., Brinkhuis, H., Lourens, L.J.,submitted for publication. Long-term obliquity-pacing of sea-levelcycles from Miocene shallow marine sequences in the SouthernNorth Sea Basin. Paleoceanography.
Doppert, J.W.C., Ruegg, G.H.J., Van Staalduinen, C.J., Zagwijn, W.H.,Zandstra, J.G., 1975. Formaties van het Kwartair en het Boven-Tertiair in Nederland. In: Zagwijn, W.H., Van Staalduinen, C.J.(Eds.), Toelichting bij geologische overzichtskaarten van Neder-land. Rijks Geologische Dienst, Haarlem, pp. 11–56.
Dugué, O., 2003. The Pliocene to Early Pleistocene marine to fluviatilesuccession of the Seuil du Cotentin basins (Armorican Massif,Normandy, France). Journal of Quaternary Science 18 (3–4),215–226.
Duin, E.J.T., Doornenbal, J.C., Rijkers, R.H.B., Verbeek, J.W., Wong,T.E., 2006. Subsurface structure of The Netherlands — results ofrecent onshore and offshore mapping. 85(4): 245–276.
Florschütz, F., Van Someren, A.M.H., 1948. Microbotanische vers-chillen tussen de klei van Reuver en de klei van Tegelen. Geologieen Mijnbouw 10, 68.
Florschütz, F., Van Someren, A.M.H., 1950. The palaeobotanicalboundary Pliocene–Pleistocene in The Netherlands, internationalgeological congress. Report of the Eighteenth Session Great Bri-tain, 1948, pp. 40–46. Part IX.
Geluk, M.C., Duin, E.J.T., Dusar, M., Rijkers, R.H.B., Van den Berg,M.W., Van Rooijen, P., 1994. Stratigraphy and tectonics of theRoer Valley Graben. Netherlands Journal of Geosciences/Geologieen Mijnbouw 73, 129–141.
Gibbard, P.L., West, R.G., Zagwijn, W.H., Balson, P.S., Burger, A.W.,Funnell, B.M., Jeffery, D.H., de Jong, J., Van Kolfschoten, T.,Lister, A.M., Meijer, T., Norton, P.E.P., Preece, R.C., Rose, J.,Stuart, A.J., Whiteman, C.A., Zalasiewicz, J.A., 1991. Early andEarly Middle Pleistocene correlations in the Southern North SeaBasin. Quaternary Science Reviews 10, 23–52.
Gradstein, F.M., Finney, S., Ogg, J.G., 2007. Current IUGS-IGCdecisions on Quaternary and on Pleistocene. Quaternary Newslet-ter 16 (2), 129–131.
Grimm, E.C., 1987. CONISS: a Fortran 77 program for stratigraphi-cally constrained cluster analysis by the method of incrementalsum of squares. Computers & Geosciences 13 (1), 13–35.
Hagedoorn, 2004. Sedimentpetrographie und Lithofazies der jungter-tiären und quartären Sedimente im Oberrheingebiet. DissertationThesis, Universität zu Köln, Köln. 248 pp.
Haug, G.H., Ganopolski, A., Sigman, D.M., Rosell-Melé, A., Swann,G.E.A., Tiedemann, R., Jaccard, S.L., Bollmann, J., Maslin, M.A.,Leng, M.J., Eglinton, G., 2005. North Pacific seasonalityand the glaciation of North America 2.7 million years ago. Nature393 (6686), 673–676.
Head, M.J., 1998. Marine environmental change in the Pliocene andearly Pleistocene of eastern England: the dinoflagellate evidencereviewed. Mededelingen - Nederlands Instituut voor ToegepasteGeowetenschappen TNO 60, 199–226.
Heumann, G., Litt, T., 2002. Stratigraphy and paleoecology of the LatePliocene and Early Pleistocene in the open-cast mine Hambach(Lower Rhine Basin). Netherlands Journal of Geosciences/Geo-logie en Mijnbouw 81 (193–199).
Huhn, B., Utescher, T., Ashraf, A.R., Mosbrugger, V., 1997. The peat-forming vegetation in the Middle Miocene Lower Rhine Embay-ment, an analysis based on palynological data. Mededelingen -Nederlands Instituut voor Toegepaste Geowetenschappen TNO 58,211–218.
Kemna, H.A., 2005. Pliocene and Lower Pleistocene Stratigraphy inthe Lower Rhine Embayment, Germany. Kölner Forum, vol. 14.Universität Köln. 121 pp.
Kemna, H.A., Westerhoff, W.E., 2007. Remarks on the paly-nology-based chronostratigraphic subdivision of the Plioceneterrestrial deposits in NW-Europe. Quaternary International164–165, 184–196.
Klotz, S., Fauquette, S., Combourieu-Nebout, N., Uhl, D., Suc, J.-P.,Mosbrugger, V., 2006. Seasonality intensification and long-termwinter cooling as a part of the Late Pliocene climate development.Earth and Planetary Science Letters 241 (1–2), 174–187.
Kürschner, W.M., Van der Burgh, J., Visscher, H., Dilcher, D.L., 1996.Oak leaves as biosensors of late Neogene and early Pleistocenepaleoatmospheric CO2 concentrations. Marine Micropaleontology27 (1–4), 299–312.
Lotter, A.F., Juggins, S., 1991. POLPROF, TRAN and ZONE:programs for plotting, editing and zoning pollen and diatomdata. INQUA-Subcommission for the study of the HoloceneWorking Group on Data-Handling Methods. Newsletters 4,4–6.
Lücke, A., Helle, G., Schleser, G.H., Figueiral, I., Mosbrugger, V.,Jones, T.P., Rowe, N.P., 1999. Environmental history of theGermanLower Rhine Embayment during the Middle Miocene as reflectedby carbon isotopes in brown coal. Palaeogeography, Palaeoclima-tology, Palaeoecology 154, 339–352.
Menke, B., 1975. Vegetationsgeschichte und Florenstratigraphie Nord-westdeutschlands im Pliozän und Fruh-Quartär. Mit einem Beitragzur Biostratigraphie desWeichsel-Frühglazials. Geologisches Jahr-buch. Reihe A, Allgemeine und regionale Geologie BR Deutsch-land und Nachbargebiete, Tektonik, Stratigraphie, PalaÉontologie26, 3–151.
Mosbrugger, V., Gee, C.T., Belz, G., Ashraf, A.R., 1994. Three-di-mensional reconstruction of an in-situ Miocene peat forest from thelower Rhine Embayment, northwestern Germany— new methodsin palaeovegetation analysis. Palaeogeography, Palaeoclimatology,Palaeoecology 110, 295–317.
Popescu, S.-M., 2002. Repetitive changes in Early Pliocene vegetationrevealed by high-resolution pollen analysis: revised cyclostrati-graphy of southwestern Romania. Review of Palaeobotany andPalynology 120 (3–4), 181–202.
Popescu, S.-M., 2006. Late Miocene and early Pliocene environmentsin the southwestern Black Sea region from high-resolution paly-nology of DSDP Site 380A (Leg 42B). Palaeogeography, Palaeo-climatology, Palaeoecology 238, 64–77.

186 T.H. Donders et al. / Earth-Science Reviews 85 (2007) 161–186
Pross, J., Klotz, S., 2002. Palaeotemperature calculations from thePraetiglian/Tiglian (Plio-Pleistocene) pollen record of Lieth,northern Germany: implications for the climatic evolution ofNW Europe. Global and Planetary Change 34, 253–267.
Reid, C., Reid, E.M., 1915. The Pliocene Flora of the Dutch PrussianBorder. Mededeelingen van de rijksopsporing van delfstoffen,vol. 6. Martinus Nijhoff's, Gravenhage. 178 pp.
Ruddiman,W.F., Raymo,M.E.,McIntyre, A., 1986.Matuyama 41,000-year cycles: North Atlantic Ocean and Northern Hemisphere icesheets. Earth and Planetary Science Letters 80, 117–129.
Suc, J.-P., Zagwijn, W.H., 1983. Plio–Pleistocene correlations betweenthe northwestern Mediterranean region and northwestern Europeaccording to recent biostratigraphic and palaeoclimatic data. Boreas3, 153–166.
Suc, J.P., Diniz, F., Leroy, S., Poumot, C., Bertini, A., Dupont, L., Clet,M., Bessais, E., Zheng, Z., Fauqette, S., Ferrier, J., 1995. Zanclean(∼Brunssumian) to early Piacenzian (∼early–middle Reuverian)climate from 4° to 54° north latitude (West Africa, West EuropeandWest Mediterranean areas). Mededelingen - Rijks GeologischeDienst 52, 43–55.
Ter Braak, C.J.F., Smilauer, P., 2002. CANOCO Reference Manual andCanoDraw for Windows User's Guide: Software for CanonicalCommunityOrdination (Version 4.5).Microcomputer Power, Ithaca,New York.
Thompson, R.S., Anderson, K.H., Bartlein, P.J., 2000. Atlas of rela-tions between climatic parameters and distributions of importanttrees and shrubs in North America, introduction and conifers,1650-A. U.S. Geological Survey Professional Paper. 269 pp.
Thomson, P.W., Pflug, H., 1953. Pollen und Sporen des Mitteleur-opäischen Tertiärs. Palaeontographica 94B (1–4), 1–138.
Tiedemann, R., Sarnthein, M., Shackleton, N.J., 1994. Astronomicaltimescale for the Pliocene Atlantic delta 18O and dust flux recordof Ocean Drilling Program site 659. Paleoceanography 9 (4),619–638.
Utescher, T., Mosbrugger, V., Ashraf, A.R., 2000. Terrestrial climateevolution in Northwest Germany over the last 25 million years.Palaios 15, 430–449.
Van den Berg, M.W., 1994. Neotectonics of the Roer Valley riftsystem. Style and rate of crustal deformation inferred from syntec-tonic sedimentation. Netherlands Journal of Geosciences/Geologieen Mijnbouw 73, 143–156.
Van der Burgh, J., Zetter, R., 1998. Plant mega- and microfossilassemblages from the Brunssumian of ‘Hambach’, near Düren,B.R.D. Review of Palaeobotany and Palynology 101, 209–256.
Van der Hammen, T., Wijmstra, T.A., Zagwijn, W.H., 1971. The floralRecord of the Late Cenozoic of Europe. In: Turekian, K.K. (Ed.),The Late Cenozoic Glacial Ages. Yale University, pp. 391–424.
Van der Vlerk, I.M., Florschütz, F., 1950. Nederland in het IJstijdvak.287 pp.
Van Montfrans, H.M., 1971. Palaeomagnetic dating in the North SeaBasin. Earth and Planetary Science Letters 11, 226–235.
Von der Brelie, G., Rein, U., 1954. Die pollen-analytische Flözor-ientierung im Braunkohlentiefbau der Schachtanlage Morsche-nich. Geologisches Jahrbuch 69, 303.
Weerts, H.J.T., Cleveringa, P., Ebbing, J.H.J., De Lang, F.D., Wester-hoff, W.E., 2000. De lithostratigrafische indeling van Nederland-
Formaties uit het Tertiair enKwartair. TNORapport NITG 00-95-A,NITG-TNO, Utrecht.
Westerhoff, W.E., Wong, T.E., De Mulder, E.F.J., 2003. Opbouw vande ondergrond. In: De Mulder, E.F.J., Geluk, M.C., Ritsema, I.L.,Westerhoff, W.E., Wong, T.E. (Eds.), De ondergrond van Neder-land. Wolters-Noordhoff, Groningen. 379 pp.
Willard, D.A., Weimer, L.M., Riegel, W.L., 2001. Pollen assemblagesas paleoenvironmental proxies in the Florida Everglades. Reviewof Palaeobotany and Palynology 113, 213–235.
Zagwijn, W.H., 1957. Vegetation, climate and time-correlations in theearly Pleistocene of Europe. Geologie en Mijnbouw 19, 233–244.
Zagwijn, W.H., 1959. Zur stratigrafischen und pollenanalytischenGliederung der pliozenen Ablagerungen im Roertal-Graben undVenloer Graben der Niederlande. Fortschritte in der Geologie vonRheinland und Westfalen 4, 5–26.
Zagwijn, W.H., 1960. Aspects of the Pliocene and early Pleistocenevegetation in The Netherlands. Mededelingen van de GeologischeStichting, Serie C III-1–5, 1–78.
Zagwijn, W.H., 1963. Pollen-analytical investigations in the Tiglian ofThe Netherlands. Mededelingen van de Geologische Stichting.Nieuwe Serie 16, 49–71.
Zagwijn, W.H., 1967. Ecological interpretation of a pollen diagramfrom Neogene beds in The Netherlands. Review of Palaeobotanyand Palynology 2, 173–181.
Zagwijn, W.H., 1974a. The Pliocene–Pleistocene boundary in westernand southern Europe. Boreas 3, 75–97.
Zagwijn, W.H., 1974b. Variations in climate as shown by pollenanalysis, especially in the Lower Pleistocene of Europe. In: Wright,A.E., Moseley, F. (Eds.), Ice Ages: Ancient and Modern. Geolo-gical Journal. Seel House Press, Liverpool, pp. 137–152.
Zagwijn, W.H., 1989. The Netherlands during the Tertiary and theQuaternary: a case history of Coastal Lowland evolution. Geologieen Mijnbouw 68, 107–120.
Zagwijn, W.H., 1992. The beginning of the ice age in Europe and itsmajor subdivisions. Quaternary Science Reviews 11, 583–591.
Zagwijn, W.H., 1998. Borders and boundaries: a century of strati-graphical research in the Tegelen–Reuver area of Limburg (TheNetherlands). Mededelingen - Nederlands Instituut voor Toege-paste Geowetenschappen TNO 60, 19–34.
Zagwijn, W.H., Doppert, J.W.C., 1978. Upper cenozoic of the South-ern North Sea Basin: palaeoclimatic and palaeogeographicevolution. Geologie en Mijnbouw 57 (4), 577–588.
Zagwijn,W.H., Hager, H., 1987. Correlations of continental andmarineNeogene deposits in the south-eastern Netherlands and the LowerRhine District. Mededelingen van de Werkgroep voor Tertiaire enKwartaire Geologie 24 (1–2), 59–78.
Zagwijn, W.H., Suc, J.-P., 1973. Palynostratigraphie du Plio–Pleistocene d'Europe et de Mediterranee nord-occidentales:correlations chronostratigraphiques, histoire de la vegetation etdu climat. Paleobiologie Continentale XIV (2), 475–483.
Ziegler, P.A., 1994. Cenozoic rift system of western and centralEurope: an overview. Netherlands Journal of Geosciences/Geologie en Mijnbouw 73, 99–127.