Embed Size (px)
Citation preview

MEDDELANDEN från
STOCKHOLMS UNIVERSITETS INSTITUTION för
GEOLOGI och GEOKEMINo. 334
Late Eocene through Oligocene calcareous nannofossils
from the paleo-equatorial Pacific Ocean –
taxonomy, preservation history, biochronology and evolution
Teodora Blaj
Stockholm 2009
Department of Geology and GeochemistryStockholm University
106 91 StockholmSweden

A Dissertation for the degree of Doctor of Philosophy in Natural Science
Department of Geology and GeochemistryStockholm University106 91 StockholmSweden
Abstract
This study aims to unravel the ecological and evolutionary dynamics within the calcareous nannofossil communities at the Eocene/Oligocene transition and during the Oligocene Epoch, when Cenozoic ‘icehouse’ conditions were first established. More specifically, the main question this study aims to answer is whether the changes in the calcareous nannofossil assemblages were controlled by intrinsic evolutionary trends or if the changes were controlled by environmental factors such as changes in temperature and nutrient availability in the surface water. These questions are addressed with detailed analyses of the taxonomy, biostratigraphy as well as fluctuations in abundance and diversity patterns of calcareous nannofossil assemblages from a continuous latest Eocene through Oligocene deep-sea sediment section from the Ocean Drilling Program Leg 199, Site 1218 (8°53.38´N, 135°22.00´W; water depth 4826 m), paleo-equatorial Pacific Ocean. An improved Oligocene calcareous nannofossil taxonomy and biostratigraphy has been established. At the Eocene/Oligocene transition, changes in the nannofossil taxa preservation mimics changes in calcium carbonate content. A detailed investigation of late Eocene through late Oligocene sediments yields age estimates, on an astronomically calibrated timescale, for 10 calcareous nannofossil bioevents. The most reliable events are the extinctions of Discoaster saipanensis, Ericsonia formosa and Sphenolithus predistentus. Morphometric studies of the Reticulofenestra umbilicus-hillae group show that these cannot be subdivided into two different morphospecies. Based on differences in morphometry and stratigraphic ranges, the Oligocene Sphenolithus lineage appears to be the result of a combined anagenetic and cladogenetic evolution. A new Oligocene nannolith species is described: Triquetrorhabdulus longus sp. nov. High-resolution nannofossil data indicate changes in the composition, abundance and diversity of the mid-Oligocene (30.0-26.4 Ma) calcareous nannofossil assemblages. The nannofossil assemblages are dominated by Cyclicargolithus floridanus, Sphenolithus moriformis and Coccolithus pelagicus, which show a combined mean abundance of 84 % of the total assemblage throughout the investigated 3.6 Myr interval. Variations in abundance and Shannon diversity index have been used to subdivide the 3.6 Myr long study interval into four subintervals. Intervals of highest Shannon index diversity coincide with Oi-glaciation events. However, visual examination of the variations in abundance of selected nannofossil taxa do not appear to correlate with changes in either oxygen or carbon isotopes, or sediment flux. This presumably indicates that a dynamic equilibrium did not exist between these Oligocene calcareous nannoplankton assemblages and changes in surface water temperature or productivity conditions. Observed changes in the nannofossil assemblages thus could have probably been driven by the internal evolutionary dynamics within the coccolithophore communities.
© Teodora BlajISBN 978-91-7155-890-9ISSN 1101-1599
Cover: Coccosphere of Cyclicargolithus floridanus (foto: T. Blaj)Layout: T. Blaj (except Paper I and II)
Printed in Sweden by US-AB SU, Stockholm 2009Distributor: Department of Geology and Geochemistry

This thesis consists of a summary and five appended papers.
List of papers:
Paper I:
Blaj, T. and Henderiks, J. 2007. Smear and spray preparation techniques put to the test (��)�� reproducibilitySmear and spray preparation techniques put to the test (��)�� reproducibility and accuracy of calcareous nannofossil assemblage counts. Journal of Nannoplankton Research 29, 92-100. Reprinted with permission of Journal of Nannoplankton Research.
Paper II:
Blaj,. T., Backman, J., and Raffi, �. 2009. Late �ocene to Oligocene preservation history and biochronologyLate Eocene to Oligocene preservation history and biochronology of calcareous nannofossils from paleo-equatorial Pacific Ocean sediments. Rivista Italiana di Paleontologia e Stratigrafia 115/1, 67-85. Reprinted with permission of Rivista Italiana di Paleontologia e Stratigrafia.
Paper III:
Blaj, T., Henderiks, J., Young, J., and Rehnberg, E., in review. On the nature of the Oligocene Sphenolithus evolutionary lineage�� insights from the paleo-equatorial Pacific Ocean.. Submitted to Journal of Micropalaeontology.
Paper IV:
Blaj, T. and Young, J., in review. A new Oligocene Triquetrorhabdulus species: Triquetrorhabdulus longus sp. nov. Submitted to Journal of Nannoplankton Research.
Paper V:
Blaj, T. manuscript to be submitted to Marine Micropaleontology. Abundance and diversity changes among calcareous nannofossil assemblages across the early/late Oligocene boundary in the paleo-equatorial Pacific Ocean.
All work in this thesis has been carried out by the author. My contribution to the papers: I was lead author in all five papers for which � also carried out the sample preparation and the laboratory/microscopy work. The results have been discussed and interpreted in collaboration with co-authors.
Stockholm, April 2009Teodora Blaj
Late Eocene through Oligocene calcareous nannofossils from the paleo-equatorial Pacific Ocean –
taxonomy, preservation history, biochronology and evolution
Teodora Blaj
Department of Geology and Geochemistry, Stockholm University, 106 91 Stockholm Sweden

Pentru mama şi tata

1
1. Introduction
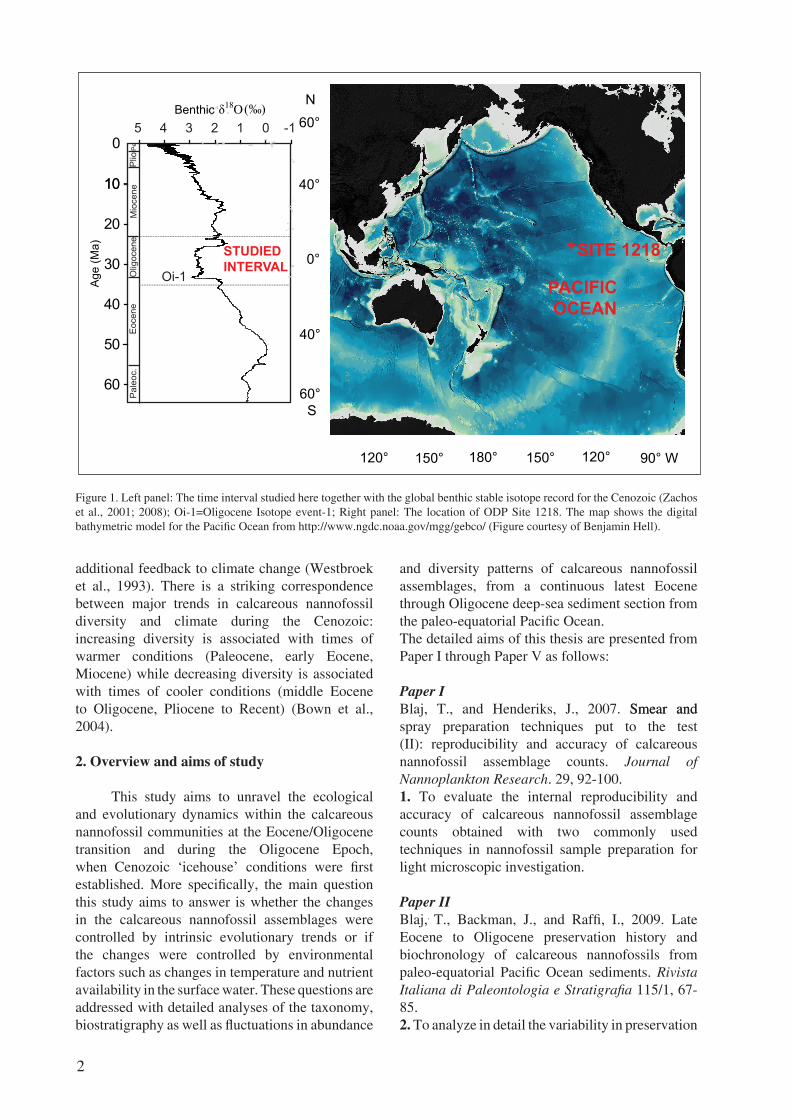
The transition between the Eocene and Oligocene epochs at 33.8 Ma (Pälike et al., 2006) marks an important step towards the development of the modern icehouse world, characterized by the first major build-up of an Antarctic ice sheet, as well as changes in sea level, ocean chemistry, and plankton communities (Lear et al., 2000; Zachos et al., 2001; Coxall et al., 2005; Pälike at al., 2006; Coxall and Pearson, 2007; Dunkley Jones et al., 2008). The Eocene/Oligocene interval thus represents the transition from an ice-free early Paleogene global warm climate and high atmospheric pCO2 to the glaciated climate of the Oligocene and lower atmospheric pCO2 (Zachos et al., 2001; Pagani et al., 2005). Oligocene benthic oxygen isotopes are about 2 ‰ heavier if compared to the early Eocene climate optimum, and about 1 ‰ lighter if compared to the present interglacial situation (Fig. 1, left panel) (Zachos et al., 2008). The Oligocene world thus was warmer and less glaciated compared to present-day conditions. The underlying causes for this evolution of late Eocene through Oligocene paleoclimates are still debated (Raymo and Ruddiman, 1992; Exon et al., 2001; Huber et al., 2004; Jovane et al., 2009). In this context, it is important to take into account also the different paleogeographic configurations during Eocene-Oligocene times, with critical oceanic gateways open that are now closed, and vice versa: the opening of the Southern Ocean gateways and closure of the Tethys Ocean; disappearance of the Arctic subpolar gyres as the South Pacific was connected to the Indian Ocean, through the Tasmanian Gateway, near the end of the Eocene and then later to Atlantic Ocean through the Drake Passage (Huber et al., 2004).
The equatorial Pacific Ocean is a main component of the global heat machine, also characterized by high primary productivity and by being a large reservoir for carbon exchange between the atmosphere and the ocean (Lyle et al., 2008). Large areas of the deep-sea are
covered by calcareous oozes formed mainly by two groups of surface dwelling plankton: foraminifers (zooplankton) and coccolithophores (phytoplankton). Coccolithophores (“round-stone-bearers”) are a major group of marine, unicellular algae (Lohmann, 1902) belonging to the phylum Haptophyta. Coccolithophores secrete minute calcite crystals inside their cell within a special vesicle, where they modify the shape and size of the crystals and arrange them to build individual plates of calcium carbonate (coccoliths) that are subsequently arranged outside the cell forming a coccosphere (Lohmann, 1902; Young et al, 2004). The coccoliths form an important component of the deep-sea sediments (Honjo, 1976; Roth, 1994; Bown et al., 2004).
Coccolithophores are widespread in the euphotic zone of the global oceans and are an important part of the marine phytoplankton community. Coccolithophores play an important role in the global carbon cycle, both as oceanic primary producers and marine calcifiers (Winter and Siesser, 1994; Rost and Riebesell, 2004).Rost and Riebesell, 2004). As primary producers, coccolithophores derivecoccolithophores derive energy from photosynthesis and are considered to be sensitive to changes in sea-surface temperature and nutrient concentration (McIntyre and Bé, 1967; Winter and Siesser, 1994). They have been widely used in paleoecological and paleoceanographical studies (e.g., Mc�ntyre, 1967; Haq and Lohmann, 1976; Wei et. al, 1992; Winter et. al, 1994; Wade and Bown, 2006; Villa et. al, 2008). Due to their microscopic size (2-20 µm), great diversity, fast evolutionary rates, wide geographic distribution and their astronomical number in marine sediments, this group provides one of the most complete fossil records for Cenozoic times (Bown et al., 2004). This group represents a powerful tool for regional and worldwide biostratigraphic correlations (Perch-Nielsen, 1985). Due to their biochemical (dimethylsulfide – acting as a source molecule for cloud nucleation) and optical (albedo – aggregations of coccoliths in ocean surface waters reflect incoming light) effects they likely produce
Late Eocene through Oligocene calcareous nannofossils from the paleo-equatorial Pacific Ocean –
taxonomy, preservation history, biochronology and evolution
Teodora Blaj
Department of Geology and Geochemistry, Stockholm University, 106 91 Stockholm Sweden
2
additional feedback to climate change (Westbroek et al., 1993). There is a striking correspondence between major trends in calcareous nannofossil diversity and climate during the Cenozoic: increasing diversity is associated with times of warmer conditions (Paleocene, early Eocene, Miocene) while decreasing diversity is associated with times of cooler conditions (middle Eocene to Oligocene, Pliocene to Recent) (Bown et al., 2004).
2. Overview and aims of study
This study aims to unravel the ecological and evolutionary dynamics within the calcareous nannofossil communities at the Eocene/Oligocene transition and during the Oligocene Epoch, when Cenozoic ‘icehouse’ conditions were first established. More specifically, the main question this study aims to answer is whether the changes in the calcareous nannofossil assemblages were controlled by intrinsic evolutionary trends or if the changes were controlled by environmental factors such as changes in temperature and nutrient availability in the surface water. These questions are addressed with detailed analyses of the taxonomy, biostratigraphy as well as fluctuations in abundance
and diversity patterns of calcareous nannofossil assemblages, from a continuous latest Eocene through Oligocene deep-sea sediment section from the paleo-equatorial Pacific Ocean.The detailed aims of this thesis are presented from Paper I through Paper V as follows:
Paper IBlaj, T., and Henderiks, J., 2007. Smear andSmear and spray preparation techniques put to the test (II): reproducibility and accuracy of calcareous nannofossil assemblage counts. Journal of Nannoplankton Research. 29, 92-100.1. To evaluate the internal reproducibility and accuracy of calcareous nannofossil assemblage counts obtained with two commonly used techniques in nannofossil sample preparation for light microscopic investigation.
Paper IIBlaj,. T., Backman, J., and Raffi, �., 2009. Late Eocene to Oligocene preservation history and biochronology of calcareous nannofossils from paleo-equatorial Pacific Ocean sediments. Rivista Italiana di Paleontologia e Stratigrafia 115/1, 67-85.2. To analyze in detail the variability in preservation
Figure 1. Left panel: The time interval studied here together with the global benthic stable isotope record for the Cenozoic (Zachos et al., 2001; 2008); Oi-1=Oligocene Isotope event-1; Right panel: The location of ODP Site 1218. The map shows the digital bathymetric model for the Pacific Ocean from http��//www.ngdc.noaa.gov/mgg/gebco/ (Figure courtesy of Benjamin Hell).
1010
20
30
40
50
60
Age
(Ma)
Benthic
Pal
eoc.
Eoc
ene
Olig
ocen
eM
ioce
neP
lioP
e
-------------------------------------------------------------
Oi-1--------------------------------------------------------------
05 4 3 2 1 0 -1
STUDIEDINTERVAL
SITE 1218
60° S
40°
40°
60° N
0°
PACIFIC OCEAN
120° 150° 180° 150° 120° 90° W
*
δ18O (‰)

3
of selected calcareous nannofossil taxa across the Eocene/Oligocene transition.3. To establish a high-resolution biochronology for the latest Eocene through Oligocene sediments of Ocean Drilling Program (ODP) Site 1218.
Paper III Blaj, T., Henderiks, J., Young, J., and Rehnberg, E., submitted. On the nature of the Oligocene Sphenolithus evolutionary lineage: insights from the paleo-equatorial Pacific Ocean.. Journal of Micropalaeontology.4. To examine in detail changes in morphologychanges in morphology within the biostratigraphically important Oligocene nannofossil lineage, Sphenolithus predistentus, S. distentus and S. ciperoensis in order to determine whether this set of sphenolith species represents an anagenetic or a cladogenetic evolutionary lineage (Fig. 2).
Paper IV Blaj, T., and Young, J., submitted. A new Oligocene Triquetrorhabdulus species: Triquetrorhabdulus longus sp. nov. Journal of Nannoplankton Research.5. To formally describe a new and biostratigraphically useful Oligocene nannolith taxon: i.e. Triquetrorhabdulus longus sp. nov.
Paper V Blaj, T. manuscript. Abundance and diversity changes among calcareous nannofossil assemblages across the early/late Oligocene boundary in the paleo-equatorial Pacific Ocean. To be submitted to Marine Micropaleontology 6. To determine the composition, abundance and diversity patterns of total calcareous nannofossil assemblages during a 3.6 Myr long time interval from the mid-Oligocene at ODP Site 1218.7. To compare the abundance and diversity patterns of the nannofossil assemblages with existing oxygen and carbon isotope from Site 1218 (Wade and Pälike, 2004; Pälike et al., 2006) in order to evaluate if the changes occurring in the nannofossil assemblages were controlled by environmental factors (i.e. temperature and nutrient availability in the surface water) or by evolutionary trends within the calcareous nannofossil communities.
3. Material and Methods
3.1. Study Site
ODP Site 1218 recovered a complete late �ocene through Oligocene sediment sequence from the paleo-equatorial Pacific Ocean (Fig. 1 right
panel) (Lyle et al., 2002; Wilson et al., 2006). The site was drilled at 8°53.38´N, 135°22.00´W in a water depth of 4826 m. This site was chosen for drilling mainly in order to investigate paleoceanographic processes that occurred in the equatorial Paleogene Pacific Ocean during the transition of �arth’s climate from the early Paleogene greenhouse condition into the late Paleogene icehouse condition (Lyle et al., 2002). In this study, the late Eocene to Oligocene sediment section was analyzed from 101.15 to 247.54 revised meter composite depth (rmcd) in the composite sediment section of Site 1218, spliced together from Holes 1218A, 1218B and 1218C (Pälike et al., 2006). The studied section corresponds to the time interval from 35.03 Ma to 23.41 Ma. An average sample spacing of 10 cm was used, which corresponds to an average duration of about 7.8 kyrs.
3.2. Rationale for using an astronomically calibrated time-scale
The development of an astronomically calibrated time scale is an important innovation of modern geochronology. Its main objective is to acquire an accurate and stable Cenozoic time scale (http://earth-time.org/; Pälike and Hilgen, 2008). The climate is influenced by the periodic variations in Earth’s orbit, tilt and precession relative to the Sun (Ruddiman, 2007). Cyclical fluctuations in sedimentary properties are related to the orbital
Figure 2. An example of an anagenetic and a cladogenetic evolution. Species A anagenetically changes over time to become species B, while species B cladogenetically changes over time by splitting into species C and D, neither of which are very different from B or each other. The anagenesis axis represents change of form, either genetic or phenotypic. The cladogenetic axis represents isolation of species from each other (e.g., reproductive isolation). The plot is from http://www.talkorigins.org/faqs/macroevolution.html

4
forcing of the incoming sunlight and thus can be used as a basis for the geological time scale (Raymo et al., 1989; Shackleton et al., 1990).
In this study, the astronomically calibrated time scale of Pälike et al. (2006) (P06) is used. This time scale is based on the 405 kyr eccentricity cycles, mirrored in the stable isotopes record from Site 1218 (Wade and Pälike, 2004; Pälike et al., 2006). The age estimates derived from the biostratigraphic study were compared with age estimated derived from two magnetobiochronologic Cenozoic timescales, i.e., Berggren et al. (1985) (B85) and Berggren et al. (1995) (B95). Age estimates in these two timescales were based on the use of linear interpolation between nearest geomagnetic reversal boundaries. Therefore, the precision of the age estimates in the B85 and B95 timescales depends on the sample spacing used and the error introduced when assuming constant sedimentation rates between the reversal boundaries. Age estimates using the B85 or B95 timescales are therefore generally an order of magnitude less precise compared to the estimates determined using the P06 timescale, which is astronomically calibrated. An age estimate generated using B85 is first converted to B95 using linear interpolation, which is further converted to P06 following data available in the Pangaea database (www.pangaea.de).
3.3. Samples preparation techniques
All sediment samples were prepared for light microscope examination. Smear-slides were prepared from all samples using the smear slide method (Haq and Lohmann 1976; Perch-Nielsen, 1985). The smear slides were analyzed using a Leica DMLP polarizing light microscope at 1000x magnification.
3.4. Morphometric analysis
For the morphometric analysis of the Reticulofenestra spp. group, light microscope images were captured using a Leica DMLP microscope (1000x magnification) and Leica DFC 320 digital camera. A Zeiss Axioplan microscope (1600x magnification) equipped with a Leica DFC 280 digital camera was used for measuring the Sphenolithus lineage members. The morphometric study of the genus Reticulofenestra was made on ten different early Oligocene samples (Paper II, Appendix A). Over 100 specimens of the R. umbilicus-R. hillae plexus, plus 100 specimens of the smaller Reticulofenestra spp. group, were
randomly chosen and photographed. Measurements of total placolith length and width, and length and width of the central opening, on calibrated digital images (1 pixel corresponds to 0.054 µm) were performed using the public domain program ImageJ (http://rsb.info.nih.gov/ij/). In a similar approach,. In a similar approach, the morphometric study of the genus Sphenolithus were made on ten mid-Oligocene samples (Paper III, Appendix). A total of one thousand specimens specimens were morphometrically analysed by measuring the sphenolith proximal cycle height and basal width. 3.5. Statistical analysis
Chi-square tests for multiple samples were applied for comparing the proportion of different species between replicates obtained with the smear and spray slides, respectively, in order to determine the reproducibility of relative species abundances for both smear and spray methods and to examine whether the two methods produced equal species proportions. For all samples, the standard deviation and the 95 % confidence level of the mean species proportions were calculated. The statistical analyses were performed with the MS Excel and PhStat software (Levine et al., 2001).
Calcareous nannofossil assemblage diversity was calculated using the Shannon diversity index, frequently used in the analysis of ecological diversity (Dunkley Jones et al., 2008; Incarbona et al., 2008). The Shannon index accounts for both abundance and evenness/dominance of the taxa present. The index increases either by adding new species, or by having a greater species evenness (more equal abundances among the component taxa). The calculations for the diversity index were made using the free software PAST (PAlaeontological Statistics, http://folk.uio.no/ohammer/past/). Time-series analysis have been performed using the program AnalySeries (Paillard et al., 1996).
3.6. Taxonomy
The counted calcareous nannofossil specimens were identified at the species level following the taxonomy of Perch-Nielsen (1985) and Aubry (1984, 1988, 1989, 1990, 1999). Roth’s et al. (1970) taxonomy was used for the Sphenolithus taxa. One new nannolith species has been described in the study material, namely Triquetrorhabdulus longus (Blaj and Young, submitted). All taxa discussed in this study are listed in the taxonomic appendix. All data set (Appendix data) is stored on ftp://ftp.geo.su.se/teo/download/.

5
3.7. Biochronologic analysis
A total of 1484 samples (Paper II, Appendix A: http://users.unimi.it/rips/115/115N1.htm) was investigated for biochronological purposes. Semi-quantitative data of marker species were obtained using the method of Backman and Shackleton (1983), with abundances expressed as number of specimens per mm2. All index species were counted on 10 to 50 fields of view (FOV) which had a relatively constant nannofossil density, averaging about 50 specimens/FOV. Most samples were investigated using 25 FOV (Backman and Shackleton, 1983). The abbreviations LO (LowestThe abbreviations LO (Lowest Occurrence) and HO (Highest Occurrence) were used for the two-dimensional stratigraphic surfaces defined by the lowest observed occurrences and highest observed occurrence, respectively, of a certain taxon in the sedimentary record, following Aubry and Van Couvering (2005). Seventy-six (76) samples (Paper II, Appendix A) were selected for analyzing preservation patterns of calcareous nannofossils and planktic foraminifers over an interval of 1 Myr (34.63 Ma to 33.63 Ma) across the Eocene/Oligocene transition.
3.8. Calcareous nannofossil assemblage counts
For the whole calcareous nannofossil assemblage study, the mid-Oligocene sediment section was analyzed from 136.63 to 192.11 rmcd. This sample set represents a time interval of 3.6 Myrs, between 30.0 Ma and 26.4 Ma, involving analysis of 552 samples (Paper V, Appendix A) using a 7 kyrs sample resolution throughout. Quantitative analyses were performed by counting at least 300 specimens per sample which were expressed as relative abundances of the total assemblage. Increasing the number of specimens counted did not dramatically affect the relative abundance patterns of different taxa (Fig. 3).
4. Summary of Papers I to V
4.1. Testing the accuracy and reproducibility of smear and spray techniques
Paper I - Smear and spray preparation techniques put to the test (II): reproducibility and accuracy of calcareous nannofossil assemblage counts.
This paper is a methodology study concerning the accuracy and reproducibility of the calcareous nannofossil assemblage counts using the simple smear slide method and the spray method. There are important questions concerning data consistency, accuracy and reliability that must be considered in data interpretation as well as comparison between different data sets. Increasing interest is being shown in recent years for comparison of data sets obtained using different sample preparation methods.
In an earlier study (Henderiks and Törner, 2006), nannofossil proportion estimates between replicate smear slides showed substantially higher variance than those obtained using replicate sprayed slides. This study revisits this potentially disconcerting issue, detailing the internal accuracy and reproducibility of relative nannofossil species abundances obtained with these two preparation techniques. �n addition, accuracy and reproducibility were tested for a semi-quantitative method, in which the number of specimens per mm2 is determined from smear slides. To test the overall reproducibility of these two preparation methods, replicate slides were prepared and analyzed with each technique for a set of six samples selected from the Site 1218 sediments. Based on the results of the statistical tests, both smear and spray replicates indicate a good reproducibility of proportion estimates within the same method, since no statistically significant differences between the replicate slides were observed.
However, when comparing the smear with spray replicates, the data set reveals significantly different species proportions, indicating that the two preparation techniques are not statistically comparable. It appears that the dominant taxon, Cyclicargolithus floridanus, is enriched in the smear slides, whereas the abundance of the subordinate taxa is about the same for either method. A comparative test of abundance counts between dense and thin areas on the same smear slide indicates nannofossil size sorting in the smearing technique, with proportionally more large specimens in the denser ripples.
0
5
10
15
20
25
30
35
40
45
1 2 3 4 5 6 7 8 9 10
N = 165 N = 332N = 501N = 683N = 836N = 974
Number of counted taxa
Rel
ativ
e ab
unda
nce
(%)
Figure 3. Comparison of relative abundance patterns obtained by counting increasing number of specimens (N).

6
4.2. Calcareous nannofossil preservation and biochronology
Paper II - Late Eocene to Oligocene preservation history and biochronology of calcareous nannofossils from paleo-equatorial Pacific Ocean sediments
In this paper a high-resolution preservation record of selected calcareous nannofossil species across the Eocene/Oligocene transition is presented together with late Eocene and Oligocene calcareous nannofossil biochronology. The preservation of nannofossil taxa is evaluated using percentages of complete versus broken specimens of five placolith taxa. Taxa less prone to dissolution are Reticulofenestra umbilicus, Coccolithus pelagicus, Ericsonia formosa and Dictyococites bisectus, while Cyclicargolithus floridanus is more susceptible to dissolution. The cumulative percentage of all complete placoliths versus all broken placoliths reflects in detail the changes in carbonate content. The two patterns are so similar that the proportion between complete and broken placoliths appears to have potential to be used as a proxy for carbonate contents, at least for this group of placolith taxa.
This study presents also a biochronologic framework for the following taxa: the HO of Discoaster barbadiensis (34.77 Ma), D. saipanensis (34.44 Ma), E. formosa (32.92 Ma), R. umbilicus (32.02 Ma), Sphenolithus predistentus (26.93 Ma), S. distentus (26.81 Ma), and S. ciperoensis (24.43 Ma), and the LO of S. distentus (30.00 Ma) and S. ciperoensis (27.14 Ma). The first consistent appearance of Triquetrorhabdulus carinatus occurs at 26.56 Ma, while the onset of the peak interval of T. carinatus was determined at 24.67 Ma. Biochronological comparisons are made with other sites from the Atlantic Ocean.
4.3. Oligocene Sphenolithus evolutionary lineage
Paper III - On the nature of the Oligocene Sphenolithus evolutionary lineage: insights from the paleo-equatorial Pacific Ocean
This study investigates changes in morphology within a biostratigraphically important Oligocene nannofossil lineage, Sphenolithus predistentus-distentus-ciperoensis, in order to determine the nature of this evolutionary lineage. Using differences in their morphology and biostratigraphic ranges, the aim of this study was to determine whether this set of sphenolith species represents an anagenetic evolutionary lineage or a
set of discrete species with overlapping geological ranges. One thousand specimens were analysed morphometrically, by measuring the basal ratio (the ratio between the proximal cycle height and basal width). These measures were identified as key parameters in this lineage. The study concludes that S. distentus and S. predistentus are intergradational species forming an anagenetic lineage and that S. ciperoensis is a discrete species which evolved relatively abruptly in the late Oligocene.
4.4. Describing a new nannolith species from the low latitude Pacific Ocean
Paper IV - A new Oligocene Triquetrorhabdulus species: Triquetrorhabdulus longus sp. nov.
While investigating the LO of Triquetrorhabdulus carinatus at ODP Site 1218 in the paleo-equatorial Pacific Ocean, a form that resembles this species was observed and counted separately (Blaj et al., 2009). Based on differences in size, shape, and stratigraphic range compared with the typical Triquetrorhabdulus carinatus, this longer morphotype has been described as a new and apparently biostratigraphically useful nannolith species, i.e. Triquetrorhabdulus longus sp. nov. Triquetrorhabdulus longus precedes the LO of T. carinatus by ~ 0.7 Myr. Its stratigraphic range has a duration of about 3.3 Myr. Triquetrorhabdulus longus shows a strong reduction in abundance parallel with the beginning of a sharp increase in abundance of T. carinatus.
4.5. Changes among calcareous nannofossil assemblages in the mid-Oligocene
Paper V - Abundance and diversity changes among calcareous nannofossil assemblages across the early/late Oligocene boundary in the paleo-equatorial Pacific Ocean
This paper presents a high-resolution study of relative abundances and diversity fluctuations of calcareous nannofossil assemblages in the mid-Oligocene interval showing high carbonate contents. The data generated are compared with stable isotope (C, O) and sediment flux data in order to establish possible relationships to changes in sea surface temperature and productivity. The nannofossil assemblage is dominated by Cyclicargolithus floridanus, Sphenolithus moriformis and Coccolithus pelagicus. Together, they show a combined mean abundance of 84 % throughout the investigated 3.6 Myr interval (30.0 - 26.4 Ma). All component taxa

7
show strong fluctuations in abundance. Variations in abundance and Shannon diversity index have been used to subdivide the 3.6 Myr long study interval into four subintervals. Intervals of highest Shannon index diversity coincide with Oi-glaciation events. However, the variations in abundance of selected nannofossil taxa do not appear to correlate with changes in either oxygen isotopes or carbon isotopes. This presumably indicates that a dynamic equilibrium did not exist between these Oligocene calcareous nannoplankton assemblages and changes in surface water temperature or productivity conditions. Observed changes in the nannofossil assemblages thus seem to have been driven probably by the internal evolutionary dynamics within the coccolithophore communities.
5. Results and discussion
5.1. Oligocene calcareous nannofossil taxonomic issues
The diversity of the calcareous nannofossil assemblages during the Oligocene was relatively low (Bown et al., 2004) and hence the number of well-established biostratigraphic markers in this interval is lower compared to other Cenozoic epochs (Martini, 1971; Bukry, 1978; Perch-Nielsen, 1985) (Fig. 4). The lowered rate of taxonomic evolution during Oligocene times has decreased the number of useful biostratigraphic events. So there is a need to refine species concepts in order both to increase the number of useful bioevents and to reduce ambiguity in species concepts. This study highlights several taxonomic problems, reflecting
the fact that there have been relatively few studies undertaken on Oligocene nannofossil taxonomy in recent decades. Improved taxonomy is crucial for the understanding of evolutionary processes in calcareous nannofossils and for producing reliable biostratigraphic and paleoceanographic data. In this study, these limitations are overcome by combining the biostratigraphic pattern and morphometric analysis of selected nannofossil taxa and LM and SEM investigations.
5.1.1 Reticulofenestra umbilicus-hillae plexus
The HO of Reticulofenestra umbilicus defines the Zone NP22/NP23 boundary of Martini (1971) and the CP16c/CP17 boundary of Okada and and Bukry (1980). This taxon is distinguished from other related taxa by its larger size. Morphological investigation is the most frequently used criteria for distinguishing between different species. Changes in placolith size and central opening size within Reticulofenestra are used for taxonomic purposes. Backman and Hermelin (1986) suggested the use of a lower placolith length of 14 µm for the identification of the first appearance of R. umbilicus. Reticulofenestra hillae has a thicker collar around the central opening and a smaller central opening, compared to R. umbilicus (Bukry and Percival, 1971; Backman and Hermelin, 1986). In this study, the morphometric measurements of Reticulofenestra spp. and the R. umbilicus-hillae plexus show that the placolith and central opening length and width are strongly correlated. Placolith lengths range between 11 µm and 18 µm for one cluster (representing the R. umbilicus-hillae plexus) and between 4 µm and 8 µm for another
a b
Number of biostratigraphic units Martini (1971) Number of boundary species Bukry (1978)
0 20 40 60 80 100
Total nannofosil diversity(Bown et al., 2004)
Miocene
Oligocene
Eocene
Paleocene
Pliocene
Pal
eoge
neN
eoge
ne
0 5 10 15 20 25120
10
20
30
40
50
60
Age(Ma)
1010
20
30
40
50
60
Age
(Ma)
Benthic
Pal
eoc.
Eoc
ene
Olig
ocen
eM
ioce
neP
lioP
e
-------------------------------------------------------------
Oi-1--------------------------------------------------------------
0
STUDIEDINTERVAL
δ18O (‰)
5 4 3 2 1 0 -1
Global composite (Zachos et al., 2001)
δ18O
Figure 4. Cenozoic nannofossil diversity data: (a) total nannofossil diversity; (b) the number of biostratigraphic units and boundary species used in the standard Cenozoic zonation schemes; Note the low diversity and low number of biostratigraphic events and boundary species in the Oligocene (hatched interval).

8
cluster (representing several smaller species, here referred to as Reticulofenestra spp.) (Fig 5). The results of the morphometric analyses do not show any bimodal distribution among the larger cluster, either in total length or central opening length (Fig. 5). Hence, it is difficult to distinguish R. umbilicus and R. hillae as two different subpopulations. Based on these results, R. umbilicus and R. hillae have been here combined into a single taxonomic entity, referred to as the R. umbilicus group. Furthermore, the 14 µm size limit for the R. umbilicus concept employed by Backman and Hermelin (1986) is not relevant in the late Eocene and early Oligocene at Site 1218 because the R. umbilicus group forms a coherent size cluster from approximately 11 µm to 18 µm. The 14 µm concept for the LO of R. umbilicus was introduced because the earliest ca. two
million years of the range of this taxon showed discontinuous occurrences in low abundances of the >12 µm and >13 µm forms (Backman and Hermelin, 1986, figure. 4). Mapping the spatial and temporal size variability of the R. umbilicus group in different paleoceanographic settings appears to be necessary in order to determine the reliability of its biochronologic and paleoecologic properties.
5.1.2. Oligocene Sphenolithus evolutionary lineage
The sphenoliths are important for the subdivision of Oligocene time (Roth et al., 1970; Perch-Nielsen, 1985). Key taxa include the Sphenolithus predistentus, Sphenolithus distentus predistentus, Sphenolithus distentusSphenolithus distentus distentus and Sphenolithus ciperoensisSphenolithus ciperoensis ciperoensis and intermediate forms (Olafsson och Villa, 1992). The sphenolithsOlafsson och Villa, 1992). The sphenoliths. The sphenoliths are also suitable for studies of evolutionary changes and phenotypic variations. Their continuous stratigraphic distribution and abundance (Fig. 6) at Site 1218 allows a detailed study of the Oligocene sphenolith lineage. As the morphological featuresAs the morphological features of a species changes through time, morphology is also the primary used criteria for analyzing evolutionary processes within a lineage. The oneThe one thousand randomly selected Sphenolith specimens (Fig. 7a) could be consistently identified to species level (Fig. 7b) based on their extinction pattern in polarized light (i.e. the extinction line between the apical cone and proximal height is straight in S. predistentus, V-shaped in S. distentus and X-shaped in S. ciperoensis). However, under the SEM investigation, the specimens are harder to distinguish. Measurements of the sphenolith basal width and basal width and proximal cycle height show that show that Sphenolithus
-------------------------
----
Age
(Ma)
S. predistentus S. distentus
S. ciperoensis
N/mm2
25
27
29
31
33
0 200 0 100 0 200
Figure 6. Abundances pattern (N/mm2) of S. predistentus, S. distentus and S. ciperoensis as identified at Site 1218.
2 6 10 14 18
2
6
10
14
18
Placolith length (µm)
R. umbilicus-hillae plexuscentral opening ofR. umbilicus-hillae plexus
0 2 4 6 8 100
2
4
6
8
Reticulofenestra spp.
leng
th
width width
leng
th
Placolith length (µm)
Pla
colit
h w
idth
(µm
)
Figure 5. Scatter plots showing the morphometric measurements of the Reticulofenestra umbilicus-R. hillae plexus and Reticulofenestra spp. in ten different samples. Insert micrographs show the reticulofenestrid morphological features investigated (i.e. placolith and central opening length and width). Note the difference is x and y scale between the two plots.

9
predistentus and S. distentus group overlap significantly. Sphenolithus ciperoensis, on the other hand, is rather well-separated from the other two taxa (Fig. 7b). The frequency histogram of theThe frequency histogram of the basal ratio shows a weakly bimodal distribution, with a poorly defined frequency minimum at 2.0 (Fig. 8). �t is obvious that this frequency minimum corresponds to the separation of S. ciperoensis from S. distentus and S. predistentus noted in the scatter diagram (Fig. 7b).
The results of morphometric measurements of the S. predistentus, S. distentus and S. ciperoensis lineage also show that the basal ratio (betweenalso show that the basal ratio (between basal width and proximal cycle height) is distinct between the different morphospecies and thus can be used to distinguish between the sphenoliths species. The highest mean basal ratio was observed in Sphenolithus predistentus (average 2.79), followed by a lower basal ratio in its descendant species S. distentus (average 2.23) and a still lower basal in the youngest member of the lineage, S. ciperoensis (average 1.70). These changes in basal ratio show that the investigated sphenolith lineage is made of three different morphospecies. However, it is important to note that the groups are
not very distinct in terms of bimodality. Our data show time-progressive changes in the basal ratio within the analyzed species toward morphospecies with larger proximal cycle height and smaller basal ratios (Fig. 9).
Based on their stratigraphic range observations and changes in their morphology, S. distentus and S. predistentus seem to have been the products of an anagenetic evolution, while S. ciperoensis is considered to be a discrete species which evolved rapidly by cladogenesis in the late Oligocene (Fig. 2). If these time-progressive trends If these time-progressive trends and changes in sphenolith morphology prove to be worldwide consistent, the Sphenolithus lineage could be another helpful case for investigating the evolutionary mechanisms that underlie size and morphology changes in calcareous nannofossils
1.5 2.5 3.5 4.50
20
40
60
80
100
Freq
uenc
y
Ratio between sphenolith basal width/proximal cycle height
S. ciperoensisS. distentusS. predistentus
Figure 8. Histograms of the basal ratio (between basal width and proximal cycle height) in 1000 sphenolith taxa.
2.5 3.02.0Ratio between sphenolith basal width/proximal cycle height
S. ciperoensis
S. distentusS. predistentus
29.86
29.51
29.20
28.89
28.54
28.24
27.84
27.43
27.08
26.76
Age (Ma)
Figure 9. Plot of changes in time of the mean basal ratio values in each of the 10 samples; bars represent standard error of the mean; shading indicates the diffrence in basal ratio between S. distentus and S. predistentus.
0.0
0.5
1.0
1.5
2.0
2.5
3.0
0 1 2 3 4 5 60.0
0.5
1.0
1.5
2.0
2.5
3.0
Sph
enol
ith p
roxi
mal
hei
ght (
µm)
Sphenolith width (µm)
proximalcycleheight
apicalcone
basal width
0 1 2 3 4 5 6
Sphenolithus spp.
Sphenolith width (µm)
S. predistentus
S. distentus
S. ciperoensis
----1.5 µm
a bS. ciperoensisS. distentusS. predistentus
Figure 7. (a) Relationship between proximal cycle height and basal width in the 10 investigated samples of 1000 unlabelled sphenoliths taxa; Insert drawing shows Sphenolithus distentus (from Young, 1998) and morphological features investigated in this study (i.e. basal width and proximal cycle height). (b) Scatter plot of proximal cycle height and basal width of the 1000 sphenoliths taxa identified as S. predistentus, S. distentus and S. ciperoensis (inserted micrographs).
10
(e.g., Young, 1990; Henderiks and Pagani, 2008). In order to further explore this, further investigations of Sphenolithus assemblages from different locations and latitudes and extended stratigraphic range are needed.
5.1.3. A new Oligocene nannolith species: Triquetrorhabdulus longus sp. nov.
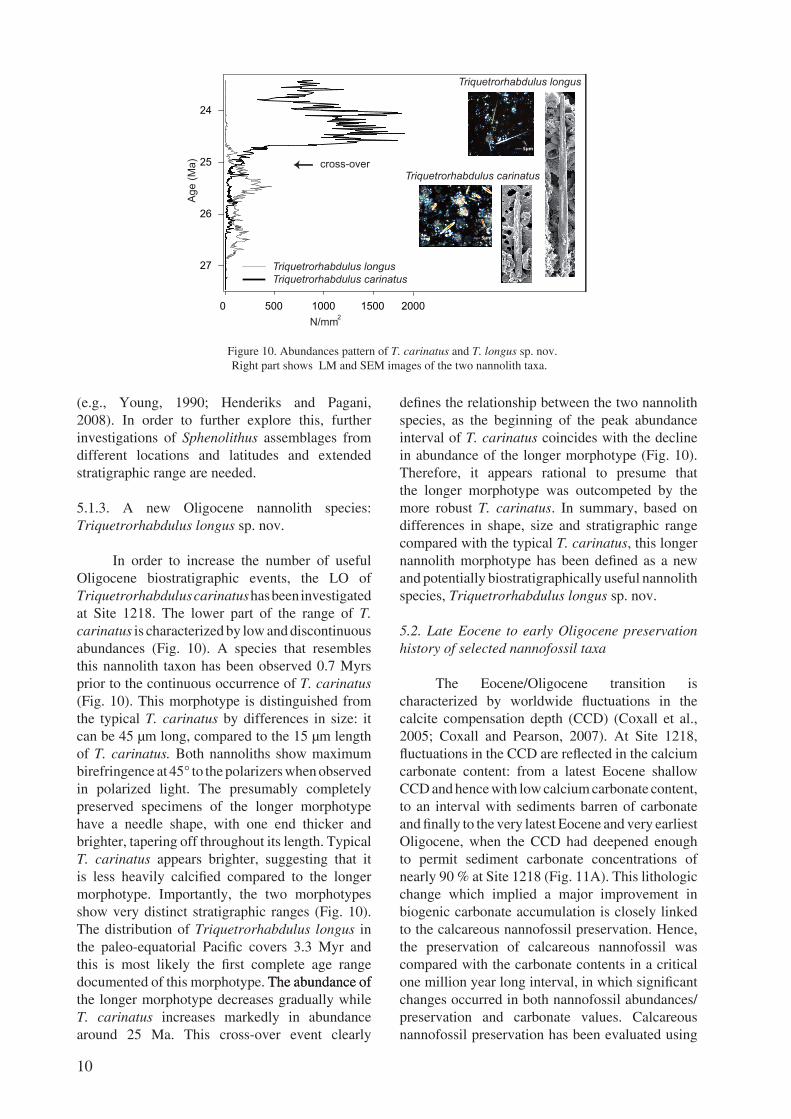
In order to increase the number of useful Oligocene biostratigraphic events, the LO of Triquetrorhabdulus carinatus has been investigated at Site 1218. The lower part of the range of T. carinatus is characterized by low and discontinuous abundances (Fig. 10). A species that resembles this nannolith taxon has been observed 0.7 Myrs prior to the continuous occurrence of T. carinatus (Fig. 10). This morphotype is distinguished from the typical T. carinatus by differences in size: it can be 45 µm long, compared to the 15 µm length of T. carinatus. Both nannoliths show maximum birefringence at 45° to the polarizers when observed in polarized light. The presumably completely preserved specimens of the longer morphotype have a needle shape, with one end thicker and brighter, tapering off throughout its length. Typical T. carinatus appears brighter, suggesting that it is less heavily calcified compared to the longer morphotype. Importantly, the two morphotypes show very distinct stratigraphic ranges (Fig. 10). The distribution of Triquetrorhabdulus longus in the paleo-equatorial Pacific covers 3.3 Myr and this is most likely the first complete age range documented of this morphotype. The abundance ofThe abundance of the longer morphotype decreases gradually while T. carinatus increases markedly in abundance around 25 Ma. This cross-over event clearly
defines the relationship between the two nannolith species, as the beginning of the peak abundance interval of T. carinatus coincides with the decline in abundance of the longer morphotype (Fig. 10). Therefore, it appears rational to presume that the longer morphotype was outcompeted by the more robust T. carinatus. In summary, based on differences in shape, size and stratigraphic range compared with the typical T. carinatus, this longer nannolith morphotype has been defined as a new and potentially biostratigraphically useful nannolith species, Triquetrorhabdulus longus sp. nov.
5.2. Late Eocene to early Oligocene preservation history of selected nannofossil taxa
The Eocene/Oligocene transition is characterized by worldwide fluctuations in the calcite compensation depth (CCD) (Coxall et al., 2005; Coxall and Pearson, 2007). At Site 1218, fluctuations in the CCD are reflected in the calcium carbonate content: from a latest Eocene shallow CCD and hence with low calcium carbonate content, to an interval with sediments barren of carbonate and finally to the very latest �ocene and very earliest Oligocene, when the CCD had deepened enough to permit sediment carbonate concentrations of nearly 90 % at Site 1218 (Fig. 11A). This lithologic change which implied a major improvement in biogenic carbonate accumulation is closely linked to the calcareous nannofossil preservation. Hence, the preservation of calcareous nannofossil was compared with the carbonate contents in a critical one million year long interval, in which significant changes occurred in both nannofossil abundances/preservation and carbonate values. Calcareous nannofossil preservation has been evaluated using
0 500 1000 1500 2000
Triquetrorhabdulus longusTriquetrorhabdulus carinatus
N/mm2
cross-over
24
25
26
27
Age
(Ma)
Triquetrorhabdulus carinatus
Triquetrorhabdulus longus
----
5µ
m --
--
----
5µ
m --
--
---- 5µm
---- 5µm
Figure 10. Abundances pattern of T. carinatus and T. longus sp. nov. Right part shows LM and SEM images of the two nannolith taxa.

11
percentages of complete versus broken/fragmented specimens of five placolith taxa. The five investigated placolith taxa are: Reticulofenestra umbilicus group, Ericsonia formosa, Coccolithus pelagicus, and Dictyococites bisectus group and Cyclicargolithus floridanus.
The studied interval covers the time between 34.63 Ma and 33.63 Ma. This interval has been divided into 4 intervals (Interval I to IV), based on the changes that occurred in both carbonate values and calcareous nannofossils (Fig. 11A). Between 34.15 Ma and 33.94 Ma, biogenic carbonate is lacking (0.2 and 2.9 % carbonate). At around 33.90 Ma, calcareous nannofossils return to the latest Eocene sediments, parallel with the initial sharp and rapid increase in carbonate. Planktic foraminifers, on the other hand, return 230 kyrs later than calcareous nannofossils (Fig. 11A), reconfirming the fact that calcareous nannofossil are less susceptible to dissolution than planktic foraminifers (Berger 1973). The following succession of calcareous nannofossil preservation and carbonate contents changes characterizes the one million year long study interval:
Late Eocene: 34.63 - 34.15 Ma - Interval ICarbonate values fluctuate between 2.3 and
22.3 % in what appears to be a cyclical trend. The nannofossil assemblages are characterized by heavily dissolved, fragmented/broken placoliths, composed mainly of the D. bisectus and R. umbilicus groups, C. pelagicus (“ghosts” - isolated proximal and/or distal shields of placoliths) and fragments of E. formosa (isolated proximal and/or distal shields). The complete/broken pattern of the nannofossil taxa varied in parallel with the carbonate content in Interval I (Fig. 11B-F), where the percentage of broken taxa represents over 60 % of the assemblage. Cyclicargolithus floridanus seems to be the most dissolution prone taxon, as the broken specimens of this species represent 95 %. Broken specimens of C. floridanus typically have the central area dissolved.
Late Eocene: 34.15 - 33.94 Ma - Interval IIThis interval is characterized by nearly
complete carbonate dissolution (0.2-1.7 % carbonate). A few overcalcified specimens belonging probably to the D. bisectus and R. umbilicus groups were observed in the upper part of this interval.
D. b
isec
tus
gr.
E. fo
rmos
a
4080
C. p
elag
icus
AGE (Ma)
4080
C. f
lorid
anus
INTE
RVA
L II
INTE
RVA
L III
INTE
RVA
L IV
NO
BIO
GEN
IC C
AR
BO
NAT
E
- - -
- - -
- - -
- - -
- -
O E bo
unda
ry(3
3.79
Ma)
- - -
- - -
- - -
33.6
3
33.6
8
34.1
5
33.9
4
34.6
3
Tota
l pla
colit
hs
040
80
AC
DE
FG
INTE
RVA
L I
R. u
mbi
licus
gr.
4080
B
Pan
els
B-G
: x-a
xis
show
CaC
O3 (
%) a
nd c
umul
ativ
e (%
)C
aCO
3 (%
)
PF p
rese
nt
00
040
800
4080
040
800
com
plet
eco
mpl
ete
com
plet
eco
mpl
ete
com
plet
eco
mpl
ete
brok
enbr
oken
brok
enbr
oken
brok
enbr
oken
CaC
O3(%
)
Figu
re 1
1. (
A)
Dis
solu
tion
patte
rn �
nter
vals
�-�
V (
34.6
3 M
a to
33.
63 M
a). T
hegr
aylin
ere
pres
ents
CaC
O3
(%).
Cum
ulta
tive
freq
uenc
es(i
n%
)of
com
plet
e(a
rea
left
ofhe
avy
blac
klin
ew
ithfil
led
The
gra
y lin
e re
pres
ents
CaC
O3
(%).
Cum
ulta
tive
freq
uenc
es (
in %
) of
com
plet
e (a
rea
left
of
heav
y bl
ack
line
with
fille
d ci
rcle
s) v
ersu
s br
oken
(ar
ea r
ight
of
heav
y bl
ack
line
with
fille
d ci
rcle
s) s
peci
men
s�� (
B)
R. u
mbi
licus
, (C
) E
. for
mos
a, (
D)
C. p
elag
icus
, (E
) D
. bis
ectu
s, (
F) C
. flor
idan
us, (
G)
Tot
al p
laco
liths
. Hat
ched
in
terv
al s
how
the
carb
onat
e ba
rren
Int
erva
l II.

12
Late Eocene and Eocene/Oligocene transition:33.94 - 33.68 Ma - Interval III
Carbonate values vary from 4.7 (just at the very base of this interval) to 82.5 % in this interval (11A). The initial increase in carbonate contents is sharp, increasing to more then 50 % over 66 kyrs. Nannofossil assemblages are characterized by a progressive increase of well preserved and complete placoliths, although broken/fragmented specimens are still present in high percentages. The base of Interval III is characterized by an increase in carbonate content and also a simultaneous appearance of complete specimens of all investigated taxa, except for C. floridanus, which continues to show high percentages of the broken specimens. Following the barren late Eocene Interval II, the D. bisectus group are the first identifiable specimens to re-appear. The recovery of R. umbilicus group, E. formosa and C. pelagicus from broken to complete taxa was quite sharp (Fig. 11B-D). Interval III is characterized by the dominance of the completely preserved placolith taxa, which represent over 80 % of the assemblage. The exception to this is C. floridanus, which continues to show high percentages of the broken specimens, although the carbonate content is high in this interval.
Early Oligocene: 33.68 - 33.63 Ma - Interval IV Carbonate values are highest in this interval,
fluctuating between 85.5 and 89.3 %. The base of this interval is placed where planktic foraminifers return. The percentage of complete calcareous nannofossil specimens dominates over broken/fragmented specimens, which show a sharp decrease in abundance. Interval IV is characterized by having more than 90 % complete specimens of R. umbilicus group, E. formosa, C. pelagicus and D. bisectus group. Cyclicargolithus floridanus shows a sharp increase, from 20 % to 50 % of the complete specimens in the basal part of the high carbonate content Interval IV. Only in the upper part of this interval, compared to the other three intervals, the complete C. floridanus specimens dominate over the broken ones. It follows thus that C. floridanus is the most dissolution prone placolith taxon in this interval.
To sum up, the cumulative percentage of all complete placoliths versus all broken placoliths mirrors in detail the changes in carbonate content (Fig. 11G). In fact, the two curves are so similar that the proportion between complete and broken placoliths, at least for this group of placolith taxa, appears to have potential as a proxy for carbonate contents.
5.3. Biochronology of the late Eocene to late Oligocene paleo-equatorial Pacific sediments and comparison with other reference sites
This study presents the first astronomically tuned age estimates of Oligocene calcareous nannofossils from the paleo-equatorial Pacific Ocean. Age estimates derived from Site 1218 are reported (Tab. 1) and compared to biochronologies from Lyle at al. (2002), Shackleton et al. (1999), Berggren et al. (1995), Olafsson and Villa (1992), Wei and Wise (1989), and Backman (1987). All age estimates are converted to the Pälike et al. (2006; tab. S2) astronomically calibrated timescale from Site 1218.
All nannofossil bioevents identified in the paleo-equatorial Pacific Site 1218 (Fig. 12) are discussed below:
•The late Eocene at Site 1218 is determined by the presence of the last rosette shaped discoasters, namely D. saipanensis and D. barbadiensis. These dissolution resistant species are overgrown prior to their extinction, which occurred in a low carbonate content interval (<20 %). The HO of D. saipanensis defines the base of Zone NP21 (Martini, 1971). At Site 1218, the HO of D. barbadiensis occurs at 34.77 Ma and the HO of D. saipanensis occurs at 34.44 Ma. The HOs of D. barbadiensis and D. saipanensis occur shortly prior to the Hantkenina extinction, which is used for definition of the Eocene/Oligocene transition (Premoli Silva and Jenkins, 1993).
•As Hantkenina is not preserved at Site 1218, the Eocene/Oligocene transition is inferred at Site 1218 via cyclostratigraphy (Pälike et al., 2006), at 33.79 Ma. The boundary falls in the early part of the 200 kyrs long plateau showing intermediate carbonate contents (Coxall et al., 2005). The stratigraphy around the Eocene/Oligocene transition is marked at Site 1218 by a major change from a dark brown radiolarite to light nannofossil chalk and ooze. This change in carbonate preservation and accumulation represents a major event that has been observed in many Pacific Ocean sites (van Andel et al., 1975), reflecting a major deepening of the CCD that occurred in two steps of 40 kyrs each separated by an intermediate plateau having a duration of about 200 kyrs (Coxall et al., 2005). At Site 1218, biogenic carbonate did not accumulate in a 210 kyrs long interval (34.15-33.94 Ma) (Fig. 11A), characterized by a CCD level shallower than the depositional depth of Site 1218. Carbonate values varied from 2.3 to 22.5 % in a cyclical way between about 34.63 and 34.15 Ma (Fig. 11A). The HOs of D. barbadiensis and D. saipanensis both

13
occur in this low carbonate content interval.•The HO of D. saipanensis is a synchronous
event within 68 kyrs in the tropical Pacific and Atlantic oceans, and in the middle latitude South Atlantic (Tab. 1). The 346 kyrs younger estimate from Site 516 (Wei and Wise 1989) is probably due to the poor magnetostratigraphic record at this site (Berggren et al., 1995).
•The HO of D. barbadiensis occurs 338 kyrs before the HO of D. saipanensis at Site 1218 (Table 1). Age estimates for these two events from the low and middle latitude Atlantic sites are consistently younger (Table 1). However, taking into account the better age-constrain and higher sampling resolution, it is assumed that the Site 1218 study show the genuine HO’s of D. barbadiensis and D. saipanensis.
•The HO of E. formosa defines the Zones NP21/NP22 boundary of Martini (1971) and the CP16b/CP16c boundary of Okada and Bukry (1980). The final decline and sharp extinction of E. formosa occurs in an interval with decreasing carbonate concentrations, from about 80 to 40 % carbonate. However, the extinction of E. formosa does not appear to have been biased by carbonate dissolution judging from its abundance pattern and the general shape of the carbonate content curve. The extinction of E. formosa at Site 1218 is determined to 32.91 Ma (Paper ��, fig. 5).
•The HO of E. formosa represents a virtually synchronous event in the tropical Pacific
and Atlantic oceans (Tab. 1). The only marked difference is in the eastern middle latitude South Atlantic, where it is 251 kyrs younger compared to Site 1218. The 251 kyrs younger estimate is derived from DSDP Hole 523 (Backman, 1987). His data from DSDP Hole 522, where the HO of E. formosa results in an age of 32.90 Ma, is only 14 kyrs younger than the estimate from Site 1218. The discrepancy between the neighbouring Sites 522 and 523 is probably caused by the slightly lower sedimentation rates in Site 523 in combination with variable sedimentation rates during the long Chron C12r (2.39 Myr on the B85 timescale). In conclusion, E. formosa provides a consistent and synchronous event in the low latitude Pacific and Atlantic oceans, and in the middle latitude South Atlantic.
•The HO of R. umbilicus defines the Zone NP22/NP23 boundary of Martini (1971) and the CP16c/CP17 boundary of Okada and Bukry (1980). Abundances decrease gradually in the top part of the range. This species also shows discontinuous occurrences in its upper range. The extinction of R. umbilicus at Site 1218 is determined to 32.02 Ma. The HO of R. umbilicus is a problematic marker which is difficult to pick consistently partly because of low abundances towards the end of its range (Paper ��, figure 6). �n addition, this taxon is mainly distinguished from other related taxa in terms of size differences, which probably also contributes to the fairly large spread in its estimated extinction
Conv. to P06 Conv. to P06(522)
S. Atlantic
S. Atlantic (522, 523)
location
(516)
(522)
(522)
(522)
(522)
(522, 523)
(516)
(522, 523)
(516)
(522, 523)
(516)
(926) Atlantic Pacific
(1218)
Table 1. Differences in age estimates of nannofossil biohorizons between this study and a few selected other studies: Ref.=Reference and corresponding location and site; OV92=Olafsson and Villa (1992); WW89=Wei and Wise (1989); B87=Backman (1987); B85=Berggren et al. (1985); B95=Berggren et al. (1995); S99=Shackleton et al. (1999); L02=Lyle et al. (2002; shipboard) data(1985); B95=Berggren et al. (1995); S99=Shackleton et al. (1999); L02=Lyle et al. (2002; shipboard) data(2002; shipboard) data converted to P06; Conv. to P06=all ages are converted to P06 timescale. Diff.=Difference (Myr) in age estimate between the ”This study” column and the corresponding age estimate in nearest left column. The sign (–) in diff. columns indicates that the age estimate is older than this study age estimate whereas (+) indicates that the age estimate is younger than the estimate of this study. LCO=lowest continuous occurrence; Sp->Sd=S. predistentus to S. distentus; *base of peak abundance, with >900 specimens/mm2; rmcd= revised meter composite depths.

14
age. Estimates vary from 614 kyrs younger to 445 kyrs older, in comparison to the age derived from Site 1218. Notably, the shipboard data from Site 1218 is 159 kyrs older than the result in this study (Table 1). This older estimate represents the highest continuous occurrence of R. umbilicus. Clearly, the HO of R. umbilicus must be used with caution.
•Oligocene sphenolith events and the HO of R. umbilicus show the largest inconsistencies between workers and regions. The only exception is the HO of S. predistentus, which appears to be only 25 kyrs older in the South Atlantic (Olafsson and Villa, 1992) compared to Site 1218. Thus, the HO of S. predistentus thus appears to represent the
most consistent Oligocene sphenolith marker in the middle latitude South Atlantic and tropical Pacific Ocean.
•Forms transitional between S. predistentus and S. distentus were observed well below the LO of the S. distentus s.s. The transitional forms show a distinct LO at 33.29 Ma. This form is common in the lower part of its range, and occurs discontinuously with lower abundances in its upper range. The last specimens were observed in a sample at 30.17 Ma.
•The LO of S. distentus defines the Zone CP17/18 boundary in Okada and Bukry (1980). At Site 1218 the LO of S. distentus was placed at 30.00 Ma, which is 3.3 Myrs after the appearance of the first transitional forms.
34
30
24
Age (Ma)
C7An
C6Cn.3n
C7n
C8n.1n
C8n.2n
C9n
C10n
C11n.2n
C11n.1n
C12n
C13n
C15nC16n
C13r.1n?
33.232
33.705
30.617
31.021
34.15134.285
35.12635.25435.328
29.16629.46729.53629.957
27.866
28.318
26.508
27.412
28
32
25.11025.24825.306
26.032
24.75624.984
24.022
24.459
23.27823.340
Chron
EO
CE
NE
late
OLI
GO
CE
NE
late
early
Epoch
HO S. ciperoensis
LO S. ciperoensis
HO S. distentusHO S. predistentus
LO S. distentus
HO R. umbilicus
HO E. formosa
HO D. barbadiensisHO D. saipanensis
Oligocene - MioceneBoundary
Calcareous nannofossil events
Eocene - OligoceneBoundary
20 40 60 80
CaCO3 (%)
CaCO (%)3
26
Figure 12. Magnetostratigraphy (Lanci et al., 2005), per cent calcium carbonate content(www.pangaea.de) and positions of biohorizons determined from Site 1218 (Blaj et al., 2009).
15
•The LO of S. ciperoensis defines the top of Zones NP23 (Martini 1971) and CP18 (Okada and Bukry 1980), respectively. Discontinuous occurrences in the earliest part of its range increase the uncertainty of its true age at Site 1218. It is continuously present from 27.09 Ma in Site 1218.
•Sphenolithus predistentus is not traditionally used for the subdivision of the Oligocene, but the importance of this taxon as biostratigraphic marker has been previously argued by, for example, Olafsson and Villa (1992). In the upper part of its range, the abundance decreases sharply just prior to the extinction, estimated to 26.93 Ma. Judging from the data at Site 1218, the distribution of S. predistentus shows a sharp final decline in abundance. Its HO therefore represents a useful biostratigraphic signal, which can be employed to approximate the Zone NP24/25 boundary and to increase the biostratigraphic resolution of the Oligocene, as was previously suggested by Olafsson and Villa (1992).
•The HO of S. distentus marks the NP24/NP25 and the CP19a/CP19b zonal boundaries. The highest continuous occurrence of S. distentus is observed at 26.95 Ma at Site 1218, which is followed by an interval of discontinuous and low abundances. This species has not been observed above 26.56 Ma. The mean age of this indistinct event is thus 26.81±0.114 Ma.
•The LO of S. ciperoensis shows the single largest age difference, in being 2586 kyrs older (Berggren et al., 1995) compared to the estimate derived from Site 1218. �ts first continuous occurrence at Site 1218 was observed at 27.090 Ma, and the absolutely lowest specimens at 27.194 Ma. The mean age of this event is thus placed at 27.14 Ma. This species seems to arrive later to the tropical western Atlantic by 242 kyrs (Shackleton et al., 1999) (Table 1). The oldest estimate for the evolutionary appearance of S. ciperoensis is at 27.532 Ma, derived from DSDP Hole 522 in the South Atlantic (Olafsson and Villa, 1992), thus arriving 390 kyrs earlier at this site compared to Site 1218. There is a long interval of transitional forms, encompassing 3117 kyrs, between S. predistentus and S. distentus. The first distinct S. distentus occurs at 30.00 Ma. It follows that this event likely is picked differently by different workers (Table 1). This event should be used with caution in the biochronologic subdivision of Oligocene time.
•The HO of S. ciperoensis defines the top of Zones CP19a of Okada and Bukry (1980) and the top of NP25 of Martini (1971). The HO is determined at 24.43 Ma. This is fully compatible with the shipboard data (Pälike et al., 2006, table
S2), if considering the larger depth uncertainty (1.5 m) in the shipboard determination. The abundances of S. ciperoensis towards the end of its range are so low that finding the absolutely last specimens in the true range of this species is difficult to reproduce precisely even if counting 50 FOV having >50 specimens/FOV. The HO of S. ciperoensis has an astronomically calibrated age of 24.13 Ma from Site 522 in the South Atlantic (Shackleton et al., 2000), which is 0.3 Myrs younger than the estimate from Site 1218. It is thus possible that the last observed specimens at Site 1218 represents a paleoecological event rather than the true extinction event of this species. This datum hence must be used with caution because of low abundances towards its uppermost range and clear diachrony between low and middle latitudes, disappearing earlier at lower latitudes.
•The oldest estimate of the HO of S. ciperoensis is from this study, which is, on the average, 461 kyrs older compared to other estimates presented in Table 1. The small size of this species in tropical regions combined with its rare abundances towards its upper range makes it difficult to pick this event consistently. The estimate from Site 1218 thus does not represents the extinction of this species, but probably a paleoecologically caused exclusion from the tropical assemblages; it survived for about half a million years longer in the South Atlantic (Olafsson and Villa, 1992).
5.4. Mid-Oligocene calcareous nannofossil whole assemblage study
The aim of this study is to present a high-resolution analysis of the relative abundances and diversity fluctuations of calcareous nannofossil assemblages in a mid-Oligocene interval showing high carbonate contents, in order to in investigate which factors controlled the changes occurring in the nannofossil assemblages.
The changes occurring in the nannofossil assemblages might have been presumably controlled by environmental factors (i.e. temperature and nutrient availability in the surface water) and/or by evolutionary trends within the nannofossil communities. High-resolution sampling of the mid-Oligocene sediments at Site 1218 provides detailed records that reveal that the nannofossil assemblage experienced marked changes in abundance and diversity index values in the 3.6 Myrs (30.00-26.4 Ma) study interval.
Cyclicargolithus floridanus, Sphenolithus moriformis and Coccolithus pelagicus dominate the nannofossil assemblages and show a combined

16
mean relative abundance of 83 % through the entire interval (Fig. 13). Common taxa include Discoaster spp., Reticulofenestra spp. and Sphenolithus predistentus. Rare taxa include Dictyococcites spp., Sphenolithus distentus, Sphenolithus ciperoensis, Sphenolithus tribulosus, Coronocyclus nitescens, Helicoshapera compacta and Triquetrorhabdulus spp., which comprise only <2 % of the total assemblage. The simple species richness ranges from 15 to 20 species (it taking in consideration that Discoaster spp., Dictyococcites spp., Reticulofenestra spp. and Triquetrorhabdulus spp. include at least more then one species).
Changes in relative abundances and hence in the Shannon diversity index of the investigated taxa occur at three stratigraphic horizons, and hence the 3.6 Myrs interval has been divided into four different intervals (Fig. 14), each showing a characteristic nannofossil abundance pattern and Shannon diversity index. The different characters in the four intervals may represent unique combinations or sets of temperature and productivity conditions in the photic zone, or alternatively, some other factors that generated the observed variability in abundance and diversity, such as evolutionary changes within the nannofossil communities.
At a large scale pattern, there is a general trend of increasing diversity values from basal interval 1 to basal interval 3, where a decreasing trend begins, followed by an increasing trend through interval 4 (Fig. 14). The increasing trends that occurred in the diversity index seem to be mainly the product of the decline in dominance of C. floridanus and in the lower part of the interval, the decline of S. moriformis and the relationship between the abundance of these two taxa (Fig. 14, last panel).
There is a clear cross-over in abundance, or change in dominance, between C. floridanus and S. moriformis, at the base of the chosen study interval. This may suggest that they occupied approximately the same ecological niche and whichever factor made the former increase in abundance therefore resulted in a reduction of the latter. Another possible explanation could be that the S. moriformis population in the lowermost part of the study interval holds more than one species, one of which became extinct. Such an event could have caused the distinct decline in relative abundance of the ‘S. moriformis’ group. One approach to investigating this last hypothesis would be to analyze other cores and see if similar changes occur. Another approach would be to see if there is a size or other morphological change which correlates with the changes in the abundance of S. moriformis. Since
the changes in the abundance of C. floridanus and S. moriformis are closely reflected by the diversity data, the next question to be answered is whether those changes are ecological or evolutionary in origin.
In order to investigate whether the changes in the photic zone environment (i.e. variations in temperature and productivity) may have affected the changes in the calcareous nannofossil assemblages, the nannofossil assemblage data generated in this study have been compared with carbon and oxygen isotopes data from both planktic and benthic foraminifera from Site 1218 (Wade and Pälike, 2004). The 3.6 Myrs long interval investigated here covers three episodes of δ18O maxima, referred to as the Oi-2*, Oi-2a and Oi-2b glaciations (Miller at al., 1991; Zachos et al., 2001; Wade and Pälike, 2004). Three of the described intervals at Site 1218 contain an Oi glaciation event, except for interval 1, characterized by lighter δ18O values (Fig. 14). The planktic and benthic foraminifera δ18O and δ13C isotope record from Site 1218 shows a long-term trend towards heavier values through the studied time interval (Fig. 14). Sudden and dramatic changes in the physico-chemical environment, such as the Cretaceous anoxic events, the Paleocene Eocene Thermal Maximum, the Eocene/Oligocene transition cooling event, or the Messinian salinity crisis, seem to correlate with changes in abundance, evolution and diversity among calcareous nannofossil assemblages (Erba, 2004; Raffi et al., 2005; Wade and Bown, 2006; Agnini et al., 2007; Dunkley Jones et al., 2008; Villa et al., 2008; Bown and Pearson, 2009; Raffi et al., 2009). However, in the mid-Oligocene low-latitude Site 1218, an interval characterized by non-dramatic changes in surface water conditions, the details of planktic and benthic δ18O or δ13C patterns, which presumably reflect changes in the physico-chemical environment, seem to be poorly reflected in the observed abundance patterns (Figs. 13-14). It follows that there is no obvious correlation, at face value, between the abundance variability of the assemblages on the one hand and the oxygen and carbon isotopic parameters on the other. �t is therefore difficult to directly link the observed variability in the calcareous nannofossil diversity to changes in temperature or productivity. Thus, changes that occurred in the nannofossil assemblages seem to have been driven by other factors. Most probably, this is a case when the evolutionary change predominates over environmental change as the dominant cause of assemblage change when investigating timescales of a few million years.

17
OLIGOCENElate early
020
4060
S. m
orifo
rmis
S. p
redi
sten
tus
05
S. d
iste
ntus
05
05
S. c
iper
oens
is
S. t
ribul
osus
Rel
ativ
e ab
unda
nce
(%)
D. d
efla
ndre
i and
D
isco
aste
rspp
.
020
05
05
C. n
itesc
ensH. c
ompa
cta
T. c
arin
atus
and
T. l
ongu
s
05
020
020
4060
C. f
lorid
anus
<
8µm
C. f
lorid
anus
> 8
µm
Ret
icul
ofen
estra
spp
.
020
C. p
elag
icus
05
Dic
tyoc
ocite
ssp
p.
020
020
26Age
(Ma)
C9n
C10
n
C11
n.2n
C11
n.1n
29.4
6729
.536
29.9
57
27.8
66
26.5
08
2927 3028
Pol
arity
27.4
12
28.3
18
29.1
66
a
b
c
d
e
f
g
h
i
j
k
l
m
n
bent
hic
plan
ktic
26Age
(Ma)
C9n
C10
n
C11
n.2n
C11
n.1n
29.4
6729
.536
29.9
57
27.8
66
26.5
08
2927
OLIGOCENElate early
3028
Pol
arity
-0.5
-1
.00.
00.
51.
01.
52.
0
δ13C
27.4
12
28.3
18
29.1
66
0
0.5
1
δ13C
Δbe
nthi
c-pl
ankt
ic g
radi
ent
(‰)
δ18O
Δbe
nthi
c-pl
ankt
ic g
radi
ent
1
1.5
2
Sha
nnon
Div
ersi
ty In
dex
1234
1.0
1.2
1.4
1.6
1.8
02
46
810
C. f
lorid
anus
/S. m
orifo
rmis
-10
12
3
Oi-2
b
Oi-2
a
Oi-2
*
bent
hic
plan
ktic
δ18O
(‰)
Rat
io
Figu
re 1
3. R
elat
ive
abun
danc
es o
f ta
xa (
%)
of th
e to
tal n
anno
foss
il as
sem
blag
e. C
hron
ostr
atig
raph
y an
d m
agne
tost
ratig
raph
y ar
e fr
om P
älik
e at
al.
(200
6) a
nd L
anci
et a
l. (2
005)
.
Figu
re 1
4. P
lank
tic a
nd b
enth
ic o
xyge
n an
d ca
rbon
isot
opes
are
fro
m W
ade
and
Pälik
e (2
004)
and
Päl
ike
et a
l., 2
006.
The
two
righ
t col
umns
sho
w S
hann
on d
iver
sity
inde
x an
d ca
lcul
ated
rat
io o
f C
. flo
rida
nus/
S. m
orifo
rmis
. Sta
ble
isot
ope
and
Shan
non
dive
rsity
dat
a ar
e pl
otte
d as
thre
e po
int m
ovin
g av
erag
es. T
he te
rmin
olog
y an
d ch
rono
logy
of
the
Oi-
even
ts f
ollo
w W
ade
and
Pälik
e (2
004)
.
18
5.5. Cyclicity in the calcareous nannofossil relative abundance and diversity patterns
At Site 1218, the time series analysis of δ18O and δ13C isotopes exhibits strong power at eccentricity periods of 405 kyr, 127 kyr and 96 kyr, and the 1.2 Myr obliquity cycle (Pälike et al., 2006, figure 2 and Fig. 15A). The high-resolution calcareous nannofossil assemblage data generated from Site 1218 sediments show evidence of taxa abundances fluctuating in what appears to be a cyclical fashion (Fig. 13). In order to investigate if these presumably cyclical variations in the calcareous nannofossil abundance patterns oscillates in the Milankovitch frequency band, preliminary time-series analyses have been made. These analyses can also reveal the relationship between carbon and oxygen isotopes, on the one hand, and calcareous nannofossil abundances on the other. In this way, one can better assess common cyclical behavior and establish any significant temporal off-sets (leads and/or lags).The results of these analyses are presented in Figure 15. The main component taxa of the assemblage, i.e. the C. floridanus and the Sphenolithus spp. groups, show minor peaks at 277 kyr, 151 kyr and 117 kyr (Fig. 15B). The data set reveals also major peaks in the C. floridanus group and Sphenolithus spp. group at 1.6 Myr and 1.2 Myr, respectively. None of the taxa show peaks with frequencies similar to Milankovitch cycles, but it appears that both dominant taxa display similar cyclical behavior (Fig. 15B). The only exception is the 1.2 Myr long amplitude �arth’s obliquity cycle (Pälike et al., 2006) observed in the Sphenolithus spp. group (Fig. 15B). The time-series analysis of the Shannon diversity index shows two minor peaks at 217 kyr and 127 kyr (Fig. 15C-D). The latter peak in the diversity index matches the 127 kyr eccentricity cycle observed also in the benthic δ18O isotope record (Pälike et al., 2006) (Fig. 15C). Thus, the diversity index seems to correlate with the benthic δ18O, which is an indicator of deep water temperature and/or ice volume. The Shannon diversity seems also to correlate with a planktic foraminiferal δ13C peak (217 kyr) (Fig. 15D). The planktic foraminiferal δ18O isotope record and the abundance of the dominant taxon, C. floridanus, seem to overlap at a minor peak of 151 kyr (Fig. 15E). The variations in calcium carbonate content (CaCO3) seem to coincide with the variations in the abundance of Sphenolithus spp. group and C. floridanus group at frequency peaks of 151 kyr and 1.6 Myr, respectively (Fig. 15F-G).
6. Concluding remarks
In this thesis, new high-resolution calcareous nannofossil records are presented from ODP Site 1218 sediments drilled from paleo-equatorial Pacific Ocean. The studied section covers the time interval between the late Eocene and the late Oligocene (35.03 Ma and 23.41 Ma). This study presents new insights on the taxonomy, preservation history, biostratigraphy and evolution of the Oligocene calcareous nannofossil assemblages in the low latitude Site 1218. The key observations and interpretations drawn from this study can be summarized as follows:
A. Reproducibility and accuracy of calcareous nannofossil assemblage counts obtained using smear and spray preparation techniques.
This study shows that both smear and spray replicates indicate a good reproducibility and accuracy within the same method. Using one or another of the two methods would give good reproducibility of the counts, as the 18 investigated taxa counted in the 15 replicate smear and 15 replicate spray slides largely overlap within the same method. However, the statistical tests show that the two methods are not comparable with each other.
B. Detailed analysis of the variability in preservation of selected calcareous nannofossil taxa across the Eocene/Oligocene transition.
This investigation represents a step ahead towards studying the variability of calcareous nannofossil preservation in late Eocene and early Oligocene sediments from a deep, paleo-equatorial depositional setting and the relationship between the calcium carbonate values and nannofossil taxa preservation. The nannofossil preservation has been assessed using percentages of complete versus broken specimens of five placolith species. When this measure is integrated for the five taxa, the resulting curve captures the general shape, as well as many of the details, of the carbonate content curve. The relative abundance of complete placoliths is thus strongly controlled by carbonate content.
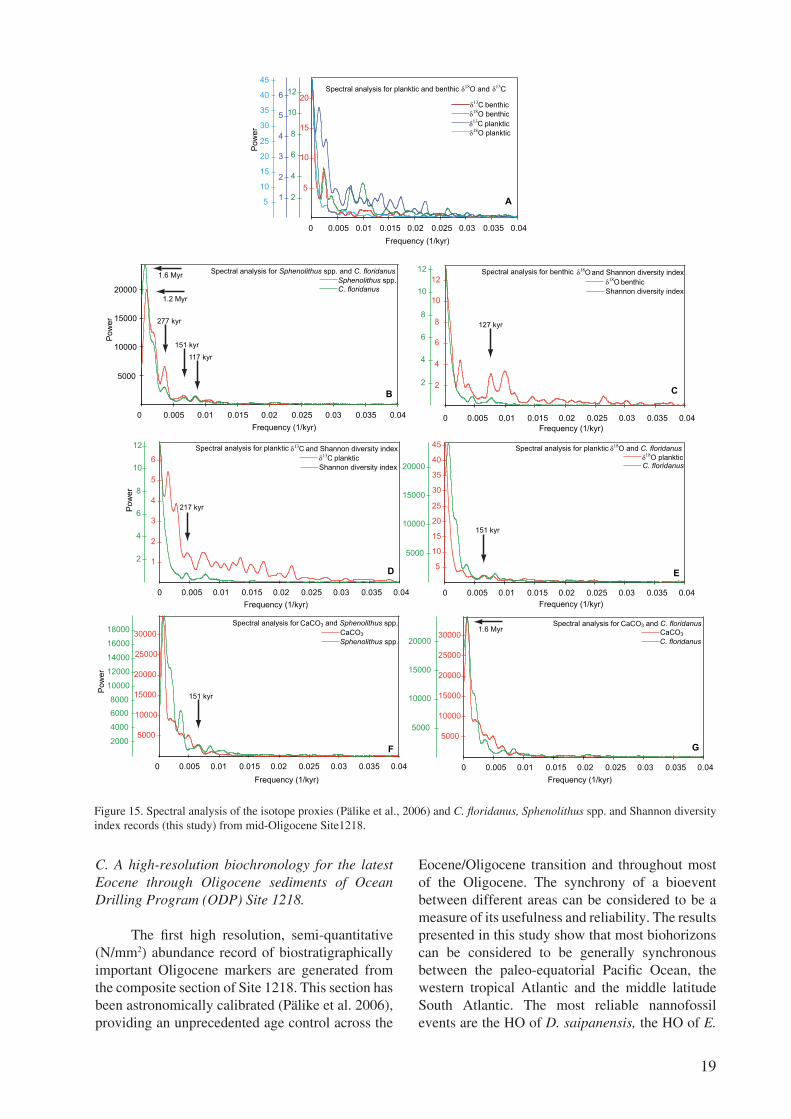
19
C. A high-resolution biochronology for the latest Eocene through Oligocene sediments of Ocean Drilling Program (ODP) Site 1218.
The first high resolution, semi-quantitative (N/mm2) abundance record of biostratigraphically important Oligocene markers are generated from the composite section of Site 1218. This section has been astronomically calibrated (Pälike et al. 2006), providing an unprecedented age control across the
Eocene/Oligocene transition and throughout most of the Oligocene. The synchrony of a bioevent between different areas can be considered to be a measure of its usefulness and reliability. The results presented in this study show that most biohorizons can be considered to be generally synchronous between the paleo-equatorial Pacific Ocean, the western tropical Atlantic and the middle latitude South Atlantic. The most reliable nannofossil events are the HO of D. saipanensis, the HO of E.
5
10
15
20
2
4
6
8
10
12
1
2
3
4
5
6
5
10
15
20
25
30
35
40
45
0 0.005 0.01 0.015 0.02 0.025 0.03 0.035 0.04
1
2
3
4
5
6
2
4
6
8
10
12
0 0.005 0.01 0.015 0.02 0.025 0.03 0.035 0.04
5000
10000
15000
20000
25000
30000
2000
4000
60008000
10000
12000
14000
16000
18000
0 0.005 0.01 0.015 0.02 0.025 0.03 0.035 0.04
5000
10000
15000
20000
25000
30000
5000
10000
15000
20000
0 0.005 0.01 0.015 0.02 0.025 0.03 0.035 0.04
2
4
6
8
10
12
2
4
6
8
10
12
0 0.005 0.01 0.015 0.02 0.025 0.03 0.035 0.04
5
10
15
20
25
30
35
40
45
5000
10000
15000
20000
0 0.005 0.01 0.015 0.02 0.025 0.03 0.035 0.04
5000
10000
15000
20000
0 0.005 0.01 0.015 0.02 0.025 0.03 0.035 0.04
δ18O and δ13CSpectral analysis for planktic and benthic
Pow
er
Pow
er
Pow
er
Pow
er
Frequency (1/kyr)
Frequency (1/kyr)
Frequency (1/kyr)
Frequency (1/kyr) Frequency (1/kyr)
Frequency (1/kyr)
Frequency (1/kyr)
Spectral analysis for Sphenolithus spp. and C. floridanus
δ13C planktic δ18O planktic
δ18O benthic δ13C benthic
Sphenolithus spp. C. floridanus
CaCO3Spectral analysis for and C. floridanus
C. floridanusCaCO3
CaCO3Spectral analysis for and Sphenolithus spp.
Sphenolithus spp.CaCO3
δ18O and C. floridanus Spectral analysis for planktic δ18O planktic C. floridanus
δ13C planktic δ13C and Shannon diversity index Spectral analysis for planktic
Shannon diversity index
δ18O and Shannon diversity index Spectral analysis for benthicδ18O benthicShannon diversity index
277 kyr
151 kyr
117 kyr
151 kyr
1.6 Myr
151 kyr
1.2 Myr
1.6 Myr
217 kyr
127 kyr
A
B C
D E
F G
Figure 15. Spectral analysis of the isotope proxies (Pälike et al., 2006) and C. floridanus, Sphenolithus spp. and Shannon diversity index records (this study) from mid-Oligocene Site1218.

20
formosa and the HO of S. predistentus. Although the HO of S. predistentus is not used in the two classical calcareous nannofossil zonations (Martini, 1971; Bukry, 1978), this bioevent appears to be the most consistent, in terms of synchrony, Oligocene sphenoliths marker in the paleo-equatorial Pacific Ocean and the middle latitude South Atlantic. Thus, in order to increase the biostratigraphic resolution of the Oligocene, the HO of S. predistentus could be employed to approximate the Zone NP24/25, as previously suggested by Olafsson and Villa (1992). Less reliable events are considered to be the LO and HO of S. ciperoensis and S. distentus, the HO of R. umbilicus, and LO of T. carinatus. Low and/or discontinuous occurrences in the initial and/or final parts of the range of these taxa make it difficult to pick the associated biohorizons consistently. This study underlines the importance of using high resolution sampling in order to better constrain the nannofossil datums in marine biostratigraphy and to better understand the behavior of nannofossil marker species throughout their virtually entire stratigraphic ranges.
D. Improving Oligocene nannofossil taxonomy
The application of strict taxonomic concepts for nannofossil biostratigraphic marker taxa are vital when comparing the stratigraphic occurrences of the bioevents between regions and nannofossil workers. This study re-visits this potentially disconcerting topic by combining morphometric measurements and stratigraphic distribution of the nannofossil taxa in order to better constrain their taxonomic concepts. Key taxonomic findings include the following��
• Based on the morphometric measurements of the Reticulofenestra umbilicus – hillae plexus placoliths, the two taxa could not be separated from each other; the 14 µm size limit for the R. umbilicus concept it is not applicable in the studied lateit is not applicable in the studied latelate Eocene and early Oligocene section at Site 1218;section at Site 1218;at Site 1218; • For the first time, morphometric data are provided that can help distinguish three sphenolith morphospecies: Sphenolithus predistentus, S. distentus and S. ciperoensis. The ratio between basal width and proximal cycle height appears to be distinct between the morphospecies and thus can be used to distinguish between the investigated sphenoliths species. The LO of S. distentus appears to represent a shift in morphology within an anagenetic lineage while the LO of S. ciperoensis marks a much more abrupt morphological shift and more probably a cladogenetic event shortly
followed by extinction of the ancestral species. •In order to increase the number of the Oligocene biostratigraphic events, a new nannolith species has been described: Triquetrorhabdulus longus sp. nov., based on the differences in size, shape, anddifferences in size, shape, and stratigraphic range compared with the only other known Oligocene Triquetrorhabdulus species, T. carinatus.
E. Document the composition, abundance and diversity patterns of the mid-Oligocene calcareous nannofossil assemblages in a 3.6 Myrs interval.
The calcareous nannofossil assemblages are dominated by C. floridanus and S. moriformis, showing a combined mean abundance of 69 % throughout the entire interval. Coccolithus pelagicus (15 %) is the third most abundant species. About 14 % of the assemblage is made up of taxa showing lower relative abundances, including Discoaster spp., Reticulofenestra spp. and S. predistentus. The remaining <2 % of the total assemblage include: Dictyococcites spp., S. distentus, S. ciperoensis, S. tribulosus, C. nitescens, H. compacta and Triquetrorhabdulus spp. The investigated mid-Oligocene interval is characterized by abundance changes in nannofossil assemblages and in Shannon diversity index values, which have been used to subdivide the 3.6 Myr long study interval into four subintervals. Changes in the abundance of the dominant taxa, C. floridanus seem to dictate the diversity index pattern through the mid-Oligocene interval.
F. Calcareous nannofossil assemblage fluctuations: a response to environmental or evolutionary controlling factors?
The new high-resolution record generated in this study provides the first insight into the nature of the changes occurring into calcareous nannofossil assemblage in the mid-Oligocene low-latitude Pacific Ocean. Calcareous nannofossil assemblages appear not to directly related to the environmental changes (i.e. temperature and nutrient availability changes) that are inferred to have occurred in the surface waters. Assemblage fluctuations rather suggest an evolutionary change, which dominates over the environmental factors in this relatively short 3.6 Myrs timescale interval. The calcareous nannofossil assemblage abundance and Shannon diversity data seem not to be sensitive enough to be successfully used as paleoecological indicators/proxies, at least during this mid-Oligocene time interval showing non-dramatic stable surface

21
water conditions in the low latitude Pacific Ocean. Future high-resolution investigations of calcareous nannofossil assemblages from different localities and latitudes would reveal if the evolutionary changes indeed are the controlling factors of the mid-Oligocene nannofossil assemblage changes.
7. Future perspective
This study has investigated certain aspects of the late Eocene through Oligocene calcareous nannofossil assemblages at Site 1218. There are, however, many other questions that can be addressed using this rather unique sedimentary material from the paleo-equatorial Pacific. For example, whole assemblages are quantified in a restricted 3.6 Myr long interval. This effort could of course be expanded to encompass the entire late Eocene through Oligocene interval. Furthermore, size variability of key Oligocene genera such as Cyclicargolithus, Dictyoccocites and Reticulofenestra could be investigated, preferably together with stable isotope data (C, O) from the bulk sediment, that is, the nannofossil fraction.
Paleoecologic whole assemblage data
Both modern (Okada and Honjo, 1973) and Cenozoic (Haq and Lohmann, 1976) calcareous nannoplankton show biogeographic preferences. Producing high resolution whole assemblage data of calcareous nannofossil for paleoecologic reconstruction from this tropical site would probably add important pieces to the Oligocene paleoclimate puzzle. A recent high-resolution calcareous nannofossil study from Tanzania showed that the calcareous nannofossil assemblages underwent marked changes forced by abiotic factors, at the Eocene/Oligocene transition (Dunkley Jones et al., 2008). What is the response of the calcareous nannofossil to Eocene/Oligocene paleoenvironmental change in the paleo-equatorial Pacific? This question could be addressed through quantification of total assemblages around the �ocene/Oligocene boundary. The question to be answered is whether the Eocene/Oligocene climatic shifts is more likely to pose an abiotic forcing on the calcareous nannofossil assemblages and their evolutionary patterns in the paleo-equatorial Pacific Ocean.
Size variability of key Oligocene genera (Cyclicargolithus, Dictyoccocites, Reticulofenestra)
Pronounced variability in size of species
belonging to genera such as Cyclicargolithus, Dictyoccocites and Reticulofenestra has been demonstrated (Blaj et al., 2009). Certain forms grew to more than double their size. Do the size changes among the different genera occur in synchrony? �s it related to high-frequency (glacial-/interglacial) oscillations or longer-term trends? These questions can only be answered through detailed morphometric analysis of statistically adequate numbers of specimens in the critical groups.
Stable isotope data (C, O) from the bulk sediment fraction for parts of the sample set
The studies of Wade and Pälike (2004) and Pälike et al. (2006) established planktic and benthic foraminifera stable isotope stratigraphies from the entire Oligocene from Site 1218, together with a short interval of bulk sediment isotope data. The bulk sediment is mainly composed of calcareous nannofossil and the bulk isotope signal therefore represents the nannofossil isotope stratigraphy. How does the planktic foraminifer and nannofossil stable isotope records compare? Generating a complete bulk sediment isotope record throughout the study interval could facilitate the interpretation of the paleoecological response of calcareous nannofossil assemblages to the paleoenvironmental change that occurred during Oligocene times.
Acknowledgements
There are many people who have had considerable impact on me and my work during the Swedish episode of my life. I would like to take this opportunity and thank them all. First of all, I would like to thank my supervisor, Jan Backman for giving me the opportunity to start a PhD in the Marine Geoscience group. Ett stor tack for all the support and excellent guidance throughout this work. Thank you also for trying to elucidate the mysteries of scientific writing in �nglish to me.
I would also like to thank my co-supervisor Jorijntje Henderiks for her so-much-needed constructive criticism and support. �sabella Raffi, my external co-supervisor, is acknowledged for help during my visit to the University of Chieti and for her valuable feedback. Jeremy Young is gratefully acknowledged for being a never ending inspiration source during and after my Synthesis visit to the Natural History Museum, London and, most importantly, for making me discover the beauty of the coccolithophores. Heiko Pälike was a good host during my visit to the National
22
Oceanography Centre, Southampton and kindly provided me with his data-set. This PhD study benefited from conversations with Jeremy Young, Helen Coxal, Heiko Pälike, Emil Rehnberg, Miloš Bartol, Ramona Balc and Bridget Wade.
Then, I would like to thank all my fellow PhD students and colleagues for creating a great atmosphere and for nice coffee breaks. I really enjoyed sharing office with Benjamin and Linda during my last year in the department. Benjamin, I owe you a big Danke schön for all your help! Thank you Emma, Daniela, Åsa, Louise and Cécile for delicious cakes (and not only). Very special thanks to Malin, Verity, Nils, Runa, Marianne, Lars Erik, Calle, Ludvig, Henrik, Paula, Carl, Klara and many others for being such pleasant lunch/dinner company. Administrative issues were kindly solved by Runa Eve, Elisabeth, Monica and Dan. Arne, Björn and Rezwan provided valuable help with computer related problems.
Without my friends, I probably would not have been able to simultaneously explore the ocean and myself. So, I am happy to give a big hug and thank you to all these wonderful people: Anna, I am so happy to have met you and to have had the chance to start learning Swedish with you; you were my first and best teacher; Leon, îţi mulţumesc for grabbing my hand and taking me away; Sofia, tack for the most beautiful and contagious smile; Maia, îţi mulţumesc pentru poveştile de seară; Dear Maria, Marina, Stefano, Nils N. and Ram: I cherish our nice walks, talks, international dinners and unforgettable trips; Mia cara Silvia, you have been a great friend over the last three years and especially over the summer/autumn days you spent with me; I miss you and I am looking forward to see you again; Markus, tack for not always listening, but being there; Lumi, mersi pentu tot; Zyta and Viktor, dzięki & hvala for the nice time spent together.
Financial support for this work was provided by Stockholm University and by grants to Jan Backman from the Swedish Research Council. This research also received support from the SYNTH�SYS Project which is financed by European Community Research Infrastructure Action. Postgraduate student support from the Stockholm Marine Research Center is acknowledged. This work used samples provided by the Ocean Drilling Program.
Antonia şi �oana, mândrele mele surori, simţăsc amu timpu aista, pătrăcut dăparti dă voi, aşe dă piert...nimi şi nimică n-o mărtat dăpărtarea asta dântră noi...mi-aţi lipsât în fieşcare zâuă! Mama şi tata, vă mulţămăscu că aţi crăzt in mini cându io n-am mai crăztu!...Daniele, îţi mulţămăscu...
References
Agnini, C., Fornaciari, E., Rio, E., Tateo, F., Backman J., Giusberti, L., 2007. Responses ofResponses of calcareous nannofossil assemblages, mineralogy and geochemistry to the environmental perturbations across the Paleocene/Eocene boundary in the Venetian Pre-Alps. Marine Micropaleontology 63, 19-38.
van Andel, T.H., Heath, G.R., Moore, T.C. Jr., 1975. Cenozoic History and Paleoceanography of the Central �quatorial Pacific Ocean�� A Regional Synthesis of Deep Sea Drilling Project Data. Memoirs Geol. Soc. Am., 143, 1-134.
Aubry, M.-P., 1984. Handbook of Cenozoic calcareous nannoplankton, Book 1: Ortholithae (Discoasters). Micropaleontology Press, American Museum of Natural History, New York, 265 pp.
Aubry, M.-P., 1988. Handbook of Cenozoic calcareous nannoplankton, Book 2: Ortholithae (Holochoccoliths, Ceratoliths and others). Micropaleontology Press, American Museum of Natural History, New York, 279 pp.
Aubry, M.-P., 1989. Handbook of Cenozoic calcareous nannoplankton, Book 3: Ortholithae (Pentaliths, and others) Heliolithae (Fasciculiths, Sphenoliths and others). Micropaleontology Press, American Museum of Natural History, New York, 279 pp.
Aubry, M.-P., 1990. Handbook of Cenozoic calcareous nannoplankton, Book 4: Heliolithae (Helicoliths, Cribriliths, Lopadoliths and others). Micropaleontology Press, American Museum of Natural History, New York, 381 pp.
Aubry, M.-P., 1999. Handbook of Cenozoic calcareous nannoplankton, Book 5: Heliolithae (Zygolithus and Rhabdolithus). Micropaleontology Press, American Museum of Natural History, New York, 367 pp.
Aubry, M.-P., Van Couvering, J.A., 2005. BuriedBuried Time: Chronostratigraphy as a Research Tool. In: Eduardo, A., Koutsoukos, M. (Eds.) Applied Stratigraphy. Springer-Verlag, pp. 23-53.
Backman, J., Shackleton, N.J. 1983. QuantitativeQuantitative biochronology of Pliocene and early Pleistocene calcareous nannofossils from the Atlantic, Indian and Pacific oceans. Marine Micropaleontology 8, 141-170.
Backman, J., Hermelin, J.O.R. 1986. Morphometry of the Eocene nannofossil R. umbilicus lineage and its biochronological consequences. Palaeogeography, Palaeoclimatology, Palaeoecology 57, 103-106.
Backman, J., 1987. Quantitative calcareous

23
nannofossil biochronology of middle Eocene through early Oligocene sediment from DSDP Sites 522 and 523. Abh. Geol. Bundesanst.Abh. Geol. Bundesanst., 39, 21-31 Wien.
Berger, W.H., 1973. Deep-sea carbonates: Pleistocene dissolution cycles. Journal of Foraminiferal Research 3, 187-195.
Berggren, W.A., Kent, D.V., Flynn, J.J., 1985. Jurassic to Paleogene, Part 2. Paleogene geochronology and chronostratigraphy. In Snelling N.J. (Ed.). The Chronology of the Geological Record. Geol. Soc. London Mem., 10, pp. 141-195.
Berggren, W.A., Kent, D.V., Swisher, C.C, Aubry M., 1995. A Revised Cenozoic Geochronology and Chronostratigraphy. In Berggren, W. A., Kent, D.V., Swisher C.C, Aubry, M.-P., Hardenbol, J. (Eds) Geochronology, Time Scales and Global Stratigraphic Correlation. SEPM Special Publication No. 54, pp 129-212.
Blaj, T., and Henderiks, J., 2007. Smear andSmear and spray preparation techniques put to the test (II): reproducibility and accuracy of calcareous nannofossil assemblage counts. Journal of Nannoplankton Research 29, 92-100.
Blaj,. T., Backman, J., Raffi, �., 2009. Late Eocene to Oligocene preservation history and biochronology of calcareous nannofossils from paleo-equatorial Pacific Ocean sediments. Rivista �taliana di Paleontologia e Stratigrafia 115/1, 67-85.
Blaj, T., Henderiks, J., Young, J., Rehnberg, E., submitted. On the nature of the Oligocene Sphenolithus evolutionary lineage: insights from the paleo-equatorial Pacific Ocean.. Journal of Micropalaeontology.
Blaj, T., Young, J., submitted. A new Oligocene Triquetrorhabdulus species: Triquetrorhabdulus longus sp. nov. Journal of Nannoplankton Research.
Blaj, T. manuscript. Abundance and diversity changes among calcareous nannofossil assemblages across the early/late Oligocene boundary in the paleo-equatorial Pacific Ocean.
Bown, P.R., Lees, J.A., Young J.R., 2004. Calcareous nannoplankton evolution and diversity through time. In: Thierstein, H.R. and Young J.R. (Eds.) Coccolithophores - From molecular processes to global impact. Springer-Verlag, pp. 481-508.
Bown, P.R., Pearson, P., 2009. Calcareous plankton evolution and the Paleocene/Eocene thermal maximum event: New evidence from Tanzania. Marine Micropaleontology 71, 60-70.
Bukry, D., Percival, S.F. 1971. New Tertiary
calcareous nannofossils. Tulane Studies in Geology and Paleontology 8, 123-146.
Bukry, D., 1978. Cenozoic Coccolith, silicoflagellate, and diatom stratigraphy, Deep Sea Drilling Project, Leg 44. In: Benson, W.E., Sheridan, R.E., et al., Initial Reports of the Deep Sea Drilling Project, v. 44: Washington (U.S. Government Printing Office), pp. 807-864.
Coxall, H.K., Wilson, P.A., Pälike, H., Lear, C.H., Backman, J. 2005. Rapid stepwise onset of Antarctic glaciation and deeper calcite compensation in the Pacific Ocean. Nature 433, 53–57.
Coxall, H.K., Pearson, P.N. 2007. The Eocene – Oligocene transition. �n�� Williams, M., Hayward, A., Gregory, J., Schmidt, D., (Eds). Deep time perspectives on climate change: marrying the signal from computer models and biological proxies. The Micropalaeontological Society Special Publication, 2, pp. 351-387.
Dunkley Jones, T., Bown, P.R., Pearson, P.N., Wade, B.S., Coxall, H.K., Lear, C.H. 2008. Major shifts in calcareous phytoplankton assemblages through the Eocene-Oligocene transition of Tanzania and their implications for low-latitude primary production. Paleoceanography 23, PA4204, doi:10.1029/2008PA001640.
Erba, E. 2004. Nannofossils and Mesozoic oceanic anoxic events. Marine Micropaleontology 52,Marine Micropaleontology 52, 85–106.
Exon, N.F., Kennett, J.P., Malone, M.J., et al., 2001. Proc. ODP, Init. Repts., 189: College Station, TX (Ocean Drilling Program). doi:10.2973/odp.proc.ir.189.2001
Haq, B.U., Lohman, G.P., 1976. �arly calcareous nannoplankton biogeography of the Atlantic ocean. Marine Micropaleontology 1, 119-194.
Henderiks, J., Törner, A., 2006. Reproducibility of coccolith morphometry: Evaluation of spraying and smear slide preparation techniques. Marine Micropaleontology 58, 207-218.
Henderiks, J., Pagani, M., 2008. CoccolithophoreCoccolithophore cell size and the Paleogene decline in atmospheric CO2. Earth and Planetary Science Letters 269, 575-583.
Honjo, S., 1976. Coccoliths: production, transportation and sedimentation. Marine Micropaleontology 1, 65-79.
Huber, M., Brinkhuis, H., Stickley, C.E., Döös, K., Sluijs, A., Warnaar, J., Schellenberg, S.A. and Williams, G.L., 2004. Eocene circulation of the Southern Ocean: Was Antarctica kept warm by subtropical waters?, Paleoceanography, 19, PA4026, doi:10.1029/2004PA001014.
Incarbona, A., Di Stefano, E., Sprovieri, R., Bonomo,

24
S., Censi, P., Dinarès-Turell, J., Spoto, S., 2008. Variability in the vertical structure of the water column and paleoproductivity reconstruction in the central-western Mediterranean during the Late Pleistocene. Marine Micropaleontology 69, 26-41.
Jovane, L., Coccioni, R., Marsili, A., Acton, G., 2009. The late Eocene greenhouse-icehouse transition: Observations from the Massignano global stratotype section and point (GSSP), In: Koeberl, C., Montanari, A., (eds.), The Late Eocene Earth-Hothouse, Icehouse, and Impacts. Geological Society of America, Special Paper 452, p. 149-168, doi: 10.1130/2009.2452(10)
Lear, C.H., �lderfield, H., Wilson, P.A., 2000. Cenozoic Deep-Sea Temperatures and Global Ice Volumes from Mg/Ca in Benthic Foraminiferal Calcite. Science 287, 269-272 doi: 10.1126/science.287.5451.269.
Levine, D., Ramsey, P., Smidt, R., 2001. Applied Statistics for Engineers and Scientists Using Microsoft Excel® and MINITAB®. Prentice Hall, Upper Saddle River, New Jersey 07458: 671 pp.
Lohmann, H., 1902. Die Coccolithophoridae, eine Monographie der Coccolithen bildenden Flagellaten, zuglekh ein Beitrag zur Kenntnis des Mittelmeerauftriebs. Arch. Protistenk. 1, 89-165
Lyle, M., Wilson, P.A., Janecek, T.R., et al., 2002. Proc. ODP, Init. Repts., 199: College Station, TX (Ocean Drilling Program). doi:10.2973/odp.proc.ir.199.2002
Lyle, M., Barron, J., Bralower, T.J., Huber, M., Olivarez Lyle, A., Ravelo, A.C., Rea, D.K., Wilson, P.A., 2008. Pacific Ocean and Cenozoic evolution of climate, Reviews of Geophysics. 46, RG2002, doi:10.1029/2005RG000190.
Martini, E., 1971. Standard Tertiary and Quaternary calcareous nannoplankton zonation. In Farinacci,In Farinacci, A., (Ed.), Proc. 2nd Int. Conf. Planktonic Microfossils Roma: Rome (Ed. Tecnosci.) 2,Tecnosci.) 2, 739-785.
McIntyre, A., 1967. Coccoliths as paleoclimatic indicators of Pleistocene glaciation. Science 158, 1314-1317.
McIntyre, A., Bé, A.W.H., 1967. Modern coccolithophores from the Atlantic Ocean - I. Placoliths and Cyrtoliths. Deep-Sea Research 14, 561-597.
Miller, K.G., Wright, J.D., Fairbanks, R.G., 1991. Unlocking the Ice House: Oligocene-Miocene Oxygen Isotopes, Eustasy, and Margin Erosion. Journal of Geophysical Research 96, 6829-6848.
Okada, H., Honjo, S., 1973. The distribution of oceanic coccolithophorids in the Pacific, Deep-Sea Research 20, 355–374.
Okada, H., Bukry, D., 1980. Supplementary modification and introduction of code numbers to the low-latitude coccolith biostratigraphic zonation. Marine Micropaleontology 5, 321-325.
Olafsson, G., Villa, G. 1992. Reliability of sphenoliths as zonal markers in Oligocene sediments from the Atlantic and Indian Oceans. Mem. Sci. Geol 43, 261-275 Padova.
Pagani, M., Zachos, J.C, Freeman, K.H., Tripple, B, Bohaty S., 2005. Marked decline in atmospheric carbon dioxide concentrations during the Paleogene. Science 309, 600–603.
Paillard D., Labeyrie, L., Yiou, P., 1996. Macintosh Program Performs Time-Series Analysis. Eos, Transactions, American Geophysical Union 77:379.
Perch-Nielsen, K., 1985. Cenozoic calcareous nannofossils. In Bolli, H.M., Saunders, J.B., and Perch-Nielsen, K. (Eds.), Plankton Stratigraphy: Cambridge (Cambridge Univ. Press), pp. 427-554.
Primoli Silva, I., Jenkins, D.G., 1993. Decision on the Eocene-Oligocene boundary stratotype. Episodes 16, 379-381.
Pälike, H., Hilgen, F., 2008. Rock clock synchronization, Nature Geoscience 1, 282 doi:10.1038/ngeo197
Pälike, H., Norris, R.D., Herrle, J.O., Wilson, P.A., Coxall, H.K., Lear, C.H., Shackleton, N.J., Tripati, A.K., Wade, B.S. 2006. The heartbeat of the Oligocene climate system. Science 314, 1894-1898.
Raffi, �., Backman, J., Pälike, H., 2005. Changes in calcareous nannofossil assemblages across the Paleocene/Eocene transition from the paleo-equatorial Pacific Ocean. Palaeogeography, Palaeoclimatology, Palaeoecology 226, (1–2), 93-126. doi:10.1016/j.palaeo.2005.05.006.
Raffi, �., Backman, J., Zachos, J.C., Sluijs, A., 2009. The response of calcareous nannofossil assemblages to the Paleocene Eocene Thermal Maximum at the Walvis Ridge in the South Atlantic. Marine Micropaleontology 70, 201-212.
Raymo, M.E., Ruddiman, W.F. Backman, J., Clement, B.M., Martinson, D.G., 1989. Late Pliocene variation in Northern Hemisphere ice sheets and North Atlantic deep water circulation. Paleoceanography 4, 413-446.
Raymo, M.E., Ruddiman, W.F., 1992. Tectonic forcing of late Cenozoic climate. Nature, 359,

25
117-122.Rost, B.,U. Riebesell, U., 2004. Coccolithophores
and the biological pump: responses to environmental changes. In Thierstein, H.R., Young, J.R. (Eds.) Coccolithophores - from molecular processes to global impact, Springer-Springer-Verlag pp. 99-125. pp. 99-125.
Roth, P.H., Franz, H.E., Wise, S.W. Jr., 1970. Morphological study of the selected members of the genus Sphenolithus Delfandre (Incertae sedis, Tertiary). In: Forinacci, A. (Editor), Proceedings of the II planktonic conference Roma 1970 2, Editioni Tecnoscienza, Rome, pp. 1099-1119.
Roth, P.H., 1994. Distribution of coccoliths in oceanic sediments. In: Winter, A., Siesser W.G., (Eds.), Coccolithophores. Cambridge University Press, pp. 199-218.
Ruddiman, W.F., 2007. Earth’s Climate: Past and Future, Publisher Freeman, W.H. 465 pp.465 pp.
Shackleton, N.J., Berger, A., Peltier, W.R., 1990. An alternative astronomical calibration of the lower Pleistocene timescale based on ODP Site 677. Transactions of the Royal Society of Edinburgh: Earth Sciences. 81, 251-261.
Shackleton, N.J., Crowhurst, S.J., Weedon, G., Laskar L., 1999. Astronomical calibration ofAstronomical calibration of Oligocene–Miocene time. Philos. Trans. R. Soc. Lond. 357, 1909–1927.
Shackleton, N.J., Hall, M.A., Raffi, �., Tauxe, L., Zachos, J., 2000. Astronomical calibration for the Oligocene-Miocene boundary. Geology, 28, 447-450.
Villa, G., Fioroni, C., Pea, L., Bohaty, S., Persico, D., 2008. Middle �ocene–late OligoceneMiddle �ocene–late Oligocene climate variability: Calcareous nannofossil response at Kerguelen Plateau, Site 748. MarineMarine Micropaleontology 69, 173-192.
Wade, B. S., Pälike, H., 2004. Oligocene climateOligocene climate dynamics. Paleoceanography 19 :PA4019. doi:10.1029/2004PA001042
Wade, B.S., Bown, P.R. 2006. Calcareous nannofossils in extreme environments: The Messinian Salinity Crisis, Polemi Basin, Cyprus. Palaeogeography, Palaeoclimatology Palaeoecology 233, 271-286.
Wei, W., Wise, S.W. Jr., 1989. Paleogene calcareous nannofossil magnetobiochronology: results from South Atlantic DSDP Site 516. Marine Micropaleontology, 14, 119-152.
Wei, W., Villa, G., Wise Jr., S.W. 1992. Paleoceanographic implications of Eocene-Oligocene calcareous nannofossils from Sites 711 and 748 in the Indian Ocean. In: Wise Jr., S.W., Schlich, R., et al., 1992. Proc. Ocean Drill.
Program Sci. Results vol. 120, 979–999.Westbroek, P., Van Hinte, J.E., Brummer, G.J.,
Veldhuis, M., Brownlee, C., Green, J.C., Harris, R., Heimdal, B.R., 1994. Emiliania huxleyi as a key to biosphere-geosphere interactions. In: Green, J.C., Leadbeater, B.S.C. (Eds.) The Haptophyte Algae. Clarendon Press, Oxford, pp. 321–34.
Wilson P.A., Lyle M., Firth J.V. (Eds.) 2006. Proc. ODP, Sci. Results, 199: College Station, TX (Ocean Drilling Program). doi:10.2973/odp.proc.sr.199.2006
Winter, A., Jordon, R.W., Roth, P.H., 1994. Biogeography of living coccolithophores in ocean waters. In: Winter, A., Siesser, W.G., (Eds), Coccolithophores, Cambridge University Press, Cambridge, pp. 161–177.
Winter, A., Siesser, W.G., 1994. Coccolithophores, Cambridge University Press, Cambridge, 242 pp.
Young, J.R. 1990. Size variation of Neogene Reticulofenestra coccoliths from Indian Ocean DSDP Cores. Journal of Micropaleontology 9, 71-86.
Young, J.R., Henriksen, H., Probert, I, 2004. Structure and morphogenesis of the coccoliths of the CODENET species. In Thierstein, H.R., Young, J.R., (Eds.) Coccolithophores - From molecular processes to global impact. Springer-Verlag, pp. 191-216.
Zachos, J.C., Pagani, M., Sloan, L.C., Thomas,E.,Billups, K., 2001. Trends, rhythms, and aberrations in global climate 65 Ma to present. Science 292, 686-693.
Zachos, J.C., Dickens, G.R., Zeebe, R.E., 2008. An early Cenozoic perspective on greenhouse warming and carbon-cycle dynamics. Nature 451, 279-283.
Internet referenceshttp://earth-time.org/ http;//rsb.info.nih.gov/ij/ www.nannotax.org http://folk.uio.no/ohammer/past/http��//www.talkorigins.org/faqs/macroevolution. http://www.gebco.net/

26
Taxonomic appendix
Calcareous nannofossils encountered in this study are listed in alphabetical order:
Coccolithus pelagicus (Wallich, 1877) Schiller (1930)Coronocyclus nitescens (Kamptner, 1963) Bramlette and Wilcoxon (1967)Cyclicargolithus floridanus, (Roth and Hay in Hay et al., 1967) Bukry (1971a)Dictyococcites bisectus (Hay, Mohler and Wade, 1966) Bukry and Percival (1971)Dictyococcites hesslandii (Haq 1966), Haq and Lohman (1976) Dictyococcites scrippsae Bukry and Percival (1971)Discoaster barbadiensis Tan (1927)Discoaster deflandrei Bramlette and Riedel (1954)Discoaster saipanensis Bramlette and Riedel (1954)Discoaster spp.Ericsonia formosa (Kamptner, 1963), Haq (1971)Helicoshapera compacta Bramlette and Wilcoxon (1967)Reticulofenestra umbilica (Levin, 1965) Martini and Ritzkowski (1968) Reticulofenestra hillae Bukry and Percival (1971)Reticulofenestra spp.Sphenolithus ciperoensis Bramlette and Wilconxon (1967)Sphenolithus distentus Martini (1965) Bramlette and Wilconxon (1967)Sphenolithus predistentus Bramlette and Wilconxon (1967)Sphenolithus moriformis (Brönnimann and Stradner, 1960) Bramlette and Wilconxon (1967)Sphenolithus tribulosus Roth (1970) Triquetrorhabdulus carinatus (Martini 1965)Triquetrorhabdulus longus Blaj and Young (submitted)