Embed Size (px)
Citation preview
1
vegIMPACT Report 4
December 2014
Late Blight demonstrations
December 2013-February 2014
Huub Schepers, Nikardi Gunadi, Herman de Putter, Romke Wustman,
Tonny K. Moekasan, Laksminiwati Prabaningrum, Asih K. Karjadi

2
vegIMPACT Report 4 – Late Blight demonstrations December 2013-February 2014
vegIMPACT is a program financed by The Netherlands’ Government promoting improved vegetable
production and marketing for small farmers in Indonesia, contributing to the food security status
and private sector development in Indonesia. The program builds on the results of previous joint
Indonesian-Dutch horticultural development cooperation projects and aligns with recent
developments in the horticultural private sector and retail in Indonesia. The program activities
(2012 – 2016) include the Development of Product Market Combinations, Strengthening the Potato
Sector, Development of permanent Vegetable Production Systems, Knowledge Transfer and
Occupational Health.
Wageningen University and Research centre (Wageningen UR, The Netherlands):
- Applied Plant Research (APR), AGV Research Unit Lelystad - Centre for Development Innovation (CDI), Wageningen - Plant Research International (PRI), Wageningen - Agricultural Economics Institute (LEI), Den Haag
Contact person:
Huib Hengsdijk, [email protected]
Indonesian Vegetable Research Institute (IVEGRI, Indonesia)
Contact person:
Witono Adigoya, [email protected]
Fresh Dynamics (Indonesia)
Contact person:
Marcel Stallen, [email protected]
www.vegIMPACT.com
© 2014 Wageningen UR, The Netherlands
All rights reserved. No part of this publication may be reproduced, stored in a retrieval system or transmitted, in any form of by any
means, electronic, mechanical, photocopying, recording or otherwise, without the prior written permission of Wageningen UR, The
Netherlands
Wageningen UR, The Netherlands, takes no responsibility for any injury or damage sustained by using data from this publication

3
vegIMPACT Report 4 – Late Blight demonstrations December 2013-February 2014
Late Blight demonstrations
December 2013-February 2014
Huub Schepers, Nikardi Gunadi, Herman de Putter, Romke Wustman,
Tonny K. Moekasan, Laksminiwati Prabaningrum, Asih K. Karjadi
© 2014 Wageningen UR, The Netherlands
The user may copy, distribute and transmit the work and create derivative works. Third-party material
that has been used in the work and to which intellectual property rights apply may not be used without
prior permission of the third party concerned. The user must specify the name as stated by the author or
licence holder of the work, but not in such a way as to give the impression that the work of the user or the
way in which the work has been used are being endorsed. The user may not use this work for commercial
purposes.
Wageningen UR, The Netherlands, takes no responsibility for any injury or damage sustained by using
data from this publication

4
vegIMPACT Report 4 – Late Blight demonstrations December 2013-February 2014
Contents
1. Introduction .......................................................................................................................................... 5
2. Materials and methods ........................................................................................................................ 6
2.1 Demo-plot lay-out ........................................................................................................................ 6
2.2 Spray applications ......................................................................................................................... 6
2.3 Disease observations .................................................................................................................... 8
2.4 Yield .............................................................................................................................................. 8
3. Results .................................................................................................................................................. 9
3.1 Pangalengan ................................................................................................................................. 9
3.2 Garut ........................................................................................................................................... 11
3.3 Weather data .............................................................................................................................. 14
4. Discussion and conclusions ................................................................................................................ 15
5. References .......................................................................................................................................... 16
6. Appendix 1: lay out demo plots .......................................................................................................... 17
5
vegIMPACT Report 4 – Late Blight demonstrations December 2013-February 2014
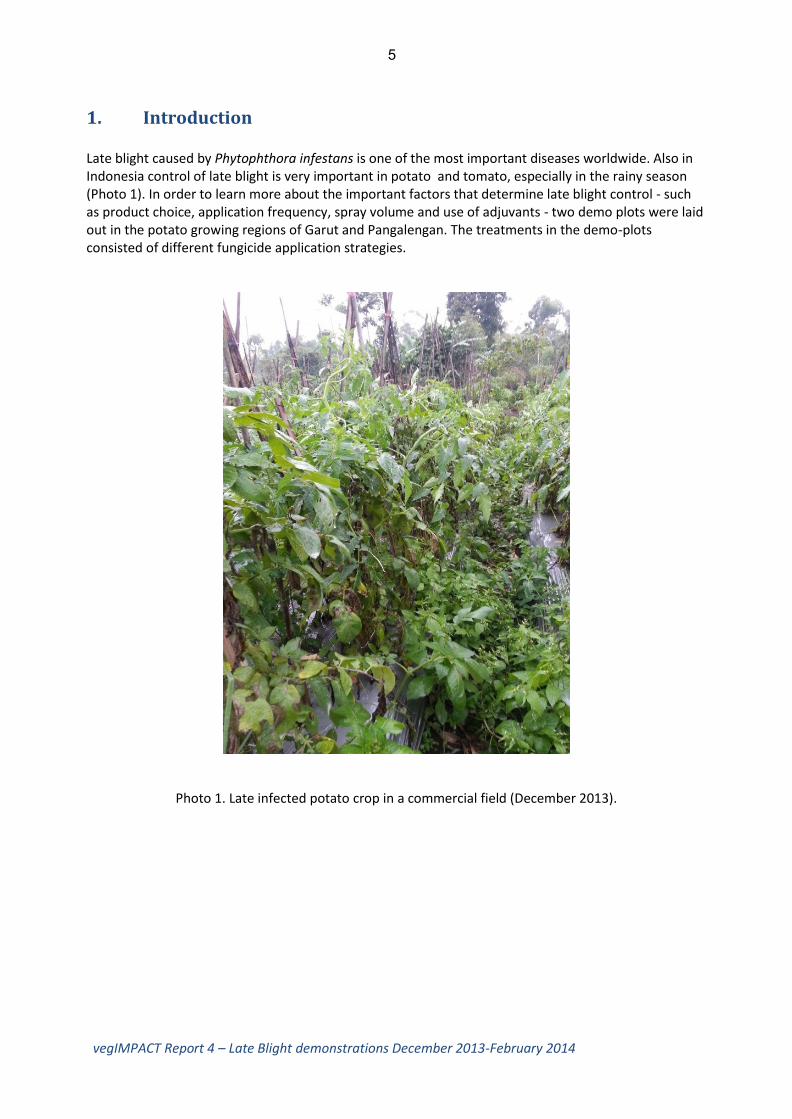
1. Introduction Late blight caused by Phytophthora infestans is one of the most important diseases worldwide. Also in Indonesia control of late blight is very important in potato and tomato, especially in the rainy season (Photo 1). In order to learn more about the important factors that determine late blight control - such as product choice, application frequency, spray volume and use of adjuvants - two demo plots were laid out in the potato growing regions of Garut and Pangalengan. The treatments in the demo-plots consisted of different fungicide application strategies.
Photo 1. Late infected potato crop in a commercial field (December 2013).

6
vegIMPACT Report 4 – Late Blight demonstrations December 2013-February 2014
2. Materials and methods
2.1 Demo-plot lay-out
Demonstration plots in Pangalengan and Garut were planted respectively on 4 and 5 December 2013
(rainy season) with the potato varieties Granola and Atlantic. The plots consisted of 3 beds of 2 rows
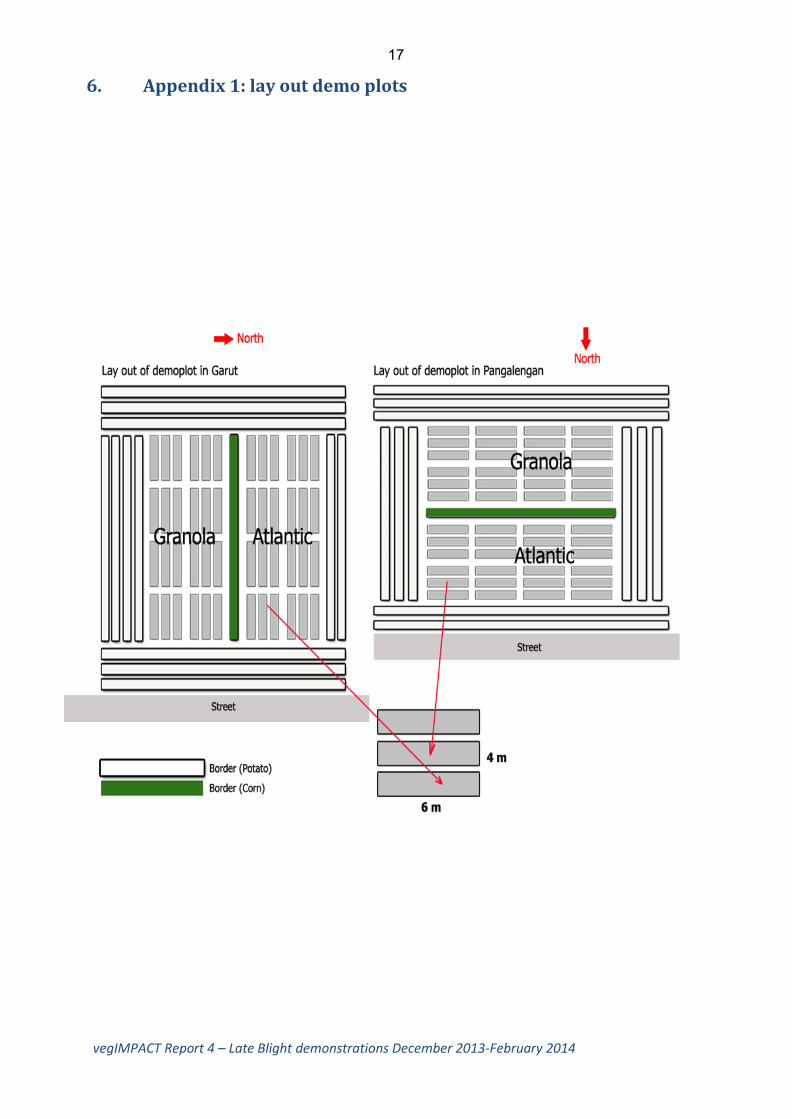
each with in total 40 plants with an area of 6 x 4 m. The demo-plot was laid-out in 4 replicates
(Appendix 1). The beds were covered with a silver-coloured plastic mulch. The demo-plots were
surrounded by border plots. The plants were not artificially inoculated with late blight.
2.2 Spray applications
In Table 1 and Table 2 the fungicides used and the fungicide application strategies are presented. The
strategies consisted of both a Farmers Practice and an alternative ‘vegIMPACT’ strategy applied in the
Atlantic as well as Granola variety. The Farmers Practice strategy, the application interval, the spray
volume and adjuvant choice were selected on the basis of the inventory described by De Putter et al.
(2014). The vegIMPACT strategies in Granola and Atlantic were selected based on their susceptibility for
late blight and the characteristics of the products described in the fungicide table of EuroBlight
(www.euroblight.net).
The treatments were applied with a spray interval of 4 days using a battery powered (to provide
constant pressure) knapsack sprayer (16 litre) with a spray volume of 600 l/ha (Photo 3). Spray
schedules for 18 applications were made but since the growing seasons was shorter than beforehand
expected only 13 (Pangalengan) and 14 (Garut) applications were applied. In Garut dates of application
were 19, 24, 28 December 2013; 1, 5, 9, 13, 17, 21, 25 and 29 January 2014; 3, 7 and 11 February 2014.
In Pangalengan, application dates were 26 and 30 December 2013; 3, 7, 11, 15, 19, 23, 27 and 31
January 2014; 4, 8 and 12 February 2014. The adjuvant Agristick was added to all treatments to provide
extra rain fastness to the fungicides.

7
vegIMPACT Report 4 – Late Blight demonstrations December 2013-February 2014
Photo 2. Lay-out of the demo-plots in Pangalengan, December 2013.
Photo 3. A battery powered knapsack sprayer was used in both demo-plots in Garut and Pangalengan.
Table 1. Fungicide and adjuvant doses and costs used in the demonstration plots.
Product name Active ingredients Dose rate
Per 4 plots/replicates (96 m
2)
Per hectare (10,000 m
2) with 600 liter
Dose (g or ml)
Cost (IDR)
Dose (g or ml)
Cost (IDR)
Daconil 75 WP chlorothalonil (75%) 100% 9 1,305 936 135,720
Dithane M45 80 WP
mancozeb (80%) 50% 6 570 624 59,280
Curci 10 WP cymoxanil (10%) 50% 12 1,200 1,248 124,800
Curzate 64/8 WP mancozeb (64%) + cymoxanil (8%)
100% 24 3,600 2,496 374,000
Akrobat 50 WP dimethomorph (50%) 50% 1.5 1,050 156 109,200
Trivia 73 WP propineb (67%) + fluopicolide (6%)
100% 10 3,250 1040 338,000
Revus 250 SC mandipropamid (250 g/l) 100% 3 2,700 312 280,800
Infinito 687.5 SC propamocarb (625 g/l) + fluopicolide (62.5 g/l)
100% 15 6,600 1,560 686,400
Agristick 400 L adjuvant 100% 3 210 312 21,840

8
vegIMPACT Report 4 – Late Blight demonstrations December 2013-February 2014
Table 2. The spray schedules used in the demonstration plots. In Garut 14 fungicide applications were
applied in Pangalengan 13 spray applications were applied.
Atlantic Granola
# Farmers practice vegIMPACT Framers practice vegIMPACT
1 100% Daconil +50% Dithane + 50% Curci
100% Curzate 100% Daconil + 50% Dithane + 50% Akrobat
100% Trivia
2 100% Daconil +50% Dithane + 50% Curci
100% Curzate 100% Daconil + 50% Dithane + 50% Akrobat
100% Trivia
3 100% Daconil +50% Dithane + 50% Curci
100% Curzate 100% Daconil + 50% Dithane + 50% Akrobat
100% Trivia
4 100% Daconil +50% Dithane + 50% Curci
100% Curzate 100% Daconil + 50% Dithane + 50% Akrobat
100% Trivia
5 100% Daconil +50% Dithane + 50% Curci
100% Curzate 100% Daconil + 50% Dithane + 50% Akrobat
100% Trivia
6 100% Daconil +50% Dithane + 50% Curci
100% Curzate 100% Daconil + 50% Dithane + 50% Akrobat
100% Trivia
7 100% Daconil +50% Dithane + 50% Curci
100% Revus 100% Daconil + 50% Dithane + 50% Akrobat
100% Curzate
8 100% Daconil +50% Dithane + 50% Curci
100% Revus 100% Daconil + 50% Dithane + 50% Akrobat
100% Curzate
9 100% Daconil +50% Dithane + 50% Curci
100% Revus 100% Daconil + 50% Dithane + 50% Akrobat
100% Curzate
10 100% Daconil +50% Dithane + 50% Curci
100% Revus 100% Daconil + 50% Dithane + 50% Akrobat
100% Curzate
11 100% Daconil +50% Dithane + 50% Curci
100% Revus 100% Daconil + 50% Dithane + 50% Akrobat
100% Curzate
12 100% Daconil +50% Dithane + 50% Curci
100% Revus 100% Daconil + 50% Dithane + 50% Akrobat
100% Curzate
13 100% Daconil +50% Dithane + 50% Curci
100% Infinito 100% Daconil + 50% Dithane + 50% Akrobat
100% Curzate
14 100% Daconil +50% Dithane + 50% Curci
100% Infinito 100% Daconil + 50% Dithane + 50% Akrobat
100% Curzate
2.3 Disease observations
Late blight observations were carried out every 4 days on the net plots which consisted of 32 plants. The
percentage of infected foliage was estimated for each of the 32 plants per plot. The average percentage
infected foliage was calculated per plot. For the assessments, two visual keys were used namely:
Efficacy evaluation of fungicides: Phytophthora infestans on potato. EPPO Guideline PP 1/2 (4)
An illustrated assessment key for foliage blight of potatoes (Cruickshank et al., 1982).
The AUDPC (Area Under the Disease Progress Curve) was calculated and used as an indicator of the
efficacy of the strategies during the complete growing season. The AUDPC is a measure of the total
amount of disease over a period of time, determined from graphs of disease vs. time, which can be used
to compare epidemics quantitatively.
2.4 Yield
Crops were harvested by hand in Pangalengan and Garut on 19 February 2014 and 5 March 2014,
respectively. The tubers were classified in Class A (1 kg = 5 tubers), Class B (1 kg = 10 tubers) and Class C
(1 kg = 20 tubers) and weighed. Also the rotten tubers were weighed.

9
vegIMPACT Report 4 – Late Blight demonstrations December 2013-February 2014
3. Results
3.1 Pangalengan
Percentage infected foliage per treatment and AUDPC is presented in Table 3. Figure 1 is a graphic
representation of the late blight assessments per treatment. On 25 December 2013, one day before the
first fungicide application, potato late blight was already observed in some plots, indicating that the
natural inoculum pressure at that time was very high.
Till the end of January the percentage infection in all strategies was below 10 %, thereafter the
epidemic developed exponentially. In the beginning of February especially Atlantic was seriously
infected (Photo 4). In both Atlantic and Granola, the Farmers Practice and vegIMPACT strategy resulted
in a similar effect on the late blight epidemic. The AUDPC of both strategies in Atlantic was significantly
higher compared to the strategies in Granola. The potatoes were harvested on 19 February 2014 and
graded in class A, B and C and rotten tubers. The yield was low caused by the early and severe epidemic
of late blight (Table 4). In both Atlantic and Granola the marketable yield of the Farmers Practice
strategy was higher compared to the vegIMPACT strategy. Costs for the vegIMPACT strategy were
higher than the Farmers practice strategy in both Atlantic and Granola (Table 5).
Photo 4. Seriously infected Atlantic plants in demo plots in Pangalengan (5 February 2014).
10
vegIMPACT Report 4 – Late Blight demonstrations December 2013-February 2014
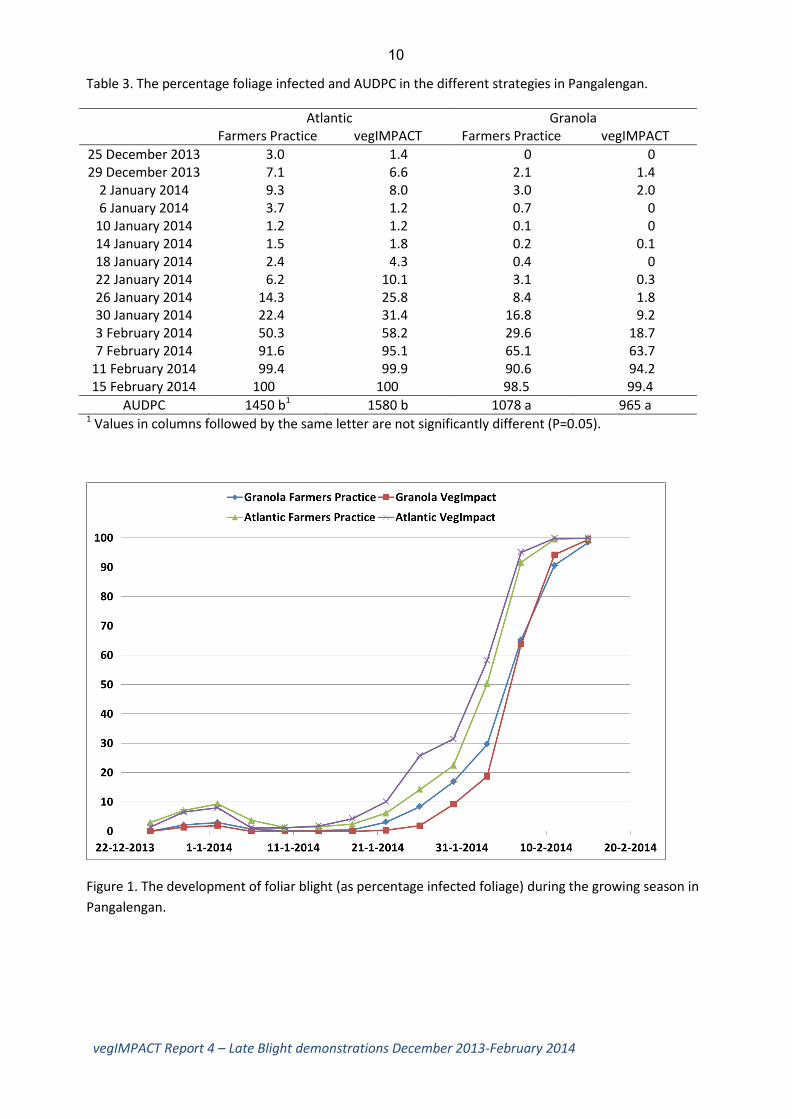
Table 3. The percentage foliage infected and AUDPC in the different strategies in Pangalengan.
Atlantic Granola Farmers Practice vegIMPACT Farmers Practice vegIMPACT
25 December 2013 3.0 1.4 0 0 29 December 2013 7.1 6.6 2.1 1.4
2 January 2014 9.3 8.0 3.0 2.0 6 January 2014 3.7 1.2 0.7 0
10 January 2014 1.2 1.2 0.1 0 14 January 2014 1.5 1.8 0.2 0.1 18 January 2014 2.4 4.3 0.4 0 22 January 2014 6.2 10.1 3.1 0.3 26 January 2014 14.3 25.8 8.4 1.8 30 January 2014 22.4 31.4 16.8 9.2 3 February 2014 50.3 58.2 29.6 18.7 7 February 2014 91.6 95.1 65.1 63.7
11 February 2014 99.4 99.9 90.6 94.2 15 February 2014 100 100 98.5 99.4
AUDPC 1450 b1 1580 b 1078 a 965 a 1 Values in columns followed by the same letter are not significantly different (P=0.05).
Figure 1. The development of foliar blight (as percentage infected foliage) during the growing season in
Pangalengan.

11
vegIMPACT Report 4 – Late Blight demonstrations December 2013-February 2014
Table 4. Potato yield in the different strategies in Pangalengan.
Atlantic Granola Farmers Practice vegIMPACT Farmers Practice vegIMPACT
Class A (ton/ha) 6.7 5.3 0 0 Class B (ton/ha) 4.7 4.8 5.2 4.6 Class C (ton/ha) 2.3 2.4 6.6 5.4
Total Marketable Yield (ton/ha)
13.7 c1 12.5 b 11.8 b 10.0 a
Rotten tubers (kg/ha)
0.8 0.6 0.3 0.2
1 Values in columns followed by the same letter are not significantly different (P=0.05).
Table 5. Cost (IDR) per 4 plots of the 13 fungicide applications sprayed with 600 l/ha per application of
the different strategies in Pangalengan.
Strategy Cost (IDR)
Atlantic: Farmers Practice 42,705
Atlantic: vegIMPACT 47,130
Granola: Farmers Practice 40,755
Granola: vegIMPACT 47,430
3.2 Garut
Percentage infected foliage per treatment and AUDPC is presented in Table 6. Figure 2 is a graphic
representation of the late blight assessments per treatment. On 23 December 2013, one day before the
second treatment, potato late blight was already observed in some plots, indicating that the natural
inoculum pressure at that time was very high.
Till the beginning of February the percentage infection in all strategies was below 10 % (Photo 5),
thereafter the epidemic developed exponentially. In both Atlantic and Granola, the Farmers Practice
and vegIMPACT strategy resulted in a comparable effect on the late blight epidemic. The AUDPC of both
strategies in Atlantic was significantly higher compared to the strategies in Granola. The potatoes were
harvested on 5 March 2014 and sorted in class A, B and C and rotten tubers. Marketable yield was
much higher compared to Pangalengan caused by a later epidemic of late blight (Table 7). Yield of
Atlantic was higher compared to Granola. In both varieties, the Farmers Practice and the vegIMPACT
strategy resulted in similar marketable yields. Costs for the vegIMPACT strategy were higher than the
Farmers Practice strategy in both Atlantic and Granola (Table 8).

12
vegIMPACT Report 4 – Late Blight demonstrations December 2013-February 2014
Photo 5. Late blight infection in Atlantic plants in Garut (6 February 2014)
Table 6. The percentage foliage infected and AUDPC in the different strategies in Garut.
Atlantic Granola Farmers Practice vegIMPACT Farmers Practice vegIMPACT
18 December 2013 0 0 0 0 23 December 2013 0.2 0.1 0.1 0.01 27 December 2013 2.4 3.4 0.3 0.4 31 December 2013 2.8 3.9 0.4 0.5
4 January 2014 10.7 10.5 0.5 1.3 8 January 2014 4.7 4.8 1.2 1.6
12 January 2014 0.4 0.8 0.3 0.3 16 January 2014 0.3 0.2 0 0.1 20 January 2014 0 0.1 0 0.1 24 January 2014 0.1 0.8 0 0 28 January 2014 2.7 2.8 1.8 3.5 2 February 2014 4.8 6.3 1.9 1.6 6 February 2014 8.7 10.1 4.1 3.2
10 February 2014 48.2 41.8 32.4 36.2 14 February 2014 70.1 66.4 60.4 58.8 18 February 2014 89.5 87.7 76.8 78.2
AUDPC 808 b 788 b 570 a 590 a 1 Values in columns followed by the same letter are not significantly different (P=0.05).
13
vegIMPACT Report 4 – Late Blight demonstrations December 2013-February 2014
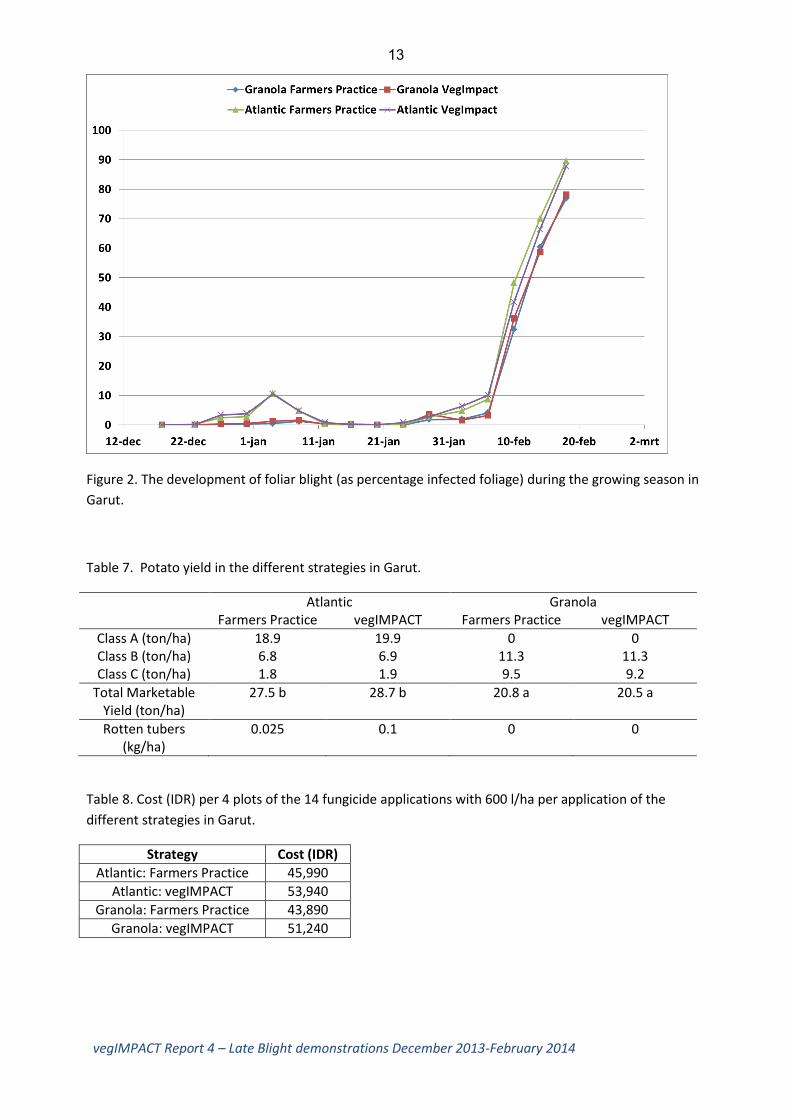
Figure 2. The development of foliar blight (as percentage infected foliage) during the growing season in
Garut.
Table 7. Potato yield in the different strategies in Garut.
Atlantic Granola Farmers Practice vegIMPACT Farmers Practice vegIMPACT
Class A (ton/ha) 18.9 19.9 0 0 Class B (ton/ha) 6.8 6.9 11.3 11.3 Class C (ton/ha) 1.8 1.9 9.5 9.2
Total Marketable Yield (ton/ha)
27.5 b 28.7 b 20.8 a 20.5 a
Rotten tubers (kg/ha)
0.025 0.1 0 0
Table 8. Cost (IDR) per 4 plots of the 14 fungicide applications with 600 l/ha per application of the
different strategies in Garut.
Strategy Cost (IDR)
Atlantic: Farmers Practice 45,990
Atlantic: vegIMPACT 53,940
Granola: Farmers Practice 43,890
Granola: vegIMPACT 51,240

14
vegIMPACT Report 4 – Late Blight demonstrations December 2013-February 2014
3.3 Weather data
The rainfall at the demo plots in Garut and Pangalengan are presented in Table 9 and Figure 3.
Table 9. Number of days with rain and amount of rain (mm) in December 2013 and January and
February 2014 at the demo plots in Garut and Pangalengan. The high rainfall in Garut in December 2013
(1133 mm) is the total amount of rain for December. In the graph the rainfall is (only) presented from
20 December onwards.
Rain days Total (mm)
Pangalengan Garut Pangalengan Garut
December 25 18 475 1133
January 27 24 329 303
February 19 17 228 430
Figure 3. Rain fall (mm/day) at the demo plots in Garut and Pangalengan between 20 December 2013
and February 2014.
15
vegIMPACT Report 4 – Late Blight demonstrations December 2013-February 2014
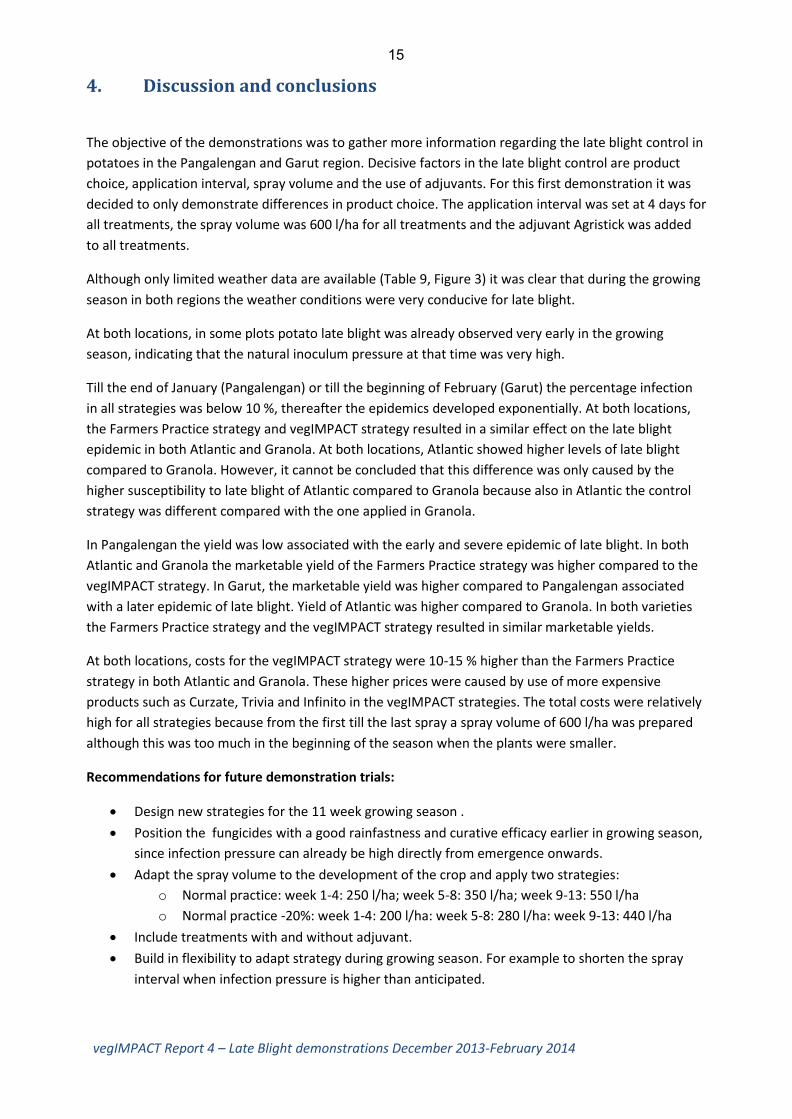
4. Discussion and conclusions
The objective of the demonstrations was to gather more information regarding the late blight control in
potatoes in the Pangalengan and Garut region. Decisive factors in the late blight control are product
choice, application interval, spray volume and the use of adjuvants. For this first demonstration it was
decided to only demonstrate differences in product choice. The application interval was set at 4 days for
all treatments, the spray volume was 600 l/ha for all treatments and the adjuvant Agristick was added
to all treatments.
Although only limited weather data are available (Table 9, Figure 3) it was clear that during the growing
season in both regions the weather conditions were very conducive for late blight.
At both locations, in some plots potato late blight was already observed very early in the growing
season, indicating that the natural inoculum pressure at that time was very high.
Till the end of January (Pangalengan) or till the beginning of February (Garut) the percentage infection
in all strategies was below 10 %, thereafter the epidemics developed exponentially. At both locations,
the Farmers Practice strategy and vegIMPACT strategy resulted in a similar effect on the late blight
epidemic in both Atlantic and Granola. At both locations, Atlantic showed higher levels of late blight
compared to Granola. However, it cannot be concluded that this difference was only caused by the
higher susceptibility to late blight of Atlantic compared to Granola because also in Atlantic the control
strategy was different compared with the one applied in Granola.
In Pangalengan the yield was low associated with the early and severe epidemic of late blight. In both
Atlantic and Granola the marketable yield of the Farmers Practice strategy was higher compared to the
vegIMPACT strategy. In Garut, the marketable yield was higher compared to Pangalengan associated
with a later epidemic of late blight. Yield of Atlantic was higher compared to Granola. In both varieties
the Farmers Practice strategy and the vegIMPACT strategy resulted in similar marketable yields.
At both locations, costs for the vegIMPACT strategy were 10-15 % higher than the Farmers Practice
strategy in both Atlantic and Granola. These higher prices were caused by use of more expensive
products such as Curzate, Trivia and Infinito in the vegIMPACT strategies. The total costs were relatively
high for all strategies because from the first till the last spray a spray volume of 600 l/ha was prepared
although this was too much in the beginning of the season when the plants were smaller.
Recommendations for future demonstration trials:
Design new strategies for the 11 week growing season .
Position the fungicides with a good rainfastness and curative efficacy earlier in growing season,
since infection pressure can already be high directly from emergence onwards.
Adapt the spray volume to the development of the crop and apply two strategies:
o Normal practice: week 1-4: 250 l/ha; week 5-8: 350 l/ha; week 9-13: 550 l/ha
o Normal practice -20%: week 1-4: 200 l/ha: week 5-8: 280 l/ha: week 9-13: 440 l/ha
Include treatments with and without adjuvant.
Build in flexibility to adapt strategy during growing season. For example to shorten the spray
interval when infection pressure is higher than anticipated.
16
vegIMPACT Report 4 – Late Blight demonstrations December 2013-February 2014
5. References
G. Cruickshank, H. E. Stewart & R. L. Wastie (1982) An illustrated assessment key for foliage
blight of potatoes. Potato Research 25: 213-214.
Herman de Putter, Nikardi Gunadi, Uka, Romke Wustman & Huub Schepers (2014) Economics
and agronomics of Atlantic and Granola potato cultivation in the dry season of 2013 in West
Java. vegIMPACT Internal Report nr. 10.
17
vegIMPACT Report 4 – Late Blight demonstrations December 2013-February 2014
6. Appendix 1: lay out demo plots