Embed Size (px)
Citation preview
Nevada’sEnglishLanguageLearnerPopulation:AReviewofEnrollment,Outcomes,andOpportunities
Sonya Douglass Horsford, Ed.D., The Lincy Institute Christina Mokhtar, Ph.D., Annenberg Institute for School Reform Carrie Sampson, M.S., The Lincy Institute
The Lincy Institute University of Nevada, Las Vegas
March 2013
Nevada’s English Language Learner Population: A Review of Enrollment, Outcomes, and Opportunities
Sonya Douglass Horsford, Ed.D. Christina Mokhtar, Ph.D. Carrie Sampson, M.S.
March 2013
About the Authors Sonya Douglass Horsford, Ed.D., is Senior Resident Scholar of Education at The Lincy Institute at University of Nevada, Las Vegas. Christina Mokhtar, Ph.D., is Principal Research Associate at the Annenberg Institute for School Reform at Brown University. Carrie Sampson, M. S., is a Research Assistant at The Lincy Institute at University of Nevada, Las Vegas.
Acknowledgments The authors wish to thank Rosann Tung, Ph.D. (Director, Research and Policy) and Michelle Renee, Ph.D. (Principal Associate) from the Annenberg Institute for School Reform at Brown University for their valuable comments and feedback on the report. Thanks also to Sarah Linet (Research Intern) at the Annenberg Institute for School Reform at Brown University for assistance with data mapping. Thanks also to Robert Lang, Executive Director of The Lincy Institute at University of Nevada, Las Vegas for his support of this project and Alexandra Nikolich and Lucy Klinkhammer for reviewing and editing the report. We also acknowledge Lincy Research Intern Alfonso Ayala for his contributions to an earlier draft of this report. Finally, appreciation goes to Clark County School District staff and administration for their data assistance and support.
About The Lincy Institute Established in 2009, The Lincy Institute conducts and supports research that focuses on improving Nevada’s health, education, and social services. This research is used to build capacity for service providers and enhance efforts to draw state and federal money to the greater Las Vegas community and highlight key issues affecting public policy and quality‐of‐life decisions on behalf of Nevada’s children, seniors, and families. The Lincy Institute is located on the campus of University of Nevada, Las Vegas and has been made possible by the generous support of The Lincy Foundation. To learn more about The Lincy Institute, please visit http://www.unlv.edu/lincyinstitute. Copyright © The Lincy Institute University of Nevada, Las Vegas March 2013
Table of Contents Introduction ..................................................................................................................................... 1
Nevada’s English Language Learners: Demographics and Context ................................................. 3
Clark County School District’s English Language Learners: Enrollment and Outcomes .................. 9
ELL Funding and Access to Educational Opportunities .................................................................. 16
Summary of State and District Level Findings ............................................................................... 21
State Level Policy Recommendations and Conclusion ................................................................... 22
References ..................................................................................................................................... 24
Figures and Tables Figure 1: Population Change, 2000–2010 ........................................................................................ 3
Figure 2: Nevada Children in Immigrant Families by Parents’ Region of Origin, 2010 .................... 4
Figure 3: Children Whose Parents Have Less than a High School Degree, 2010 ............................. 5
Figure 4: Children Who Speak a Language Other than English at Home ......................................... 5
Table 1: Nevada Population Five Years Old and Over by Language Spoken at Home, 2010 ........... 6
Figure 5: States with the Highest ELL Student Density, 2007‐2008 ................................................. 7
Figure 6: NAEP Reading Proficiency in Nevada, 2011 ...................................................................... 8
Figure 7: Student Population by Race, 2011 .................................................................................. 10
Figure 8: Number of Nevada LEP Students by District ................................................................... 11
Figure 9: Third‐Grade CCSD Students Meeting the CRT Math Standard ....................................... 12
Figure 10: Third‐Grade CCSD Students Meeting the CRT Reading Standard ................................. 13
Figure 11: Eighth‐Grade CCSD Students Meeting the CRT Math Standard ................................... 13
Figure 12: Eighth‐Grade CCSD Students Meeting the CRT Reading Standard .............................. 14
Figure 13: Eleventh‐Grade CCSD Students Meeting the Standard on the HSPE in Math ............. 14
Figure 14: Eleventh‐Grade CCSD Students Meeting the Standard on the HSPE in Reading .......... 15
Table 2: District Level ELL Support by Comparison Districts, 2010‐2011 ...................................... 17
Table 3: Comparison State ELL Weights, 2010‐2011 ..................................................................... 17
Table 4: Description of Costing Out Study Methodologies ............................................................ 18
Table 5: Gándara & Rumberger’s (2006) Four Ways to Define Adequacy for ELL Education ........ 19
The Lincy Institute ׀ March 2013 1
IntroductionThe purpose of this report is to provide the public with an easy‐to‐understand review of the status of education for Nevada’s English Language Learner1 (ELL) population with a focus on Clark County. Nevada is ranked first in the U.S. for having the highest growth rate of Limited English Proficient (LEP) individuals and fifth in the nation for having the largest share of LEP residents, only behind California, Texas, New York, and New Jersey (Migration Policy Institute, 2011). In the case of public education, student enrollment patterns over the last two decades reflect dramatic increases in ELL students in Nevada and especially Clark County.
Why ELL Education is Critical to Nevada Clark County School District (CCSD) is home to the largest school district in Nevada and fifth‐largest school district in the country. During the 2011‐2012 school year, CCSD enrolled 70 percent of the state’s overall public school population and served 54,1002 of the state’s 69,800 ELL students or 77 percent of the state’s ELLs (Nevada Report Card, 2013). In February 2013, CCSD reported 53,073 ELL students actively enrolled in its ELL Program, but as many as 94,771 students identified as ELL3. Based on 2012‐2013 enrollment figures, this number translates into more than 30 percent of CCSD students identified as ELLs–one of many clear examples of why ELL education is critical to Nevada’s present and future. Given the size and share of CCSD students who are ELLs and their growing representation within Nevada’s overall student population, Clark County’s ELL enrollment, educational opportunities, and outcomes are critical to larger conversations concerning educational improvement and reform in the state. Due to their limited English proficiency, ELLs lag behind their peers in academic achievement as measured by local, state, and national assessments. As Goldenberg (2006) observed in his review of ELL student achievement research:
This discrepancy bodes ill for the society as a whole, since the costs of large‐scale underachievement among large sectors of the populace are very high. The growing number of and the lack of adequate progress among English‐learners – even many who were born in the United States or have lived here for years – should concern us all (Goldenberg, 2006).
1 English Language Learner (ELL) means a pupil whose: (1) primary language is not English; (2) proficiency in English is below the average proficiency of pupils at the same age or grade level whose primary language is English; and (3) probability of success in a classroom in which courses of study are taught only in English is impaired because of his or her limited proficiency in English. http://www.leg.state.nv.us/nac/nac‐388.html#NAC388Sec610. We use the terms ELLs and LEP students interchangeably in this report, but recognize the variation in how these terms are used and defined in different contexts. 2 While the Nevada Department of Education’s (NDE) 2013 Nevada Report Card, which reports data from the 2011‐2012 school year, lists CCSD’s LEP population at 54,100; CCSD ELL Program’s figure for the same year was 54,398. The 2012 Nevada Report Card, which reports data from the 2010‐2011 school year, listed CCSD’s LEP population as 71,247, while CCSD’s ELL Program’s figure was 55,502. It is not clear why the Nevada Report Card figure for LEPs in CCSD and the state overall in 2010‐2011 is so much larger than the year preceding or following it. 3 Each month, CCSD’s ELL Program reports figures for two different groups of ELL students: (a) ELL students identified ‐ students they have tested, identified, and tracked that were enrolled in CCSD in the month indicated and (b) ELL Enrolment ‐ students who are actively enrolled in ELL services and will be required to be assessed by the annual English Language Proficiency Assessment (ELPA) examination. Data is available at http://ellp.ccsd.net/Statistics/region_monthly_stats/ELL_Fast_Facts.pdf
The Lincy Institute ׀ March 2013 2
The lack of a state vision and action plan for ELL education is especially problematic in Nevada, where despite its higher numbers of ELLs, has no funding mechanism for ELL education nor standards4 to guide the educational goals and achievement of its ELL students. Furthermore, proposals to grant schools class size flexibility (allowing class sizes to be larger than the state mandated levels) and end social promotion fail to consider the implications of such polices on students who are encountering the English language for the very first time.
Purpose and Overview In response to a growing concern expressed by community leaders, policymakers, parents, researchers, activists and other stakeholders regarding ELL education in Southern Nevada, this report is based on a study commissioned by The Lincy Institute and conducted by the Annenberg Institute for School Reform at Brown University in partnership with CCSD between May 2012 and January 2013 (Mokhtar, 2012)5.
The purpose of this study was to: (1) outline the enrollment, educational opportunities, and outcomes of CCSD students with a focus on ELL students, and (2) inform the district and community about strengths and challenges in ELL outcomes and fruitful research directions that will guide policies and programs for ELL students. In addition to the Annenberg findings, this policy report also uses publicly available data from the U.S. Census Bureau, Annie E. Casey Foundation, Nevada Department of Education, American Institutes for Research, Migration Policy Institute, and similar sources along with peer‐reviewed research and policy reports examining ELL funding, policy, and practice. The story that emerges points to many policy and practice improvements that must occur at the state level for the successful education of Nevada’s English Language Learners.
Research Note This report’s reliance on publicly available data coupled with varying definitions of English Language Learner (ELL) and Limited English Proficient (LEP) poses several challenges to presenting accurate figures for this rapidly growing population. Data sources at the federal, state, and district levels collect and report ELL and LEP data at different times in different ways for different purposes. It is also important to note that the study on which this report is based was conducted in 2012, when the most recent state level data available was from the 2010‐2011 school year. Thus, unless noted otherwise, the numbers included in the report do not reflect the most recent publicly accessible data. We encourage readers who interested in accessing the latest state level numbers for LEP students to visit www.nevadareportcard.com and CCSD ELL data updated monthly at http://ellp.ccsd.net/Statistics/index.html.
4 Nevada has no English Language Development Standards (ELD) in place, which are standards designed to guide ELD curriculum and instruction and “bring students to a level of proficiency in English that will allow them to reach English Language Arts [ELA] standards” (CCSD, ELL Programs, n.d.) http://ellp.ccsd.net/programs/standards.html 5 Mokhtar, C. (2012). Clark County School District’s English Language Learners: An Analysis of Enrollment, Educational Opportunities, and Outcomes in Nevada and CCSD. Provided as an Internal Working Document to The Lincy Institute at the University of Nevada, Las Vegas by the Annenberg Institute for School Reform at Brown University. For original references and data source, see http://www.unlv.edu/lincyinstitute/education
The Lincy Institute ׀ March 2013 1
Nevada’sEnglishLanguageLearners:DemographicsandContext
Nevada is outpacing the rest of the nation in population growth, immigration, and the increasing ethnic
and linguistic diversity of its children and families. This mostly Latin American population has high
poverty, low educational attainment, and high employment (Mokhtar, 2012). As a result, Nevada has
increasing and high numbers of English Language Learners (ELLs) ‐ students who speak a language other
than English at home – and show low educational attainment compared to their native English‐speaking
peers.
Population Growth and Immigration
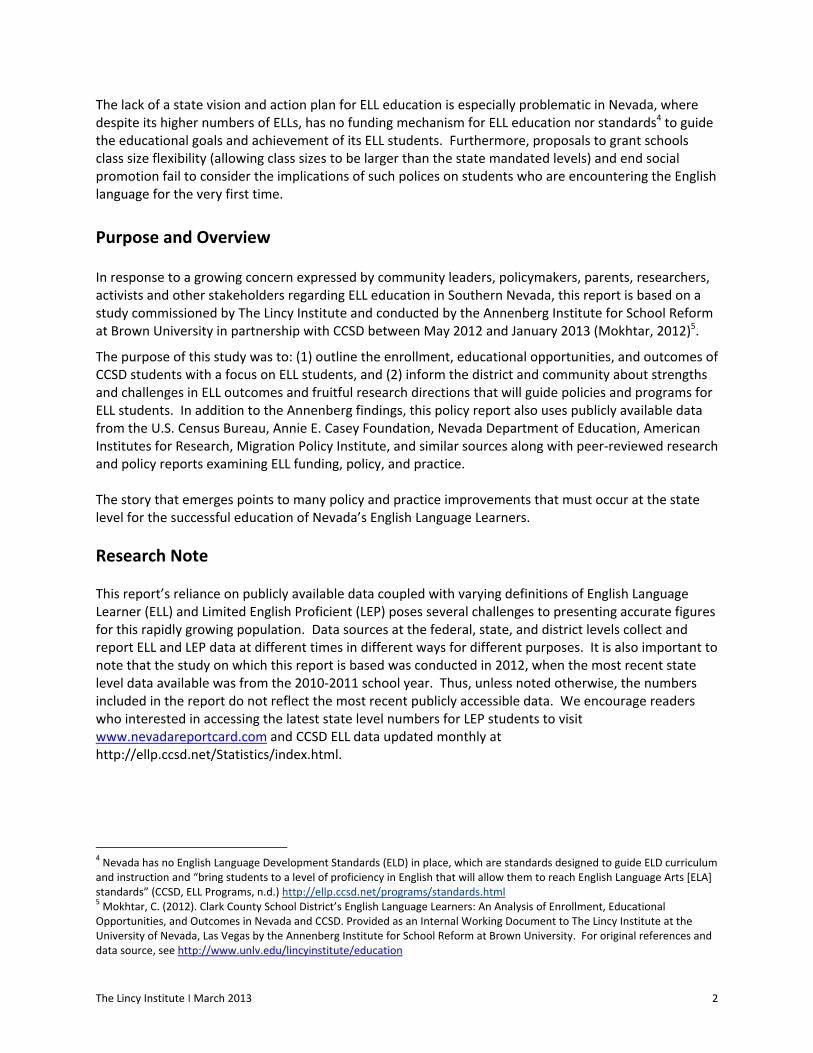
From 2000 to 2010, Nevada saw a 35 percent increase in its population overall – more than three times
the rate experienced by the U.S. as a whole. Clark County saw an even higher rate of change at 42
percent (Mokhtar, 2012) (Figure 1). The average proportion of individuals born outside the U.S. is also
higher in Nevada (19 percent) and Clark County specifically (22 percent) than for the country as a whole
(13 percent) (Mokhtar, 2012). During the same time period, Clark County ranked third largest in
absolute growth in immigrants among the nation’s counties – preceded by Harris County in Texas and
Riverside County in California (Batalova & Lee 2012). Figure 1: Population Change, 2000–20106
© Annenberg Institute for School Reform at Brown University Prepared for: The Lincy Institute
6 Different time points were chosen based on available data.
10%
35%
42%
0%5%10%15%20%25%30%35%40%45%50%
U.S.A. Nevada Clark
Populationchange
The Lincy Institute ׀ March 2013 2
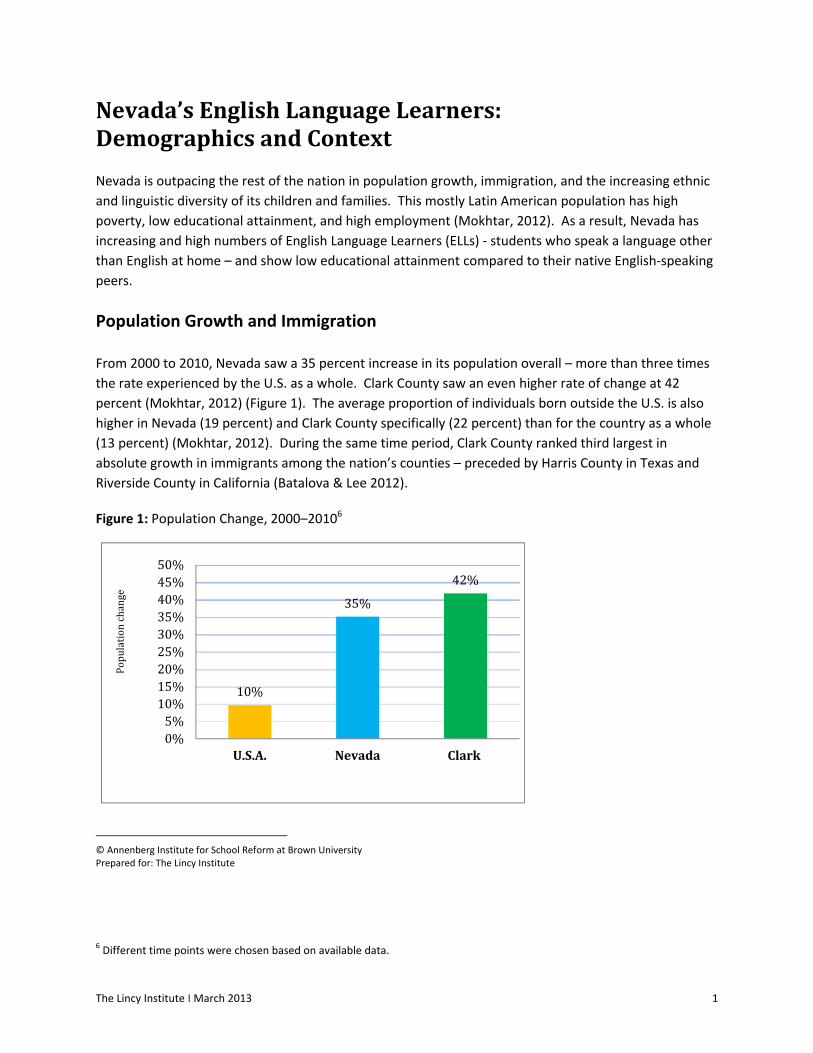
The number of children born to foreign‐born mothers in Nevada increased 106 percent from 1990 to 2009, compared with half that rate (50 percent) for the country as a whole. Nevada also has a higher rate of children living in immigrant families (36 percent) compared with the country as a whole (23 percent), nearly three‐quarters of which have at least one parent who was born in Latin America (Mokhtar, 2012) (Figure 2).
Figure 2: Nevada Children in Immigrant Families by Parents’ Region of Origin, 2010
© Annenberg Institute for School Reform at Brown University Prepared for: The Lincy Institute
Poverty and Unemployment
Although growing in number, Nevada’s non‐White population continues to struggle economically, with
disproportionate implications for children and students of color. While 22 percent of Nevada children
live below the poverty threshold, that rate is higher for children in immigrant families (27 percent
compared with 19 percent for children in United States‐born families) and for Hispanic or Latino children
(31 percent compared with 11 percent for non‐Hispanic White children) (Mokhtar, 2012).
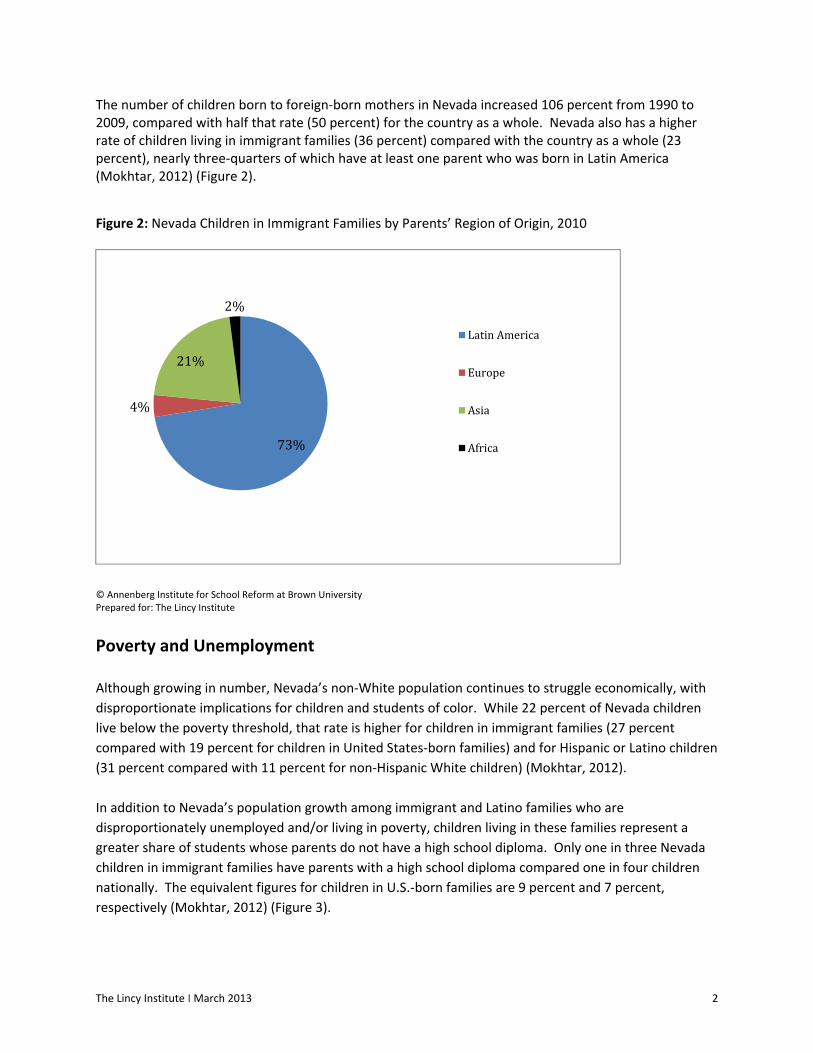
In addition to Nevada’s population growth among immigrant and Latino families who are
disproportionately unemployed and/or living in poverty, children living in these families represent a
greater share of students whose parents do not have a high school diploma. Only one in three Nevada
children in immigrant families have parents with a high school diploma compared one in four children
nationally. The equivalent figures for children in U.S.‐born families are 9 percent and 7 percent,
respectively (Mokhtar, 2012) (Figure 3).
73%
4%
21%
2%
LatinAmerica
Europe
Asia
Africa
The Lincy Institute ׀ March 2013 3
Figure 3: Children Whose Parents Have Less than a High School Degree, 2010
© Annenberg Institute for School Reform at Brown University Prepared for: The Lincy Institute
Language Diversity
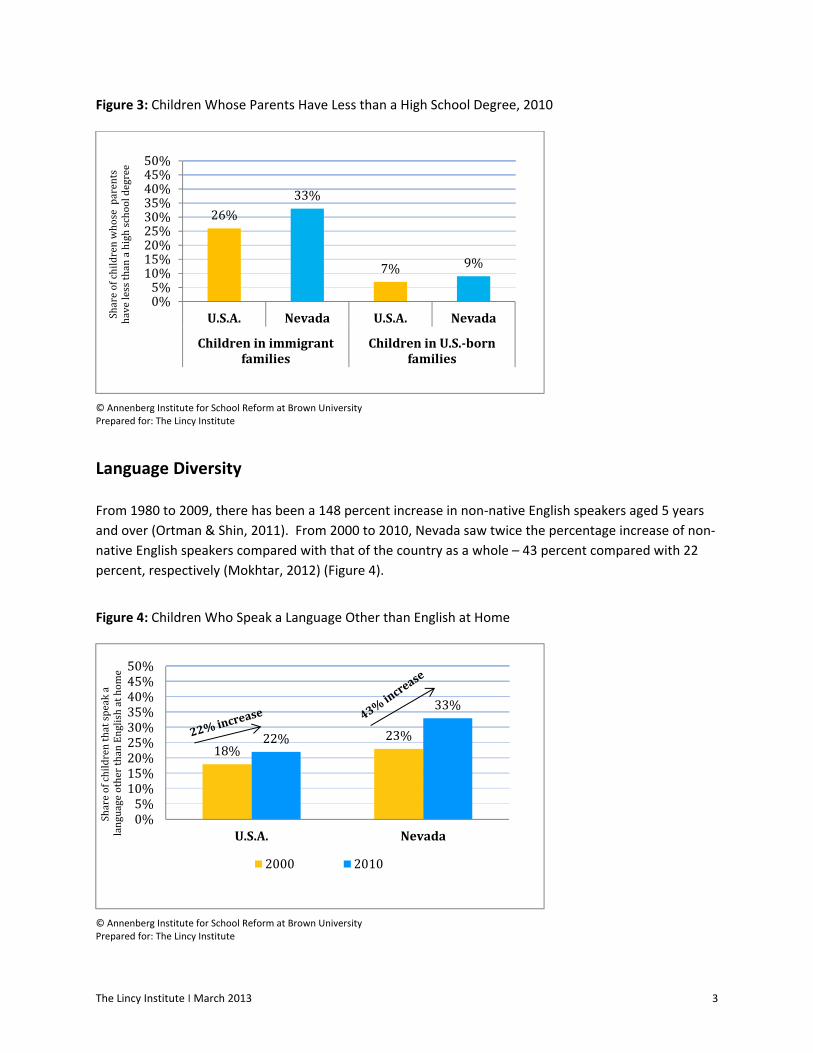
From 1980 to 2009, there has been a 148 percent increase in non‐native English speakers aged 5 years
and over (Ortman & Shin, 2011). From 2000 to 2010, Nevada saw twice the percentage increase of non‐
native English speakers compared with that of the country as a whole – 43 percent compared with 22
percent, respectively (Mokhtar, 2012) (Figure 4).
Figure 4: Children Who Speak a Language Other than English at Home
© Annenberg Institute for School Reform at Brown University Prepared for: The Lincy Institute
26%
33%
7% 9%
0%5%10%15%20%25%30%35%40%45%50%
U.S.A. Nevada U.S.A. Nevada
Childreninimmigrantfamilies
ChildreninU.S.‐bornfamilies
Shareofchildrenwhoseparents
havelessthanahighschooldegree
18%23%22%
33%
0%5%10%15%20%25%30%35%40%45%50%
U.S.A. Nevada
Shareofchildrenthatspeaka
languageotherthanEnglishathom
e
2000 2010
The Lincy Institute ׀ March 2013 4
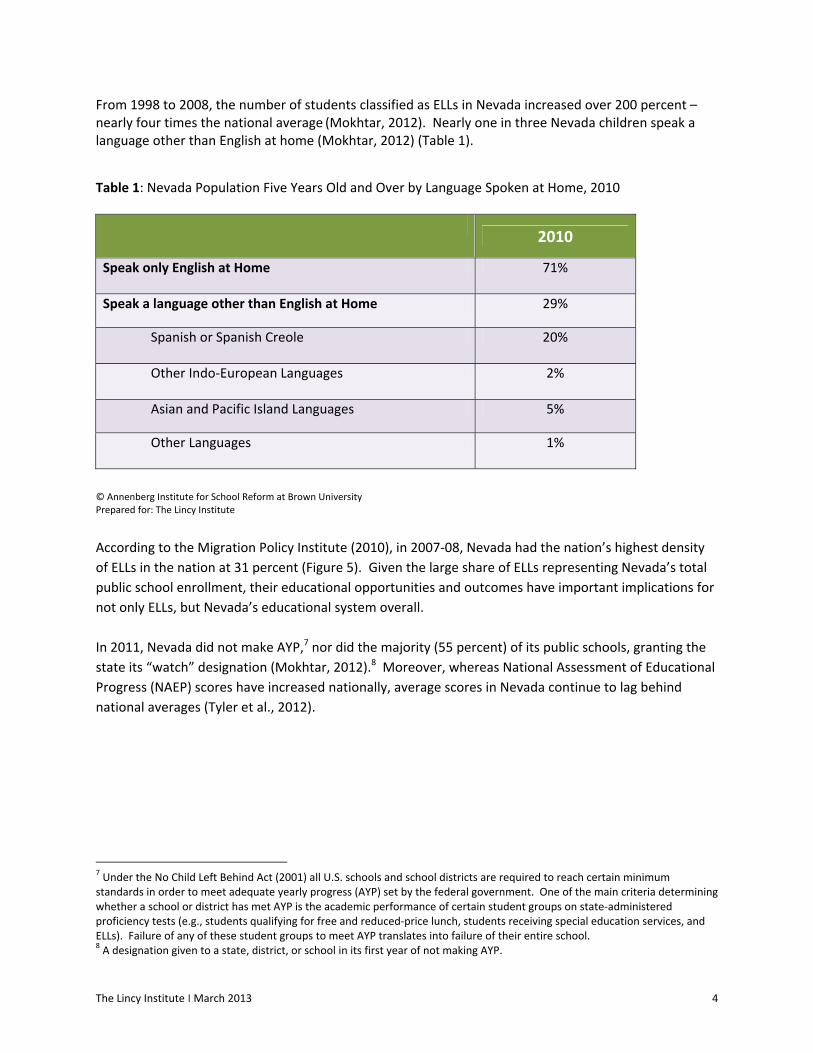
From 1998 to 2008, the number of students classified as ELLs in Nevada increased over 200 percent – nearly four times the national average (Mokhtar, 2012). Nearly one in three Nevada children speak a language other than English at home (Mokhtar, 2012) (Table 1).
Table 1: Nevada Population Five Years Old and Over by Language Spoken at Home, 2010
2010
Speak only English at Home 71%
Speak a language other than English at Home 29%
Spanish or Spanish Creole 20%
Other Indo‐European Languages 2%
Asian and Pacific Island Languages 5%
Other Languages 1%
© Annenberg Institute for School Reform at Brown University Prepared for: The Lincy Institute
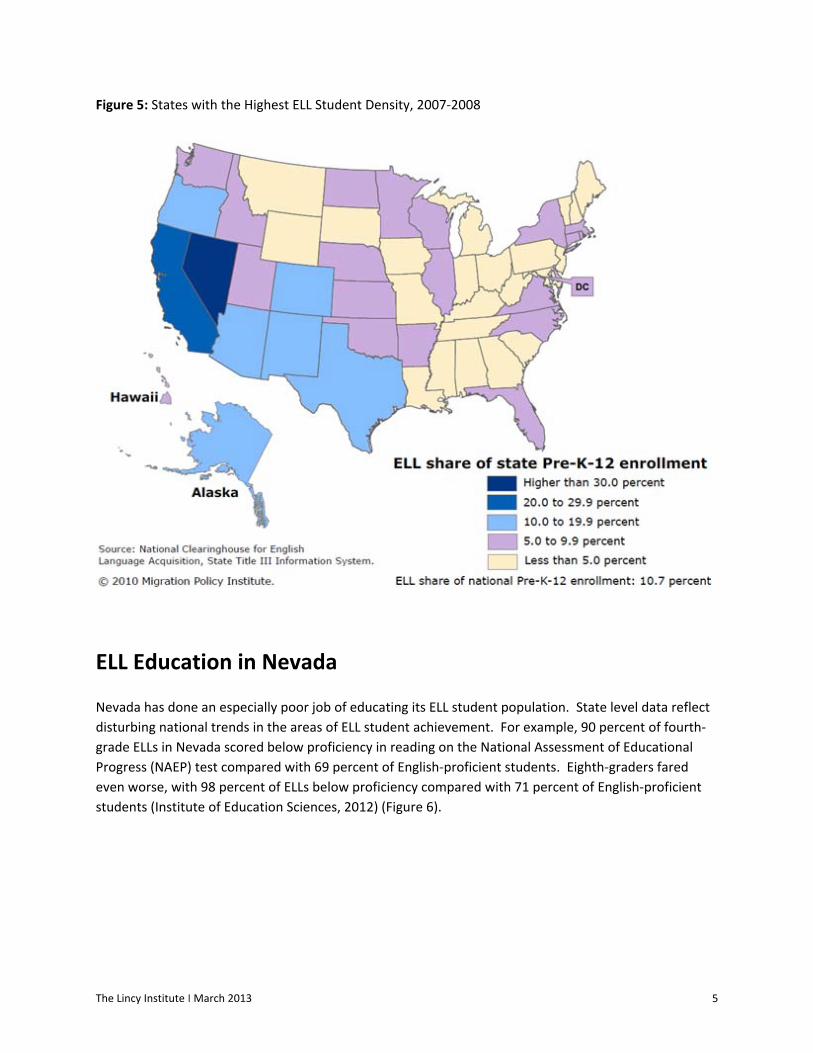
According to the Migration Policy Institute (2010), in 2007‐08, Nevada had the nation’s highest density
of ELLs in the nation at 31 percent (Figure 5). Given the large share of ELLs representing Nevada’s total
public school enrollment, their educational opportunities and outcomes have important implications for
not only ELLs, but Nevada’s educational system overall.
In 2011, Nevada did not make AYP,7 nor did the majority (55 percent) of its public schools, granting the
state its “watch” designation (Mokhtar, 2012).8 Moreover, whereas National Assessment of Educational
Progress (NAEP) scores have increased nationally, average scores in Nevada continue to lag behind
national averages (Tyler et al., 2012).
7 Under the No Child Left Behind Act (2001) all U.S. schools and school districts are required to reach certain minimum standards in order to meet adequate yearly progress (AYP) set by the federal government. One of the main criteria determining whether a school or district has met AYP is the academic performance of certain student groups on state‐administered proficiency tests (e.g., students qualifying for free and reduced‐price lunch, students receiving special education services, and ELLs). Failure of any of these student groups to meet AYP translates into failure of their entire school. 8 A designation given to a state, district, or school in its first year of not making AYP.
The Lincy Institute ׀ March 2013 5
Figure 5: States with the Highest ELL Student Density, 2007‐2008
ELL Education in Nevada
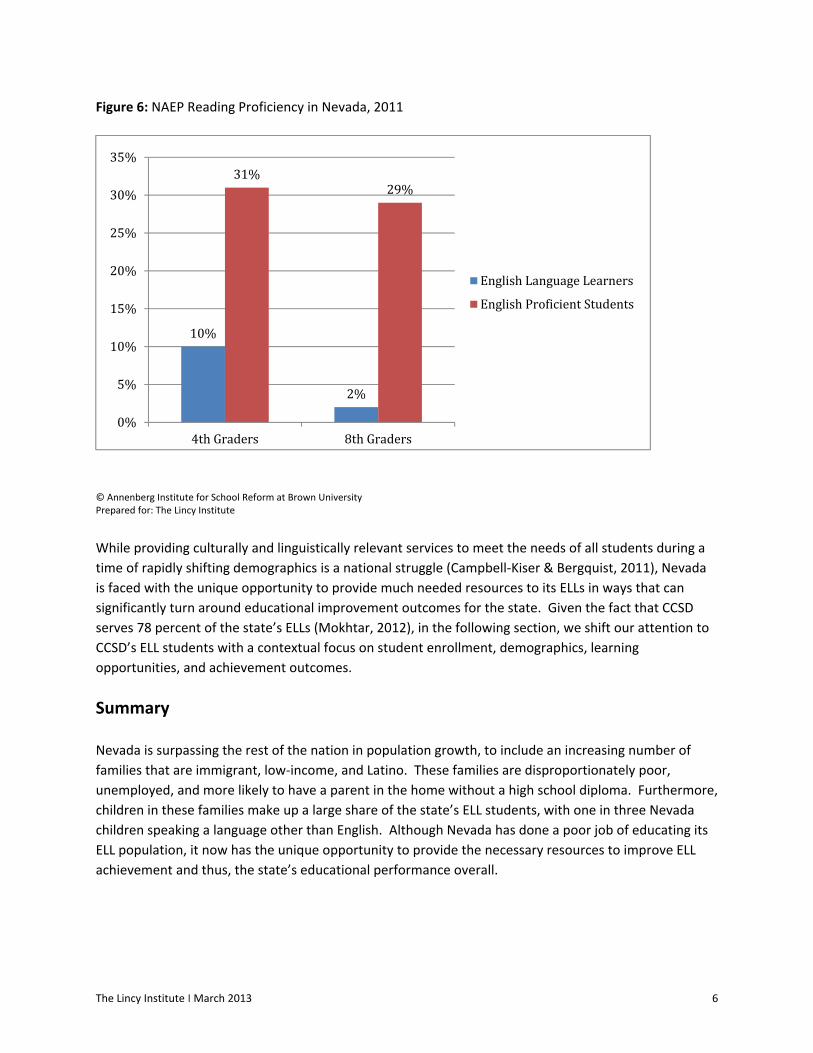
Nevada has done an especially poor job of educating its ELL student population. State level data reflect
disturbing national trends in the areas of ELL student achievement. For example, 90 percent of fourth‐
grade ELLs in Nevada scored below proficiency in reading on the National Assessment of Educational
Progress (NAEP) test compared with 69 percent of English‐proficient students. Eighth‐graders fared
even worse, with 98 percent of ELLs below proficiency compared with 71 percent of English‐proficient
students (Institute of Education Sciences, 2012) (Figure 6).
The Lincy Institute ׀ March 2013 6
Figure 6: NAEP Reading Proficiency in Nevada, 2011
© Annenberg Institute for School Reform at Brown University Prepared for: The Lincy Institute
While providing culturally and linguistically relevant services to meet the needs of all students during a
time of rapidly shifting demographics is a national struggle (Campbell‐Kiser & Bergquist, 2011), Nevada
is faced with the unique opportunity to provide much needed resources to its ELLs in ways that can
significantly turn around educational improvement outcomes for the state. Given the fact that CCSD
serves 78 percent of the state’s ELLs (Mokhtar, 2012), in the following section, we shift our attention to
CCSD’s ELL students with a contextual focus on student enrollment, demographics, learning
opportunities, and achievement outcomes.
Summary
Nevada is surpassing the rest of the nation in population growth, to include an increasing number of
families that are immigrant, low‐income, and Latino. These families are disproportionately poor,
unemployed, and more likely to have a parent in the home without a high school diploma. Furthermore,
children in these families make up a large share of the state’s ELL students, with one in three Nevada
children speaking a language other than English. Although Nevada has done a poor job of educating its
ELL population, it now has the unique opportunity to provide the necessary resources to improve ELL
achievement and thus, the state’s educational performance overall.
10%
2%
31%29%
0%
5%
10%
15%
20%
25%
30%
35%
4thGraders 8thGraders
EnglishLanguageLearners
EnglishProficientStudents
The Lincy Institute ׀ March 2013 7
ClarkCountySchoolDistrict’sEnglishLanguageLearners:EnrollmentandOutcomes
The academic performance of ELL students is particularly challenged given the fact that these students
tend to have greater academic needs, yet receive fewer resources to meet those needs in adequately
funded learning environments. Although Nevada represents the highest density of ELL students in the
nation (Migration Policy Institute, 2010), not one state dollar has been or is invested in ELL education
(AIR, 2012).
As noted in the next section, such under‐resourced learning opportunities affect all CCSD students. This
lack of investment is compounded for CCSD’s ELL students, who are grossly underfunded at the district
level and thus without access to the high quality instructors, instructional resources, and educational
supports essential to their academic success.
The following analysis reflects data available for the 2010‐2011 school year, which was the most recent
data available at the time of writing this report.
Student Enrollment and Demographics
During the 2010‐2011 school year, there were 626 public schools in Nevada – 341 of which were in CCSD
(the majority being public elementary schools at 218, with 38 public high schools). According to the
2012 Nevada Report Card, CCSD was home to 71 percent of all Nevada’s public school students,
followed by Washoe County at 14 percent (Mokhtar, 2012). Typical of urban districts, more than half of
the CCSD’s students are eligible for free or reduced‐price lunch, and 68 percent are students of color
(Mokhtar, 2012).
After a few years of declining enrollment, more students are attending CCSD than ever before. During
the 2012‐2013 school year, CCSD served 311,380 students, 3,007 more than the previous year. The
district also serves the largest proportion of Latino students compared to Nevada’s other school districts
and the state as a whole. In fact, in 2006, Latino students surpassed their White peers as the largest
group in CCSD.
All other student racial/ethnic groups increased their numbers, except for Native Americans (Milliard,
2012). By 2011, the CCSD student enrollment figures stood at 42% Latino, 32% White, 12% Black, 7%
Asian, 5% Multi‐Racial, 1% Pacific Islander, and 1% American Indian/Alaskan Native (Mokhtar, 2012)
(Figure 7).

The Lincy Institute ׀ March 2013 8
Figure 7: Student Population by Race (2011)
© Annenberg Institute for School Reform at Brown University Prepared for: The Lincy Institute
Notes: District totals do not include state‐ or district‐sponsored charter school data. © Annenberg Institute for School Reform at Brown University
Along with a steadily increasing Latino population in CCSD, according to Wright et al., (2011), over the
1992‐1994 and the 2000‐2001 school years, the number of students enrolled in the district’s ELL
program increased 245 percent to 35,296, while total student enrollment in the district grew 59 percent.
And while Spanish is the home language spoken by the majority of CCSD’s ELL students, as of February
2013, the district’s ELL population represents 154 different languages and 149 various countries of origin
(CCSD ELL Fast Facts, 2013).
It is important to note that eighty percent of CCSD’s ELL students are from the U.S. (CCSD ELL Fast Facts)
– perhaps implying that ELL status may have more to do with residential and linguistic isolation than
immigrant status. Only 11 percent are from Mexico with just under 2 percent emigrating from the
Philippines.
In 2011, about one‐quarter (23 percent) of CCSD students were ELLs, a slightly higher number than the
state proportion at 20 percent (Mokhtar, 2012). CCSD’s 2011 strategic plan illustrates the high priority
placed on improving ELL student achievement in one of its eight Annual Measurable Achievement
Objectives (AMAO):
The District will demonstrate increased achievement as measured by the AMAO objectives such
that: a) 52% of all LEP students achieve a 25 point gain in overall ELPA [English Language
Proficiency Assessment] scaled scores each year; b) 14% of all LEP students achieve English
42% 39%
32% 39%
12%10%
7% 6%5% 4%
0%
10%
20%
30%
40%
50%
60%
70%
80%
90%
100%
Percentofstudents
AmericanIndian/AlaskanNativePacificIslander
Multi‐Race
Asian
Black
White
LatinoCCSD Nevada
The Lincy Institute ׀ March 2013 9
language proficiency each year; and c) LEP students make AYP [adequate yearly progress] as
determined by Title I.9
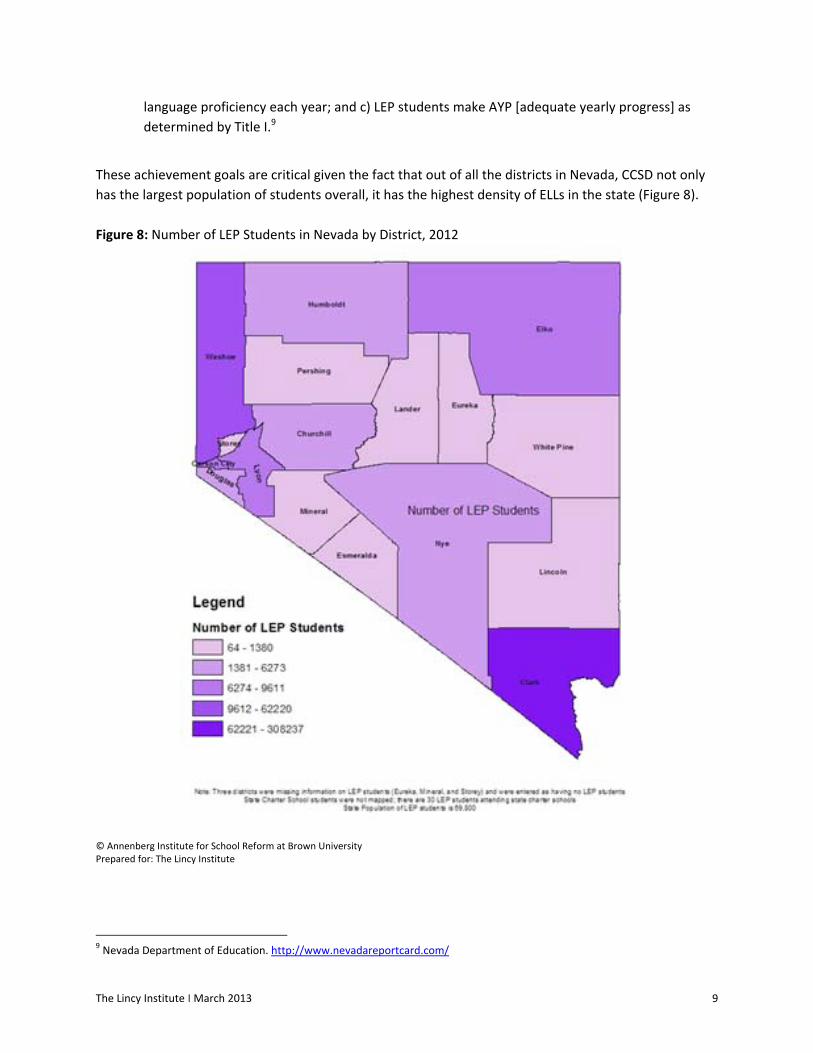
These achievement goals are critical given the fact that out of all the districts in Nevada, CCSD not only
has the largest population of students overall, it has the highest density of ELLs in the state (Figure 8).
Figure 8: Number of LEP Students in Nevada by District, 2012
© Annenberg Institute for School Reform at Brown University Prepared for: The Lincy Institute
9 Nevada Department of Education. http://www.nevadareportcard.com/
The Lincy Institute ׀ March 2013 10
Student Achievement Outcomes
An examination of achievement trends for elementary, middle, and high school students in CCSD
illustrates that although students overall are struggling, ELLs are faring particularly poorly compared to
students overall (Mokhtar, 2012). Important to note is that comparing ELL students to students as a
whole downplays the achievement gap, since ELL students are included in the total students comparison
group. However, we did not have access to proficiency levels for English‐proficient (EP) students to be
able to make the ideal comparison between two distinct groups – ELL students versus EP students.
However, despite our data limitations, and the resulting under‐estimations of the achievement gaps, the
large gaps we do uncover are due cause for concern in and of themselves.
The vast majority of Nevada students participate in general statewide content assessments – Nevada
Criterion Referenced Test (CRT)10 or Nevada High School Proficiency Examination (HSPE).11 Students are
rated on one of four levels: emergent/developing, approaches standard, meets standard or exceeds
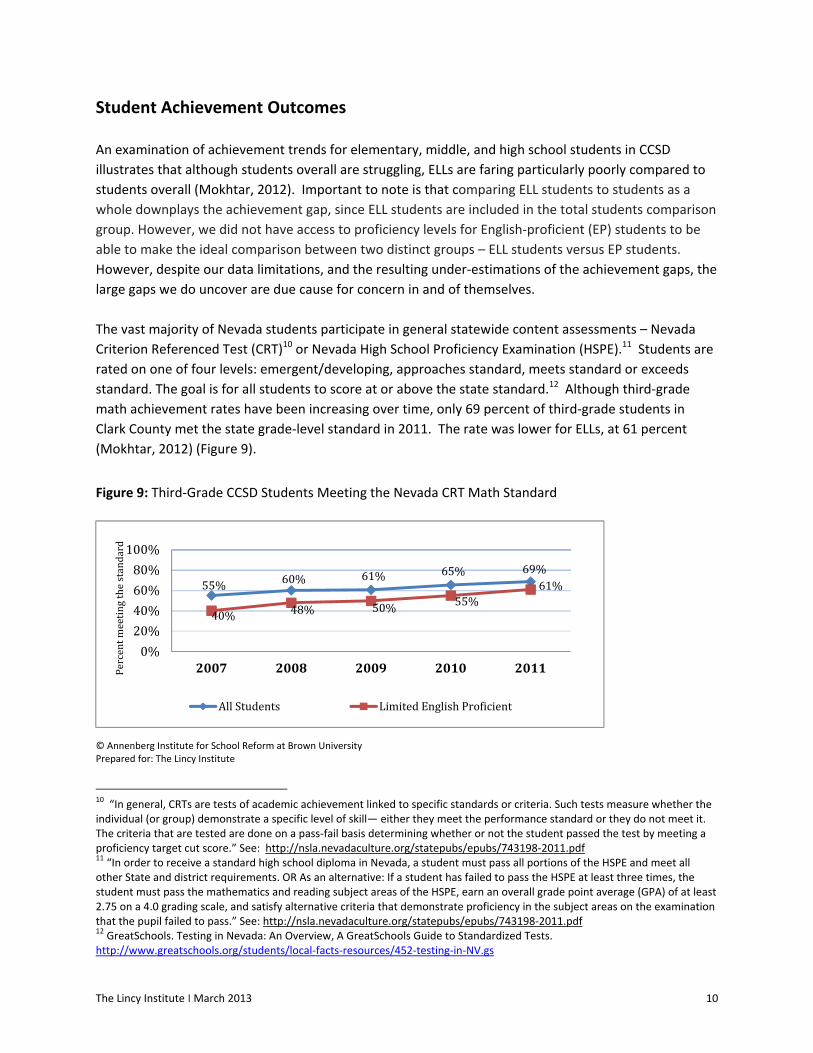
standard. The goal is for all students to score at or above the state standard.12 Although third‐grade
math achievement rates have been increasing over time, only 69 percent of third‐grade students in
Clark County met the state grade‐level standard in 2011. The rate was lower for ELLs, at 61 percent
(Mokhtar, 2012) (Figure 9).
Figure 9: Third‐Grade CCSD Students Meeting the Nevada CRT Math Standard
© Annenberg Institute for School Reform at Brown University Prepared for: The Lincy Institute
10 “In general, CRTs are tests of academic achievement linked to specific standards or criteria. Such tests measure whether the individual (or group) demonstrate a specific level of skill— either they meet the performance standard or they do not meet it. The criteria that are tested are done on a pass‐fail basis determining whether or not the student passed the test by meeting a proficiency target cut score.” See: http://nsla.nevadaculture.org/statepubs/epubs/743198‐2011.pdf 11 “In order to receive a standard high school diploma in Nevada, a student must pass all portions of the HSPE and meet all other State and district requirements. OR As an alternative: If a student has failed to pass the HSPE at least three times, the student must pass the mathematics and reading subject areas of the HSPE, earn an overall grade point average (GPA) of at least 2.75 on a 4.0 grading scale, and satisfy alternative criteria that demonstrate proficiency in the subject areas on the examination that the pupil failed to pass.” See: http://nsla.nevadaculture.org/statepubs/epubs/743198‐2011.pdf 12 GreatSchools. Testing in Nevada: An Overview, A GreatSchools Guide to Standardized Tests. http://www.greatschools.org/students/local‐facts‐resources/452‐testing‐in‐NV.gs
55% 60% 61% 65% 69%
40% 48% 50% 55%61%
0%
20%
40%
60%
80%
100%
2007 2008 2009 2010 2011Percentm
eetingthestandard
AllStudents LimitedEnglishProficient
The Lincy Institute ׀ March 2013 11
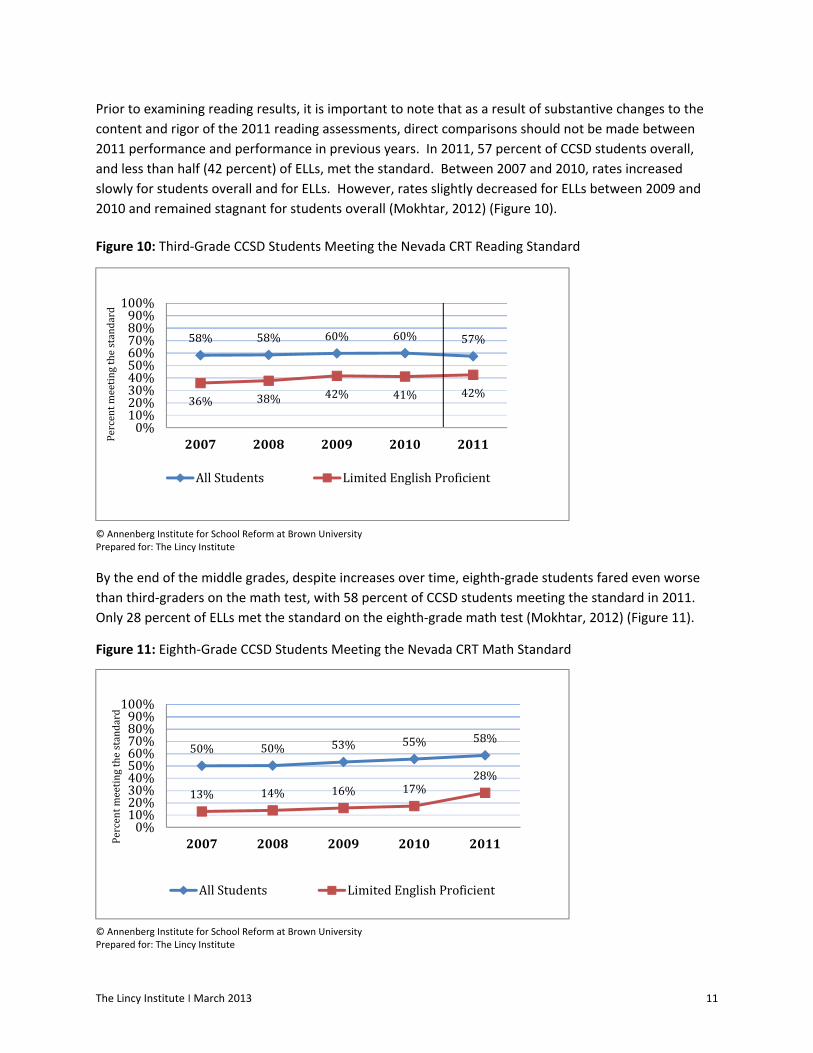
Prior to examining reading results, it is important to note that as a result of substantive changes to the
content and rigor of the 2011 reading assessments, direct comparisons should not be made between
2011 performance and performance in previous years. In 2011, 57 percent of CCSD students overall,
and less than half (42 percent) of ELLs, met the standard. Between 2007 and 2010, rates increased
slowly for students overall and for ELLs. However, rates slightly decreased for ELLs between 2009 and
2010 and remained stagnant for students overall (Mokhtar, 2012) (Figure 10).
Figure 10: Third‐Grade CCSD Students Meeting the Nevada CRT Reading Standard
© Annenberg Institute for School Reform at Brown University Prepared for: The Lincy Institute
By the end of the middle grades, despite increases over time, eighth‐grade students fared even worse
than third‐graders on the math test, with 58 percent of CCSD students meeting the standard in 2011.
Only 28 percent of ELLs met the standard on the eighth‐grade math test (Mokhtar, 2012) (Figure 11).
Figure 11: Eighth‐Grade CCSD Students Meeting the Nevada CRT Math Standard
© Annenberg Institute for School Reform at Brown University Prepared for: The Lincy Institute
58% 58% 60% 60% 57%
36% 38% 42% 41% 42%
0%10%20%30%40%50%60%70%80%90%100%
2007 2008 2009 2010 2011Percentm
eetingthestandard
AllStudents LimitedEnglishProficient
50% 50% 53% 55% 58%
13% 14% 16% 17%28%
0%10%20%30%40%50%60%70%80%90%100%
2007 2008 2009 2010 2011Percentm
eetingthestandard
AllStudents LimitedEnglishProficient
The Lincy Institute ׀ March 2013 12
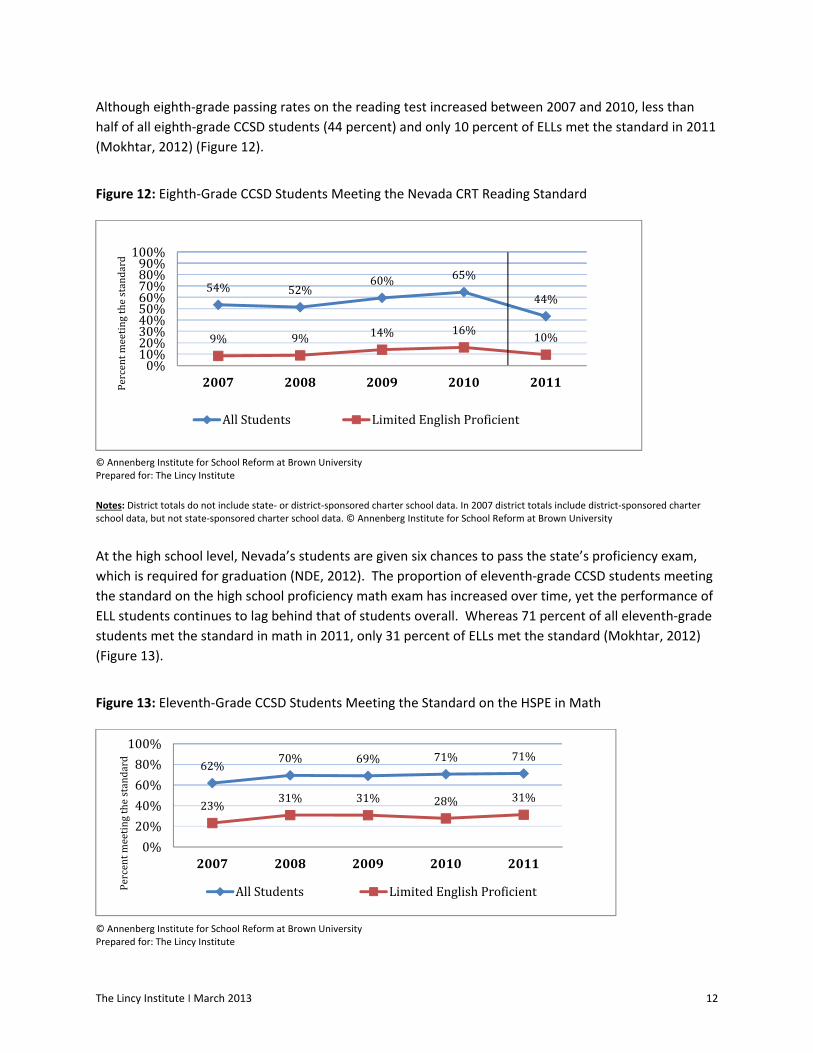
Although eighth‐grade passing rates on the reading test increased between 2007 and 2010, less than
half of all eighth‐grade CCSD students (44 percent) and only 10 percent of ELLs met the standard in 2011
(Mokhtar, 2012) (Figure 12).
Figure 12: Eighth‐Grade CCSD Students Meeting the Nevada CRT Reading Standard
© Annenberg Institute for School Reform at Brown University Prepared for: The Lincy Institute
Notes: District totals do not include state‐ or district‐sponsored charter school data. In 2007 district totals include district‐sponsored charter school data, but not state‐sponsored charter school data. © Annenberg Institute for School Reform at Brown University
At the high school level, Nevada’s students are given six chances to pass the state’s proficiency exam,
which is required for graduation (NDE, 2012). The proportion of eleventh‐grade CCSD students meeting
the standard on the high school proficiency math exam has increased over time, yet the performance of
ELL students continues to lag behind that of students overall. Whereas 71 percent of all eleventh‐grade
students met the standard in math in 2011, only 31 percent of ELLs met the standard (Mokhtar, 2012)
(Figure 13).
Figure 13: Eleventh‐Grade CCSD Students Meeting the Standard on the HSPE in Math
© Annenberg Institute for School Reform at Brown University Prepared for: The Lincy Institute
54% 52%60% 65%
44%
9% 9% 14% 16%10%
0%10%20%30%40%50%60%70%80%90%100%
2007 2008 2009 2010 2011Percentm
eetingthestandard
AllStudents LimitedEnglishProficient
62%70% 69% 71% 71%
23%31% 31% 28% 31%
0%
20%
40%
60%
80%
100%
2007 2008 2009 2010 2011
Percentm
eetingthestandard
AllStudents LimitedEnglishProficient
The Lincy Institute ׀ March 2013 13
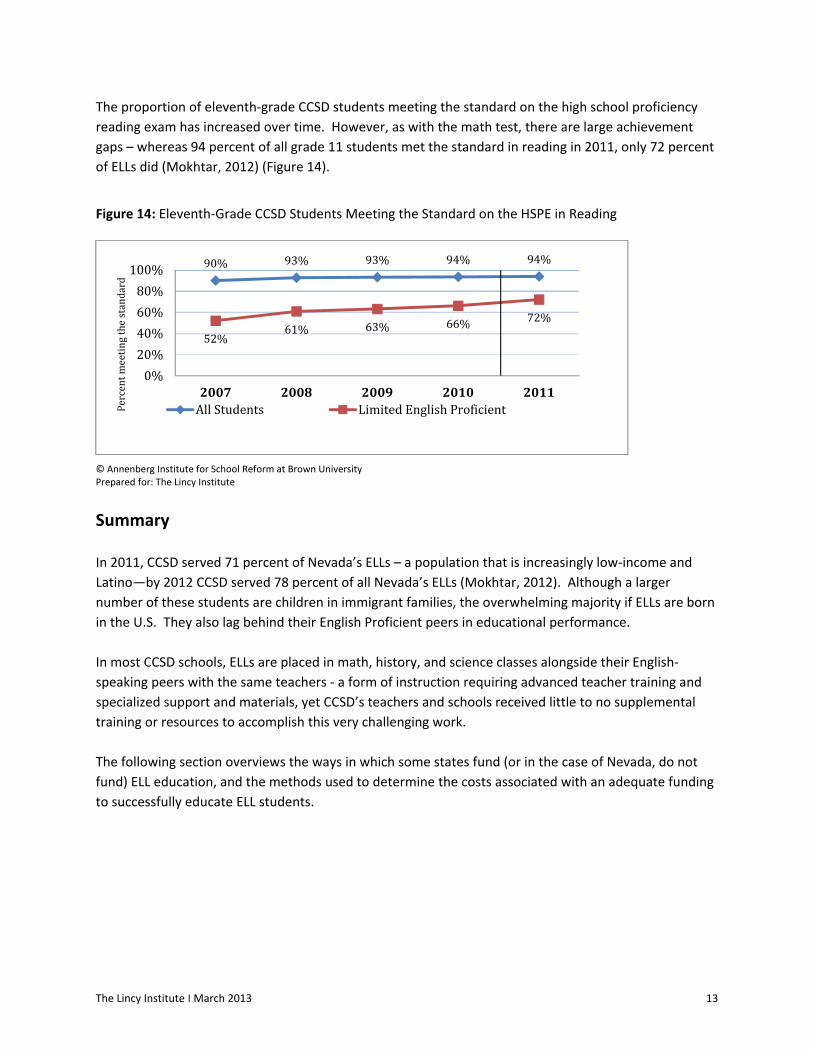
The proportion of eleventh‐grade CCSD students meeting the standard on the high school proficiency
reading exam has increased over time. However, as with the math test, there are large achievement
gaps – whereas 94 percent of all grade 11 students met the standard in reading in 2011, only 72 percent
of ELLs did (Mokhtar, 2012) (Figure 14).
Figure 14: Eleventh‐Grade CCSD Students Meeting the Standard on the HSPE in Reading
© Annenberg Institute for School Reform at Brown University Prepared for: The Lincy Institute
Summary
In 2011, CCSD served 71 percent of Nevada’s ELLs – a population that is increasingly low‐income and
Latino—by 2012 CCSD served 78 percent of all Nevada’s ELLs (Mokhtar, 2012). Although a larger
number of these students are children in immigrant families, the overwhelming majority if ELLs are born
in the U.S. They also lag behind their English Proficient peers in educational performance.
In most CCSD schools, ELLs are placed in math, history, and science classes alongside their English‐
speaking peers with the same teachers ‐ a form of instruction requiring advanced teacher training and
specialized support and materials, yet CCSD’s teachers and schools received little to no supplemental
training or resources to accomplish this very challenging work.
The following section overviews the ways in which some states fund (or in the case of Nevada, do not
fund) ELL education, and the methods used to determine the costs associated with an adequate funding
to successfully educate ELL students.
90% 93% 93% 94% 94%
52%61% 63% 66% 72%
0%
20%
40%
60%
80%
100%
2007 2008 2009 2010 2011
Percentm
eetingthestandard
AllStudents LimitedEnglishProficient

The Lincy Institute ׀ March 2013 14
ELLFundingandAccesstoEqualEducationinNevada
Despite having the highest density of ELLs than any other state in the nation (Migration Policy Institute, 2010) and federal law requiring states to provide adequate resources to ensure an equal education for ELL students,13 Nevada is among only eight states14 that do not allocate specific dollars to these students (AIR, 2012). And while proposals to dedicate state dollars to fund ELL education represent some signs of progress, determining the resource needs of Nevada’s ELL students and the adequate funding levels required to meet such needs remain oversimplified and understudied. Policy discussions about ELL funding are further complicated by concerns with equity, which have been the subject of numerous lawsuits filed in 44 states – the majority of which in the past ten years were won by plaintiffs (Jimenez‐Castellanos & Topper, 2012). In Clark County, recent cost savings mechanisms impacting ELL students have resulted in potential lawsuits by Latino activists (Takahashi, 2013). With resources come standards and accountability, and ELL education has been no exception. To be expected, the No Child Left Behind Act requires schools receiving federal Title III funds to report ELL performance. Title III is the only source of funding made available to Nevada’s ELLs beyond limited district level allocations. Nevertheless, in 1995, the Nevada State Legislature did require the State Board of Education develop a program that regulated and evaluated ELL students; and two years later, the Nevada Education Reform Act of 1997 included ELLs in its accountability framework (Nevada Legislature, 200, 2013) with zero investment from the state.
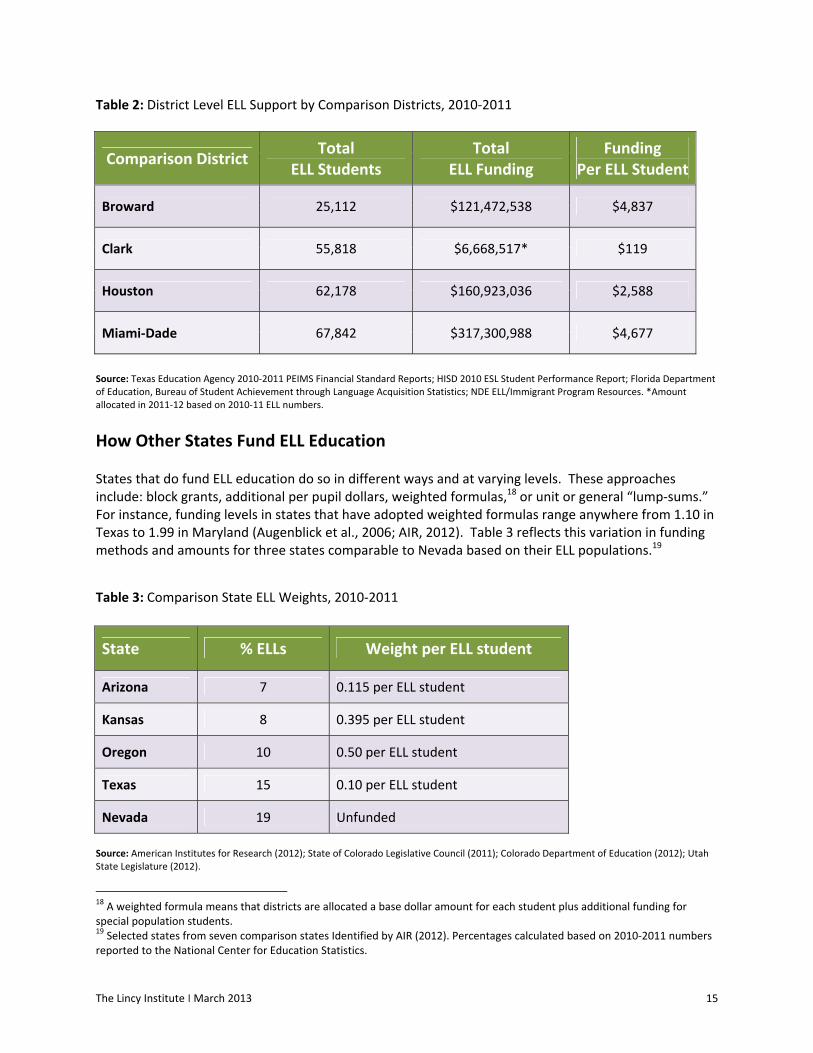
How Nevada Funds ELL Education The only monies Nevada schools receive to support ELL students are Title III federal funds given to states for language instruction for LEP and immigrant students (U.S. Department of Education, 2004; NDE, 2012). Title III funds are significantly less than what most states provide school districts for ELL students. For instance, in 2012‐2013, Nevada received approximately $8.3 million for 71,455 LEP students15 (55,818 students in CCSD) 16 based on 2010‐2011 enrollment figures, equating to $116 per pupil (NDE, 2012). At the district level, CCSD ELL students receive only $119 for ELL support. Comparison districts17 like Houston Independent School District in Texas, and Broward County and Miami‐Dade County Public Schools, both in Florida. Texas and Florida are among several states that distribute ELL funds according to a weighted funding formula. In Texas, ELL students are weighted at 1.10, meaning school districts receive 10 percent above the base funding for each ELL in their district (Texas Association of School Boards, 2013). In Florida, school districts are allocated 16.7 percent more per ELL (Florida Department of Education, 2012) (Table 2).
13 Civil Rights Act of 1964 and Equal Opportunity Act of 1974 required states provide adequate resources for ELL students designed to provide them with an equal education (Jimenez‐Castellanos & Topper, 2012). 14 Colorado, Delaware, Mississippi, Montana, Nevada, Pennsylvania, South Carolina, and South Dakota. 15 It is important to note the discrepancy in the NDE figure of 71,455 LEPs submitted for Title III funding (http://www.doe.nv.gov/ELL_Resources_Page) and the 87, 240 figure reported in the 2012 Nevada Report Card (www.nevadareportcard.com). 16 CCSD figure for enrolled ELLs for the same year was 55,502. Data available at http://ellp.ccsd.net/Statistics/index.html 17 Identified by the Gibson Consulting Group (2011) based on similar size and demographics.
The Lincy Institute ׀ March 2013 15
Table 2: District Level ELL Support by Comparison Districts, 2010‐2011
Comparison District Total
ELL Students Total
ELL Funding Funding
Per ELL Student
Broward 25,112 $121,472,538 $4,837
Clark 55,818 $6,668,517* $119
Houston 62,178 $160,923,036 $2,588
Miami‐Dade 67,842 $317,300,988 $4,677
Source: Texas Education Agency 2010‐2011 PEIMS Financial Standard Reports; HISD 2010 ESL Student Performance Report; Florida Department of Education, Bureau of Student Achievement through Language Acquisition Statistics; NDE ELL/Immigrant Program Resources. *Amount allocated in 2011‐12 based on 2010‐11 ELL numbers.
How Other States Fund ELL Education States that do fund ELL education do so in different ways and at varying levels. These approaches include: block grants, additional per pupil dollars, weighted formulas,18 or unit or general “lump‐sums.” For instance, funding levels in states that have adopted weighted formulas range anywhere from 1.10 in Texas to 1.99 in Maryland (Augenblick et al., 2006; AIR, 2012). Table 3 reflects this variation in funding methods and amounts for three states comparable to Nevada based on their ELL populations.19
Table 3: Comparison State ELL Weights, 2010‐2011
State % ELLs Weight per ELL student
Arizona 7 0.115 per ELL student
Kansas 8 0.395 per ELL student
Oregon 10 0.50 per ELL student
Texas 15 0.10 per ELL student
Nevada 19 Unfunded
Source: American Institutes for Research (2012); State of Colorado Legislative Council (2011); Colorado Department of Education (2012); Utah State Legislature (2012).
18 A weighted formula means that districts are allocated a base dollar amount for each student plus additional funding for special population students. 19 Selected states from seven comparison states Identified by AIR (2012). Percentages calculated based on 2010‐2011 numbers reported to the National Center for Education Statistics.
The Lincy Institute ׀ March 2013 16
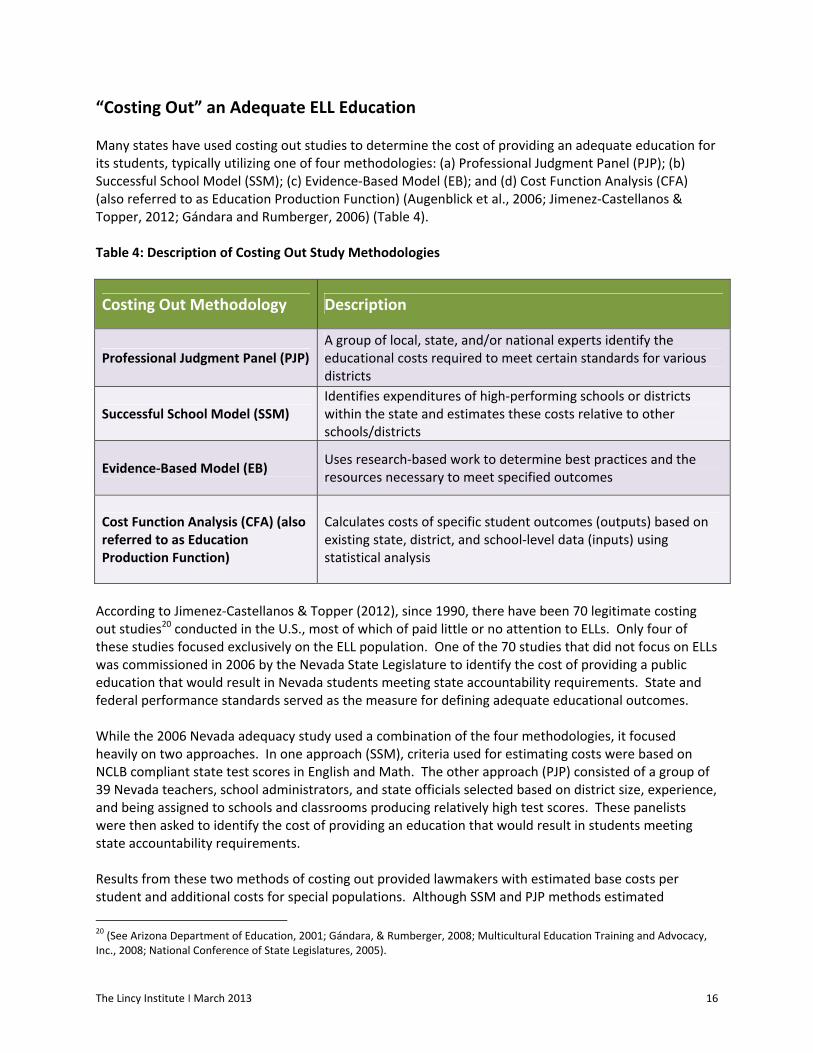
“Costing Out” an Adequate ELL Education Many states have used costing out studies to determine the cost of providing an adequate education for its students, typically utilizing one of four methodologies: (a) Professional Judgment Panel (PJP); (b) Successful School Model (SSM); (c) Evidence‐Based Model (EB); and (d) Cost Function Analysis (CFA) (also referred to as Education Production Function) (Augenblick et al., 2006; Jimenez‐Castellanos & Topper, 2012; Gándara and Rumberger, 2006) (Table 4). Table 4: Description of Costing Out Study Methodologies
Costing Out Methodology Description
Professional Judgment Panel (PJP) A group of local, state, and/or national experts identify the educational costs required to meet certain standards for various districts
Successful School Model (SSM) Identifies expenditures of high‐performing schools or districts within the state and estimates these costs relative to other schools/districts
Evidence‐Based Model (EB) Uses research‐based work to determine best practices and the resources necessary to meet specified outcomes
Cost Function Analysis (CFA) (also referred to as Education Production Function)
Calculates costs of specific student outcomes (outputs) based on existing state, district, and school‐level data (inputs) using statistical analysis
According to Jimenez‐Castellanos & Topper (2012), since 1990, there have been 70 legitimate costing out studies20 conducted in the U.S., most of which of paid little or no attention to ELLs. Only four of these studies focused exclusively on the ELL population. One of the 70 studies that did not focus on ELLs was commissioned in 2006 by the Nevada State Legislature to identify the cost of providing a public education that would result in Nevada students meeting state accountability requirements. State and federal performance standards served as the measure for defining adequate educational outcomes. While the 2006 Nevada adequacy study used a combination of the four methodologies, it focused heavily on two approaches. In one approach (SSM), criteria used for estimating costs were based on NCLB compliant state test scores in English and Math. The other approach (PJP) consisted of a group of 39 Nevada teachers, school administrators, and state officials selected based on district size, experience, and being assigned to schools and classrooms producing relatively high test scores. These panelists were then asked to identify the cost of providing an education that would result in students meeting state accountability requirements. Results from these two methods of costing out provided lawmakers with estimated base costs per student and additional costs for special populations. Although SSM and PJP methods estimated
20 (See Arizona Department of Education, 2001; Gándara, & Rumberger, 2008; Multicultural Education Training and Advocacy, Inc., 2008; National Conference of State Legislatures, 2005).
The Lincy Institute ׀ March 2013 17
different costs, they both found that ELL students were underfunded and recommended that Nevada spend between $132 million to $206 million dollars annually on this population based on 2003‐2004 figures.21
Determining Resource Needs for Nevada’s English Language Learners
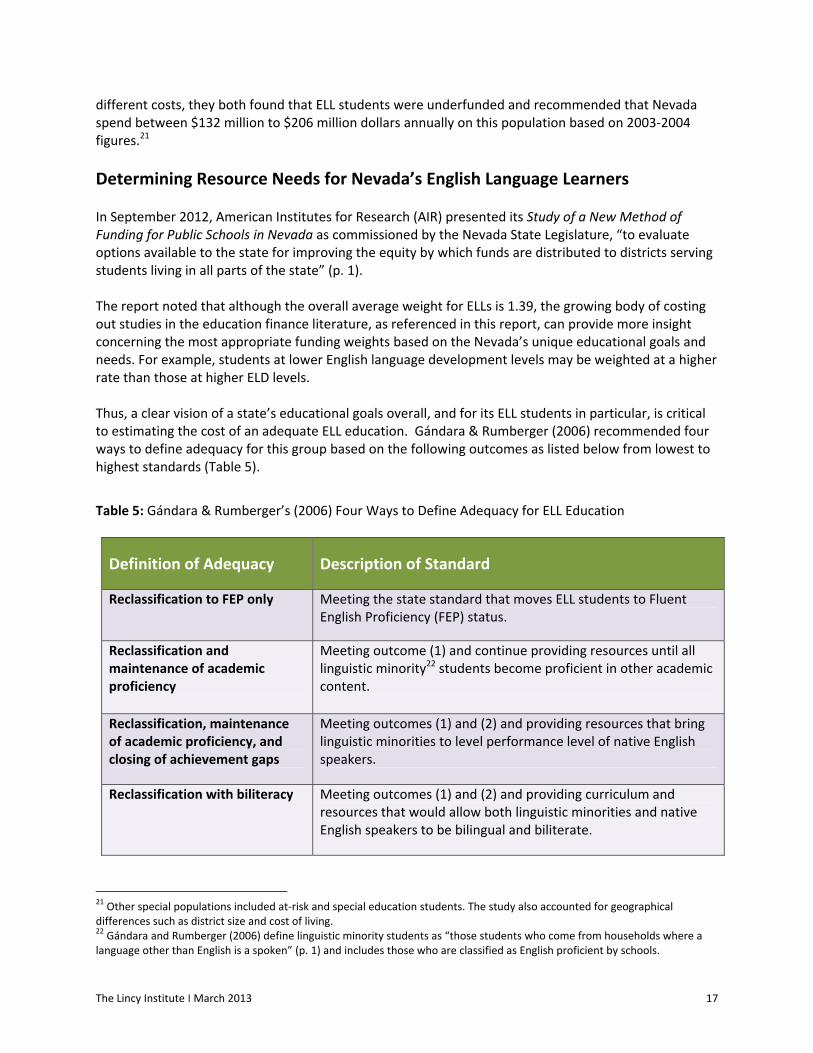
In September 2012, American Institutes for Research (AIR) presented its Study of a New Method of Funding for Public Schools in Nevada as commissioned by the Nevada State Legislature, “to evaluate options available to the state for improving the equity by which funds are distributed to districts serving students living in all parts of the state” (p. 1). The report noted that although the overall average weight for ELLs is 1.39, the growing body of costing out studies in the education finance literature, as referenced in this report, can provide more insight concerning the most appropriate funding weights based on the Nevada’s unique educational goals and needs. For example, students at lower English language development levels may be weighted at a higher rate than those at higher ELD levels. Thus, a clear vision of a state’s educational goals overall, and for its ELL students in particular, is critical to estimating the cost of an adequate ELL education. Gándara & Rumberger (2006) recommended four ways to define adequacy for this group based on the following outcomes as listed below from lowest to highest standards (Table 5).
Table 5: Gándara & Rumberger’s (2006) Four Ways to Define Adequacy for ELL Education
Definition of Adequacy Description of Standard
Reclassification to FEP only Meeting the state standard that moves ELL students to Fluent English Proficiency (FEP) status.
Reclassification and maintenance of academic proficiency
Meeting outcome (1) and continue providing resources until all linguistic minority22 students become proficient in other academic content.
Reclassification, maintenance of academic proficiency, and closing of achievement gaps
Meeting outcomes (1) and (2) and providing resources that bring linguistic minorities to level performance level of native English speakers.
Reclassification with biliteracy Meeting outcomes (1) and (2) and providing curriculum and resources that would allow both linguistic minorities and native English speakers to be bilingual and biliterate.
21 Other special populations included at‐risk and special education students. The study also accounted for geographical differences such as district size and cost of living. 22 Gándara and Rumberger (2006) define linguistic minority students as “those students who come from households where a language other than English is a spoken” (p. 1) and includes those who are classified as English proficient by schools.
The Lincy Institute ׀ March 2013 18
In their study of California linguistic minorities, Gándara and Rumberger (2007) used the second outcome, reclassification and maintenance of academic proficiency, with an eventual aim toward bi‐literacy, for their definition of adequacy. They conducted a pilot costing out study using schools selected based on high levels of ELL academic achievement, location, and curriculum and identified five areas that require investment for ELL success:
1. A high‐quality preschool program; 2. A comprehensive instructional program that addresses both English language development
and the core curriculum; 3. Sufficient and appropriate student and family support; 4. Ongoing professional support for teachers with a significant focus on the teaching of ELL
students; and 5. A safe, welcoming school climate.
Although these recommendations are not very specific, they do offer insight into how states can approach an ELL costing out study that defines adequacy in ways beyond test score data and target investments in areas beyond staffing. Nevertheless, any of the four costing out methods can provide valuable information regarding ELL student resource needs and their associated costs. Any costing out analysis must recognize the diversity among the ELL student population since their needs vary based on their “linguistic, social, and academic backgrounds and the age at which they enter the U.S. school system” (Gándara & Rumberger, 2006, p. 3). Studies to develop funding formulas should include the opinions of ELL experts, leaders from schools or districts with high performing ELL populations, highlights of ELL best practices, and ELL‐specific indicators of engagement and outcomes (Jimenez‐Castellanos & Topper, 2012).
Summary Nevada is only one of eight states that do not fund ELLs at a higher rate than non‐ELL students. Studies examining the adequacy and equitable nature of state funding formulas often ignore the needs of ELL students, including the 2012 study in Nevada, which recommended the state undertake a costing out study to best determine how to adequately fund ELL education.
The Lincy Institute ׀ March 2013 19
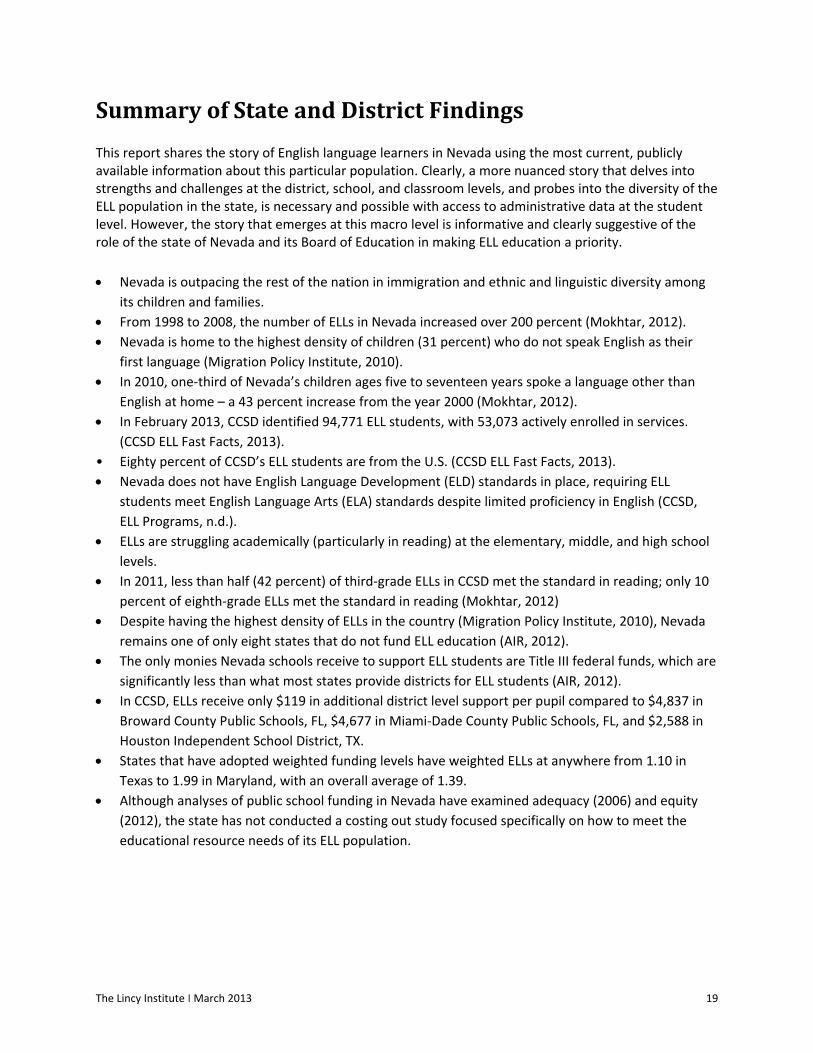
SummaryofStateandDistrictFindings This report shares the story of English language learners in Nevada using the most current, publicly available information about this particular population. Clearly, a more nuanced story that delves into strengths and challenges at the district, school, and classroom levels, and probes into the diversity of the ELL population in the state, is necessary and possible with access to administrative data at the student level. However, the story that emerges at this macro level is informative and clearly suggestive of the role of the state of Nevada and its Board of Education in making ELL education a priority.
Nevada is outpacing the rest of the nation in immigration and ethnic and linguistic diversity among
its children and families.
From 1998 to 2008, the number of ELLs in Nevada increased over 200 percent (Mokhtar, 2012).
Nevada is home to the highest density of children (31 percent) who do not speak English as their
first language (Migration Policy Institute, 2010).
In 2010, one‐third of Nevada’s children ages five to seventeen years spoke a language other than
English at home – a 43 percent increase from the year 2000 (Mokhtar, 2012).
In February 2013, CCSD identified 94,771 ELL students, with 53,073 actively enrolled in services.
(CCSD ELL Fast Facts, 2013).
• Eighty percent of CCSD’s ELL students are from the U.S. (CCSD ELL Fast Facts, 2013).
Nevada does not have English Language Development (ELD) standards in place, requiring ELL
students meet English Language Arts (ELA) standards despite limited proficiency in English (CCSD,
ELL Programs, n.d.).
ELLs are struggling academically (particularly in reading) at the elementary, middle, and high school
levels.
In 2011, less than half (42 percent) of third‐grade ELLs in CCSD met the standard in reading; only 10
percent of eighth‐grade ELLs met the standard in reading (Mokhtar, 2012)
Despite having the highest density of ELLs in the country (Migration Policy Institute, 2010), Nevada
remains one of only eight states that do not fund ELL education (AIR, 2012).
The only monies Nevada schools receive to support ELL students are Title III federal funds, which are
significantly less than what most states provide districts for ELL students (AIR, 2012).
In CCSD, ELLs receive only $119 in additional district level support per pupil compared to $4,837 in
Broward County Public Schools, FL, $4,677 in Miami‐Dade County Public Schools, FL, and $2,588 in
Houston Independent School District, TX.
States that have adopted weighted funding levels have weighted ELLs at anywhere from 1.10 in
Texas to 1.99 in Maryland, with an overall average of 1.39.
Although analyses of public school funding in Nevada have examined adequacy (2006) and equity
(2012), the state has not conducted a costing out study focused specifically on how to meet the
educational resource needs of its ELL population.
The Lincy Institute ׀ March 2013 20
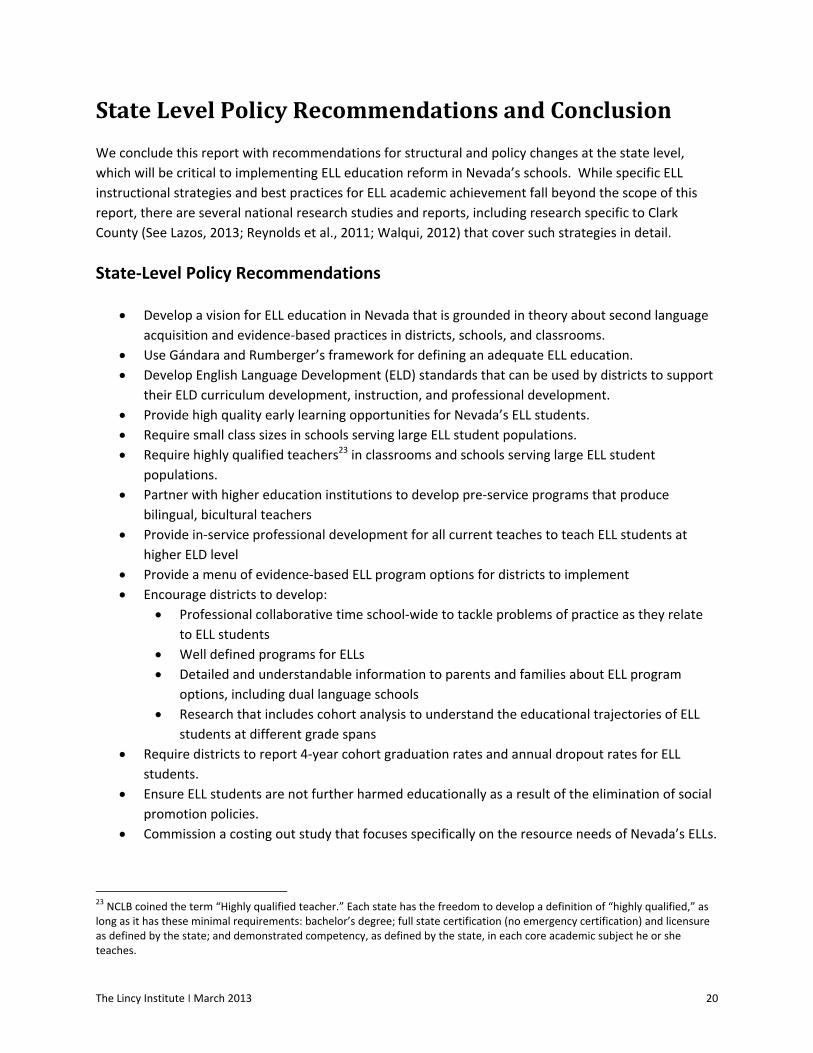
StateLevelPolicyRecommendationsandConclusion
We conclude this report with recommendations for structural and policy changes at the state level,
which will be critical to implementing ELL education reform in Nevada’s schools. While specific ELL
instructional strategies and best practices for ELL academic achievement fall beyond the scope of this
report, there are several national research studies and reports, including research specific to Clark
County (See Lazos, 2013; Reynolds et al., 2011; Walqui, 2012) that cover such strategies in detail.
State‐Level Policy Recommendations
Develop a vision for ELL education in Nevada that is grounded in theory about second language
acquisition and evidence‐based practices in districts, schools, and classrooms.
Use Gándara and Rumberger’s framework for defining an adequate ELL education.
Develop English Language Development (ELD) standards that can be used by districts to support
their ELD curriculum development, instruction, and professional development.
Provide high quality early learning opportunities for Nevada’s ELL students.
Require small class sizes in schools serving large ELL student populations.
Require highly qualified teachers23 in classrooms and schools serving large ELL student
populations.
Partner with higher education institutions to develop pre‐service programs that produce
bilingual, bicultural teachers
Provide in‐service professional development for all current teaches to teach ELL students at
higher ELD level
Provide a menu of evidence‐based ELL program options for districts to implement
Encourage districts to develop:
Professional collaborative time school‐wide to tackle problems of practice as they relate
to ELL students
Well defined programs for ELLs
Detailed and understandable information to parents and families about ELL program
options, including dual language schools
Research that includes cohort analysis to understand the educational trajectories of ELL
students at different grade spans
Require districts to report 4‐year cohort graduation rates and annual dropout rates for ELL
students.
Ensure ELL students are not further harmed educationally as a result of the elimination of social
promotion policies.
Commission a costing out study that focuses specifically on the resource needs of Nevada’s ELLs.
23 NCLB coined the term “Highly qualified teacher.” Each state has the freedom to develop a definition of “highly qualified,” as long as it has these minimal requirements: bachelor’s degree; full state certification (no emergency certification) and licensure as defined by the state; and demonstrated competency, as defined by the state, in each core academic subject he or she teaches.
The Lincy Institute ׀ March 2013 21
Develop a weighted student funding formula that allocates additional funding to ELL students
based on their English language development level and clearly defined educational goals and
needs.
Identify and allocate adequate state funds to the education of Nevada’s ELL students and other
linguistic minorities.
Conclusion
This report paints a picture of Nevada’s English Language Learner population and provides suggestions
for improving their educational opportunities and outcomes. Given the large and growing share of
Nevada students who are linguistic minorities, more attention must be paid to English language
acquisition, development, and proficiency in Nevada’s schools. The state must pave the way for this to
occur by sharing a vision for ELL education and providing the resources and guidance to districts.
Our findings also confirm that extra funding, resources, and educational supports are needed for
Nevada’s ELL students if the state ever hopes to reverse not only its dismal academic trends among this
population, but also its poor national rankings in education. The adequate education of Nevada’s ELLs is
inextricably linked to the educational and economic future of the state.
As such, it is our hope that this report not only sheds light on the important issue of ELL education in
Nevada, but also contributes useful information to address the pressing needs facing Nevada’s English
Language Learners and the schools that serve them.
The Lincy Institute ׀ March 2013 22
References American Institutes for Research (2012, August 22). Study of a new method of funding for public schools in Nevada.
Report submitted to Nevada Legislative Counsel Bureau. Retrieved from http://leg.state.nv.us/Interim/76th2011/Committee/Studies/FundingSchools/OtherNV_F unding_Study_Report_FINAL_2012_09_25.pdf
Annie E. Casey Foundation. (2013). KIDS COUNT Data Center. Retrieved from http://datacenter.kidscount.org Arizona Department of Education. (2001). English acquisition program cost study—Phases I through IV. Phoenix:
Author. Augenblick, Palaich, & Associates. (2006). Estimating the cost of an adequate education in Nevada. Report
prepared for Nevada Legislative Commission’s Committee to Study School Financing Adequacy. Retrieved from http://www.apaconsulting.net/uploads/reports/7.pdf
Batalova, J., & Lee, A. (2012). Frequently requested statistics on Immigrants and Immigration in the United States. Washington, DC: Migration Policy Institute.
Campbell‐Kiser, K., & Bergquist, K. J.(2011). “Culture, Language and Gendered Violence in Southern Nevada” (April 20). Graduate Research Symposium (GCUA). Paper 9, University of Nevada Las Vegas. Available online at http://digitalscholarship.unlv.edu/grad_symposium/2011/april20/9.
Clark County School District. (2011). Clark County School District Accountability Report: 2010‐11 School Year. Las Vegas, NV: CCSD Accountability Department.
Clark County School District. (2012, June 11). “Clark County School District Begins Reduction in Force.” CCSD news release.
Clark County School District. (2013). ELLP Fast Statistical Facts – February 2013. Retrieved from http://ellp.ccsd.net/Statistics/region_monthly_stats/ELL_Fast_Facts.pdf
Clark County School District. (n.d.) English language learner program. Standards. Retrieved from http://ellp.ccsd.net/programs/standards.html
Colorado Department of Education. (2012, July). Understanding Colorado school finance and categorical program funding. Retrieved from http://www.ednewscolorado.org/wp‐content/uploads/2011/08/FY2012‐13Brochure.pdf
Florida Department of Education. (2012). 2012‐13 Funding for Florida school districts: Statistical Report. Retrieved from http://www.fldoe.org/fefp/pdf/fefpdist.pdf
Florida Department of Education. (2013). Bureau of student achievement through language acquisition statistics data. 2010‐11 Florida ELLs (LYs) by Grade. Retrieved from http://www.fldoe.org/aala/pdf/1011‐ELLGrade.pdf
Gándara, P., & Rumberger, R. (2006, December 30). Resource needs for California English learners. University of California, CA: Linguistic Minority Research Institute.
Gándara, P., & Rumberger, R. (2007). Resource needs for California English learners. Getting down to facts project summary. Stanford, CA: Institute for Research of Education Policy & Practice, Stanford University.
Gibson Consulting Group. (2011). Educational and operational efficiency study of the Clark County School District. Retrieved from http://www.ccsd.net/district/gibsonreport/gibson2011/Educational_and_Operational_Efficieny_Study_of_the_Clark_C.pdf
Goldenberg, C. (2006). “Improving Achievement for English Learners: What the Research Tells Us.” Education Week. Available to subscribers at http://www.edweek.org/ew/articles/2006/07/26/43goldenberg.h25.html
GreatSchools. (2013). Testing in Nevada: An Overview, A GreatSchools guide to standardized tests. Retrieved from http://www.greatschools.org/students/local‐facts‐resources/452‐testing‐in‐NV.gs
Houston Independent School District. (2010). 2010 ESL student performance report. Research & Accountability Department. Retrieved from https://www2.houstonisd.org/ResearchAccountability/Home/PE_Multilingual/ESL%20010%20COMPLETE.pdf
Institute of Education Sciences. (2012). The Nation’s Report Card: Reading 2011, National Assessment of Educational Progress at Grades 4 and 8. Washington, D.C.: U.S. Department of Education. Retrieved from http://nces.ed.gov/nationsreportcard/naepdata/report.aspx
The Lincy Institute ׀ March 2013 23
Jimenez‐Castellanos, O., & Topper, A. M. (2012). The cost of providing an adequate education to English language learners: A review of the literature. Review of Educational Research, 82( 2) 179–232. DOI: 10.3102/0034654312449872
Lazos, S. (2013). Nevada neglects English language learners children at its economic peril. Developed for Latino Leaders Alliance.
Migration Policy Institute (2010). States and Districts with the Highest Number and Share of English Language Learners. National Center on Immigrant Integration Policy. ELL Information Center Fact Sheet Series, No.2. 2010. http://www.migrationinformation.org/ellinfo/FactSheet_ELL2.pdf
Migration Policy Institute (2011). Limited English Proficient Individuals in the United States: Number, share, growth, and linguistic diversity. National Center on Immigrant Integration Policy. LEP Data Brief. December 2011. http://www.migrationinformation.org/integration/LEPdatabrief.pdf
Milliard, T., (2012). “Clark County School District’s Enrollment Grows.” Las Vegas Review‐Journal (September 25). Retrieved from http://www.lvrj.com/news/clark‐county‐school‐district‐s‐enrollment‐grows‐171077941.html.
Mokhtar, C. (2012). Clark County School District’s English Language Learners: An analysis of enrollment, educational opportunities, and outcomes in Nevada and CCSD. Provided as an Internal Working Document to The Lincy Institute at the University of Nevada, Las Vegas by the Annenberg Institute for School Reform at Brown University
Multicultural Education Training and Advocacy, Inc. (2008). Getting it right: Ensuring a quality education for English language learners in New York. Prepared by the New York Immigration Coalition.
National Center for Education Statistics, (2012). The Nation’s Report Card: Reading 2011. Washington, DC: U.S. Department of Education Institute of Education Sciences. Nevada State Senate. 2011. Nevada Education Data Book. Available at http://www.leg.state.nv.us/Division/Research/Publications/EdDataBook/2011/Ch01.pdf .
National Conference of State Legislatures. (2005). Arizona English language learner cost study. Prepared for the Arizona Legislative Council. Retrieved from http:// www.schoolfunding.info/states/az/AZ‐NCSLenglanglearn2005.pdf
Nevada Department of Education. (2012). Assessment resources. Procedures manual SY 2012 2013. Retrieved from http://www.doe.nv.gov/Assessment_Resources/
Nevada Department of Education. (2012). English language learners/immigrant program resources. 2012‐2013 Title III allocations. Retrieved from http://www.doe.nv.gov/ELL_Resources_Page
Nevada Department of Education. (2012). Administrative and fiscal Services. Nevada annual reports of accountability.
Nevada Department of Education. (2012). Nevada report card. Retrieved from http://www.nevadareportcard.com/ Nevada Legislature. (2013). Nevada Revised Statues: Chapter 388‐Systems of Public Instruction. Retrieved from
http://www.leg.state.nv.us/NRS/NRS‐388.html#NRS388Sec405 Nevada Legislature. (2000, December 31). Legislative bureau of educational accountability and program
evaluation: Fourth annual report. Retrieved from http://leg.state.nv.us/Division/fiscal/LeBeapeAnnualRpt0001.htm
Nevada State Library and Archives. (2011). 2011 Nevada education data book. Retrieved from http://nsla.nevadaculture.org/statepubs/epubs/743198‐2011.pdf
Ortman, J. M., & Shin, H.B. (2011). “Language Projections: 2010 to 2020.” Paper presented at the annual meetings of the American Sociological Association, Las Vegas, NV, August 20–23.
Population Reference Bureau. (2012). U.S. Census Bureau, Census 2000 Supplementary Survey, Population Reference Bureau. (2012). 2002 through 2010 American Community Survey. Population Reference Bureau. (2012). 2001 Supplementary Survey, Reynolds, R. E., Lazos, S., Putney, L. (2011). CCSD‐UNLV partnership for English language learners. Final report for
Lincy Institute Fellowship Project. Takahashi, P. (2012, June 23). “Conference Attendees Say Nevada Isn’t Doing Enough to Educate ELL Students.” Las
Vegas Sun. Retrieved from http://www.lasvegassun.com/news/2012/jun/23/conference‐explores‐challenges‐nevadaschools‐engl/.
Takahashi, P. (2013, March 6). Lost in translation: District cost‐cutting move targets non‐English‐speaking parents of special needs students. Las Vegas Sun. Retrieved from http://www.lasvegassun.com/news/2013/mar/06/lost‐translation‐districts‐cost‐cutting‐move‐targe/#ixzz2NH7EZJ00
The Lincy Institute ׀ March 2013 24
Texas Association of School Boards (2013). Issue: Adjustments and weights in the Texas school finance system. Retrieved from http://www.tasb.org/legislative/documents/weights.pdf
Texas Education Agency. (2012). 2010‐2011 PEIMS financial standard reports. Retrieved from http://ritter.tea.state.tx.us
Thomas, W. P., & V. P. Collier. 1997. School effectiveness for language minority students. National Clearinghouse for English Language Acquisition (NCELA) Resource Collection Series, No. 9. Washington, DC: George Washington University Center for the Study of Language and Education. Available online at http://www.thomasandcollier.com/Downloads/1997_Thomas‐Collier97.pdf .
Tung, R., Uriarte, M., Diez, V., Lavin, N., Augusti, N., Karp, F., & Meschede, T. (2009). English Language Learners in Boston Public Schools: Enrollment, Engagement and Academic Outcomes, AY2003–AY2006 Final Report. Boston, MA: Mauricio Gaston Institute for Latino Community Development and Public Policy.
Tyler, T. G., Garner, D., Wakefield, M., Cleveland, R., & Owens, S. (2012). “Academic Achievement and School Resources.” In D. N. Shalin (Ed.), The Social Health of Nevada: Leading Indicators and Quality of Life in the Silver State. Las Vegas, NV: UNLV Center for Democratic Culture. Retrieved from http://cdclv.unlv.edu/healthnv_2012/index
U.S. Census Bureau. (2013). State and County QuickFacts. Retrieved from http://www.census.gov/prod/cen2010/briefs/c2010br‐01.pdf
U.S. Department of Education. (2004). Elementary & secondary education. Title III—Language instruction for limited English proficient and immigrant students. Retrieved from http://www2.ed.gov/policy/elsec/leg/esea02/pg39.html
Walqui, A. (2012, June). Clark County public schools, Nevada: Report on instruction for English language learners. Produced by WestEd Quality Teaching for English Learners for CCSD.
Wright, C. T., Tuman, J.T., & Stevenson. M. T. (2011). “Immigration and Ethnic Diversity in Nevada.” In D. N. Shalin (Ed.), The Social Health of Nevada: Leading Indicators and Quality of Life in the Silver State. Las Vegas, NV: UNLV Center for Democratic Culture. Available at http://cdclv.unlv.edu/healthnv_2012/index.