Embed Size (px)
Citation preview
Land Resources and socio-economic report of
Bonga, Boginda, Mankira and the surrounding areas in Kaffa zone, SNNPRS, Ethiopia
Prepared by
Tezera Chernet
Submitted to PPP project July 2008Addis Ababa
Report on the land resources of Bonga, Boginda and Mankira areas
EWNHS 2
Table of Content
Page
ACRONYMS AND ABBREVIATIONS USED.................................................................................................. V
I. INTRODUCTION ......................................................................................................................................1
1.1 BACKGROUND ..............................................................................................................................................3 1.2 OBJECTIVE ...................................................................................................................................................3 1.3 DATA SOURCES ............................................................................................................................................4 1.4 THE PHYSICAL ENVIRONMENT .........................................................................................................................4
1.4.1 Climate ............................................................................................................................................. 4 1.4.2 Topography and Soil ......................................................................................................................... 6 1.4.3 Drainage.......................................................................................................................................... 8
II. METHODOLOGY.......................................................................................................................................8
2.1 LAND USE AND LAND COVER DESCRIPTION.....................................................................................................8 2.1.1 Pre-field work................................................................................................................................ 8 2.1.2 Field work ...................................................................................................................................... 8 2.1.3 Post-field work .............................................................................................................................. 9
2.2 SOCIO-ECONOMICS .......................................................................................................................................9
PART I: .......................................................................................................................................................10
III. LAND USE AND LAND COVER CLASSIFICATION ..........................................................................11
3. 1 THE IDENTIFIED LAND UNITS ......................................................................................................................11 3. 2 DESCRIPTION OF THE LAND UNITS...............................................................................................................13
PART II .......................................................................................................................................................18
IV. SOCIO-ECONOMIC CHARACTERISTICS.............................................................................................19
4.1 DEMOGRAPHY ...........................................................................................................................................19 4.2 SOCIAL ORGANIZATION ..............................................................................................................................22
4.2.1 History .......................................................................................................................................... 22 4.2.2 Marriage ..................................................................................................................................... 22
Report on the land resources of Bonga, Boginda and Mankira areas
EWNHS ii
4.2.3 Ethnic composition.................................................................................................................... 23 4.2.4 Religion........................................................................................................................................ 24 4.2.5 Language ................................................................................................................................... 24 4.2.6 Social group ............................................................................................................................... 25
4.3 SOCIAL SERVICES .......................................................................................................................................25 4.3.1 Health .......................................................................................................................................... 25 4.3.2 Education ................................................................................................................................... 26 4.3.3 Communication ........................................................................................................................ 27
4.3.3.1 Transport network ...............................................................................................................................27 4.3.3.2 Telecommunication and Postal services.........................................................................................28
4.3.4 Settlements ................................................................................................................................. 29 4.3.5 Utilities .......................................................................................................................................... 30
4.3.5.1 Drinking water .....................................................................................................................................30 4.3.5.2 Energy ..................................................................................................................................................31
4.3.6 Tourism......................................................................................................................................... 31 4.4 INCOME AND EXPENDITURE..........................................................................................................................33
V. AGRICULTURE ........................................................................................................................................34
5.1 CROP ........................................................................................................................................................34 5.2 LIVESTOCK..................................................................................................................................................34 5.3 AGRICULTURAL SUPPORTING SERVICES .........................................................................................................35 5.4 AGRICULTURAL INVESTMENT ACTIVITIES .........................................................................................................35
VI. LAND TENURE........................................................................................................................................36
6.1 LAND TENURE – THE PAST AND PRESENT.........................................................................................................36 6.2 THE LANDLESS .............................................................................................................................................38 6.3 CONFLICT AND CONFLICT RESOLUTION ........................................................................................................39 6.3 FOREST TENURE ...........................................................................................................................................40
VII. INSTITUTIONS........................................................................................................................................44
7.1 ADMINISTRATIVE GOVERNMENT...................................................................................................................44 7.2 NON-GOVERNMENTAL ORGANIZATIONS .....................................................................................................45 7.3 COMMUNITY BASED INSTITUTIONS .................................................................................................................45 7.4 RESEARCH INSTITUTIONS...............................................................................................................................46
VIII. TRENDS AND RECOMMENDATIONS: .................................................................................................47
8.1 TRENDS ......................................................................................................................................................47
Report on the land resources of Bonga, Boginda and Mankira areas
EWNHS iii
8.2 RECOMMENDATIONS ..................................................................................................................................47
IX. REFERENCES: .........................................................................................................................................49
List of Tables
Table 1: The identified land cover types....................................................................................... 11
Table 2: Area (in ha) distribution of land cover types by woreda. ............................................... 12
Table 3: Population distribution by woreda.................................................................................. 19
Table 4: Active and dependent population by sex and woreda .................................................... 21
Table 5: Road distance from the capital Addis Ababa, passed towns, to and within the study area
(in km)........................................................................................................................................... 28
Table 6: Type of telephone services in towns of studied woredas ......... Fehler! Textmarke nicht
definiert.
Table 7: Population size and plan status of towns in the study area............................................. 30
Table 8: Total annual energy consumption by Bio-fuel type (in tons) ......................................... 31
Table 9: Summary of livestock population................................................................................... 34
Table 10: Livestock feed supply ................................................................................................... 35
Table 11: proportion of houses with land holding ........................................................................ 39
Table 12: Details of Forest User Groups developed by FARM-SOS........................................... 41
Table 13: Details of Forest User Groups developed by FAO and PPP ........................................ 42
List of Figures Figure 1. Mean Monthly Rainfall in mm........................................................................................ 5
Figure 2: Mean Monthly Minimum, Average and Maximum Temperature in oC......................... 5
Figure 3: Traditional agro-ecological zones ................................................................................... 6
Figure 4: Soil types of the study area.............................................................................................. 7
Figure 5: Percentage distribution of mapped units ....................................................................... 12
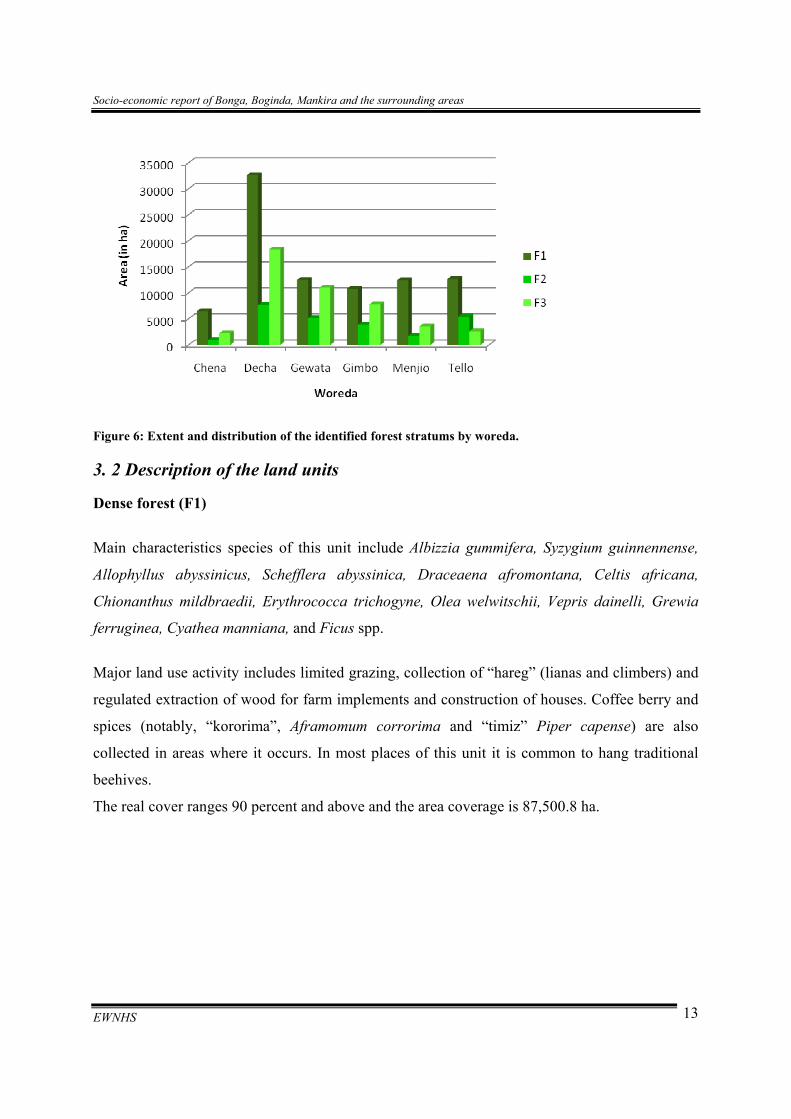
Figure 6: Extent and distribution of the identified forest stratums by woreda. ............................ 13
Figure 7: Age distribution of the studied woredas population...................................................... 20
Figure 8: Active and dependent population by woreda ................................................................ 22
Figure 9: Major ethnic groups found in the study area................................................................. 23
Figure 10: Number of people by major mother tongue in the study area ..................................... 25
Report on the land resources of Bonga, Boginda and Mankira areas
EWNHS iv
Figure 11: School age population and Enrollment ration in primary schools: Male .................... 26
Figure 12: School age population and enrollment ratio in primary schools: Females.................. 26
Figure 13: Changes in the land tenure between the three regimes ............................................... 38
List of Plates
Plate 1: Dense forest (Mankira area) ............................................................................................ 14
Plate 2: Hanging traditional beehives (extreme left-middle, yellowish) at Boginda forest.......... 15
Plate 3: Bamboo forest (foreground) and dense forest (background)........................................... 16
Plate 4: Charcoal prepared for sale on the road to Bonga............................................................. 43
Annexes
Annex 1: Field data collection format: Natural Vegetation.......................................................... 53
Annex 2: Field data collection format: Agricultural land............................................................. 54
Annex 3: List of some important tree and shrub species and their use......................................... 55
Annex 4: List of persons contacted............................................................................................... 57
Annex 5: Existing road map of Kaffa Zone.................................................................................. 59
Annex 6: Location of major towns in and around the study area ................................................. 60
Annex 7: Number of people by ethnic group by woredas ............................................................ 61
Annex 8: Number of people by mother tongue by woredas ......................................................... 62
Annex 9: List of Major investment activities in the studied woredas........................................... 63
Annex 10: List of small investment activites carried on in the studied woredas.......................... 67
Annex 11: List of ongoing and completed research works........................................................... 69
Annex 12: Some of the existing agricultural investment areas..................................................... 71
Report on the land resources of Bonga, Boginda and Mankira areas
EWNHS v
Acronyms and abbreviations used 0C degree centigrade
ARC Agricultural Research Center
BLT Branches, Leaves and Twigs
BoFED Bureau of Finance and Economic Development
CSA Central Statistical Authority
DoFED Department of Finance and Economic Development
DRMAS Digital Radio Multi-Access System
EDRI Ethiopian Development Research Institute
EEPFE Environmental Economics Policy Forum for Ethiopia
EfD Environment for Development
EIAR Ethiopian Institute of Agricultural Research
FAO Food and Agriculture Organization of the United Nations
FARM-Africa Food and Agricultural Research Management - Africa
FUG Forest User Group
GIS Geographical Information Systems
GTZ Deutsche Gesellschaft für Technische Zusammenarbeit (German Agency
for Technical Cooperation)
ha Hectare
HH household
HIV/AIDS Human immunodeficiency virus / Acquired Immunity Deficiency
Syndrome
IBC Institute of Biodiversity Conservation
JARC Jimma Agricultural Research Center
KAs Kebele Administrations
KFCU Kaffa Forest Coffee Farmers Cooperative Union
KZARD Kaffa Zone Agriculture and Rural Development Department
m.a.s.l meters above sea level
M.W. Micro Wave
mm millimeter
Socio-economic report of Bonga, Boginda, Mankira and the surrounding areas
EWNHS vii
MoA Ministry of Agriculture
n/a not available
NABU Nature and Biodiversity Conservation Union
NARS National Agricultural Research system
NERA Nera Telecommunication Ltd.
NGO Non-Governmental Organization
NMSA National Meteorological Service Agency
NTFP Non-Timber Forest Product
PFM Participatory Forest Management
PPP Public–Private Partnerships
RARIs Regional Agricultural Research Institutes
SCRP Soil Conservation Research Project
SNNPRS Southern Nations Nationalities and People Regional State
SOS-Sahel Save Our Souls - Sahel
sq.km. square kilometer
SRMA Southern Region Meteorological Agency
SUPAK Sustainable Poverty Alleviation in Kaffa
TLU Tropical Livestock Unit (250 kilograms live weight)
UA Units of Account
USAID United States Agency for International Development
VSAT Very small aperture terminal
WARDO Woreda Agriculture and Rural Development Office
WBISPP Woody Biomass Inventory and Strategic Planning Project
Socio-economic report of Bonga, Boginda, Mankira and the surrounding areas
EWNHS 1
Executive Summary As part of the data basis for the planning process of the proposed Coffee Biosphere Reserve in
Bonga Region, a land resource and socio-economic study was undertaken through the initiative
and financial support of PPP.
The study area includes Chena, Decha, Gimbo, Gewata, Menjiwo and Tello Woredas of Kaffa
Zone, SNNPRS and covers an area of 7,167.8 ha of land. Bonga, Boginda and Mankira forest
areas are included within the study area.
The land use and land cover assessment identifies thirteen land cover types, and of these, five are
of natural vegetation whilst the remaining eight had an anthropogenic characteristic.
Land use activities in the natural vegetation areas are for various purposes ranging from NTFP
collection to regulated extraction of wood for farm implements and construction of houses. Part
one of the report gives details of the land resource assessment.
The population of the study area is about 657,780, and is growing at a rate of 2.9% per annum.
Of these, 91.68 % reside in rural areas and 8.42 % in urban areas. The majority of the population
in the study area are found in the age group of 15 to 64 years, constituting 52.08% followed by
age group 0-14 making up 45.19% of the total population.Gross enrollment ratio for both sexes
is about 85%, and the student enrollment ratio is 40% females and 60% males.
Percentile potential health coverage of the zone in 2005 was 57.24 percent, whilst the percentage
coverage of family planning service in the zone is about 50 percent in the year 2006.
Major source of livelihood in the study area are agricultural production, which is rain-fed and
traditional, livestock rearing and the collection of NTFP, where such is available.
Severely marginalized groups are the Manjiwo’s and Mano’s who mainly subsisted on hunting
and tannery, respectively. The number of Manjiwo households living in pockets among the
farmer Kafecho is very small and occupy marginal lands considered to be the habitat of wild
Socio-economic report of Bonga, Boginda, Mankira and the surrounding areas
EWNHS 2
animals that destroy crops. These groups will not intermarry nor eat together with farmer
Kafecho.
Investment activities were increasing in the study area from year to year. Between the years 1998
to 2006, an average of 5 investment activities per year were granted permission, while in
2006/07 the figure rise to about 30. Overall, over the past 10 years an estimated number of 75
investment projects were granted permission to work in agricultural investment activities, most
of which are located in the identified forest areas.
FARM-Africa, FAO and PPP with the support of SNNPRS had established 14, 2 and 3 PFM
cooperatives respectively found in the forest and mixed (agriculture) lands of the study areas.
Chapter four through eleven of Part two of this report give details of the socio-economic
assessment.
The study area has a high potential and many opportunities for establishing and development of a
biosphere reserve, nevertheless, there is a need to put in place a proper coordination and
collaboration at institutional level and formulation of appropriate incentive mechanism at
community level.
Socio-economic report of Bonga, Boginda, Mankira and the surrounding areas
EWNHS 3
I. Introduction
1.1 Background
Kaffa is located in the south western part of Ethiopia in between 60 24’ to 7070’ N and 350 69’ to
36078’ E, some 460 km south west of Addis Abeba. Administratively the zone is found under the
SNNPRS and is divided into 10 woredas. The total land area of the zone is 10,602.7 sq.km. Six
woredas, namely Chena, Decha, Gimbo, Gewata, Menjiwo and Tello are encompassed in the
study area.
The project was realized through the initiative and financial support of PPP on the establishment
of a Coffee Biosphere Reserve in Bonga Region. This report is, therefore, part of the data basis
for the planning process for the proposed Coffee Biosphere Reserve in Bonga Region.
Chapter one of this report discusses the background and objective of the study and chapter two
the methodology used. The rest of the report is divided into two parts, in which part one (chapter
3) deals with the description of the land use and land cover classification and part two discuss
the socio economic set up. In part two, chapter four discuss the socio-demographic
characteristics, chapter five the agriculture, chapter six the land tenure, chapter seven institutions,
chapter eight trends and recommendations and finally chapter nine lists the references.
1.2 Objective
The Major objective of this study was to carry out detail assessment of the land use and socio-
economic features around Bonga, Boginda and Mankira forests and surrounding areas as to
provide the data basis for the planning process for the proposed Coffee Biosphere Reserve in
Bonga Region.
Within this frame work the specific objectives were:
- to identify the existing land cover types and land use practices in the study area.
- to assess and compile all relevant information on:
Socio-economic report of Bonga, Boginda, Mankira and the surrounding areas
EWNHS 4
o the general characteristics, description including topography, rainfall agro-
climatic zone, geology, etc. of the study area;
o demographic information, including various ethnic groups, indigenous groups
and immigrants, magnitude and reasons of conflicts among the ethnic groups if
any, main human impact on conservation of natural resources and related
management practices, etc
o related to existing land use practices, land cover types and major economic
activities,
- to identify and document prevailing and potential main conflicts between investment
activities and the surrounding communities, if there is any;
- to assess and compile information on the structure of governance prevailing in the area
and a description of mandate institutions responsible for running of government, civil
society and private sector activities;
- to provide a detailed information on the land use history, land use regulations at present
and current and potential conflicts stemming from the land tenure system in place at the
moment in the investigation area.
1.3 Data Sources
Primary data: Primary data were collected through data gathering formats, questionnaires
administered at household level and discussions with key informants and focus groups.
Secondary data: The report used CSA data for most of the demographic information. Data from
different SNNP Regional Bureaus (in statistical abstracts, KZAFEDD, 2005) were analyzed as to
describe the resources of the area. Further more, published and unpublished findings of different
federal, regional, zonal and woreda offices, NGO’s and as well different research works were
also used as appropriate.
1.4 The physical environment
1.4.1 Climate
Rainfall:
Socio-economic report of Bonga, Boginda, Mankira and the surrounding areas
EWNHS 5
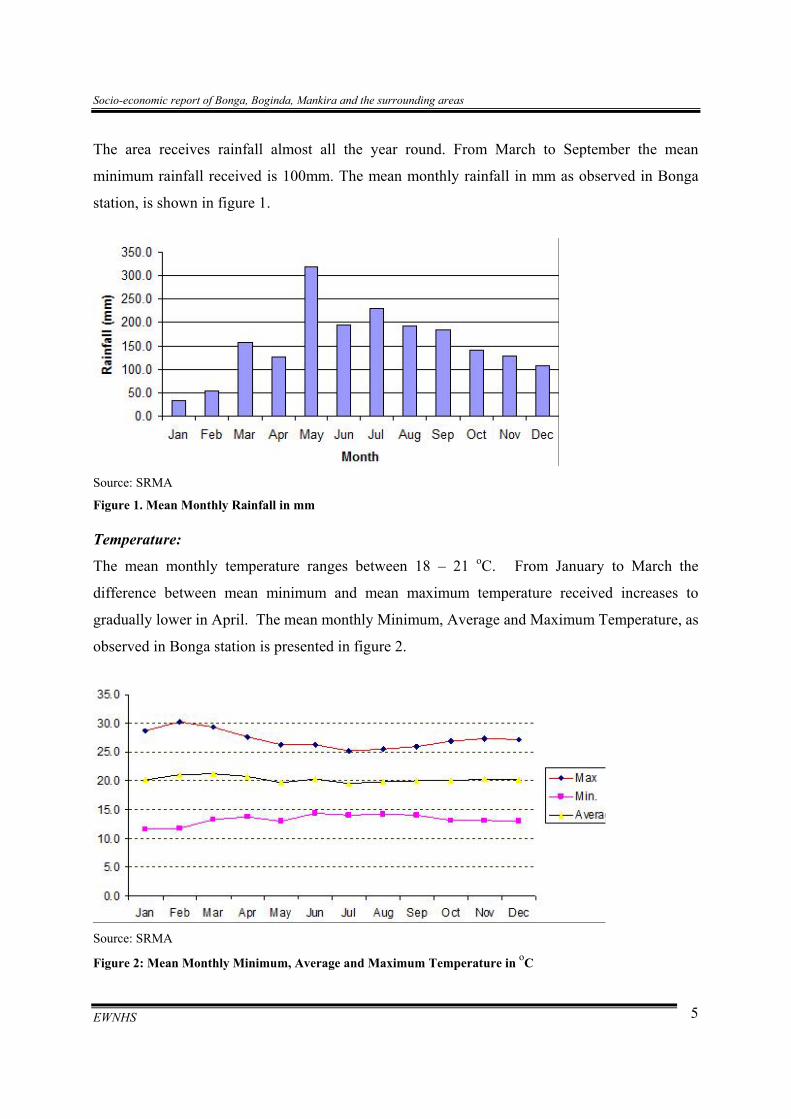
The area receives rainfall almost all the year round. From March to September the mean
minimum rainfall received is 100mm. The mean monthly rainfall in mm as observed in Bonga
station, is shown in figure 1.
Source: SRMA
Figure 1. Mean Monthly Rainfall in mm
Temperature:
The mean monthly temperature ranges between 18 – 21 oC. From January to March the
difference between mean minimum and mean maximum temperature received increases to
gradually lower in April. The mean monthly Minimum, Average and Maximum Temperature, as
observed in Bonga station is presented in figure 2.
Source: SRMA
Figure 2: Mean Monthly Minimum, Average and Maximum Temperature in oC
Socio-economic report of Bonga, Boginda, Mankira and the surrounding areas
EWNHS 6
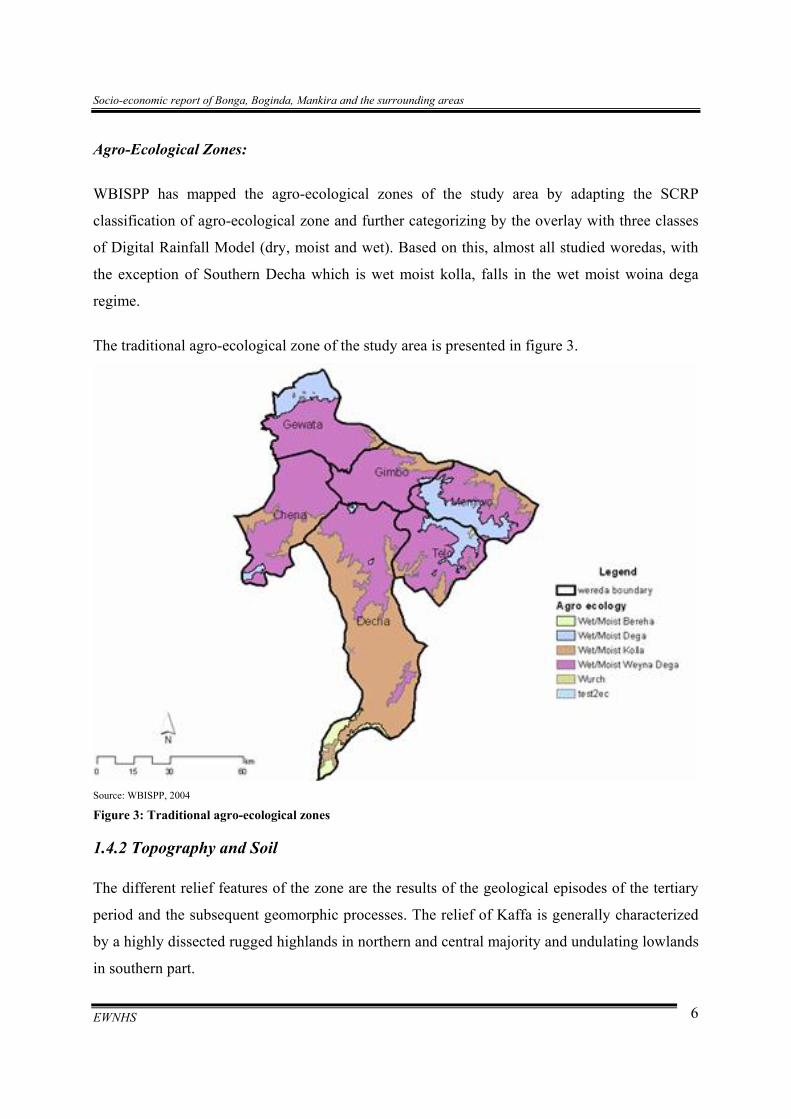
Agro-Ecological Zones:
WBISPP has mapped the agro-ecological zones of the study area by adapting the SCRP
classification of agro-ecological zone and further categorizing by the overlay with three classes
of Digital Rainfall Model (dry, moist and wet). Based on this, almost all studied woredas, with
the exception of Southern Decha which is wet moist kolla, falls in the wet moist woina dega
regime.
The traditional agro-ecological zone of the study area is presented in figure 3.
Source: WBISPP, 2004
Figure 3: Traditional agro-ecological zones
1.4.2 Topography and Soil
The different relief features of the zone are the results of the geological episodes of the tertiary
period and the subsequent geomorphic processes. The relief of Kaffa is generally characterized
by a highly dissected rugged highlands in northern and central majority and undulating lowlands
in southern part.
Socio-economic report of Bonga, Boginda, Mankira and the surrounding areas
EWNHS 7
In the zone, altitude generally varies from less than 500 m.a.s.l. in the undulating plains of the
south such as in Decha woreda (lowest 500 m.a.s.l. near Omo river) and to about 3000 m.a.s.l. in
the highlands of Menjiwo and Tello woredas (peak 3348 m.a.s.l. at mount Shetra).
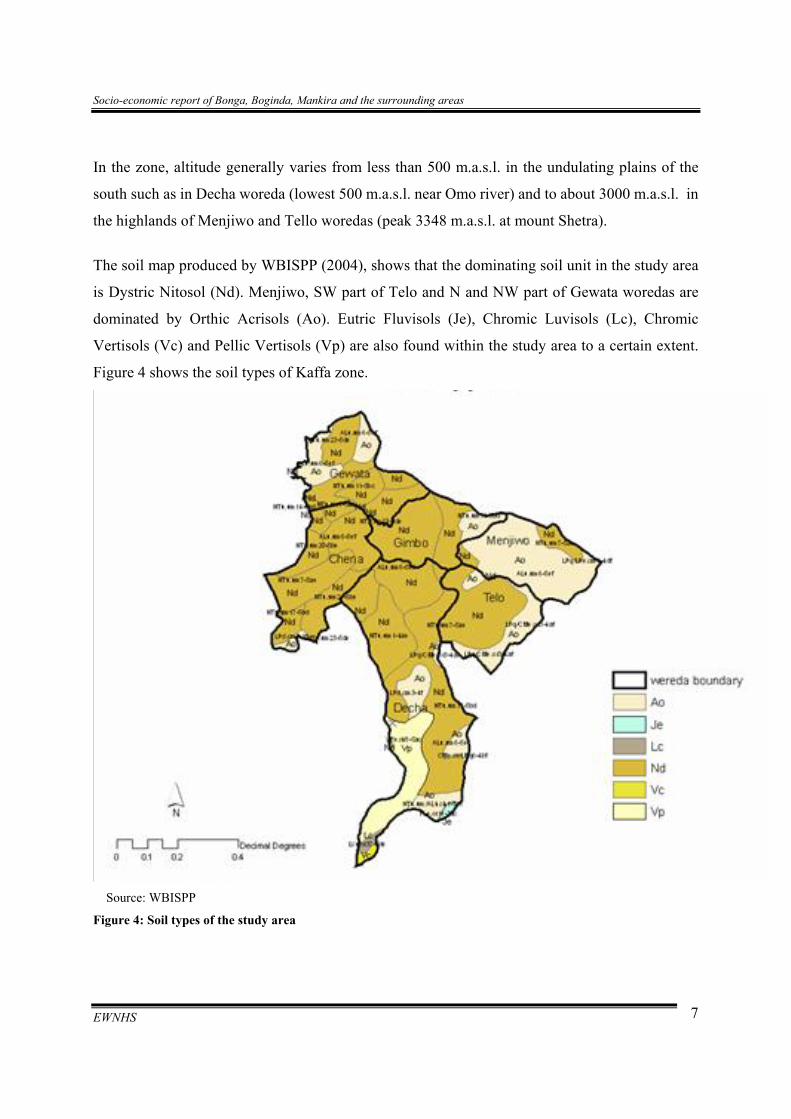
The soil map produced by WBISPP (2004), shows that the dominating soil unit in the study area
is Dystric Nitosol (Nd). Menjiwo, SW part of Telo and N and NW part of Gewata woredas are
dominated by Orthic Acrisols (Ao). Eutric Fluvisols (Je), Chromic Luvisols (Lc), Chromic
Vertisols (Vc) and Pellic Vertisols (Vp) are also found within the study area to a certain extent.
Figure 4 shows the soil types of Kaffa zone.
Source: WBISPP
Figure 4: Soil types of the study area
Socio-economic report of Bonga, Boginda, Mankira and the surrounding areas
EWNHS 8
1.4.3 Drainage
Kaffa is endowed with rivers. One of these major rivers is Gojeb and flows from the North
toward the North-eastern part of the zone to join Gibe river and form the Omo River. There are
also other rivers such as Woshi, Baro and Beko that flows toward Omo and Gilo Rivers.
II. METHODOLOGY
2.1 Land use and land cover description
2.1.1 Pre-field work
Available published land use/cover studies of the study area had been examined prior to
embarking on the field activity. Moreover, a relevé data sheet was also developed at this stage
for collection of data on the land use/cover type.
2.1.2 Field work
Based on the unsupervised classification map produced by the GIS expert, (for methodology and
materials used in image interpretation, please see the GIS report) a reconnaissance survey was
conducted in the proposed study area and a preliminary land use land cover legend was
developed.
Using a relevé sheet, data on percentage composition of the existing cover types, land use
pattern, degree of disturbance, and other related information (please see annex 1) on the natural
vegetation was recorded by field observation. Further more, the species composition and
abundance within a quadrant of 40 * 40 meters were also recorded on randomly located sampling
points. During the period of the field work a total of 24 relevés were filled.
Within the cultivated land units, percentage composition of existing tree, shrub and herbaceous
layers, as to determine the intensity of cultivation and other relevant information related with the
unit were registered by direct observation. Moreover, information on the crop types grown in the
unit was also collected by interviewing farmers. See Annex 2 for agricultural land data gathering
form. Furthermore, all identified units were discussed on the spot with the GIS expert.
Socio-economic report of Bonga, Boginda, Mankira and the surrounding areas
EWNHS 9
2.1.3 Post-field work
All the collected data were collated and analyzed. Based on this, the preliminary mapping units
were modified and a final land unit was produced.
2.2 Socio-Economics
To collect the needed information as set by the objective, the following methods were used:
- Questionnaires (having both open and close ended questions) were administered at
household level,
- Formal and informal discussions with inhabitants, concerned governmental, non-
governmental and community based organizations, private sector and research
institutions and researchers,
- Focus group discussions
- Field observations and
- Compiling of published and unpublished socio-economic data from different sources.
Thirty-two households from 14 kebeles, were randomly selected for a structured interview.
Focus group discussion was also held in selected four kebeles using basic socio-economic
variables such as age, sex and wealth rank nominated through consultation with concerned
Development Agents and Kebele Administration cabinet members. Quantitative data from the
structured interviews were analyzed using descriptive statistics.
A check list was developed and used as a guide for interviews with key informants to ensure key
issues and questions were addressed during discussions. List of persons contacted are listed in
Annex 4.
Socio-economic report of Bonga, Boginda, Mankira and the surrounding areas
EWNHS 10
PART I:
LAND USE / COVER CLASSIFICATION DESCRIPTION
Socio-economic report of Bonga, Boginda, Mankira and the surrounding areas
EWNHS 11
III. Land use and land cover classification
3. 1 The identified land units
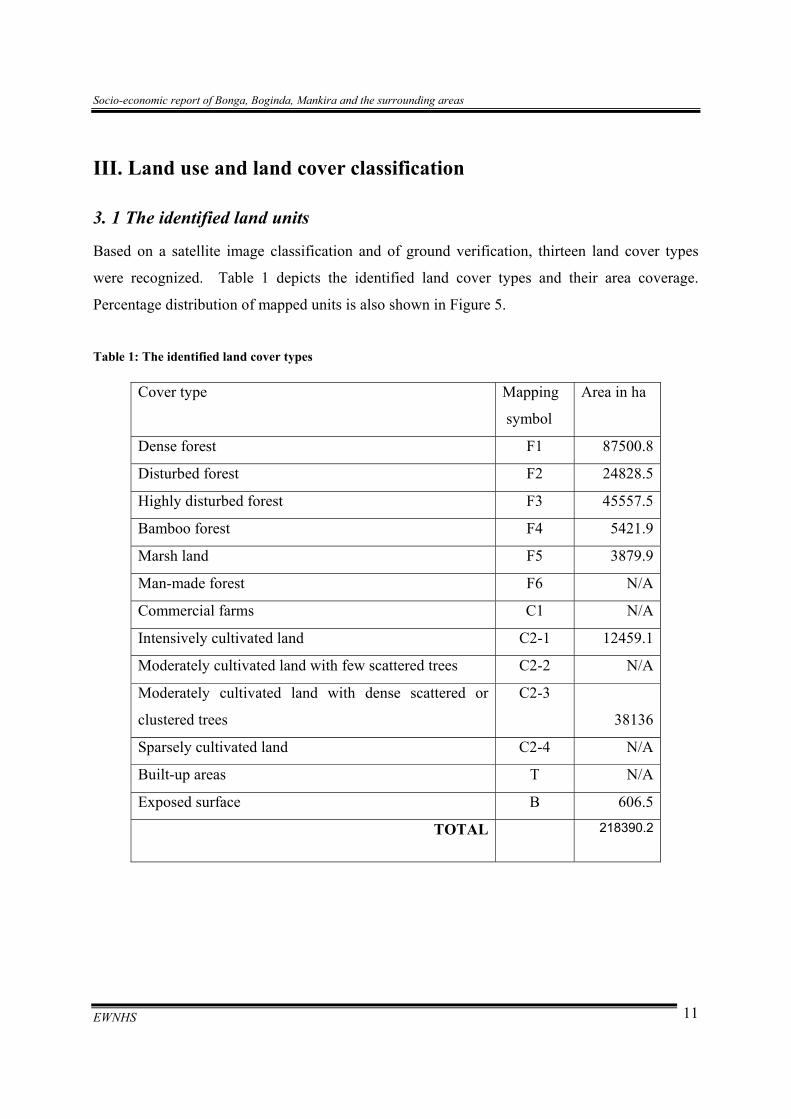
Based on a satellite image classification and of ground verification, thirteen land cover types
were recognized. Table 1 depicts the identified land cover types and their area coverage.
Percentage distribution of mapped units is also shown in Figure 5.
Table 1: The identified land cover types
Cover type Mapping
symbol
Area in ha
Dense forest F1 87500.8
Disturbed forest F2 24828.5
Highly disturbed forest F3 45557.5
Bamboo forest F4 5421.9
Marsh land F5 3879.9
Man-made forest F6 N/A
Commercial farms C1 N/A
Intensively cultivated land C2-1 12459.1
Moderately cultivated land with few scattered trees C2-2 N/A
Moderately cultivated land with dense scattered or
clustered trees
C2-3
38136
Sparsely cultivated land C2-4 N/A
Built-up areas T N/A
Exposed surface B 606.5
TOTAL 218390.2
Socio-economic report of Bonga, Boginda, Mankira and the surrounding areas
EWNHS 12
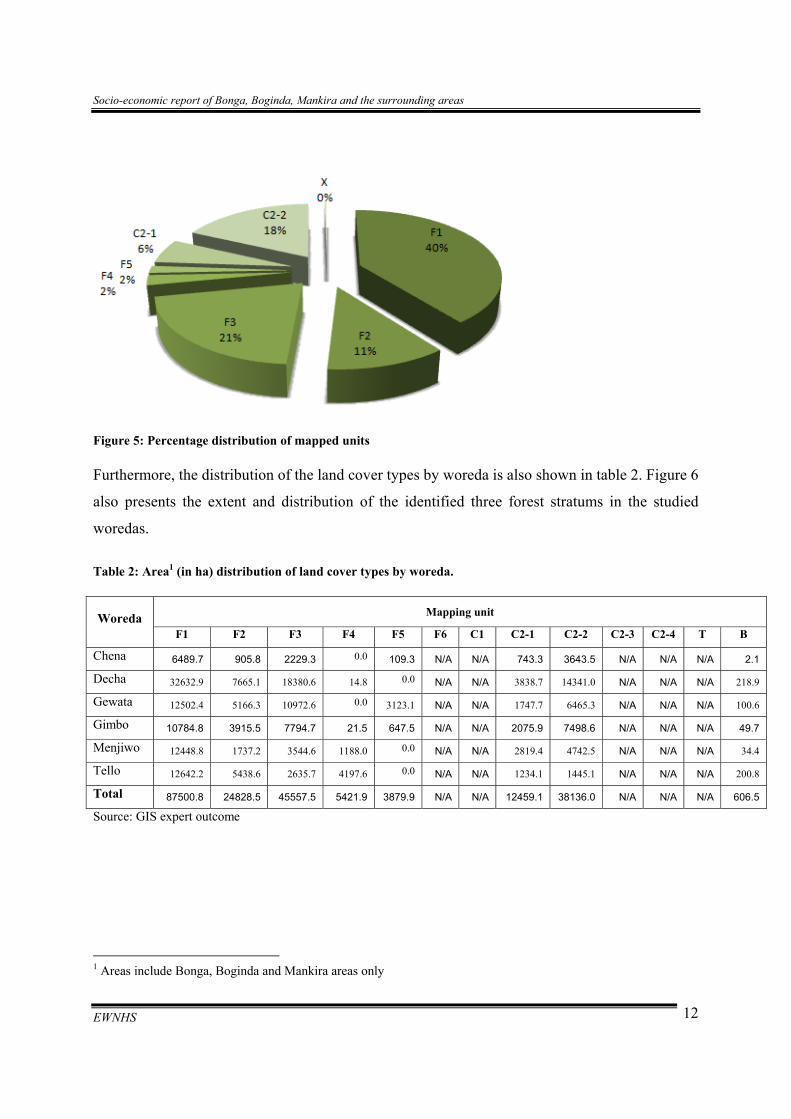
Figure 5: Percentage distribution of mapped units
Furthermore, the distribution of the land cover types by woreda is also shown in table 2. Figure 6
also presents the extent and distribution of the identified three forest stratums in the studied
woredas.
Table 2: Area1 (in ha) distribution of land cover types by woreda.
Mapping unit Woreda F1 F2 F3 F4 F5 F6 C1 C2-1 C2-2 C2-3 C2-4 T B
Chena 6489.7 905.8 2229.3 0.0 109.3 N/A N/A 743.3 3643.5 N/A N/A N/A 2.1
Decha 32632.9 7665.1 18380.6 14.8 0.0 N/A N/A 3838.7 14341.0 N/A N/A N/A 218.9
Gewata 12502.4 5166.3 10972.6 0.0 3123.1 N/A N/A 1747.7 6465.3 N/A N/A N/A 100.6
Gimbo 10784.8 3915.5 7794.7 21.5 647.5 N/A N/A 2075.9 7498.6 N/A N/A N/A 49.7
Menjiwo 12448.8 1737.2 3544.6 1188.0 0.0 N/A N/A 2819.4 4742.5 N/A N/A N/A 34.4
Tello 12642.2 5438.6 2635.7 4197.6 0.0 N/A N/A 1234.1 1445.1 N/A N/A N/A 200.8
Total 87500.8 24828.5 45557.5 5421.9 3879.9 N/A N/A 12459.1 38136.0 N/A N/A N/A 606.5
Source: GIS expert outcome
1 Areas include Bonga, Boginda and Mankira areas only
Socio-economic report of Bonga, Boginda, Mankira and the surrounding areas
EWNHS 13
Figure 6: Extent and distribution of the identified forest stratums by woreda.
3. 2 Description of the land units
Dense forest (F1)
Main characteristics species of this unit include Albizzia gummifera, Syzygium guinnennense,
Allophyllus abyssinicus, Schefflera abyssinica, Draceaena afromontana, Celtis africana,
Chionanthus mildbraedii, Erythrococca trichogyne, Olea welwitschii, Vepris dainelli, Grewia
ferruginea, Cyathea manniana, and Ficus spp.
Major land use activity includes limited grazing, collection of “hareg” (lianas and climbers) and
regulated extraction of wood for farm implements and construction of houses. Coffee berry and
spices (notably, “kororima”, Aframomum corrorima and “timiz” Piper capense) are also
collected in areas where it occurs. In most places of this unit it is common to hang traditional
beehives.
The real cover ranges 90 percent and above and the area coverage is 87,500.8 ha.
Socio-economic report of Bonga, Boginda, Mankira and the surrounding areas
EWNHS 14
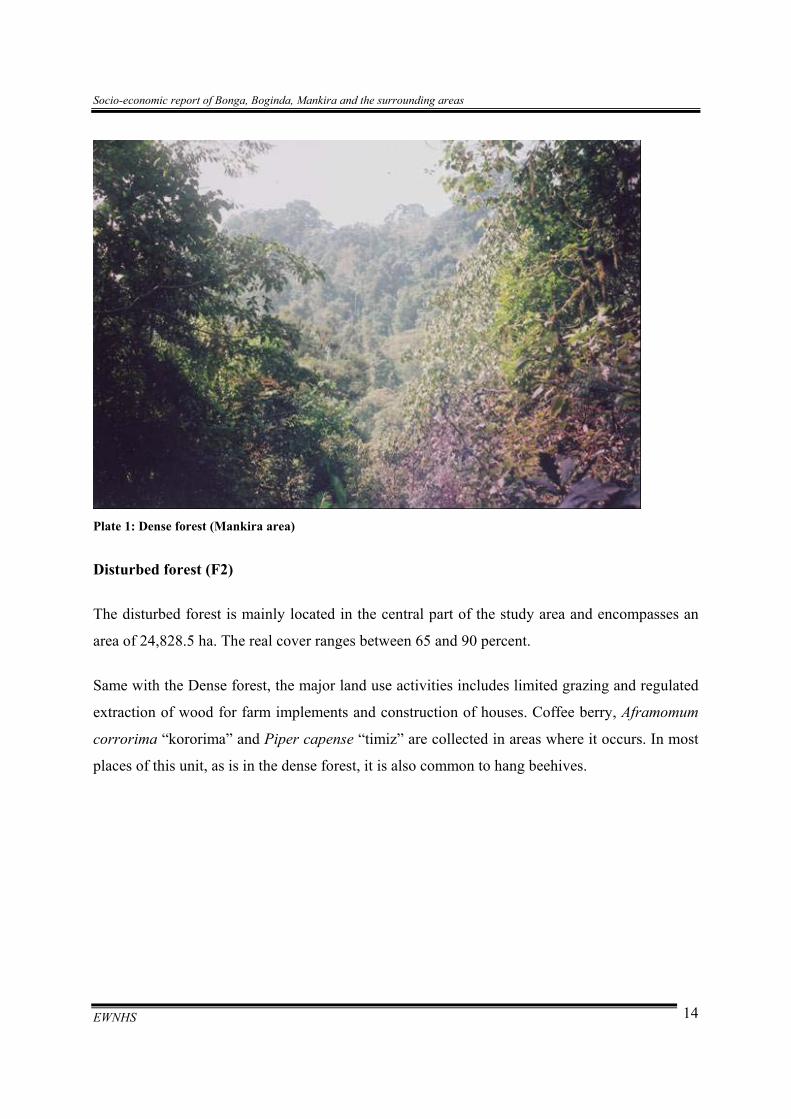
Plate 1: Dense forest (Mankira area)
Disturbed forest (F2)
The disturbed forest is mainly located in the central part of the study area and encompasses an
area of 24,828.5 ha. The real cover ranges between 65 and 90 percent.
Same with the Dense forest, the major land use activities includes limited grazing and regulated
extraction of wood for farm implements and construction of houses. Coffee berry, Aframomum
corrorima “kororima” and Piper capense “timiz” are collected in areas where it occurs. In most
places of this unit, as is in the dense forest, it is also common to hang beehives.
Socio-economic report of Bonga, Boginda, Mankira and the surrounding areas
EWNHS 15
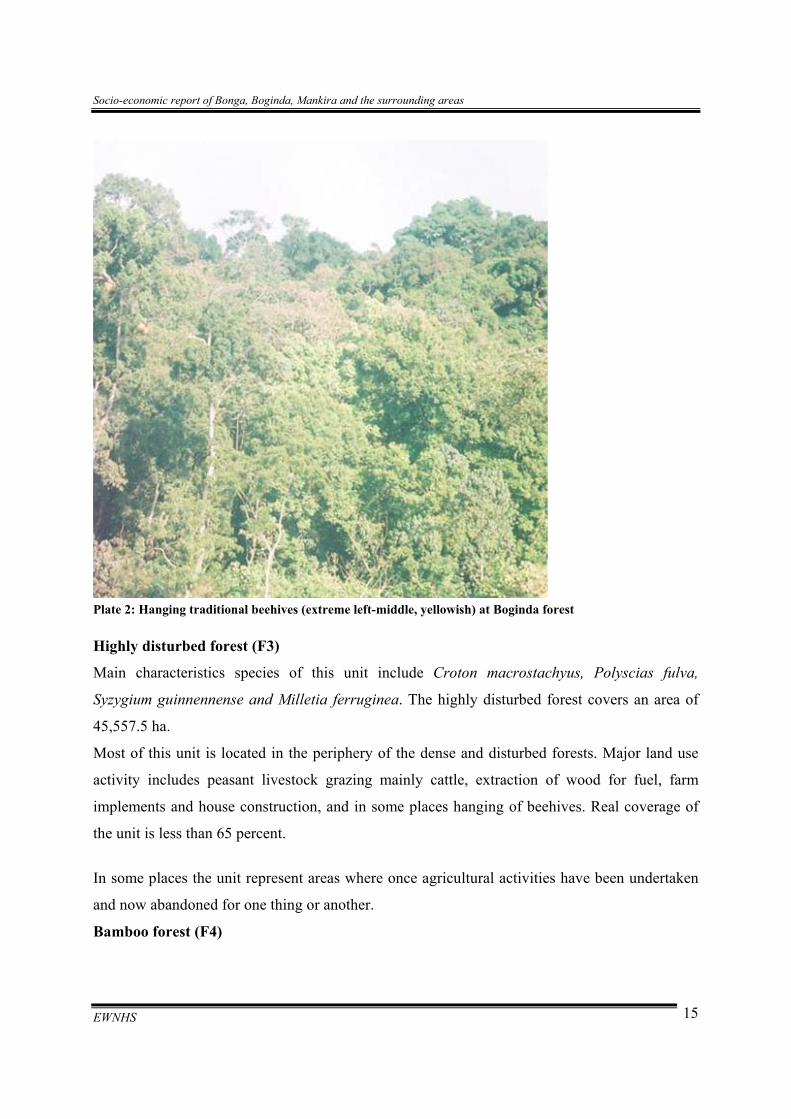
Plate 2: Hanging traditional beehives (extreme left-middle, yellowish) at Boginda forest
Highly disturbed forest (F3)
Main characteristics species of this unit include Croton macrostachyus, Polyscias fulva,
Syzygium guinnennense and Milletia ferruginea. The highly disturbed forest covers an area of
45,557.5 ha.
Most of this unit is located in the periphery of the dense and disturbed forests. Major land use
activity includes peasant livestock grazing mainly cattle, extraction of wood for fuel, farm
implements and house construction, and in some places hanging of beehives. Real coverage of
the unit is less than 65 percent.
In some places the unit represent areas where once agricultural activities have been undertaken
and now abandoned for one thing or another.
Bamboo forest (F4)
Socio-economic report of Bonga, Boginda, Mankira and the surrounding areas
EWNHS 16
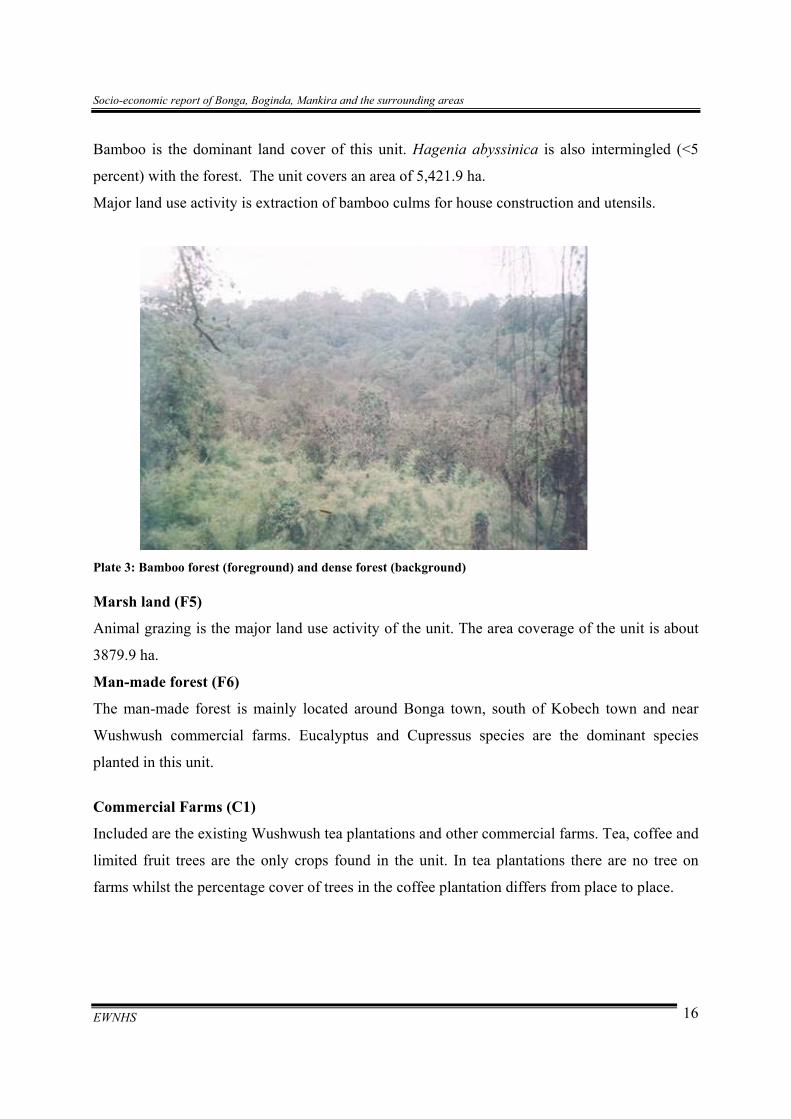
Bamboo is the dominant land cover of this unit. Hagenia abyssinica is also intermingled (<5
percent) with the forest. The unit covers an area of 5,421.9 ha.
Major land use activity is extraction of bamboo culms for house construction and utensils.
Plate 3: Bamboo forest (foreground) and dense forest (background)
Marsh land (F5)
Animal grazing is the major land use activity of the unit. The area coverage of the unit is about
3879.9 ha.
Man-made forest (F6)
The man-made forest is mainly located around Bonga town, south of Kobech town and near
Wushwush commercial farms. Eucalyptus and Cupressus species are the dominant species
planted in this unit.
Commercial Farms (C1)
Included are the existing Wushwush tea plantations and other commercial farms. Tea, coffee and
limited fruit trees are the only crops found in the unit. In tea plantations there are no tree on
farms whilst the percentage cover of trees in the coffee plantation differs from place to place.
Socio-economic report of Bonga, Boginda, Mankira and the surrounding areas
EWNHS 17
Intensively cultivated land (C2-1)
Major land use activity of this unit is the cultivation of crops. The percentage cover of trees and
shrubs is less than 5 percent each and grasses up to 10 percent. 80 percent or more of the unit, on
the other hand, is under cultivation. This unit covers an area of 12,459.1 ha.
Moderately cultivated land with few scattered trees (C2-2)
The unit is characterized by a moderate cultivated land with few scattered trees. Percent area
coverage of trees is less than 10 percent; shrub ranges from 5 to 8 percent and grassland 12 to 20
percent. The latter is mostly located at valley bottoms and side slopes. Cultivated land coverage
ranges between 65 to 79 percent.
Moderately cultivated land with dense scattered or clustered trees (C2-3)
The total area coverage of this unit is 38,136 ha. and is characterized by a moderately cultivated
land with dense trees which are found either scattered or clustered. Tree covers 15 – 25 percent,
shrub less than 5 percent and grasses 8-15 percent. Cultivation unit ranges between 55 to 73
percent.
Sparsely cultivated land (C2-4)
The unit is mostly located along the boundary of the forest areas. The percentage cover of trees is
greater than 20 percent and that of shrubs and grasses between 10 and 15 percent each.
Cultivated land coverage is less than 55 percent.
Built-up areas (T)
As the interpreted areas focus on NFPA’s, no built up areas are shown on the current map.
Exposed surface (B)
Areas devoid of or with very low vegetation cover are included in this unit and have an area of
606.8 ha.
Socio-economic report of Bonga, Boginda, Mankira and the surrounding areas
EWNHS 18
PART II
SOCIO–ECONOMICS
Socio-economic report of Bonga, Boginda, Mankira and the surrounding areas
EWNHS 19
IV. SOCIO-ECONOMIC CHARACTERISTICS
4.1 Demography
Population
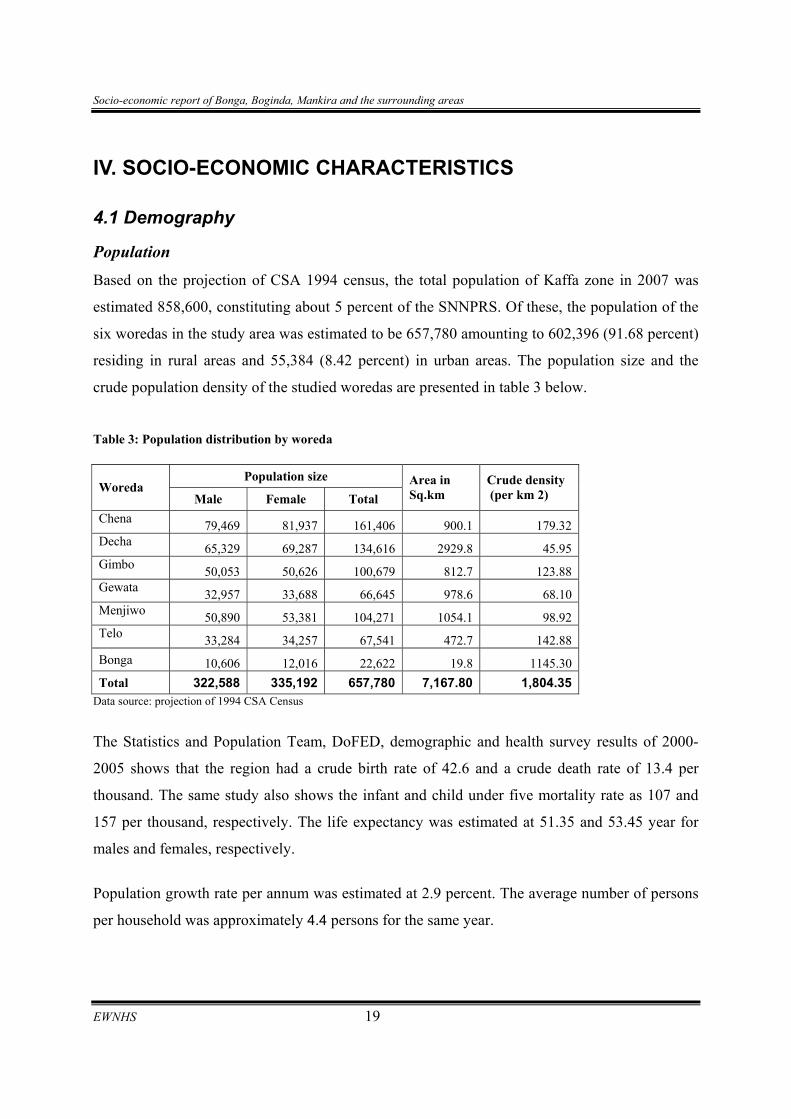
Based on the projection of CSA 1994 census, the total population of Kaffa zone in 2007 was
estimated 858,600, constituting about 5 percent of the SNNPRS. Of these, the population of the
six woredas in the study area was estimated to be 657,780 amounting to 602,396 (91.68 percent)
residing in rural areas and 55,384 (8.42 percent) in urban areas. The population size and the
crude population density of the studied woredas are presented in table 3 below.
Table 3: Population distribution by woreda
Population size Woreda
Male Female Total Area in Sq.km
Crude density (per km 2)
Chena 79,469 81,937 161,406 900.1 179.32 Decha 65,329 69,287 134,616 2929.8 45.95 Gimbo 50,053 50,626 100,679 812.7 123.88 Gewata 32,957 33,688 66,645 978.6 68.10 Menjiwo 50,890 53,381 104,271 1054.1 98.92 Telo 33,284 34,257 67,541 472.7 142.88 Bonga 10,606 12,016 22,622 19.8 1145.30 Total 322,588 335,192 657,780 7,167.80 1,804.35
Data source: projection of 1994 CSA Census
The Statistics and Population Team, DoFED, demographic and health survey results of 2000-
2005 shows that the region had a crude birth rate of 42.6 and a crude death rate of 13.4 per
thousand. The same study also shows the infant and child under five mortality rate as 107 and
157 per thousand, respectively. The life expectancy was estimated at 51.35 and 53.45 year for
males and females, respectively.
Population growth rate per annum was estimated at 2.9 percent. The average number of persons
per household was approximately 4.4 persons for the same year.
Socio-economic report of Bonga, Boginda, Mankira and the surrounding areas
EWNHS 20
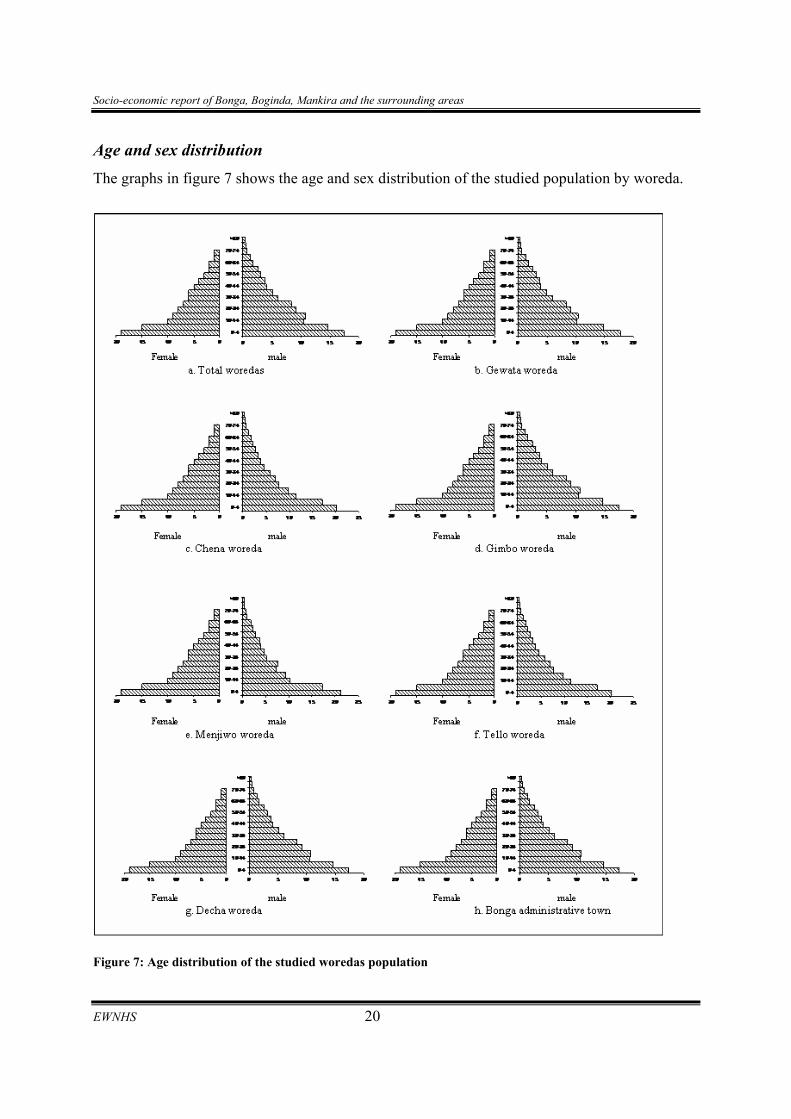
Age and sex distribution
The graphs in figure 7 shows the age and sex distribution of the studied population by woreda.
Figure 7: Age distribution of the studied woredas population
Socio-economic report of Bonga, Boginda, Mankira and the surrounding areas
EWNHS 21
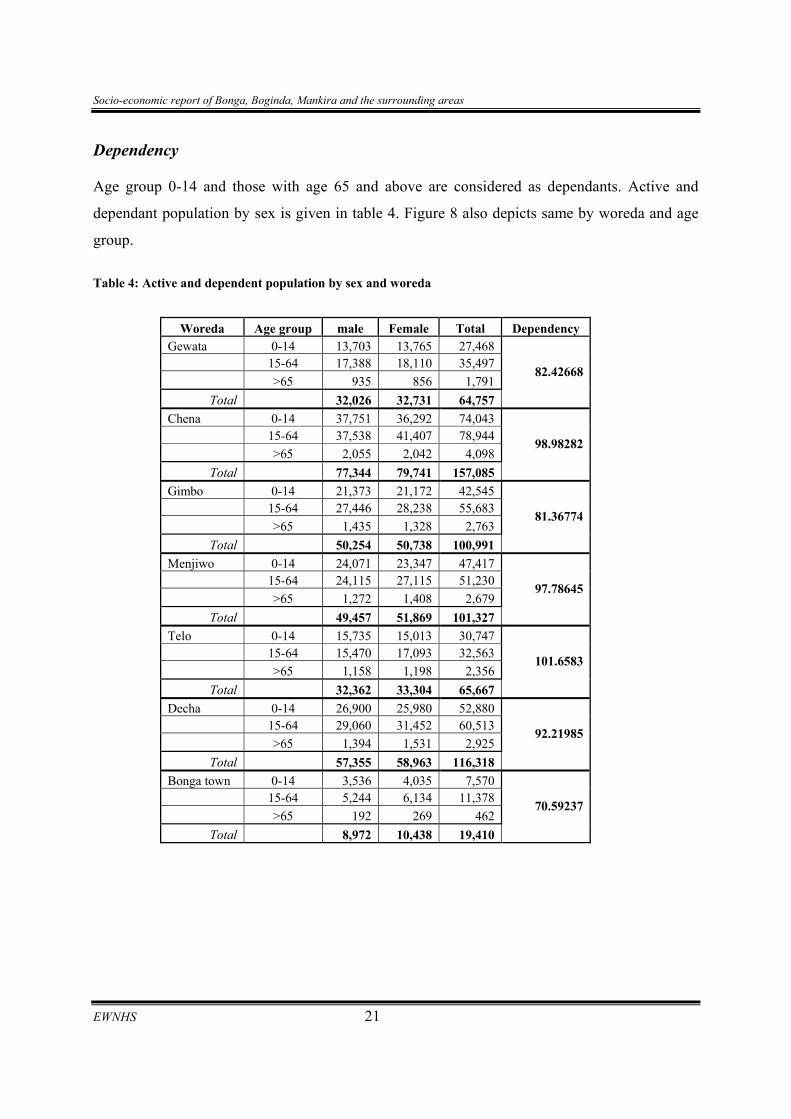
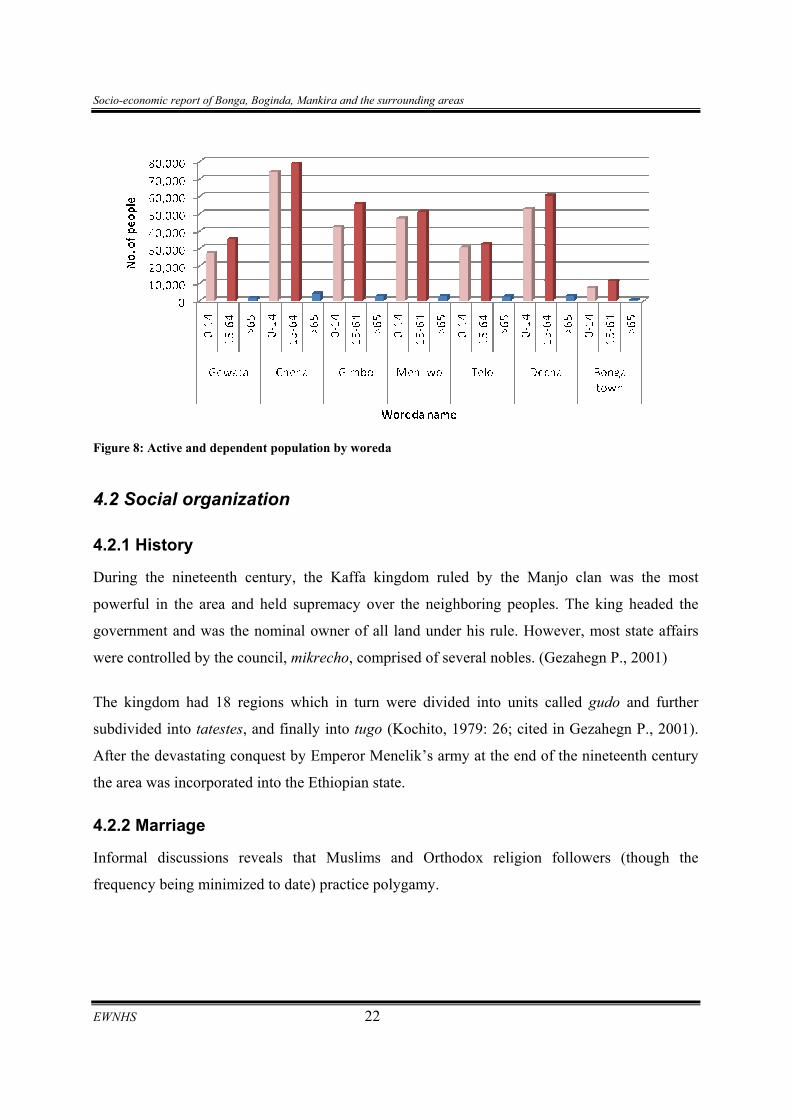
Dependency
Age group 0-14 and those with age 65 and above are considered as dependants. Active and
dependant population by sex is given in table 4. Figure 8 also depicts same by woreda and age
group.
Table 4: Active and dependent population by sex and woreda
Woreda Age group male Female Total Dependency Gewata 0-14 13,703 13,765 27,468 15-64 17,388 18,110 35,497 >65 935 856 1,791
Total 32,026 32,731 64,757
82.42668
Chena 0-14 37,751 36,292 74,043 15-64 37,538 41,407 78,944 >65 2,055 2,042 4,098
Total 77,344 79,741 157,085
98.98282
Gimbo 0-14 21,373 21,172 42,545 15-64 27,446 28,238 55,683 >65 1,435 1,328 2,763
Total 50,254 50,738 100,991
81.36774
Menjiwo 0-14 24,071 23,347 47,417 15-64 24,115 27,115 51,230 >65 1,272 1,408 2,679
Total 49,457 51,869 101,327
97.78645
Telo 0-14 15,735 15,013 30,747 15-64 15,470 17,093 32,563 >65 1,158 1,198 2,356
Total 32,362 33,304 65,667
101.6583
Decha 0-14 26,900 25,980 52,880 15-64 29,060 31,452 60,513 >65 1,394 1,531 2,925
Total 57,355 58,963 116,318
92.21985
Bonga town 0-14 3,536 4,035 7,570 15-64 5,244 6,134 11,378 >65 192 269 462
Total 8,972 10,438 19,410
70.59237
Socio-economic report of Bonga, Boginda, Mankira and the surrounding areas
EWNHS 22
Figure 8: Active and dependent population by woreda
4.2 Social organization
4.2.1 History
During the nineteenth century, the Kaffa kingdom ruled by the Manjo clan was the most
powerful in the area and held supremacy over the neighboring peoples. The king headed the
government and was the nominal owner of all land under his rule. However, most state affairs
were controlled by the council, mikrecho, comprised of several nobles. (Gezahegn P., 2001)
The kingdom had 18 regions which in turn were divided into units called gudo and further
subdivided into tatestes, and finally into tugo (Kochito, 1979: 26; cited in Gezahegn P., 2001).
After the devastating conquest by Emperor Menelik’s army at the end of the nineteenth century
the area was incorporated into the Ethiopian state.
4.2.2 Marriage
Informal discussions reveals that Muslims and Orthodox religion followers (though the
frequency being minimized to date) practice polygamy.
Socio-economic report of Bonga, Boginda, Mankira and the surrounding areas
EWNHS 23
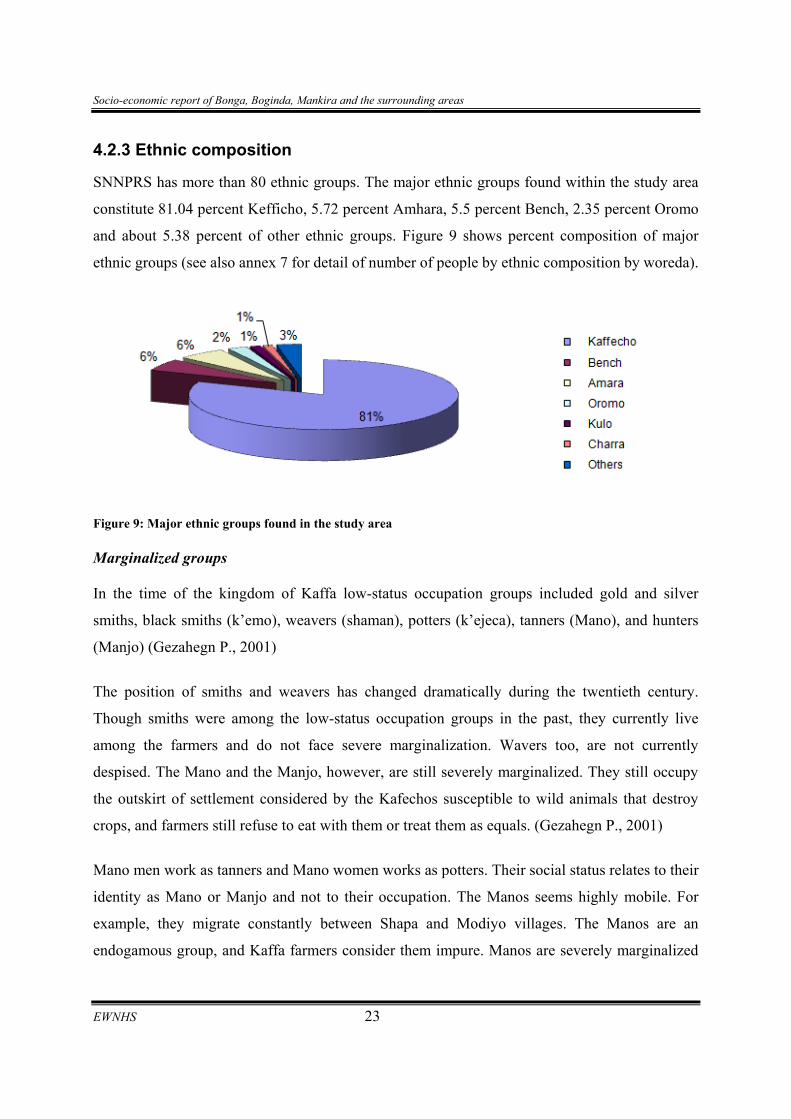
4.2.3 Ethnic composition
SNNPRS has more than 80 ethnic groups. The major ethnic groups found within the study area
constitute 81.04 percent Kefficho, 5.72 percent Amhara, 5.5 percent Bench, 2.35 percent Oromo
and about 5.38 percent of other ethnic groups. Figure 9 shows percent composition of major
ethnic groups (see also annex 7 for detail of number of people by ethnic composition by woreda).
Figure 9: Major ethnic groups found in the study area
Marginalized groups
In the time of the kingdom of Kaffa low-status occupation groups included gold and silver
smiths, black smiths (k’emo), weavers (shaman), potters (k’ejeca), tanners (Mano), and hunters
(Manjo) (Gezahegn P., 2001)
The position of smiths and weavers has changed dramatically during the twentieth century.
Though smiths were among the low-status occupation groups in the past, they currently live
among the farmers and do not face severe marginalization. Wavers too, are not currently
despised. The Mano and the Manjo, however, are still severely marginalized. They still occupy
the outskirt of settlement considered by the Kafechos susceptible to wild animals that destroy
crops, and farmers still refuse to eat with them or treat them as equals. (Gezahegn P., 2001)
Mano men work as tanners and Mano women works as potters. Their social status relates to their
identity as Mano or Manjo and not to their occupation. The Manos seems highly mobile. For
example, they migrate constantly between Shapa and Modiyo villages. The Manos are an
endogamous group, and Kaffa farmers consider them impure. Manos are severely marginalized
Socio-economic report of Bonga, Boginda, Mankira and the surrounding areas
EWNHS 24
by other Kaffa and live separately on the edge of settlements. Farmers will not intermarry with
them or eat with them. (Gezahegn P., 2001)
The Manjo’s are skilled hunters, using traps, hunting nets, and spears. They are also skillful tree
climbers, make and hang hives and are the main suppliers of fire wood and charcoal to Bonga
town. Before 1974 revolution they were landless and move form one area to another along the
edges of forest. The Manjo used to live mainly on hunted animals notably porcupines, colobus
monkey and wild pig. However, owing to the dwindling number of wild animals and government
prohibitions against hunting, this is no longer the Manjo’s main diet. (Gezahegn P., 2001)
Rate of migration among the Manjo’s is higher than among the other minority groups in Kaffa
(when wild animals become scarce and search for another area where there are more numerous).
The focus of Manjo attention is the denser forest where they hunt animal and burn charcoal. The
Manjo are an endogamous group. The number of Manjo households living in pockets among the
farmer Kafecho is very small and occupy marginal lands considered to be the habitat of wild
animals that destroy crops. Kafecho considered the Manjo to be ‘unclean’ and ‘stinking’.
(Gezahegn P., 2001)
During the Derg regime there were different efforts, but the practices fell in to disuse and did not
bring fundamental changes as they were imposed and directed from above. (Gezahegn P.)
4.2.4 Religion
MoA (2002) survey in some 16 KA’s of Chena, Decha and Gimbo woredas found number of
believers to each religion as 66.5 percent Orthodox Christians, 19.74 percent Protestants, 10.26
percent Catholics, 3.18 percent Muslims and 0.32 percent atheist.
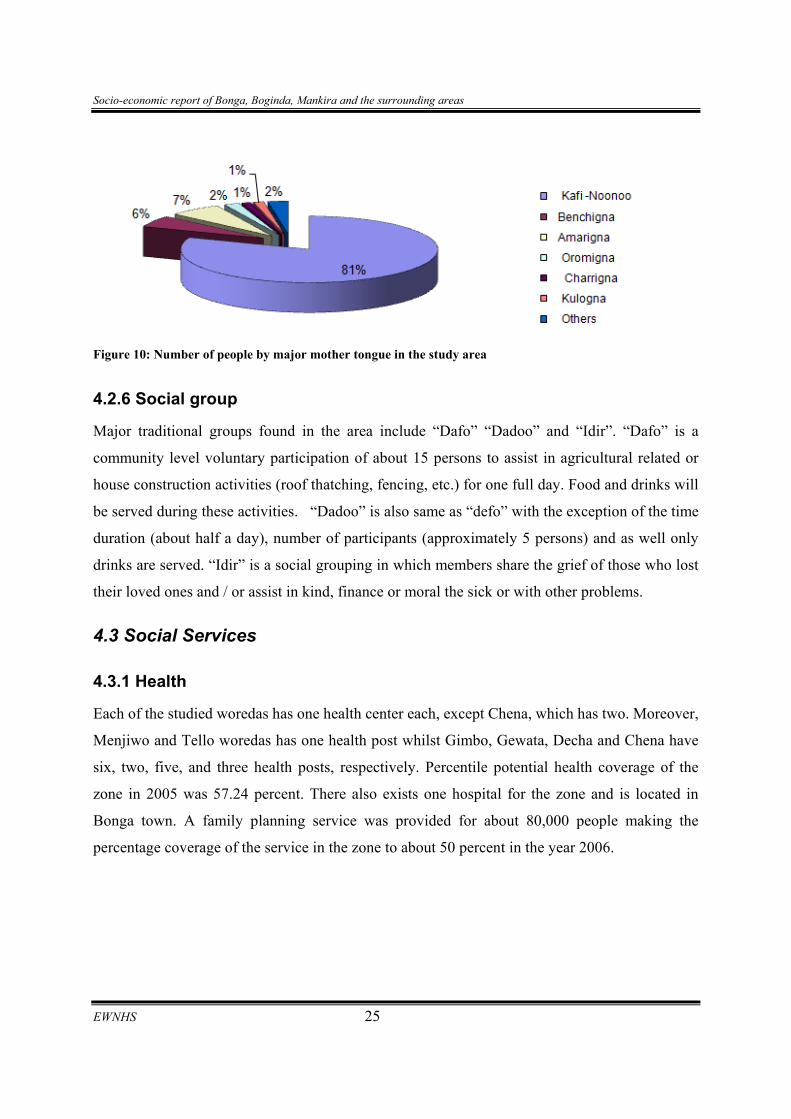
4.2.5 Language
Kefficho is the most widely used language in the study area, spoken by about 80 percent of the
population. Benchigna, Amharic and Oromiffa are also some of the major mother tongue. See
figure 10 for major mother tongue in the study area. See also annex 8 for detail number of people
by major mother tongue by woreda.
Socio-economic report of Bonga, Boginda, Mankira and the surrounding areas
EWNHS 25
Figure 10: Number of people by major mother tongue in the study area
4.2.6 Social group
Major traditional groups found in the area include “Dafo” “Dadoo” and “Idir”. “Dafo” is a
community level voluntary participation of about 15 persons to assist in agricultural related or
house construction activities (roof thatching, fencing, etc.) for one full day. Food and drinks will
be served during these activities. “Dadoo” is also same as “defo” with the exception of the time
duration (about half a day), number of participants (approximately 5 persons) and as well only
drinks are served. “Idir” is a social grouping in which members share the grief of those who lost
their loved ones and / or assist in kind, finance or moral the sick or with other problems.
4.3 Social Services
4.3.1 Health
Each of the studied woredas has one health center each, except Chena, which has two. Moreover,
Menjiwo and Tello woredas has one health post whilst Gimbo, Gewata, Decha and Chena have
six, two, five, and three health posts, respectively. Percentile potential health coverage of the
zone in 2005 was 57.24 percent. There also exists one hospital for the zone and is located in
Bonga town. A family planning service was provided for about 80,000 people making the
percentage coverage of the service in the zone to about 50 percent in the year 2006.
Socio-economic report of Bonga, Boginda, Mankira and the surrounding areas
EWNHS 26
3.2 Education
There were 125 first level primary and secondary schools (grades 1-8) and 4 second level
primary schools (grades 9-10) within the woredas of the study area as of year 2005/6. In Bonga
town there is also a teachers training college with 10+1 and 10+3 programs.
The average student teacher ratio in the study area was 1:57.48, 47.48, and 70.73 for grades 1-4,
5-8 and 9-10, respectively. In the preparatory classes (grade 11-12), which is found in Bonga
town, the student teacher ratio was 1:14.18 for the year 2005/6.
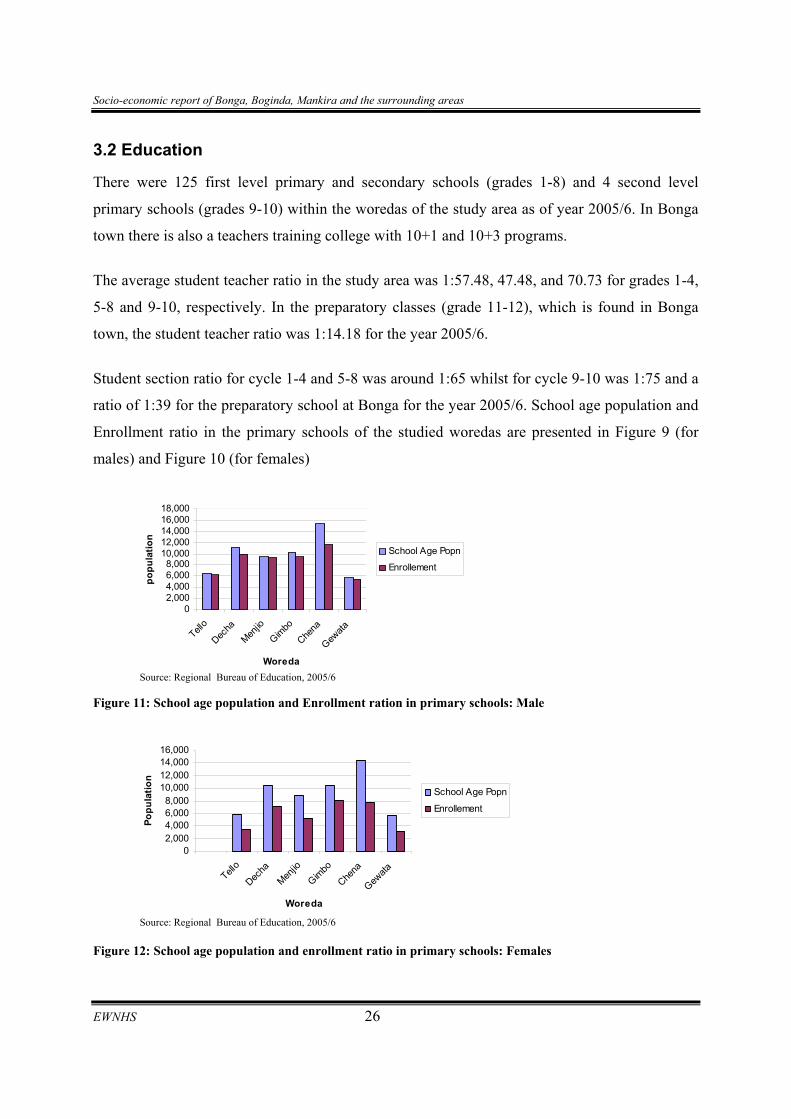
Student section ratio for cycle 1-4 and 5-8 was around 1:65 whilst for cycle 9-10 was 1:75 and a
ratio of 1:39 for the preparatory school at Bonga for the year 2005/6. School age population and
Enrollment ratio in the primary schools of the studied woredas are presented in Figure 9 (for
males) and Figure 10 (for females)
02,0004,0006,0008,000
10,00012,00014,00016,00018,000
Tello
Decha
Menjio
Gimbo
Chena
Gewata
Woreda
popu
latio
n
School Age Popn
Enrollement
Source: Regional Bureau of Education, 2005/6
Figure 11: School age population and Enrollment ration in primary schools: Male
02,0004,0006,0008,000
10,00012,00014,00016,000
Tello
Decha
Menjio
Gimbo
Chena
Gewata
Woreda
Popu
latio
n
School Age Popn
Enrollement
Source: Regional Bureau of Education, 2005/6
Figure 12: School age population and enrollment ratio in primary schools: Females
Socio-economic report of Bonga, Boginda, Mankira and the surrounding areas
EWNHS 27
Projections for 2008 indicate the total school age population in the studied woredas could
increase from 160,182 to 173,474, an increase of about 13,292.
4.3.3 Communication
4.3.3.1 Transport network
The road network within the study area consists of gravel and earth road. See Annex 5 for
existing road map of Kaffa Administrative Zone. Of these, currently works are underway at a
cost of 101.53 million UA (as of August, 2006, 1 UA equals approximately US$ 1.4548) to
upgrade the road from Jimma to Mizan-teferi to asphalt standard. Of the 225 km of the road
project 95 km is within the Kaffa Administrative zone, the road is expected to be finalized in the
coming three years. Leading off these main roads are many trails in which the only means of
transport is on foot or pack animals.
During the rainy seasons, accessibility to Mankira area on foot is also non-permitting, as there is
no bridge over the river. Road distance from the capital of the country to and within the study
area is shown in table 5.
Socio-economic report of Bonga, Boginda, Mankira and the surrounding areas
EWNHS 28
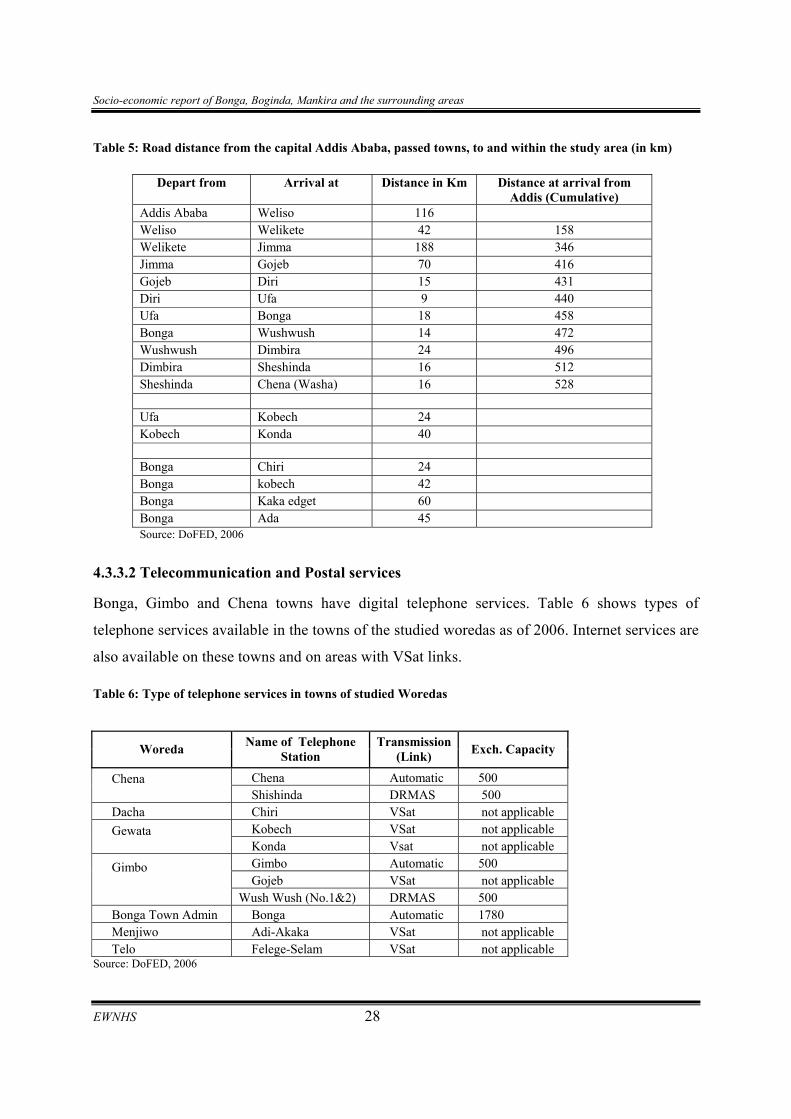
Table 5: Road distance from the capital Addis Ababa, passed towns, to and within the study area (in km)
Depart from Arrival at Distance in Km Distance at arrival from
Addis (Cumulative) Addis Ababa Weliso 116 Weliso Welikete 42 158 Welikete Jimma 188 346 Jimma Gojeb 70 416 Gojeb Diri 15 431 Diri Ufa 9 440 Ufa Bonga 18 458 Bonga Wushwush 14 472 Wushwush Dimbira 24 496 Dimbira Sheshinda 16 512 Sheshinda Chena (Washa) 16 528 Ufa Kobech 24 Kobech Konda 40 Bonga Chiri 24 Bonga kobech 42 Bonga Kaka edget 60 Bonga Ada 45 Source: DoFED, 2006
4.3.3.2 Telecommunication and Postal services
Bonga, Gimbo and Chena towns have digital telephone services. Table 6 shows types of
telephone services available in the towns of the studied woredas as of 2006. Internet services are
also available on these towns and on areas with VSat links. Table 6: Type of telephone services in towns of studied Woredas
Woreda Name of Telephone Station
Transmission(Link) Exch. Capacity
Chena Automatic 500 Chena Shishinda DRMAS 500 Dacha Chiri VSat not applicable
Kobech VSat not applicable Gewata Konda Vsat not applicable
Gimbo Automatic 500 Gojeb VSat not applicable
Gimbo
Wush Wush (No.1&2) DRMAS 500 Bonga Town Admin Bonga Automatic 1780 Menjiwo Adi-Akaka VSat not applicable Telo Felege-Selam VSat not applicable
Source: DoFED, 2006
Socio-economic report of Bonga, Boginda, Mankira and the surrounding areas
EWNHS 29
There is a post office at Bonga town. Departmental or sub-post offices are also found at each of
the studied Woreda towns.
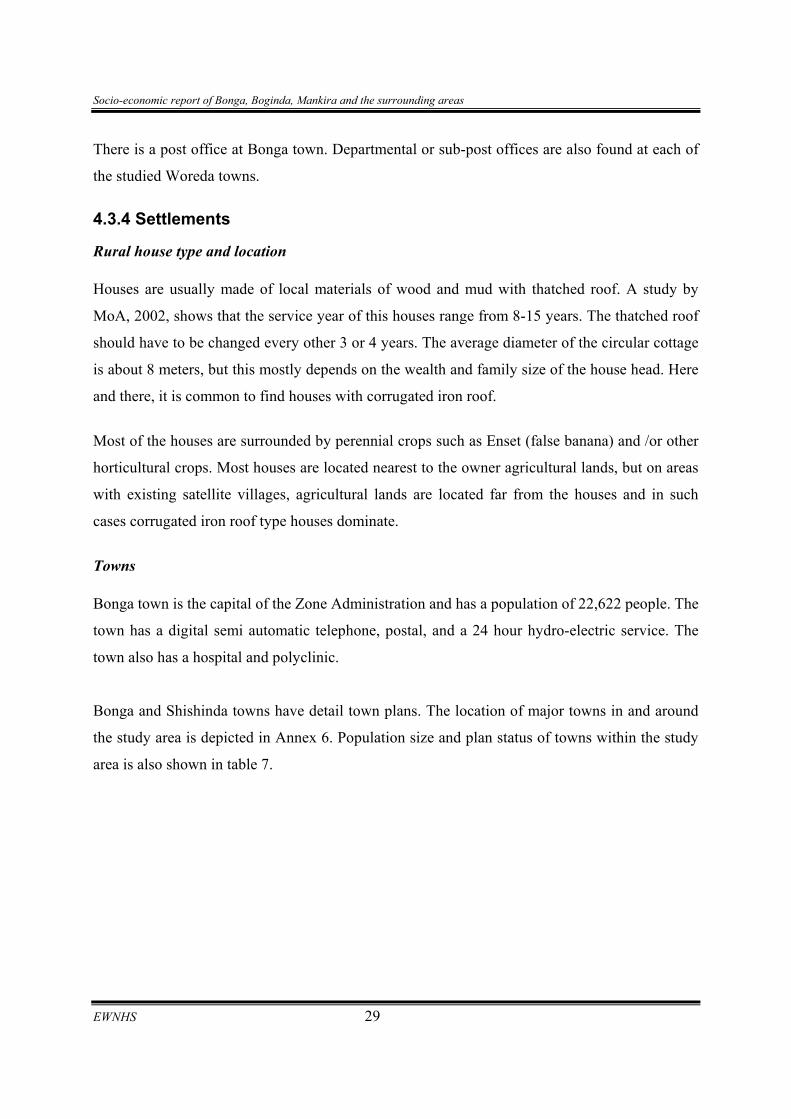
4.3.4 Settlements
Rural house type and location
Houses are usually made of local materials of wood and mud with thatched roof. A study by
MoA, 2002, shows that the service year of this houses range from 8-15 years. The thatched roof
should have to be changed every other 3 or 4 years. The average diameter of the circular cottage
is about 8 meters, but this mostly depends on the wealth and family size of the house head. Here
and there, it is common to find houses with corrugated iron roof.
Most of the houses are surrounded by perennial crops such as Enset (false banana) and /or other
horticultural crops. Most houses are located nearest to the owner agricultural lands, but on areas
with existing satellite villages, agricultural lands are located far from the houses and in such
cases corrugated iron roof type houses dominate.
Towns
Bonga town is the capital of the Zone Administration and has a population of 22,622 people. The
town has a digital semi automatic telephone, postal, and a 24 hour hydro-electric service. The
town also has a hospital and polyclinic.
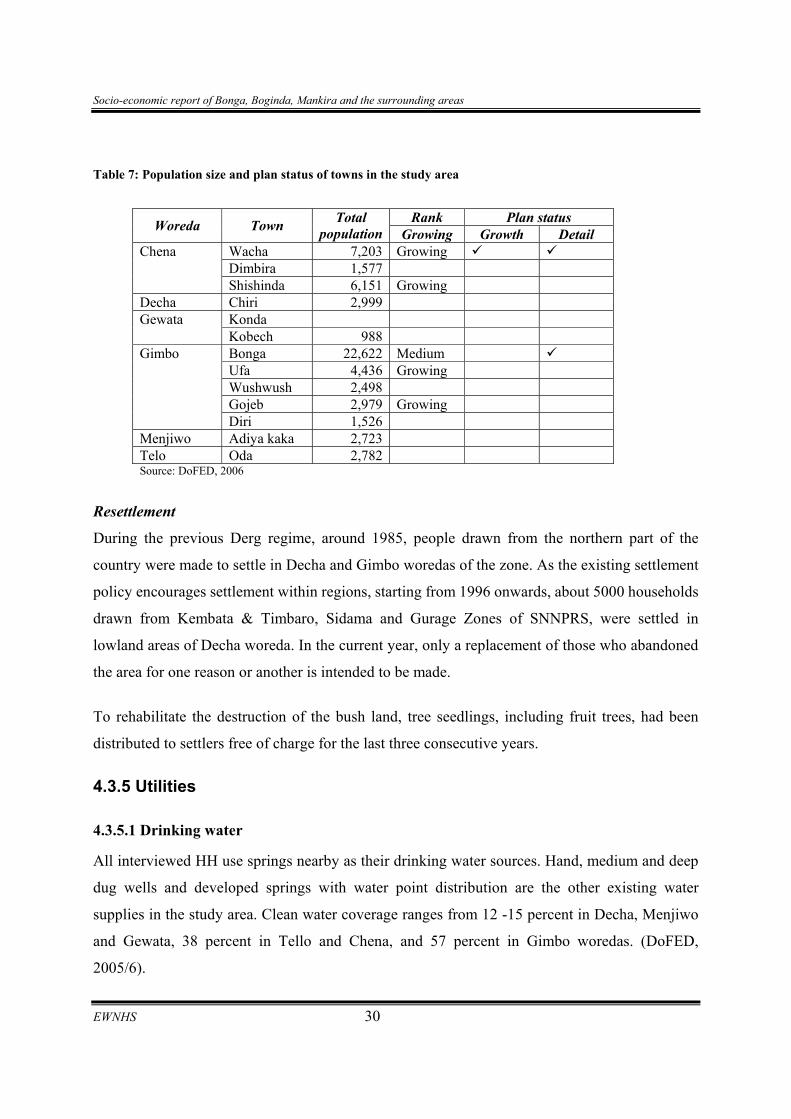
Bonga and Shishinda towns have detail town plans. The location of major towns in and around
the study area is depicted in Annex 6. Population size and plan status of towns within the study
area is also shown in table 7.
Socio-economic report of Bonga, Boginda, Mankira and the surrounding areas
EWNHS 30
Table 7: Population size and plan status of towns in the study area
Rank Plan status Woreda Town Total population Growing Growth Detail
Wacha 7,203 Growing Dimbira 1,577
Chena
Shishinda 6,151 Growing Decha Chiri 2,999
Konda Gewata Kobech 988 Bonga 22,622 Medium Ufa 4,436 Growing Wushwush 2,498 Gojeb 2,979 Growing
Gimbo
Diri 1,526 Menjiwo Adiya kaka 2,723 Telo Oda 2,782 Source: DoFED, 2006
Resettlement
During the previous Derg regime, around 1985, people drawn from the northern part of the
country were made to settle in Decha and Gimbo woredas of the zone. As the existing settlement
policy encourages settlement within regions, starting from 1996 onwards, about 5000 households
drawn from Kembata & Timbaro, Sidama and Gurage Zones of SNNPRS, were settled in
lowland areas of Decha woreda. In the current year, only a replacement of those who abandoned
the area for one reason or another is intended to be made.
To rehabilitate the destruction of the bush land, tree seedlings, including fruit trees, had been
distributed to settlers free of charge for the last three consecutive years.
4.3.5 Utilities
4.3.5.1 Drinking water
All interviewed HH use springs nearby as their drinking water sources. Hand, medium and deep
dug wells and developed springs with water point distribution are the other existing water
supplies in the study area. Clean water coverage ranges from 12 -15 percent in Decha, Menjiwo
and Gewata, 38 percent in Tello and Chena, and 57 percent in Gimbo woredas. (DoFED,
2005/6).
Socio-economic report of Bonga, Boginda, Mankira and the surrounding areas
EWNHS 31
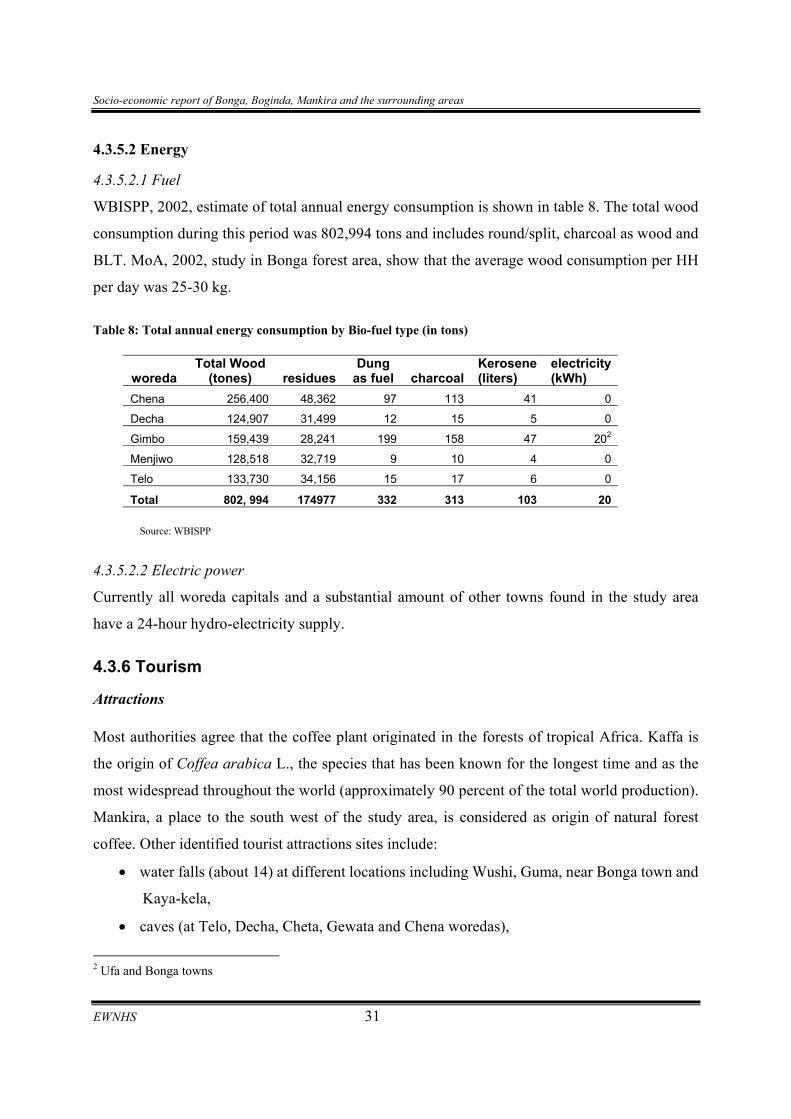
4.3.5.2 Energy
4.3.5.2.1 Fuel
WBISPP, 2002, estimate of total annual energy consumption is shown in table 8. The total wood
consumption during this period was 802,994 tons and includes round/split, charcoal as wood and
BLT. MoA, 2002, study in Bonga forest area, show that the average wood consumption per HH
per day was 25-30 kg.
Table 8: Total annual energy consumption by Bio-fuel type (in tons)
woreda Total Wood
(tones) residuesDung
as fuel charcoalKerosene (liters)
electricity (kWh)
Chena 256,400 48,362 97 113 41 0
Decha 124,907 31,499 12 15 5 0
Gimbo 159,439 28,241 199 158 47 202
Menjiwo 128,518 32,719 9 10 4 0
Telo 133,730 34,156 15 17 6 0
Total 802, 994 174977 332 313 103 20
Source: WBISPP
4.3.5.2.2 Electric power
Currently all woreda capitals and a substantial amount of other towns found in the study area
have a 24-hour hydro-electricity supply.
4.3.6 Tourism
Attractions
Most authorities agree that the coffee plant originated in the forests of tropical Africa. Kaffa is
the origin of Coffea arabica L., the species that has been known for the longest time and as the
most widespread throughout the world (approximately 90 percent of the total world production).
Mankira, a place to the south west of the study area, is considered as origin of natural forest
coffee. Other identified tourist attractions sites include:
• water falls (about 14) at different locations including Wushi, Guma, near Bonga town and
Kaya-kela,
• caves (at Telo, Decha, Cheta, Gewata and Chena woredas),
2 Ufa and Bonga towns
Socio-economic report of Bonga, Boginda, Mankira and the surrounding areas
EWNHS 32
• natural bridges: Gurguta, locally known as “God’s bridge”,
• hot springs at Dadiben (Gimbo woreda – on the road to Gewata), Gora, and Kechi (Decha
woreda);
• long-aged worshipping places: St. Michael church (est. 1529 A.D) in Decha woreda,
Anderacha Medhan-Alem (mid 18th century) St.Georgis, a 16th century monastery some
5 km from Bonga town, Tengola Mosque (13th century), and a Catholc church (16th
century) in Decha woreda, about 15 km from Bonga;
• war-time artifacts of the Kaffa king: ditch like pits for trap in almost all woredas, (zonal
tourism experts claim that the like of which is available only in China).
• the scenic fauna and flora (preliminary studies were conducted to establish a wildlife
reserve and/or control hunting area at Chocha Bereha [Decha woreda] and at Cheta Kola
[Cheta woreda])
Coffee museum
The Ethiopian Millennium Celebration Office has planned to build a Coffee museum where
coffee and coffee related indigenous plants and animals are to be preserved. Within the
compound there will also be a coffee garden. The place shall have research laboratories, out
reach sites with ex-situ conservation works and more. The first phase of this project will come to
an end in December 2008. To date, detail design plan have been prepared and stakeholders are
identified. There are also intentions to celebrate “Coffee day” probably at the end of May or
early June 2008.
Coffee Ceremony
It is the culture of the Kaffa people to invite a guest, even to a meal by saying “please drink a cup
of coffee”. Almost all inhabitants have made it a tradition as not to leave their home without
drinking coffee, as not doing so is believed to bring bad luck.
Facilities
Currently there is one guest house, with 12 bedrooms, and a breakfast service at Bonga town.
Available are also few local hotels with bedrooms (some with common shower services). During
Socio-economic report of Bonga, Boginda, Mankira and the surrounding areas
EWNHS 33
the survey period two hotels were under construction with relatively better facilities. There are
also two meeting halls, one with a capacity of 500 and the other about 2000 persons.
The tourism industry
Currently, local tourists are the major visiting tourists. There is also a steady growth in foreign
tourists that came to the area. Of the 10,095 tourists that visited the area in the first two quarters
of the fiscal year 2008, around 198 were foreigners.
4.4 Income and expenditure
The major sources of cash and non-cash income in the study area are agricultural crops,
livestock, honey production and collection of coffee and spices (such as cardamom and long
pepper) from the forest. The latter depends by virtue of their nearness to a forest where such is
available.
Difference in household income is thus attributed to nearness and access to NTFP and beyond to
the availability of off-farm jobs (e.g. investment activity). Yihenew (2003), drawing from
research and case studies from six forest villages in Gimbo woreda, found the level of income
from non-wood forest product to vary from household to household but averaging at least a third
of the annual cash income of the rural households.
Studies made by MoA, 2004, in Bonga forest area shows that the average household income was
2653.29 (highest income 3422.4 and lowest 2098.40) and expenditure 2383.30 (highest
expenditure was 2832.30 and lowest 2073.33). Household major expenditures were for clothing,
children’s education, tax and health care.
Socio-economic report of Bonga, Boginda, Mankira and the surrounding areas
EWNHS 34
V. AGRICULTURE
5.1 Crop
The subsistence crop production of the study area is traditional and rain-fed. Depending on the
prevailing agro-ecological conditions, different crops are grown, and of these, maize, sorghum,
barley, wheat and teff are the main cereal crops. Pulses grown are field pea, horse bean and
haricot bean. From perennial crops “enset”, Ensete ventricosum is found in abundance and
mostly around homestead, and sugar cane.
Fruits like banana, avocado, mango,and papaya, vegetables such as Ethiopian cabbage and root
crops like carrot, beet root, onion, “Anchote” Coccinia abyssinica, “Godere” Colacasia
esculanta L., Colacasia esculanta L., nd potato are also planted nearby homesteads.
Agricultural inputs are not widely practiced, nevertheless, in some places fertilizer is applied for
maize and teff and improved seed varieties of maize, wheat and barley are used. Pesticides are
also applied for sorghum and teff in certain localities.
5.2 Livestock
Cattle rearing are one of the sources of livelihood in the studied woredas. It is a source of
draught power, milk, meat, and income. Equines are used as means of carrying load or personal
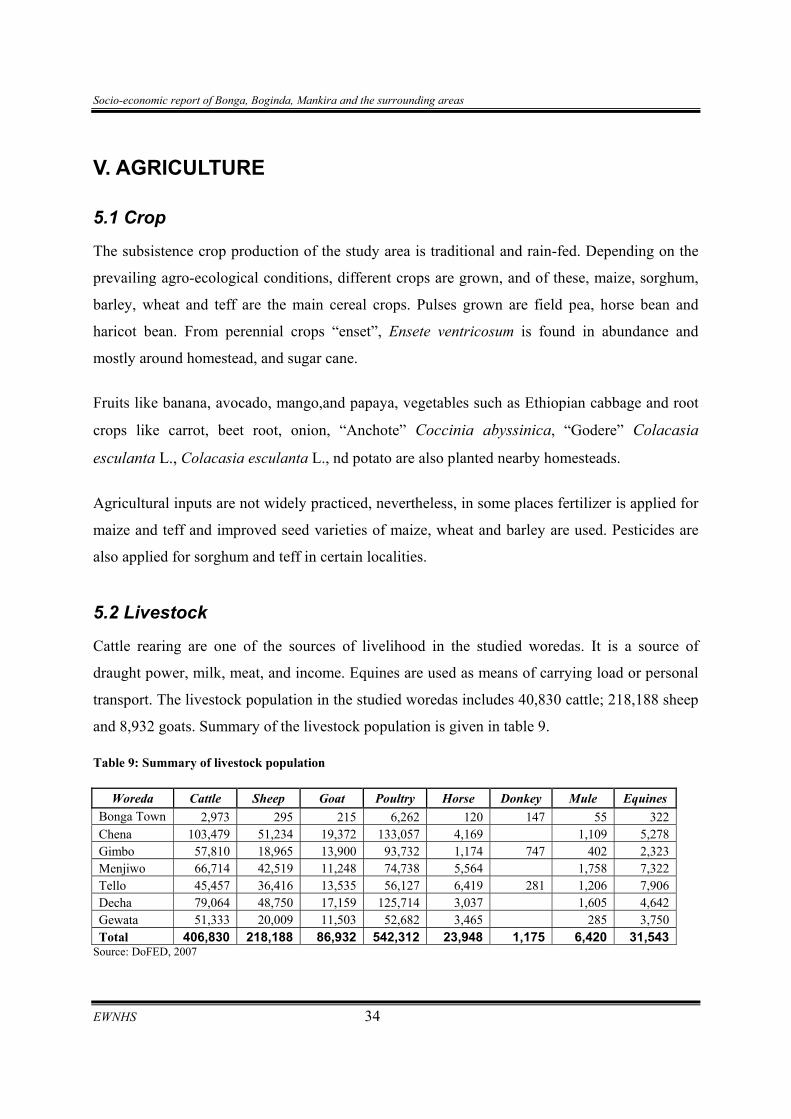
transport. The livestock population in the studied woredas includes 40,830 cattle; 218,188 sheep
and 8,932 goats. Summary of the livestock population is given in table 9.
Table 9: Summary of livestock population
Woreda Cattle Sheep Goat Poultry Horse Donkey Mule Equines Bonga Town 2,973 295 215 6,262 120 147 55 322 Chena 103,479 51,234 19,372 133,057 4,169 1,109 5,278 Gimbo 57,810 18,965 13,900 93,732 1,174 747 402 2,323 Menjiwo 66,714 42,519 11,248 74,738 5,564 1,758 7,322 Tello 45,457 36,416 13,535 56,127 6,419 281 1,206 7,906 Decha 79,064 48,750 17,159 125,714 3,037 1,605 4,642 Gewata 51,333 20,009 11,503 52,682 3,465 285 3,750 Total 406,830 218,188 86,932 542,312 23,948 1,175 6,420 31,543
Source: DoFED, 2007
Socio-economic report of Bonga, Boginda, Mankira and the surrounding areas
EWNHS 35
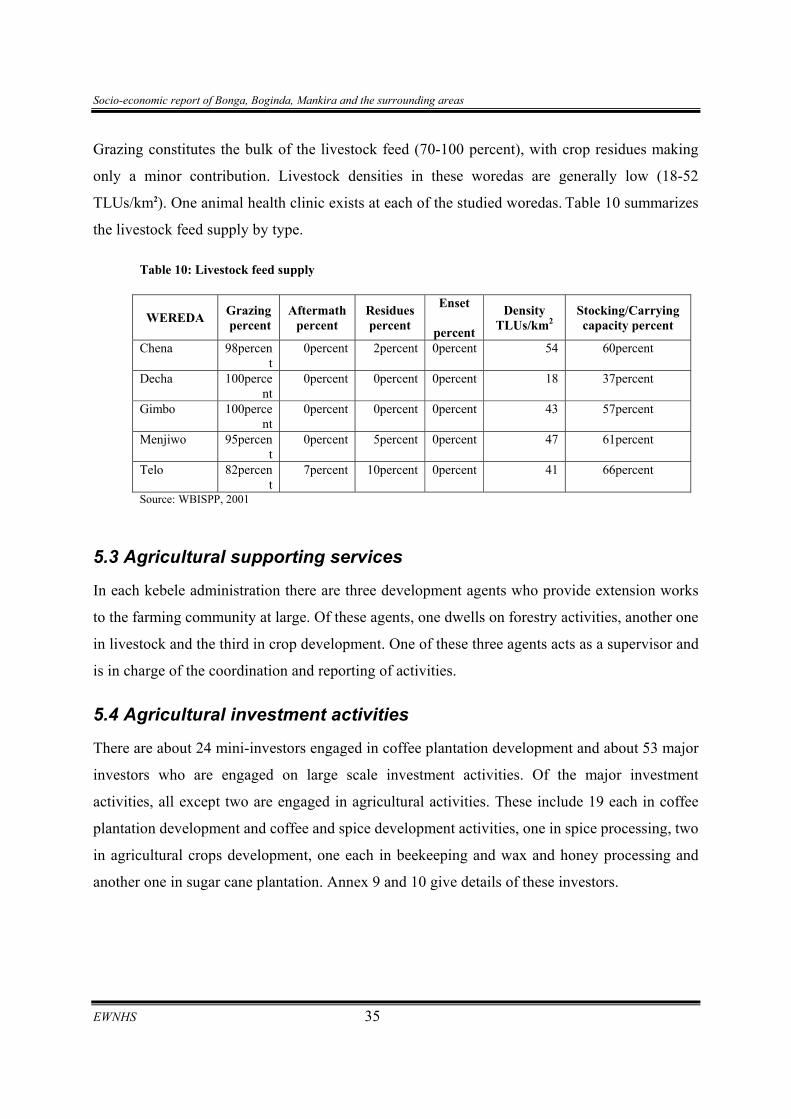
Grazing constitutes the bulk of the livestock feed (70-100 percent), with crop residues making
only a minor contribution. Livestock densities in these woredas are generally low (18-52
TLUs/km2). One animal health clinic exists at each of the studied woredas. Table 10 summarizes
the livestock feed supply by type.
Table 10: Livestock feed supply
WEREDA Grazing percent
Aftermath percent
Residues percent
Enset
percent
Density TLUs/km2
Stocking/Carrying capacity percent
Chena 98percent
0percent 2percent 0percent 54 60percent
Decha 100percent
0percent 0percent 0percent 18 37percent
Gimbo 100percent
0percent 0percent 0percent 43 57percent
Menjiwo 95percent
0percent 5percent 0percent 47 61percent
Telo 82percent
7percent 10percent 0percent 41 66percent
Source: WBISPP, 2001
5.3 Agricultural supporting services
In each kebele administration there are three development agents who provide extension works
to the farming community at large. Of these agents, one dwells on forestry activities, another one
in livestock and the third in crop development. One of these three agents acts as a supervisor and
is in charge of the coordination and reporting of activities.
5.4 Agricultural investment activities
There are about 24 mini-investors engaged in coffee plantation development and about 53 major
investors who are engaged on large scale investment activities. Of the major investment
activities, all except two are engaged in agricultural activities. These include 19 each in coffee
plantation development and coffee and spice development activities, one in spice processing, two
in agricultural crops development, one each in beekeeping and wax and honey processing and
another one in sugar cane plantation. Annex 9 and 10 give details of these investors.
Socio-economic report of Bonga, Boginda, Mankira and the surrounding areas
EWNHS 36
VI. LAND TENURE
6.1 Land tenure – the past and present
Pre 1975 land tenure
Before the agrarian reform in 1974, Ethiopia had a complex land tenure system, (Philippe. L.,
2003) and the tenure system was different in the north and in the south of the country. The
tenures in application in the north were the ‘rist’ – that is kinship or communal, church and state
tenures while in the south, there were church, state and private tenures. (Rahmato, 1985; cited in
Philippe L., 2003)
Private tenure was recognized as the most dominant system during the final days of the Imperial
regime, affecting some 60 percent of peasants and 65 percent of the country's population. (B.
Nega, et al., 2003) and virtually all lands under private tenures were originally state property. In
the south, landlords, official and loyal servants of the crown, were allowed to use these lands and
employed peasants to work on them. Few farmers owned the land on which they worked.
(Philippe L., 2003)
B. Nega et al., 2003, states that under this system land was sold and exchanged; however, given
that all the land was originally state property and that private holders had no absolute rights, this
was different from the general concept of a freehold system. Land tenure during the Derg period (1974 - 1991) The 1975 land reform by the Derg was designed to alter fundamentally the then agrarian
relations, (B. Nega, et al. 2003). Proclamation No. 31 (1975) “Public Ownership of Rural
Lands”, prohibited private ownership of land; transfers of land by sale, lease and mortgage; as
well as hiring of labor. It acknowledged only use rights to land and set a maximum farm size of
10 hectares (Holden S. et al. 2001)
The Peasant Associations (PA) were formed at the kebele level to be in charge of the land
distribution. But since everyone above 18 years was entitled to have a farmland, frequent
redistribution of lands were necessary to accommodate the growing population. The PAs,
however, failed to redistribute land to accommodate young families and new households.
Socio-economic report of Bonga, Boginda, Mankira and the surrounding areas
EWNHS 37
Farmers were also forced into collectivization and resettlement that further exacerbated the
problem of tenure insecurity (Philippe L. 2003)
Current land tenure
The December 1994 Constitution of the Federal Democratic Republic of Ethiopia proclaimed
that land remains vested in the State: …the right to ownership of rural and urban land, as well
as all of natural resources is exclusively vested in the state and in the peoples of Ethiopia. Land
is a common property of the nations, nationalities and Peoples of Ethiopia and shall not be
subject to sale or to other means of transfer.’ (Philippe L., 2003) The constitution, under Article 51, also states that the Federal Government shall enact laws for
the utilization and conservation of land and other natural resources. Article 52 also states that
Regional Governments have the duty to administer land and other natural resources according to
federal laws. Such law was enacted in July 1997 on "Rural Land Administration Proclamation,
No. 89/1997". This law vested Regional Governments with the power of land administration,
defined as "the assignment of holding rights and the execution of distribution of holdings"; (B.
Nega et al., 2003)
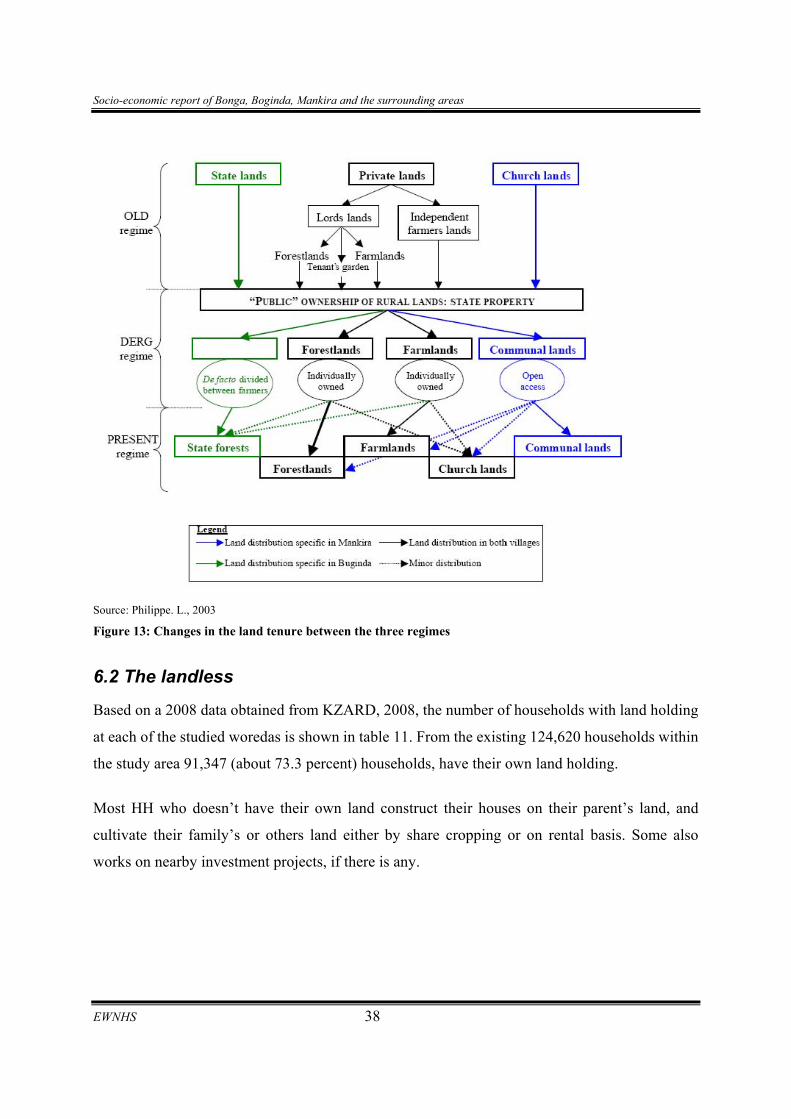
Philippe L., 2003 summarizes the changes in the land tenure between the three regimes, as
depicted in Figure 13, as how the lands have been distributed among the different holdings for
each regime.
Socio-economic report of Bonga, Boginda, Mankira and the surrounding areas
EWNHS 38
Source: Philippe. L., 2003
Figure 13: Changes in the land tenure between the three regimes
6.2 The landless
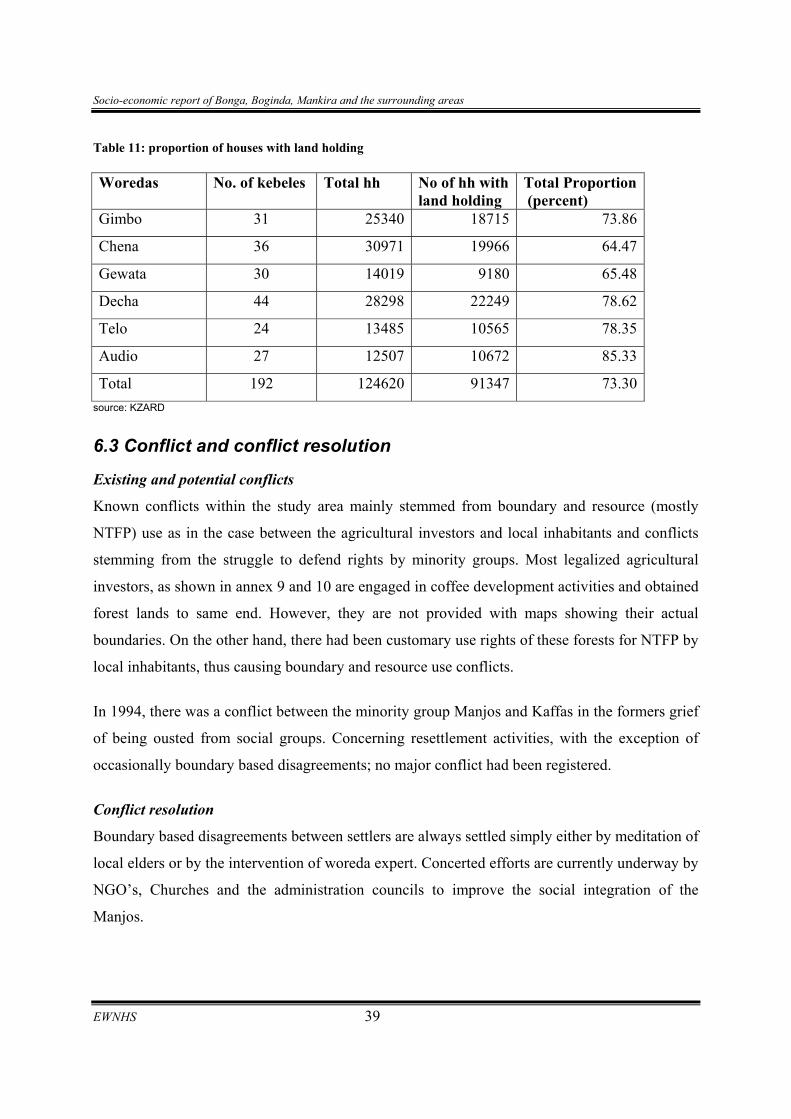
Based on a 2008 data obtained from KZARD, 2008, the number of households with land holding
at each of the studied woredas is shown in table 11. From the existing 124,620 households within
the study area 91,347 (about 73.3 percent) households, have their own land holding.
Most HH who doesn’t have their own land construct their houses on their parent’s land, and
cultivate their family’s or others land either by share cropping or on rental basis. Some also
works on nearby investment projects, if there is any.
Socio-economic report of Bonga, Boginda, Mankira and the surrounding areas
EWNHS 39
Table 11: proportion of houses with land holding Woredas
No. of kebeles
Total hh
No of hh with land holding
Total Proportion (percent)
Gimbo 31 25340 18715 73.86
Chena 36 30971 19966 64.47
Gewata 30 14019 9180 65.48
Decha 44 28298 22249 78.62
Telo 24 13485 10565 78.35
Audio 27 12507 10672 85.33
Total 192 124620 91347 73.30 source: KZARD
6.3 Conflict and conflict resolution
Existing and potential conflicts
Known conflicts within the study area mainly stemmed from boundary and resource (mostly
NTFP) use as in the case between the agricultural investors and local inhabitants and conflicts
stemming from the struggle to defend rights by minority groups. Most legalized agricultural
investors, as shown in annex 9 and 10 are engaged in coffee development activities and obtained
forest lands to same end. However, they are not provided with maps showing their actual
boundaries. On the other hand, there had been customary use rights of these forests for NTFP by
local inhabitants, thus causing boundary and resource use conflicts.
In 1994, there was a conflict between the minority group Manjos and Kaffas in the formers grief
of being ousted from social groups. Concerning resettlement activities, with the exception of
occasionally boundary based disagreements; no major conflict had been registered.
Conflict resolution
Boundary based disagreements between settlers are always settled simply either by meditation of
local elders or by the intervention of woreda expert. Concerted efforts are currently underway by
NGO’s, Churches and the administration councils to improve the social integration of the
Manjos.
Socio-economic report of Bonga, Boginda, Mankira and the surrounding areas
EWNHS 40
Conflicts between agricultural investors and local inhabitants in forest use rights are resolved
through the participation of Elders, ‘Eder’, or Kebele administration and sometimes with the
involvement of pertinent woreda officials.
6.3 Forest tenure Since nationalization of land holdings in 1975, stewardship for forest resources is a
governmental matter. Nevertheless, forest use and conservation has been a low priority topic in
the governmental framework of Ethiopia, facing drastic financial and personnel shortage.
Governmental forest policy in Ethiopia primarily focused on ‘rigid conservation,’ hence on
exclusion of human interference, rather than on management of forest resources. In this
understanding, Ethiopian governments tried to implement different forest conservation
approaches over time, the most ambitious started in the early 1980s with the incorporation of
primary high forest areas as ‘National Forest Priority Areas’, NFPA (Stellmacher T, 2005).
However, communities continued to claim forest access through locally recognized customary
channels. The principles informing customary forest access included geographical proximity to
the resource, proven track record and ancestral claim of ownership.
Participatory Forest Management
PFM in Ethiopia has been started 10 years ago. Since then four forest priority areas namely,
Chilimo, Bonga, Adaba-Dodola and Yabeloo forest areas are put under PFM Program and is
financed by FARM-Africa and GTZ. Oromiya and SNNP Regional Bureaus of Agriculture and
Rural Development have supported the two supporting agencies to achieve their goals and have
worked closely with these two funding agencies to meet objectives of the program (EfD, 2008).
Bench-Maji, Bale, Munessa and Wof-Wwasha forests are also being put under PFM.
The PFM project of FARM Africa was initiated in 1996 (now part of the FARM/SOS PFMP)
and aims to ensure environmental sustainability, with improved efficiency and effectiveness of
forest utilization and conservation, through participatory forest management system. One of the
target areas, Bonga Natural Forest was designated as National Forest Priority Area (NFPA) in
1985 by the State Forest Development and Conservation Department of the Ministry of
Socio-economic report of Bonga, Boginda, Mankira and the surrounding areas
EWNHS 41
Agriculture. Though the forest was designated as a NFPA, little has been achieved towards its
protection, development and proper utilization due to limited government resources.
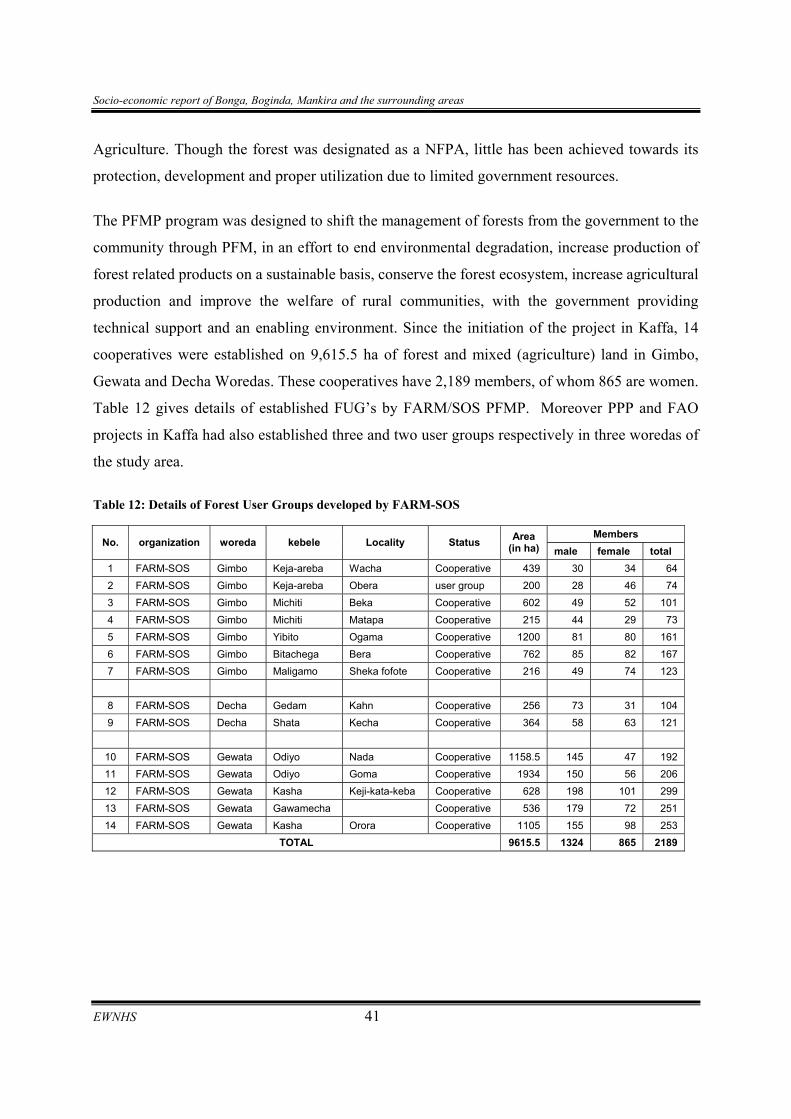
The PFMP program was designed to shift the management of forests from the government to the
community through PFM, in an effort to end environmental degradation, increase production of
forest related products on a sustainable basis, conserve the forest ecosystem, increase agricultural
production and improve the welfare of rural communities, with the government providing
technical support and an enabling environment. Since the initiation of the project in Kaffa, 14
cooperatives were established on 9,615.5 ha of forest and mixed (agriculture) land in Gimbo,
Gewata and Decha Woredas. These cooperatives have 2,189 members, of whom 865 are women.
Table 12 gives details of established FUG’s by FARM/SOS PFMP. Moreover PPP and FAO
projects in Kaffa had also established three and two user groups respectively in three woredas of
the study area.
Table 12: Details of Forest User Groups developed by FARM-SOS
Members No. organization woreda kebele Locality Status Area
(in ha) male female total 1 FARM-SOS Gimbo Keja-areba Wacha Cooperative 439 30 34 64 2 FARM-SOS Gimbo Keja-areba Obera user group 200 28 46 74 3 FARM-SOS Gimbo Michiti Beka Cooperative 602 49 52 101 4 FARM-SOS Gimbo Michiti Matapa Cooperative 215 44 29 73 5 FARM-SOS Gimbo Yibito Ogama Cooperative 1200 81 80 161 6 FARM-SOS Gimbo Bitachega Bera Cooperative 762 85 82 167 7 FARM-SOS Gimbo Maligamo Sheka fofote Cooperative 216 49 74 123 8 FARM-SOS Decha Gedam Kahn Cooperative 256 73 31 104 9 FARM-SOS Decha Shata Kecha Cooperative 364 58 63 121
10 FARM-SOS Gewata Odiyo Nada Cooperative 1158.5 145 47 192 11 FARM-SOS Gewata Odiyo Goma Cooperative 1934 150 56 206 12 FARM-SOS Gewata Kasha Keji-kata-keba Cooperative 628 198 101 299 13 FARM-SOS Gewata Gawamecha Cooperative 536 179 72 251 14 FARM-SOS Gewata Kasha Orora Cooperative 1105 155 98 253
TOTAL 9615.5 1324 865 2189
Socio-economic report of Bonga, Boginda, Mankira and the surrounding areas
EWNHS 42
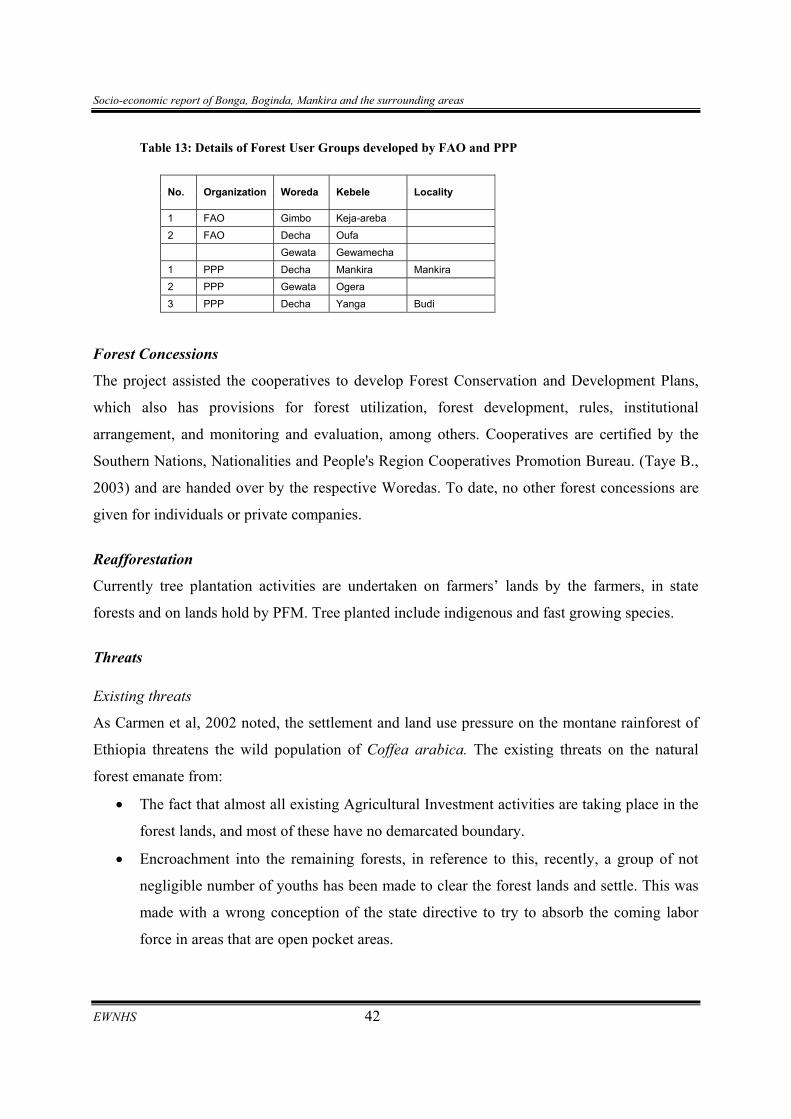
Table 13: Details of Forest User Groups developed by FAO and PPP
No. Organization Woreda Kebele Locality
1 FAO Gimbo Keja-areba 2 FAO Decha Oufa Gewata Gewamecha 1 PPP Decha Mankira Mankira 2 PPP Gewata Ogera 3 PPP Decha Yanga Budi
Forest Concessions
The project assisted the cooperatives to develop Forest Conservation and Development Plans,
which also has provisions for forest utilization, forest development, rules, institutional
arrangement, and monitoring and evaluation, among others. Cooperatives are certified by the
Southern Nations, Nationalities and People's Region Cooperatives Promotion Bureau. (Taye B.,
2003) and are handed over by the respective Woredas. To date, no other forest concessions are
given for individuals or private companies.
Reafforestation
Currently tree plantation activities are undertaken on farmers’ lands by the farmers, in state
forests and on lands hold by PFM. Tree planted include indigenous and fast growing species.
Threats Existing threats
As Carmen et al, 2002 noted, the settlement and land use pressure on the montane rainforest of
Ethiopia threatens the wild population of Coffea arabica. The existing threats on the natural
forest emanate from:
• The fact that almost all existing Agricultural Investment activities are taking place in the
forest lands, and most of these have no demarcated boundary.
• Encroachment into the remaining forests, in reference to this, recently, a group of not
negligible number of youths has been made to clear the forest lands and settle. This was
made with a wrong conception of the state directive to try to absorb the coming labor
force in areas that are open pocket areas.
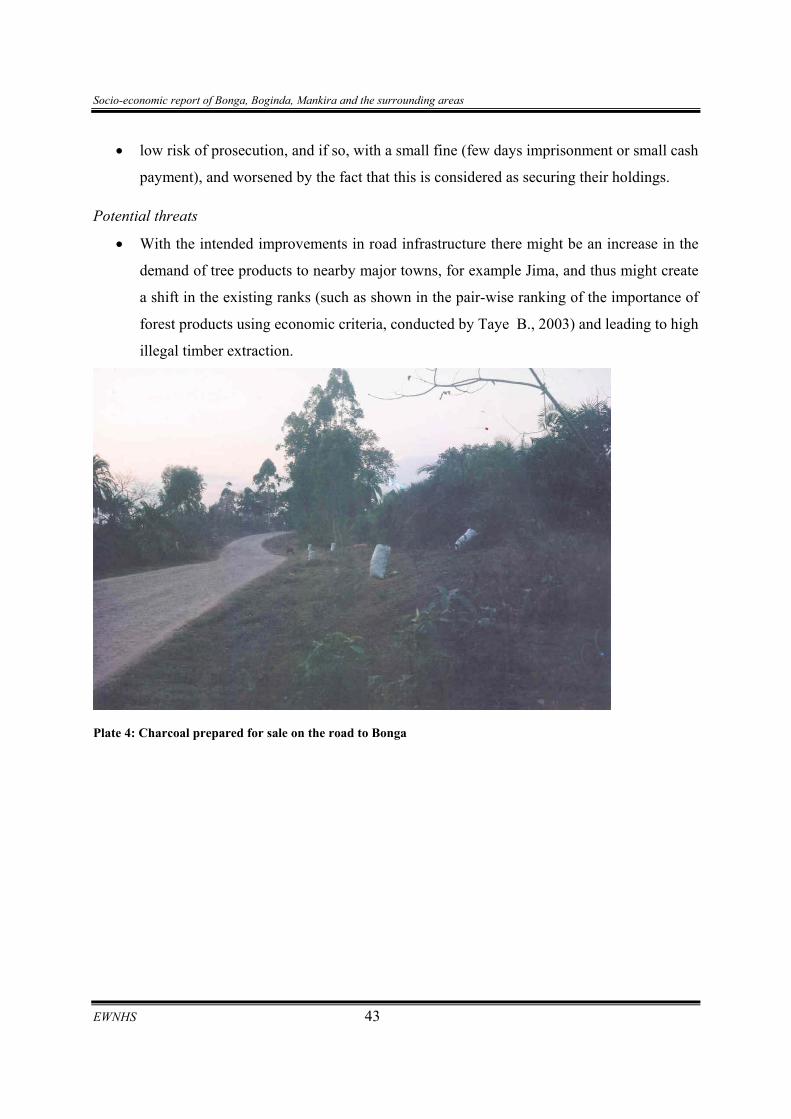
Socio-economic report of Bonga, Boginda, Mankira and the surrounding areas
EWNHS 43
• low risk of prosecution, and if so, with a small fine (few days imprisonment or small cash
payment), and worsened by the fact that this is considered as securing their holdings. Potential threats
• With the intended improvements in road infrastructure there might be an increase in the
demand of tree products to nearby major towns, for example Jima, and thus might create
a shift in the existing ranks (such as shown in the pair-wise ranking of the importance of
forest products using economic criteria, conducted by Taye B., 2003) and leading to high
illegal timber extraction.
Plate 4: Charcoal prepared for sale on the road to Bonga
Socio-economic report of Bonga, Boginda, Mankira and the surrounding areas
EWNHS 44
VII. Institutions
7.1 Administrative Government
Ethiopia, a Federal State, has nine regions and two Administrative Areas. SNNPRS is one of the
nine Regions and is in turn divided into fifteen Zones and six Special Woredas. Kaffa is one of
these zones and have 10 Woredas and one town administration. Below the Woreda level there
are Kebele Administrations.
The regional state has two councils, the elected regional council and a cabinet body called
administration council. The Bureau of Agriculture and Rural Development at the regional level is
the official body concerned with the issue of policies on rural land use planning and
administration and laws on forest and wild animal protection and utilization and the
implementation thereof. Environmental protection and land administration and planning
authority is one of the organization organized under it to assist the implementation of its
objectives.
The agriculture and rural development department at zonal level ensures the correct
implementation of agriculture and rural development proclamations, directives and guidelines
issued by the regional council/Bureau of Agriculture and Rural Development, and when asked
gives support to woredas.
Land use, forestry and management of protected areas are under the auspices of the agriculture
and rural development offices.
The tourism desk, under Commerce and Tourism Department at zonal level is the responsible
authority for wildlife conservation and development. The Woreda Administration has offices for
agriculture, health, education, rural primary road, domestic water supplies and local
administration, which are responsible for agricultural extension, primary health care,
basic/primary education, feeder roads and safe drinking water service delivery, respectively.
The Woreda Agriculture and Rural Development office is responsible for the planning, decision
making and implementation of the Woreda’s agricultural and rural development activities. To
Socio-economic report of Bonga, Boginda, Mankira and the surrounding areas
EWNHS 45
execute its responsibilities the office has organized itself under six Desks. These are: Crop
Development and Protection, Livestock Resource Development and Hhealth Service and
Training and Promotion of Agricultural Technology Desks, which are under one Deputy Head,
and Agricultural Marketing and Cooperatives Promotion, Food Security, Disaster Prevention and
Preparedness, and Natural Resource and Rural Land Administration Desks under another Deputy
Head.
The Natural Resources and Rural Land Administration Desk within the Woreda Agricultural and
rRural Development Office has two teams organized under it for the execution of its
responsibilities: Land Use Planning and Administration and Natural Resources Development and
Protection. At Kebele level, three development agents are in place to execute the agricultural
development activities.
7.2 Non-Governmental Organizations
Many NGOs have worked and are currently working on different sectors, such as Health,
Resource Conservation/Wise Utilization, Environmental Protection, Food Security, Good
Governance, Women’s and Girls’ Rights, HIV/AIDS, Education and Capacity Building.
Some of these organizations are: FARM Africa, SOS Sahel Ethiopia, Action-Aid, World Vision,
KDP Integrated Community Development Initiative, Catholic Church, Meserte Kiristos Church
Relief & Development Association, USAID, GTZ PPP Project, and Action For Environment
Public Advocacy. Of these, some organizations had established a forum at Woreda level to
support the Woredas’ development.
7.3 Community based institutions
KFCU was founded in March 2004, with a total of 3269 coffee-producer member farmers. By
2006, its membership has reached 5517. The major objectives of the Union are to integrate and
improve coffee production and marketing. Its main missions are to determine and apply the best
of possible options, generate and distribute net benefits to the members. In addition, the Union
manages coffee project-funding. The union is financially and technically supported by PPP-
Project (GTZ) to develop and introduce a scheme for sustainable coffee production and
marketing at international quality standards using the natural resources of Ethiopia.
Socio-economic report of Bonga, Boginda, Mankira and the surrounding areas
EWNHS 46
7.4 Research institutions
Agricultural research in Ethiopia was initiated in early 1950s. Since 1997, the NARS is
organized at Federal and Regional levels with the apex body the EIAR. Currently, EIAR
administers eight federal research centers distributed in different agro-ecologies of the country.
Moreover, there are five regional agricultural research institutes (RARIs).
Established in 2002, the Southern Agricultural Research Institute has four research centers,
which have their own thematic areas, these are, Awassa and Areca ARC for densely populated
areas, Jinka ARC for lowland areas along the rift valley and pastoral areas and Bonga ARC on
forest resources.
Established in April, 2005, Bonga ARC have socio-economic, research extension, natural
resource, animal science, and crop science research division and its focus area are the south
western moist and sub-moist areas (Kaffa, Sheka, Bench-Maji, partly Dawro Zone and Yem and
Konta Special Woredas and currently conducts research activities listed in annex 11.
Different research activities are currently undertaken at the Federal and Regional Research
Centers, and Higher Learning Institutions in the country which concern natural resource
conservation. Annex 9 shows list of some of the ongoing and completed research sets conducted
in the SW-Ethiopia, Kaffa area. There is also a spices demonstration site, Abech, run by Gimbo
WARDO, and is located on the road to Bonga from Ufa.
The IBC in July 1998 with technical and financial assistance from the Federal Republic of
Germany had initiated a genetic resource conservation project in Boginda-Yeba Forest. The
purpose of the project is to protect and conserve the forest genetic resources of Ethiopia
according to appropriate concepts and strategies. Different studies are intended to be conducted
by JRC, EIAR and IBC.
Socio-economic report of Bonga, Boginda, Mankira and the surrounding areas
EWNHS 47
VIII. Trends and Recommendations:
8.1 Trends
• In almost all forest areas where there are sufficient NTFP, there is a tendency to protect
the forest;
• There is an increase in population growth and consequently an increment in number of
people without land holdings;
• Efforts to halt the marginalization of Manjo community are not sufficient;
• Blooming of investment activities and the fact that it is causing significant amount of
deforestation.
8.2 Recommendations
At community level
Livelihood diversification
• to stimulate NTFP production and trade as a diversification strategy (Bognetteau E. et al.,
undated) and to this end to provide training and assistance (technical, financial as for
establishment and provision of tools, and market opportunities) in non-timber forest
product utilization such as bamboo and medicinal plants;
• Technical assistance on credit schemes based on feedbacks from existing microfinance
institutions and the community;
• Exploit new income generating schemes that benefit the local community, especially the
landless households, based on existing conditions and their ranking preferences.
Marginalized groups
To change the inferior position and economic impoverishment of the Manjo and Mano
communities,
• As Gezahegn P., 2001 noted, some Manos are observed to improve their social position
by becoming economically sustainable. Thus it is recommended to assist these vulnerable
Socio-economic report of Bonga, Boginda, Mankira and the surrounding areas
EWNHS 48
social group with economic activity rather than trying to address the social or cultural
issues directly through:
o opening market to their products,
o introducing new low-cost technologies
o supplementing the most impoverished ones with low cost agricultural tools and
oxen for plowing that would gradually leads to an improvement in their economic
positions.
Forest protection
• To support the tree planting schemes in order to reduce the pressure on the natural forest
• To establish appropriate incentive mechanisms through either established or newly set
community groups
At institutional level
Investment
As Dechassa L. et al., 2001 observed that there are cases where the provision of forested
areas for commercial exploitation was effected without consulting the responsible official
experts. Especially when experts are suspected of resisting such projects, they can be by-
passed and the land contracted without their consent, thus there is a need to reinforce
coordination between the agricultural and investment desks (at Zonal and Woreda levels) in
order to enhance:
o Monitoring and evaluation of the existing investment activities in relation to
natural resource conservation
o Impact assessment as to avoid long term damaging implication
o Demarcation of the previously allocated lands
Tourism
• To assist the tourism office in developing tourist attraction places
• To assist in the establishment of the proposed wildlife reserve and/or control hunting
areas
Forest protection
• To support the tree planting schemes in order to reduce the pressure on the natural forests
• To assist the government in reallocation of farmers residing in the forest area
Socio-economic report of Bonga, Boginda, Mankira and the surrounding areas
EWNHS 49
IX. References: Anke Rojahn, 2006. Incentive mechanisms for a sustainable use system of the montane rain
forest in Ethiopia, Dissertation, Berlin.
Aseffa Seyoum, Bezabih Emana and Franz Gatzweiler Belaineh Legesse, Comparative
Analysis of In-situ Conservation Costs of Forest Coffee in Southwestern Ethiopia
Ayelech Araya and Mebrat Jember, 2002. Socio-Economic Study Report For Bonga National
Forest Priority Area, MoA, Addis Abeba
Berhanu Nega, Berhanu Adnew and Samuel GebreSelassie, 2003. Current Land Policy Issues
in Ethiopia. Ethiopian Economic Policy Research Institute, Addis Ababa, Ethiopia
http://www.fao.org/docrep/006/y5026e/y5026e08.htm
Carmen Richerzhagen and Detlef Virchow, 2002. Sustainable Utilization of Crop Genetic
Diversity through Property Rights Mechanisms. The Case of Coffee Genetic
Resources in Ethiopia, paper presented in The Economics of Incentive Mechanisms
for Biodiversity Conservation: Property Rights, BioEcon Workshop
Dechassa Lemessa, Matthew Perault, Brown 2001. Forest fires in Ethiopia: Reflections on
socio-economic and environmental effects of the fires in 2000
EfD, Policies to increase forest cover in Ethiopia, 2008. Proceedings of a Policy Workshop
organized by EEPEE and EDRI, Editors: Jonse Bane, Sisay Nune, Alemu Mekonnen,
Randall Bluffstone Sponsored by (EfD) Initiative at University of Gothenburg,
Sweden
Els Bognetteau, Abebe Haile, K. Freerk Wiersum, undated, Linking Forests and People: A
potential for sustainable development of the South-West Ethiopian Highlands Non-
Timber Forest Products Research & Development Project, South-West Ethiopia
FARM-Africa, . Forest Coffee Baseline Data Study in 3-Woredas of Kaffa Zone
FARM-Africa, Manja and the Bonga forest: A story of successful interaction, case study,
http://www.pfmp-farmsos.org/resources-case-studies-manja.htm, assessed at 02/06/08
Gezahegn Petros, 2001, in Living on the edge, marginalized minorities of craft workers and
hunter in southern Ethiopia Ed. Dena Freeman and Alula Pankhurst, Pp. 81-99.
Department of Sociology and Administration, AAU.
Socio-economic report of Bonga, Boginda, Mankira and the surrounding areas
EWNHS 50
Laurence Philippe, 2003. Dynamics of coffee production systems in Kaffa, a case study from
two villages in Kaffa province of Ethiopia, M.Sc. Thesis, Wageningen University, the
Netherlands
NTFP Research and Development Project in S-W Ethiopia, 2005. Poverty Alleviation
through NTFP Development in S-W Ethiopia: Options for Certification of Coffee and
Honey for Poverty Alleviation and Forest Conservation, student research series No. 2
Wageningen
OINF, 2006. Appraisal report- Jimma Mizan Road Upgrading Project,
Regional Statistical Abstract 2005-06. Bureau of Finance and Economic Development,
Division of Statistics and Population, Awassa, SNNPRS.
Regional Statistical Abstract 2005-06. Department of Finance and Economic Development,
Division of Statistics and Population, Awassa, SNNPRS.
Rene Coste, 1992. Coffee – the plant and the product, CTA, Macmilan publishers.
Stein Holden and Hailu Yohannes, 2001. Land redistribution, tenure insecurity, and intensity
of production: a study of farm households in southern Ethiopia, CAPRi working
paper No. 21, Collective Action and Property Rights Secretariat: International Food
Policy Research Institute, Washington, D.C., U.S.A.
Surendra Kotecha, 2007. Arabicas from the Garden of Eden: Coffea Aethiopica - Speciality
Coffee Association Europe Arabicas from the Garden of Eden
Taye Bekele, 2003. the potential of Bonga forest for certification, a case study, paper
prepared for the National Stakeholders Workshop on Forest Certification, Organized
by Institute of Biodiversity Conservation (IBC), FARM Africa and SOS Sahel, 25-26
August, Addis Ababa, Ethiopia.
Till Stellmacher, 2005. Institutional Factors shaping Coffee Forest Management in Ethiopia.
The Case of Bonga Forest, Kaffa Zone. Conference Paper, International Trade and
the Protection of Natural Resources in Ethiopia, German Ethiopian Association,
Berlin
UNESCO, 2004. Man and the Biosphere (MAB) Programme - Biosphere reserve nomination
form, Paris, France.
WBISPP, 2001. Report on natural grazing lands and livestock feed resources: SNNPRS,
Addis Ababa
Socio-economic report of Bonga, Boginda, Mankira and the surrounding areas
EWNHS 51
WBISPP, 2001. SNNPRS - a strategic plan for the sustainable development, conservation,
and management of the woody biomass resources, final report, Addis Abeba
Yihenew Zewde, 2003. Forest access: policy and reality in Kaffa, Ethiopia, Leisa
Socio-economic report of Bonga, Boginda, Mankira and the surrounding areas
EWNHS 52
A N N E X E S
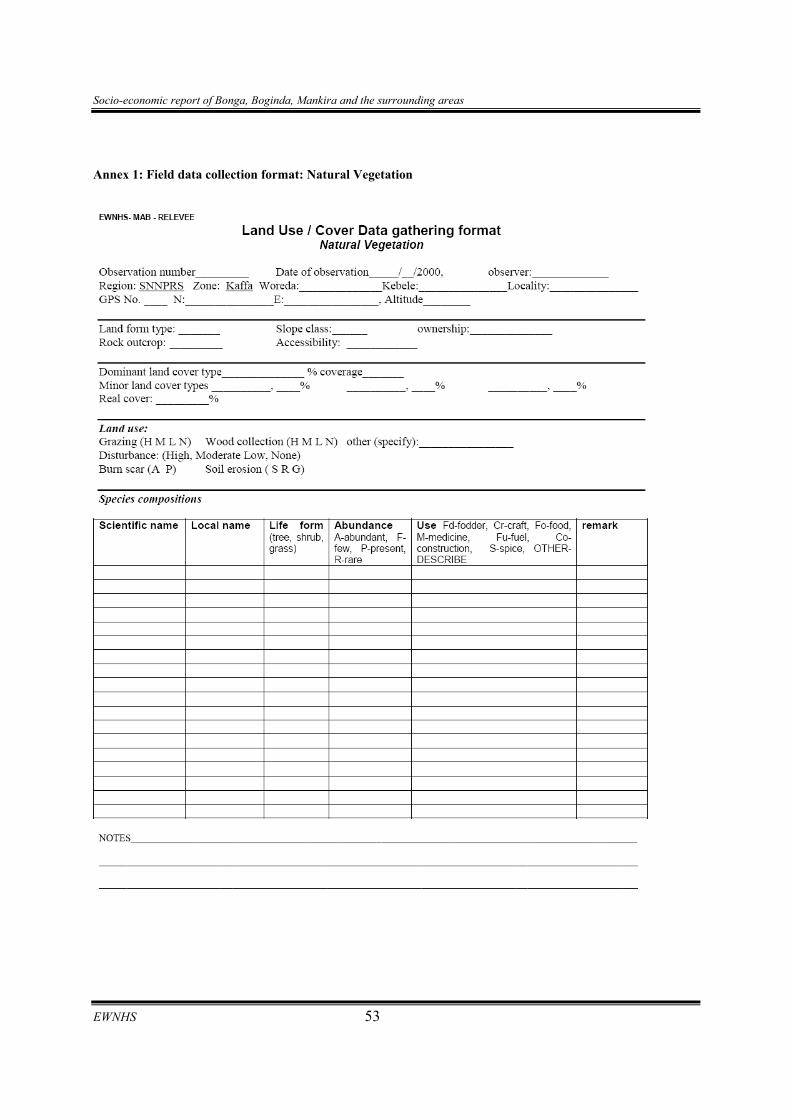
Socio-economic report of Bonga, Boginda, Mankira and the surrounding areas
EWNHS 53
Annex 1: Field data collection format: Natural Vegetation
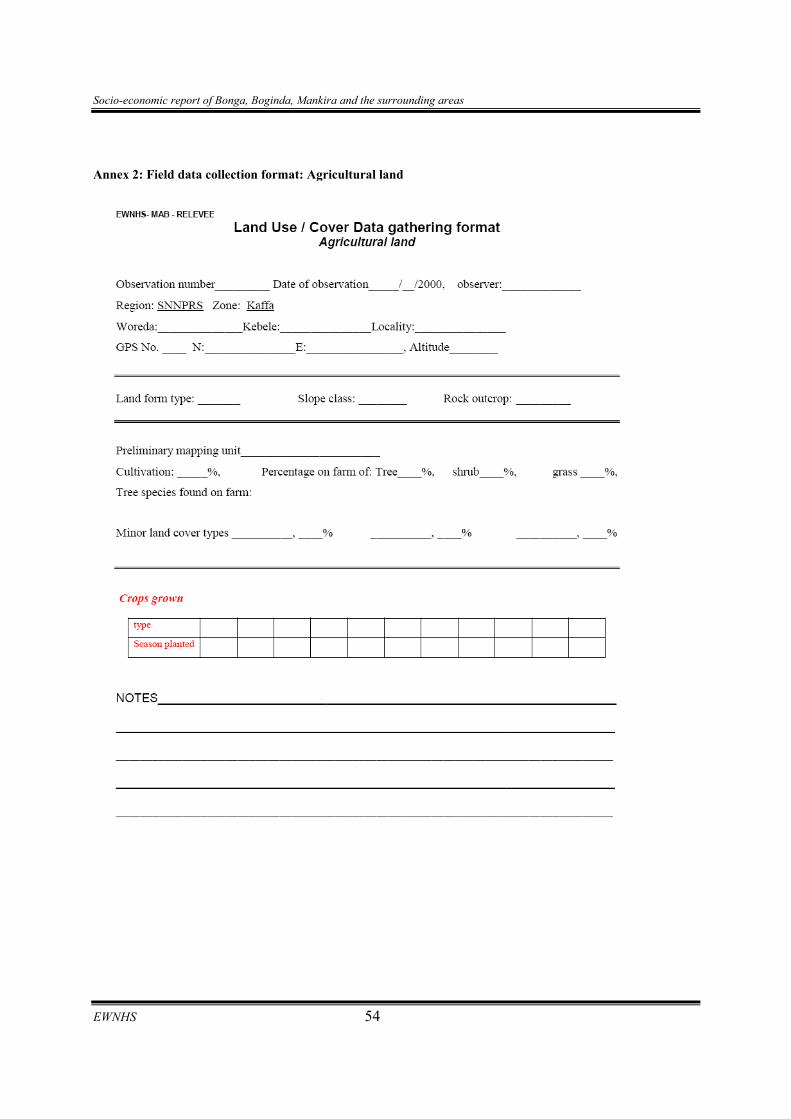
Socio-economic report of Bonga, Boginda, Mankira and the surrounding areas
EWNHS 54
Annex 2: Field data collection format: Agricultural land
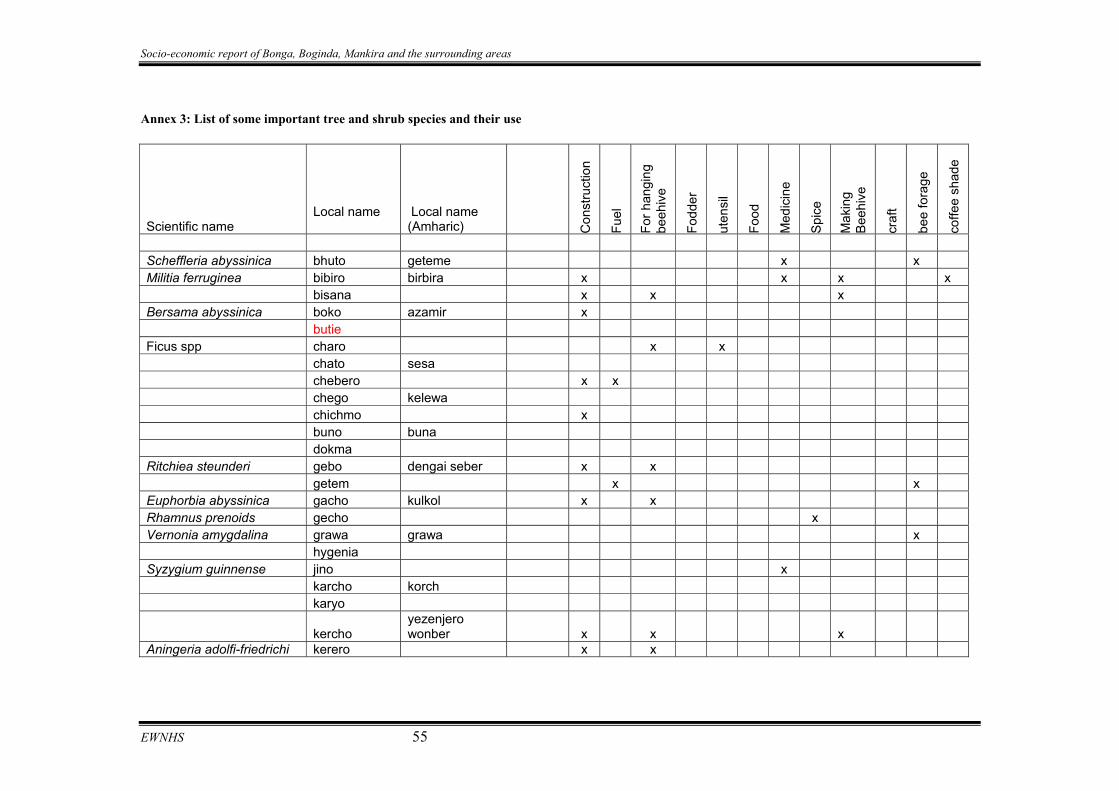
Socio-economic report of Bonga, Boginda, Mankira and the surrounding areas
EWNHS 55
Annex 3: List of some important tree and shrub species and their use
Scientific name Local name
Local name (Amharic) C
onst
ruct
ion
Fuel
For h
angi
ng
beeh
ive
Fodd
er
uten
sil
Food
Med
icin
e
Spic
e
Mak
ing
Beeh
ive
craf
t
bee
fora
ge
coffe
e sh
ade
Scheffleria abyssinica bhuto geteme x x Militia ferruginea bibiro birbira x x x x bisana x x x Bersama abyssinica boko azamir x butie Ficus spp charo x x chato sesa chebero x x chego kelewa chichmo x buno buna dokma Ritchiea steunderi gebo dengai seber x x getem x x Euphorbia abyssinica gacho kulkol x x Rhamnus prenoids gecho x Vernonia amygdalina grawa grawa x hygenia Syzygium guinnense jino x karcho korch karyo
kercho yezenjero wonber x x x
Aningeria adolfi-friedrichi kerero x x
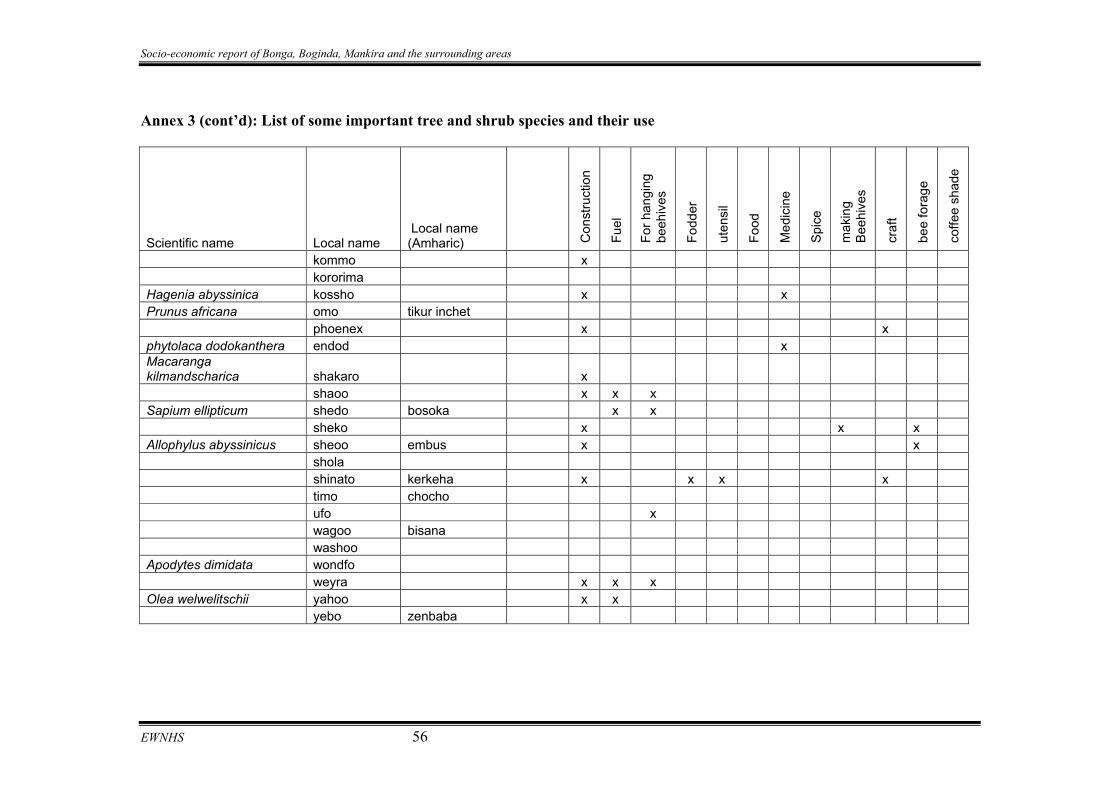
Socio-economic report of Bonga, Boginda, Mankira and the surrounding areas
EWNHS 56
Annex 3 (cont’d): List of some important tree and shrub species and their use
Scientific name Local name Local name (Amharic) C
onst
ruct
ion
Fuel
For h
angi
ng
beeh
ives
Fodd
er
uten
sil
Food
Med
icin
e
Spi
ce
mak
ing
Beeh
ives
craf
t
bee
fora
ge
coffe
e sh
ade
kommo x kororima Hagenia abyssinica kossho x x Prunus africana omo tikur inchet phoenex x x phytolaca dodokanthera endod x Macaranga kilmandscharica shakaro x shaoo x x x Sapium ellipticum shedo bosoka x x sheko x x x Allophylus abyssinicus sheoo embus x x shola shinato kerkeha x x x x timo chocho ufo x wagoo bisana washoo Apodytes dimidata wondfo weyra x x x Olea welwelitschii yahoo x x yebo zenbaba
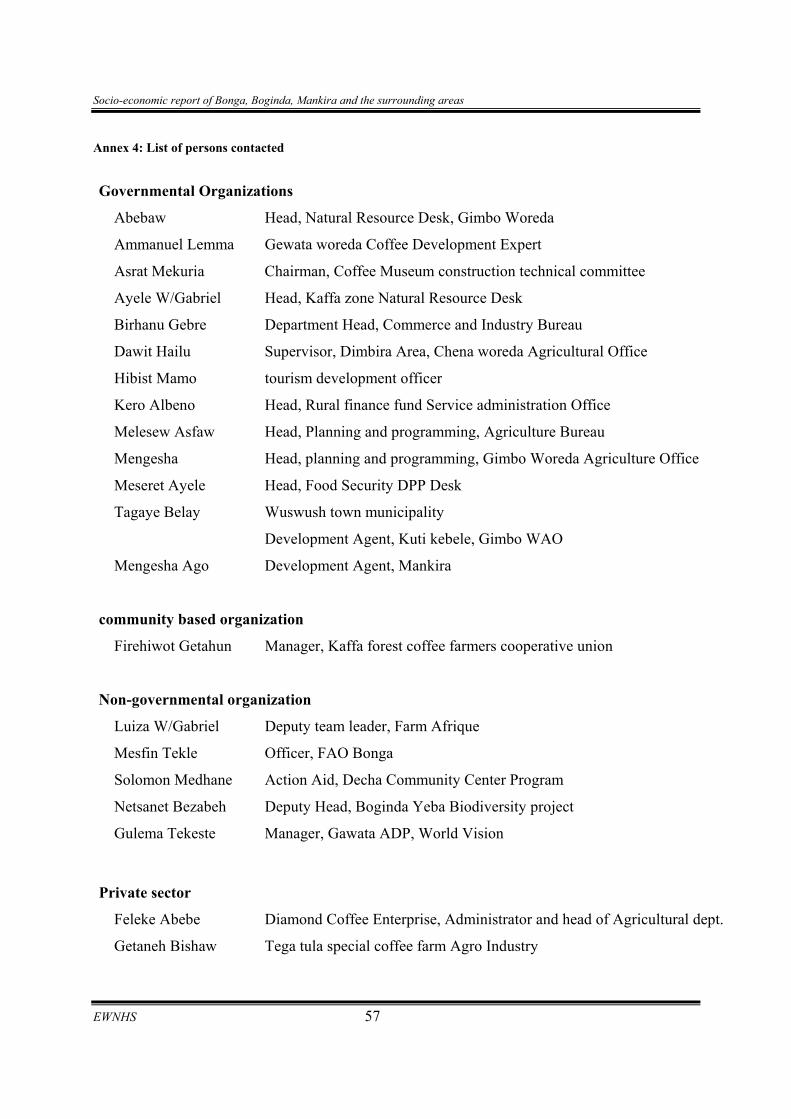
Socio-economic report of Bonga, Boginda, Mankira and the surrounding areas
EWNHS 57
Annex 4: List of persons contacted
Governmental Organizations
Abebaw Head, Natural Resource Desk, Gimbo Woreda
Ammanuel Lemma Gewata woreda Coffee Development Expert
Asrat Mekuria Chairman, Coffee Museum construction technical committee
Ayele W/Gabriel Head, Kaffa zone Natural Resource Desk
Birhanu Gebre Department Head, Commerce and Industry Bureau
Dawit Hailu Supervisor, Dimbira Area, Chena woreda Agricultural Office
Hibist Mamo tourism development officer
Kero Albeno Head, Rural finance fund Service administration Office
Melesew Asfaw Head, Planning and programming, Agriculture Bureau
Mengesha Head, planning and programming, Gimbo Woreda Agriculture Office
Meseret Ayele Head, Food Security DPP Desk
Tagaye Belay Wuswush town municipality
Development Agent, Kuti kebele, Gimbo WAO
Mengesha Ago Development Agent, Mankira
community based organization
Firehiwot Getahun Manager, Kaffa forest coffee farmers cooperative union
Non-governmental organization
Luiza W/Gabriel Deputy team leader, Farm Afrique
Mesfin Tekle Officer, FAO Bonga
Solomon Medhane Action Aid, Decha Community Center Program
Netsanet Bezabeh Deputy Head, Boginda Yeba Biodiversity project
Gulema Tekeste Manager, Gawata ADP, World Vision
Private sector
Feleke Abebe Diamond Coffee Enterprise, Administrator and head of Agricultural dept.
Getaneh Bishaw Tega tula special coffee farm Agro Industry
Socio-economic report of Bonga, Boginda, Mankira and the surrounding areas
EWNHS 58
Tesfaye G/Meskel Planning and programming head, Wushwush Tea Development
Research Organization / Researchers
Getu Haile Bonga Agricultural Research Center
Sayuri Yoshida Ph.D. student
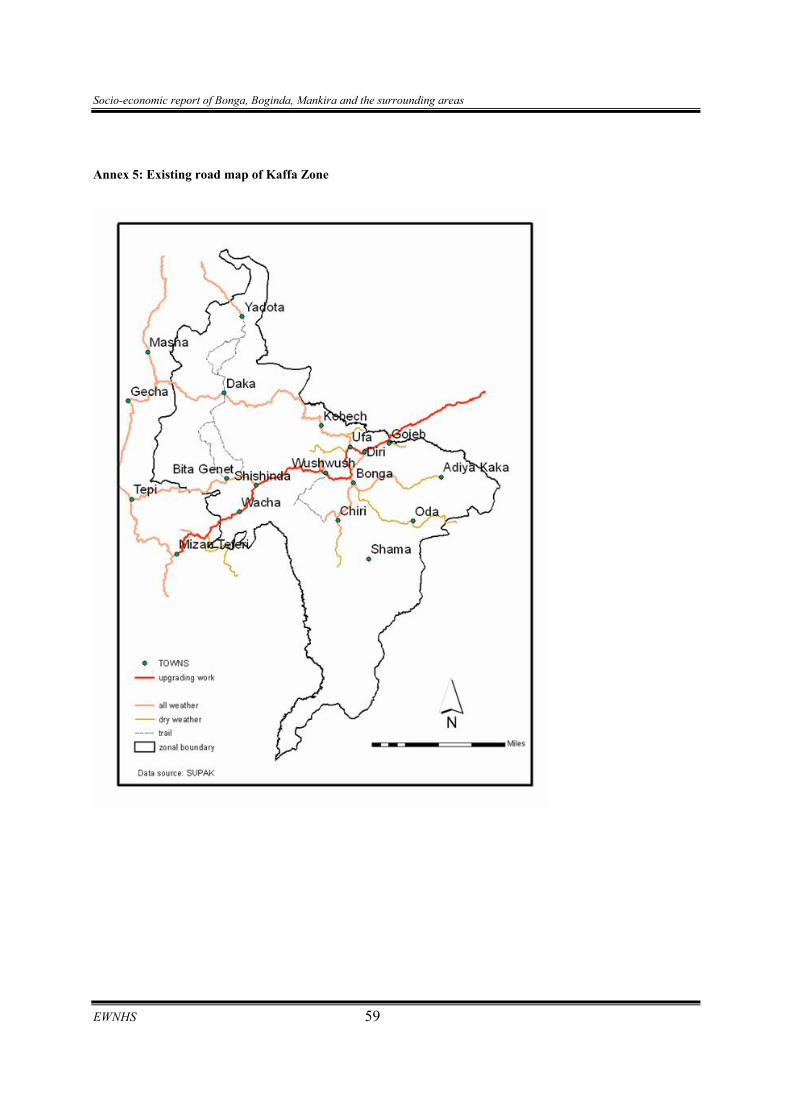
Socio-economic report of Bonga, Boginda, Mankira and the surrounding areas
EWNHS 59
Annex 5: Existing road map of Kaffa Zone
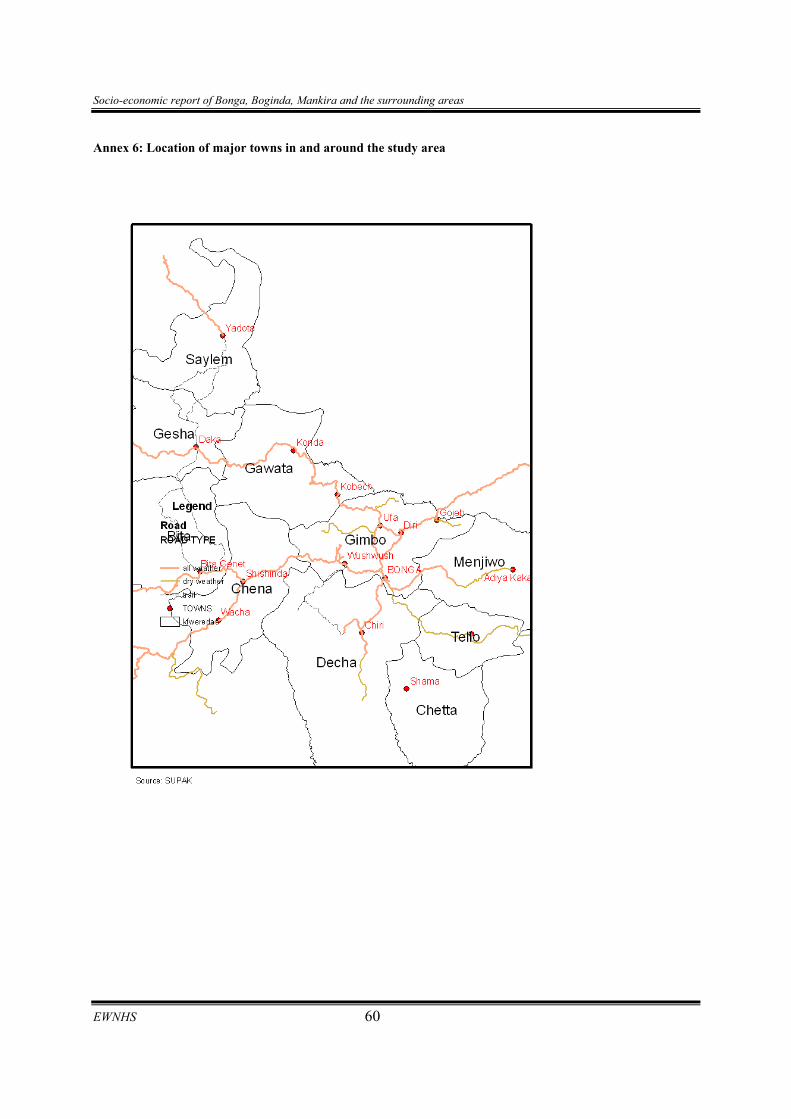
Socio-economic report of Bonga, Boginda, Mankira and the surrounding areas
EWNHS 60
Annex 6: Location of major towns in and around the study area
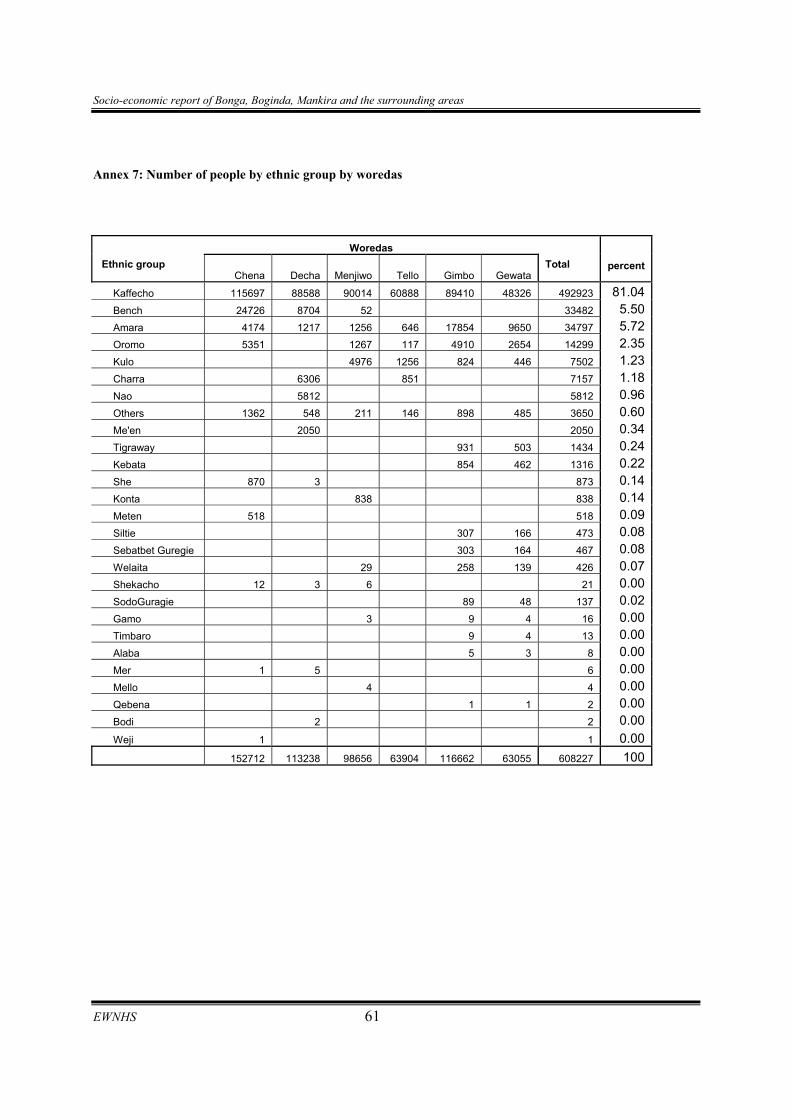
Socio-economic report of Bonga, Boginda, Mankira and the surrounding areas
EWNHS 61
Annex 7: Number of people by ethnic group by woredas
Woredas Ethnic group
Chena Decha Menjiwo Tello Gimbo Gewata
Total
percent
Kaffecho 115697 88588 90014 60888 89410 48326 492923 81.04 Bench 24726 8704 52 33482 5.50 Amara 4174 1217 1256 646 17854 9650 34797 5.72 Oromo 5351 1267 117 4910 2654 14299 2.35 Kulo 4976 1256 824 446 7502 1.23 Charra 6306 851 7157 1.18 Nao 5812 5812 0.96 Others 1362 548 211 146 898 485 3650 0.60 Me'en 2050 2050 0.34 Tigraway 931 503 1434 0.24 Kebata 854 462 1316 0.22 She 870 3 873 0.14 Konta 838 838 0.14 Meten 518 518 0.09 Siltie 307 166 473 0.08 Sebatbet Guregie 303 164 467 0.08 Welaita 29 258 139 426 0.07 Shekacho 12 3 6 21 0.00 SodoGuragie 89 48 137 0.02 Gamo 3 9 4 16 0.00 Timbaro 9 4 13 0.00 Alaba 5 3 8 0.00 Mer 1 5 6 0.00 Mello 4 4 0.00 Qebena 1 1 2 0.00 Bodi 2 2 0.00 Weji 1 1 0.00 152712 113238 98656 63904 116662 63055 608227 100
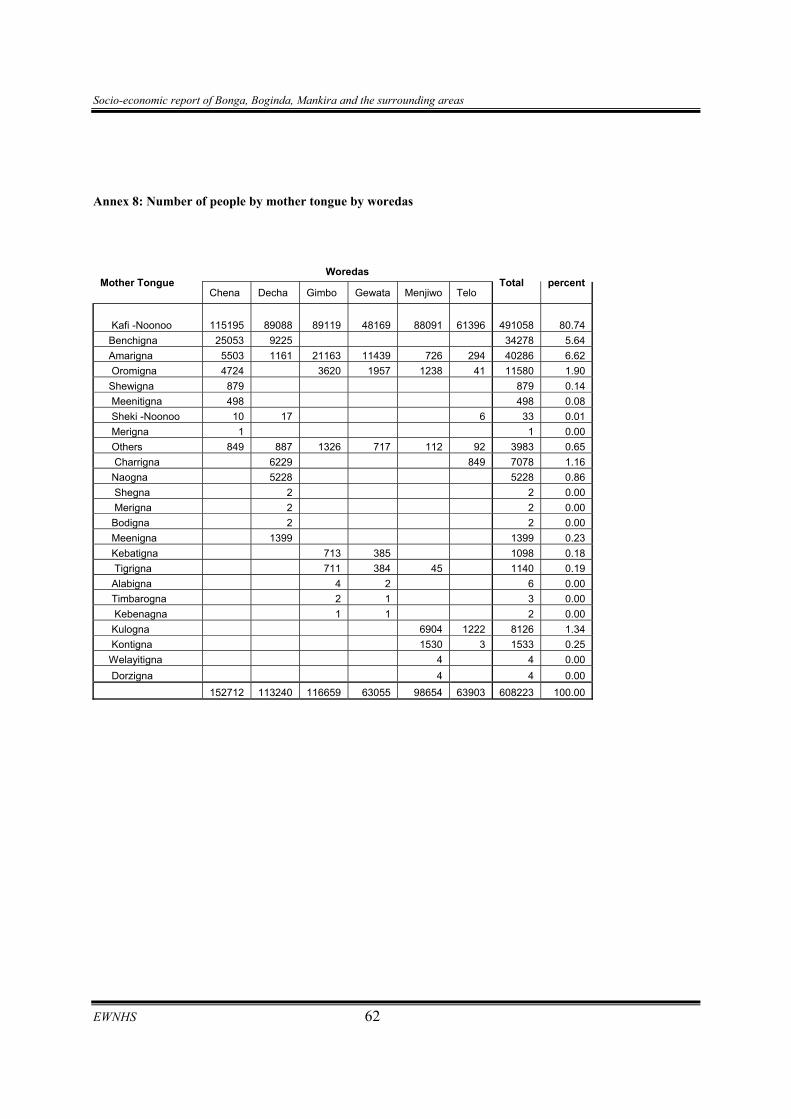
Socio-economic report of Bonga, Boginda, Mankira and the surrounding areas
EWNHS 62
Annex 8: Number of people by mother tongue by woredas
Woredas Mother Tongue
Chena Decha Gimbo Gewata Menjiwo Telo Total percent
Kafi -Noonoo 115195 89088 89119 48169 88091 61396 491058 80.74 Benchigna 25053 9225 34278 5.64 Amarigna 5503 1161 21163 11439 726 294 40286 6.62 Oromigna 4724 3620 1957 1238 41 11580 1.90 Shewigna 879 879 0.14 Meenitigna 498 498 0.08 Sheki -Noonoo 10 17 6 33 0.01 Merigna 1 1 0.00 Others 849 887 1326 717 112 92 3983 0.65 Charrigna 6229 849 7078 1.16 Naogna 5228 5228 0.86 Shegna 2 2 0.00 Merigna 2 2 0.00 Bodigna 2 2 0.00 Meenigna 1399 1399 0.23 Kebatigna 713 385 1098 0.18 Tigrigna 711 384 45 1140 0.19 Alabigna 4 2 6 0.00 Timbarogna 2 1 3 0.00 Kebenagna 1 1 2 0.00 Kulogna 6904 1222 8126 1.34 Kontigna 1530 3 1533 0.25 Welayitigna 4 4 0.00 Dorzigna 4 4 0.00 152712 113240 116659 63055 98654 63903 608223 100.00
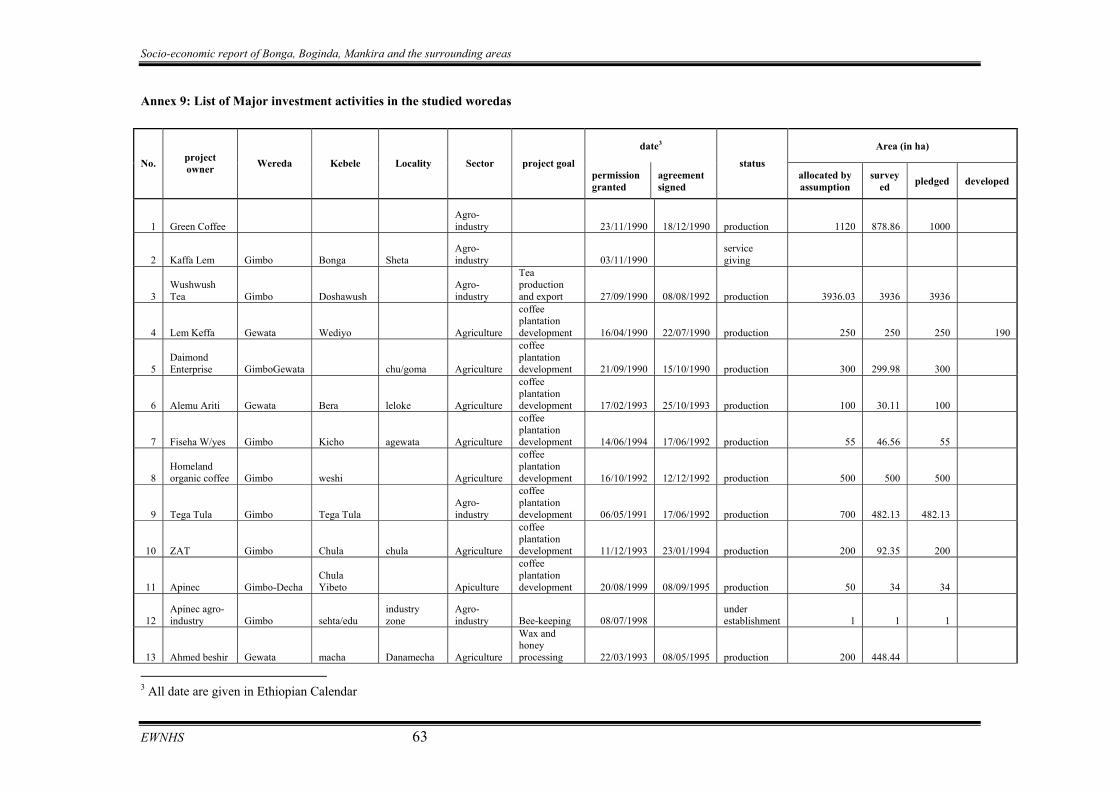
Socio-economic report of Bonga, Boginda, Mankira and the surrounding areas
EWNHS 63
Annex 9: List of Major investment activities in the studied woredas
3 All date are given in Ethiopian Calendar
date3 Area (in ha)
No. project owner Wereda Kebele Locality Sector project goal
permission granted
agreement signed
status allocated by assumption
surveyed pledged developed
1 Green Coffee Agro-industry 23/11/1990 18/12/1990 production 1120 878.86 1000
2 Kaffa Lem Gimbo Bonga Sheta Agro-industry 03/11/1990
service giving
3 Wushwush Tea Gimbo Doshawush
Agro-industry
Tea production and export 27/09/1990 08/08/1992 production 3936.03 3936 3936
4 Lem Keffa Gewata Wediyo Agriculture
coffee plantation development 16/04/1990 22/07/1990 production 250 250 250 190
5 Daimond Enterprise GimboGewata chu/goma Agriculture
coffee plantation development 21/09/1990 15/10/1990 production 300 299.98 300
6 Alemu Ariti Gewata Bera leloke Agriculture
coffee plantation development 17/02/1993 25/10/1993 production 100 30.11 100
7 Fiseha W/yes Gimbo Kicho agewata Agriculture
coffee plantation development 14/06/1994 17/06/1992 production 55 46.56 55
8 Homeland organic coffee Gimbo weshi Agriculture
coffee plantation development 16/10/1992 12/12/1992 production 500 500 500
9 Tega Tula Gimbo Tega Tula Agro-industry
coffee plantation development 06/05/1991 17/06/1992 production 700 482.13 482.13
10 ZAT Gimbo Chula chula Agriculture
coffee plantation development 11/12/1993 23/01/1994 production 200 92.35 200
11 Apinec Gimbo-Decha Chula Yibeto Apiculture
coffee plantation development 20/08/1999 08/09/1995 production 50 34 34
12 Apinec agro-industry Gimbo sehta/edu
industry zone
Agro-industry Bee-keeping 08/07/1998
under establishment 1 1 1
13 Ahmed beshir Gewata macha Danamecha Agriculture
Wax and honey processing 22/03/1993 08/05/1995 production 200 448.44
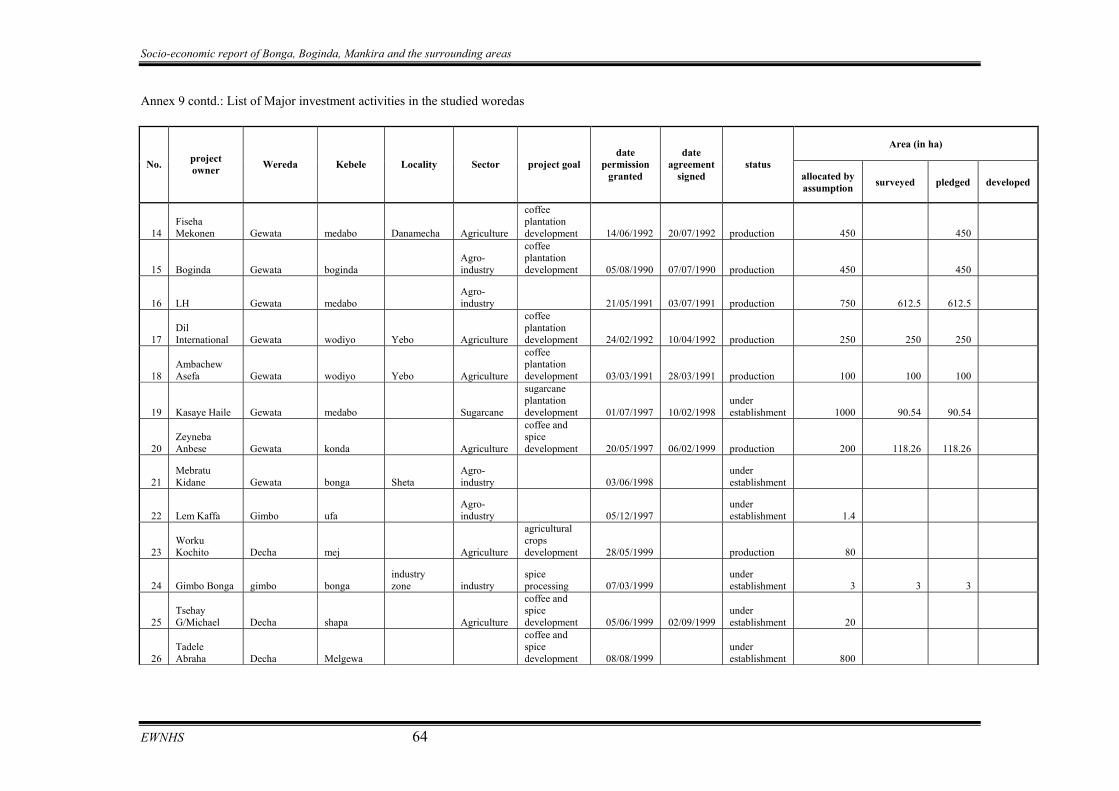
Socio-economic report of Bonga, Boginda, Mankira and the surrounding areas
EWNHS 64
Annex 9 contd.: List of Major investment activities in the studied woredas
Area (in ha)
No. project owner Wereda Kebele Locality Sector project goal
date permission
granted
date agreement
signed status
allocated by assumption surveyed pledged developed
14 Fiseha Mekonen Gewata medabo Danamecha Agriculture
coffee plantation development 14/06/1992 20/07/1992 production 450 450
15 Boginda Gewata boginda Agro-industry
coffee plantation development 05/08/1990 07/07/1990 production 450 450
16 LH Gewata medabo Agro-industry 21/05/1991 03/07/1991 production 750 612.5 612.5
17 Dil International Gewata wodiyo Yebo Agriculture
coffee plantation development 24/02/1992 10/04/1992 production 250 250 250
18 Ambachew Asefa Gewata wodiyo Yebo Agriculture
coffee plantation development 03/03/1991 28/03/1991 production 100 100 100
19 Kasaye Haile Gewata medabo Sugarcane
sugarcane plantation development 01/07/1997 10/02/1998
under establishment 1000 90.54 90.54
20 Zeyneba Anbese Gewata konda Agriculture
coffee and spice development 20/05/1997 06/02/1999 production 200 118.26 118.26
21 Mebratu Kidane Gewata bonga Sheta
Agro-industry 03/06/1998
under establishment
22 Lem Kaffa Gimbo ufa Agro-industry 05/12/1997
under establishment 1.4
23 Worku Kochito Decha mej Agriculture
agricultural crops development 28/05/1999 production 80
24 Gimbo Bonga gimbo bonga industry zone industry
spice processing 07/03/1999
under establishment 3 3 3
25 Tsehay G/Michael Decha shapa Agriculture
coffee and spice development 05/06/1999 02/09/1999
under establishment 20
26 Tadele Abraha Decha Melgewa
coffee and spice development 08/08/1999
under establishment 800
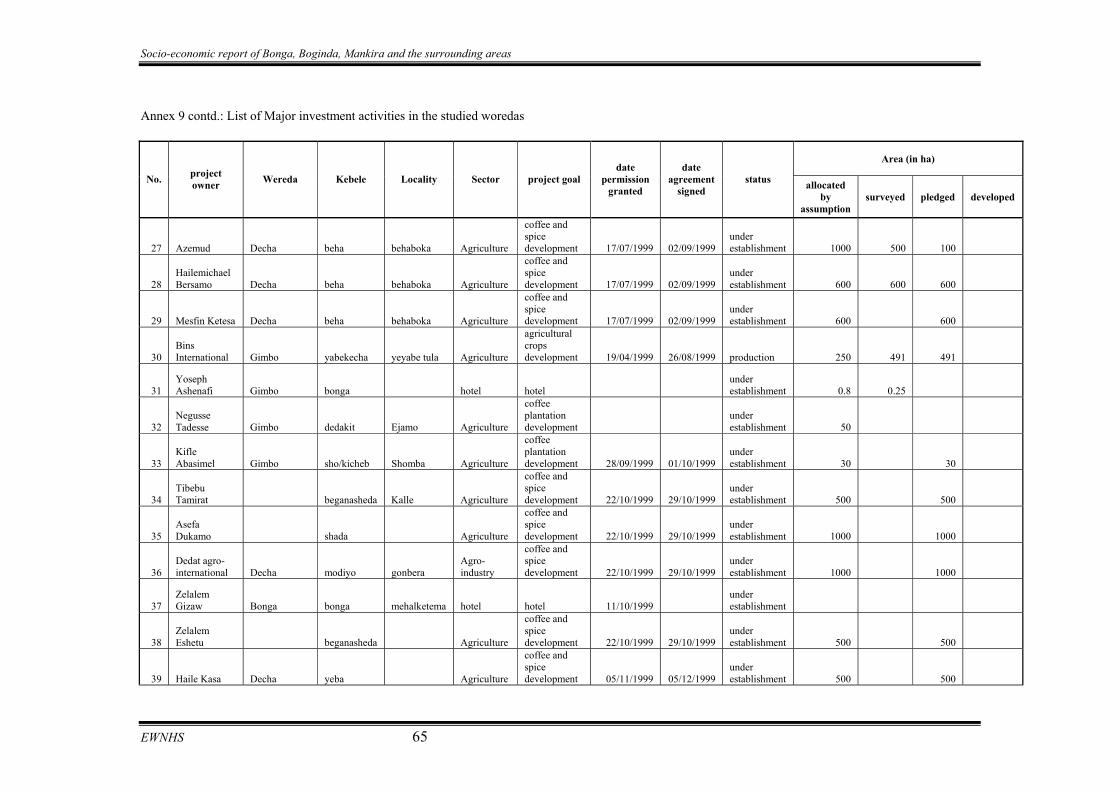
Socio-economic report of Bonga, Boginda, Mankira and the surrounding areas
EWNHS 65
Annex 9 contd.: List of Major investment activities in the studied woredas
Area (in ha)
No. project owner Wereda Kebele Locality Sector project goal
date permission
granted
date agreement
signed status allocated
by assumption
surveyed pledged developed
27 Azemud Decha beha behaboka Agriculture
coffee and spice development 17/07/1999 02/09/1999
under establishment 1000 500 100
28 Hailemichael Bersamo Decha beha behaboka Agriculture
coffee and spice development 17/07/1999 02/09/1999
under establishment 600 600 600
29 Mesfin Ketesa Decha beha behaboka Agriculture
coffee and spice development 17/07/1999 02/09/1999
under establishment 600 600
30 Bins International Gimbo yabekecha yeyabe tula Agriculture
agricultural crops development 19/04/1999 26/08/1999 production 250 491 491
31 Yoseph Ashenafi Gimbo bonga hotel hotel
under establishment 0.8 0.25
32 Negusse Tadesse Gimbo dedakit Ejamo Agriculture
coffee plantation development
under establishment 50
33 Kifle Abasimel Gimbo sho/kicheb Shomba Agriculture
coffee plantation development 28/09/1999 01/10/1999
under establishment 30 30
34 Tibebu Tamirat beganasheda Kalle Agriculture
coffee and spice development 22/10/1999 29/10/1999
under establishment 500 500
35 Asefa Dukamo shada Agriculture
coffee and spice development 22/10/1999 29/10/1999
under establishment 1000 1000
36 Dedat agro-international Decha modiyo gonbera
Agro-industry
coffee and spice development 22/10/1999 29/10/1999
under establishment 1000 1000
37 Zelalem Gizaw Bonga bonga mehalketema hotel hotel 11/10/1999
under establishment
38 Zelalem Eshetu beganasheda Agriculture
coffee and spice development 22/10/1999 29/10/1999
under establishment 500 500
39 Haile Kasa Decha yeba Agriculture
coffee and spice development 05/11/1999 05/12/1999
under establishment 500 500
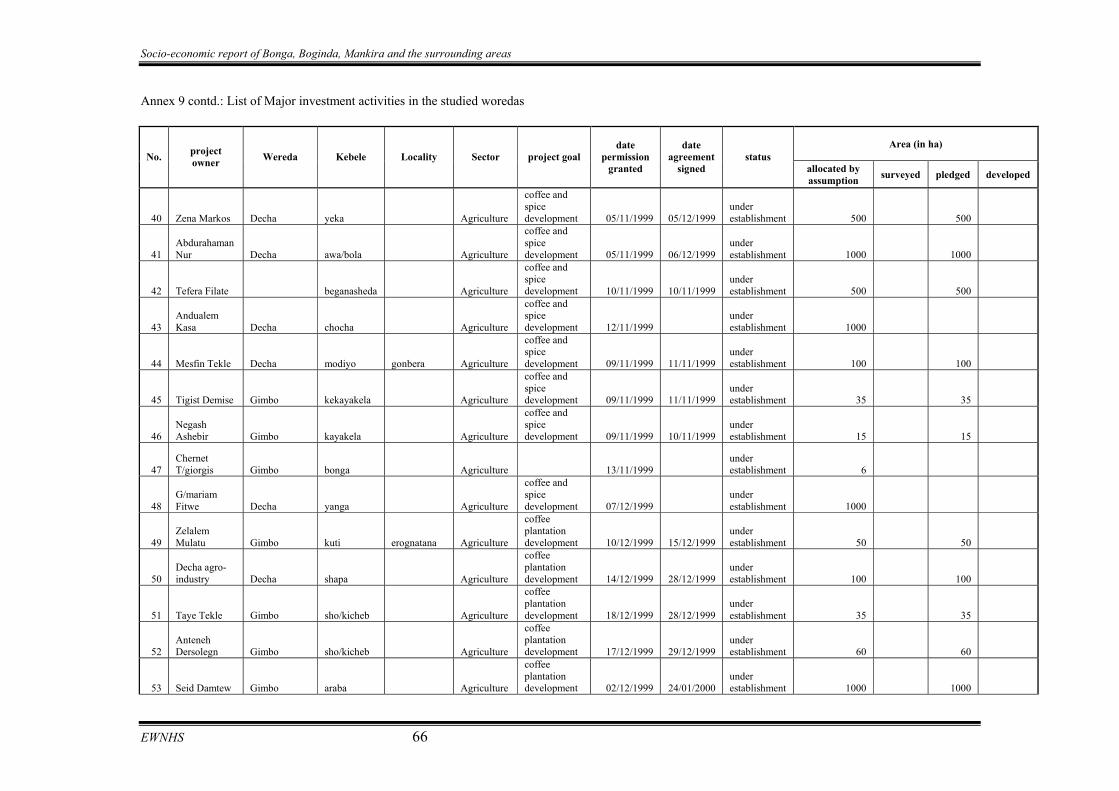
Socio-economic report of Bonga, Boginda, Mankira and the surrounding areas
EWNHS 66
Annex 9 contd.: List of Major investment activities in the studied woredas
Area (in ha) No. project
owner Wereda Kebele Locality Sector project goal date
permission granted
date agreement
signed status
allocated by assumption surveyed pledged developed
40 Zena Markos Decha yeka Agriculture
coffee and spice development 05/11/1999 05/12/1999
under establishment 500 500
41 Abdurahaman Nur Decha awa/bola Agriculture
coffee and spice development 05/11/1999 06/12/1999
under establishment 1000 1000
42 Tefera Filate beganasheda Agriculture
coffee and spice development 10/11/1999 10/11/1999
under establishment 500 500
43 Andualem Kasa Decha chocha Agriculture
coffee and spice development 12/11/1999
under establishment 1000
44 Mesfin Tekle Decha modiyo gonbera Agriculture
coffee and spice development 09/11/1999 11/11/1999
under establishment 100 100
45 Tigist Demise Gimbo kekayakela Agriculture
coffee and spice development 09/11/1999 11/11/1999
under establishment 35 35
46 Negash Ashebir Gimbo kayakela Agriculture
coffee and spice development 09/11/1999 10/11/1999
under establishment 15 15
47 Chernet T/giorgis Gimbo bonga Agriculture 13/11/1999
under establishment 6
48 G/mariam Fitwe Decha yanga Agriculture
coffee and spice development 07/12/1999
under establishment 1000
49 Zelalem Mulatu Gimbo kuti erognatana Agriculture
coffee plantation development 10/12/1999 15/12/1999
under establishment 50 50
50 Decha agro-industry Decha shapa Agriculture
coffee plantation development 14/12/1999 28/12/1999
under establishment 100 100
51 Taye Tekle Gimbo sho/kicheb Agriculture
coffee plantation development 18/12/1999 28/12/1999
under establishment 35 35
52 Anteneh Dersolegn Gimbo sho/kicheb Agriculture
coffee plantation development 17/12/1999 29/12/1999
under establishment 60 60
53 Seid Damtew Gimbo araba Agriculture
coffee plantation development 02/12/1999 24/01/2000
under establishment 1000 1000
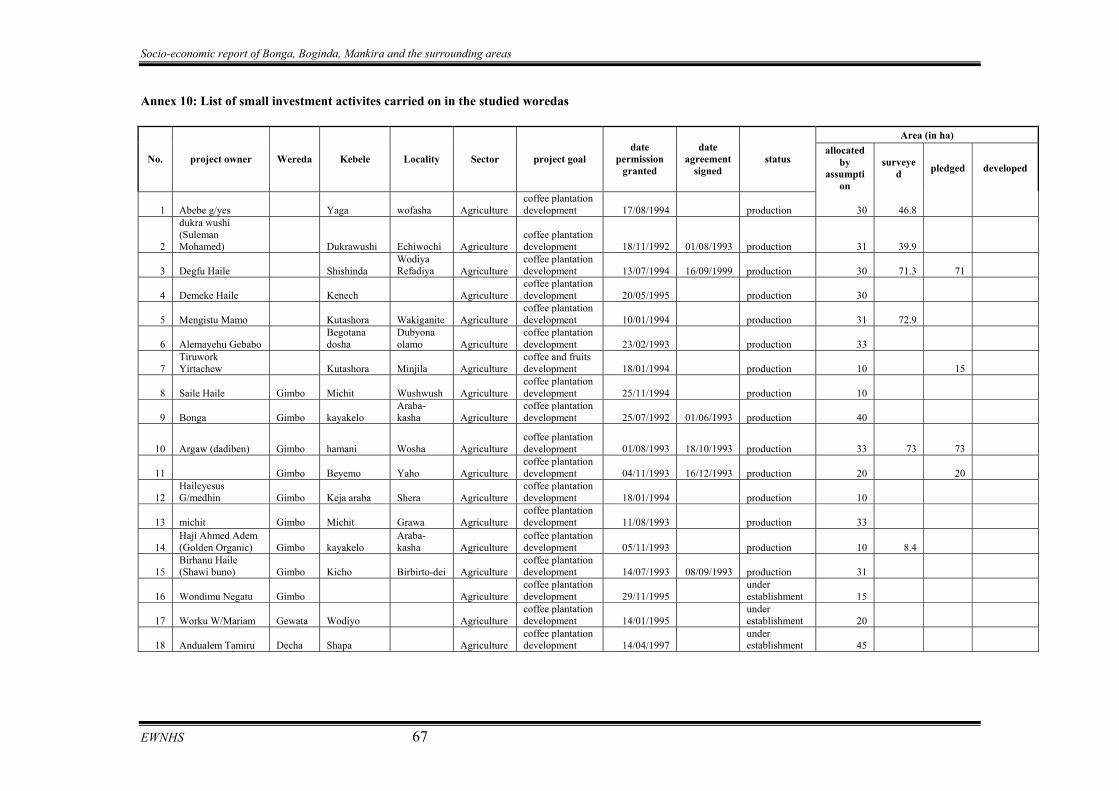
Socio-economic report of Bonga, Boginda, Mankira and the surrounding areas
EWNHS 67
Annex 10: List of small investment activites carried on in the studied woredas
Area (in ha)
No. project owner Wereda Kebele Locality Sector project goal date
permission granted
date agreement
signed status
allocated by
assumption
surveyed pledged developed
1 Abebe g/yes Yaga wofasha Agriculture coffee plantation development 17/08/1994 production 30 46.8
2
dukra wushi (Suleman Mohamed) Dukrawushi Echiwochi Agriculture
coffee plantation development 18/11/1992 01/08/1993 production 31 39.9
3 Degfu Haile Shishinda Wodiya Refadiya Agriculture
coffee plantation development 13/07/1994 16/09/1999 production 30 71.3 71
4 Demeke Haile Kenech Agriculture coffee plantation development 20/05/1995 production 30
5 Mengistu Mamo Kutashora Wakiganite Agriculture coffee plantation development 10/01/1994 production 31 72.9
6 Alemayehu Gebabo Begotana dosha
Dubyona olamo Agriculture
coffee plantation development 23/02/1993 production 33
7 Tiruwork Yirtachew Kutashora Minjila Agriculture
coffee and fruits development 18/01/1994 production 10 15
8 Saile Haile Gimbo Michit Wushwush Agriculture coffee plantation development 25/11/1994 production 10
9 Bonga Gimbo kayakelo Araba-kasha Agriculture
coffee plantation development 25/07/1992 01/06/1993 production 40
10 Argaw (dadiben) Gimbo hamani Wosha Agriculture coffee plantation development 01/08/1993 18/10/1993 production 33 73 73
11 Gimbo Beyemo Yaho Agriculture coffee plantation development 04/11/1993 16/12/1993 production 20 20
12 Haileyesus G/medhin Gimbo Keja araba Shera Agriculture
coffee plantation development 18/01/1994 production 10
13 michit Gimbo Michit Grawa Agriculture coffee plantation development 11/08/1993 production 33
14 Haji Ahmed Adem (Golden Organic) Gimbo kayakelo
Araba-kasha Agriculture
coffee plantation development 05/11/1993 production 10 8.4
15 Birhanu Haile (Shawi buno) Gimbo Kicho Birbirto-dei Agriculture
coffee plantation development 14/07/1993 08/09/1993 production 31
16 Wondimu Negatu Gimbo Agriculture coffee plantation development 29/11/1995
under establishment 15
17 Worku W/Mariam Gewata Wodiyo Agriculture coffee plantation development 14/01/1995
under establishment 20
18 Andualem Tamiru Decha Shapa Agriculture coffee plantation development 14/04/1997
under establishment 45
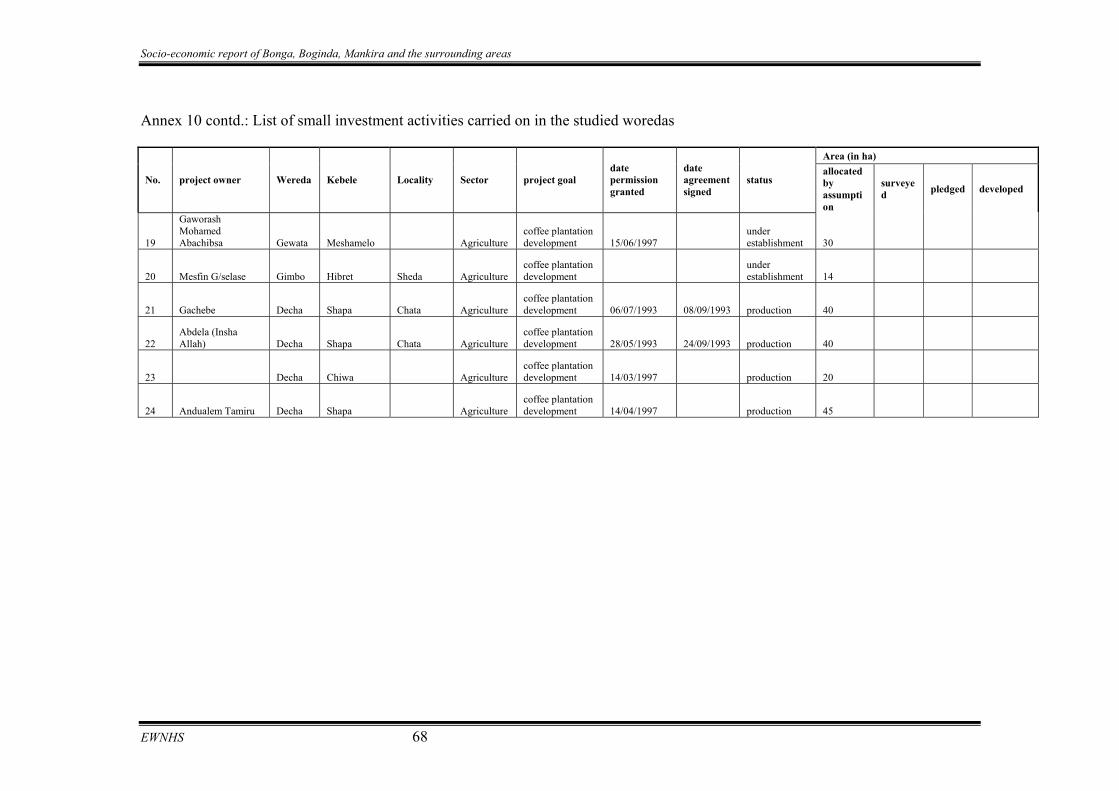
Socio-economic report of Bonga, Boginda, Mankira and the surrounding areas
EWNHS 68
Annex 10 contd.: List of small investment activities carried on in the studied woredas
Area (in ha)
No. project owner Wereda Kebele Locality Sector project goal date permission granted
date agreement signed
status allocated by assumption
surveyed pledged developed
19
Gaworash Mohamed Abachibsa Gewata Meshamelo Agriculture
coffee plantation development 15/06/1997
under establishment 30
20 Mesfin G/selase Gimbo Hibret Sheda Agriculture coffee plantation development
under establishment 14
21 Gachebe Decha Shapa Chata Agriculture coffee plantation development 06/07/1993 08/09/1993 production 40
22 Abdela (Insha Allah) Decha Shapa Chata Agriculture
coffee plantation development 28/05/1993 24/09/1993 production 40
23 Decha Chiwa Agriculture coffee plantation development 14/03/1997 production 20
24 Andualem Tamiru Decha Shapa Agriculture coffee plantation development 14/04/1997 production 45
Socio-economic report of Bonga, Boginda, Mankira and the surrounding areas
EWNHS 69
Annex 11: List of ongoing and completed research works OOnnggooiinngg Bonga research Center:
Animal science division
- Four different studies on bee, beehives and quality of honey
- Socio-economic survey on sheko breeds
- Participatory indigenous sheep breed improvement
- Adaptation of different fodder spp.
Socio economics division
- Identifying agro-ecology based farming system on selected woredas of Kaffa zone
Research extension division
- Evaluation of extension system at Kaffa and Bench-maji zone
Natural resource division
- Participatory Selection of multipurpose fodder grass in Gimbo woreda,
CCoommpplleetteedd
Kumelachew Yeshitela and Simon Shibru, Year. floristic composition and phytogeographic
comparison of moist montane forests of southwest Ethiopia
Feyera Senbeta, 2002. Patterns of floristic diversity and distribution in montane rainforests
with occurrences of wild Coffea arabica L. populations in Ethiopia , PhD Thesis
Proposal Center for Development Research (ZEF), Bonn,
Dereje Tadesse, 2007. Forest cover change and socio-economic drivers in south west
Ethiopia, M.Sc. Thesis, München.
Yoseph Amaha et.al., 2006.Survey on Identification of Fast Growing Shade Tree Species for
the Production of Coffea arabica L. JARC
Adugna Debela, 2007. Physiological effect of Shade on growth and production of Organic
Coffee in Ethiopia Wageningen University, The Netherlands.
JARC, 2006. Assessment of Non-Timber Forest Products (NTFPs) and Their Socioeconomic
Significance for Sustainable Natural Forest Management in Illubabor Zone
SUPAK-S, 2000. Natural Resource under threat
Socio-economic report of Bonga, Boginda, Mankira and the surrounding areas
EWNHS 70
Mesfin T., 1999. Land tenure and its impact on land resource utilization in Kaffa-Sheka
administration zone (SW Ethiopia), Enschede, The Netherlands
Gezahegne P., 1996. Land tenure and natural resource management in Bonga forest, SW
Ethiopia – the case of Kafficho and Manjo, A.A, Ethiopia
Admassu Alemayehu D., 2003. “Assessment of the effectiveness of soil and water
conservation measures: a case study in Kaffa, Ethiopian highlands” Wageningen, The
Netherlands.
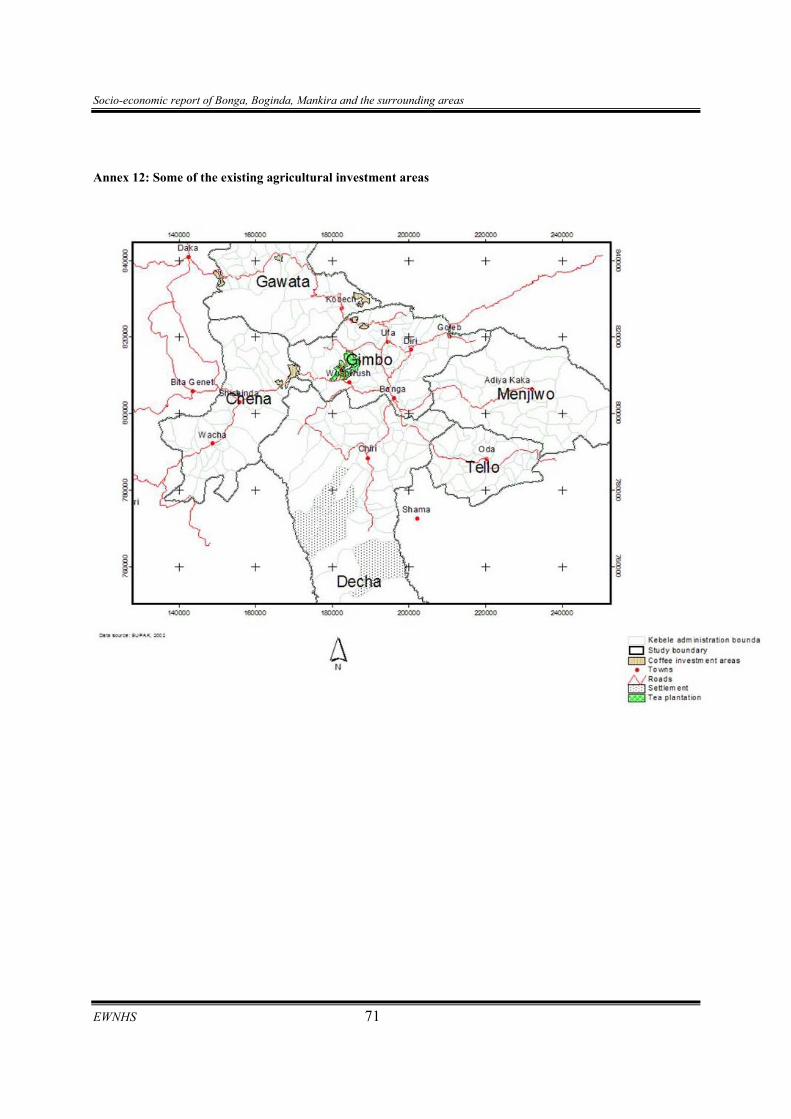
Socio-economic report of Bonga, Boginda, Mankira and the surrounding areas
EWNHS 71
Annex 12: Some of the existing agricultural investment areas