Embed Size (px)
Citation preview
9
LAND BANK OF THE PHILIPPINES NOTES TO FINANCIAL STATEMENTS
(Amounts in thousands, except as indicated) 1. Corporate Information The Land Bank of the Philippines (Parent) is a financial institution wholly-owned by the National Government. The Parent was established in 1963 as the financial intermediary of the Land Reform Program of the government. Later, it became the first universal bank by charter with expanded commercial banking powers to sustain its social mission of spurring countryside development. The Parent is a depository bank of the government and its various instrumentalities. The Parent services requirements of the national government, local government units and government-owned and controlled corporations. As of December 31, 2012, 71 percent of the deposit portfolio came from the government while the rest came from private depositors. The Parent and its subsidiaries (Group) are engaged in the business of banking, financing, leasing, real estate, insurance brokering and other related services to personal, commercial, corporate and institutional clients. The Group’s products and services include deposit-taking, lending and related services, treasury and capital market operations, trade services, payments and cash management, and trust services. The Parent’s principal office of business is located at the LandBank Plaza, 1598 M.H. Del Pilar corner Dr. J. Quintos Streets, Malate, Manila. The accompanying comparative financial statements of the Group and the Parent were authorized for issue by the Parent’s Board of Directors on February 25, 2013.
2. Summary of Significant Accounting Policies 2.1 Basis of Financial Statements Preparation The accompanying financial statements have been prepared on a historical cost basis except for financial assets at fair value through profit or loss (FVPL), available-for-sale (AFS) investments, and derivative financial instruments that have been measured at fair value. The financial statements of the Parent include the accounts maintained in the Regular Banking Unit (RBU) and Foreign Currency Deposit Unit (FCDU). The financial statements individually prepared for these units are combined after eliminating inter-unit accounts. The functional currency of RBU and FCDU is Philippine Peso and United States Dollar (USD), respectively. For financial reporting purposes, FCDU accounts and foreign currency-denominated accounts in the RBU are translated in Philippine peso based on the Philippine Dealing System (PDS) closing rate prevailing at end of the year.
10
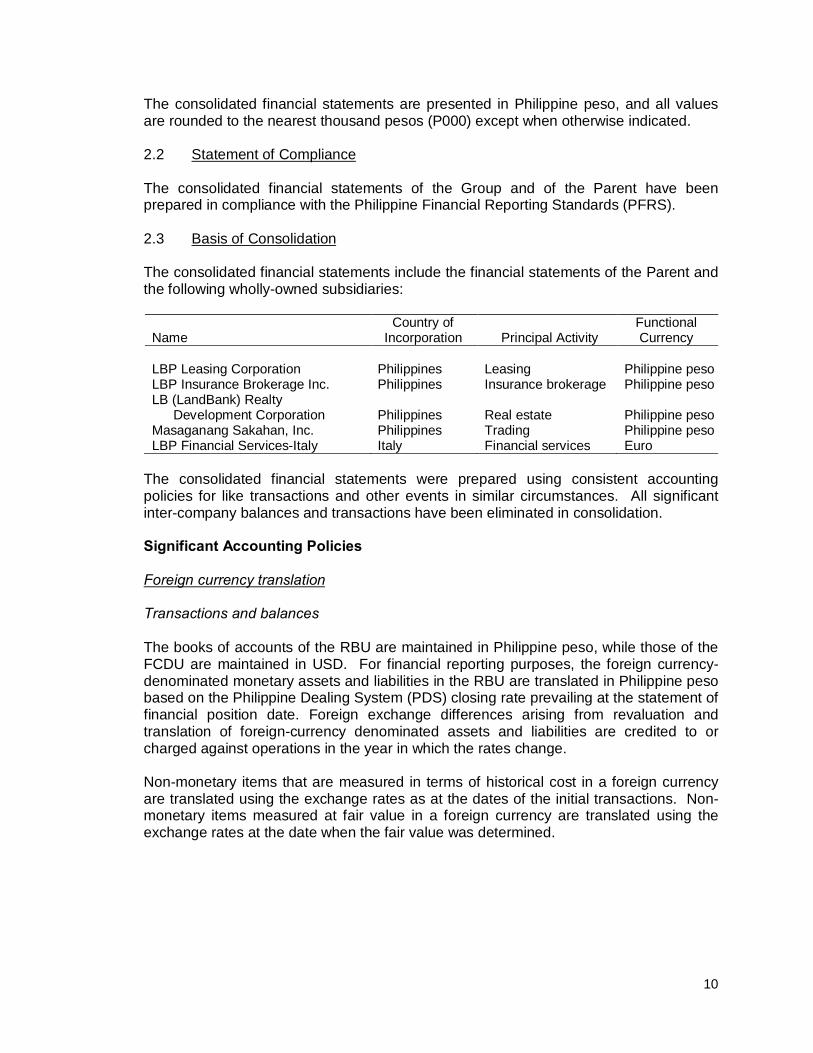
The consolidated financial statements are presented in Philippine peso, and all values are rounded to the nearest thousand pesos (P000) except when otherwise indicated. 2.2 Statement of Compliance The consolidated financial statements of the Group and of the Parent have been prepared in compliance with the Philippine Financial Reporting Standards (PFRS). 2.3 Basis of Consolidation The consolidated financial statements include the financial statements of the Parent and the following wholly-owned subsidiaries:
Name
Country of Incorporation
Principal Activity
Functional Currency
LBP Leasing Corporation Philippines Leasing Philippine peso LBP Insurance Brokerage Inc. Philippines Insurance brokerage Philippine peso LB (LandBank) Realty Development Corporation
Philippines
Real estate
Philippine peso
Masaganang Sakahan, Inc. Philippines Trading Philippine peso LBP Financial Services-Italy Italy Financial services Euro
The consolidated financial statements were prepared using consistent accounting policies for like transactions and other events in similar circumstances. All significant inter-company balances and transactions have been eliminated in consolidation. Significant Accounting Policies Foreign currency translation Transactions and balances The books of accounts of the RBU are maintained in Philippine peso, while those of the FCDU are maintained in USD. For financial reporting purposes, the foreign currency-denominated monetary assets and liabilities in the RBU are translated in Philippine peso based on the Philippine Dealing System (PDS) closing rate prevailing at the statement of financial position date. Foreign exchange differences arising from revaluation and translation of foreign-currency denominated assets and liabilities are credited to or charged against operations in the year in which the rates change. Non-monetary items that are measured in terms of historical cost in a foreign currency are translated using the exchange rates as at the dates of the initial transactions. Non-monetary items measured at fair value in a foreign currency are translated using the exchange rates at the date when the fair value was determined.
11
Financial Instruments Date of recognition Purchases or sales of financial assets that require delivery of assets within the time frame established by regulation or convention in the marketplace are recognized on the settlement date - the date that an asset is delivered to or by the Group. Securities transactions are also recognized on settlement date basis. Deposits, amounts due to banks and customers and loans are recognized when cash is received by the Group or advanced to the borrowers. Initial recognition of financial instruments All financial assets, including trading and investment securities and loans and receivables, are initially measured at fair value. Except for financial assets valued at FVPL, the initial measurement of financial assets includes transaction costs. The Group classifies its financial assets in the following categories: financial assets at FVPL, HTM investments, AFS investments, and loans and receivables while financial liabilities are classified as financial liabilities at FVPL and financial liabilities carried at cost. The classification depends on the purpose for which the investments were acquired and whether they are quoted in an active market. Management determines the classification of its investments at initial recognition and, where allowed and appropriate, re-evaluates such designation at every reporting date. Reclassification of financial assets A financial asset is reclassified out of the FVPL category when the following conditions are met: • the financial asset is no longer held for the purpose of selling or repurchasing it in the near term; and • there is a rare circumstance. A financial asset that is reclassified out of the FVPL category is reclassified at its fair value on the date of reclassification. Any gain or loss already recognized in the consolidated statement of income is not reversed. The fair value of the financial asset on the date of reclassification becomes its new cost or amortized cost, as applicable. Determination of fair value The fair value for financial instruments traded in active markets at the statement of financial position date is based on their quoted market price or dealer price quotations (bid price for long positions and ask price for short positions), without any deduction for transaction costs. When current bid and asking prices are not available, the price of the most recent transaction is used since it provides evidence of the current fair value as long as there has not been a significant change in economic circumstances since the time of the transaction.
12
For all other financial instruments not listed in an active market, the fair value is determined by using appropriate valuation techniques. Valuation techniques include net present value techniques, comparison to similar instruments for which market observable prices exist, options pricing models, and other relevant valuation models. ‘Day 1’ difference Where the transaction price in a non-active market is different from the fair value from other observable current market transactions in the same instrument or based on a valuation technique whose variables include only data from observable market, the Group recognizes the difference between the transaction price and fair value (a ‘Day 1’ difference) in the statement of income. In cases where use is made of data which is not observable, the difference between the transaction price and model value is only recognized in the statement of income when the inputs become observable or when the instrument is derecognized. For each transaction, the Group determines the appropriate method of recognizing the ‘Day 1’ difference amount. (a) Financial assets designated at fair value through profit or loss (FVPL) FVPL consists of securities held for trading and financial assets that are voluntarily designated as FVPL on trade date. The FVPL category includes government debt securities purchased and held principally with the intention of selling them in the near term. These securities are carried at fair market value, based primarily on quoted market prices, or if quoted market prices are not available, discounted cash flows using market rates that are commensurate with the credit quality and maturity of the investments. Realized and unrealized gains and losses on these instruments are recognized under the trading and foreign exchange profits accounts in the statements of income. (b) Loans and receivables, amounts due from BSP and other banks, interbank loans receivable and securities purchased under resale agreements These are financial assets with fixed or determinable payments and fixed maturities that are not quoted in an active market. They are not entered into with the intention of immediate or short-term resale and are not classified as other financial assets held for trading, designated as AFS investments or financial assets designated at FVPL. (c) Held-to-Maturity (HTM) investments HTM investments are quoted non-derivative financial assets with fixed or determinable payments and fixed maturities for which the Group’s management has the positive intention and ability to hold to maturity. Where the Group sells other than an insignificant amount of HTM investments or those close to maturity, the entire category would be tainted and reclassified as AFS asset. These investments are carried at amortized cost using the effective interest rate method, reduced by any impairment in value. Gains and losses are recognized in income when the HTM investments are derecognized and impaired, as well as through the amortization process.
13
(d) Available-for-sale (AFS) investments AFS investments are those which do not qualify to be classified as designated as FVPL, HTM or loans and receivables. They are purchased and held indefinitely, but which the Group anticipates to sell in response to liquidity requirements or changes in market. AFS investments are carried at fair market value. The effective yield component (including premium, discounts and directly attributable transaction costs) and foreign exchange restatement results of available-for-sale debt securities are reported in earnings. Dividends on AFS equity instruments are recognized in the statements of income when the entity’s right to receive payment is established. The unrealized gains and losses arising from the recognition of fair value changes on AFS assets are reported as a separate component of capital funds in the statements of financial position. Fair Value Measurement The methods and assumptions used by the Group in estimating the fair value of the financial instruments include the following: Cash and cash equivalents and short-term investments – Carrying amounts approximate fair values due to the relatively short-term maturity of these instruments. Debt securities – Fair values are generally based upon quoted market prices. If the market prices are not readily available, fair values are estimated using either values obtained from counterparties or independent parties offering pricing services, values based on adjusted quoted market prices of comparable investments or values computed using the discounted cash flow methodology. Equity securities - Fair values are based on quoted prices published in markets. Loans and receivables – Fair values of loans are estimated using the discounted cash flow methodology using the Parent’s current incremental lending rates for similar types of loans. Mortgage loans – Fair values of loans on real estate are estimated using the discounted cash flow methodology using the Parent’s current incremental lending rates for similar types of loans. Short-term investments – Carrying amounts approximate fair values. Others – Quoted market prices are not readily available for these assets. They are not reported at fair value and are not significant in relation to the Group’s total portfolio of securities. Obligations to repurchase securities are recorded at cost which approximates fair value. Liabilities – Fair values are estimated using the discounted cash flow methodology using the Parent’s current incremental borrowing rates for similar borrowings with maturities consistent with those remaining for the liability being valued. Except for the long-term fixed rates liabilities and floating rate liabilities with repricing periods beyond three months, the carrying values approximate fair values due to the relatively short term maturities of the liabilities or frequency of the repricing.
14
Impairment of Financial Assets The Group determines at each balance sheet date whether there is objective evidence that a financial asset may be impaired. Assets carried at amortized cost A financial asset or a group of financial assets is impaired and impairment losses are incurred if, and only if, there is objective evidence of impairment as a result of one or more events that occurred after the initial recognition of the asset (a ‘loss event’) and that loss event has an impact on the estimated future cash flows of the financial asset or group of financial assets that can be reliably estimated. The Group first assesses whether objective evidence of impairment exists individually for financial assets that are individually significant, and individually or collectively for assets that are not individually significant. If it is determined that no objective evidence of impairment exists for individually assessed financial asset, whether significant or not, the asset is included in a group of financial assets with similar credit risk characteristics (i.e., on the basis of the Group’s scoring process that considers asset term, industry and collateral) and that group of assets is collectively assessed for impairment. Those characteristics are relevant to the estimation of future cash flows for group of such assets by being indicative of the debtors’ ability to pay all amounts due according to the contractual terms of the assets being evaluated. Assets that are individually assessed for impairment and for which an impairment loss is or continues to be recognized are not included in a collective assessment for impairment. If there is objective evidence that an impairment loss on loans and receivables carried at amortized cost has been incurred, the amount of the loss is measured as the difference between the asset’s carrying amount and the present value of the estimated future cash flows (excluding future credit losses that have not been incurred) discounted at the financial asset’s original effective interest rate. The carrying amount of the asset is reduced through use of an allowance account. The amount of loss is charged to current operations. If a loan or HTM investment has a variable interest rate, the discount rate for measuring any impairment loss is the current effective interest rate determined under the contract. If, in a subsequent year, the amount of the estimated impairment loss decreases because of an event occurring after the impairment was recognized, any amounts formerly charged are credited to ‘Provision for credit and impairment losses’ in the statement of income and the allowance account, reduced. The HTM investments, together with the associated allowance accounts, are written off when there is no realistic prospect of future recovery and all collateral has been realized. The calculation of the present value of the estimated future cash flows of a collateralized financial asset reflects the cash flows that may result from foreclosure less costs for obtaining and selling the collateral, whether or not foreclosure is probable. Future cash flows in a group of financial assets that are collectively evaluated for impairment are estimated on the basis of the contractual cash flows of the assets and historical loss experience for assets with similar credit risk characteristics. Historical loss
15
experience is adjusted on the basis of current observable data to reflect the effects of current conditions that did not affect the period on which the historical loss experience is based and to remove the effects of conditions in the historical period that do not exist currently. Estimates of changes in future cash flows for groups of assets are made to reflect and be directionally consistent with changes in related observable data from period to period (such as changes in unemployment rates, property prices, payment status, or other factors indicative of changes in the probability of losses in the group and their magnitude). The methodology and assumptions used for estimating future cash flows are reviewed regularly by the Group to reduce any differences between loss estimates and actual loss experience. When a loan is uncollectible, it is written off against the related allowance for loan impairment. Such loans are written off after all the necessary procedures have been completed and the amount of the loss has been determined. Subsequent recoveries of amounts previously written off are charged to income. Restructured loans Where possible, the Group seeks to restructure loans rather than to take possession of collateral. This may involve extending the payment arrangements and the agreement of new loan conditions. Once the terms have been renegotiated, the loan is no longer considered past due. Management continuously reviews restructured loans to ensure that all criteria are met and that future payments are likely to occur. The loans continue to be subject to an individual or collective impairment assessment, calculated using the loan’s original effective interest rate. The difference between the recorded value of the original loan and the present value of the restructured cash flows, discounted at the original effective interest rate, is recognized in ‘Provision for credit and impairment losses’ in the statement of income. Assets Carried at Cost If there is objective evidence that an impairment loss on an unquoted equity instruments that are not carried at fair value because its fair value cannot be reliably measured, or on a derivative asset that is linked to and must be settled by delivery of such unquoted equity instrument has been incurred, the amount of the loss is measured as the difference between the asset’s carrying amount and the present value of estimated future cash flows discounted at the current market rate of return for a similar financial asset. AFS Investments If an AFS investment is impaired, an amount comprising the difference between its cost (net of any principal payment and amortization) and its current fair value, less any impairment loss on that security previously recognized in profit or loss – is removed from equity and recognized in the statement of income. Impairment losses on equity instruments recognized in the statement of income are not reversed through the statement of income. If, in a subsequent period, the fair value of a debt instrument classified as AFS investment increases and the increase can be objectively related to an
16
event occurring after the impairment loss was recognized in profit or loss, the impairment loss is reversed through the statement of income. Derecognition of Financial Assets and Liabilities Financial Assets. A financial asset (or, where applicable, a part of a financial asset or part of a group of similar financial assets) is derecognized when: § the rights to receive cash flows from the asset have expired; § The Group retains the right to receive cash flows from the asset, but has assumed an obligation to pay them in full without material delay to a third party under a ‘pass-through’ arrangement; or § The Group has transferred its rights to receive cash flows from the asset and either (a) has transferred substantially all the risks and rewards of the asset, or (b) has neither transferred nor retained substantially all the risks and rewards of the asset, but has transferred control of the asset.
Where the Group has transferred its rights to receive cash flows from an asset and has neither transferred nor retained substantially all the risks and rewards of the asset nor transferred control of the asset, the asset is recognized to the extent of the Group’s continuing involvement in the asset. Continuing involvement that takes the form of a guarantee over the transferred asset is measured at the lower of the original carrying amount of the asset and the maximum amount of consideration that the Group could be required to repay. Where continuing involvement takes the form of a written and/or purchase option (including a cash-settled option or similar provision) on the transferred asset, the extent of the Group’s continuing involvement is the amount of the transferred asset that the Group may repurchase, except that in the case of a written put option (including a cash-settled option or similar provision) on an asset measured at fair value, the extent of the Group’s continuing involvement is limited to the lower of the fair value of the transferred asset and the option exercise price.
Financial Liabilities. A financial liability is derecognized when the obligation under the liability is discharged or cancelled or expired. When an existing financial liability is replaced by another from the same lender on substantially different terms, or the terms of an existing liability are substantially modified, such an exchange or modification is treated as a derecognition of the original liability and the recognition of a new liability, and the difference in the respective carrying amounts is recognized in profit or loss. Derivative Instruments The Group enters into derivative contracts such as currency forwards and currency swaps to manage its foreign exchange exposure. These derivative financial instruments are initially recorded at fair value on the date at which the derivative contract is entered into and are subsequently remeasured at fair value. Any gains or losses arising from changes in fair values of derivatives (except those accounted for as accounting hedges) are taken directly to the statement of income. Derivatives are carried as assets when the fair value is positive and as liabilities when the fair value is negative. Derivative instruments are booked at its notional amount under contingent account on trade date and subsequently measured using the mark to forward methods. Any gains/(losses)
17
arising from the market valuation are booked under asset account “Derivatives with positive fair value“ if the market valuation is positive and under the liability account “Derivatives with negative fair value” if the market valuation is negative contra foreign exchange gain/(loss) account. For the purpose of hedge accounting, hedges are classified primarily as either: a) a hedge of the fair value of an asset, liability or a firm commitment (fair value hedge); or b) a hedge of the exposure to variability in cash flows attributable to an asset or liability or a forecasted transaction (cash flow hedge). The Group did not apply hedge accounting treatment for its derivative transactions. The Group has certain derivatives that are embedded in host financial contracts (such as structured notes, debt investments, and loan receivables) and non-financial contracts (such as purchase orders, lease contracts and service agreements). These embedded derivatives include credit default swaps (which are linked to a reference bond), and calls and puts in debt and equity securities; conversion options in loans receivable; and foreign-currency derivatives in debt instruments, lease contracts, purchase orders and service agreements. Embedded derivatives are separated from their host contracts and carried at fair value with fair value changes being reported through profit or loss, when the entire hybrid contracts (composed of both the host contract and the embedded derivative) are not accounted for as financial instruments at FVPL and when their economic risks and characteristics are not closely related to those of their respective host contracts. Offsetting financial instruments Financial assets and financial liabilities are only offset and the net amount are reported in the statement of financial position when there is a legally enforceable right to offset the recognized amounts and the Group intends to either settle on a net basis, or to realize the asset and the liability simultaneously. Fiduciary Activities Assets and income arising from fiduciary activities together with related undertakings to return such assets to customers are excluded from the financial statements where the Group acts in a fiduciary capacity such as nominee, trustee or agent. Subsequent Events Any post-year-end event that provides additional information about the Group’s position at the statement of financial position date (adjusting event) is reflected in the financial statements. Post-year-end events that are non adjusting events, if any, are disclosed in the Notes to the financial statements, when material. Impairment of Property and Equipment, Investment Property and Other Resources At each reporting date, the Group assesses whether there is any indication that the property and equipment and investment properties may be impaired.
18
Where an indicator of impairment exists, the Group makes a formal estimate of recoverable amount. Where the carrying amount of an asset exceeds its recoverable amount, the asset is considered impaired and is written down to its recoverable amount. Recoverable amount is the higher of an asset’s or cash-generating unit’s fair value less costs to sell and its value in use and is determined for an individual asset, unless the asset does not generate cash inflows that are largely independent of those from other assets or group of assets. Investments in Subsidiaries The Group’s investments in subsidiaries and entities in which the Group has control are accounted for under the cost method of accounting in the separate financial statements. These are carried in the statement of financial position at cost less any impairment in value. Property and Equipment Property and equipment are carried at cost less accumulated depreciation and amortization and any impairment in value. When the assets are sold or retired, their cost and accumulated depreciation and amortization are eliminated from the accounts and any gain or loss resulting from their disposal is included in the statement of income. The initial cost of property and equipment comprises its purchase price and any directly attributable cost of bringing the asset to its working condition and location for its intended use. Expenditures incurred after the fixed assets have been put into operation, such as repairs and maintenance costs, are normally charged to profit and loss in the period in which the costs are incurred. Depreciation and amortization is calculated on a straight-line basis over the estimated useful life (EUL) of the property and equipment as follows: Number of Years Buildings 10 - 30 Furniture, fixtures and equipment 5 - 10 Leasehold rights 10 - 30* Transportation equipment 7 - 10 *EUL shall depend on the length of the lease. It shall be the period of the lease or the EUL of the assets, as given, whichever is shorter.
The useful life and depreciation and amortization methods are reviewed periodically to ensure that the period and method of depreciation and amortization are consistent with the expected pattern of economic benefits from items of property and equipment. Investment properties Property acquired by the Group in settlement of loans through foreclosure or dation in payment, and that is not significantly occupied by the Group, is classified as investment property. Investment property comprises land and building.
19
Investment properties are measured at their fair value as the deemed cost as allowed under PFRS 1 and PAS 40. Subsequent to initial recognition, investment properties are stated at cost less accumulated depreciation and impairment loss. Investment properties are derecognized when they have either been disposed of or when the investment property is permanently withdrawn from use and no future benefit is expected from its disposal. Any gains or losses on derecognition of an investment property are recognized in the profit and loss in the year of derecognition. Expenditures incurred after the fixed investment properties have been put into operation, such as repairs and maintenance costs, are normally charged to income in the period in which the costs are incurred. Depreciation is calculated on a straight-line basis over 10 to 30 years, which is the estimated useful life of the investment properties. Intangible Assets Computer software Acquired computer software licenses are capitalized on the basis of the costs incurred to acquire and bring to use the specific software. These costs are amortized on the basis of the expected useful lives (three to five years). Costs associated with developing or maintaining computer software programs are recognized as an expense as incurred. Income Taxes Income tax on the profit for the year comprises current tax only. Income tax is recognized in the statement of income except to the extent that it relates to items recognized directly in equity. Current income tax is the expected tax payable on the taxable income for the year using tax rates enacted or substantially enacted as of the balance sheet date, and any adjustment to tax payable in respect to previous years. Deferred tax assets are recognized for the future tax consequences attributable to temporary differences between the carrying amounts of assets and liabilities for financial reporting purposes and the amount used for taxation purposes and the carry forward benefits of the net operating loss carryover (NOLCO) and the minimum corporate income tax (MCIT) over the regular corporate income tax. The amount of deferred tax provided is based on the expected manner of realization or settlement of the carrying amounts of assets and liabilities, using tax rates that have been enacted or substantially enacted as of the balance sheet date. A deferred tax asset is recognized only to the extent that it is probable that future taxable profits will be available against which the asset can be utilized. Deferred tax assets are reduced to the extent that it is no longer probable that the related tax benefit will be realized. The carrying amount of the deferred tax asset is reviewed at each balance sheet date and reduced, if appropriate.
20
Employee Benefits The Group maintains a defined contribution plan which provides for estimated pension benefits on its contributory retirement plan covering all regular employees. Leases (a) LBP Group is the lessee
(i) Operating lease - leases in which substantially all risks and rewards of ownership are retained by another party, the lessor, are classified as operating leases. Payments, including prepayments, made under operating leases (net of any incentives received from the lessor) are charged to the statement of income on a straight-line basis over the period of the lease. (ii) Financial lease - leases of assets where the LBP Group has substantially all the risks and rewards of ownership are classified as finance leases. Finance leases are capitalized at the lease’s commencement at the lower of the fair value of the leased property and the present value of the minimum lease payments. Each lease payment is allocated between the liability and the finance charges so as to achieve a constant rate on the finance balance outstanding. The corresponding rental obligations, net of finance charges, are included in deferred credits and other liabilities. The interest element of the finance cost is charged to the statement of income over the lease period so as to produce a constant periodic rate of interest on the remaining balance of the liability for each period.
(b) LBP Group is the lessor
(i) Operating lease - properties leased out under operating leases are included in investment property in the statement of financial position. Rental income under operating leases is recognized in the statement of income on a straight-line basis over the period of lease. (ii) Finance lease - when assets are leased out under a finance lease, the present value of the lease payments is recognized as a receivable. The difference between the gross receivable and the present value of the receivable is recognized as unearned income.
Lease income under finance lease is recognized over the term of the lease using the net investment method before tax, which reflects a constant periodic rate of return. Revenue Recognition Interest income and fees which are considered an integral part of the effective yield of a financial asset are recognized using the effective interest method, unless collectibility is in doubt. Interest is recognized on impaired loans and other financial assets based on the rate used to discount future cash flows to their net present value. Dividend income is recognized when the right to receive payment is established.
21
Gains or losses arising from the trading of securities and foreign currency are reported in the statement of income. Generally, commissions, service charges and fees are recognized only upon collection or accrued where there is reasonable degree of certainty as to its collectibility. Commitment fees received to originate a loan when the loan commitment is outside the scope of PAS 39 are deferred and recognized as an adjustment to the effective interest rate. If the loan commitment expires, the fee is recognized as revenue on expiry. Borrowing Costs Borrowing costs are expensed when incurred.
3. Future Changes in Accounting Policies The Group will adopt the standards and interpretations enumerated below when these become effective. Except as otherwise indicated, the Group does not expect the adoption of these new and amended PFRS and Philippine Interpretations to have significant impact on its financial statements. New Standards and Interpretations PFRS 3, Business Combinations (Revised) and PAS 27, Consolidated and Separate Financial Statements (Amended) The revised standards are effective for annual periods beginning on or after July 1, 2009. PFRS 3 (Revised) introduces significant changes in the accounting for business combinations occurring after this date. Changes affect the valuation of non-controlling interest, the accounting for transaction costs, the initial recognition and subsequent measurement of a contingent consideration and business combinations achieved in stages. These changes will impact the amount of goodwill recognized, the reported results in the period that an acquisition occurs and future reported results. PAS 27 (Amended) requires that a change in the ownership interest of a subsidiary (without loss of control) is accounted for as a transaction with owners in their capacity as owners. Therefore, such transactions will no longer give rise to goodwill, nor will it give rise to gain or loss. Furthermore, the amended standard changes the accounting for losses incurred by the subsidiary as well as the loss of control of a subsidiary. The changes by PFRS 3 (Revised) and PAS 27 (Amended) will affect future acquisitions or loss of control of subsidiaries and transactions with non-controlling interests. PFRS 3 (Revised) will be applied prospectively while PAS 27 (Amended) will be applied retrospectively with few exceptions. Philippine Interpretation IFRIC 15, Agreement for Construction of Real Estate This Interpretation, effective for annual periods beginning on or after January 1, 2012 covers accounting for revenue and associated expenses by entities that undertake the construction of real estate directly or through subcontractors. The Interpretation requires that the revenue on construction of real estate be recognized only upon completion, except when such contract qualifies as construction contract to be accounted for under
22
PAS 11, Construction Contracts, or involves rendering of services in which case revenue is recognized based on stage of completion. Contracts involving provisions of services with the construction materials and where the risks and reward of ownership are transferred to the buyer on a continuous basis will also be accounted for based on stage of completion. Philippine Interpretation IFRIC 17, Distributions of Non-Cash Assets to Owners This Interpretation is effective for annual periods beginning on or after July 1, 2009 with early application permitted. It provides guidance on how to account for non-cash distributions to owners. The interpretation clarifies when to recognize a liability, how to measure it and the associated assets, and to derecognize the asset and liability. Amendments to Standards PAS 39 Amendment – Eligible Hedged Items The amendment to PAS 39, Financial Instruments: Recognition and Measurement, effective for annual periods beginning on or after July 1, 2009, clarifies that an entity is permitted to designate a portion of the fair value changes or cash flow variability of a financial instrument as a hedged item. This also covers the designation of inflation as a hedged risk or portion in particular situations. PFRS 2 Amendments – Group Cash-settled Share-based Payment Transactions The amendments to PFRS 2, Share-based Payments, effective for annual periods beginning on or after January 1, 2010, clarify the scope and the accounting for group cash-settled share-based payment transactions. Improvements to PFRS 2009 The omnibus amendments to PFRS issued in 2009 were issued primarily with a view to remove inconsistencies and clarify wording. The amendments are effective for annual periods beginning on or after January 1, 2010 except otherwise stated. The Group has not yet adopted the following amendments and anticipates that these changes will have no material effect on the financial statements. � PFRS 2, Share-based Payment, clarifies that the contribution of a business on
formation of a joint venture and combinations under common control are not within the scope of PFRS 2 even though they are out of scope of PFRS 3, Business Combinations (Revised). The amendment is effective for annual periods beginning on or after July 1, 2009.
� PFRS 5, Non-current Assets Held for Sale and Discontinued Operations, clarifies
that the disclosures required in respect of non-current assets and disposal groups classified as held for sale or discontinued operations are only those set out in PFRS 5. The disclosure requirements of other PFRS only apply if specifically required for such non-current assets or discontinued operations.
23
� PFRS 8, Operating Segment Information, clarifies that segment assets and liabilities need only be reported when those assets and liabilities are included in measures that are used by the chief operating decision maker.
� PAS 1, Presentation of Financial Statements, clarifies that the terms of a liability
that could result, at anytime, in its settlement by the issuance of equity instruments at the option of the counterparty do not affect its classification.
� PAS 7, Statement of Cash Flows, explicitly states that only expenditure that
results in a recognized asset can be classified as a cash flow from investing activities.
� PAS 17, Leases, removes the specific guidance on classifying land as a lease.
Prior to the amendment, leases of land were classified as operating leases. The amendment now requires that leases of land are classified as either “finance” or “operating” in accordance with the general principles of PAS 17. The amendments will be applied retrospectively.
� PAS 36, Impairment of Assets, clarifies that the largest unit permitted for
allocating goodwill, acquired in a business combination, is the operating segment as defined in PFRS 8 before aggregation for reporting purposes.
� PAS 38, Intangible Assets, clarifies that if an intangible asset acquired in a
business combination is identifiable only with another intangible asset, the acquirer may recognize the group of intangible assets as a single asset provided the individual assets have similar useful lives. Also clarifies that the valuation techniques presented for determining the fair value of intangible assets acquired in a business combination that are not traded in active markets are only examples and are not restrictive on the methods that can be used.
� PAS 39, Financial Instruments: Recognition and Measurement, clarifies the
following:
– that a prepayment option is considered closely related to the host contract when the exercise price of a prepayment option reimburses the lender up to the approximate present value of lost interest for the remaining term of the host contract.
– that the scope exemption for contracts between an acquirer and a vendor
in a business combination to buy or sell an acquiree at a future date applies only to binding forward contracts, and not derivative contracts where further actions by either party are still to be taken.
– that gains or losses on cash flow hedges of a forecast transaction that
subsequently results in the recognition of a financial instrument or on cash flow hedges of recognized financial instruments should be reclassified in the period that the hedged forecast cash flows affect profit or loss.
� Amendment to Philippine Interpretation IFRIC 9, Reassessment of Embedded
Derivatives, clarifies that it does not apply to possible reassessment at the date
24
of acquisition, to embedded derivatives in contracts acquired in a business combination between entities or businesses under common control or the formation of joint venture.
� Amendment to Philippine Interpretation IFRIC 16, Hedge of a Net Investment in a
Foreign Operation, states that, in a hedge of a net investment in a foreign operation, qualifying hedging instruments may be held by any entity or entities within the group, including the foreign operation itself, as long as the designation, documentation and effectiveness requirements of PAS 39 that relate to a net investment hedge are satisfied.
IFRS 9, Financial Instruments Part 1: Classification and Measurement. IFRS 9 was issued in November 2009 and replaces those parts of IAS 39 relating to the classification and measurement of financial assets. Key features are as follows:
(i) Financial assets are required to be classified into two measurement categories: those to be measured subsequently at fair value, and those to be measured subsequently at amortized cost. The decision is to be made at initial recognition. The classification depends on the entity’s business model for managing its financial instruments and the contractual cash flow characteristics of the instrument.
(ii) An instrument is subsequently measured at amortized cost only if it is a
debt instrument and both the objective of the entity’s business model is to hold the asset to collect the contractual cash flow, and the asset’s contractual cash flow represent only payments of principal and interest. All other debt instruments are to be measured at fair value through profit or loss.
(iii) All equity instruments are to be measured subsequently at fair value.
Equity instruments that are held for trading will be measured at fair value through profit or loss. For all other equity investments, an irrevocable election can be made at initial recognition, to recognize unrealized and realized fair value gains and losses through other comprehensive income rather than profit or loss. There shall be no recycling of fair value gains and losses to profit or loss. This election may be made on an instrument-by-instrument basis. Dividends are to be presented in profit or loss, as long as they represent a return on investment.
4. Significant Accounting Judgments and Estimates The preparation of the financial statements in compliance with PFRS requires the Group to make estimates and assumptions that affect the reported amounts of resources, liabilities, income and expenses and disclosure of contingent resources and contingent liabilities. Future events may occur which will cause the assumptions used in arriving at the estimates to change. The effects of any change in estimates are reflected in the financial statements as they become reasonably determinable.
25
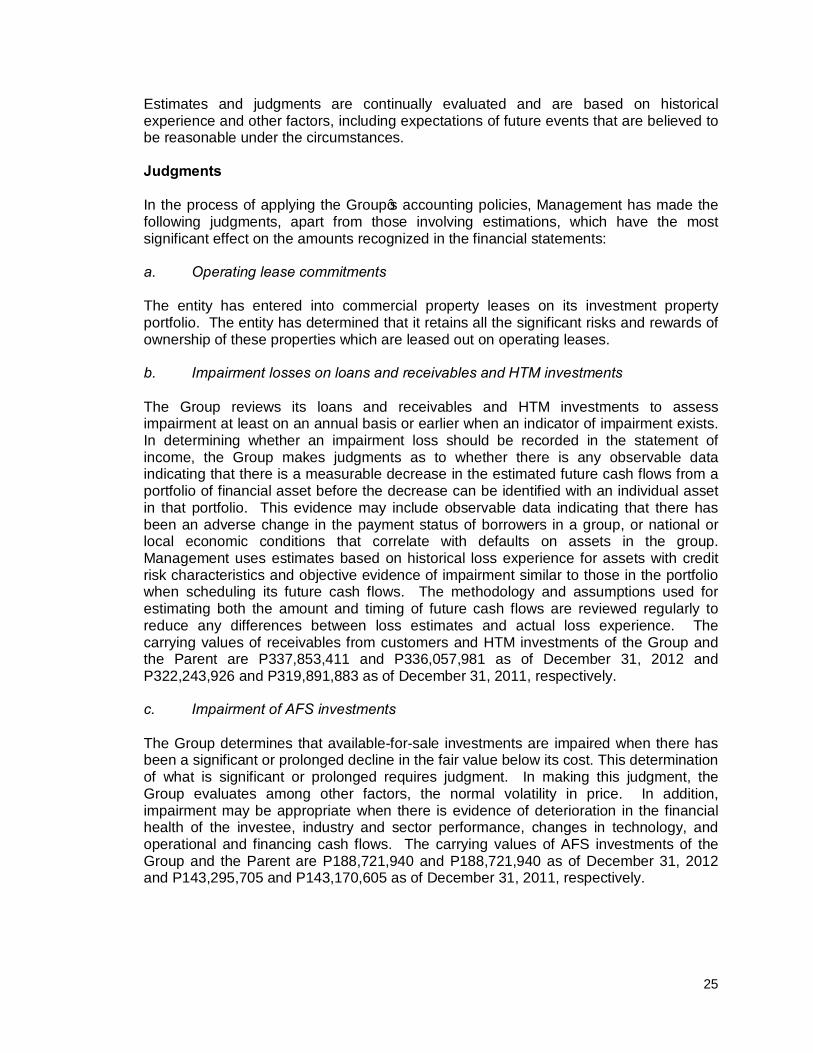
Estimates and judgments are continually evaluated and are based on historical experience and other factors, including expectations of future events that are believed to be reasonable under the circumstances. Judgments In the process of applying the Group’s accounting policies, Management has made the following judgments, apart from those involving estimations, which have the most significant effect on the amounts recognized in the financial statements: a. Operating lease commitments The entity has entered into commercial property leases on its investment property portfolio. The entity has determined that it retains all the significant risks and rewards of ownership of these properties which are leased out on operating leases. b. Impairment losses on loans and receivables and HTM investments The Group reviews its loans and receivables and HTM investments to assess impairment at least on an annual basis or earlier when an indicator of impairment exists. In determining whether an impairment loss should be recorded in the statement of income, the Group makes judgments as to whether there is any observable data indicating that there is a measurable decrease in the estimated future cash flows from a portfolio of financial asset before the decrease can be identified with an individual asset in that portfolio. This evidence may include observable data indicating that there has been an adverse change in the payment status of borrowers in a group, or national or local economic conditions that correlate with defaults on assets in the group. Management uses estimates based on historical loss experience for assets with credit risk characteristics and objective evidence of impairment similar to those in the portfolio when scheduling its future cash flows. The methodology and assumptions used for estimating both the amount and timing of future cash flows are reviewed regularly to reduce any differences between loss estimates and actual loss experience. The carrying values of receivables from customers and HTM investments of the Group and the Parent are P337,853,411 and P336,057,981 as of December 31, 2012 and P322,243,926 and P319,891,883 as of December 31, 2011, respectively. c. Impairment of AFS investments The Group determines that available-for-sale investments are impaired when there has been a significant or prolonged decline in the fair value below its cost. This determination of what is significant or prolonged requires judgment. In making this judgment, the Group evaluates among other factors, the normal volatility in price. In addition, impairment may be appropriate when there is evidence of deterioration in the financial health of the investee, industry and sector performance, changes in technology, and operational and financing cash flows. The carrying values of AFS investments of the Group and the Parent are P188,721,940 and P188,721,940 as of December 31, 2012 and P143,295,705 and P143,170,605 as of December 31, 2011, respectively.
26
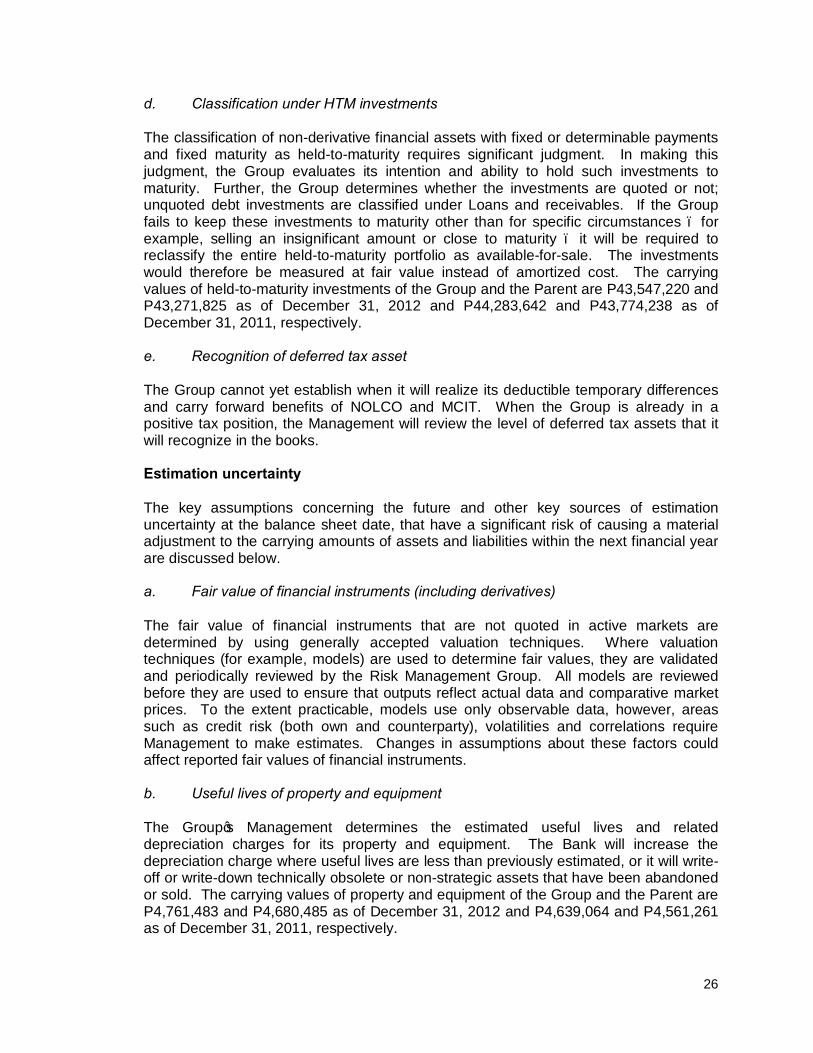
d. Classification under HTM investments The classification of non-derivative financial assets with fixed or determinable payments and fixed maturity as held-to-maturity requires significant judgment. In making this judgment, the Group evaluates its intention and ability to hold such investments to maturity. Further, the Group determines whether the investments are quoted or not; unquoted debt investments are classified under Loans and receivables. If the Group fails to keep these investments to maturity other than for specific circumstances – for example, selling an insignificant amount or close to maturity – it will be required to reclassify the entire held-to-maturity portfolio as available-for-sale. The investments would therefore be measured at fair value instead of amortized cost. The carrying values of held-to-maturity investments of the Group and the Parent are P43,547,220 and P43,271,825 as of December 31, 2012 and P44,283,642 and P43,774,238 as of December 31, 2011, respectively. e. Recognition of deferred tax asset The Group cannot yet establish when it will realize its deductible temporary differences and carry forward benefits of NOLCO and MCIT. When the Group is already in a positive tax position, the Management will review the level of deferred tax assets that it will recognize in the books. Estimation uncertainty The key assumptions concerning the future and other key sources of estimation uncertainty at the balance sheet date, that have a significant risk of causing a material adjustment to the carrying amounts of assets and liabilities within the next financial year are discussed below. a. Fair value of financial instruments (including derivatives) The fair value of financial instruments that are not quoted in active markets are determined by using generally accepted valuation techniques. Where valuation techniques (for example, models) are used to determine fair values, they are validated and periodically reviewed by the Risk Management Group. All models are reviewed before they are used to ensure that outputs reflect actual data and comparative market prices. To the extent practicable, models use only observable data, however, areas such as credit risk (both own and counterparty), volatilities and correlations require Management to make estimates. Changes in assumptions about these factors could affect reported fair values of financial instruments. b. Useful lives of property and equipment The Group’s Management determines the estimated useful lives and related depreciation charges for its property and equipment. The Bank will increase the depreciation charge where useful lives are less than previously estimated, or it will write-off or write-down technically obsolete or non-strategic assets that have been abandoned or sold. The carrying values of property and equipment of the Group and the Parent are P4,761,483 and P4,680,485 as of December 31, 2012 and P4,639,064 and P4,561,261 as of December 31, 2011, respectively.
27
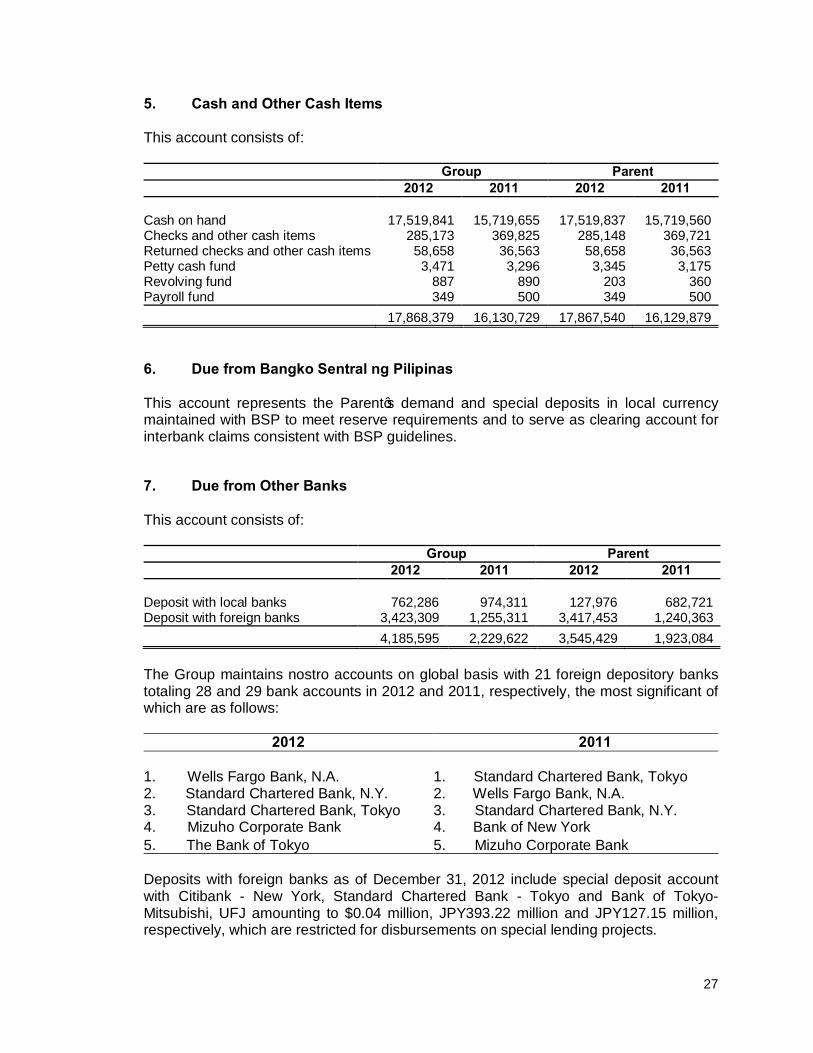
5. Cash and Other Cash Items This account consists of: Group Parent 2012 2011 2012 2011
Cash on hand 17,519,841 15,719,655 17,519,837 15,719,560 Checks and other cash items 285,173 369,825 285,148 369,721 Returned checks and other cash items 58,658 36,563 58,658 36,563 Petty cash fund 3,471 3,296 3,345 3,175 Revolving fund 887 890 203 360 Payroll fund 349 500 349 500 17,868,379 16,130,729 17,867,540 16,129,879
6. Due from Bangko Sentral ng Pilipinas This account represents the Parent’s demand and special deposits in local currency maintained with BSP to meet reserve requirements and to serve as clearing account for interbank claims consistent with BSP guidelines.
7. Due from Other Banks This account consists of: Group Parent
2012 2011 2012 2011
Deposit with local banks 762,286 974,311 127,976 682,721 Deposit with foreign banks 3,423,309 1,255,311 3,417,453 1,240,363 4,185,595 2,229,622 3,545,429 1,923,084
The Group maintains nostro accounts on global basis with 21 foreign depository banks totaling 28 and 29 bank accounts in 2012 and 2011, respectively, the most significant of which are as follows:
2012 2011
1. Wells Fargo Bank, N.A. 2. Standard Chartered Bank, N.Y.
1. Standard Chartered Bank, Tokyo 2. Wells Fargo Bank, N.A.
3. Standard Chartered Bank, Tokyo 3. Standard Chartered Bank, N.Y. 4. Mizuho Corporate Bank 4. Bank of New York 5. The Bank of Tokyo 5. Mizuho Corporate Bank
Deposits with foreign banks as of December 31, 2012 include special deposit account with Citibank - New York, Standard Chartered Bank - Tokyo and Bank of Tokyo-Mitsubishi, UFJ amounting to $0.04 million, JPY393.22 million and JPY127.15 million, respectively, which are restricted for disbursements on special lending projects.
28
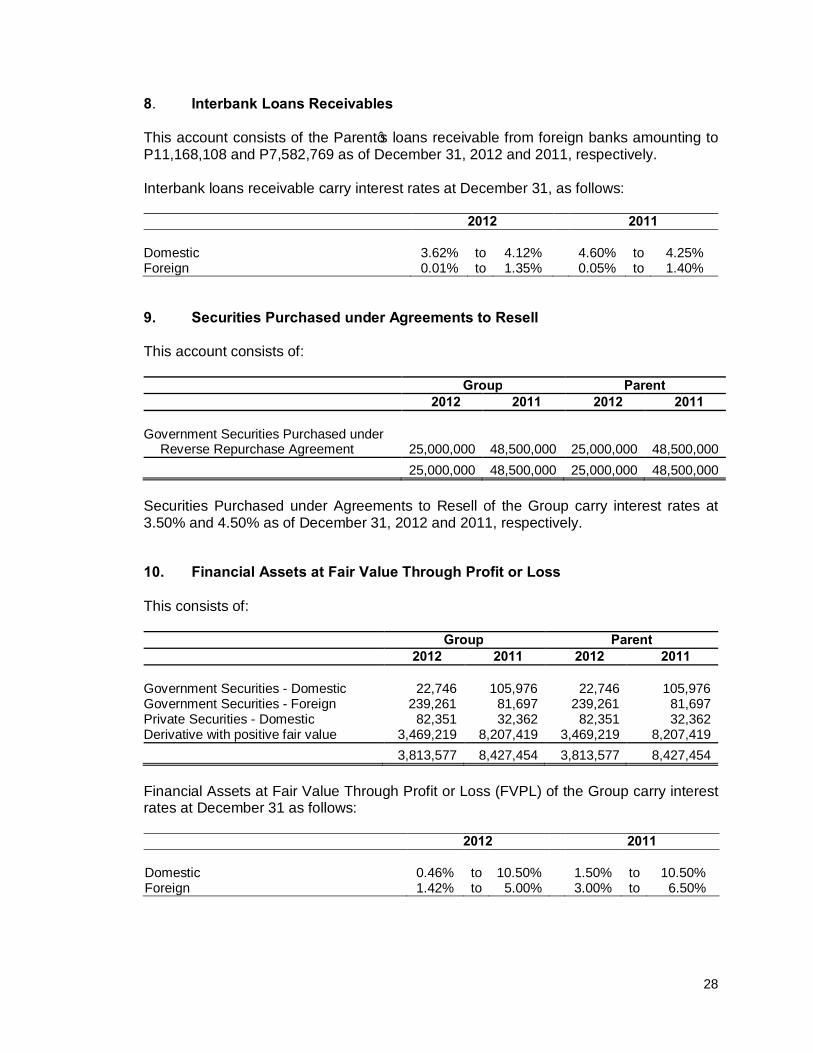
8. Interbank Loans Receivables This account consists of the Parent’s loans receivable from foreign banks amounting to P11,168,108 and P7,582,769 as of December 31, 2012 and 2011, respectively. Interbank loans receivable carry interest rates at December 31, as follows: 2012 2011
Domestic 3.62% to 4.12% 4.60% to 4.25% Foreign 0.01% to 1.35% 0.05% to 1.40%
9. Securities Purchased under Agreements to Resell This account consists of: Group Parent
2012 2011 2012 2011
Government Securities Purchased under Reverse Repurchase Agreement 25,000,000 48,500,000 25,000,000 48,500,000
25,000,000 48,500,000 25,000,000 48,500,000 Securities Purchased under Agreements to Resell of the Group carry interest rates at 3.50% and 4.50% as of December 31, 2012 and 2011, respectively.
10. Financial Assets at Fair Value Through Profit or Loss This consists of:
Group Parent 2012 2011 2012 2011
Government Securities - Domestic 22,746 105,976 22,746 105,976 Government Securities - Foreign 239,261 81,697 239,261 81,697 Private Securities - Domestic 82,351 32,362 82,351 32,362 Derivative with positive fair value 3,469,219 8,207,419 3,469,219 8,207,419
3,813,577 8,427,454 3,813,577 8,427,454 Financial Assets at Fair Value Through Profit or Loss (FVPL) of the Group carry interest rates at December 31 as follows: 2012 2011
Domestic 0.46% to 10.50% 1.50% to 10.50% Foreign 1.42% to 5.00% 3.00% to 6.50%
29
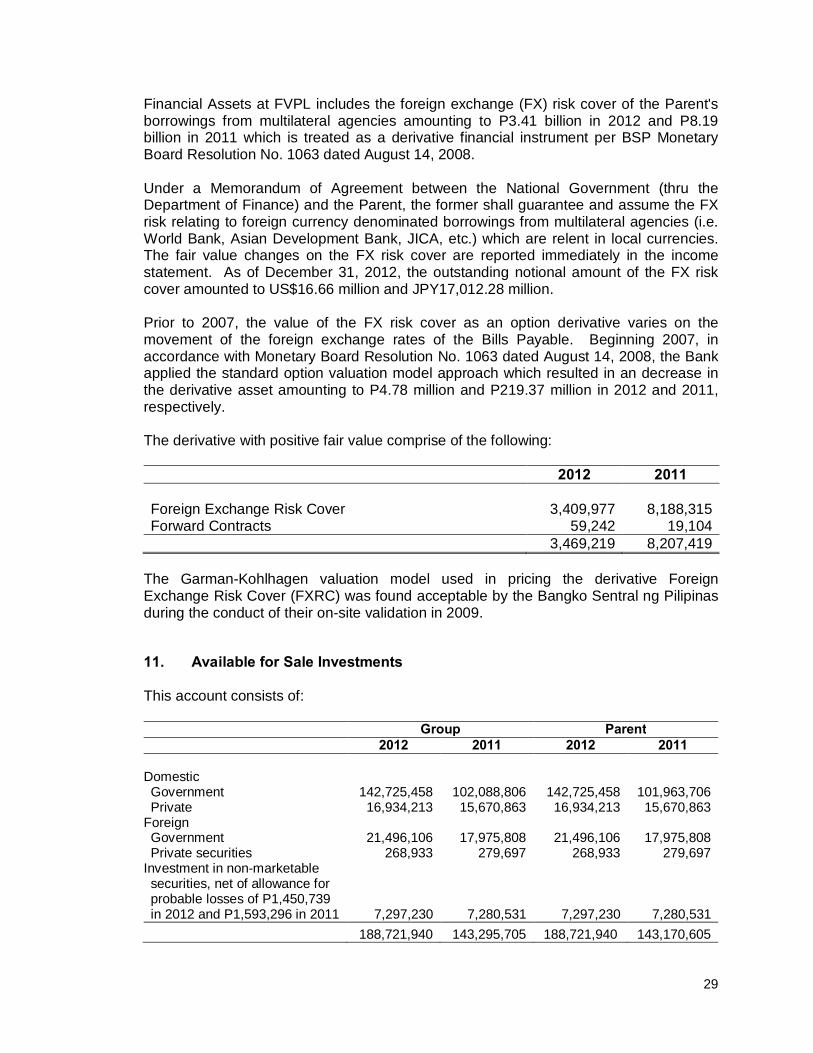
Financial Assets at FVPL includes the foreign exchange (FX) risk cover of the Parent's borrowings from multilateral agencies amounting to P3.41 billion in 2012 and P8.19 billion in 2011 which is treated as a derivative financial instrument per BSP Monetary Board Resolution No. 1063 dated August 14, 2008. Under a Memorandum of Agreement between the National Government (thru the Department of Finance) and the Parent, the former shall guarantee and assume the FX risk relating to foreign currency denominated borrowings from multilateral agencies (i.e. World Bank, Asian Development Bank, JICA, etc.) which are relent in local currencies. The fair value changes on the FX risk cover are reported immediately in the income statement. As of December 31, 2012, the outstanding notional amount of the FX risk cover amounted to US$16.66 million and JPY17,012.28 million. Prior to 2007, the value of the FX risk cover as an option derivative varies on the movement of the foreign exchange rates of the Bills Payable. Beginning 2007, in accordance with Monetary Board Resolution No. 1063 dated August 14, 2008, the Bank applied the standard option valuation model approach which resulted in an decrease in the derivative asset amounting to P4.78 million and P219.37 million in 2012 and 2011, respectively. The derivative with positive fair value comprise of the following:
2012 2011 Foreign Exchange Risk Cover 3,409,977 8,188,315 Forward Contracts 59,242 19,104 3,469,219 8,207,419
The Garman-Kohlhagen valuation model used in pricing the derivative Foreign Exchange Risk Cover (FXRC) was found acceptable by the Bangko Sentral ng Pilipinas during the conduct of their on-site validation in 2009.
11. Available for Sale Investments This account consists of: Group Parent
2012 2011 2012 2011
Domestic Government 142,725,458 102,088,806 142,725,458 101,963,706 Private 16,934,213 15,670,863 16,934,213 15,670,863
Foreign Government 21,496,106 17,975,808 21,496,106 17,975,808 Private securities 268,933 279,697 268,933 279,697
Investment in non-marketable securities, net of allowance for probable losses of P1,450,739 in 2012 and P1,593,296 in 2011 7,297,230 7,280,531 7,297,230 7,280,531 188,721,940 143,295,705 188,721,940 143,170,605
30
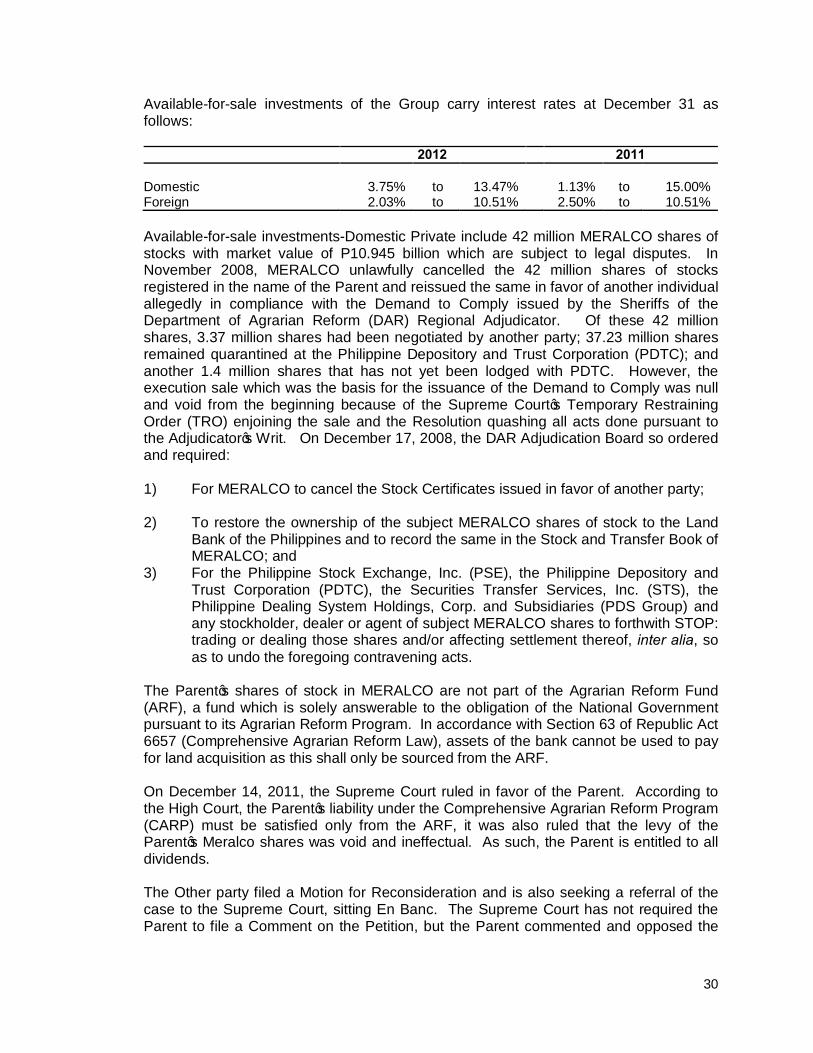
Available-for-sale investments of the Group carry interest rates at December 31 as follows: 2012 2011
Domestic 3.75% to 13.47% 1.13% to 15.00% Foreign 2.03% to 10.51% 2.50% to 10.51% Available-for-sale investments-Domestic Private include 42 million MERALCO shares of stocks with market value of P10.945 billion which are subject to legal disputes. In November 2008, MERALCO unlawfully cancelled the 42 million shares of stocks registered in the name of the Parent and reissued the same in favor of another individual allegedly in compliance with the Demand to Comply issued by the Sheriffs of the Department of Agrarian Reform (DAR) Regional Adjudicator. Of these 42 million shares, 3.37 million shares had been negotiated by another party; 37.23 million shares remained quarantined at the Philippine Depository and Trust Corporation (PDTC); and another 1.4 million shares that has not yet been lodged with PDTC. However, the execution sale which was the basis for the issuance of the Demand to Comply was null and void from the beginning because of the Supreme Court’s Temporary Restraining Order (TRO) enjoining the sale and the Resolution quashing all acts done pursuant to the Adjudicator’s Writ. On December 17, 2008, the DAR Adjudication Board so ordered and required: 1) For MERALCO to cancel the Stock Certificates issued in favor of another party; 2) To restore the ownership of the subject MERALCO shares of stock to the Land
Bank of the Philippines and to record the same in the Stock and Transfer Book of MERALCO; and
3) For the Philippine Stock Exchange, Inc. (PSE), the Philippine Depository and Trust Corporation (PDTC), the Securities Transfer Services, Inc. (STS), the Philippine Dealing System Holdings, Corp. and Subsidiaries (PDS Group) and any stockholder, dealer or agent of subject MERALCO shares to forthwith STOP: trading or dealing those shares and/or affecting settlement thereof, inter alia, so as to undo the foregoing contravening acts.
The Parent’s shares of stock in MERALCO are not part of the Agrarian Reform Fund (ARF), a fund which is solely answerable to the obligation of the National Government pursuant to its Agrarian Reform Program. In accordance with Section 63 of Republic Act 6657 (Comprehensive Agrarian Reform Law), assets of the bank cannot be used to pay for land acquisition as this shall only be sourced from the ARF. On December 14, 2011, the Supreme Court ruled in favor of the Parent. According to the High Court, the Parent’s liability under the Comprehensive Agrarian Reform Program (CARP) must be satisfied only from the ARF, it was also ruled that the levy of the Parent’s Meralco shares was void and ineffectual. As such, the Parent is entitled to all dividends. The Other party filed a Motion for Reconsideration and is also seeking a referral of the case to the Supreme Court, sitting En Banc. The Supreme Court has not required the Parent to file a Comment on the Petition, but the Parent commented and opposed the
31
referral of the case to the entire Supreme Court, arguing that the decision of a Division of the Supreme Court is the decision of the entire court. In a Resolution dated 25 June 2012, the Supreme Court denied with finality other party’s Motion for Reconsideration, including the motion for referral to the Supreme Court En Banc and the motion seeking the inhibition of Justice Bersamin from the case. The other party sought leave of court to file a Second Motion for Reconsideration and filed a Motion seeking a clarification of the ruling re. Justice Bersamin’s inhibition from the case. The Supreme Court later issued a Resolution simply noting other party’s motion. As the Supreme Court had issued an Entry for Judgement involving the decision dated 14 December 2011, LBP immediately filed a “Motion for the Issuance of Writ of Execution” with the Regional Agrarian Reform Adjudicator (RARAD), Region IV-A. The other parties filed several motions to further delay the implementation of the Supreme Court’s final and executory Decision dated 14 December 2011. LBP countered these with several “Very Urgent Manifestations and Motions” debunking the other parties arguments and reiterated its main contention that the execution of the High Court’s ruling in this case is completely ministerial in nature, which should be granted with utmost dispatch. The Regional Adjudicator had already denied the dilatory motion such as “Motion to Intervene,” “Motion to Inhibit” and “Motion to Dismiss.” The Regional Adjudicator after it had disposed of other party’s dilatory motions, issued a “Writ of Execution” on 01 April 2013 several months after LBP filed the “Motion for the Issuance of Writ of Execution” because other party was accorded the procedural due process to which she was entitled. MERALCO partially complied with the Sheriff’s Demand to Comply dated 12 April 2013 when 38,635,950 shares of stock were restored in the name of LBP. The Securities Transfer Services, Inc. issued the corresponding stock certificates in the name of LBP on 25 June 2013. There are still 3,364,050 shares of stock not yet restored in favor of LBP. Also, dividends due on the 42 million shares have not yet been paid and proceedings for the full implementation of the Supreme Court decision dated 14 December 2011 are still being conducted. Accumulated market gains/losses on AFS government and private issues as of December 31, 2012 amounted to 24,317.35 million. Net unrealized gains/losses on AFS was P24,701.59 million. The difference in the amount outstanding of the local currency accumulated market gains/losses and net unrealized gains/losses on AFS as of December 31, 2012 in the amount of P384.24 million, represents the remaining unamortized portion of the net unrealized gain or loss, that has been recognized directly in equity when the Available-for-sale securities has been reclassified to Held to maturity securities on various dates.
32
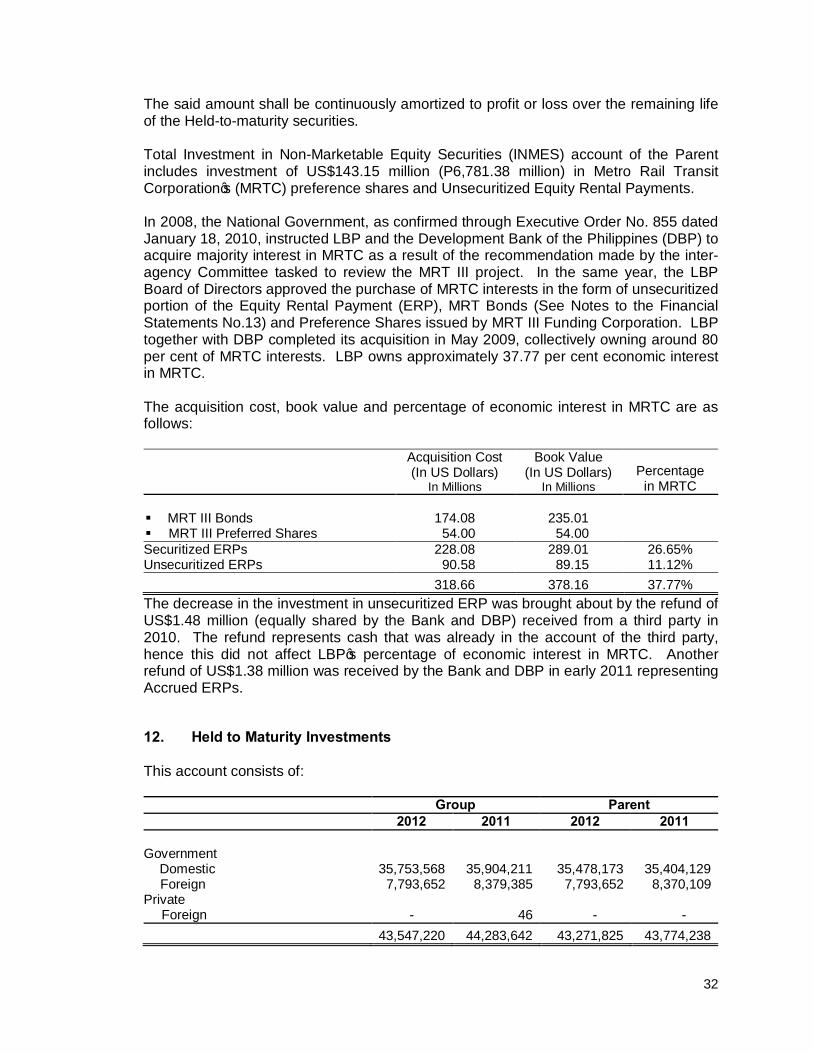
The said amount shall be continuously amortized to profit or loss over the remaining life of the Held-to-maturity securities. Total Investment in Non-Marketable Equity Securities (INMES) account of the Parent includes investment of US$143.15 million (P6,781.38 million) in Metro Rail Transit Corporation’s (MRTC) preference shares and Unsecuritized Equity Rental Payments. In 2008, the National Government, as confirmed through Executive Order No. 855 dated January 18, 2010, instructed LBP and the Development Bank of the Philippines (DBP) to acquire majority interest in MRTC as a result of the recommendation made by the inter-agency Committee tasked to review the MRT III project. In the same year, the LBP Board of Directors approved the purchase of MRTC interests in the form of unsecuritized portion of the Equity Rental Payment (ERP), MRT Bonds (See Notes to the Financial Statements No.13) and Preference Shares issued by MRT III Funding Corporation. LBP together with DBP completed its acquisition in May 2009, collectively owning around 80 per cent of MRTC interests. LBP owns approximately 37.77 per cent economic interest in MRTC. The acquisition cost, book value and percentage of economic interest in MRTC are as follows:
Acquisition Cost (In US Dollars)
In Millions
Book Value (In US Dollars)
In Millions Percentage
in MRTC § MRT III Bonds 174.08 235.01 § MRT III Preferred Shares 54.00 54.00 Securitized ERPs 228.08 289.01 26.65% Unsecuritized ERPs 90.58 89.15 11.12%
318.66 378.16 37.77% The decrease in the investment in unsecuritized ERP was brought about by the refund of US$1.48 million (equally shared by the Bank and DBP) received from a third party in 2010. The refund represents cash that was already in the account of the third party, hence this did not affect LBP’s percentage of economic interest in MRTC. Another refund of US$1.38 million was received by the Bank and DBP in early 2011 representing Accrued ERPs.
12. Held to Maturity Investments This account consists of: Group Parent
2012 2011 2012 2011
Government Domestic 35,753,568 35,904,211 35,478,173 35,404,129 Foreign 7,793,652 8,379,385 7,793,652 8,370,109
Private Foreign - 46 - -
43,547,220 44,283,642 43,271,825 43,774,238
33
Held to maturity investments of the Group carry interest rates at December 31 as follows: 2012 2011
Domestic 2.08% to 18.24% 5.75% to 18.25% Foreign 2.88% to 14.90% 2.88% to 14.90%
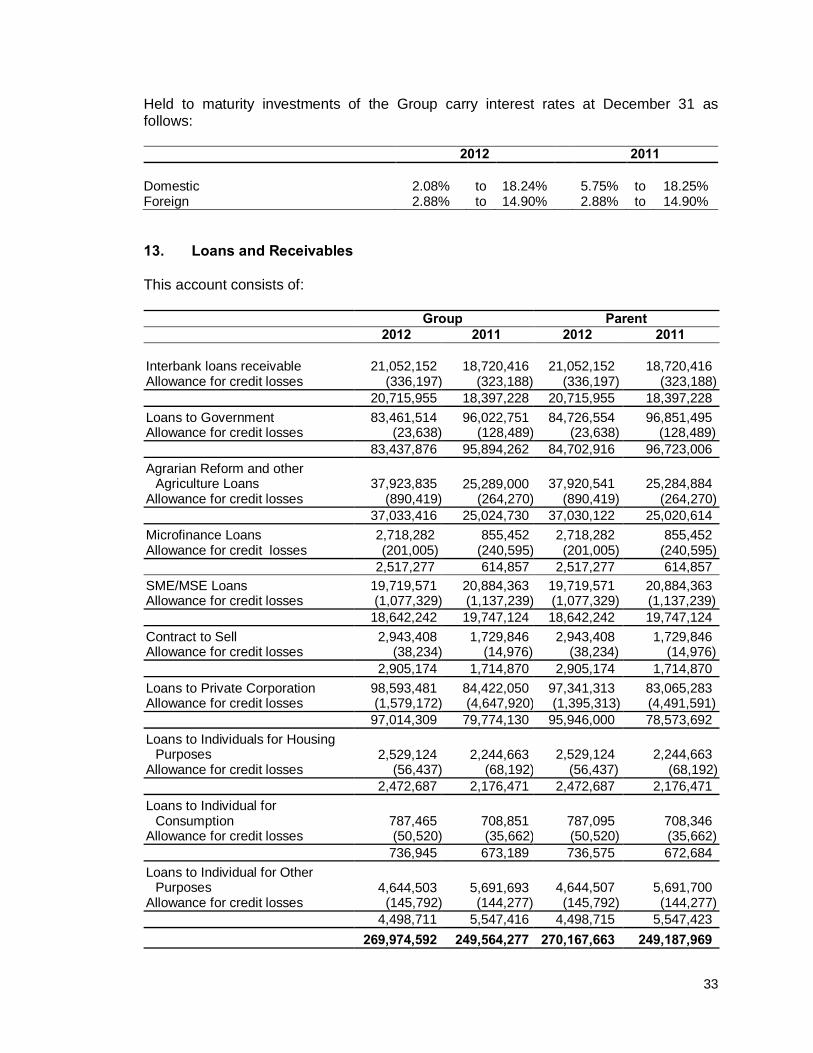
13. Loans and Receivables This account consists of: Group Parent 2012 2011 2012 2011 Interbank loans receivable 21,052,152 18,720,416 21,052,152 18,720,416 Allowance for credit losses (336,197) (323,188) (336,197) (323,188) 20,715,955 18,397,228 20,715,955 18,397,228 Loans to Government 83,461,514 96,022,751 84,726,554 96,851,495 Allowance for credit losses (23,638) (128,489) (23,638) (128,489) 83,437,876 95,894,262 84,702,916 96,723,006 Agrarian Reform and other
Agriculture Loans
37,923,835 25,289,000
37,920,541
25,284,884 Allowance for credit losses (890,419) (264,270) (890,419) (264,270) 37,033,416 25,024,730 37,030,122 25,020,614 Microfinance Loans 2,718,282 855,452 2,718,282 855,452 Allowance for credit losses (201,005) (240,595) (201,005) (240,595) 2,517,277 614,857 2,517,277 614,857 SME/MSE Loans 19,719,571 20,884,363 19,719,571 20,884,363 Allowance for credit losses (1,077,329) (1,137,239) (1,077,329) (1,137,239) 18,642,242 19,747,124 18,642,242 19,747,124 Contract to Sell 2,943,408 1,729,846 2,943,408 1,729,846 Allowance for credit losses (38,234) (14,976) (38,234) (14,976) 2,905,174 1,714,870 2,905,174 1,714,870 Loans to Private Corporation 98,593,481 84,422,050 97,341,313 83,065,283 Allowance for credit losses (1,579,172) (4,647,920) (1,395,313) (4,491,591) 97,014,309 79,774,130 95,946,000 78,573,692 Loans to Individuals for Housing
Purposes 2,529,124 2,244,663
2,529,124
2,244,663 Allowance for credit losses (56,437) (68,192) (56,437) (68,192) 2,472,687 2,176,471 2,472,687 2,176,471 Loans to Individual for
Consumption 787,465 708,851
787,095 708,346 Allowance for credit losses (50,520) (35,662) (50,520) (35,662) 736,945 673,189 736,575 672,684 Loans to Individual for Other
Purposes 4,644,503 5,691,693
4,644,507
5,691,700 Allowance for credit losses (145,792) (144,277) (145,792) (144,277) 4,498,711 5,547,416 4,498,715 5,547,423 269,974,592 249,564,277 270,167,663 249,187,969
34
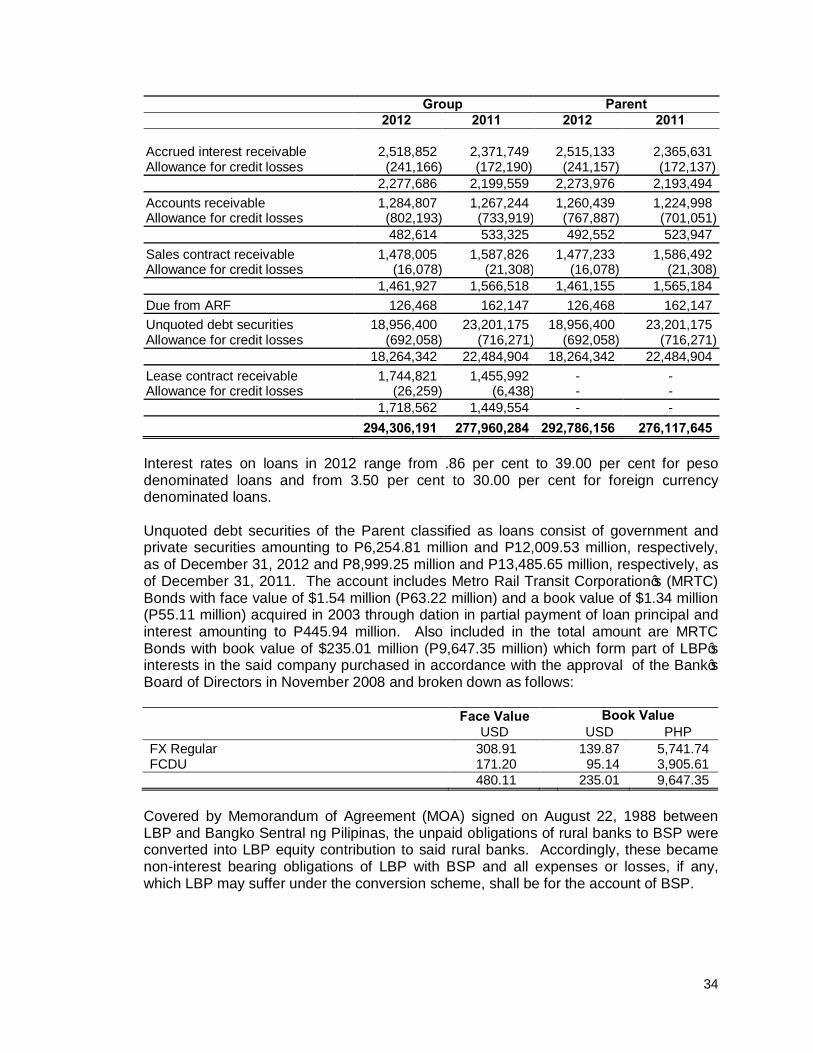
Group Parent 2012 2011 2012 2011 Accrued interest receivable 2,518,852 2,371,749 2,515,133 2,365,631 Allowance for credit losses (241,166) (172,190) (241,157) (172,137) 2,277,686 2,199,559 2,273,976 2,193,494 Accounts receivable 1,284,807 1,267,244 1,260,439 1,224,998 Allowance for credit losses (802,193) (733,919) (767,887) (701,051) 482,614 533,325 492,552 523,947 Sales contract receivable 1,478,005 1,587,826 1,477,233 1,586,492 Allowance for credit losses (16,078) (21,308) (16,078) (21,308) 1,461,927 1,566,518 1,461,155 1,565,184 Due from ARF 126,468 162,147 126,468 162,147 Unquoted debt securities 18,956,400 23,201,175 18,956,400 23,201,175 Allowance for credit losses (692,058) (716,271) (692,058) (716,271) 18,264,342 22,484,904 18,264,342 22,484,904 Lease contract receivable 1,744,821 1,455,992 - - Allowance for credit losses (26,259) (6,438) - - 1,718,562 1,449,554 - - 294,306,191 277,960,284 292,786,156 276,117,645 Interest rates on loans in 2012 range from .86 per cent to 39.00 per cent for peso denominated loans and from 3.50 per cent to 30.00 per cent for foreign currency denominated loans. Unquoted debt securities of the Parent classified as loans consist of government and private securities amounting to P6,254.81 million and P12,009.53 million, respectively, as of December 31, 2012 and P8,999.25 million and P13,485.65 million, respectively, as of December 31, 2011. The account includes Metro Rail Transit Corporation’s (MRTC) Bonds with face value of $1.54 million (P63.22 million) and a book value of $1.34 million (P55.11 million) acquired in 2003 through dation in partial payment of loan principal and interest amounting to P445.94 million. Also included in the total amount are MRTC Bonds with book value of $235.01 million (P9,647.35 million) which form part of LBP’s interests in the said company purchased in accordance with the approval of the Bank’s Board of Directors in November 2008 and broken down as follows: Face Value Book Value USD USD PHP FX Regular 308.91 139.87 5,741.74 FCDU 171.20 95.14 3,905.61 480.11 235.01 9,647.35
Covered by Memorandum of Agreement (MOA) signed on August 22, 1988 between LBP and Bangko Sentral ng Pilipinas, the unpaid obligations of rural banks to BSP were converted into LBP equity contribution to said rural banks. Accordingly, these became non-interest bearing obligations of LBP with BSP and all expenses or losses, if any, which LBP may suffer under the conversion scheme, shall be for the account of BSP.
35
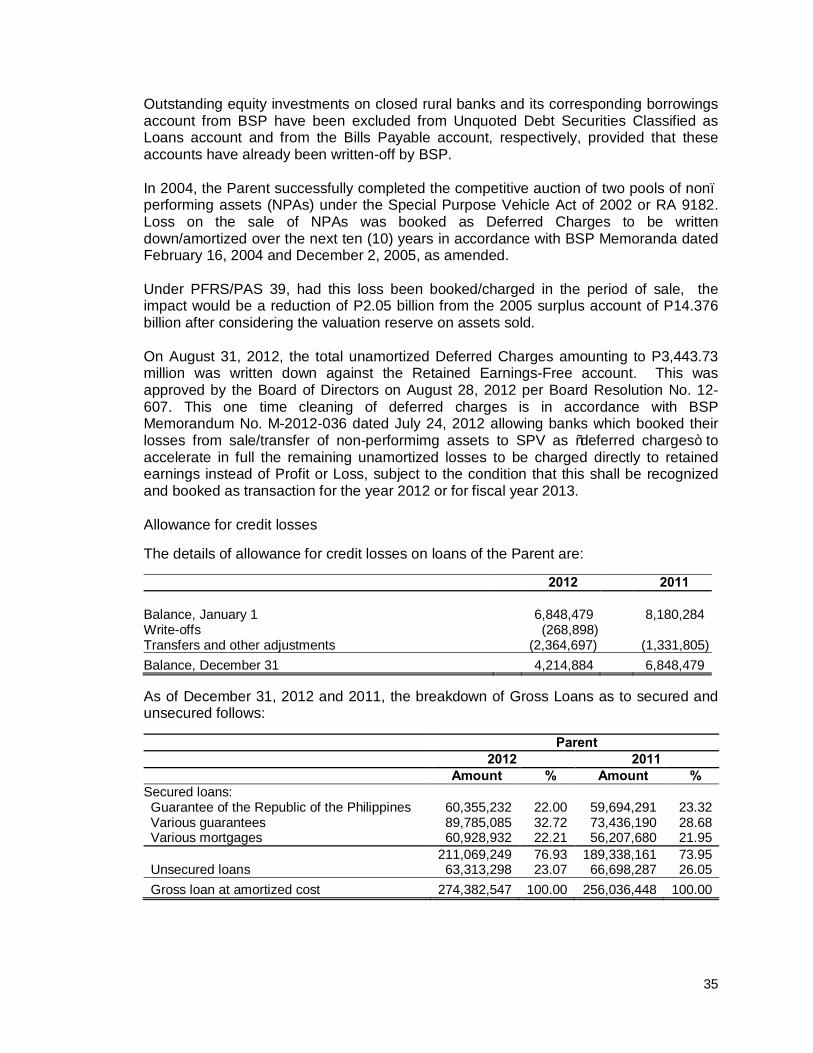
Outstanding equity investments on closed rural banks and its corresponding borrowings account from BSP have been excluded from Unquoted Debt Securities Classified as Loans account and from the Bills Payable account, respectively, provided that these accounts have already been written-off by BSP. In 2004, the Parent successfully completed the competitive auction of two pools of non–performing assets (NPAs) under the Special Purpose Vehicle Act of 2002 or RA 9182. Loss on the sale of NPAs was booked as Deferred Charges to be written down/amortized over the next ten (10) years in accordance with BSP Memoranda dated February 16, 2004 and December 2, 2005, as amended. Under PFRS/PAS 39, had this loss been booked/charged in the period of sale, the impact would be a reduction of P2.05 billion from the 2005 surplus account of P14.376 billion after considering the valuation reserve on assets sold. On August 31, 2012, the total unamortized Deferred Charges amounting to P3,443.73 million was written down against the Retained Earnings-Free account. This was approved by the Board of Directors on August 28, 2012 per Board Resolution No. 12-607. This one time cleaning of deferred charges is in accordance with BSP Memorandum No. M-2012-036 dated July 24, 2012 allowing banks which booked their losses from sale/transfer of non-performimg assets to SPV as “deferred charges” to accelerate in full the remaining unamortized losses to be charged directly to retained earnings instead of Profit or Loss, subject to the condition that this shall be recognized and booked as transaction for the year 2012 or for fiscal year 2013. Allowance for credit losses The details of allowance for credit losses on loans of the Parent are: 2012 2011
Balance, January 1 6,848,479 8,180,284 Write-offs (268,898) Transfers and other adjustments (2,364,697) (1,331,805) Balance, December 31 4,214,884 6,848,479
As of December 31, 2012 and 2011, the breakdown of Gross Loans as to secured and unsecured follows: Parent
2012 2011 Amount % Amount %
Secured loans: Guarantee of the Republic of the Philippines 60,355,232 22.00 59,694,291 23.32 Various guarantees 89,785,085 32.72 73,436,190 28.68 Various mortgages 60,928,932 22.21 56,207,680 21.95 211,069,249 76.93 189,338,161 73.95 Unsecured loans 63,313,298 23.07 66,698,287 26.05 Gross loan at amortized cost 274,382,547 100.00 256,036,448 100.00
36
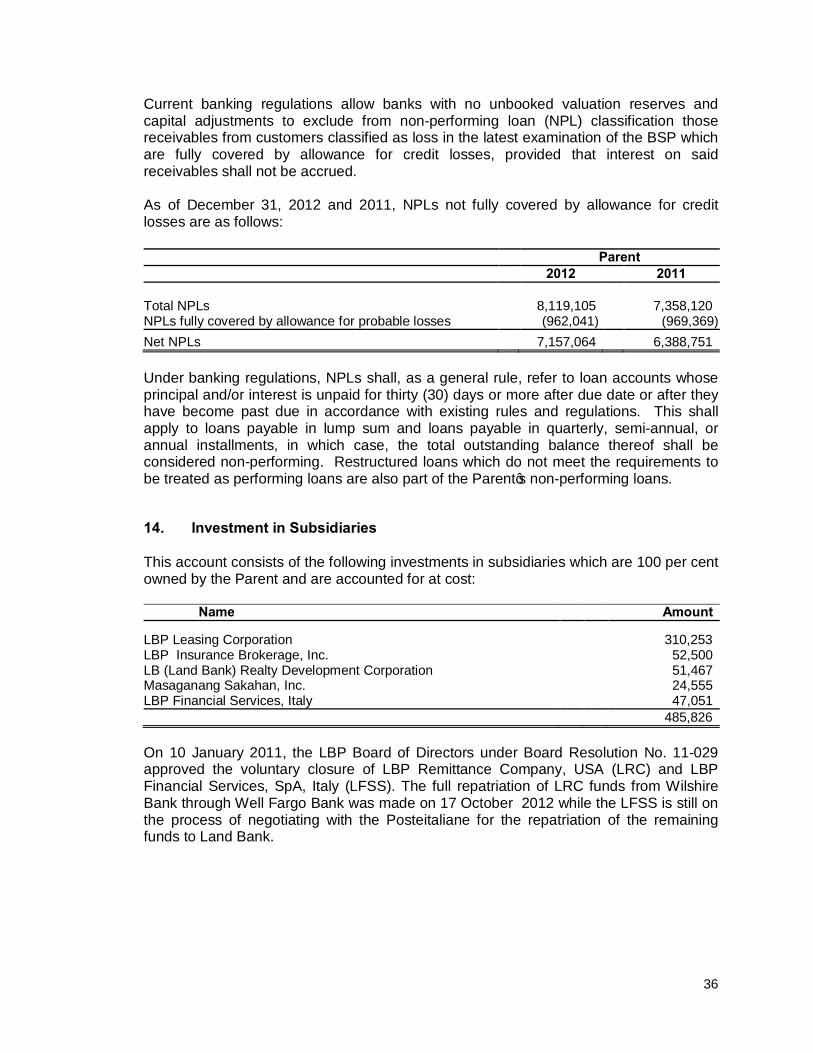
Current banking regulations allow banks with no unbooked valuation reserves and capital adjustments to exclude from non-performing loan (NPL) classification those receivables from customers classified as loss in the latest examination of the BSP which are fully covered by allowance for credit losses, provided that interest on said receivables shall not be accrued. As of December 31, 2012 and 2011, NPLs not fully covered by allowance for credit losses are as follows: Parent 2012 2011
Total NPLs 8,119,105 7,358,120 NPLs fully covered by allowance for probable losses (962,041) (969,369) Net NPLs 7,157,064 6,388,751 Under banking regulations, NPLs shall, as a general rule, refer to loan accounts whose principal and/or interest is unpaid for thirty (30) days or more after due date or after they have become past due in accordance with existing rules and regulations. This shall apply to loans payable in lump sum and loans payable in quarterly, semi-annual, or annual installments, in which case, the total outstanding balance thereof shall be considered non-performing. Restructured loans which do not meet the requirements to be treated as performing loans are also part of the Parent’s non-performing loans.
14. Investment in Subsidiaries This account consists of the following investments in subsidiaries which are 100 per cent owned by the Parent and are accounted for at cost: Name Amount
LBP Leasing Corporation 310,253 LBP Insurance Brokerage, Inc. 52,500 LB (Land Bank) Realty Development Corporation 51,467 Masaganang Sakahan, Inc. 24,555 LBP Financial Services, Italy 47,051 485,826
On 10 January 2011, the LBP Board of Directors under Board Resolution No. 11-029 approved the voluntary closure of LBP Remittance Company, USA (LRC) and LBP Financial Services, SpA, Italy (LFSS). The full repatriation of LRC funds from Wilshire Bank through Well Fargo Bank was made on 17 October 2012 while the LFSS is still on the process of negotiating with the Posteitaliane for the repatriation of the remaining funds to Land Bank.
37
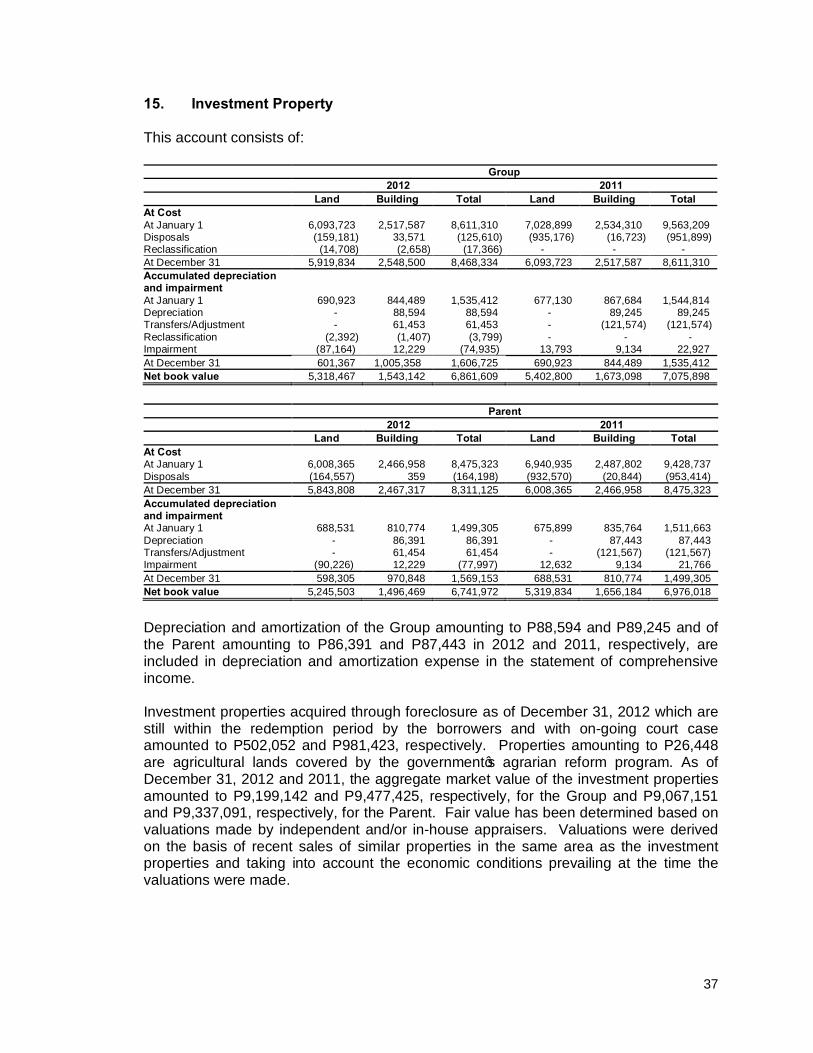
15. Investment Property This account consists of:
Group 2012 2011 Land Building Total Land Building Total
At Cost At January 1 6,093,723 2,517,587 8,611,310 7,028,899 2,534,310 9,563,209 Disposals (159,181) 33,571 (125,610) (935,176) (16,723) (951,899) Reclassification (14,708) (2,658) (17,366) - - - At December 31 5,919,834 2,548,500 8,468,334 6,093,723 2,517,587 8,611,310 Accumulated depreciation and impairment At January 1 690,923 844,489 1,535,412 677,130 867,684 1,544,814 Depreciation - 88,594 88,594 - 89,245 89,245 Transfers/Adjustment - 61,453 61,453 - (121,574) (121,574) Reclassification (2,392) (1,407) (3,799) - - - Impairment (87,164) 12,229 (74,935) 13,793 9,134 22,927 At December 31 601,367 1,005,358 1,606,725 690,923 844,489 1,535,412 Net book value 5,318,467 1,543,142 6,861,609 5,402,800 1,673,098 7,075,898
Parent
2012 2011 Land Building Total Land Building Total
At Cost At January 1 6,008,365 2,466,958 8,475,323 6,940,935 2,487,802 9,428,737 Disposals (164,557) 359 (164,198) (932,570) (20,844) (953,414) At December 31 5,843,808 2,467,317 8,311,125 6,008,365 2,466,958 8,475,323 Accumulated depreciation and impairment At January 1 688,531 810,774 1,499,305 675,899 835,764 1,511,663 Depreciation - 86,391 86,391 - 87,443 87,443 Transfers/Adjustment - 61,454 61,454 - (121,567) (121,567) Impairment (90,226) 12,229 (77,997) 12,632 9,134 21,766 At December 31 598,305 970,848 1,569,153 688,531 810,774 1,499,305 Net book value 5,245,503 1,496,469 6,741,972 5,319,834 1,656,184 6,976,018
Depreciation and amortization of the Group amounting to P88,594 and P89,245 and of the Parent amounting to P86,391 and P87,443 in 2012 and 2011, respectively, are included in depreciation and amortization expense in the statement of comprehensive income. Investment properties acquired through foreclosure as of December 31, 2012 which are still within the redemption period by the borrowers and with on-going court case amounted to P502,052 and P981,423, respectively. Properties amounting to P26,448 are agricultural lands covered by the government’s agrarian reform program. As of December 31, 2012 and 2011, the aggregate market value of the investment properties amounted to P9,199,142 and P9,477,425, respectively, for the Group and P9,067,151 and P9,337,091, respectively, for the Parent. Fair value has been determined based on valuations made by independent and/or in-house appraisers. Valuations were derived on the basis of recent sales of similar properties in the same area as the investment properties and taking into account the economic conditions prevailing at the time the valuations were made.
38
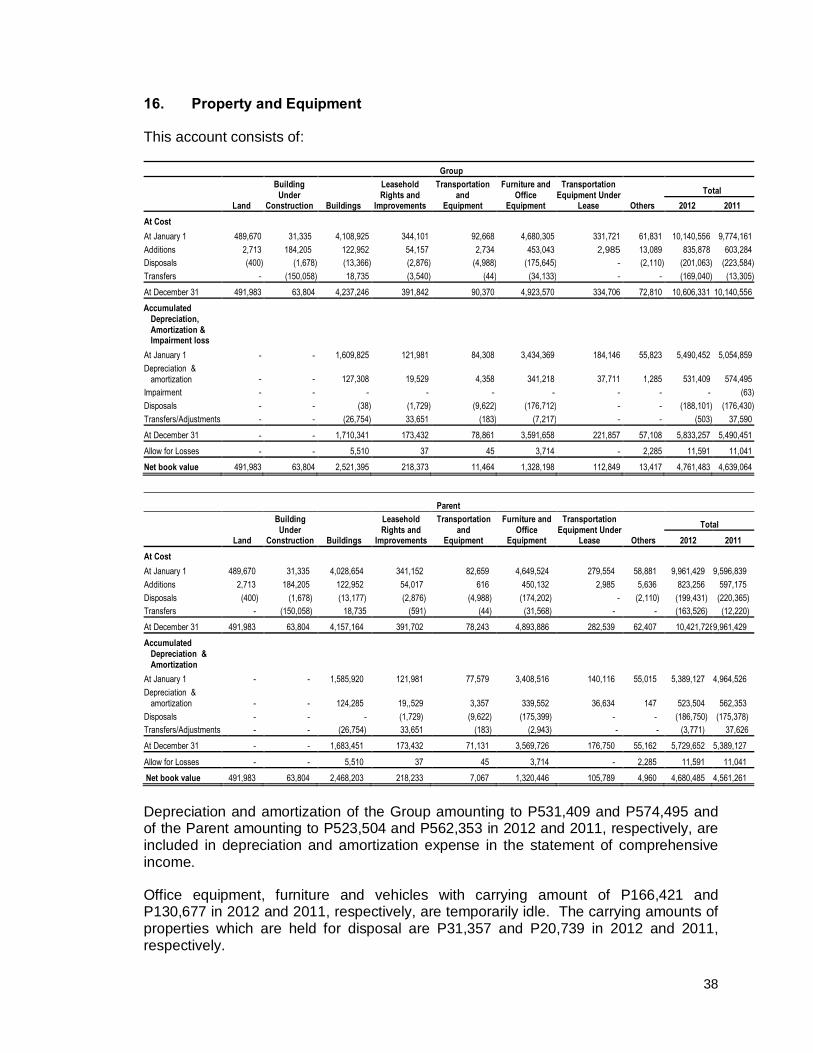
16. Property and Equipment This account consists of:
Group
Land
Building Under
Construction Buildings
Leasehold Rights and
Improvements
Transportation and
Equipment
Furniture and Office
Equipment
Transportation Equipment Under
Lease Others Total
2012 2011 At Cost At January 1 489,670 31,335 4,108,925 344,101 92,668 4,680,305 331,721 61,831 10,140,556 9,774,161 Additions 2,713 184,205 122,952 54,157 2,734 453,043 2,985 13,089 835,878 603,284 Disposals (400) (1,678) (13,366) (2,876) (4,988) (175,645) - (2,110) (201,063) (223,584)Transfers - (150,058) 18,735 (3,540) (44) (34,133) - - (169,040) (13,305)At December 31 491,983 63,804 4,237,246 391,842 90,370 4,923,570 334,706 72,810 10,606,331 10,140,556 Accumulated
Depreciation, Amortization & Impairment loss
At January 1 - - 1,609,825 121,981 84,308 3,434,369 184,146 55,823 5,490,452 5,054,859 Depreciation &
amortization - - 127,308 19,529 4,358 341,218 37,711 1,285 531,409 574,495 Impairment - - - - - - - - - (63)Disposals - - (38) (1,729) (9,622) (176,712) - - (188,101) (176,430)Transfers/Adjustments - - (26,754) 33,651 (183) (7,217) - - (503) 37,590 At December 31 - - 1,710,341 173,432 78,861 3,591,658 221,857 57,108 5,833,257 5,490,451 Allow for Losses - - 5,510 37 45 3,714 - 2,285 11,591 11,041 Net book value 491,983 63,804 2,521,395 218,373 11,464 1,328,198 112,849 13,417 4,761,483 4,639,064
Parent
Land
Building Under
Construction Buildings
Leasehold Rights and
Improvements
Transportation and
Equipment
Furniture and Office
Equipment
Transportation Equipment Under
Lease Others Total
2012 2011 At Cost At January 1 489,670 31,335 4,028,654 341,152 82,659 4,649,524 279,554 58,881 9,961,429 9,596,839 Additions 2,713 184,205 122,952 54,017 616 450,132 2,985 5,636 823,256 597,175 Disposals (400) (1,678) (13,177) (2,876) (4,988) (174,202) - (2,110) (199,431) (220,365) Transfers - (150,058) 18,735 (591) (44) (31,568) - - (163,526) (12,220) At December 31 491,983 63,804 4,157,164 391,702 78,243 4,893,886 282,539 62,407 10,421,7289,961,429 Accumulated
Depreciation & Amortization
At January 1 - - 1,585,920 121,981 77,579 3,408,516 140,116 55,015 5,389,127 4,964,526 Depreciation &
amortization - - 124,285 19,,529 3,357 339,552 36,634 147 523,504 562,353 Disposals - - - (1,729) (9,622) (175,399) - - (186,750) (175,378) Transfers/Adjustments - - (26,754) 33,651 (183) (2,943) - - (3,771) 37,626 At December 31 - - 1,683,451 173,432 71,131 3,569,726 176,750 55,162 5,729,652 5,389,127
Allow for Losses - - 5,510 37 45 3,714 - 2,285 11,591 11,041 Net book value 491,983 63,804 2,468,203 218,233 7,067 1,320,446 105,789 4,960 4,680,485 4,561,261
Depreciation and amortization of the Group amounting to P531,409 and P574,495 and of the Parent amounting to P523,504 and P562,353 in 2012 and 2011, respectively, are included in depreciation and amortization expense in the statement of comprehensive income. Office equipment, furniture and vehicles with carrying amount of P166,421 and P130,677 in 2012 and 2011, respectively, are temporarily idle. The carrying amounts of properties which are held for disposal are P31,357 and P20,739 in 2012 and 2011, respectively.
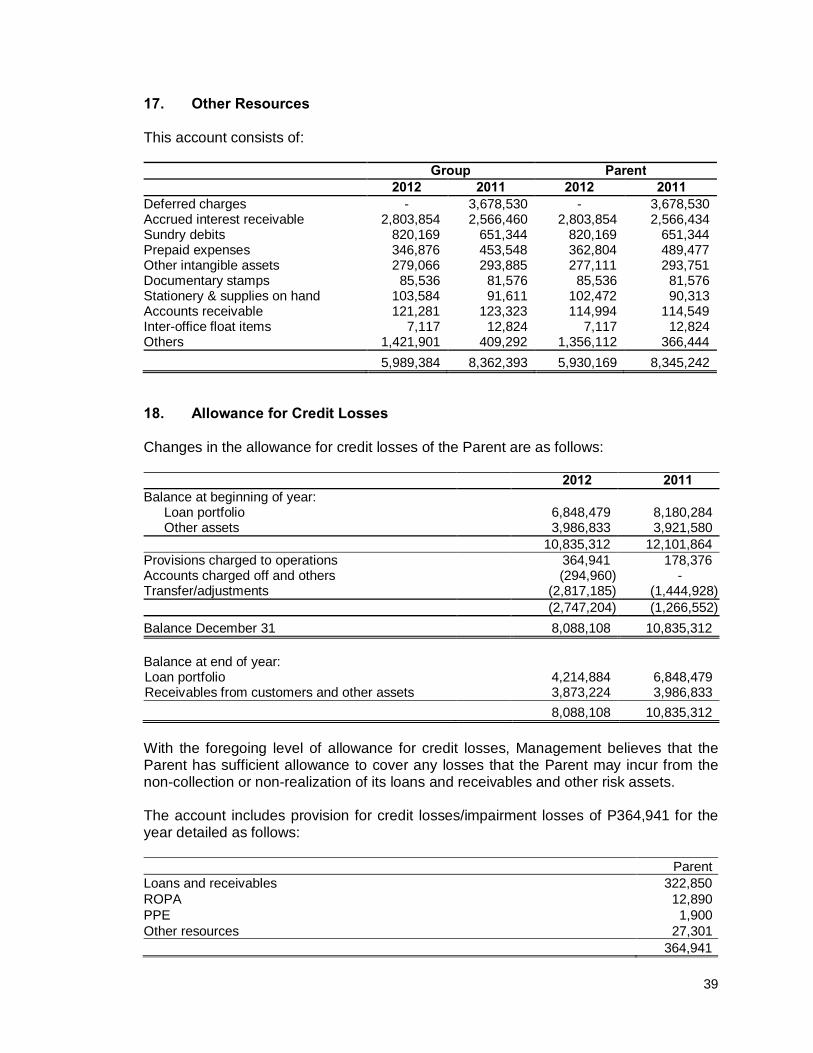
39
17. Other Resources This account consists of: Group Parent 2012 2011 2012 2011
Deferred charges - 3,678,530 - 3,678,530 Accrued interest receivable 2,803,854 2,566,460 2,803,854 2,566,434 Sundry debits 820,169 651,344 820,169 651,344 Prepaid expenses 346,876 453,548 362,804 489,477 Other intangible assets 279,066 293,885 277,111 293,751 Documentary stamps 85,536 81,576 85,536 81,576 Stationery & supplies on hand 103,584 91,611 102,472 90,313 Accounts receivable 121,281 123,323 114,994 114,549 Inter-office float items 7,117 12,824 7,117 12,824 Others 1,421,901 409,292 1,356,112 366,444
5,989,384 8,362,393 5,930,169 8,345,242
18. Allowance for Credit Losses Changes in the allowance for credit losses of the Parent are as follows: 2012 2011
Balance at beginning of year: Loan portfolio 6,848,479 8,180,284 Other assets 3,986,833 3,921,580
10,835,312 12,101,864 Provisions charged to operations 364,941 178,376 Accounts charged off and others (294,960) - Transfer/adjustments (2,817,185) (1,444,928) (2,747,204) (1,266,552)
Balance December 31 8,088,108 10,835,312 Balance at end of year: Loan portfolio 4,214,884 6,848,479 Receivables from customers and other assets 3,873,224 3,986,833
8,088,108 10,835,312 With the foregoing level of allowance for credit losses, Management believes that the Parent has sufficient allowance to cover any losses that the Parent may incur from the non-collection or non-realization of its loans and receivables and other risk assets. The account includes provision for credit losses/impairment losses of P364,941 for the year detailed as follows: Parent Loans and receivables 322,850 ROPA 12,890 PPE 1,900 Other resources 27,301 364,941
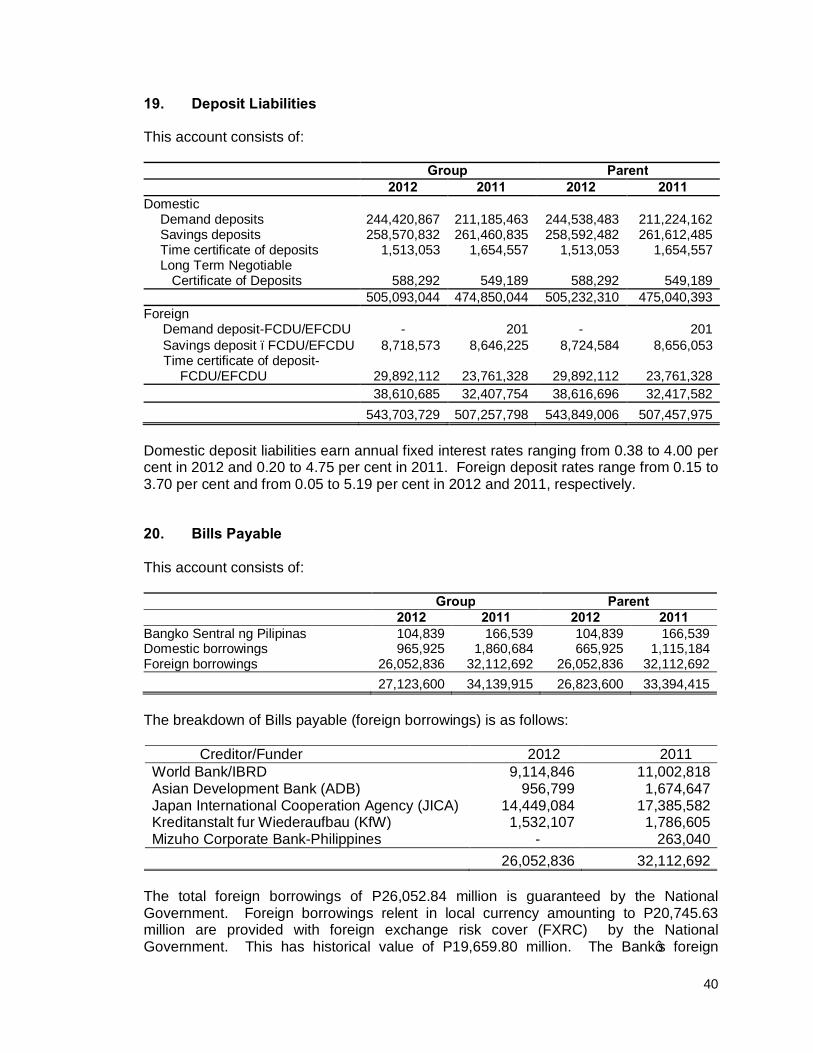
40
19. Deposit Liabilities This account consists of:
Group Parent 2012 2011 2012 2011
Domestic Demand deposits 244,420,867 211,185,463 244,538,483 211,224,162 Savings deposits 258,570,832 261,460,835 258,592,482 261,612,485 Time certificate of deposits 1,513,053 1,654,557 1,513,053 1,654,557 Long Term Negotiable
Certificate of Deposits 588,292 549,189 588,292 549,189 505,093,044 474,850,044 505,232,310 475,040,393
Foreign Demand deposit-FCDU/EFCDU - 201 - 201 Savings deposit –FCDU/EFCDU 8,718,573 8,646,225 8,724,584 8,656,053 Time certificate of deposit-
FCDU/EFCDU 29,892,112 23,761,328 29,892,112 23,761,328 38,610,685 32,407,754 38,616,696 32,417,582 543,703,729 507,257,798 543,849,006 507,457,975
Domestic deposit liabilities earn annual fixed interest rates ranging from 0.38 to 4.00 per cent in 2012 and 0.20 to 4.75 per cent in 2011. Foreign deposit rates range from 0.15 to 3.70 per cent and from 0.05 to 5.19 per cent in 2012 and 2011, respectively.
20. Bills Payable This account consists of: Group Parent 2012 2011 2012 2011
Bangko Sentral ng Pilipinas 104,839 166,539 104,839 166,539 Domestic borrowings 965,925 1,860,684 665,925 1,115,184 Foreign borrowings 26,052,836 32,112,692 26,052,836 32,112,692
27,123,600 34,139,915 26,823,600 33,394,415 The breakdown of Bills payable (foreign borrowings) is as follows:
Creditor/Funder 2012 2011 World Bank/IBRD 9,114,846 11,002,818 Asian Development Bank (ADB) 956,799 1,674,647 Japan International Cooperation Agency (JICA) 14,449,084 17,385,582 Kreditanstalt fur Wiederaufbau (KfW) 1,532,107 1,786,605 Mizuho Corporate Bank-Philippines - 263,040
26,052,836 32,112,692 The total foreign borrowings of P26,052.84 million is guaranteed by the National Government. Foreign borrowings relent in local currency amounting to P20,745.63 million are provided with foreign exchange risk cover (FXRC) by the National Government. This has historical value of P19,659.80 million. The Bank’s foreign
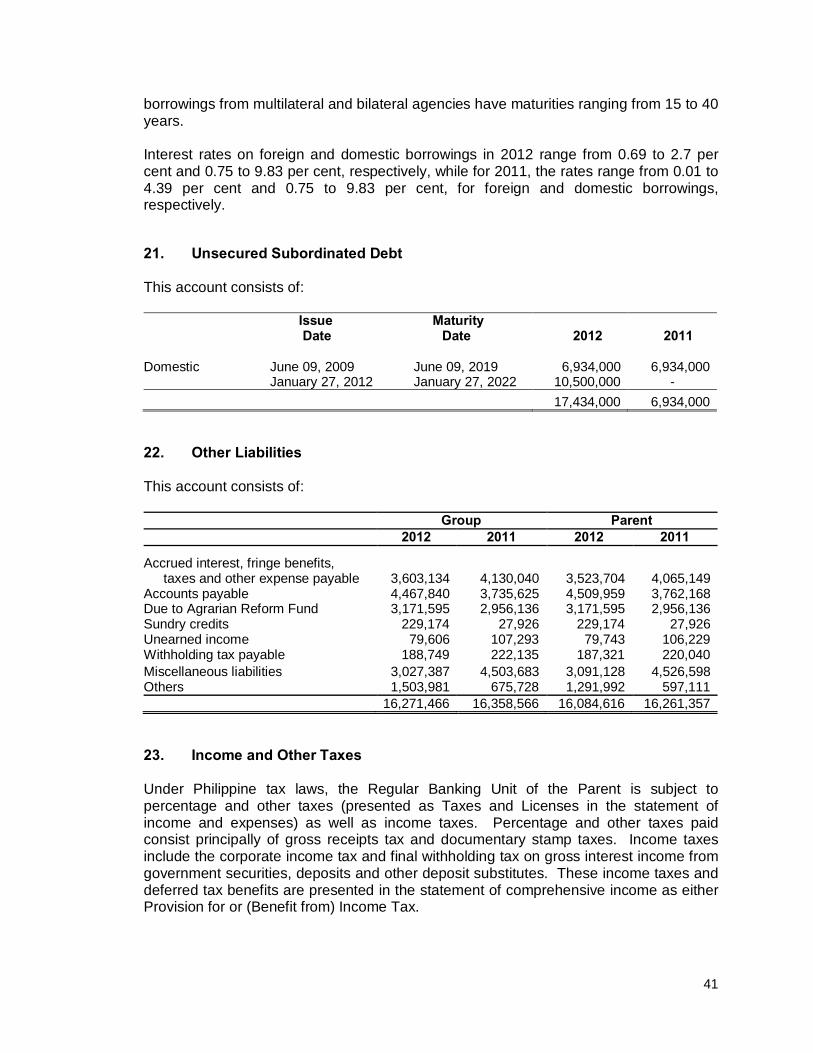
41
borrowings from multilateral and bilateral agencies have maturities ranging from 15 to 40 years. Interest rates on foreign and domestic borrowings in 2012 range from 0.69 to 2.7 per cent and 0.75 to 9.83 per cent, respectively, while for 2011, the rates range from 0.01 to 4.39 per cent and 0.75 to 9.83 per cent, for foreign and domestic borrowings, respectively.
21. Unsecured Subordinated Debt This account consists of: Issue Maturity Date Date
2012
2011
Domestic June 09, 2009 June 09, 2019 6,934,000 6,934,000 January 27, 2012 January 27, 2022 10,500,000 -
17,434,000 6,934,000
22. Other Liabilities This account consists of: Group Parent 2012 2011 2012 2011
Accrued interest, fringe benefits, taxes and other expense payable 3,603,134 4,130,040 3,523,704 4,065,149
Accounts payable 4,467,840 3,735,625 4,509,959 3,762,168 Due to Agrarian Reform Fund 3,171,595 2,956,136 3,171,595 2,956,136 Sundry credits 229,174 27,926 229,174 27,926 Unearned income 79,606 107,293 79,743 106,229 Withholding tax payable 188,749 222,135 187,321 220,040 Miscellaneous liabilities 3,027,387 4,503,683 3,091,128 4,526,598 Others 1,503,981 675,728 1,291,992 597,111
16,271,466 16,358,566 16,084,616 16,261,357
23. Income and Other Taxes Under Philippine tax laws, the Regular Banking Unit of the Parent is subject to percentage and other taxes (presented as Taxes and Licenses in the statement of income and expenses) as well as income taxes. Percentage and other taxes paid consist principally of gross receipts tax and documentary stamp taxes. Income taxes include the corporate income tax and final withholding tax on gross interest income from government securities, deposits and other deposit substitutes. These income taxes and deferred tax benefits are presented in the statement of comprehensive income as either Provision for or (Benefit from) Income Tax.
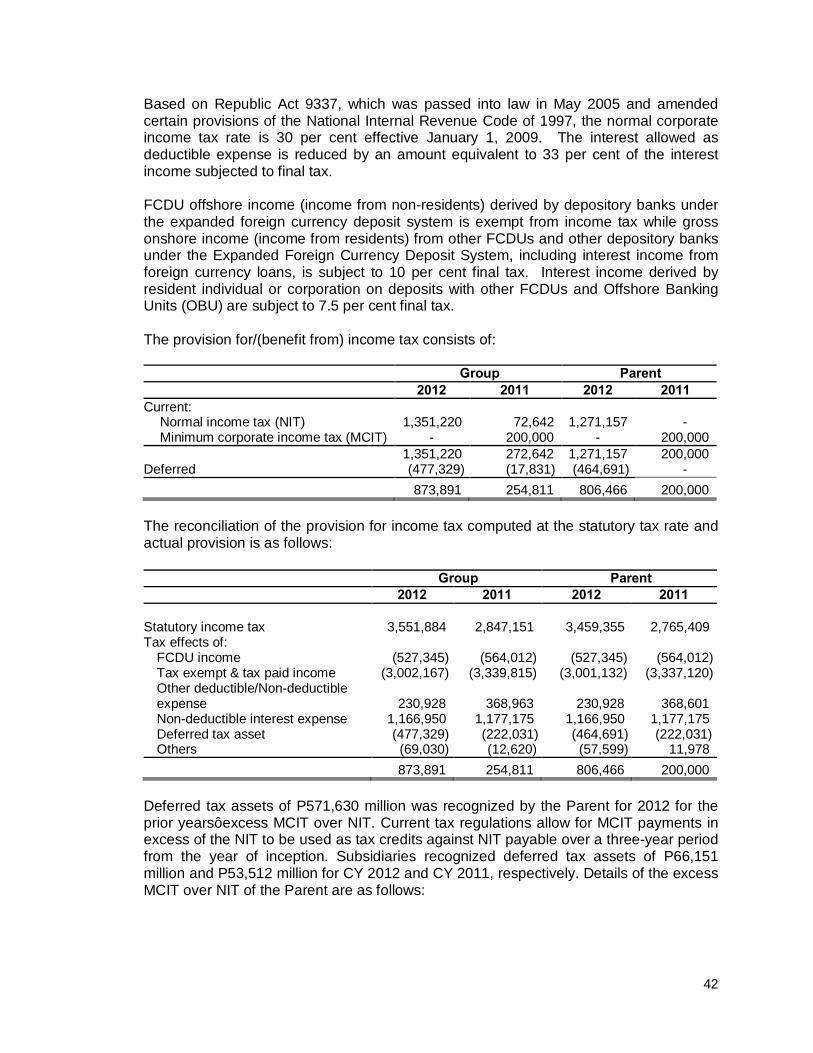
42
Based on Republic Act 9337, which was passed into law in May 2005 and amended certain provisions of the National Internal Revenue Code of 1997, the normal corporate income tax rate is 30 per cent effective January 1, 2009. The interest allowed as deductible expense is reduced by an amount equivalent to 33 per cent of the interest income subjected to final tax. FCDU offshore income (income from non-residents) derived by depository banks under the expanded foreign currency deposit system is exempt from income tax while gross onshore income (income from residents) from other FCDUs and other depository banks under the Expanded Foreign Currency Deposit System, including interest income from foreign currency loans, is subject to 10 per cent final tax. Interest income derived by resident individual or corporation on deposits with other FCDUs and Offshore Banking Units (OBU) are subject to 7.5 per cent final tax. The provision for/(benefit from) income tax consists of: Group Parent 2012 2011 2012 2011
Current: Normal income tax (NIT) 1,351,220 72,642 1,271,157 - Minimum corporate income tax (MCIT) - 200,000 - 200,000
1,351,220 272,642 1,271,157 200,000 Deferred (477,329) (17,831) (464,691) -
873,891 254,811 806,466 200,000 The reconciliation of the provision for income tax computed at the statutory tax rate and actual provision is as follows: Group Parent 2012 2011 2012 2011
Statutory income tax 3,551,884 2,847,151 3,459,355 2,765,409 Tax effects of:
FCDU income (527,345) (564,012) (527,345) (564,012) Tax exempt & tax paid income (3,002,167) (3,339,815) (3,001,132) (3,337,120) Other deductible/Non-deductible expense 230,928 368,963 230,928 368,601 Non-deductible interest expense 1,166,950 1,177,175 1,166,950 1,177,175 Deferred tax asset (477,329) (222,031) (464,691) (222,031) Others (69,030) (12,620) (57,599) 11,978
873,891 254,811 806,466 200,000 Deferred tax assets of P571,630 million was recognized by the Parent for 2012 for the prior years’ excess MCIT over NIT. Current tax regulations allow for MCIT payments in excess of the NIT to be used as tax credits against NIT payable over a three-year period from the year of inception. Subsidiaries recognized deferred tax assets of P66,151 million and P53,512 million for CY 2012 and CY 2011, respectively. Details of the excess MCIT over NIT of the Parent are as follows:
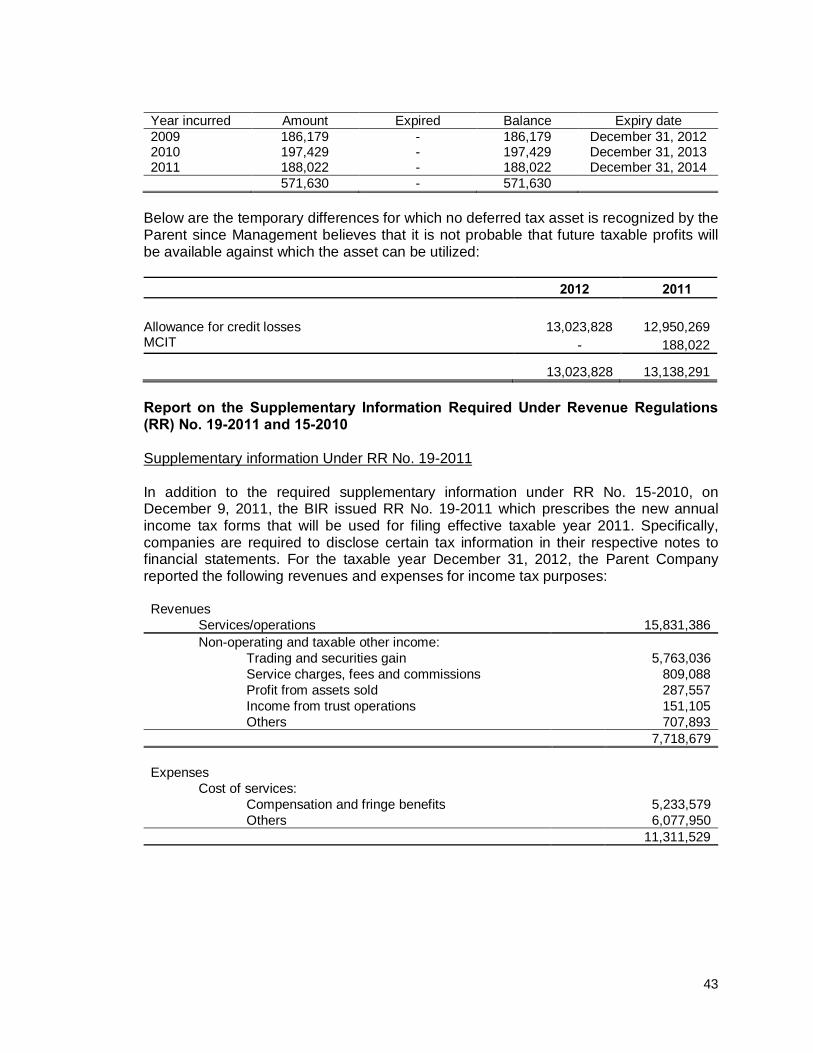
43
Year incurred Amount Expired Balance Expiry date 2009 186,179 - 186,179 December 31, 2012 2010 197,429 - 197,429 December 31, 2013 2011 188,022 - 188,022 December 31, 2014 571,630 - 571,630
Below are the temporary differences for which no deferred tax asset is recognized by the Parent since Management believes that it is not probable that future taxable profits will be available against which the asset can be utilized: 2012 2011
Allowance for credit losses 13,023,828 12,950,269 MCIT - 188,022
13,023,828 13,138,291 Report on the Supplementary Information Required Under Revenue Regulations (RR) No. 19-2011 and 15-2010 Supplementary information Under RR No. 19-2011 In addition to the required supplementary information under RR No. 15-2010, on December 9, 2011, the BIR issued RR No. 19-2011 which prescribes the new annual income tax forms that will be used for filing effective taxable year 2011. Specifically, companies are required to disclose certain tax information in their respective notes to financial statements. For the taxable year December 31, 2012, the Parent Company reported the following revenues and expenses for income tax purposes: Revenues
Services/operations 15,831,386 Non-operating and taxable other income: Trading and securities gain 5,763,036 Service charges, fees and commissions 809,088 Profit from assets sold 287,557 Income from trust operations 151,105 Others 707,893 7,718,679 Expenses
Cost of services: Compensation and fringe benefits 5,233,579 Others 6,077,950 11,311,529
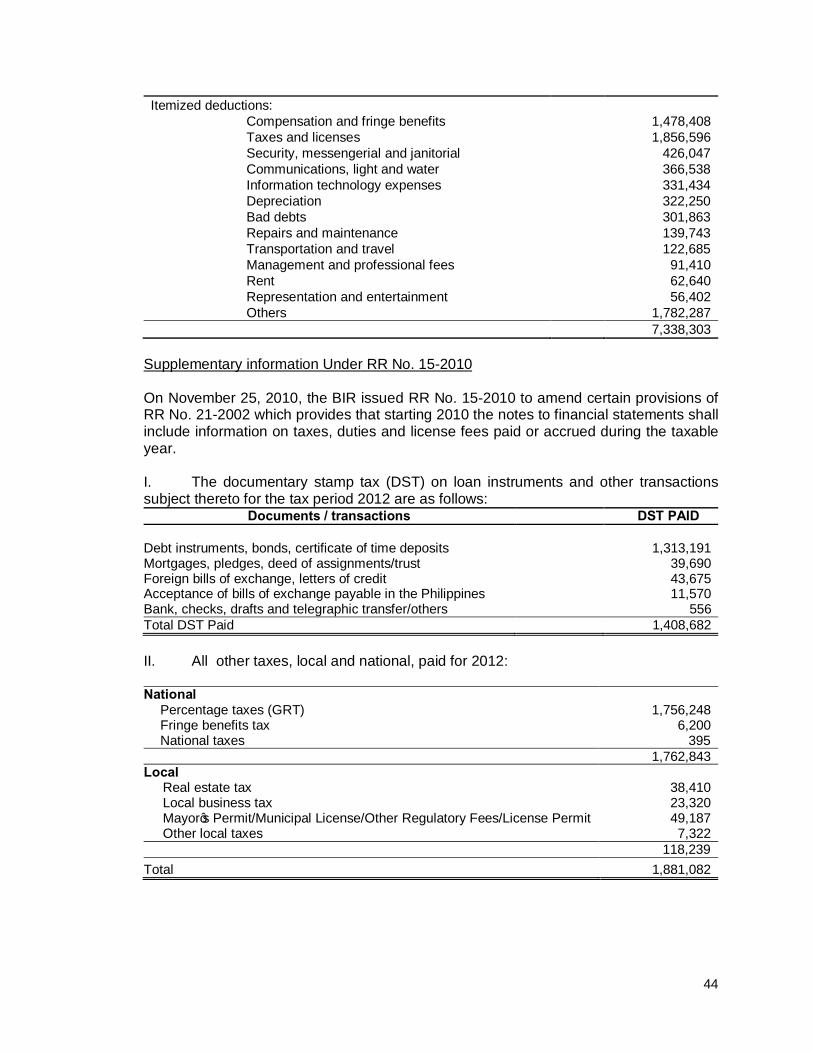
44
Itemized deductions: Compensation and fringe benefits 1,478,408 Taxes and licenses 1,856,596 Security, messengerial and janitorial 426,047 Communications, light and water 366,538 Information technology expenses 331,434 Depreciation 322,250 Bad debts 301,863 Repairs and maintenance 139,743 Transportation and travel 122,685 Management and professional fees 91,410 Rent 62,640 Representation and entertainment 56,402 Others 1,782,287 7,338,303
Supplementary information Under RR No. 15-2010 On November 25, 2010, the BIR issued RR No. 15-2010 to amend certain provisions of RR No. 21-2002 which provides that starting 2010 the notes to financial statements shall include information on taxes, duties and license fees paid or accrued during the taxable year. I. The documentary stamp tax (DST) on loan instruments and other transactions subject thereto for the tax period 2012 are as follows:
Documents / transactions DST PAID
Debt instruments, bonds, certificate of time deposits 1,313,191 Mortgages, pledges, deed of assignments/trust 39,690 Foreign bills of exchange, letters of credit 43,675 Acceptance of bills of exchange payable in the Philippines 11,570 Bank, checks, drafts and telegraphic transfer/others 556 Total DST Paid 1,408,682 II. All other taxes, local and national, paid for 2012: National
Percentage taxes (GRT) 1,756,248 Fringe benefits tax 6,200 National taxes 395 1,762,843
Local Real estate tax 38,410 Local business tax 23,320 Mayor’s Permit/Municipal License/Other Regulatory Fees/License Permit 49,187 Other local taxes 7,322 118,239
Total 1,881,082
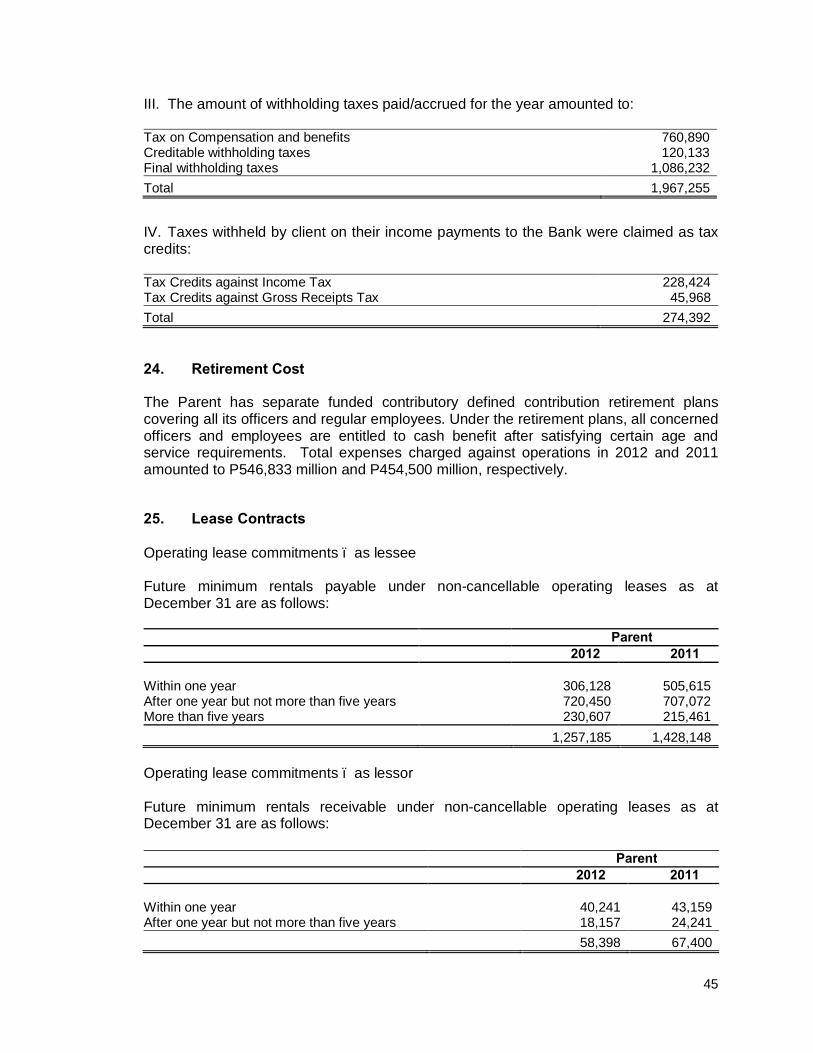
45
III. The amount of withholding taxes paid/accrued for the year amounted to: Tax on Compensation and benefits 760,890 Creditable withholding taxes 120,133 Final withholding taxes 1,086,232 Total 1,967,255
IV. Taxes withheld by client on their income payments to the Bank were claimed as tax credits: Tax Credits against Income Tax 228,424 Tax Credits against Gross Receipts Tax 45,968 Total 274,392
24. Retirement Cost The Parent has separate funded contributory defined contribution retirement plans covering all its officers and regular employees. Under the retirement plans, all concerned officers and employees are entitled to cash benefit after satisfying certain age and service requirements. Total expenses charged against operations in 2012 and 2011 amounted to P546,833 million and P454,500 million, respectively.
25. Lease Contracts Operating lease commitments – as lessee Future minimum rentals payable under non-cancellable operating leases as at December 31 are as follows: Parent 2012 2011
Within one year 306,128 505,615 After one year but not more than five years 720,450 707,072 More than five years 230,607 215,461
1,257,185 1,428,148 Operating lease commitments – as lessor Future minimum rentals receivable under non-cancellable operating leases as at December 31 are as follows:
Parent 2012 2011
Within one year 40,241 43,159 After one year but not more than five years 18,157 24,241
58,398 67,400
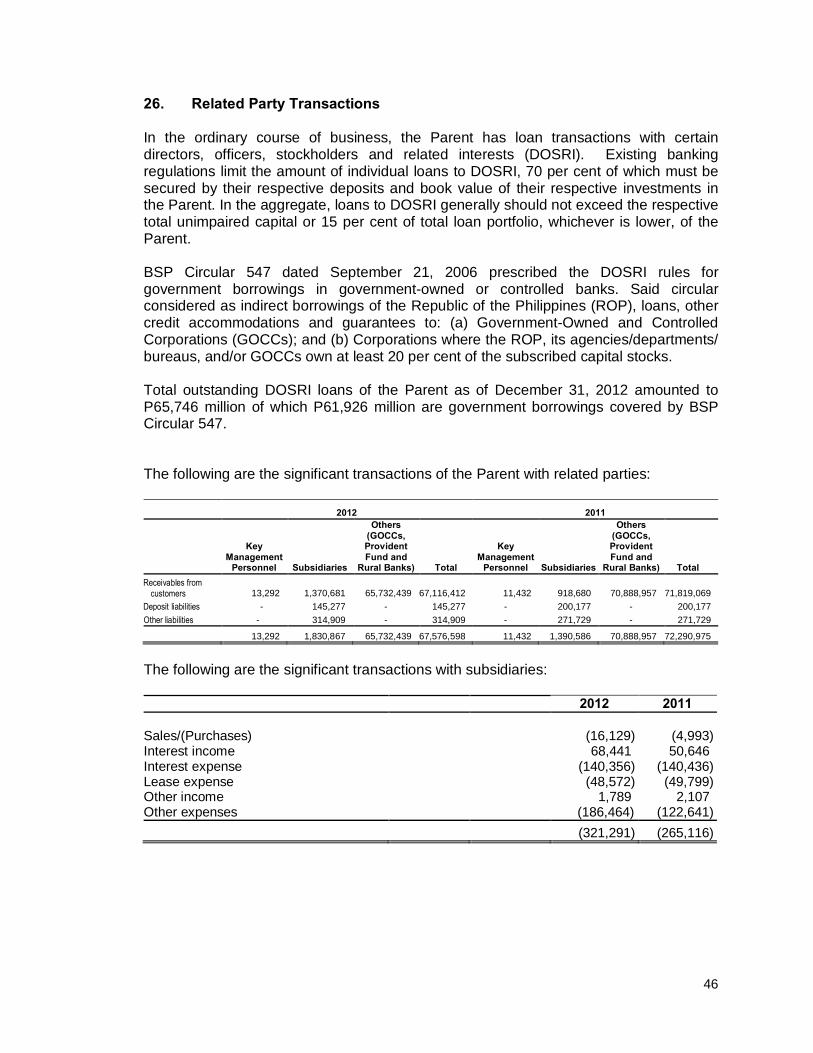
46
26. Related Party Transactions In the ordinary course of business, the Parent has loan transactions with certain directors, officers, stockholders and related interests (DOSRI). Existing banking regulations limit the amount of individual loans to DOSRI, 70 per cent of which must be secured by their respective deposits and book value of their respective investments in the Parent. In the aggregate, loans to DOSRI generally should not exceed the respective total unimpaired capital or 15 per cent of total loan portfolio, whichever is lower, of the Parent. BSP Circular 547 dated September 21, 2006 prescribed the DOSRI rules for government borrowings in government-owned or controlled banks. Said circular considered as indirect borrowings of the Republic of the Philippines (ROP), loans, other credit accommodations and guarantees to: (a) Government-Owned and Controlled Corporations (GOCCs); and (b) Corporations where the ROP, its agencies/departments/ bureaus, and/or GOCCs own at least 20 per cent of the subscribed capital stocks. Total outstanding DOSRI loans of the Parent as of December 31, 2012 amounted to P65,746 million of which P61,926 million are government borrowings covered by BSP Circular 547. The following are the significant transactions of the Parent with related parties:
2012 2011
Key Management
Personnel Subsidiaries
Others (GOCCs, Provident Fund and
Rural Banks) Total
Key Management
Personnel Subsidiaries
Others (GOCCs, Provident Fund and
Rural Banks) Total Receivables from
customers 13,292 1,370,681 65,732,439 67,116,412 11,432 918,680 70,888,957 71,819,069 Deposit liabilities - 145,277 - 145,277 - 200,177 - 200,177 Other liabilities - 314,909 - 314,909 - 271,729 - 271,729
13,292 1,830,867 65,732,439 67,576,598 11,432 1,390,586 70,888,957 72,290,975
The following are the significant transactions with subsidiaries: 2012 2011
Sales/(Purchases) (16,129) (4,993) Interest income 68,441 50,646 Interest expense (140,356) (140,436) Lease expense (48,572) (49,799) Other income 1,789 2,107 Other expenses (186,464) (122,641)
(321,291) (265,116)
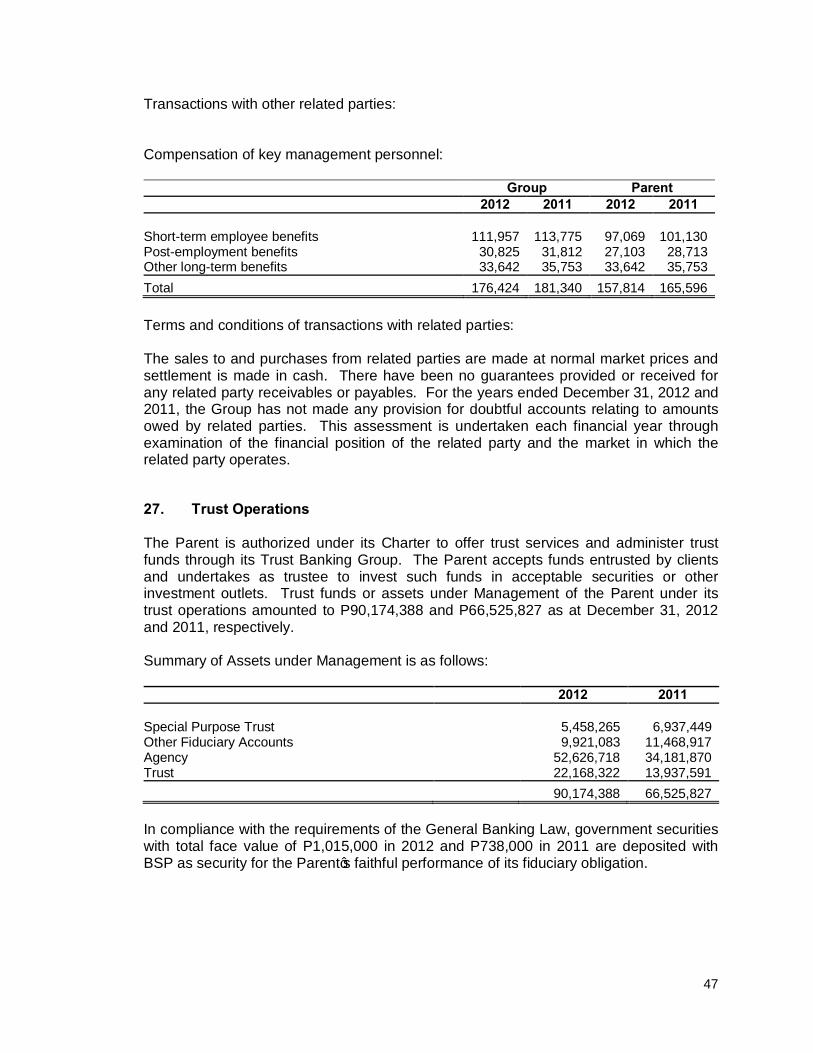
47
Transactions with other related parties: Compensation of key management personnel: Group Parent 2012 2011 2012 2011
Short-term employee benefits 111,957 113,775 97,069 101,130 Post-employment benefits 30,825 31,812 27,103 28,713 Other long-term benefits 33,642 35,753 33,642 35,753 Total 176,424 181,340 157,814 165,596 Terms and conditions of transactions with related parties: The sales to and purchases from related parties are made at normal market prices and settlement is made in cash. There have been no guarantees provided or received for any related party receivables or payables. For the years ended December 31, 2012 and 2011, the Group has not made any provision for doubtful accounts relating to amounts owed by related parties. This assessment is undertaken each financial year through examination of the financial position of the related party and the market in which the related party operates.
27. Trust Operations The Parent is authorized under its Charter to offer trust services and administer trust funds through its Trust Banking Group. The Parent accepts funds entrusted by clients and undertakes as trustee to invest such funds in acceptable securities or other investment outlets. Trust funds or assets under Management of the Parent under its trust operations amounted to P90,174,388 and P66,525,827 as at December 31, 2012 and 2011, respectively. Summary of Assets under Management is as follows: 2012 2011
Special Purpose Trust 5,458,265 6,937,449 Other Fiduciary Accounts 9,921,083 11,468,917 Agency 52,626,718 34,181,870 Trust 22,168,322 13,937,591 90,174,388 66,525,827 In compliance with the requirements of the General Banking Law, government securities with total face value of P1,015,000 in 2012 and P738,000 in 2011 are deposited with BSP as security for the Parent’s faithful performance of its fiduciary obligation.
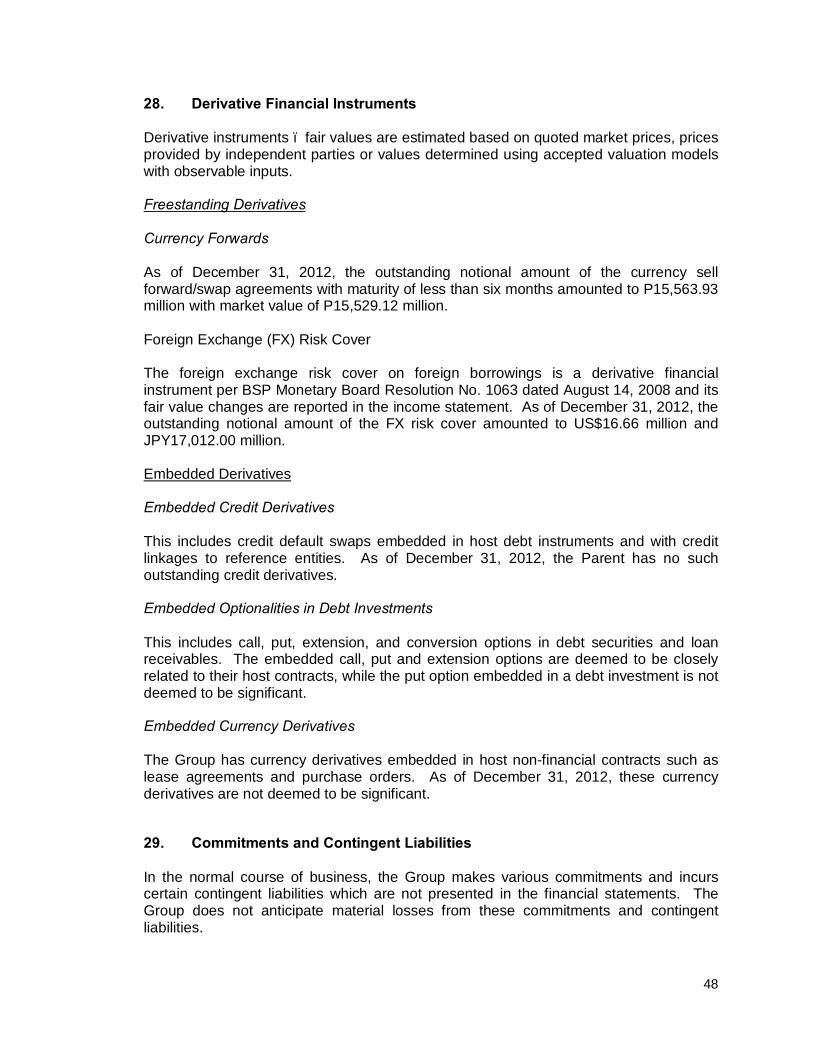
48
28. Derivative Financial Instruments Derivative instruments – fair values are estimated based on quoted market prices, prices provided by independent parties or values determined using accepted valuation models with observable inputs. Freestanding Derivatives Currency Forwards As of December 31, 2012, the outstanding notional amount of the currency sell forward/swap agreements with maturity of less than six months amounted to P15,563.93 million with market value of P15,529.12 million. Foreign Exchange (FX) Risk Cover The foreign exchange risk cover on foreign borrowings is a derivative financial instrument per BSP Monetary Board Resolution No. 1063 dated August 14, 2008 and its fair value changes are reported in the income statement. As of December 31, 2012, the outstanding notional amount of the FX risk cover amounted to US$16.66 million and JPY17,012.00 million. Embedded Derivatives Embedded Credit Derivatives This includes credit default swaps embedded in host debt instruments and with credit linkages to reference entities. As of December 31, 2012, the Parent has no such outstanding credit derivatives. Embedded Optionalities in Debt Investments This includes call, put, extension, and conversion options in debt securities and loan receivables. The embedded call, put and extension options are deemed to be closely related to their host contracts, while the put option embedded in a debt investment is not deemed to be significant. Embedded Currency Derivatives The Group has currency derivatives embedded in host non-financial contracts such as lease agreements and purchase orders. As of December 31, 2012, these currency derivatives are not deemed to be significant.
29. Commitments and Contingent Liabilities In the normal course of business, the Group makes various commitments and incurs certain contingent liabilities which are not presented in the financial statements. The Group does not anticipate material losses from these commitments and contingent liabilities.
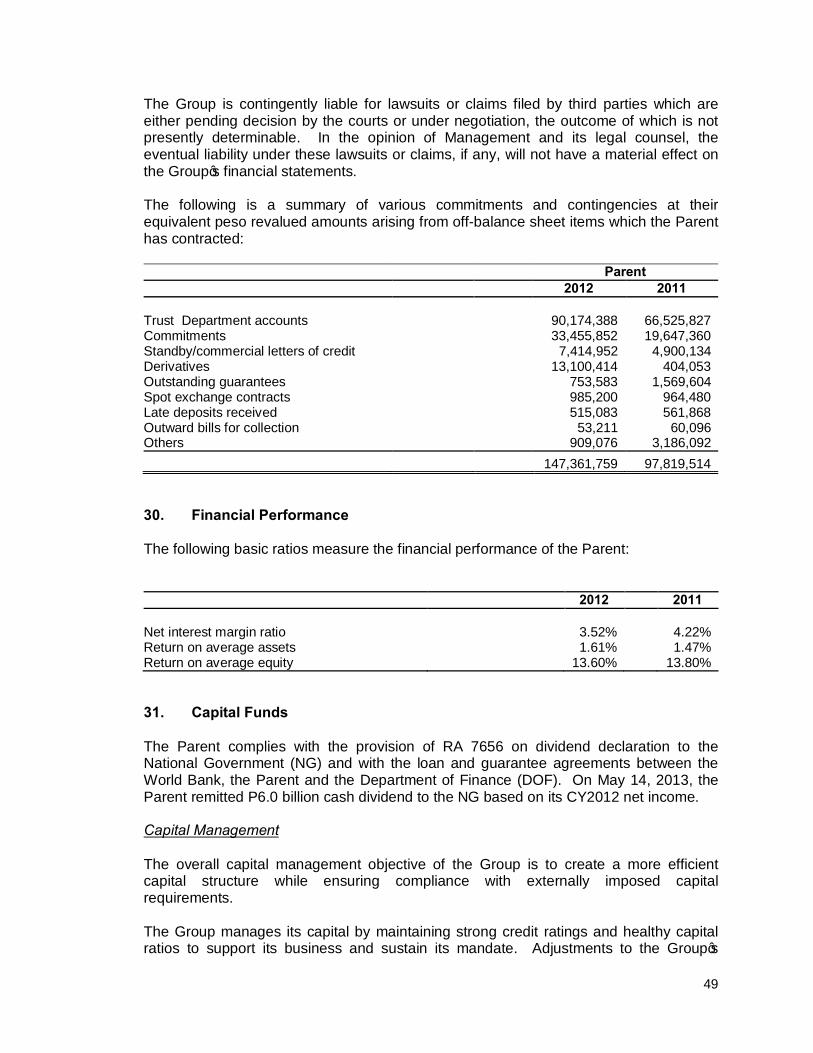
49
The Group is contingently liable for lawsuits or claims filed by third parties which are either pending decision by the courts or under negotiation, the outcome of which is not presently determinable. In the opinion of Management and its legal counsel, the eventual liability under these lawsuits or claims, if any, will not have a material effect on the Group’s financial statements. The following is a summary of various commitments and contingencies at their equivalent peso revalued amounts arising from off-balance sheet items which the Parent has contracted: Parent 2012 2011
Trust Department accounts 90,174,388 66,525,827 Commitments 33,455,852 19,647,360 Standby/commercial letters of credit 7,414,952 4,900,134 Derivatives 13,100,414 404,053 Outstanding guarantees 753,583 1,569,604 Spot exchange contracts 985,200 964,480 Late deposits received 515,083 561,868 Outward bills for collection 53,211 60,096 Others 909,076 3,186,092
147,361,759 97,819,514
30. Financial Performance The following basic ratios measure the financial performance of the Parent: 2012 2011
Net interest margin ratio 3.52% 4.22% Return on average assets 1.61% 1.47% Return on average equity 13.60% 13.80%
31. Capital Funds The Parent complies with the provision of RA 7656 on dividend declaration to the National Government (NG) and with the loan and guarantee agreements between the World Bank, the Parent and the Department of Finance (DOF). On May 14, 2013, the Parent remitted P6.0 billion cash dividend to the NG based on its CY2012 net income. Capital Management The overall capital management objective of the Group is to create a more efficient capital structure while ensuring compliance with externally imposed capital requirements. The Group manages its capital by maintaining strong credit ratings and healthy capital ratios to support its business and sustain its mandate. Adjustments to the Group’s
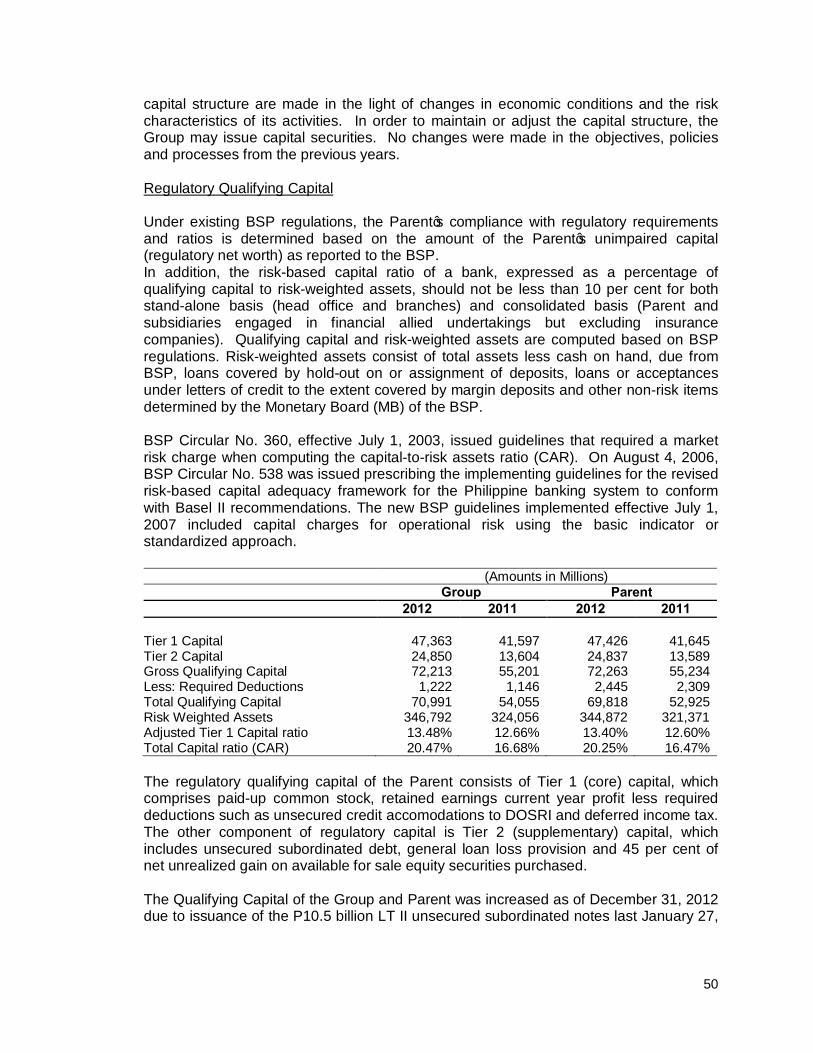
50
capital structure are made in the light of changes in economic conditions and the risk characteristics of its activities. In order to maintain or adjust the capital structure, the Group may issue capital securities. No changes were made in the objectives, policies and processes from the previous years. Regulatory Qualifying Capital Under existing BSP regulations, the Parent’s compliance with regulatory requirements and ratios is determined based on the amount of the Parent’s unimpaired capital (regulatory net worth) as reported to the BSP. In addition, the risk-based capital ratio of a bank, expressed as a percentage of qualifying capital to risk-weighted assets, should not be less than 10 per cent for both stand-alone basis (head office and branches) and consolidated basis (Parent and subsidiaries engaged in financial allied undertakings but excluding insurance companies). Qualifying capital and risk-weighted assets are computed based on BSP regulations. Risk-weighted assets consist of total assets less cash on hand, due from BSP, loans covered by hold-out on or assignment of deposits, loans or acceptances under letters of credit to the extent covered by margin deposits and other non-risk items determined by the Monetary Board (MB) of the BSP. BSP Circular No. 360, effective July 1, 2003, issued guidelines that required a market risk charge when computing the capital-to-risk assets ratio (CAR). On August 4, 2006, BSP Circular No. 538 was issued prescribing the implementing guidelines for the revised risk-based capital adequacy framework for the Philippine banking system to conform with Basel II recommendations. The new BSP guidelines implemented effective July 1, 2007 included capital charges for operational risk using the basic indicator or standardized approach. (Amounts in Millions) Group Parent 2012 2011 2012 2011
Tier 1 Capital 47,363 41,597 47,426 41,645 Tier 2 Capital 24,850 13,604 24,837 13,589 Gross Qualifying Capital 72,213 55,201 72,263 55,234 Less: Required Deductions 1,222 1,146 2,445 2,309 Total Qualifying Capital 70,991 54,055 69,818 52,925 Risk Weighted Assets 346,792 324,056 344,872 321,371 Adjusted Tier 1 Capital ratio 13.48% 12.66% 13.40% 12.60% Total Capital ratio (CAR) 20.47% 16.68% 20.25% 16.47% The regulatory qualifying capital of the Parent consists of Tier 1 (core) capital, which comprises paid-up common stock, retained earnings current year profit less required deductions such as unsecured credit accomodations to DOSRI and deferred income tax. The other component of regulatory capital is Tier 2 (supplementary) capital, which includes unsecured subordinated debt, general loan loss provision and 45 per cent of net unrealized gain on available for sale equity securities purchased. The Qualifying Capital of the Group and Parent was increased as of December 31, 2012 due to issuance of the P10.5 billion LT II unsecured subordinated notes last January 27,
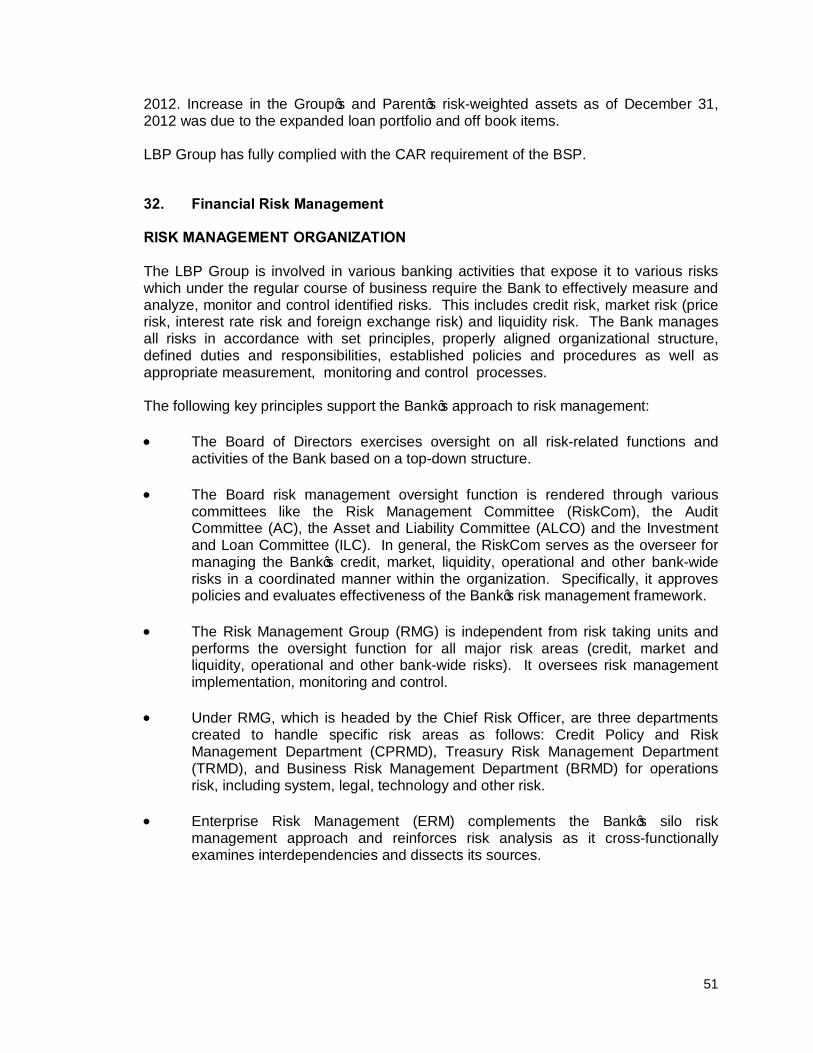
51
2012. Increase in the Group’s and Parent’s risk-weighted assets as of December 31, 2012 was due to the expanded loan portfolio and off book items. LBP Group has fully complied with the CAR requirement of the BSP.
32. Financial Risk Management RISK MANAGEMENT ORGANIZATION The LBP Group is involved in various banking activities that expose it to various risks which under the regular course of business require the Bank to effectively measure and analyze, monitor and control identified risks. This includes credit risk, market risk (price risk, interest rate risk and foreign exchange risk) and liquidity risk. The Bank manages all risks in accordance with set principles, properly aligned organizational structure, defined duties and responsibilities, established policies and procedures as well as appropriate measurement, monitoring and control processes. The following key principles support the Bank’s approach to risk management: • The Board of Directors exercises oversight on all risk-related functions and
activities of the Bank based on a top-down structure. • The Board risk management oversight function is rendered through various
committees like the Risk Management Committee (RiskCom), the Audit Committee (AC), the Asset and Liability Committee (ALCO) and the Investment and Loan Committee (ILC). In general, the RiskCom serves as the overseer for managing the Bank’s credit, market, liquidity, operational and other bank-wide risks in a coordinated manner within the organization. Specifically, it approves policies and evaluates effectiveness of the Bank’s risk management framework.
• The Risk Management Group (RMG) is independent from risk taking units and
performs the oversight function for all major risk areas (credit, market and liquidity, operational and other bank-wide risks). It oversees risk management implementation, monitoring and control.
• Under RMG, which is headed by the Chief Risk Officer, are three departments
created to handle specific risk areas as follows: Credit Policy and Risk Management Department (CPRMD), Treasury Risk Management Department (TRMD), and Business Risk Management Department (BRMD) for operations risk, including system, legal, technology and other risk.
• Enterprise Risk Management (ERM) complements the Bank’s silo risk
management approach and reinforces risk analysis as it cross-functionally examines interdependencies and dissects its sources.
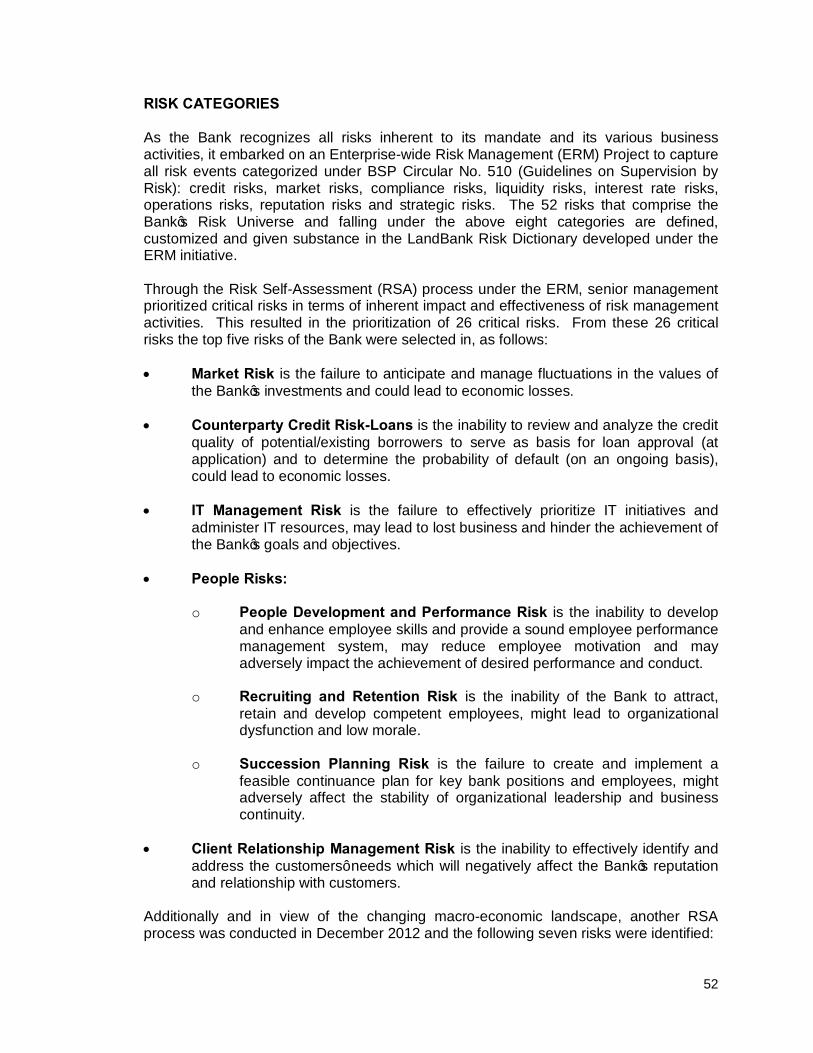
52
RISK CATEGORIES As the Bank recognizes all risks inherent to its mandate and its various business activities, it embarked on an Enterprise-wide Risk Management (ERM) Project to capture all risk events categorized under BSP Circular No. 510 (Guidelines on Supervision by Risk): credit risks, market risks, compliance risks, liquidity risks, interest rate risks, operations risks, reputation risks and strategic risks. The 52 risks that comprise the Bank’s Risk Universe and falling under the above eight categories are defined, customized and given substance in the LandBank Risk Dictionary developed under the ERM initiative. Through the Risk Self-Assessment (RSA) process under the ERM, senior management prioritized critical risks in terms of inherent impact and effectiveness of risk management activities. This resulted in the prioritization of 26 critical risks. From these 26 critical risks the top five risks of the Bank were selected in, as follows:
• Market Risk is the failure to anticipate and manage fluctuations in the values of
the Bank’s investments and could lead to economic losses. • Counterparty Credit Risk-Loans is the inability to review and analyze the credit
quality of potential/existing borrowers to serve as basis for loan approval (at application) and to determine the probability of default (on an ongoing basis), could lead to economic losses.
• IT Management Risk is the failure to effectively prioritize IT initiatives and
administer IT resources, may lead to lost business and hinder the achievement of the Bank’s goals and objectives.
• People Risks:
o People Development and Performance Risk is the inability to develop and enhance employee skills and provide a sound employee performance management system, may reduce employee motivation and may adversely impact the achievement of desired performance and conduct.
o Recruiting and Retention Risk is the inability of the Bank to attract,
retain and develop competent employees, might lead to organizational dysfunction and low morale.
o Succession Planning Risk is the failure to create and implement a
feasible continuance plan for key bank positions and employees, might adversely affect the stability of organizational leadership and business continuity.
• Client Relationship Management Risk is the inability to effectively identify and
address the customers’ needs which will negatively affect the Bank’s reputation and relationship with customers.
Additionally and in view of the changing macro-economic landscape, another RSA process was conducted in December 2012 and the following seven risks were identified:
53
• Strategic Planning Risk is the failure to develop, implement and monitor institutional strategies and direction will threaten the Bank’s overall viability and growth prospects.
• Socio-Political Risk is the failure to understand, address and anticipate political mandates and social and cultural developments will affect the Bank’s overall operations.
• Technology Identification Risk is the failure to identify and prioritize the
appropriate system and technology to support business processes or major initiatives may lead to costly investments and work inefficiencies and may compromise product or service delivery.
• Measuring and Monitoring of Major Initiatives Risk is the failure to identify
appropriate performance metrics and standards to monitor attainment of objectives and targets may prevent the achievement of desired output and performance.
• Lending Capacity Risk is the failure to maximize loanable funds might lead to
loss of business opportunities for the Bank. • Liquidity Risk is the failure to properly manage the Bank’s cash flows and have
sufficient available alternative fund sources at reasonable cost could affect the Bank’s ability to meet its obligation as they fall due.
• Banking Regulation Risk is the failure to comply with circulars, memoranda,
advisories and other issuances of regulatory bodies as applicable to the banking industry, may result in loss of business, administrative/criminal penalties/sanctions and loss to reputations. It is also the failure to set the stage for higher capital requirement in order to strategically align economic capital with regulatory requirements like Basel 3, AMLa amendments, etc.
RISK MANAGEMENT TOOLS LBP makes use of various quantitative tools and metrics for monitoring and managing risks. Some of these tools are common to a number of risk categories, while others are continuously being developed to respond to particular features of specific risk categories. As part of risk management process, LBP continually evaluates the appropriateness and reliability of risk management tools and metrics to respond to evolving risk environment and simultaneously comply with regulatory requirements and industry best practices. The following are the most important quantitative tools and metrics LBP currently uses to measure, manage and report risk: § Value-at-Risk (VaR). LBP uses this approach to derive quantitative measures
for the bank’s trading book market risks under normal market condition. Portfolios are formed primarily to diversify risk in trading and investment assets. For a given asset category or portfolio (e.g. government securities, foreign securities, equity investments, foreign exchange), VaR measures the potential loss (in terms of market value) that, under normal market conditions, will not be exceeded with a defined confidence level in a defined period. The VaR for a total
54
portfolio represents a measure of the bank’s diversified market risk in that portfolio.
§ Stress Testing. Analysis of credit, market, and liquidity risk is supplemented
with stress testing. For market risk management purposes, stress tests is performed because value-at-risk calculations are based on relatively recent historical data, and thus, only reflect possible losses under relatively normal market conditions. Stress tests help LBP determine the effects of potentially extreme and probable market developments on the value of its market risk sensitive exposures, on its highly liquid and less liquid trading positions, as well as, on investments. The Bank uses stress testing to determine the amount of economic capital allocation required to cover market risk exposure after evaluating extreme and probable market conditions. For liquidity risk management purposes, the Bank performs stress tests to evaluate the impact of sudden stress events on its liquidity position.
§ Scenario Analysis. This is a tool that generates forward-looking “what-if”
simulations for specified changes in market factors. The scenario analysis simulates the impact of significant changes in domestic and foreign interest rates. The implications of specific scenarios are simulated on the current portfolio and liquidity position of the bank.
§ Regulatory Risk Reporting. The Bangko Sentral ng Pilipinas (BSP), as the
banking regulator in the Philippines, assesses LBP’s capacity to assume risk in several ways. In compliance with BSP Memorandum Circular No. 538, s. of 2006 re: calculation of the Bank’s capital adequacy ratio (CAR) consistent with the revised International Convergence of Capital Measurement and Capital Standards, or popularly known as Basel II, LBP submits on a quarterly basis result of Capital Adequacy Ratio Calculation.
CREDIT RISK MANAGEMENT Credit risk is the risk that one party to a financial instrument will fail to discharge an obligation and cause the other party to incur financial loss. Consistent with good corporate governance, the Parent manages credit risk by setting limits for individual borrowers and group of borrowers and industry segments. The Parent also monitors credit exposures, and continually assesses the credit quality of counterparties. For certain clients, credit risk management is supplemented by credit rating systems. Various rating systems were developed for corporations, small and medium enterprises, financial institutions, cooperatives and local government units. The ratings of clients are being used, among others, as basis for determining the credit worthiness of loan clients. For the year, the Parent has approved the automated credit rating system model for LGUs for implementation in CY2013. The automated model for Livelihood Loans, as well as, the manual model for Rural, Thrift and Cooperative Banks is in the implementation stage. The Credit Risk Engine System (CRES) Phase 2 Project commenced on 30 July 2012 and it aims to build data infrastructure to allow the Bank to automate the calculation of Credit Risk Weighted Assets (CRWA) under the Foundation Internal Ratings Based (FIRB) Approach initially for Local Government Units (LGUs) portfolio.
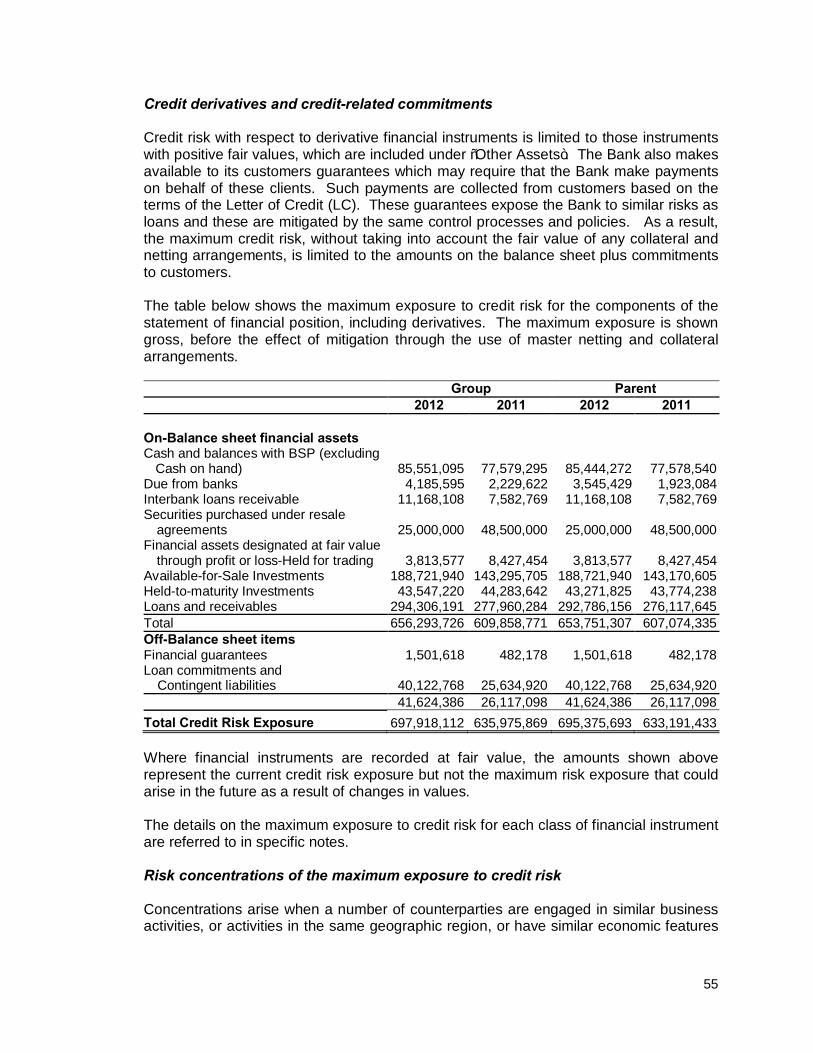
55
Credit derivatives and credit-related commitments Credit risk with respect to derivative financial instruments is limited to those instruments with positive fair values, which are included under “Other Assets”. The Bank also makes available to its customers guarantees which may require that the Bank make payments on behalf of these clients. Such payments are collected from customers based on the terms of the Letter of Credit (LC). These guarantees expose the Bank to similar risks as loans and these are mitigated by the same control processes and policies. As a result, the maximum credit risk, without taking into account the fair value of any collateral and netting arrangements, is limited to the amounts on the balance sheet plus commitments to customers. The table below shows the maximum exposure to credit risk for the components of the statement of financial position, including derivatives. The maximum exposure is shown gross, before the effect of mitigation through the use of master netting and collateral arrangements. Group Parent 2012 2011 2012 2011
On-Balance sheet financial assets Cash and balances with BSP (excluding
Cash on hand)
85,551,095 77,579,295 85,444,272 77,578,540 Due from banks 4,185,595 2,229,622 3,545,429 1,923,084 Interbank loans receivable 11,168,108 7,582,769 11,168,108 7,582,769 Securities purchased under resale
agreements 25,000,000 48,500,000 25,000,000 48,500,000 Financial assets designated at fair value
through profit or loss-Held for trading 3,813,577 8,427,454 3,813,577 8,427,454 Available-for-Sale Investments 188,721,940 143,295,705 188,721,940 143,170,605 Held-to-maturity Investments 43,547,220 44,283,642 43,271,825 43,774,238 Loans and receivables 294,306,191 277,960,284 292,786,156 276,117,645 Total 656,293,726 609,858,771 653,751,307 607,074,335 Off-Balance sheet items Financial guarantees 1,501,618 482,178 1,501,618 482,178 Loan commitments and
Contingent liabilities 40,122,768 25,634,920 40,122,768 25,634,920 41,624,386 26,117,098 41,624,386 26,117,098 Total Credit Risk Exposure 697,918,112 635,975,869 695,375,693 633,191,433 Where financial instruments are recorded at fair value, the amounts shown above represent the current credit risk exposure but not the maximum risk exposure that could arise in the future as a result of changes in values. The details on the maximum exposure to credit risk for each class of financial instrument are referred to in specific notes. Risk concentrations of the maximum exposure to credit risk Concentrations arise when a number of counterparties are engaged in similar business activities, or activities in the same geographic region, or have similar economic features
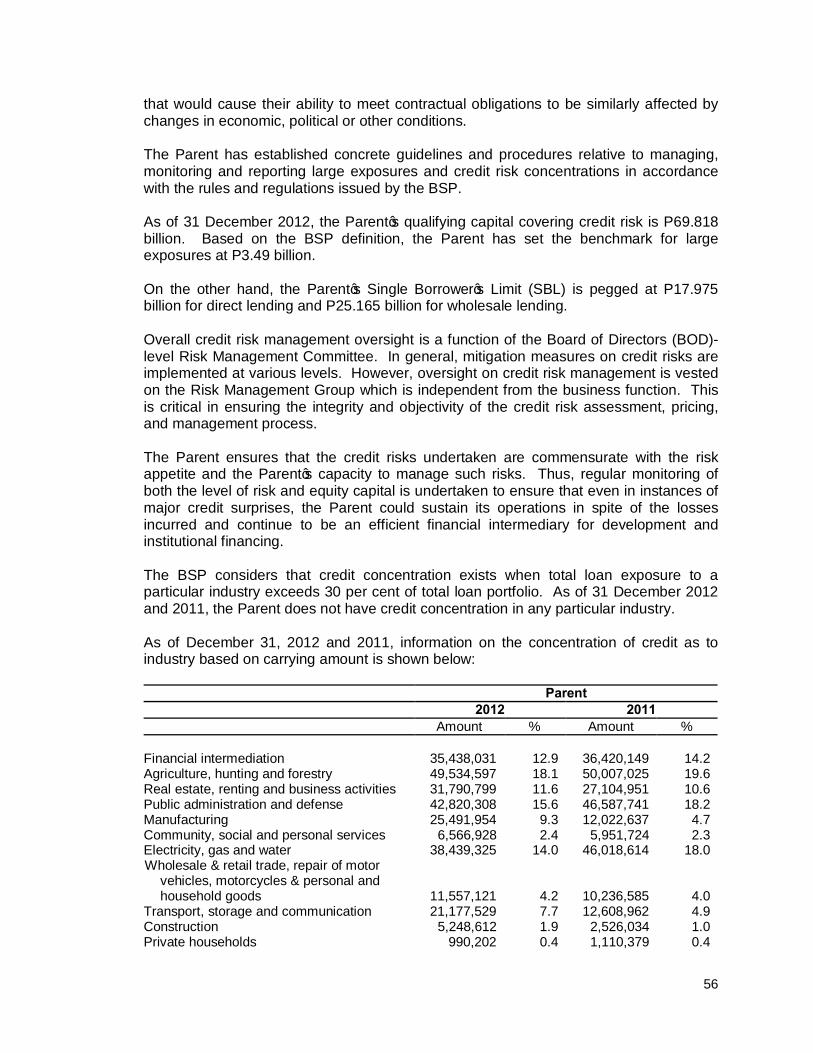
56
that would cause their ability to meet contractual obligations to be similarly affected by changes in economic, political or other conditions. The Parent has established concrete guidelines and procedures relative to managing, monitoring and reporting large exposures and credit risk concentrations in accordance with the rules and regulations issued by the BSP. As of 31 December 2012, the Parent’s qualifying capital covering credit risk is P69.818 billion. Based on the BSP definition, the Parent has set the benchmark for large exposures at P3.49 billion. On the other hand, the Parent’s Single Borrower’s Limit (SBL) is pegged at P17.975 billion for direct lending and P25.165 billion for wholesale lending. Overall credit risk management oversight is a function of the Board of Directors (BOD)-level Risk Management Committee. In general, mitigation measures on credit risks are implemented at various levels. However, oversight on credit risk management is vested on the Risk Management Group which is independent from the business function. This is critical in ensuring the integrity and objectivity of the credit risk assessment, pricing, and management process. The Parent ensures that the credit risks undertaken are commensurate with the risk appetite and the Parent’s capacity to manage such risks. Thus, regular monitoring of both the level of risk and equity capital is undertaken to ensure that even in instances of major credit surprises, the Parent could sustain its operations in spite of the losses incurred and continue to be an efficient financial intermediary for development and institutional financing. The BSP considers that credit concentration exists when total loan exposure to a particular industry exceeds 30 per cent of total loan portfolio. As of 31 December 2012 and 2011, the Parent does not have credit concentration in any particular industry. As of December 31, 2012 and 2011, information on the concentration of credit as to industry based on carrying amount is shown below: Parent 2012 2011 Amount % Amount %
Financial intermediation 35,438,031 12.9 36,420,149 14.2 Agriculture, hunting and forestry 49,534,597 18.1 50,007,025 19.6 Real estate, renting and business activities 31,790,799 11.6 27,104,951 10.6 Public administration and defense 42,820,308 15.6 46,587,741 18.2 Manufacturing 25,491,954 9.3 12,022,637 4.7 Community, social and personal services 6,566,928 2.4 5,951,724 2.3 Electricity, gas and water 38,439,325 14.0 46,018,614 18.0 Wholesale & retail trade, repair of motor
vehicles, motorcycles & personal and household goods 11,557,121 4.2 10,236,585 4.0
Transport, storage and communication 21,177,529 7.7 12,608,962 4.9 Construction 5,248,612 1.9 2,526,034 1.0 Private households 990,202 0.4 1,110,379 0.4
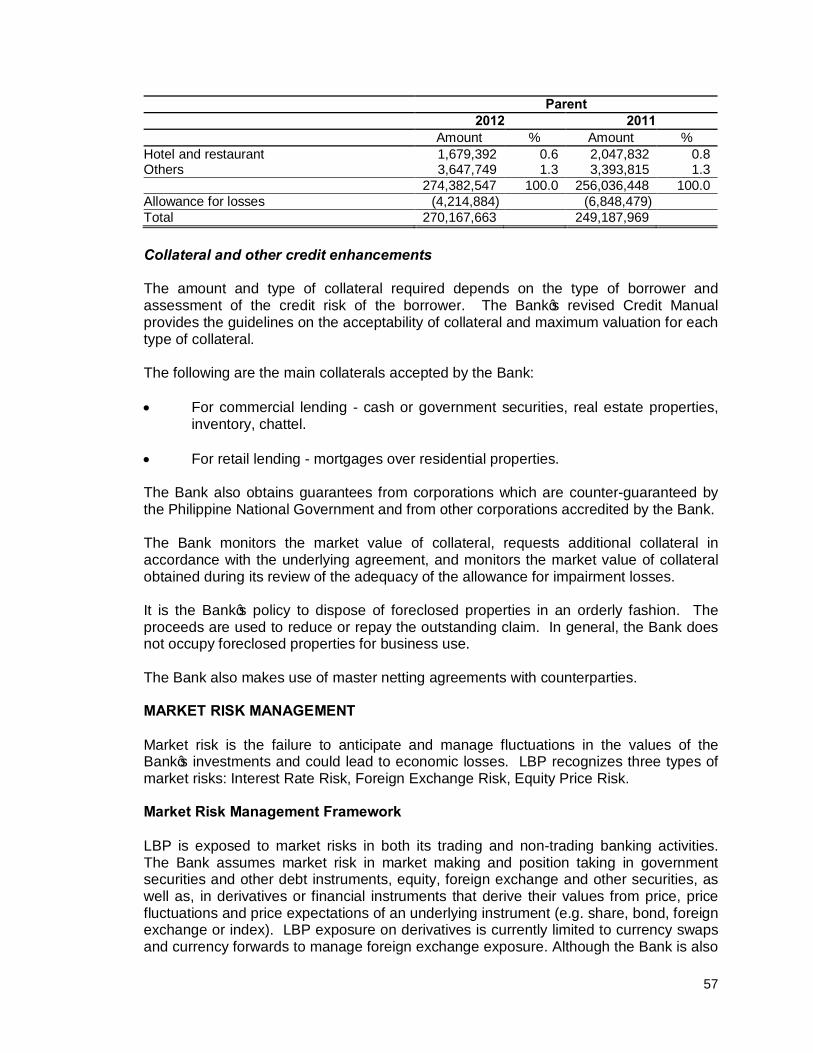
57
Parent 2012 2011 Amount % Amount %
Hotel and restaurant 1,679,392 0.6 2,047,832 0.8 Others 3,647,749 1.3 3,393,815 1.3 274,382,547 100.0 256,036,448 100.0 Allowance for losses (4,214,884) (6,848,479) Total 270,167,663 249,187,969 Collateral and other credit enhancements The amount and type of collateral required depends on the type of borrower and assessment of the credit risk of the borrower. The Bank’s revised Credit Manual provides the guidelines on the acceptability of collateral and maximum valuation for each type of collateral. The following are the main collaterals accepted by the Bank: • For commercial lending - cash or government securities, real estate properties,
inventory, chattel. • For retail lending - mortgages over residential properties. The Bank also obtains guarantees from corporations which are counter-guaranteed by the Philippine National Government and from other corporations accredited by the Bank. The Bank monitors the market value of collateral, requests additional collateral in accordance with the underlying agreement, and monitors the market value of collateral obtained during its review of the adequacy of the allowance for impairment losses. It is the Bank’s policy to dispose of foreclosed properties in an orderly fashion. The proceeds are used to reduce or repay the outstanding claim. In general, the Bank does not occupy foreclosed properties for business use. The Bank also makes use of master netting agreements with counterparties. MARKET RISK MANAGEMENT Market risk is the failure to anticipate and manage fluctuations in the values of the Bank’s investments and could lead to economic losses. LBP recognizes three types of market risks: Interest Rate Risk, Foreign Exchange Risk, Equity Price Risk. Market Risk Management Framework LBP is exposed to market risks in both its trading and non-trading banking activities. The Bank assumes market risk in market making and position taking in government securities and other debt instruments, equity, foreign exchange and other securities, as well as, in derivatives or financial instruments that derive their values from price, price fluctuations and price expectations of an underlying instrument (e.g. share, bond, foreign exchange or index). LBP exposure on derivatives is currently limited to currency swaps and currency forwards to manage foreign exchange exposure. Although the Bank is also
58
exposed to derivatives that are embedded in some financial contracts, these are considered insignificant in volume. The Bank uses a combination of risk sensitivities, value-at-risk (VaR), stress testing, capital adequacy ratio and capital metrics to manage market risks and establish limits. The LBP Board of Directors, Risk Management Committee and the Asset and Liability Committee (ALCO), define and set the various market risks limit for each trading portfolio. The Treasury and Investment Banking Sector (TIBS), particularly the Foreign Exchange Department (FED) (which handles foreign exchange and foreign securities trading), and the Local Currency Department (LCD), which takes charge of Government Securities and Equities, allocate these limits to each of the traders in their respective departments. A management loss alert is activated whenever losses during a specified period equal or exceed specified management loss alert level. LBP controls and minimizes the losses that may be incurred in daily trading activities through the VaR and stop loss limits. Positions are monitored on a daily basis to ensure that these are maintained within established limits. Position Limits are also established to control losses but are subordinated to the VaR and Stop Loss Limits. Managing Market Risk Components The following discusses the key market risk components along with respective risk mitigation techniques: Interest Rate Risk Management Interest rate risk arises from the possibility that changes in interest rates will affect future profitability or the fair values of financial instruments. LBP adopts two perspectives in measuring Interest Rate Risk as follows: • Earnings Perspective – The Bank uses the Earnings-at-Risk (EaR) Model to
estimate changes in net interest income (NII) under a variety of rate scenarios over a 12 month horizon. It is a simulation method that analyzes the interest rate risk in the banking book in terms of earnings (accrual basis). EaR measures the loss of NII resulting from upward/downward interest rate movements in a “Business as usual” environment, either through gradual movements or as a one-off large interest rate shock over a particular time horizon.
• Economic Value Perspective – The Bank uses the Economic Value of Equity
(EVE) Model to assess the potential long-term effects of changes in interest rates. This model provides long-term view of possible effects of interest rate changes over the remaining life of the Bank’s holdings. This model also measures the change in the Bank’s economic value of equity for specified changes in interest rates.
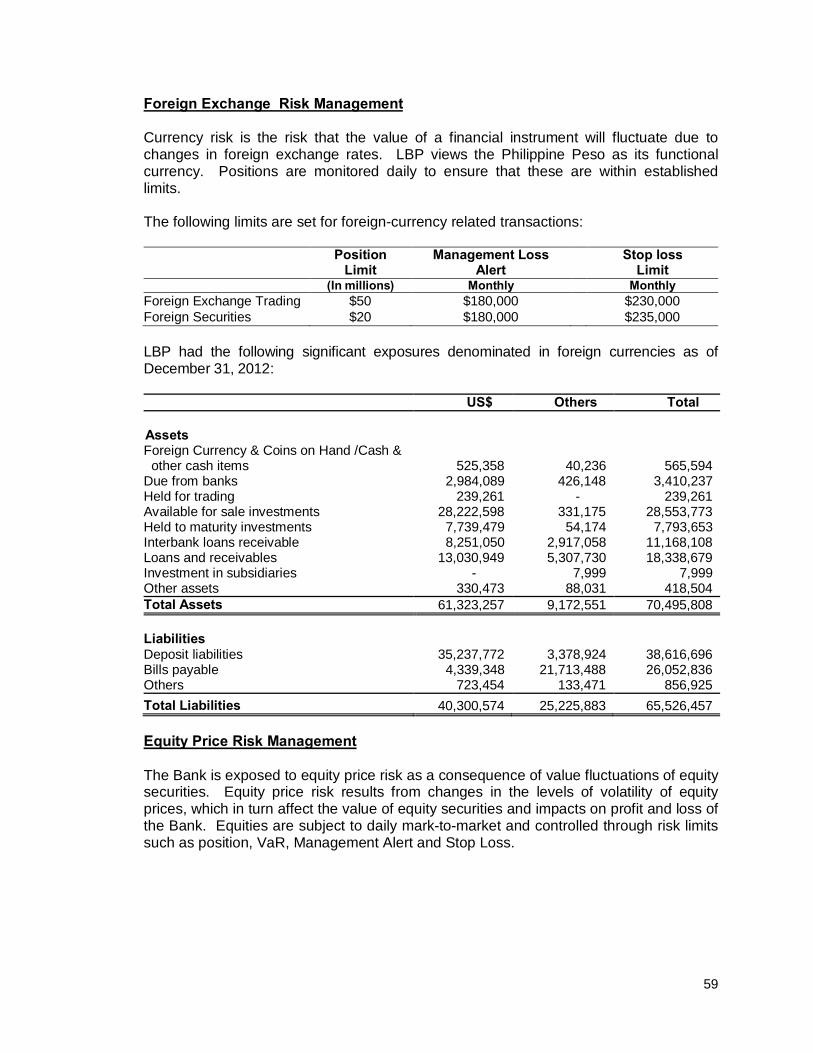
59
Foreign Exchange Risk Management Currency risk is the risk that the value of a financial instrument will fluctuate due to changes in foreign exchange rates. LBP views the Philippine Peso as its functional currency. Positions are monitored daily to ensure that these are within established limits. The following limits are set for foreign-currency related transactions:
Position
Limit Management Loss
Alert
Stop loss Limit
(In millions) Monthly Monthly Foreign Exchange Trading $50 $180,000 $230,000 Foreign Securities $20 $180,000 $235,000 LBP had the following significant exposures denominated in foreign currencies as of December 31, 2012: US$ Others Total
Assets Foreign Currency & Coins on Hand /Cash & other cash items 525,358 40,236 565,594 Due from banks 2,984,089 426,148 3,410,237 Held for trading 239,261 - 239,261 Available for sale investments 28,222,598 331,175 28,553,773 Held to maturity investments 7,739,479 54,174 7,793,653 Interbank loans receivable 8,251,050 2,917,058 11,168,108 Loans and receivables 13,030,949 5,307,730 18,338,679 Investment in subsidiaries - 7,999 7,999 Other assets 330,473 88,031 418,504 Total Assets 61,323,257 9,172,551 70,495,808
Liabilities Deposit liabilities 35,237,772 3,378,924 38,616,696 Bills payable 4,339,348 21,713,488 26,052,836 Others 723,454 133,471 856,925 Total Liabilities 40,300,574 25,225,883 65,526,457 Equity Price Risk Management The Bank is exposed to equity price risk as a consequence of value fluctuations of equity securities. Equity price risk results from changes in the levels of volatility of equity prices, which in turn affect the value of equity securities and impacts on profit and loss of the Bank. Equities are subject to daily mark-to-market and controlled through risk limits such as position, VaR, Management Alert and Stop Loss.
60
Market Risk Measurement Models * Value-at-Risk Analysis Value at Risk (VaR) is a statistical approach for measuring the potential variability of trading revenue. It is used to measure market risk in the trading book under normal conditions, estimating the potential range of loss in the market value of the trading portfolio, over a one-day period, at the 99 per cent confidence level, assuming a static portfolio. This level implies that on 99 trading days out of 100, the mark-to-market of the portfolio will likely either (1) increase in value, or (2) decrease in value by less than the VaR estimate; and that on 1 trading day out of 100, the mark-to-market of the portfolio will likely decrease in value by an amount that will exceed the VaR estimate. VaR is calculated by simulating changes in the key underlying market risk factors (e.g., interest rates, interest rate spreads, equity prices, foreign exchange rates) to determine the potential distribution of changes in the market value of LBP’s portfolios of market risk sensitive financial instruments. Daily VaR calculations are compared against VaR limits, the monetary amount of risk deemed tolerable by management. The Value-at-Risk disclosure for the trading activities is based on Variance-Covariance or Parametric Value-at-Risk Model. For Equities, Foreign Exchange and Foreign Securities trading portfolio, Parametric VaR is run parallel with the internally developed Historical Simulation VaR Calculation Model as the Bank continuously pursues initiatives to improve processes in preparation to the bank’s migration towards an Internal Model Approach for capital charging. The VaR disclosure is intended to ensure consistency of market risk reporting for internal risk management, for external disclosure and for regulatory purposes. The over-all Value-at-Risk limit for the LBP Treasury Group’s trading activities was P80 million (with a 99 per cent confidence level, and a one-day holding period) throughout 2012. * Back-Testing Back-testing is the basic technique used in verifying the quality of risk measures used by the Bank. It is the process of comparing actual trading results with model-generated risk measures. Back-testing is a standard measure in determining the accuracy and predictive ability of risk models. The results of back-testing are used to assess the performance of treasury or trading strategies. In back-testing, the focus is on the comparison of actual daily changes in portfolio value, and hypothetical changes in portfolio value that would occur if end-of-day positions remain unchanged during the one-day holding period. Back-testing results are presented to the Asset and Liability Committee (ALCO) which serves as LBP management level risk committee and the Risk Management Committee (RiskCom), a Board level risk oversight committee. The Committees analyze actual performance against VaR measures to assess model accuracy and to enhance the risk estimation process in general.
61
* Stress Testing Measuring market risk using statistical risk management models has recently become the main focus of risk management efforts in the banking industry where banking activities are exposed to changes in fair value of financial instruments. LBP believes that the statistical models alone do not provide reliable method of monitoring and controlling risk. While VaR models are relatively sophisticated, they have several known limitations. Most significantly, standard VaR models do not incorporate the potential loss caused by very unusual market events. Thus, the VaR process is complemented by Stress testing to measure this potential risk. Stress test is a risk management tool used to determine the impact on earnings of market movements considered “extreme”, i.e., beyond “normal” occurrence. Stress tests are LBP’s measures of risks to estimate possible losses which the Value at Risk (VaR) does not capture. The Bank’s Portfolio Scenario Analysis (PSA) report is a model forecasting the loss return values of a selected portfolio. It calculates the size of possible losses related to a precise scenario. It identifies scenarios that may influence the portfolio strongly and which market variables may trigger these scenarios to be able to come up with a sound portfolio risk management. The Portfolio Scenario Analysis is a replication scenario based on historical events based on imagined crises or future developments that have not yet occurred. Results of PSA are also simulated to Capital Adequacy Ratio of the Bank to be able to assess its impact on the CAR compliance set at 10 per cent. Liquidity Risk Management Liquidity Risk Management Framework The LBP Board has delegated the responsibility of managing the overall liquidity of the Bank to a committee of senior managers known as Asset/Liability Management Committee (ALCO). This Committee meets twice a month or more frequently as required by prevailing situations. Senior management is responsible for effectively executing the liquidity strategy and overseeing the daily and long-term management of liquidity risk. ALCO delegates day-to-day operating responsibilities to the treasury unit based on specific practices and limits established in governing treasury operations. The Treasury Risk Management Department is responsible for the oversight monitoring of the Bank’s risk positions and ensures that reports on the Bank’s current risk are prepared and provided to ALCO and BOD/RiskCom in a timely manner. The Treasury Group submits to the TIBS Head and the President, Daily Treasury Reports which include the Bank’s cash/near cash investments and other data related to liquidity which assist senior management in decision making. The Bank’s liquidity position is subjected to stress testing and scenario analysis to evaluate the impact of sudden stress events. The scenarios are based on historical events, case studies of liquidity crises and models using hypothetical events.
62
Liquidity Risk Measurement Models The Bank formulates different types of liquidity risk measurement tools to determine any future liquidity structural imbalances to be able to formulate strategies to mitigate liquidity risk and address funding needs. Liquidity is being monitored and controlled thru maturities of assets and liabilities over time bands and across functional currencies as reflected in the Liquidity Gap Report. This report is prepared to provide senior management and the Board timely appreciation of the Bank’s liquidity position. The ALCO and the TIBS are responsible for the daily implementation and monitoring of relevant variables affecting LBP’s liquidity position. ALCO reviews the Bank’s assets and liabilities position on a regular basis and, in coordination with the TIBS, recommends measures to promote diversification of its liabilities according to source, instrument and currency to minimize liquidity risks resulting from concentration in funding sources. LBP formulated a liquidity contingency plan using extreme scenarios of adverse liquidity which evaluates the Bank’s ability to withstand these prolonged scenarios and to ensure that it has sufficient liquidity at all times. The contingency plan focuses on the LBP’s strategy for coordinating managerial action during a crisis and includes procedures for making up cash flow shortfalls in adverse situations. The plan details the amount of available funds of the Bank (such as unused credit facilities) and the scenarios under which it could use them. As of 31 December 2012, P130.68 billion or 18.99 per cent of the Bank’s total assets were represented by gross loans with remaining maturities of less than one year classified as to original term and P24.98 billion or 3.63 per cent of the total assets were invested in trading and investment securities with remaining maturities of one year or less. The Bank’s trading and investment securities account includes securities issued by sovereign issuers, primarily government treasury bills, fixed rate treasury notes, floating rate treasury notes and foreign currency denominated bonds issued by the government. Other resources inclusive of due from BSP and other banks accounted for 13.13 percent of LBP’s total resources as of 31 December 2012. Deposits with banks are made on a short-term basis with almost all being available on demand or within one month. Although the Bank pursues what it believes to be a prudent policy in managing liquidity risk, a maturity gap does, from time to time, exist between the Bank’s assets and liabilities. In part, this comes about as a result of the Bank’s policy to seek higher yielding assets, a policy which will generally lead to the average maturity of its financial assets exceeding that of its liabilities.
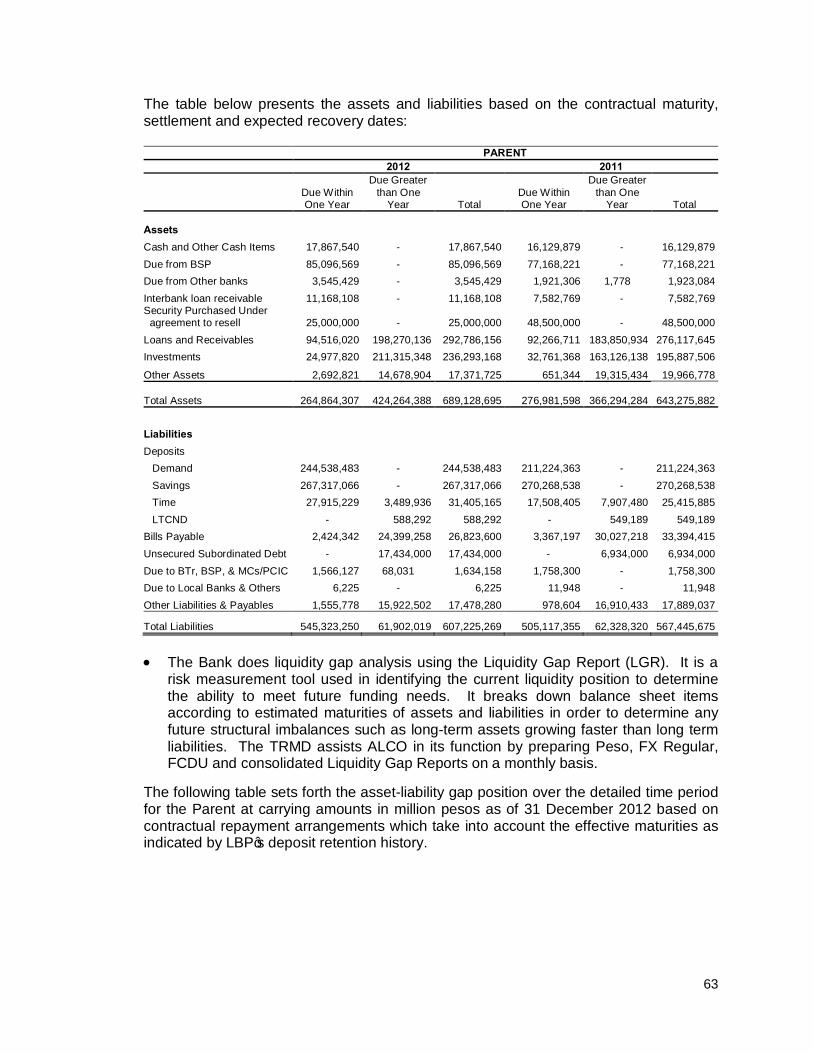
63
The table below presents the assets and liabilities based on the contractual maturity, settlement and expected recovery dates:
PARENT 2012 2011
Due Within One Year
Due Greater than One
Year Total Due Within One Year
Due Greater than One
Year Total
Assets Cash and Other Cash Items 17,867,540 - 17,867,540 16,129,879 - 16,129,879 Due from BSP 85,096,569 - 85,096,569 77,168,221 - 77,168,221 Due from Other banks 3,545,429 - 3,545,429 1,921,306 1,778 1,923,084 Interbank loan receivable 11,168,108 - 11,168,108 7,582,769 - 7,582,769 Security Purchased Under agreement to resell 25,000,000 - 25,000,000 48,500,000 - 48,500,000 Loans and Receivables 94,516,020 198,270,136 292,786,156 92,266,711 183,850,934 276,117,645 Investments 24,977,820 211,315,348 236,293,168 32,761,368 163,126,138 195,887,506
Other Assets 2,692,821 14,678,904 17,371,725 651,344 19,315,434 19,966,778
Total Assets 264,864,307 424,264,388 689,128,695 276,981,598 366,294,284 643,275,882
Liabilities Deposits Demand 244,538,483 - 244,538,483 211,224,363 - 211,224,363 Savings 267,317,066 - 267,317,066 270,268,538 - 270,268,538 Time 27,915,229 3,489,936 31,405,165 17,508,405 7,907,480 25,415,885 LTCND - 588,292 588,292 - 549,189 549,189 Bills Payable 2,424,342 24,399,258 26,823,600 3,367,197 30,027,218 33,394,415 Unsecured Subordinated Debt - 17,434,000 17,434,000 - 6,934,000 6,934,000 Due to BTr, BSP, & MCs/PCIC 1,566,127 68,031 1,634,158 1,758,300 - 1,758,300 Due to Local Banks & Others 6,225 - 6,225 11,948 - 11,948 Other Liabilities & Payables 1,555,778 15,922,502 17,478,280 978,604 16,910,433 17,889,037
Total Liabilities 545,323,250 61,902,019 607,225,269 505,117,355 62,328,320 567,445,675
• The Bank does liquidity gap analysis using the Liquidity Gap Report (LGR). It is a risk measurement tool used in identifying the current liquidity position to determine the ability to meet future funding needs. It breaks down balance sheet items according to estimated maturities of assets and liabilities in order to determine any future structural imbalances such as long-term assets growing faster than long term liabilities. The TRMD assists ALCO in its function by preparing Peso, FX Regular, FCDU and consolidated Liquidity Gap Reports on a monthly basis.
The following table sets forth the asset-liability gap position over the detailed time period for the Parent at carrying amounts in million pesos as of 31 December 2012 based on contractual repayment arrangements which take into account the effective maturities as indicated by LBP’s deposit retention history.
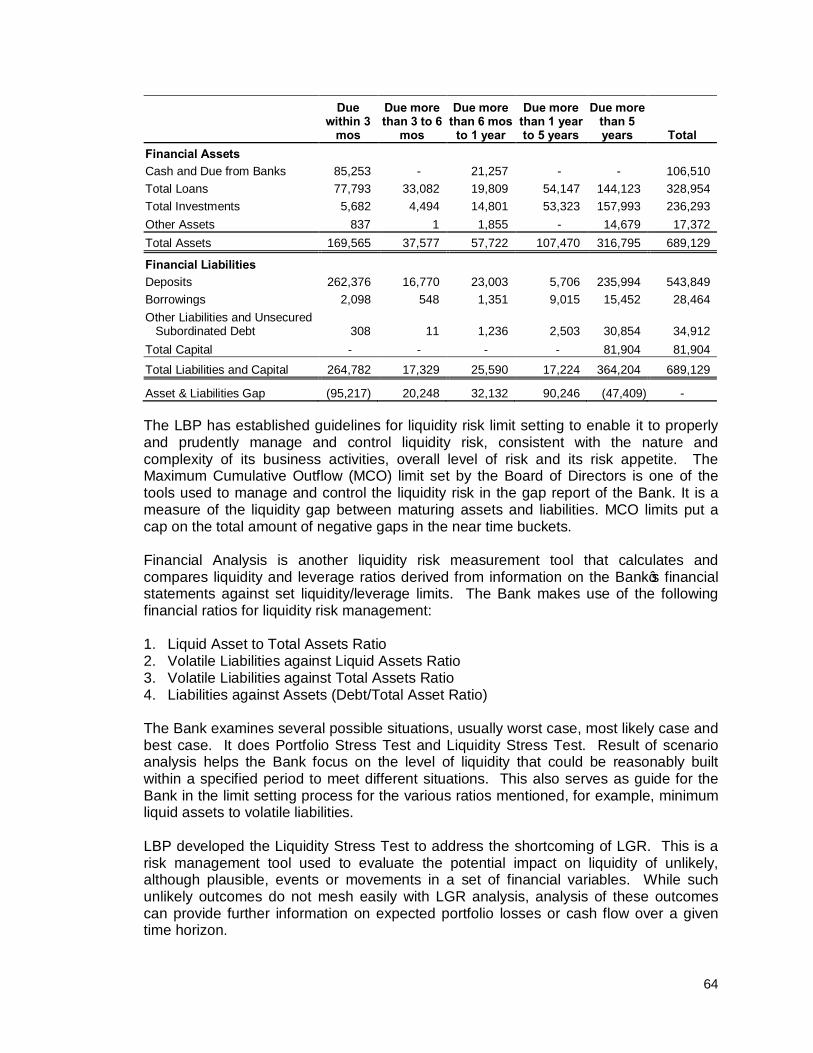
64
Due within 3
mos
Due more than 3 to 6
mos
Due more than 6 mos
to 1 year
Due more than 1 year to 5 years
Due more than 5 years Total
Financial Assets Cash and Due from Banks 85,253 - 21,257 - - 106,510 Total Loans 77,793 33,082 19,809 54,147 144,123 328,954 Total Investments 5,682 4,494 14,801 53,323 157,993 236,293 Other Assets 837 1 1,855 - 14,679 17,372 Total Assets 169,565 37,577 57,722 107,470 316,795 689,129
Financial Liabilities Deposits 262,376 16,770 23,003 5,706 235,994 543,849 Borrowings 2,098 548 1,351 9,015 15,452 28,464 Other Liabilities and Unsecured
Subordinated Debt 308 11 1,236 2,503 30,854 34,912 Total Capital - - - - 81,904 81,904 Total Liabilities and Capital 264,782 17,329 25,590 17,224 364,204 689,129
Asset & Liabilities Gap (95,217) 20,248 32,132 90,246 (47,409) - The LBP has established guidelines for liquidity risk limit setting to enable it to properly and prudently manage and control liquidity risk, consistent with the nature and complexity of its business activities, overall level of risk and its risk appetite. The Maximum Cumulative Outflow (MCO) limit set by the Board of Directors is one of the tools used to manage and control the liquidity risk in the gap report of the Bank. It is a measure of the liquidity gap between maturing assets and liabilities. MCO limits put a cap on the total amount of negative gaps in the near time buckets. Financial Analysis is another liquidity risk measurement tool that calculates and compares liquidity and leverage ratios derived from information on the Bank’s financial statements against set liquidity/leverage limits. The Bank makes use of the following financial ratios for liquidity risk management: 1. Liquid Asset to Total Assets Ratio 2. Volatile Liabilities against Liquid Assets Ratio 3. Volatile Liabilities against Total Assets Ratio 4. Liabilities against Assets (Debt/Total Asset Ratio) The Bank examines several possible situations, usually worst case, most likely case and best case. It does Portfolio Stress Test and Liquidity Stress Test. Result of scenario analysis helps the Bank focus on the level of liquidity that could be reasonably built within a specified period to meet different situations. This also serves as guide for the Bank in the limit setting process for the various ratios mentioned, for example, minimum liquid assets to volatile liabilities. LBP developed the Liquidity Stress Test to address the shortcoming of LGR. This is a risk management tool used to evaluate the potential impact on liquidity of unlikely, although plausible, events or movements in a set of financial variables. While such unlikely outcomes do not mesh easily with LGR analysis, analysis of these outcomes can provide further information on expected portfolio losses or cash flow over a given time horizon.
65
Liquidity management is one of the fundamental preconditions to achieving all other banking activities - strategically mapped by ALCO, actively managed by the TIBS through the Asset and Liabilities Management Department (ALMD) and overseen by the Treasury Risk Management Department (TRMD). To limit liquidity risk, LBP Management has instituted the following: 1. Active and Appropriate Board and Senior Management Oversight - The Board and Senior Management receives regular liquidity reports and updates to fully inform them of the level of liquidity risk assumed by the Bank and if activities undertaken are within the prescribed risk tolerance in accordance with approved guidelines, liquidity /funding policy (targets), risk limits. 2. Diversified funding sources - The Bank has identified the following sources of funding: • Cash from operations • Sale of Government Securities (GS) under Available for Sale (AFS) • Government and retail deposit sources • Interbank market • Borrowings from BSP • Undertaking Peso-Dollar Swaps • Accessing loans from multilateral and bilateral institutions (WB, ADB, JBIC, etc.) LBP performs a comprehensive liquidity risk measurement and control using as tool the Consolidated Liquidity Gap Report covering the entire LBP Group. Risk models used in liquidity risk management are subjected to independent model validation. The Internal Audit Group is tasked to do model validation. An independent validation is also being done by the Basel Officer for Treasury who reports directly to the Head of the Risk Management Group. For this year, incorporated were latest enhancements made on the model as a result of independent model validation by a third party auditor.