Embed Size (px)
Citation preview
Construction and Building Materials 37 (2012) 239–247
Contents lists available at SciVerse ScienceDirect
Construction and Building Materials
journal homepage: www.elsevier .com/locate /conbui ldmat
Laboratory investigation of compaction characteristics and performance ofwarm mix asphalt containing chemical additives
Liantong Mo a,⇑, Xun Li a, Xing Fang a, M. Huurman b, Shaopeng Wu a
a State Key Laboratory of Silicate Materials for Architectures, Wuhan University of Technology, Wuhan 430070, Chinab Technology & Development, BAM Wegen bv, Utrecht 3500 GK, The Netherlands
h i g h l i g h t s
" Warm mix asphalt containing chemical additives." Chemical additive had a limited effect on bitumen viscosity reduction." 2% Chemical additive improved the ease of compaction." Mixture compactability was less dependent on bitumen viscosity." Rutting and stripping were the main causes resulting in poor performance.
a r t i c l e i n f o
Article history:Received 13 March 2012Received in revised form 15 June 2012Accepted 22 July 2012Available online 30 August 2012
Keywords:Warm mix asphaltChemical additiveCompactionPerformance
0950-0618/$ - see front matter � 2012 Elsevier Ltd. Ahttp://dx.doi.org/10.1016/j.conbuildmat.2012.07.074
⇑ Corresponding author. Address: State Key LaboraArchitectures, Wuhan University of Technology, RoWuhan 430070, China. Tel.: +86 (0) 27 87162595; fax
E-mail addresses: [email protected], mo.lian.tong
a b s t r a c t
This paper focuses on the compaction characteristics and performance of warm mix asphalt containingchemical additive. Viscosity tests indicated the used chemical additive had a limited effect on viscosityreduction. Investigation into the ease of compaction showed that asphalt mixtures containing 2% chem-ical additive allowed compacting at lower temperatures and mixture compactability was less dependenton bitumen viscosity. It was demonstrated that the compactability of warm mix asphalt could be wellranked by using various indicators including the number of gyrations to achieve a design void content,the slope of accumulated compaction energy against the number of gyrations as well as compactionenergy indices at various compaction phases. Data obtained from immersion wheel tracking tests indi-cated that warm mix asphalt containing chemical additive did not have a performance comparable tothat of hot mix asphalt. Rutting and stripping were found to be the main causes resulting in poorperformance.
� 2012 Elsevier Ltd. All rights reserved.
1. Introduction
Warm mix asphalt (WMA) is an asphalt mix which is mixed andcompacted at temperatures lower than conventional hot mix as-phalt. It was reported that the mixing temperatures of warm mixasphalt mixtures ranged from 100 �C to 140 �C compared to themixing temperatures of 150–180 �C for conventional hot mix as-phalt [1–4]. Depending on type of warm mix technique and addi-tive, a significant temperature reduction of 20–40 �C can beobtained. Warm mix asphalt shows its advantages on reducedemissions, better working conditions because of the absence ofharmful gases, lower energy consumption [1,2]. Warm mix tech-nique has been found to be more promising for cold weather pav-
ll rights reserved.
tory of Silicate Materials forom 309, 122 Luoshi Road,: +86 (0) 27 87873892.
@gmail.com (L. Mo).
ing and recycling with high percentage of reclaimed asphaltpavement (RAP) [5–8]. Huang reported that WMA with high per-centage of RAP exhibited higher rut resistance, better moisturedamage resistance, and better fatigue performance when com-pared with hot mix asphalt containing RAP [7,8]. Researches doneby Hamzah showed that the addition of warm mix additive Sas-obit� did not significantly influent the optimum asphalt content.However, the use of Sasobit� in the blended asphalt binders incor-porated with aged binder could reduce mixing and compactiontemperatures and thus the required heat energy and CO2 emission[9,10].
Warm mix asphalt can be produced by using foaming materialsto increase the workability and compactability of the mixture atlower temperatures [1,6]. The addition of organic additives, forexample wax, into bitumen helped to reduce the viscosity and thusallowed producing the so-called no-foaming warm mix asphalt[11]. Another type of warm mix asphalt was made by the use ofchemical additives consisting of a combination of emulsification
240 L. Mo et al. / Construction and Building Materials 37 (2012) 239–247
agents, surfactants, antistripping agents, etc. The mechanisms oftemperature reduction of this product differ from foaming effectand viscosity reduction as mentioned above. It was reported thatthe chemical additives improved bitumen coating, mixture work-ability and compactability at lower temperatures [6,12,13].
In the asphalt industry, the mixing and compaction tempera-tures are usually determined on the basis of the temperature–vis-cosity graph. The mixing temperature is defined as thetemperature required to produce a viscosity of 0.17 ± 0.02 Pa s,while a viscosity of 0.28 ± 0.03 Pa s for compaction temperature.The viscosity is selected as an effective indicator for the estimationof binder workability [14–16]. Warm mix asphalt produced byusing foaming and viscosity reduction effect can apply this princi-ple to select its mixing and compaction temperatures. However,with respect to warm mix asphalt containing chemical additives,the determination of these two temperatures becomes trouble-some [12,13,17]. It was found that the lubricity effects of the bin-der were important to promote mixture compactability and thus anew test methodology was proposed to estimate the binder work-ability [18]. Because the relation between the bitumen workabilityand mixture compactability has not been well established, studiesin greater depth are still needed for warm mix asphalt containingchemical additives [1,6].
Mixing and compaction are the last steps which can signifi-cantly influence the construction quality of asphalt pavements. Re-duced mixing temperature can cause poor bitumen coating andthus make asphalt mixture susceptible to moisture damage. It iswell-known that compaction improves the performance of asphaltpavements. Among other factors, compaction temperature has thegreatest influence on mixture compaction. Reduced compactiontemperature can make mixture compaction difficult or even resultin insufficient compaction. It was reported that more than 80% ofpremature failures including rutting, water damage and raveling,of asphalt pavements are related to insufficient compaction[19,20]. It is believed that the selection of mixing and compactiontemperatures have a significant effect on mixture performance aswell as the effectiveness of chemical additives. In the case thatthe bitumen workability is difficult to obtain as an indicator forthe determination of mixing and compaction temperatures, directmixture compaction testing becomes more practical and promisingto estimate the compactability of asphalt mixtures [21,22].
The paper aimed to investigate the compaction characteristicsand performance of warm mix asphalt containing chemical addi-tives. For the purpose of comparison, hot mix asphalt was alsoused. The effect of chemical additive on the viscosity of SBS mod-ified bitumen and base bitumen was evaluated. The ease of com-paction of warm mix asphalt and hot mix asphalt at variouscompaction temperatures was analyzed using the numbers of rev-olution that is required to achieve a desired degree of compactionand compaction energy concept. Finally, performance testing onboth warm and hot mix asphalt was carried out by means ofimmersion wheel tracking test. By doing this, the coupling effectof rutting and water damage can be evaluated.
2. Experimental details
2.1. Raw materials
Two types of bitumen including one base bitumen and one SBSmodified bitumen were used in this study. The base bitumen had a
Table 1Combined gradation of blended aggregates.
Sieve size (mm) 16 13.2 9.5 4.75Percent passing (%) 100 98.9 82.2 52.7
penetration at 25 �C of 72.6 d mm, a softening point of 48.5 �C anda ductility at 5 �C of 61 cm, while the SBS modified bitumenshowed a penetration at 25 �C of 51.1 d mm, a softening point of83.5 �C and a ductility at 5 �C of 58 cm.
The aggregate used was crushed limestone with a density of2.729 g/cm3. Four fractions of limestone aggregate were employed:9.5–16 mm, 4.75–9.5 mm, 2.36–4.75 mm and fine fraction smallerthan 2.36 mm. Mineral filler was used limestone powder with adensity of 2.654 g/cm3. It is composed of 51.5% CaO and 1.76%SiO2. The particle size was in the range of 0–0.3 mm, with 81.0%by mass smaller than 0.075 mm.
The four fractions of aggregate and filler were used for aggre-gate gradation design according to AC-13 asphalt mixture. Thecombined gradation of blended aggregates is shown in Table 1.
The used warm mix additive, Rediset WMA-8017 was suppliedby AkzoNobel Surface Chemistry AB, Sweden. It was a chemicaladditive consisting of surfactants, additives to improve bitumencoating, mixture workability, and compaction, as well as adhesionpromoters (antistripping agents). The additive was first mixed withbitumen before adding bitumen into the blended aggregates. Theadditive content that is recommended was 2% by weight of thebitumen. More detailed information on warm mix binders contain-ing Rediset can be found elsewhere [23]. In order to investigate theeffect of additive content on bitumen viscosity, additive contentranging from 1.5% to 3% was considered.
2.2. Test methods
2.2.1. Viscosity testBrookfield Viscometer was used to determine the viscosity of
bituminous binders that contains warm mix additive in accordancewith ASTM D4402 [24]. The amount of warm mix additive rangedfrom 0% to 3%. The test temperature ranged from 115 �C to 175 �Cfor the base bitumen, while a higher temperature varyingfrom 135 �C to 185 �C was considered for the SBS modified bitu-men. The temperature of test specimen was controlled by a temper-ature chamber. At each test temperature, specimen was kept inthe constant temperature at least 15 min before starting themeasurement.
2.2.2. Determination of asphalt contentIn this study, the optimum asphalt binder content was
selected based on the combined results of Marshall tests and vol-umetric measurements. Marshall Hammer (75 blows per side)was used to prepare specimens. The mixing temperature andcompaction temperatures were 155 �C and 145 �C for base bitu-men, while 175 �C and 165 �C for SBS modified bitumen. With atarget air void content of 4–4.5% by volume, the asphalt contentfor both mixtures was determined as 4.8% by weight of the totalaggregate.
2.2.3. Gyration compactionGyratory compaction is considered to be one of the best meth-
ods of laboratory compaction for the assessment of compactabilityof asphalt mixtures [17,21,22]. For this reason, a gyratory compac-tor (T401, Troxler, USA) was used to investigate the compactioncharacteristics of warm mix asphalt in this study. For the purposeof comparison and as the benchmark, hot mix asphalt that wasproduced by using base bitumen and SBS modified bitumen wasinvolved. In total, four mixtures were involved and focus was on
2.36 1.18 0.6 0.3 0.15 0.07531.9 22.3 15.6 11.0 8.6 7.2
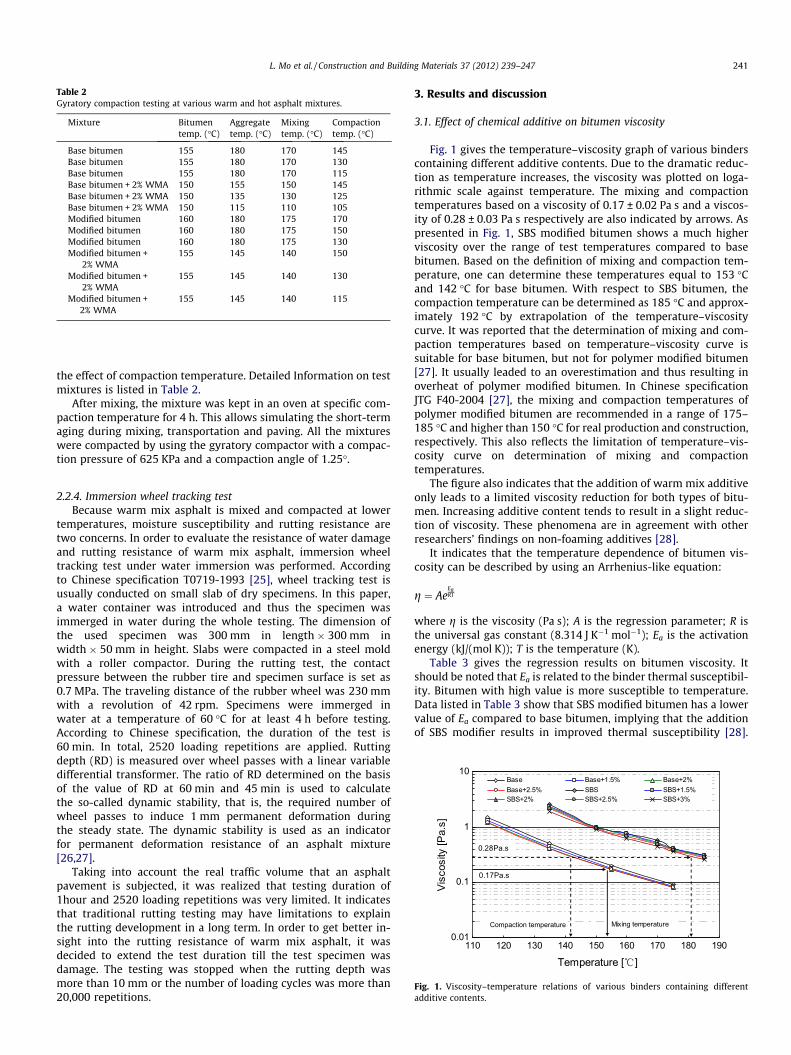
Table 2Gyratory compaction testing at various warm and hot asphalt mixtures.
Mixture Bitumentemp. (�C)
Aggregatetemp. (�C)
Mixingtemp. (�C)
Compactiontemp. (�C)
Base bitumen 155 180 170 145Base bitumen 155 180 170 130Base bitumen 155 180 170 115Base bitumen + 2% WMA 150 155 150 145Base bitumen + 2% WMA 150 135 130 125Base bitumen + 2% WMA 150 115 110 105Modified bitumen 160 180 175 170Modified bitumen 160 180 175 150Modified bitumen 160 180 175 130Modified bitumen +
2% WMA155 145 140 150
Modified bitumen +2% WMA
155 145 140 130
Modified bitumen +2% WMA
155 145 140 115
L. Mo et al. / Construction and Building Materials 37 (2012) 239–247 241
the effect of compaction temperature. Detailed Information on testmixtures is listed in Table 2.
After mixing, the mixture was kept in an oven at specific com-paction temperature for 4 h. This allows simulating the short-termaging during mixing, transportation and paving. All the mixtureswere compacted by using the gyratory compactor with a compac-tion pressure of 625 KPa and a compaction angle of 1.25�.
0.01
0.1
1
10
110 120 130 140 150 160 170 180 190
Temperature [ ]
Visc
osity
[Pa.
s]
Base Base+1.5% Base+2%Base+2.5% SBS SBS+1.5%SBS+2% SBS+2.5% SBS+3%
Mixing temperatureCompaction temperature
0.28Pa.s
0.17Pa.s
Fig. 1. Viscosity–temperature relations of various binders containing differentadditive contents.
2.2.4. Immersion wheel tracking testBecause warm mix asphalt is mixed and compacted at lower
temperatures, moisture susceptibility and rutting resistance aretwo concerns. In order to evaluate the resistance of water damageand rutting resistance of warm mix asphalt, immersion wheeltracking test under water immersion was performed. Accordingto Chinese specification T0719-1993 [25], wheel tracking test isusually conducted on small slab of dry specimens. In this paper,a water container was introduced and thus the specimen wasimmerged in water during the whole testing. The dimension ofthe used specimen was 300 mm in length � 300 mm inwidth � 50 mm in height. Slabs were compacted in a steel moldwith a roller compactor. During the rutting test, the contactpressure between the rubber tire and specimen surface is set as0.7 MPa. The traveling distance of the rubber wheel was 230 mmwith a revolution of 42 rpm. Specimens were immerged inwater at a temperature of 60 �C for at least 4 h before testing.According to Chinese specification, the duration of the test is60 min. In total, 2520 loading repetitions are applied. Ruttingdepth (RD) is measured over wheel passes with a linear variabledifferential transformer. The ratio of RD determined on the basisof the value of RD at 60 min and 45 min is used to calculatethe so-called dynamic stability, that is, the required number ofwheel passes to induce 1 mm permanent deformation duringthe steady state. The dynamic stability is used as an indicatorfor permanent deformation resistance of an asphalt mixture[26,27].
Taking into account the real traffic volume that an asphaltpavement is subjected, it was realized that testing duration of1hour and 2520 loading repetitions was very limited. It indicatesthat traditional rutting testing may have limitations to explainthe rutting development in a long term. In order to get better in-sight into the rutting resistance of warm mix asphalt, it wasdecided to extend the test duration till the test specimen wasdamage. The testing was stopped when the rutting depth wasmore than 10 mm or the number of loading cycles was more than20,000 repetitions.
3. Results and discussion
3.1. Effect of chemical additive on bitumen viscosity
Fig. 1 gives the temperature–viscosity graph of various binderscontaining different additive contents. Due to the dramatic reduc-tion as temperature increases, the viscosity was plotted on loga-rithmic scale against temperature. The mixing and compactiontemperatures based on a viscosity of 0.17 ± 0.02 Pa s and a viscos-ity of 0.28 ± 0.03 Pa s respectively are also indicated by arrows. Aspresented in Fig. 1, SBS modified bitumen shows a much higherviscosity over the range of test temperatures compared to basebitumen. Based on the definition of mixing and compaction tem-perature, one can determine these temperatures equal to 153 �Cand 142 �C for base bitumen. With respect to SBS bitumen, thecompaction temperature can be determined as 185 �C and approx-imately 192 �C by extrapolation of the temperature–viscositycurve. It was reported that the determination of mixing and com-paction temperatures based on temperature–viscosity curve issuitable for base bitumen, but not for polymer modified bitumen[27]. It usually leaded to an overestimation and thus resulting inoverheat of polymer modified bitumen. In Chinese specificationJTG F40-2004 [27], the mixing and compaction temperatures ofpolymer modified bitumen are recommended in a range of 175–185 �C and higher than 150 �C for real production and construction,respectively. This also reflects the limitation of temperature–vis-cosity curve on determination of mixing and compactiontemperatures.
The figure also indicates that the addition of warm mix additiveonly leads to a limited viscosity reduction for both types of bitu-men. Increasing additive content tends to result in a slight reduc-tion of viscosity. These phenomena are in agreement with otherresearchers’ findings on non-foaming additives [28].
It indicates that the temperature dependence of bitumen vis-cosity can be described by using an Arrhenius-like equation:
g ¼ AeEaRT
where g is the viscosity (Pa s); A is the regression parameter; R isthe universal gas constant (8.314 J K�1 mol�1); Ea is the activationenergy (kJ/(mol K)); T is the temperature (K).
Table 3 gives the regression results on bitumen viscosity. Itshould be noted that Ea is related to the binder thermal susceptibil-ity. Bitumen with high value is more susceptible to temperature.Data listed in Table 3 show that SBS modified bitumen has a lowervalue of Ea compared to base bitumen, implying that the additionof SBS modifier results in improved thermal susceptibility [28].
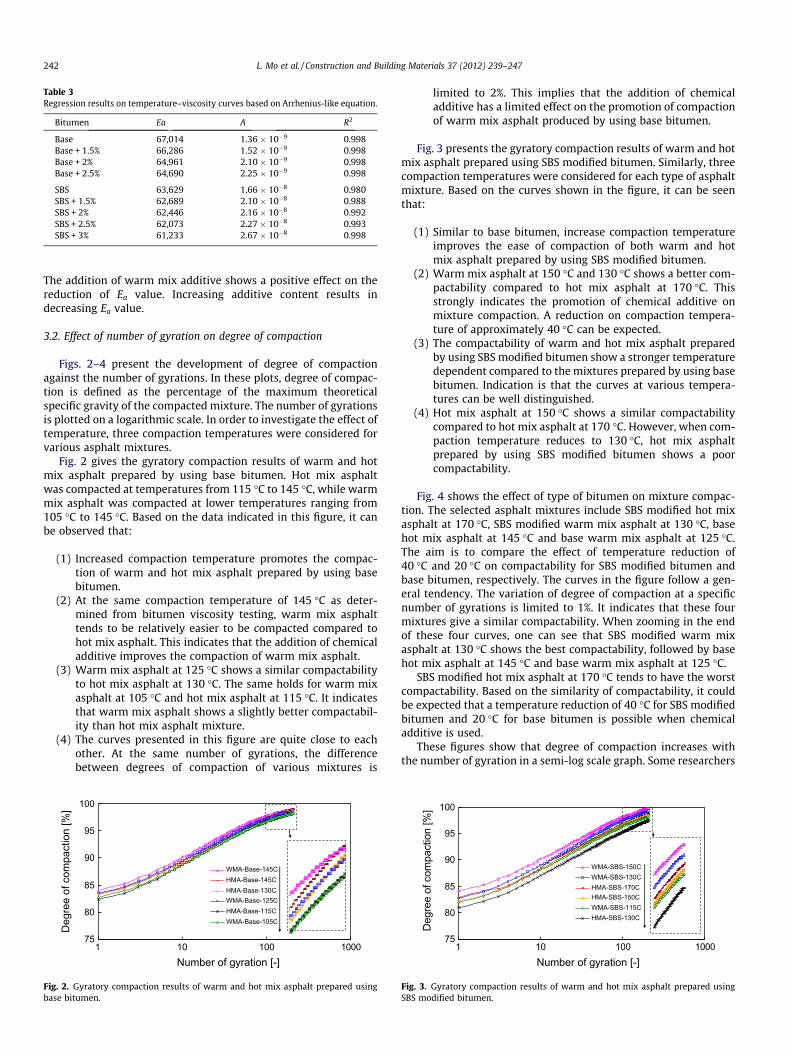
Table 3Regression results on temperature–viscosity curves based on Arrhenius-like equation.
Bitumen Ea A R2
Base 67,014 1.36 � 10�9 0.998Base + 1.5% 66,286 1.52 � 10�9 0.998Base + 2% 64,961 2.10 � 10�9 0.998Base + 2.5% 64,690 2.25 � 10�9 0.998
SBS 63,629 1.66 � 10�8 0.980SBS + 1.5% 62,689 2.10 � 10�8 0.988SBS + 2% 62,446 2.16 � 10�8 0.992SBS + 2.5% 62,073 2.27 � 10�8 0.993SBS + 3% 61,233 2.67 � 10�8 0.998
242 L. Mo et al. / Construction and Building Materials 37 (2012) 239–247
The addition of warm mix additive shows a positive effect on thereduction of Ea value. Increasing additive content results indecreasing Ea value.
3.2. Effect of number of gyration on degree of compaction
Figs. 2–4 present the development of degree of compactionagainst the number of gyrations. In these plots, degree of compac-tion is defined as the percentage of the maximum theoreticalspecific gravity of the compacted mixture. The number of gyrationsis plotted on a logarithmic scale. In order to investigate the effect oftemperature, three compaction temperatures were considered forvarious asphalt mixtures.
Fig. 2 gives the gyratory compaction results of warm and hotmix asphalt prepared by using base bitumen. Hot mix asphaltwas compacted at temperatures from 115 �C to 145 �C, while warmmix asphalt was compacted at lower temperatures ranging from105 �C to 145 �C. Based on the data indicated in this figure, it canbe observed that:
(1) Increased compaction temperature promotes the compac-tion of warm and hot mix asphalt prepared by using basebitumen.
(2) At the same compaction temperature of 145 �C as deter-mined from bitumen viscosity testing, warm mix asphalttends to be relatively easier to be compacted compared tohot mix asphalt. This indicates that the addition of chemicaladditive improves the compaction of warm mix asphalt.
(3) Warm mix asphalt at 125 �C shows a similar compactabilityto hot mix asphalt at 130 �C. The same holds for warm mixasphalt at 105 �C and hot mix asphalt at 115 �C. It indicatesthat warm mix asphalt shows a slightly better compactabil-ity than hot mix asphalt mixture.
(4) The curves presented in this figure are quite close to eachother. At the same number of gyrations, the differencebetween degrees of compaction of various mixtures is
75
80
85
90
95
100
1 10 100 1000Number of gyration [-]
Deg
ree
of c
ompa
ctio
n [%
]
WMA-Base-145CHMA-Base-145CHMA-Base-130CWMA-Base-125CHMA-Base-115CWMA-Base-105C
Fig. 2. Gyratory compaction results of warm and hot mix asphalt prepared usingbase bitumen.
limited to 2%. This implies that the addition of chemicaladditive has a limited effect on the promotion of compactionof warm mix asphalt produced by using base bitumen.
Fig. 3 presents the gyratory compaction results of warm and hotmix asphalt prepared using SBS modified bitumen. Similarly, threecompaction temperatures were considered for each type of asphaltmixture. Based on the curves shown in the figure, it can be seenthat:
(1) Similar to base bitumen, increase compaction temperatureimproves the ease of compaction of both warm and hotmix asphalt prepared by using SBS modified bitumen.
(2) Warm mix asphalt at 150 �C and 130 �C shows a better com-pactability compared to hot mix asphalt at 170 �C. Thisstrongly indicates the promotion of chemical additive onmixture compaction. A reduction on compaction tempera-ture of approximately 40 �C can be expected.
(3) The compactability of warm and hot mix asphalt preparedby using SBS modified bitumen show a stronger temperaturedependent compared to the mixtures prepared by using basebitumen. Indication is that the curves at various tempera-tures can be well distinguished.
(4) Hot mix asphalt at 150 �C shows a similar compactabilitycompared to hot mix asphalt at 170 �C. However, when com-paction temperature reduces to 130 �C, hot mix asphaltprepared by using SBS modified bitumen shows a poorcompactability.
Fig. 4 shows the effect of type of bitumen on mixture compac-tion. The selected asphalt mixtures include SBS modified hot mixasphalt at 170 �C, SBS modified warm mix asphalt at 130 �C, basehot mix asphalt at 145 �C and base warm mix asphalt at 125 �C.The aim is to compare the effect of temperature reduction of40 �C and 20 �C on compactability for SBS modified bitumen andbase bitumen, respectively. The curves in the figure follow a gen-eral tendency. The variation of degree of compaction at a specificnumber of gyrations is limited to 1%. It indicates that these fourmixtures give a similar compactability. When zooming in the endof these four curves, one can see that SBS modified warm mixasphalt at 130 �C shows the best compactability, followed by basehot mix asphalt at 145 �C and base warm mix asphalt at 125 �C.
SBS modified hot mix asphalt at 170 �C tends to have the worstcompactability. Based on the similarity of compactability, it couldbe expected that a temperature reduction of 40 �C for SBS modifiedbitumen and 20 �C for base bitumen is possible when chemicaladditive is used.
These figures show that degree of compaction increases withthe number of gyration in a semi-log scale graph. Some researchers
75
80
85
90
95
100
1 10 100 1000
Number of gyration [-]
Deg
ree
of c
ompa
ctio
n [%
]
WMA-SBS-150CWMA-SBS-130CHMA-SBS-170CHMA-SBS-150CWMA-SBS-115CHMA-SBS-130C
Fig. 3. Gyratory compaction results of warm and hot mix asphalt prepared usingSBS modified bitumen.
80
85
90
95
100
1 10 100 1000
Number of gyration [-]
Deg
ree
of c
ompa
ctio
n [%
]
WMA-SBS-130CHMA-Base-145CWMA-Base-125CHMA-SBS-170C
Fig. 4. Effect of type of bitumen on mixture compaction.
0
5000
10000
15000
20000
25000
0 50 100 150 200 250
Number of gyrations [-]
Accu
mul
ated
com
pact
ion
ene
rgy
WMA-SBS-150CWMA-SBS-130CHMA-SBS-170CHMA-SBS-150CWMA-SBS-115CHMA-SBS-130C
Fig. 5. Relation between accumulated compaction energy and number of gyrations.
L. Mo et al. / Construction and Building Materials 37 (2012) 239–247 243
proposed to use the following equation to explain the relation be-tween air void content of the compacted specimen and the numberof gyrations applied to the mixture [17–19].
Vi ¼ V1 � KLnðNiÞ ð1Þ
where Vi is the air void content for a given number of cycles (%); V1
is the air voids content calculated at the first gyration; K is the com-pactability factor. Ni is the number of gyrations.
The air void content and degree of compaction holds the follow-ing relation:
V1 ¼ 100� DOC1 ð2Þ
Vi ¼ 100� DOCi ð3Þ
where DOC1 is the degree of compaction calculated at the first gyra-tion, that is, initial degree of compaction (%); DOCi is the degree ofcompaction for a given number of cycles (%).
Eq. (1) can also be rewritten using degree of compaction insteadof air void content.
DOCi ¼ DOC1 þ KLnðNiÞ ð4Þ
The regression coefficients of K and V1 were used to explain theease of compaction. it was reported that the values of K and V1
tended to reduce as increased bitumen content. Elsa found thatV1 reduced with increased compaction temperatures; however, Kdid not follow a simple trend, but most of data indicate that Kwas likely to reduce as temperature increases [22].
In this paper, Eq. (1) was used to fit the gyratory compaction re-sults of various asphalt mixture. Table 4 gives the regression re-sults by means of least square method. As indicated, the trend ofK is complex. For example, K shows a decline trend as compactiontemperature increases for hot mix asphalt prepared by using SBSmodified bitumen and warm mix asphalt prepared by using basebitumen, while an increase trend is observed for hot mix asphalt
Table 4Regression results on development of degree of compaction and the number of gyrations
Bitumen Mixture-temp. (�C) K
SBS modified bitumen HMA-130 3.399HMA-150 3.357HMA-170 3.314WMA-115 3.321WMA-130 3.387WMA-150 3.183
Base bitumen HMA-115 3.137HMA-130 3.150HMA-155 3.163WMA-105 3.111WMA-125 3.007WMA-145 2.929
prepared by base bitumen. The obtained results show that K can-not well reflect mixture compactability. With respect to V1, it in-creases with increasing compaction temperature, indicating thatinitial degree of compaction may have a strong relation with mix-ture compactability.
3.3. Effect of number of compaction energy
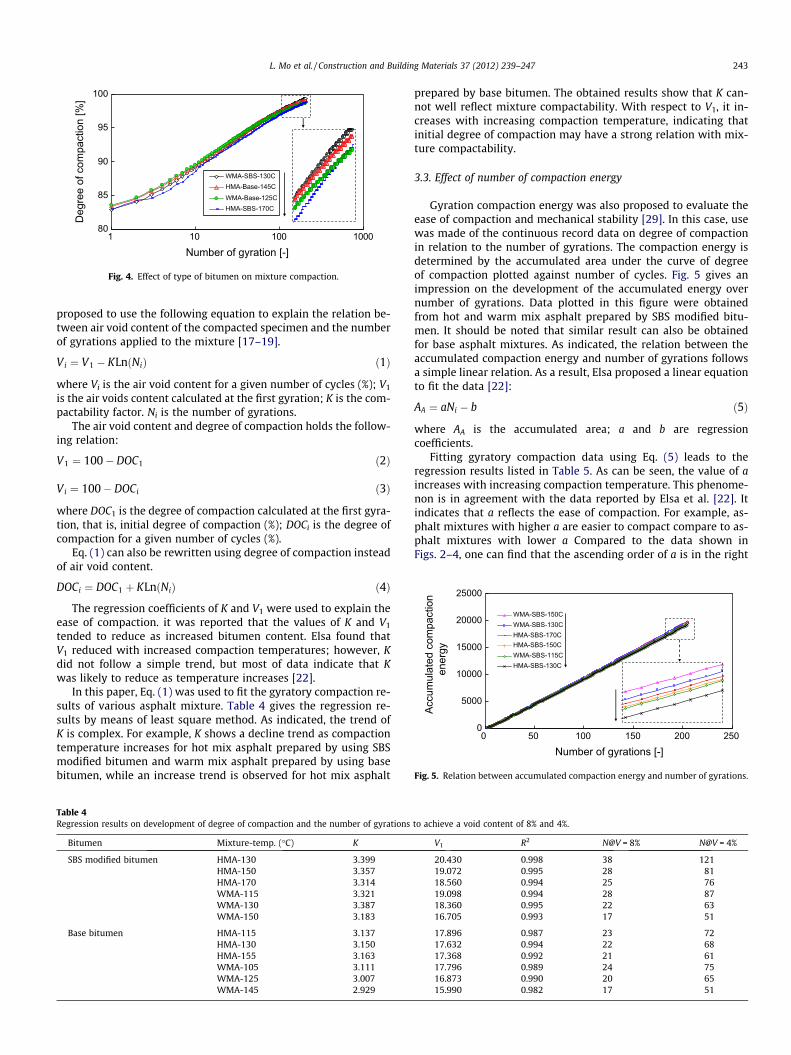
Gyration compaction energy was also proposed to evaluate theease of compaction and mechanical stability [29]. In this case, usewas made of the continuous record data on degree of compactionin relation to the number of gyrations. The compaction energy isdetermined by the accumulated area under the curve of degreeof compaction plotted against number of cycles. Fig. 5 gives animpression on the development of the accumulated energy overnumber of gyrations. Data plotted in this figure were obtainedfrom hot and warm mix asphalt prepared by SBS modified bitu-men. It should be noted that similar result can also be obtainedfor base asphalt mixtures. As indicated, the relation between theaccumulated compaction energy and number of gyrations followsa simple linear relation. As a result, Elsa proposed a linear equationto fit the data [22]:
AA ¼ aNi � b ð5Þ
where AA is the accumulated area; a and b are regressioncoefficients.
Fitting gyratory compaction data using Eq. (5) leads to theregression results listed in Table 5. As can be seen, the value of aincreases with increasing compaction temperature. This phenome-non is in agreement with the data reported by Elsa et al. [22]. Itindicates that a reflects the ease of compaction. For example, as-phalt mixtures with higher a are easier to compact compare to as-phalt mixtures with lower a Compared to the data shown inFigs. 2–4, one can find that the ascending order of a is in the right
to achieve a void content of 8% and 4%.
V1 R2 N@V = 8% N@V = 4%
20.430 0.998 38 12119.072 0.995 28 8118.560 0.994 25 7619.098 0.994 28 8718.360 0.995 22 6316.705 0.993 17 51
17.896 0.987 23 7217.632 0.994 22 6817.368 0.992 21 6117.796 0.989 24 7516.873 0.990 20 6515.990 0.982 17 51
Table 5Regression results on accumulated compaction energy and compaction energy indices.
Bitumen Mixture-temp. (�C) a b R2 CEI CEIV¼8%!4% TDI
SBS modified bitumen HMA-130 94.93 319.58 1.000 105.0 197.7 –A
HMA-150 96.13 319.39 1.000 50.2 130.1 550.3HMA-170 96.44 316.22 1.000 41.2 119.2 471.6WMA-115 95.95 314.59 1.000 53.7 141.5 645.6WMA-130 96.99 320.12 1.000 29.7 96.3 387.6WMA-150 97.72 309.22 1.000 12.7 79.9 299.2
Base bitumen HMA-115 96.36 303.82 1.000 42.0 117.3 835.1HMA-130 96.64 305.75 1.000 28.1 108.9 495.5HMA-145 96.98 306.93 1.000 22.0 94.4 418.0WMA-105 96.33 302.65 1.000 46.4 123.9 660.0WMA-125 96.78 295.90 1.000 27.6 110.7 515.0WMA-145 97.34 291.70 1.000 13.5 81.3 378.1
A 98% Degree of compaction did not reach at the maximum number of gyrations.
0
200
400
600
800
0 20 40 60 80 100 120
Compaction energy index, CEI
CEI
v=8%
-4%
and
TD
I
HMA-SBS-0WMA-SBS-0HMA-Sase-0WMA-Base-0HMA-SBS-1WMA-SBS-1HMA-Sase-1WMA-Base-1
y = 7.3131x + 253.42R2 = 0.735
y = 1.2658x + 66.969R2 = 0.976
Fig. 7. Relation between various compaction indices.
244 L. Mo et al. / Construction and Building Materials 37 (2012) 239–247
order of the ease of compaction of various asphalt mixtures. Theother parameter b does not show a clear trend on increasing com-paction temperatures.
Compaction Energy Index (CEI) based on the results fromgyration 8 until reaching 92% of degree of compaction was usedto compare the compaction of one mixture to another [17]. In orderto evaluate the possible post-densification due to the traffic effects,the Traffic Densification Index (TDI) was also proposed by usinggyratory compaction data ranging from 92% to 98% of degree ofcompaction. The definition of these two indices is schematicallyillustrated in Fig. 6 and can be determined as follows:
CEI ¼XNi¼Ni@DOC¼92%
Ni¼8
ðDOCi � DOC@Ni ¼ 8ÞdNi ð6Þ
TDI ¼XNi¼Ni@DOC¼98%
Ni¼Ni@DOC¼92%
ðDOCi � 92%ÞdNi ð7Þ
where DOC@Ni ¼ 8 is the degree of compaction at gyration 8 (%);Ni@DOC ¼ 92% and Ni@DOC ¼ 98% are the number of gyrationswhen degree of compaction reaches 92% and 98% respectively.
Fig. 6 schematic illustration of the definition of relevant com-paction indices
A void content of 8% is usually regarded as the maximum allow-able void content for compaction quality control of asphalt pave-ments. With respect to mixture design, a void content of 4% isusually desired. In practice, asphalt mixtures are expected to becompacted to achieve a void content that equal to the design voidcontent. In any cases, insufficient compaction and over compactionshould be avoided. The above indicates that the compaction energythat is required to compact an asphalt mixture with reducing voidcontent from 8% to 4% may well reflect the compactability at thesecond phase.
80828486889092949698
100
0 50 100 150 200 250Number of gyration
Deg
ree
of c
ompa
ctio
n [%
]
N=8
CEITDI
8% 4%VCEI
= →
Fig. 6. Schematic illustration of the definition of relevant compaction indices.
CEIV¼8%!4% ¼XN¼Ni@DOC¼96%
N¼Ni@DOC¼92%
ðDOCi � 92%ÞdN ð8Þ
where Ni@DOC ¼ 96% is the number of gyrations when degree ofcompaction reaches 96%.
The values of CEI, CEIV¼8%!4% and TDI as determined from gyra-tory compaction data are listed in Table 5. Among of these indices,CEI, CEIV¼8%!4% and TDI reflect the ease of compaction at the initial,steady phase and possible traffic densification, respectively. Fig. 7shows the relationships of the indices mentioned above. As indi-cated, the values of CEIV¼8%!4% and TDI strongly depend on the va-lue of CEI. A linear relationship can be observed. In general,CEIV¼8%!4% has a better linear regression compared to TDI. Thisindicates that the compaction mechanisms at various phases maybe different. During the initial and steady phases, the contributionof bituminous mortar is expected to be predominant while thecontribution of stone skeleton may play an important role on pos-sible traffic densification.
3.4. Effect of bitumen viscosity on the ease of compaction
It is known that bitumen viscosity has a great effect on the easeof compaction of asphalt mixtures. For this reason, mixing andcompaction temperatures are usually determined based on tem-perature–viscosity graph. The above discussion indicates that thereare interesting parameters that well reflect the ease of compaction.These parameters include the number of gyrations that is requiredto achieve a desired degree of compaction (98% and 96%), the valueof a (that is, the slope of the accumulated energy against number ofgyration) and compaction energy indices (CEI and CEIV¼8%!4%.Hereafter, the relation between bitumen viscosity and the param-eters mentioned above will be discussed. The aim is to examinewhether bitumen viscosity could be used as a good indicator for
0
20
40
60
80
100
120
140
0 1 2 3 4 5 6
Bitumen viscosity [Pa.s]
Num
ber o
f Gyr
atio
ns
y = 2.0517x + 20.459
R2 = 0.2967
y = 6.7484x + 61.76
R2 = 0.2982
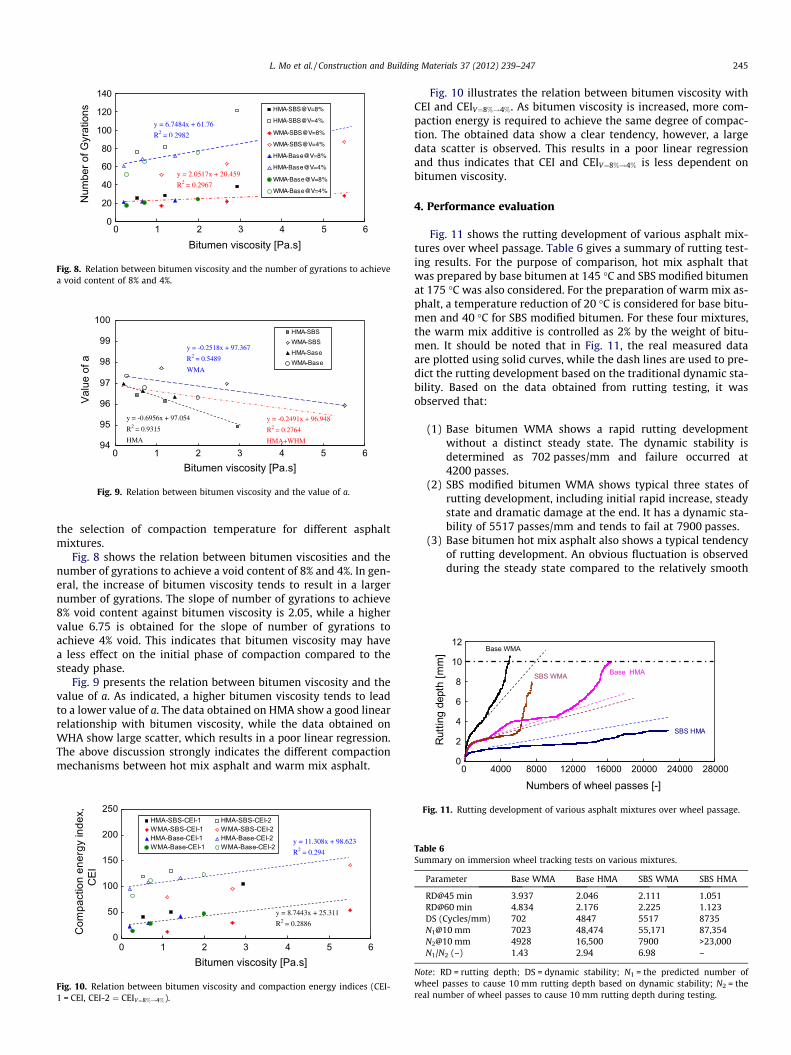
Fig. 8. Relation between bitumen viscosity and the number of gyrations to achievea void content of 8% and 4%.
94
95
96
97
98
99
100
0 1 2 3 4 5 6Bitumen viscosity [Pa.s]
Valu
e of
a
HMA-SBSWMA-SBSHMA-SaseWMA-Base
y = -0.2491x + 96.948
R2 = 0.2764
HMA+WHM
y = -0.6956x + 97.054
R2 = 0.9315
HMA
y = -0.2518x + 97.367
R2 = 0.5489
WMA
Fig. 9. Relation between bitumen viscosity and the value of a.
0
2
4
6
8
10
12
0 4000 8000 12000 16000 20000 24000 28000
Rut
ting
dept
h [m
m]
SBS HMA
SBS WMA Base HMA
Base WMA
L. Mo et al. / Construction and Building Materials 37 (2012) 239–247 245
the selection of compaction temperature for different asphaltmixtures.
Fig. 8 shows the relation between bitumen viscosities and thenumber of gyrations to achieve a void content of 8% and 4%. In gen-eral, the increase of bitumen viscosity tends to result in a largernumber of gyrations. The slope of number of gyrations to achieve8% void content against bitumen viscosity is 2.05, while a highervalue 6.75 is obtained for the slope of number of gyrations toachieve 4% void. This indicates that bitumen viscosity may havea less effect on the initial phase of compaction compared to thesteady phase.
Fig. 9 presents the relation between bitumen viscosity and thevalue of a. As indicated, a higher bitumen viscosity tends to leadto a lower value of a. The data obtained on HMA show a good linearrelationship with bitumen viscosity, while the data obtained onWHA show large scatter, which results in a poor linear regression.The above discussion strongly indicates the different compactionmechanisms between hot mix asphalt and warm mix asphalt.
0
50
100
150
200
250
0 1 2 3 4 5 6Bitumen viscosity [Pa.s]
Com
pact
ion
ener
gy in
dex,
C
EI
HMA-SBS-CEI-1 HMA-SBS-CEI-2WMA-SBS-CEI-1 WMA-SBS-CEI-2HMA-Base-CEI-1 HMA-Base-CEI-2WMA-Base-CEI-1 WMA-Base-CEI-2
y = 8.7443x + 25.311
R2 = 0.2886
y = 11.308x + 98.623
R2 = 0.294
Fig. 10. Relation between bitumen viscosity and compaction energy indices (CEI-1 = CEI, CEI-2 ¼ CEIV¼8%!4%).
Fig. 10 illustrates the relation between bitumen viscosity withCEI and CEIV¼8%!4%. As bitumen viscosity is increased, more com-paction energy is required to achieve the same degree of compac-tion. The obtained data show a clear tendency, however, a largedata scatter is observed. This results in a poor linear regressionand thus indicates that CEI and CEIV¼8%!4% is less dependent onbitumen viscosity.
4. Performance evaluation
Fig. 11 shows the rutting development of various asphalt mix-tures over wheel passage. Table 6 gives a summary of rutting test-ing results. For the purpose of comparison, hot mix asphalt thatwas prepared by base bitumen at 145 �C and SBS modified bitumenat 175 �C was also considered. For the preparation of warm mix as-phalt, a temperature reduction of 20 �C is considered for base bitu-men and 40 �C for SBS modified bitumen. For these four mixtures,the warm mix additive is controlled as 2% by the weight of bitu-men. It should be noted that in Fig. 11, the real measured dataare plotted using solid curves, while the dash lines are used to pre-dict the rutting development based on the traditional dynamic sta-bility. Based on the data obtained from rutting testing, it wasobserved that:
(1) Base bitumen WMA shows a rapid rutting developmentwithout a distinct steady state. The dynamic stability isdetermined as 702 passes/mm and failure occurred at4200 passes.
(2) SBS modified bitumen WMA shows typical three states ofrutting development, including initial rapid increase, steadystate and dramatic damage at the end. It has a dynamic sta-bility of 5517 passes/mm and tends to fail at 7900 passes.
(3) Base bitumen hot mix asphalt also shows a typical tendencyof rutting development. An obvious fluctuation is observedduring the steady state compared to the relatively smooth
Numbers of wheel passes [-]
Fig. 11. Rutting development of various asphalt mixtures over wheel passage.
Table 6Summary on immersion wheel tracking tests on various mixtures.
Parameter Base WMA Base HMA SBS WMA SBS HMA
RD@45 min 3.937 2.046 2.111 1.051RD@60 min 4.834 2.176 2.225 1.123DS (Cycles/mm) 702 4847 5517 8735N1@10 mm 7023 48,474 55,171 87,354N2@10 mm 4928 16,500 7900 >23,000N1/N2 (–) 1.43 2.94 6.98 –
Note: RD = rutting depth; DS = dynamic stability; N1 = the predicted number ofwheel passes to cause 10 mm rutting depth based on dynamic stability; N2 = thereal number of wheel passes to cause 10 mm rutting depth during testing.
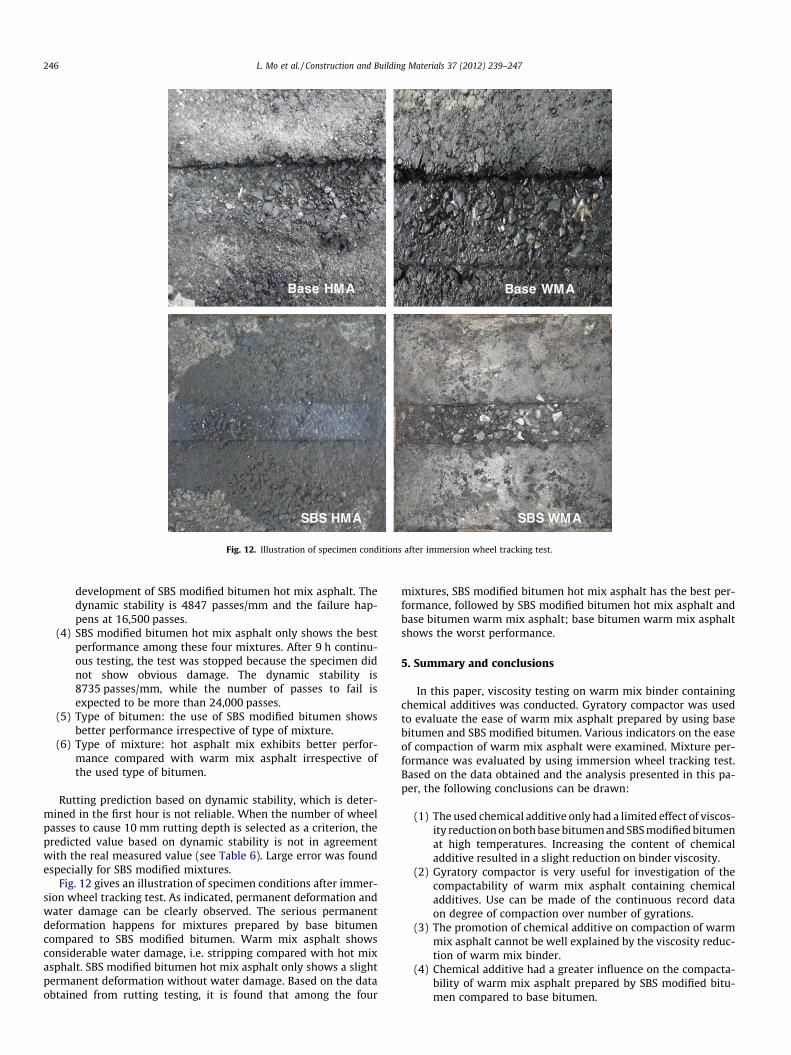
Fig. 12. Illustration of specimen conditions after immersion wheel tracking test.
246 L. Mo et al. / Construction and Building Materials 37 (2012) 239–247
development of SBS modified bitumen hot mix asphalt. Thedynamic stability is 4847 passes/mm and the failure hap-pens at 16,500 passes.
(4) SBS modified bitumen hot mix asphalt only shows the bestperformance among these four mixtures. After 9 h continu-ous testing, the test was stopped because the specimen didnot show obvious damage. The dynamic stability is8735 passes/mm, while the number of passes to fail isexpected to be more than 24,000 passes.
(5) Type of bitumen: the use of SBS modified bitumen showsbetter performance irrespective of type of mixture.
(6) Type of mixture: hot asphalt mix exhibits better perfor-mance compared with warm mix asphalt irrespective ofthe used type of bitumen.
Rutting prediction based on dynamic stability, which is deter-mined in the first hour is not reliable. When the number of wheelpasses to cause 10 mm rutting depth is selected as a criterion, thepredicted value based on dynamic stability is not in agreementwith the real measured value (see Table 6). Large error was foundespecially for SBS modified mixtures.
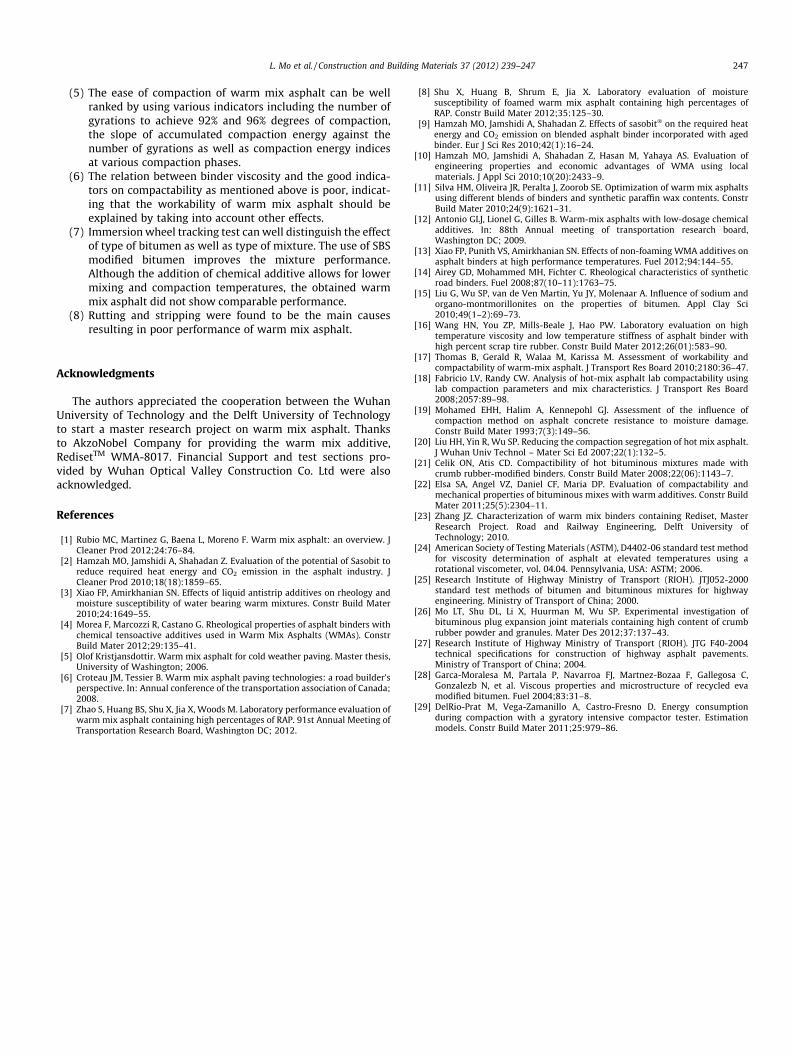
Fig. 12 gives an illustration of specimen conditions after immer-sion wheel tracking test. As indicated, permanent deformation andwater damage can be clearly observed. The serious permanentdeformation happens for mixtures prepared by base bitumencompared to SBS modified bitumen. Warm mix asphalt showsconsiderable water damage, i.e. stripping compared with hot mixasphalt. SBS modified bitumen hot mix asphalt only shows a slightpermanent deformation without water damage. Based on the dataobtained from rutting testing, it is found that among the four
mixtures, SBS modified bitumen hot mix asphalt has the best per-formance, followed by SBS modified bitumen hot mix asphalt andbase bitumen warm mix asphalt; base bitumen warm mix asphaltshows the worst performance.
5. Summary and conclusions
In this paper, viscosity testing on warm mix binder containingchemical additives was conducted. Gyratory compactor was usedto evaluate the ease of warm mix asphalt prepared by using basebitumen and SBS modified bitumen. Various indicators on the easeof compaction of warm mix asphalt were examined. Mixture per-formance was evaluated by using immersion wheel tracking test.Based on the data obtained and the analysis presented in this pa-per, the following conclusions can be drawn:
(1) The used chemical additive only had a limited effect of viscos-ity reduction on both base bitumen and SBS modified bitumenat high temperatures. Increasing the content of chemicaladditive resulted in a slight reduction on binder viscosity.
(2) Gyratory compactor is very useful for investigation of thecompactability of warm mix asphalt containing chemicaladditives. Use can be made of the continuous record dataon degree of compaction over number of gyrations.
(3) The promotion of chemical additive on compaction of warmmix asphalt cannot be well explained by the viscosity reduc-tion of warm mix binder.
(4) Chemical additive had a greater influence on the compacta-bility of warm mix asphalt prepared by SBS modified bitu-men compared to base bitumen.
L. Mo et al. / Construction and Building Materials 37 (2012) 239–247 247
(5) The ease of compaction of warm mix asphalt can be wellranked by using various indicators including the number ofgyrations to achieve 92% and 96% degrees of compaction,the slope of accumulated compaction energy against thenumber of gyrations as well as compaction energy indicesat various compaction phases.
(6) The relation between binder viscosity and the good indica-tors on compactability as mentioned above is poor, indicat-ing that the workability of warm mix asphalt should beexplained by taking into account other effects.
(7) Immersion wheel tracking test can well distinguish the effectof type of bitumen as well as type of mixture. The use of SBSmodified bitumen improves the mixture performance.Although the addition of chemical additive allows for lowermixing and compaction temperatures, the obtained warmmix asphalt did not show comparable performance.
(8) Rutting and stripping were found to be the main causesresulting in poor performance of warm mix asphalt.
Acknowledgments
The authors appreciated the cooperation between the WuhanUniversity of Technology and the Delft University of Technologyto start a master research project on warm mix asphalt. Thanksto AkzoNobel Company for providing the warm mix additive,RedisetTM WMA-8017. Financial Support and test sections pro-vided by Wuhan Optical Valley Construction Co. Ltd were alsoacknowledged.
References
[1] Rubio MC, Martinez G, Baena L, Moreno F. Warm mix asphalt: an overview. JCleaner Prod 2012;24:76–84.
[2] Hamzah MO, Jamshidi A, Shahadan Z. Evaluation of the potential of Sasobit toreduce required heat energy and CO2 emission in the asphalt industry. JCleaner Prod 2010;18(18):1859–65.
[3] Xiao FP, Amirkhanian SN. Effects of liquid antistrip additives on rheology andmoisture susceptibility of water bearing warm mixtures. Constr Build Mater2010;24:1649–55.
[4] Morea F, Marcozzi R, Castano G. Rheological properties of asphalt binders withchemical tensoactive additives used in Warm Mix Asphalts (WMAs). ConstrBuild Mater 2012;29:135–41.
[5] Olof Kristjansdottir. Warm mix asphalt for cold weather paving. Master thesis,University of Washington; 2006.
[6] Croteau JM, Tessier B. Warm mix asphalt paving technologies: a road builder’sperspective. In: Annual conference of the transportation association of Canada;2008.
[7] Zhao S, Huang BS, Shu X, Jia X, Woods M. Laboratory performance evaluation ofwarm mix asphalt containing high percentages of RAP. 91st Annual Meeting ofTransportation Research Board, Washington DC; 2012.
[8] Shu X, Huang B, Shrum E, Jia X. Laboratory evaluation of moisturesusceptibility of foamed warm mix asphalt containing high percentages ofRAP. Constr Build Mater 2012;35:125–30.
[9] Hamzah MO, Jamshidi A, Shahadan Z. Effects of sasobit� on the required heatenergy and CO2 emission on blended asphalt binder incorporated with agedbinder. Eur J Sci Res 2010;42(1):16–24.
[10] Hamzah MO, Jamshidi A, Shahadan Z, Hasan M, Yahaya AS. Evaluation ofengineering properties and economic advantages of WMA using localmaterials. J Appl Sci 2010;10(20):2433–9.
[11] Silva HM, Oliveira JR, Peralta J, Zoorob SE. Optimization of warm mix asphaltsusing different blends of binders and synthetic paraffin wax contents. ConstrBuild Mater 2010;24(9):1621–31.
[12] Antonio GLJ, Lionel G, Gilles B. Warm-mix asphalts with low-dosage chemicaladditives. In: 88th Annual meeting of transportation research board,Washington DC; 2009.
[13] Xiao FP, Punith VS, Amirkhanian SN. Effects of non-foaming WMA additives onasphalt binders at high performance temperatures. Fuel 2012;94:144–55.
[14] Airey GD, Mohammed MH, Fichter C. Rheological characteristics of syntheticroad binders. Fuel 2008;87(10–11):1763–75.
[15] Liu G, Wu SP, van de Ven Martin, Yu JY, Molenaar A. Influence of sodium andorgano-montmorillonites on the properties of bitumen. Appl Clay Sci2010;49(1–2):69–73.
[16] Wang HN, You ZP, Mills-Beale J, Hao PW. Laboratory evaluation on hightemperature viscosity and low temperature stiffness of asphalt binder withhigh percent scrap tire rubber. Constr Build Mater 2012;26(01):583–90.
[17] Thomas B, Gerald R, Walaa M, Karissa M. Assessment of workability andcompactability of warm-mix asphalt. J Transport Res Board 2010;2180:36–47.
[18] Fabricio LV, Randy CW. Analysis of hot-mix asphalt lab compactability usinglab compaction parameters and mix characteristics. J Transport Res Board2008;2057:89–98.
[19] Mohamed EHH, Halim A, Kennepohl GJ. Assessment of the influence ofcompaction method on asphalt concrete resistance to moisture damage.Constr Build Mater 1993;7(3):149–56.
[20] Liu HH, Yin R, Wu SP. Reducing the compaction segregation of hot mix asphalt.J Wuhan Univ Technol – Mater Sci Ed 2007;22(1):132–5.
[21] Celik ON, Atis CD. Compactibility of hot bituminous mixtures made withcrumb rubber-modified binders. Constr Build Mater 2008;22(06):1143–7.
[22] Elsa SA, Angel VZ, Daniel CF, Maria DP. Evaluation of compactability andmechanical properties of bituminous mixes with warm additives. Constr BuildMater 2011;25(5):2304–11.
[23] Zhang JZ. Characterization of warm mix binders containing Rediset, MasterResearch Project. Road and Railway Engineering, Delft University ofTechnology; 2010.
[24] American Society of Testing Materials (ASTM), D4402-06 standard test methodfor viscosity determination of asphalt at elevated temperatures using arotational viscometer, vol. 04.04. Pennsylvania, USA: ASTM; 2006.
[25] Research Institute of Highway Ministry of Transport (RIOH). JTJ052-2000standard test methods of bitumen and bituminous mixtures for highwayengineering. Ministry of Transport of China; 2000.
[26] Mo LT, Shu DL, Li X, Huurman M, Wu SP. Experimental investigation ofbituminous plug expansion joint materials containing high content of crumbrubber powder and granules. Mater Des 2012;37:137–43.
[27] Research Institute of Highway Ministry of Transport (RIOH). JTG F40-2004technical specifications for construction of highway asphalt pavements.Ministry of Transport of China; 2004.
[28] Garca-Moralesa M, Partala P, Navarroa FJ, Martnez-Bozaa F, Gallegosa C,Gonzalezb N, et al. Viscous properties and microstructure of recycled evamodified bitumen. Fuel 2004;83:31–8.
[29] DelRio-Prat M, Vega-Zamanillo A, Castro-Fresno D. Energy consumptionduring compaction with a gyratory intensive compactor tester. Estimationmodels. Constr Build Mater 2011;25:979–86.


![VARIOMATIC 2 + Asphalt-Manager Compaction.pdfSlide 14 Compaction of 6 cm asphalt binder course 0/10, ... vs. Marshall density [%] Compaction test on asphalt wearing course ... is of](https://img.dokumen.tips/doc/110x75/5abeef3e7f8b9a3a428d95f2/variomatic-2-asphalt-compactionpdfslide-14-compaction-of-6-cm-asphalt-binder.jpg)