Embed Size (px)
Citation preview

Labor Migration and Social Networks Participation:
Evidence from Southern Mozambique
Juan M. Gallego (Universidad del Rosario)
Mariapia Mendola (University Milan-Bicocca)
INSIDE Paper No. 28 July 2011
INSIDE (Insights on Immigration and Development)
Institute for Economic Analysis, CSIC Campus UAB
08193 Bellaterra (Barcelona) E-mail: [email protected] Phone: (+34) 93 580 66 12
Website: http://www.inside.org.es
Labor Migration and Social Networks Participation: Evidence from Southern
Mozambique 1
Juan M. Gallego (Universidad del Rosario)
Mariapia Mendola (University Milan-Bicocca)
INSIDE Paper No. 28 July 2011
Abstract
This paper investigates how social networks in poor developing settings are affected if people migrate. Using a unique household survey from two southern regions in Mozambique, we test the role of labor mobility in shaping participation in groups and interhousehold cooperation by migrant-sending households in village economies at origin. We find that households with successful migrants (i.e. those receiving either remittances or return migration) engage more in community-based social networks. Our findings are robust to alternative definitions of social interaction and to endogeneity concerns suggesting that stable migration ties and higher income stability through remittances may decrease participation constraints and increase household commitment in cooperative arrangements in migrant-sending communities.
JEL Keywords: International Migration, Social Capital, Networks, Group Participation, Mozambique. JEL Classifications: O17, O15, O12 Corresponding author: Mariapia Mendola Department of Economics University Milan-Bicocca and LdA, Milan Pza Ateneo Nuovo 1 20126 Milano, Italy Email:[email protected]
We thank Giorgio Barba, Sonia Bhalotra, Michael Clemens, Guido Friebel, Paolo Garella, Valeria Groppo, Max Steinhardt, Dean Yang and seminar participants at Trinity College Dublin, Toulouse School of Economics, University of Milan Bicocca, Centro Studi Luca d.Agliano in Milan, the 2010 Workshop on "Migration and Economic Development" in Florence, the 2009 CSAE Conference in Oxford, the 2009 ESPE Conference in Seville and the 2009 NEUDC Conference in Boston for useful comments and discussions. We are grateful to Basilio Cubula, Elisio Mazive, Ines Raimundo and the whole fieldwork team from the Eduardo Mondlane University and the National Statistical Institute in Maputo. Financial support from Centro Studi Luca d.Agliano (LdA) is gratefully acknowledged. Juan M. Gallego thanks the Marie Curie RTN on "Transnationality of Migrants (TOM)" for financial support.

1 Introduction
Social capital and networks are increasingly receiving attention from economists, on
both theoretical and empirical grounds, in that a key source of information and re-
sources, ultimately in�uencing economic performance (Bala and Goyal 2000, Durlauf
and Fafchamps 2005). A signi�cant body of research suggests that social interactions
yield signi�cant economic returns by facilitating cooperation and enabling individu-
als to bene�t from trade when commitment is not possible (Ostrom 1990, Platteau
1991, Putnam, 1993). This is particularly true in developing economies where insti-
tutional or market failures make membership in community associations and social
networks crucial for exchanging goods and services, getting access to credit and shar-
ing risk (see Besley 1995, Fafchamps and Minten 2000, Fafchamps and Lund 2003,
Udry 2005). A common perception in this literature is that social capital is hampered
by geographic mobility and distance as networks may depend on the future presence
of their members (Glasear et al. 2000 and 2008, Schi¤, 2002).1 Yet, migration and
network formation may also be complementary if migrants decrease aggregate risk
through uncorrelated income sources and remittance in�ows.
There is little evidence on the extent to which migration �ows exert social costs
in village economies at origin. This paper aims at �lling this gap by directly testing
the role of migration in shaping household participation in social networks in source
communities in Southern Mozambique, where informal social arrangements are vital
and migration �ows - typically to South Africa - are substantial. Our empirical analy-
sis is based on a unique representative household survey purposely collected by the
authors in southern Mozambique in summer 2008. By analyzing a rich set of social
interaction measures with non-family members, we distinguish general knowledge of
the subjective network from the actual contribution to the network. Hence we focus
on two broad categories of informal cooperation as outlined in the existing literature,
1We use the terms social networks, informal institutions, inter-household cooperation and socialcapital as synonymous. This is a catchall for all those social arrangements that make relatively littleuse of formal contractual obligations enforced through codi�ed legal system and that operate as a�network� in which individuals are connected to other people (Ellsworth 1989). It is worth notingthat all these measures are positively correlated and, in particular, membership in community groupsis always conceived as positively associated with the probability of interpersonal network formation(see for example Barr and Genicot, 2008 for empirical evidence).
2

namely participation in (formalised) groups that provide some shared economic ben-
e�ts and (informal) mutual arrangements with other households in the community
(Fukuyama 2000; Putnam 2000; Miguel et al. 2006). Overall, our �ndings show that
successful migration and remittances may signi�cantly reduce the potential loss of
social capital and cohesion associated with labor out-�ows in source communities.
There is a growing literature that documents the importance of labor migration
and remittances for economic well-being in many developing contexts. In partic-
ular migration, either on a temporary or a permanent basis, has been recognized
as a familial arrangement with bene�ts in terms of risk-diversi�cation, consumption
smoothing and investment �nancing- whereby remittances are a central element of
such a household strategy in that a stable source of income (Lucas 1987, Stark 1991,
Yang, 2008). There are di¤erent mechanisms through which household labor mobility
may a¤ect social interactions at origin. On the one hand, migration is presumed to
weaken social ties and cohesion by withdrawing human capital and raising the cost
of establishing and maintaining social relationships in the community left behind.
This is because mobility and distance drive down social capital returns (Glaeser et
al. 2000), impede monitoring and enforcement (Fafchamps and Gubert 2005, Miguel
et al.2006) and make migrant-sending households less dependent on others since self-
protection is now possible through migration (Ligon et al. 2000). On the other hand
though, migration may increase the scope of inter-household risk-sharing arrange-
ments by raising aggregate income stability (Bugamelli and Paternò, 2008; Winters
et al. 2001). This is so as households with migrants may be more appealing partners
for network relationships in the community at origin as they increase the potential
for drawing upon stable income resources (remittances), the �uctuations of which
are uncorrelated with locally covariate shocks. Moreover, while group membership
and inter-household arrangements serve many important functions for subsistence
and well-being in economically poor settings, they are not without costs and frictions
as full cooperation is not possible (Coate and Ravallion, 1993). Thus, successful
migration (e.g. remittances) may decrease participation costs in the community at
origin.
3

Overall, how family members� out-migration and remittances a¤ect household
incentives to cooperate within the source community is not unambiguous a priori.
We address this issue by using a tailored representative household survey on migration
and networks conducted by the authors on more than 1000 households in two southern
provinces of Mozambique. The latter is one of the poorest country of the world where
social relations typically extend into non-family forms and constitute a subject�s
major investment for subsistence and well-being.
A major challenge in the empirical analysis is the possibility of reverse causality,
in addition to the fact that migration experience may not be randomly allocated
across households and regions. While we argue that cross-border migration costs are
relatively low and own savings or within-family help is used in �rst place to ease
migration, we empirically tackle above issues of unobserved heterogeneity by using
both community-�xed e¤ects and instrumental variable estimation strategies. Over-
all, our �ndings are robust to alternative de�nitions of social interaction and show
that, while family labor out-migration may decrease social capital in households left
behind, remittance receipt, as well as return migration, plays a statistically signi�-
cant and economically relevant role in increasing the household probability of joining
community groups and social networks at origin. We interpret these results as evi-
dence that stable migration ties or higher income stability through remittances may
decrease participation costs and increase household commitment in informal social
arrangements in migrant-sending communities.
Furthermore, in order to explore the role of the institutional context on migrant
household voluntary participation in community groups, we carry out a sensitivity
analysis of results across socio-economic heterogeneous communities, according to ob-
servable attributes correlated with household cooperative behavior, i.e. institutional
development (e.g. land market), economic inequality, ethnic and religious fragmen-
tation. Overall, our �ndings suggest that migrant-sending households in Southern
Mozambique are more likely to engage in social capital investment and cooperation
in more economically even societies, where social sanctions may be more e¤ective,
whilst they are not unevenly responsive to the social composition of the community
4

in terms of ethnicity or religion.
Our results contribute to the existing migration literature by providing new in-
sights into how labor mobility, as a key component of a development process, a¤ects
social networks and institutions in the community at origin. To the best of our
knowledge, this paper represents the �rst study that attempts to provide system-
atic evidence on this issue, which has important implications for future research on
the degree to which migration may generate positive externalities at the aggregate
level. While our analysis is tailored to the speci�c context of Southern Mozambique,
�ndings have broader relevant implications if considering the growing temporary or
circular nature of cross-border migration �ows in di¤erent parts of the world and the
enduring ties that contemporary migrants maintain with their home communities.
From a policy perspective, exploring migrants�contributions to social capital in-
vestment in communities at origin contributes to shedding light on one of the most
important engines of local development and growth. Since the seminal studies of Gra-
novetter (1985), Coleman (1988) and Putnam (2000), social networks have long been
shown to play an important role in building trust and generating e¢ cient allocation
of resources in both developed and developing economies (see also Glaeser et al. 2000
and Guiso et al. 2004). This is even more relevant if the lack of trust and social
capital deter individuals from acquiring capital even when investment opportunities
are strong, thereby generating ine¢ ciency or poverty traps (Glaeser, Sacerdote, and
Scheinkman 2003; Karlan et al. 2009).
The rest of the paper is organised as follows. Sections 2 and 3 describe the
theoretical background and institutional context. Section 4 presents the original
household survey data and descriptive statistics. Section 5 describes the empirical
strategy and Section 6 presents results. Section 7 concludes.
2 Literature and Theoretical Background
Labor out-migration, either domestic or abroad, is an important route out of poverty
for many developing societies (Adams and Page, 2005, Yang 2006, Yang and Choi
2007 among others). There are several mechanisms through which international mi-
5

gration and remittances translate into important economic improvements in source
communities. While much of the focus has been put on investment in physical and
human capital by migrant-sending households left behind (e.g. Cox and Ureta, 2003,
Mendola 2008, Yang, 2008), less is known on the extent to which social capital in
general, and group participation and inter-household informal exchanges more specif-
ically, are a¤ected when people migrate.2
The common wisdom is that migration threatens the social structure and the
organisation of common duties in local communities at origin, by increasing informa-
tion asymmetries and imperfect monitoring (Besley et al. 1993, Miguel et al. 2006,
Fafchamps and Gubert 2007) and by withdrawing human and labor resources from
the household left behind.3 Moreover, having a migrant member working abroad
has been regarded as a within-family income diversi�cation strategy so that insur-
ance may be achieved within the family and the incentive to participate in reciprocal
insurance arrangements with non-family community members may decrease.4
However, group participation and informal social networks in low-income settings
are not only a �social activity�but serve many functions that in developed contexts
are served by market mechanisms and formal institutions (e.g. informal insurance,
credit access, public goods provision, production opportunities etc.) (La Ferrara,
2000, Fafchamps 2005).5 In poor developing settings, households�productivity and
2Social capital has a wide and variable de�nition in the literature, e.g. generalized trust; con�dencein institutions, social network (social relationship and group membership), political participation,civic awareness and social norms (see Putnam et al. 1993, Alesina and La Ferrara 2000, Helliwell2001, Sabatini 2005, and Durlauf and Fafchamps 2005, for the principal di¤erences on the de�nitionand measures of social capital).
3Futhermore, when migration is conceived as an individual strategy, it reduces the probabilityof trading with the same person in the future and reciprocity becomes less enforceable. This is tosay that risk-sharing contracts become more "spot contracts", in which commitment is unfeasible(Routledge and von Amsberg, 2003).
4The insurance motives for migration have been emphasised by the New Economics of LabourMigration (NELM), according to which greater income uncertainty may encourage out migration as arisk diversi�cation strategy (Stark and Levhari, 1982; Katz and Stark, 1986). Moreover, remittancesreceived from migrant members represent a potential means to overcome credit constraints for sourcehouseholds (Lucas, 1987; Stark, 1991).
5The social capital networks we refer to (which provide mutual assistance between households)are informal in the sense that they take place outside the market place and are made without anylegal arrangement that could in any way be binding. They are not closed multilateral grouping basedon well-de�ned formal associations that have written rules or regulations governing their operation,though. Hardship and risk are often di¢ cult to face individually. Thus people voluntarily participateinto such arrangements which are sustained over time as they o¤er higher expected payo¤ than theone in autarky.
6

well-being are fundamentally a¤ected by the ease with which social arrangements such
as loans or insurance can be taken by community�s members. Informal cooperation
is not without costs and obligations though, as contribution is expected from every
network member. Thus, when aggregate income is risky and impediments to informal
cooperation are binding, households with migrants members may be more likely to
participate in social exchanges with other households in the community. This is so as
families with a more stable income source such as remittances can expect to be able
to commit themselves more easily to regular payments in informal exchanges and,
similarly, certain households and informal groups may be more inclined to accept
partners that have a regular and uncorrelated source of income. In other words, the
ability of migrant-sending households to decrease covariate risk by drawing upon lo-
cally non-covariate income sources makes them attractive network partners.6 Hence,
by increasing income stability and lowering risk of default, migration may have a
positive impact on the probability of joining a group.
These ideas have a long-standing theoretical foundation in the literature on collec-
tive action and social network formation. Informal private transfers through networks
and mutual arrangements between households have been modelled as self-enforcing
contracts (i.e. based on voluntary participation), where current generosity is justi-
�ed by expected future reciprocity (Kimball, 1988; Foster, 1988; Coate and Raval-
lion, 1993; Foster and Rosenzweig, 2001).7 This is because (full) informal insurance
arrangements are potentially limited by the presence of various incentive constraints,
with the lack of commitment receiving particular attention (Ligon et al. 2002, Dubois
et al. 2008).8 Accordingly, numerous empirical studies have shown that mutual infor-
mal arrangements do not work at village level but within sub-groups in a community
and even among speci�c individuals within a group (e.g. Townsend 1994, Udry 1994,
6Bugamelli and Paternò (2008) provide new macro evidence on the volatility dampening e¤ect ofremittances, showing that the latter e¤ect is larger in poorer countries, where investment opportu-nities are limited and consumption needs are strong.
7By allowing mutual help to be history-dependent, informal insurance arrangements are consistentwith models of �quasi-credit�where enforcement constraints limit gift giving (e.g. Kokerlakota, 1996;Ligon, Thomas and Worrall, 2001; Fafchamps, 1999).
8Liquidity constraints may be thought as a �reduced form�expression for market imperfectionsresulting from informational problems, such as adverse selection and moral hazard, and the lack ofenforcability.
7

Fafchamps and Lund 2003). This is to say that households decide to share inputs,
services, risk and more generally �mutual help�through networks of friends and rel-
atives, whereby some form of compensation is involved - in terms of time, money or
labor contributions - against the attainment of individual and collective bene�ts (see
also De Weerdt, 2002, Dekker, 2003, Narayan, 1997).9 Thus, mutual help agree-
ments are easier to mantain when there is the potential for reciprocity: having access
to a stable income source such as remittances from family migrants may make such
a reciprocity more likley to occur and therefore increase household participation in
cooperative arrangements.
At the same time, though, it is important to note that there may be di¤erent
motivations behind incentives to cooperate in migrant-sending households related to
community-level institutions and heterogeneity. Households�propensity to engage in
informal social arrangements may, for example, be mitigated when there are other
(formal) ways of exchanging goods and services or if socio-economic heterogeneity
(or con�icts) at community level undermines trust and cooperation (Kranton, 1996
and Alesina and La Ferrara, 2000). In particular, the economic and anthropological
literature has emphasised that both extrinsic incentives, e.g. (social) sanctions that
can credibly threatened, and intrinsic motivations, such as altruism, inequality aver-
sion and reciprocal kindness, can act as bases for commitment (Platteau, 1994, 1996;
Fafchamps, 1992 1996, Posner and Rasmusen, 1999).10
We use an original and unusually detailed survey data on household migration
and social interactions from Southern Mozambique to document how these factors
interplay with each other. According to the literature, we focus on one of the most
important component of social capital, that is participation in di¤erent groups that
provide economic bene�ts in terms of information sharing and the production of
9 Indeed, pure altruistic motivations behind informal insurance arrangements at network level areruled out by various and �sophisticated� (e.g. contingent) contractual forms that can take placewithin limited market opportunities for risk-sharing (e.g. grain transfers, labour assistance, landaccess, quasi-credit etc.) (see Fafchamps, 1992; Platteau, 1991).10Anderson and Baland (2002) provide evidence that individuals living in Kenyan slums put money
in rotating savings and credit associations (ROSCAs) to avoid claims on their resources by spouse andrelatives. Ambec (1998) and Banerjee and Mullainathan (2007) take these observations as startingpoint to model the saving behavior of poor households.
8

collective goods (La Ferrara, 2000).11 Yet, owing to its comprehensive or intangible
character, we also consider other forms of social capital, such as household social
expenditure and informal exchanges of goods and services with important persons
or neighbours in the community.12 In both cases, though, we focus on the economic
bene�ts of group membership and informal interaction, as opposed to more intangible
psychological and social bene�ts of social capital.
3 The Mozambican context
Mozambique is an interesting testing ground for studying the impact of labor mi-
gration on the creation (or destruction) of social capital in village economies left
behind. Despite the fact that the country�s economy has registered some positive
achievements over the last 16 years (the average annual GDP growth rate increased
to 7 percent during the 1990s), Mozambique still remains one of the poorest coun-
tries in the world, with 70 percent of its population living below the poverty line
(and 35 percent living below the extreme poverty line) (PRSP, 2007). Mozambique
has been characterized by slow economic growth until the beginning of the 90s with
poor levels of education of the economically active members of households, espe-
cially women; high dependency rates in households; low productivity in the family
agricultural sector; lack of employment opportunities in the agricultural sector and
elsewhere; poor development of basic infrastructures in rural areas and hence poor
integration of rural-urban markets. In the face of such extreme poverty, informal
social arrangements between households are often an important way of coping with a
state of permanent vulnerability and eventually substituting for or enhancing existing
forms of capital/investment.
Yet, compared to other countries in Southern Africa, social networks in Mozam-
11The character of a group is double-fold: it is a collective actor that performs in its own right,ful�lling tasks in society and eventually providing public goods to members (Putnam et al., 1993).But it is also built on the willingness of individual actors who work together on shared objectivesand norms (Coleman, 1990).12 It is worth noting that scholars agree that, even in developing and poor settings, objective and
visible networks, such as group membership, are more institutionalised than informal interactionpatterrns. Yet both refer to the �structural social capital�, compared to the �cognitive social capital�that includes norms, trust, attitudes and subjective beliefs (Grootaert et al, 2004, Uphoof andWijayaratna, 2000).
9

bique are unique as a result of various factors. People predominantly organise their
social life around their kin, who may provide social protection, since social services
(e.g. health, child care, pensions) are rarely in place (Ministerio do Plano e Financas,
1998). Though, due to a low population density, settlement patterns are scattered
and households do not necessarily live in �villages�but are often long distances apart
from one another.13 Moreover, kinship relations and alliances also re�ect the com-
mon practice of polygamous marriages and the temporary or impermanent nature
of family life in this poor context. Thus, social relationships in Mozambique typi-
cally extend into non-family forms, like relations with key persons in the community
and neighbours, in addition to community group participation, church relations, and
inter-household exchanges of varying degrees of formality. This set of alliances in
southern Mozambique go beyond matrimonial linkages and beyond the kinship cir-
cle. It de�nes a person, and the construction of this network is a subject�s major
investment for socio-economic life in Mozambique.
Most importantly, since shortly after independence from the Portuguese colony
in 1975, the country had been battered by an internal war that had been going on
for almost 20 years. The war intensi�ed in the 1980s displacing about 50 percent of
the population.14 As a result, social ties in Mozambican communities were largely
destroyed by the war and the a massive return of refugees and displaced persons
in the 1990s was even more problematic. This is because in many cases, refugees
and internally displaced people had been away from their villages for ten or �fteen
years, and their dwellings and agricultural plots had been occupied by other displaced
13Mozambique is a country of about 800,000 km2, almost half the size of Mexico, that has to sup-port a population of only 15 million. See also Bandiera and Rasul (2006) on Northern Mozambique.14This was a protracted bloody war during which the Frelimo Government, that came to power
after independence, was being pressured by its neighbors, �rst by Rhodesia and then by South Africa,to give up its Socialist view. It was in fact a point of contact of the superpowers during the cold war.The peace agreement that ended the war was signed on October 4, 1992 in Rome. The UNHCRreports about 5 million displaced people and refugees as a result of this war � between 1.5 to 1.7million refugees in camps in neighboring countries (primarily Malawi, Tanzania, Zimbabwe, to a lesserextent Zambia, South Africa, and Swaziland), and 3.5 million or so internally displaced throughoutthe entire country. In the same period Mozambique�s southern and central provinces experienced along dry period that resulted in widespread famine and displacement of people. Of those returninghome after being displaced from their homelands for 10, 15, even 20 years, the UNHCR repatriatedabout 600,000 or 700,000. The other almost a million or more who spontaneously came back fromthe neighboring countries that border Mozambique, mostly found their hometowns, dwellings andneighbours vanished, so resettled where possible (Raimundo, 2009).
10

people. Thus, the many systems of informal cooperation and structure of rural society
were destroyed, while new forms of reciprocal exchange and insurance arrangements
arose at the community level. The main types of informal cooperation between
households include xtique (credit and saving), ajuda mutua (mutual assistance in daily
work) and buscato or ganho-ganho (exchange of labor, money, food, or traditional
drinks) (Marsh 2003). Formal cooperation is comparatively less di¤used, even though
with the increase of donor activities over the last two decades, a growing number of
institutional groups and associations are emerging all over the country.
Strengthening social capital and community-based associations is increasingly
recognised as an essential relay for development assistance, and it has been identi�ed
as an important way of responding to some of the major Mozambican challenges in
the local development debate (G20, 2005, PRSP, 2007). Indeed, diversi�cation of
social relations has become of growing importance in the country, as soon as it be-
came increasingly hard for the extended family and traditional rural society to cope
with new problems such as HIV/AIDS, orphanhood, natural disasters and signi�cant
out-migration �ows, both rural-urban and to South Africa.
The Republic of South Africa is the continent�s economic superpower, and has
been the destination of substantial regional migration �ows throughout its history,
with Mozambicans making up at least one third of the immigrant workforce, fol-
lowed by immigrants from Lesotho and Zimbabwe.15 According to preliminary es-
timates, over 200.000 Mozambicans work in South Africa (SAMP: Migration News,
01/03/2003), impacting signi�cantly on the Mozambican development pattern, espe-
cially in southern rural regions. Yet, despite the strong linkages between the Mozam-
bican and South African labor markets, very little systematic evidence exists on
15South Africa has been the destination of substantial migration �ows since the colonial period.Male labor migration to the mines and commercial farms from almost every other country in theregion (especially modern-day Lesotho, Mozambique and Zimbabwe) was the most enduring formof legal cross-border labor migration. Signi�cant poverty and unemployment rates in source coun-tries have pushed also undocumented migrants to cross the border with South Africa. The end ofthe apartheid in the early 90s and the ensuing integration of South Africa in the Southern AfricanDevelopment Community (SADC) produced new opportunities for cross-border mobility and new in-centives for temporary migration.While Lesotho�s geographical land-locked position and Zimbabwe�seconomic and political implosion constitutes special cases of migration and displacement in the region,Mozambique o¤ers an appropriate setting for studying charateristics and consequences of modernmigration �ows in the region.
11

migration patterns and consequences in the area.
4 The Data
Our study is based on a unique household survey covering 1002 households from 42
communities (both urban and rural) in four districts (Manhica, Magude, Chokwe�,
Chibuto) in two provinces (Maputo and Gaza) of southern Mozambique, conducted by
the authors in Summer 2008 in collaboration with the Eduardo Mondlane University
and the National Institute of Statistics (INE) in Maputo. Sample households were
selected with a probability proportional to population size estimated from the most
recent 2007 General Population Census provided by INE so that the household survey
is representative at the provincial level. In each community the population was
canvassed prior to the beginning of the survey to identify two groups, i.e. households
with at least one current international migrant and households with no migrants. The
target number of households was drawn randomly from each of the two subgroups,
in the same proportion as the actual migration rate16
The survey was tailored so as to allow accurate measurement of the migration
experience of each adult member in the household, including information on past
or return migration of resident members as well as migration status of household
members currently abroad, and whether they send remittances home. In addition,
the survey also collected detailed information on demographic characteristics of all
household members, individual human capital, household asset endowment, farm and
non-farm occupational status and household social networks participation.
With respect to the latter, information on several dimensions of social interac-
tions outside the family was collected, in particular (i) whether any household mem-
ber participates in various types of community groups, both economic and socio-
political, including characteristics of group membership (i.e. as bene�ciary or pro-
moter/decision maker), (ii) whether the household is in contact with relevant persons
in the community (i.e. traditional communiity leader, elected village chief, school
16A more detailed description of the survey can be found athttp://dipeco.economia.unimib.it/persone/mendola/moza.htm
12

teacher, doctor/�curandeiro�, agricultural agent, neighbours) and which type of ex-
change or mutual help (if any) is in place with them. In particular the information
includes whether households give or receive (or both) any goods or services to/from
each of their network partners. In addition, a community questionnaire was adminis-
trated to community leaders in order to collect information on the institutional and
market organizations, community infrastructure and social cohesion. After delet-
ing observations with missing values we end up with a representative sample of 905
households and 4851 individuals.
In what follows we present some descriptive statistics of household characteristics
and data point particularly to the importance of migration patterns in the region
(sampling population weights are always used so as to provide representative �g-
ures). Table 1 reports incidence of migration at the household level: 55 percent of
the households have some migration experience - 38 percent report having at least one
current migrant member, remaining households have return migrants - and the aver-
age number of current migrants per household is 1.6. Among current migrant-sending
households, 60 percent of them receive remittances from migrants (24 percent of the
total household population). It is worthwhile stressing that 40 percent of households
with migrants do not receive any money or goods from them. This re�ects the pre-
carious nature of socio-economic life in Southern Mozambique, whereby sometimes
families send relatives to work abroad without receiving any news from them: hence
the need to address household migration status and remittances separately.
-Table 1 about here-
If we look at the individual characteristics of adult migrant and non-migrant
household members (information was collected for all household members of 15 years
old and over), 11 percent of our sample individuals are currently working away from
home, whilst 6 percent are return migrants - in both cases more than 90 per cent
of them migrate to South Africa. Table 2 reports individual-level characteristics of
past/return migrants and current international migrants (information on the latter
was collected through a proxy respondent). Return migrants are predominantly men,
13

of working age, more married and educated than those who stay put. The same
is true of household members currently working abroad, but di¤erences are even
more striking. The occupations of current migrants abroad range from informal jobs
(traders, street vendors) (12%) to miners (16%) and unskilled workers (15%). As for
returnees, the average time spell since their return is a little less than one year and
once back home almost one-third of them report to work on their own farm, whilst 14
percent are non-farm workers, 10 percent informal workers, 7 percent self-employed
and only 5 percent are unemployed.
As additional information, returnees report that the reason to be back has to
do mainly with family issues, and with the end of a job or vacation. Most of this
migration may be circular as 58 percent of them report their intention to leave again
sometime in the future. Also 80 per cent of current migration is reported to be
temporary in nature. Current migrants visit home mostly once per year and 45 per
cent of them send remittances home.
-Table 2 about here-
Most important, Table 3 displays that both current and past migrants received
help to migrate in �rst place from their families (either in Mozambique or abroad) or
from their own previous experience (Panel A). Migrants also report having to cover
costs of migration typically through their own resources or with the help of relatives,
either in Mozambique or abroad (Panel B). Overall this is suggestive evidence that
social networks with non-family members is not a key determinant of migration nor
the main source to cover migration costs. This is due to the fact that migration
history between Mozambique and South Africa dates back to the mid-nineteenth
century, making cross-border migration costs relatively low.
Table 4 reports the characteristics and management of remittances: 55 percent
of current migrants send remittances home on a regular basis, mainly in person or
through informal avenues (e.g. close family friends, local bus drivers or taxis) and the
money is reported to be spent mostly for primary consumption needs such as food,
clothing and housing. Even though we do not have longitudinal data, this pattern
14

is in line with the well-known stable nature of workers�remittances, with respect to
other public or private �nancial �ows (Ratha 2003).
-Table 3 about here-
-Table 4 about here-
Table 5 presents the incidence and characteristics of household participation in
groups and social arrangements. In our sample 27 percent of households are members
of at least one group whilst almost all of them are in contact, and 74 percent talk
daily, with at least one important person in the community (this is true even exclud-
ing neighbours from the list of important persons). Yet, not all of them exchange
something with them or expect mutual help with key persons and neighbours in the
community, as 27 percent give or receive goods or services from them.17
-Table 5 about here-
We use this information as a proxy for di¤erent forms of social networks. It has
been claimed that social capital can be measured by participation in �institution-
alised�community groups or associations, which may di¤er from informal contacts or
arrangements with neighbours and friends (Durlauf and Fafchamps, 2005, Miguel et
al. 2006). We argue that our measures of social capital, i.e. group membership and
contact with important persons in the community are good proxies for social networks
participation.We also provide information on the reason why households do not join
a group or get in contact with important persons (we ask this for each group and for
each key person in the community about these questions). Tables 6 sheds light on
the household�s subjective perception of the costs and bene�ts of group participation
and social networks at the community level. The table lists the main reason why
households choose not to join a group or to get in contact with important persons.
The answers related to group participation show that the most frequent reason is
the lack of money, followed by lack of time and lack of interest; as far as informal
17The actual survey questions on this are: 1) In the last 30 days, did you or someone in yourfamily give any money, gifts or services to [each important person]? and 2) In the last 30 days, didyou or someone in your family receive any money, gifts or services from [each important person]?
15

cooperation is concerned, the main reason is lack of interest, followed by lack of time
and lack of money. This is in line with the idea outlined above about the di¤erent
degree of formality of �institutionalised�groups and �informal�social arrangements in
the community.
-Table 6 about here-
Table 7 presents household characteristics by migration status and network type.
Overall, households belonging to community groups seem to be better o¤ with re-
spect to some indicator of physical and human capital. This is consistent with the
idea that group members tend to sort into a homogeneous pool of persons with
respect to some characteristics such as income, human capital, ethnicity etc. (La
Ferrara, 2000). This is less true with respect to informal social networks (here mea-
sured through an indicator as to whether households engage in mutual help or spend
money in social ceremonies), which show a less systematic pattern with respect to
standard socio-economic variables (Panel A). Interestingly, though, while households
with international migration experience and remittances appear not to be particularly
concentrated in community groups (Panel A), households receiving remittances or re-
turn migration engage signi�cantly more in both formal and informal social networks
(Panel B).18
-Table 7 about here-
Yet, given the concurrent e¤ect of household characteristics and migration on
social capital, descriptive statistics are not fully explanatory in this regard and a
multivariate analysis is required.
5 Empirical analysis design
We start by estimating a model that relates the household decision to participate
in social networks to household attributes, including migration and remittances, and
18This is also true with respect to remittances, i.e. 41 percent of households joining communitygroups (39 percent of households with informal networks) report receiving remittances, compared to23 percent (21 percent) of households with no group membership (social networks).
16

community-level characteristics. The social capital literature agrees on considering
the family as the primary unit of analysis and we specify the expected net bene�t
from group or network participation for household i in the community j as follows:
Bi;j = �0 + �01Xi;j + �
02Hj + �
01Mi;j + �
02Ri;j + "i;j (1)
whereM and R are respectively the number of migrants in the household and whether
the household receives remittances from them, and X and H are vectors of household
and community characteristics respectively (such as demographics, education, wealth,
residence). "i;j is the standard error term. The parameters of interest are �1; which
captures the e¤ect of sending one unit of household labor to work abroad and �2;
representing the e¤ect of receiving remittances on household incentive to join a group.
What we observe, though, is not the latent variable B but only the choice made by
the household that takes value 1 (participation) if the expected net bene�t is positive,
and 0 (no participation) otherwise:
Pi;j = 1 if Bi;j > 0 (2)
Pi;j = 0 if Bi;j < 0
We estimate the model above with both a linear and a probit model. Our main
dependent variable is whether households participate in any (formal) group. Yet, we
also use other cooperative outcomes such as measure of household engagement in
informal networks of �mutual bene�t�or �ganho-ganho�and whether the household
incurs in social expenses for ceremonies or funerals outside the family.
As for regressors, we specify a model where we include a continuous variable for
migration in order to carefully capture the e¤ect of lack of family members due to mi-
gration. We here assume a linear relationship between group membership and number
of migrant members. As this is not obvious though, we also estimate a model where
we include a dummy variable for whether or not a household has a migrant member
and results have the same sign but are less precisely estimated19. This is consistent
19Results are available upon request.
17

with the above hypothesis of social networks being hampered by the departure of
family members or human capital loss. As for remittances, including the level of cash
in�ows as explanatory variable would be ideal, but the quality of the information
collected is not su¢ cient to include it as a continuous vairable. From related survey
information we reckon that remittances are mainly in-kind, sent through informal
channels, such as friends, relatives or returnees and quantifying them proved to be a
particularly di¢ cult task for interviewed households (see descriptive statistics above).
Yet, this is less of a concern as it is likely to assume that the relationship between
remittances and �bene�ts� is non-linear, with more dramatic e¤ects going from �no
remittances� to �positive remittances� than from the marginal e¤ect of one unit of
money. This is so as what matters in this context is the potential that a household
is able to draw upon a source of income, the patterns of which are uncorrelated with
local shocks - and this is captured by our dummy variable for remittances.
Our model, though, may su¤er from potential endogeneity and simultaneity bias
with respect to migration and remittances. This is so as households are likely to self-
select into sending migrants abroad based on unobserved characteristics, including
ex-ante social network participation. Indeed, the literature has argued that social
networks can facilitate subsequent migration (Massey at al. 1993, Munshi, 2003) or
o¤er those better connected services in the home region so as to discourage migration
(Munshi and Rosenzweigz, 2009). Even though social networks are heterogeneous in
kind and, as we reported above, family networks in Mozambique are more relevant
for migration behaviour than social networks, estimates may still be biased upward
or downward according to the complex role that social capital is likely to play in
the migration decision. Furthermore, remittances are produced by allocating family
members to labor migration and, given migration, they are simultaneously shaped by
many of the same characteristics that a¤ect a household�s social capital investment
(Taylor and Martin, 2001). To correct for these possibilities, we estimate a system
of linear probability models and instrument both migration and remittances using
exogenous instrumental variables. The simultaneous equation model estimated in
18

this case is:
Pi;j = �0 + �01Xi;j + �
02H;j + �
01Mi;j + �
02Ri;j + "i;j
Mi;j = �1 + �02Xi;j + �
03Zi;j + �i;j (3)
Ri;j = @1 + @02Xi;j + @
03Wi;j + �i;j
where Z and W are the instruments for migration and remittances respectively. The
model above constitutes a recursive system where both migration and remittances
are endogenously determined with social capital. Migration, M is a function of
individual- and household-level characteristics, especially related to human capital
variables. Given migration, motivations to remit, R, may be in�uenced by human
capital variables, as well as by expected norms in the source village and a household�s
need for insurance (see Lucas and Stark, 1985, Yang and Choi 2007). The identi�-
cation of the model depends on �nding instrumental variables Z and W that a¤ect
social capital solely through their impact on migration and remittance choices. The
stochastic terms "; � and � are assumed to be normally and independently distributed
with variance �2;j : However, from the set-up it is likely that there is cross-equation
correlation, since all three activities may be subject to the same exogenous shocks.
We estimate the model using both a two-stage least-squares (2sls) and a recursive
3sls estimator so as to account for contemporaneous correlation.
In order to further explore the role of migration coupled with remittances as a
commitment device in group participation, we also address some issues related to
the �direction� of social interaction, i.e. whether migrant-sending households give
or receive relatively more in inter-household exchanges. Finally, in the last part
of the empirical analysis, we further estimate group participation for socio-economic
homogeneous and heterogeneous communities separately as to check the robustness of
migration and remittance coe¢ cients across subsample populations (i.e. institutional
environments).
19

6 Regression results
Table 8 reports our baseline estimates from the reduced form linear probability model,
where the dependent variable is a binary indicator equal to 1 if the household partic-
ipates in at least one group in the community (basic statistics of main indipendent
variables are reported in Table A.1 in the Appendix). Following the existing evidence
on determinants of group and social networks participation, the variables X and H
are household demographic, human- and physical-capital variables and community-
level controls. Household characteristics include: age, sex and education of household
head, household size and demographic characteristics, ethnicity and religion, house-
hold residence and occupation. Household wealth is measured through a �synthetic
asset index�weighting the ownership of various durable goods and the dwelling con-
ditions.20 We further include community-level characteristics, such as the quality
of roads, school, health facilities, formal bank and market availability. We �nally
include community �xed e¤ects (where the community is our primary sampling unit)
as to fully focus on the within-community variation only and rule out any structural
di¤erence or covariate shock across communities.
-Table 8 about here-
Column 1 in Table 8 shows that the direct e¤ect of the household number of mi-
grants on group participation is negative, whilst access to capital through remittance
receipt is signi�cantly and positively associated with social capital investment. These
results are more precisely estimated with the inclusion of a large set of household-level
characteristics and community attributes (column 2). Household decision to join a
group signi�cantly decreases by 5 percentage points as each family members leaves
the household to work abroad. Yet, there is a signi�cant o¤setting e¤ect from re-
ceiving remittances, that increases the probability of participating by 18 percentage20The wealth index uses principal components analysis (PCA) to assign weights to the indicator.
This procedure �rst standardizes the indicator variables (assets ownership and dwelling conditions);then the factor coe¢ cient scores (or factor "loadings") are calculated using the �rst component of aPCA analysis; and �nally, for each household, the indicator values (or asset ownership) are multipliedby the "loadings" and summed to produce the household�s wealth index. In this process, only the�rst of the factors produced is used to represent the wealth index. For a complete discussion of theadvantage and disadvantes of asset and wealth index under pca procedures see Filmer and Pritchett(2001).
20

points (see Probit marginal e¤ects in Table A.2 in the Appendix). As far as con-
trols are concerned, demographic household characteristics have the expected sign,
including a negative relation between the number of women in the household and
the likelihood to join groups. This is due to the strongly patriarchal structure of
Mozambican society, particularly in the South of the country, and to the low �voice�
of Mozambican women in many di¤erent aspects of their socio-economic life. Belong-
ing to ethnic minorities, instead, or having traditional religious beliefs signi�cantly
increases group participation.21 Moreover, higher education of the household head
is positively associated with group participation while the household wealth index is
positive and signi�cant, suggesting that joining a group may be a �normal good�(La
Ferrara 2000). Concerning community level characteristics, many of them do not ap-
pear to be signi�cant with the exception of living in a community with an elementary
school, which is positively and signi�cantly associated to social capital.22 In Column
3 we �nally use a community �xed e¤ects speci�cation as to rule out variation at
the community level. Results are consistent with the above and show that neither
magnitude nor signi�cance of migration e¤ects change signi�cantly. The latter sug-
gests that our variables of interest are not correlated with community unobservables
and do not su¤er from community-level omitted variables bias. Hence, even within
communities, household migration exposure remains negatively associated to social
networks whilst remittances generates a statistically signi�cant and positive e¤ect on
group participation and social capital investment.
As mentioned above, though, informal cooperation is a multifaceted asset that
may be de�ned (and measured) in di¤erent ways. Moreover, the e¤ect of migration
and remittances on group participation may be the result of a supply-side e¤ect, in
that communities with more migrants (e.g. richer communities) may develop more
institutionalized groups and associations (see also Miguel at al. 2006, La Ferrara
21Basic statistics show a relative majority of Changana ethno-linguistic group in our sample fol-lowed by Ronga, Chope and other groups (see Table A.1 in the Appendix). As for religion, themajority of people are either Catholic or believe in traditional Spirtism.22Some community characteristics are not signi�cant but the sign is consistent with expectations.
Yet, it should be noted that formal banks and �nancial institutions (as well as health care facilities)are very few and still largely under-developed in Mozambique, as people are not used to managemedium-large quantity of money.
21

2000).23 Similarly, it may be the case that migrant households form a coalition or
�club�that excludes non-migrant members of society. Thus, in order to control for
these issues, we regress the same models as above using di¤erent measures of inter-
household cooperation through informal social networks.
In Table 9 we report results from the community �xed e¤ects speci�cation where
the dependent variables are (i) a dummy variable equal to 1 if any member of the
household is in contact, through daily talks, with any relevant person in the com-
munity (i.e. traditional community leader, elected village chief, school teacher, doc-
tor/�curandeiro�, agricultural agent, neighbours); (ii) a dummy variable equal to 1
if the household exchanges (i.e. gives or receives) any good or service with at least
one relevant person in the community, as above; and (iii) a binary variable equal to
1 if the household reports expenditure for festivals, ceremonies or funerals within its
community. The latter variable is another proxy variable for informal social arrange-
ments and underlying social connections within the community of residence. With
the exception of daily contact networks, we �nd that migration and remittance indi-
cators have patterns broadly similar to group membership behavior, even though the
migration result is less precisely estimated. This suggests that main results (espe-
cially on remittances) are robust to alternative de�nitions of social arrangements that
provide some individual or collective economic bene�t, i.e. in terms of exchange of
goods and services, rather than information sharing (see marginal e¤ects from probit
model regressions in Table A.3). It is worth noting that, unlike group membership,
in the case of informal cooperation the wealth e¤ect is not so strong and robust in in-
creasing the household incentive to participate in informal exchanges with nonfamily
community members.
In order to explore whether migrant-sending households give or receive more (or
both, through mutual help) from the interaction with other community members,
in Table 10 we report results on the �direction� of the exchange link. Estimates
show no clear dominant direction in the informal exchange pattern (a slightly bigger
23As argued in Miguel et al. (2006), community group data may capture relatively formal expres-sions of social networks.It is also possible that migration-driven modernization is associated with ashift toward formal forms of cooperation, but not considerable changes in underlying social networks.
22

coe¢ cient for the �giving�variable) as households receiving remittances are positively
associated with all directions of the exchange link. This is consistent with the idea
that remittances, as stable source of income, may enable migrant-sending households
to overcome both commitment and enforcement constraints on informal contracts.24
-Table 9 about here-
-Table 10 about here
Finally, we also test whether past household migration experience has any e¤ect
on social capital investment. Table 11 reports linear probability model regressions as
above where the main explanatory variable is whether there is any return migrant
in the household. Findings show that this latter household status, which entails the
return of both human and physical capital after international migration, has a positve
e¤ect on any form of community-based social networks.
-Table 11 about here
Overall, reduced form results seem to suggest that out-migration in a poor devel-
oping setting such as Southern Mozambique is likely to contribute to inter-household
cooperation through remittances or by returning home, even though dispatching fam-
ily labor abroad might tighten the constraint on engaging in social interactions (es-
pecially group membership). However, the direction of causal nexus is one of the
particularly di¢ cult points in the social capital and migration literatures (Durlauf,
2002, Munshi 2003). As we mentioned above, unobservable determinants of both
the household decision to join social networks and to have a migrant member �such
as idiosyncratic shocks or household implicit propensity for speci�c types of (social)
arrangements � are still unlikely to provide consistent estimates. Furthermore, a
simultaneity bias would be present. Having more social networks at home may in-
crease the probability of migrating, and thereby of receiving remittances, and bias
our reduced form estimates in a positive direction. More access to resources due to
24Migrant-sending households may improve allocative e¢ ciency by removing or relaxing some ofthe impediments that limit informal exchange - i.e. they use remittances as a committment deviceand make credible enforcable contracts.
23

social networks, though, could also increase household well-being, enabling initially
non-migrant households either to send migrants abroad or to forego migration and
stay put. Moreover, families are likely to allocate more or less resources to infor-
mal social arrangements depending on the achievement of speci�c migrant members
or may vary their resources in response to changes in their migration circumstances
(e.g.remittance receipt). In these cases, our reduced form coe¢ cients would be down-
ward biased. Overall, the estimation reported so far would be biased and inconsistent
in the event that migration and remittance are endogenous. Thus, to try to correct
for this possibiity and reveal the �true�relationship between household migration ex-
posure and social networks, using an appropriate IV strategy is required. To this we
now turn.
6.1 IV results
In order to address the causal impact of migration and remittances on social network
participation in households left behind, we estimate the system of equations (3) using
an instrumental variable strategy. We examine two sets of potential instruments. The
set of variables to identify migration is whether the household had a migrant before
the war (1982-1992) as well as the number of male household members aged between
20 and 30 years old in 2005. The former variable is a proxy for family migration
networks and herd behavior, which are related to the pre-war period and does not
a¤ect the current level social capital, unless by a¤ecting current migration decisions
and attitudes. This is so as the prolonged armed war largely destroyed existing
social networks by massively displacing refugees and returnees. Therefore, given
remittances, any individual characteristic of migrants before the war is orthogonal
to social network participation as the latter is a property of the household, and not
of the individual who migrated in the past.25 We further use the number of male
25 It should be noted that given the long timeframe, past migrants from before the war may bedead or no longer part of the household. Nevertheless, this variable as such is likely to capturewell the long-lasting migration networks and, most importantly, individual attitudes towards movingabroad. The important role of the historic migration of family members (and even of neighboursor friends) has been largely examined in in�uencing an individual�s potential migration decision, bychain-migration networks and attitudinal e¤ects (see, among others, Massey et al., 1993, Masseyand Espinosa, 1997; Munshi, 2003). Accordingly, several studies use migration histories at village-or family-level to identify current migration (see Woodru¤ and Zeteno, 2001, Hanson and Woodru¤,
24

household members in their working/migration age (i.e. between 20 and 30 years
old) in 2005, when Mozambique and South Africa agreed to visa-free travel for their
nationals, consistent with the new, high-level political vision of South Africa as part
of an integrated region. This is an exogenous migration-policy shock that, interacted
with a restricted household age structure, is likely to a¤ect networks in Mozambique
only via migration out�ows. Thus we argue that, given our household demographic
controls, the speci�c gender-age composition at the time of the exogenous migration-
policy �shock� occurred in South Africa is randomly assigned and does not a¤ect
networks in Mozambique beyond its in�uence through migration out-�ows.
In order to identify the remittance equation, we use a set of three instruments
interchangeably. The �rst one is the short-run deviation in rainfall levels, measured
as rainfall in 2007 minus the average historical rainfall since 1979.26 This is so as
variations in rainfall may have an important e¤ect on changes in household income
(in a region where most households are either directly or indirectly dependent on
agriculture), thereby a¤ecting remittances as well, as a form of insurance (Yang and
Choi, 2007). On the other hand, as long as we control for a large set of household-
and community-level determinants of income variation, it is unlikely that short-run
covariate shocks such as poor rainfall will a¤ect household membership in social
networks directly, unless making remittance receipt more likely for migrant-sending
housheolds.27 We further use whether household migrants have a permanent job-
contract at destination and the number of migrants in the rest of the community
sending remittances home as other instruments. The rationale for including the for-
mer variable lies in the fact that migrants� employment conditions at destination
are a function of labour market characteristics abroad, especially considering that
migrants from Mozambique typically sell their work to South Africans on the spot
market (see for example Raimundo, 2009). Therefore, the latter variable may be re-
2003, Lopez-Cordova, 2004, McKenzie and Rapoport 2004, Hildebrandt and McKenzie, 2005).26The rainfall data source is the NASA GPCP (Global Precipitation Climatology Project) which
has been used by Miguel et al. (2004) among others. The data can be downloaded from the followingwebsite: http://precip.gsfc.nasa.gov/27We also use, as in Munshi (2003), rainfall levels from the recent past at a community level
obtaining the same results as when using rainfall deviation. Other research using rainfall shocks asinstruments include Paxson (1992), Miguel (2005), Yang and Choi (2007).
25

lated to social networks at home only through remittance behavior. Given household
and community controls, instead, the average remittances rate at community level is
very commonly used in the literature as a proxy for the local �remittance norm�(see
Rozelle et al.1999, Taylor et al. 2003).
Results based on the IV estimation strategy are presented in Table 12. We use
both 2sls and 3sls estimator, whereby the latter applies an IV procedure to produce
consistent estimates and generalised least squares to account for correlation struc-
ture in the disturbances across equations. Our speci�cations include a rich set of
household and community level controls as in reduced form speci�cations above. In
columns (3)-(4) we report one sensitivity check to speci�c instrument selection by
using a di¤erent combination of instruments. Moreover, even though our reduced
form results have proved to be free of bias from omitted community-level characteris-
tics, the use of community-level instruments obviously precludes the introduction of
community �xed e¤ects in the IV speci�cation. Hence, as an additional strategy in
columns (4)-(6) we consider household-level instruments only and include community
�xed e¤ects. The F-statistics of all combinations of excluded instruments and the
overidenti�cation Sargan tests suggest that the instruments are valid and not weak.
Overall, results in Table 12 show the same net-e¤ect of migration on group partic-
ipation. In particular, the number of household migrants has a signi�cant negative
e¤ect on household participation in community networks. On the other hand, there
is an o¤setting signi�cant e¤ect of remittance receipt that positively in�uences the
propensity to join groups and social networks in households left behind. The di¤er-
ence in coe¢ cients�magnitude, which are higher in the IV regressions than in reduced
form linear probability models, suggest that correcting for endogeneity does have an
e¤ect in revealing the causal relationship. In particular, if social networks increase
the migration likelihood among initially non-migrant households, the reduced form
coe¢ cients would be downward biased.
-Table 12 about here-
Hence, by using di¤erent approaches we �nd that migration coupled with remit-
26

tances is economically and statistically signi�cant in increasing household member-
ship in groups at origin. We interpret these results as evidence that remittances, in
being a stable source of income, may decrease participation costs and increase house-
hold commitment in informal social arrangements in developing settings. Indeed,
households with a more stable income entry can expect to be able to commit them-
selves more easily to regular payments in informal exchanges, through lower risk of
default. Moreover, certain informal groups will be more inclined to accept members
that have a regular and secure source of income (i.e. reducing adverse selection prob-
lems). That would be an extra e¤ect favoring a positive e¤ect of remittances on the
probability of joining.
Yet, membership in groups or informal social arrangements, and the level of en-
forceability in particular, varies with the institutional and legal environment. This is
why we futher explore the social impact of household migration exposure in di¤erent
contexts (i.e. subsamples) where heterogeneous degrees of enforcement (e.g. social
sanctions) may be at work.
6.2 Institutional e¢ ciency and heterogeneous results
Labor migration from a poor to a richer destination and remittance receipt by people
left behind is a key source of heterogeneity in village economies in a developing setting.
Yet, the role of these processes in a¤ecting the household incentive to participate in
reciprocal informal arrangements at origin may be at work through further e¤ects,
related to changes in community-level institutions and socio-economic characteristics.
The existing literature has pointed out the importance of the community institutional
e¢ ciency in shaping cooperative behavior. In particular, more heterogenous societies
may hamper cooperation in the provision of local public goods and informal exchange
arrangements in that social sanctions are less e¤ective (or alternatively said, trust
and norms are weaker in more heterogeneous societies)28. Overall existing evidence
suggests that heterogeneity along economic, religious or ethnic lines is correlated with
28 It is hypothesized that homogeneity at community level increases trust and common norms andlowers information and monitoring costs, such that it encourages social exchanges. See Alesina et al.1999, Alesina and La Ferrara 2000, Bandiera et al. 2005.
27

lower contributions to public goods, higher extraction levels from common resources
and poorer maintenance of common infrastructure. Thus, even though we do not
tackle these mechanisms directly, we rule out confounding factors by carrying out a
sensitivity analysis of our results in the Mozambican context.
Table 13 presents our estimates for a set of sub-samples de�ned by observable
community attributes correlated with both household migration status and the level
of �cohesion�at the community level. Hence, we distinguish heterogenous communities
by (i) wealth inequality (reported by the community leader and measured with the
Gini coe¢ cient), (ii) the way land is allocated (traditional vs modern law)29, (iii)
ethno-linguistic and religious diversity.30 As the latter is concerned we build an index
of ethnic (religion) fractionalization that is the probability that two randomly selected
individuals from a community will not belong to the same group. 31
-Table 13 about here-
As shown in Panel A in Table 13, migration and especially the remittance e¤ect is
more precisely estimated in communities with lower levels of inequality, both reported
by the community leader (subjective measure) or measured with the Gini index (in
the latter case we consider communities in the top two and bottom two quantiles of
the Gini index distribution). When we distinguish communities where land is allo-
cated by the government or by the traditional leader or the whole community through
participatory meetings (Panel B), results show that remittances are relevant for group
participation in societies with traditional land allocation rules, and even negatively
associated with group participation where modern law holds (yet in the latter case
variation is too low to reach stable conclusions as most of the communities follow29As other regions in Africa, Mozambique is a country of relatively low densities of population with
strong cultural traditions and respected local authorities who, in the absence of o¢ cial authorities,are in charge solve con�icts and allocate land -often (but not always) jointly with the communitycouncil- using indigenous knowledge and local capacity.30Mozambique is peculiar in terms of diversity, as our data indicate a very low level of ethnic
diversity and a relatively high level of religious diversity.31Speci�cally, we use the variable "ethnic (religious) group" to de�ne the cultural identity of each
household. The fractionalization index is de�ned as: Ij = 1 �PM
i=1(�ij)2 where �ij is the share of
people of group i among the residents of community j. This index varies from 0 (perfect homogeneity)to 1 (highest degree of heterogeneity or fragmentation) (see Alesina and LaFerrara 2000, LaFerrara,2002 and Peri and Ottaviano, 2006 among others).
28

traditional patterns of land allocation). Finally, migrant-sending households do not
appear to respond very di¤erently according to the social composition of the com-
munity, when the latter is measured in terms of ethnic or religious fractionalization
(also in this case we consider communities in the top two and bottom two quantiles
of the fractionalization indexes distribution). In particular, migrant-sending house-
holds appear to participate in the same way in both ethnically homogeneous and
heterogeneous communities, and even slightly more in communities with more reli-
gious diversity. We interpret these results as evidence that economically homogeneous
societies may be more e¤ective in devising mechanisms, related to egalitarian rules
or social sanctions, that foster cooperative behavior in migrant-sending households.
This is not the case, though, when communities are homogeneous in their ethnic or
religious composition. The latter may be explained by the little history of religious
fundamentalism or ethnic con�ict in Southern Mozambique, and therefore by the lit-
tle relevance of ethnicity or religion in determining heterogeneous preferences on the
provision and characteristics of common goods.32
7 Conclusions
This paper examines the role of labor migration and remittances in shaping group
participation and social networks in village economies left behind. By using an orig-
inal household survey containing detailed information on family migration status,
group participation and inter-household informal exchanges from two provinces in
the south of Mozambique, we �nd that households with successful migrants, i.e.
those receiving remittances or return migration, engage more in community based
social networks. In particular, contrary to the common presumption, we �nd that
the probability of a family engaging in a social network is decreasing in the number
of migrants but increasing in an indicator for receipt of remittances. The former
32Mozambicans often identify primarily with the ethnic and/or linguistic group. However, theindependence movement that began in the 1960s was a unifying force, causing disparate elementsto join together in resisting the Portuguese. Ironically, some of the main unifying factors in thecountry have been remnants of the colonial system, including the Portuguese language and theRoman Catholic religion. Thus, despite ethnic and linguistic di¤erences, there is little con�ict amongthe various groups. The greatest cultural disparities are those which divide the north of the countryfrom the south.
29

result is weaker when informal social arrangements are considered, while the latter
�nding is robust to alternative de�nitions of social interaction, to the introduction of
community �xed e¤ects, and to potential endogeneity issues, which we address with
an instrumental-variable estimation strategy. The same positive result holds when
we look at the compound e¤ect of return migration on social networks participation.
We interpret these results as evidence that in a poor developing setting, even though
social networks are open, income risk and participation constraints may limit both
access to them and their e¤ectiveness in facilitating inter-household cooperation and
trade. Thus, higher income stability through remittances or strong family migration
ties may decrease participation costs and increase household commitment in engaging
in groups and reciprocal arrangements.
We also explore the role of the institutional and social environment in driving
group participation of migrant-sending households in more homogeneous communi-
ties. We �nd that migrant households in Southern Mozambique are more likely to
engage in social networks and cooperation in more economically even societies, where
social cohesion and sanctions may be more e¤ective, whilst they are not unevenly re-
sponsive to the social composition of the community in terms of ethnicity or religion.
Our results contribute to the existing migration literature by providing new in-
sights into how labor mobility, as a common within-family strategy in many devel-
oping countries, a¤ects the informal structure of village economies at origin. This is
even more relevant when considering the wide literature showing the key role played
by social capital and networks in shaping economic development and institutions in
low income countries. Thus, labor out-migration may have a positive e¤ect on the
social structure and the organization of the common duties in local communities at
origin, through the enduring ties that migrants maintain with their home country.
8 References
Adams, R., and J. Page. 2005. Do International Migration and Remittances Reduce
Poverty in Developing Countries? World Development 33(10), 1645�1669.
Alesina, A., R. Baqir, and W. Easterly. 1999. Public Goods and Ethnic Divisions.
30

Quarterly Journal of Economics 114(4), 1243-1284.
Alesina, A., and E. La Ferrara. 2000. Participation in heterogeneous communi-
ties. Quarterly Journal of Economics 115, 847�904.
Bala, V., and S. Goyal. 2000. A Non-Cooperative Model of Network Formation.
Econometrica 68(5),1181.1229.
Bandiera, O. and I. Rasul. 2006. Social Networks and Technology Adoption in
Northern Mozambique. Economic Journal 116(514), 862-902.
Besley, T. 1995. Nonmarket Institutions for Credit and Risk Sharing in Low-
Income Countries. Journal of Economic Perspectives 9(3), 115-127.
Besley, T., S. Coate, and G. Loury. 1993. The Economics of Rotating Savings
and Credit Associations. American Economic Review 83(4), 792�810.
Bugamelli, M. and Paternò, F. 2008. Output growth volatility and remittances,
Temi di discussione (Economic working papers) 673, Bank of Italy, Economic Re-
search Department. Economica, forthcoming.
Coate, S., and M. Ravallion. 1993. Reciprocity Without Commitment: Charac-
terization and Performance of Informal Insurance Arrangements. Journal of Devel-
opment Economics 40, 1.24.
Coleman, J. 1988. Social Capital in the Creation of Human Capital. American
Journal of Sociology 94, S95-S121.
Coleman, J. 1990. The Foundations of Social Theory. Cambridge: Harvard Uni-
versity Press.
Conley, T., and C. Udry. 2004. Social Networks in Ghana. Economic Growth
Center Working Paper no. 888.
Cox Edwards, A., and M. Ureta. 2003. International Migration, Remittances and
Schooling: Evidence From El Salvador. Journal Of Development Economics 72(2),
429-461
Davis, B., G. Stecklov, and P. Winters. 2002. Domestic and international migra-
tion from rural Mexico: Disaggregating the e¤ects of network structure and compo-
sition. Population Studies 56(3), 291-309.
Docquier, F., and H. Rapoport. 2008. Brain drain and human capital formation
31

in developing countries: winners and losers. Economic Journal 118(528), 631-652.
Dubois P., Bruno J. and Magnac T. 2008. Formal and Informal Risk Sharing in
LDCs: Theory and Empirical Evidence. Econometrica Vol. 76(4), 679-725.
Durlauf, S. 2002. On the Empirics of Social Capital. Economic Journal 112(483),
459-479.
Durlauf, S., and M. Fafchamps. 2005. Social Capital. Handbook of Economic
Growth, Wiley, New York.
Ellsworth, L. 1989. Mutual Insurance and Non-Market Transactions Among
Farmers in Burkina Faso, University of Wisconsin. Unpublished Ph.D. thesis.
Fafchamps, M. 1992. Solidarity Networks in Pre-Industrial Societies: Ratio-
nal Peasants with a Moral Economy. Economic Development and Cultural Change
41(1),147-174.
Fafchamps, M. and Minten, M. 2000. "Returns to Social Network Capital among
Traders," Oxford Economic Papers, 54(2), 173-206.
Fafchamps, M., and F. Gubert. 2007. The Formation of Risk-Sharing Networks.
Journal of Development Economics 83(2), 326-350.
Fafchamps, M., and S. Lund. 2003. Risk Sharing Networks in Rural Philippines.
Journal of Development Economics 71(2), 261-287.
Foster, A. and M. Rosenzweig. 2001. Imperfect Commitment, Altruism and the
Family: Evidence from Transfer Behavior in Low-Income Rural Areas. Review of
Economics and Statistics 83(3), 389-407.
Fukuyama, F. 2000. Social Capital and Civil Society, IMFWorking Paper WP/00/74,
April 2000.
Glaeser, E., D. Laibson, J. Scheinkman and C. Soutter. 2000. Measuring Trust.
Quarterly Journal of Economics 115(3), 811-846.
Glaeser, E., D. Laibson, and B. Sacerdote. 2002. An Economic Approach to
Social Capital. Economic Journal 112(483), 437-458.
Glaeser, E., B. Sacerdote, and J. Scheinkman. 2003. The Social Multiplier.
Journal of the European Economic Association 1(2), 345-353.
Granovetter, M. 1985. Economic Action and Social Structure: Embeddedness.
32

American Journal of Sociology 91(3), 481-510.
Guiso, L., Sapienza P. and Zingales, L. 2004. "The Role of Social Capital in
Financial Development," American Economic Review, vol. 94(3), pages 526-556
Helliwell, J. 2001. Social Capital, the Economy and Well-being. The Review of
Economic Performance and Social Progress 2001: The Longest Decade: Canada in
the 1990s, 2001, vol. 1.
Karlan, D., M. Bertrand, S. Mullainathan, E. Sha�r, and J. Zinman. 2009.What�s
Advertising Content Worth? Evidence from a Consumer Credit Marketing Field
Experiment. Quarterly Journal of Economics (forthcoming).
Kimball, M. 1988. Farmers Cooperatives as Behavior Toward Risk. American
Economic Review 78(1), 224-232.
Kocherlakota, N. 1996. Implications of E¢ cient Risk Sharing Without Commit-
ment. Review Economic Studies 63(4),595-609.
Kranton, R. 1996. Reciprocal Exchange: A Self-Sustaining System. American
Economic Review 86(4), 830-851.
La Ferrara, E. 2002. Inequality and group participation: Theory and evidence
from rural Tanzania. Journal of Public Economics 85(2), 235�73.
Ligon, E., J. Thomas, and T. Worrall. 2000. Mutual Insurance, Individual Sav-
ings, and Limited Commitment. Review of Economic Dynamics 3(2), 216�46.
Ligon, E., J. Thomas, and T. Worrall. 2002. Informal Insurance Arrangements
with Limited Commitment: Theory and Evidence from Village Economies. Review
of Economic Studies 69(1), 209-244.
Lucas, R.E.B. 1987. Emigration to South Africa�s Mines. American Economic
Review 77(3), 313�330.
Lucas, R.E.B., and O. Stark. 1985. Motivations to Remit: Evidence from
Botswana. Journal of Political Economy 93(5), 901�918.
Marsh, R. 2003. Working with local institutions to support sustainable liveli-
hoods. Food and Agriculture Organization of the United Nations (FAO), Rome.
Massey, D., Arango, J., Hugo, G., Kouaouci, A., Pellegrino, A., & Taylor, J.
1993. Theories of International Migration - a Review and Appraisal. Population and
33

Development Review, 19(3):431-466.
Mendola, M. 2008. Migration and Technological Change in Rural Households:
Complements or Substitutes? Journal of Development Economics 85(1-2) ,150�175.
Miguel, E., S. Satyanath, and E. Sergenti (2004). Economic Shocks and Civil
Con�ict: An Instrumental Variables Approach. Journal of Political Economy 112
(41): 725-753.
Miguel, E., P. Gertler, and D. Levine. 2005. Does Industrialization Buil or
Destroy Social Networks? Economic Development and Cultural Change 54(2), 287-
318.
Ministerio do Plano e Financas.1998. Republic of Mozambique.
Munshi, K. and Rosenzweig, M. 2009. Why is Mobility in India so Low? Social
Insurance, Inequality, and Growth mimeo 2009.
Munshi, K. 2003. Networks in the Modern Economy: Mexican Migrants in the
U.S. Labor Market. Quarterly Journal of Economics 118(2), 549�597.
Narayan, D. 1997. Voices of the Poor: Poverty and Social Capital in Tanzania.
ESD Monograph Series: World Bank. Washington, D.C.
Narayan, D., and L. Pritchett. 1999. Cents and Sociability: Household Income
and Social Capital in Rural Tanzania. Economic Development and Cultural Change
47(4), 871-897.
Ostrom, E. 1990. Governing the Commons: The Evolution of Institutions for
Collective Action. Cambridge University Press: New York.
Platteau, J. 1991. Traditional Systems of Social Security and Hunger Insurance:
Past Achievements and Modern Challenges. In E. Ahmad, J. Dreze, J. Hills, and A.
Sen (eds.). Social Security in Developing Countries. Clarendon Press, Oxford.
Platteau, J. 1991. The Social Prerequisites of the Market (Sotsialnye Predposilki
Rinka ), Eco, Novosibirsk.
PRSP, 2007. Republic of Mozambique: Poverty Reduction Strategy Paper. IMF
Country Report 07/37. January.
Putnam, R. 2000. Bowling Alone. New York: Simon and Schuster.
Putnam, R. 1995. Tuning In, Tuning Out: The Strange Disappearance of Social
34

Capital in America. PS: Political Science & Politics December, 664-683.
Putnam, R., R. Leonardi, and R. Nanetti. 1993. Making Democracy Work: Civic
Traditions in Modern Italy. Princeton University Press, Princeton, NJ.
Rozelle, S., E. Taylor, and A. deBrauw. 1999. Migration, Remittances and
Agricultural Productivity in China. American Economic Review 89(2), 287�291.
Raimundo, I. M. 2009. International Migration Management and Development
in Mozambique: What Strategies? International Migration Vol. 47 (3) forthcoming.
Ratha, D. (2003), �Workers�Remittances: An Important and Stable Source of
External Finance�, Global Development Finance, pp 157-175.
SAMP. 2003. MigrationNews. Southern African Migration Project.
Stark, O. 1991. The Migration of Labour. Basil Blackwell, Cambridge.
Stark, O., and D. Levhari. 1982. On Migration and Risk in LDCs. Economic
Development and Cultural Change 31(1), 191�196.
Schi¤, M. 2002a. Love Thy Neighbor: Social Capital, Trade and Optimal Migra-
tion Policy. European Journal of Political Economy
Schi¤, M. 2002b. Trade, Migration and Welfare: The Impact of Social Capital.
Chapter 26 in H. Singer, N. Hatti and R. Tandon (eds.) Globalization, Technology
and Trade in the 21st Century. Vol. 19 of New World Order Series. B.R. Publishing:
Delhi.
Taylor, J.E , Rozelle, S. and de Brauw, S. 2003. Migration and Incomes in Source
Communities: A new Economics of Migration Perspective from China. Economic
Development and Cultural Change. Octobre 52 (1), 75�101.
Taylor J.E. and Martin, P. 2001. Human Capital: Migration and Rural Popula-
tion Change, in Handbook for Agricultural Economics, Elsevier Science, New York.
Towsend, R. 1994. Financial Systems in Northern Thai Villages. Quarterly Jour-
nal of Economics 110(4),1011-1046.
Udry, C. 1994. Risk and Insurance in a Rural Credit Market: An Empirical
Investigation in Northern Nigeria. Review of Economic Studies 61.
Winters, P., A. de Janvry, and E. Sadoulet. 2001. Family and Community Net-
works in Mexico-U.S. Migration. Journal of Human Resources 36(1), 159-184.
35

Yang, D. 2006. Why Do Migrants Return to Poor Countries? Evidence from
Philippine Migrants�Responses to Exchange Rate Shocks. Review of Economics and
Statistics 88(4), 715-735.
Yang, D. 2008. International Migration, Remittances, and Household Investment:
Evidence from Philippine Migrants�Exchange Rate Shocks. Economic Journal 118,
591-630.
Yang, D., Choi, H., 2007. Are remittances insurance? Evidence from rainfall
shocks in the Philippines. World Bank Economic Review 21(2), 219-248.
36

8 Annex of Tables Table 1
Mean s.d.HH with any international migration experience (%) 0.55 (0.5)
N. of current migrants in the HH 1.59 (1.18)HH with current migrants (%) 0.38 (0.49)HH receiving remittances (total) (%) 0.24 (0.43)HH receiving remittances (out of migrant HHs) (%) 0.60 (0.49)
N. of return migrants in the HH 1.29 (0.68)HH with returm migrants (%) 0.29 (0.45)Obs.
Incidence of migration and remittances (household level)
905

Table 2
Current migrants Return migrants Never migrantsGender (male) (%) 0.82 0.67 0.43Age in years 30.64 38.41 23.34Married/cohabit (%) 0.52 0.62 0.38HH size 5.08 5.52 6.34Literate (%) 0.80 0.69 0.55Years of education 5.21 4.60 4.09English speaker (%) 0.27 0.20 0.05HH head no education (%) 0.45 0.34 0.43HH head primary education (%) 0.48 0.54 0.45HH head secondary or more education (%) 0.07 0.13 0.12No religion (%) 0.10 0.10 0.11
Occupation (a) (%)Farmer (work own land) - 0.27 0.22Farm worker 0.01 0.07 0.02Non-farm worker/employee 0.05 0.14 0.07Self-employed 0.02 0.07 0.05Informal worker (trader, street vendor) 0.12 0.10 0.04Student 0.04 0.06 0.34Domestic worker 0.03 0.07 0.11Miner 0.16 - -Skilled wokers 0.08 - -Unkilled worker 0.15 - -Unknown 0.21 - -Unemployed 0.04 0.05 0.06Other 0.08 0.09 0.05Retired - 0.06 0.01
Country of destination (%):South Africa 0.92 0.90 -Other African Country 0.01 0.08 -Other(EU/US) 0.01 0.01 -Other region in Mozambique 0.06 - -
Send remittances (%) 0.45 - -Wish to migrate again (%) - 0.58 -Years since return - 0.92 -Years since last migration episode 3.85 9.52 -Years since first migration episode 9.44 14.99 -
Total 0.11 0.063 0.83Obs. 527 304 4020Notes: (a) We here report occupations of current migrants at destination and occupations of return migrants at home.
Individual characteristics by migration status (15 years old or above)
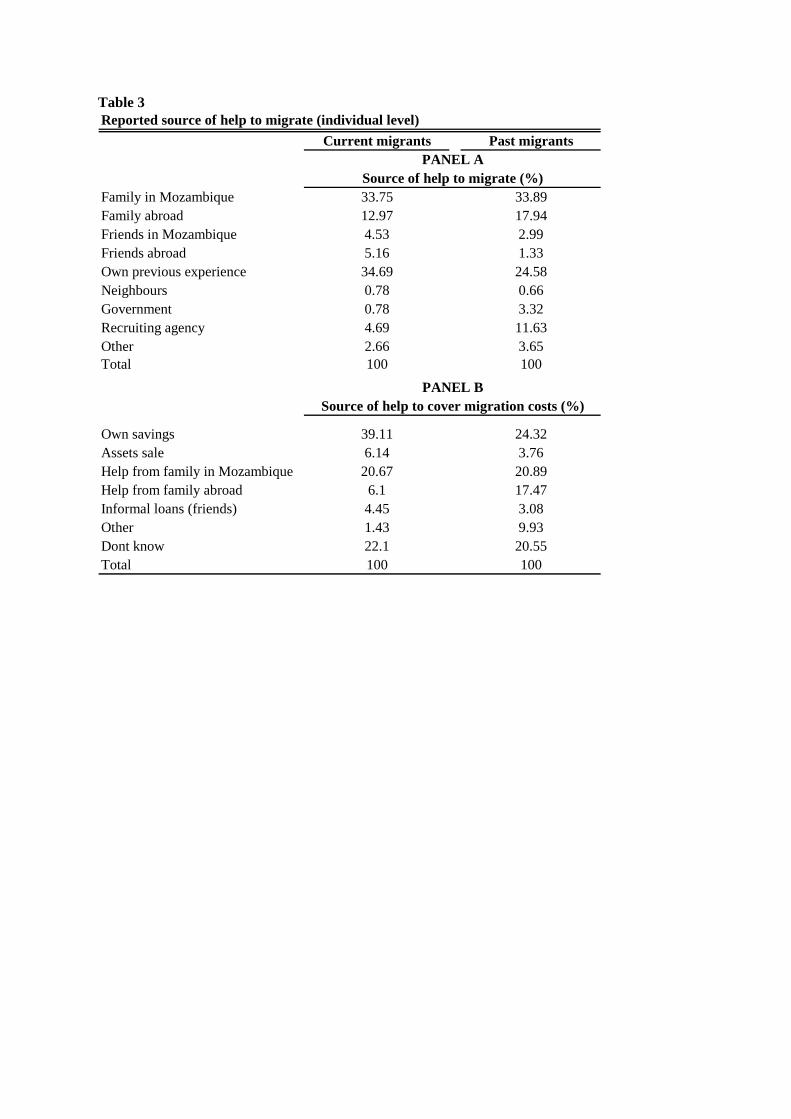
Table 3 Reported source of help to migrate (individual level)
Current migrants Past migrants
Family in Mozambique 33.75 33.89Family abroad 12.97 17.94Friends in Mozambique 4.53 2.99Friends abroad 5.16 1.33Own previous experience 34.69 24.58Neighbours 0.78 0.66Government 0.78 3.32Recruiting agency 4.69 11.63Other 2.66 3.65Total 100 100
Own savings 39.11 24.32Assets sale 6.14 3.76Help from family in Mozambique 20.67 20.89Help from family abroad 6.1 17.47Informal loans (friends) 4.45 3.08Other 1.43 9.93Dont know 22.1 20.55Total 100 100
Source of help to migrate (%)
Source of help to cover migration costs (%)
PANEL A
PANEL B

Table 4
Mean (%) s.d.
0.55 (0.35)Weekly 0.02 (0.13)Monthly 0.14 (0.35)Trimestral 0.23 (0.42)Yearly 0.16 (0.36)
0.41 (0.49)0.05 (0.22)
0.86 (0.34)0.03 (0.16)0.03 (0.17)0.01 (0.10)0.02 (0.13)0.06 (0.06)
0.20 (0.4)0.24 (0.43)0.33 (0.47)0.07 (0.1)0.04 (0.19)0.03 (0.17)0.09 (0.12)
Remittance management (current migrants- indiv. level)
Frequency
Regularly
OccasionallyNs/NR
Current consumption (food)
Other
Means of transportPersonally
HousingHealthInvestment in own business
Other527Obs.
Use
TaxiPublic transport/ mochibomboBank account (teba)Postal mail
Clothing
Friends or collegues

Table 5
Mean (%) s.d.Community groupsParticipation in any group (dummy) 0.27 (0.45)By typeROSCAs (rotating saving and credit groups) 0.06 (0.23)Farmers cooperative association 0.03 (0.18)Bank group 0.04 (0.19)Civic committees (a) 0.02 (0.19)Burials' association 0.01 (0.11)Self-help religious/church group 0.14 (0.34)Women group 0.02 (0.11)Youth group 0.01 (0.10)Other groups (b) 0.02 (0.12)Type of participationMember 0.25 (0.43)Beneficiary 0.17 (0.37)Decision maker 0.13 (0.33)Promotor 0.11 (0.31)Informal social interactionDaily talk with any important person 0.74 (0.43)Give or receive (any good or service) 0.27 (0.44)Expenses on ceremonies 0.14 (0.34)Direction of the social exchangeReceive 0.18 (0.38)Give 0.14 (0.35)Give and Receive (mutual help) 0.05 (0.21)Obs.Notes: (a) Civic committees include both participation in meetings and voluntarylabor exchage to improve community infrastructures. (b) Other groups includes:informal cross-border traders associations or "mukhero", cooperatives of producers,unions, NGOs, agricultural voluntary labor.
Social network participation (household level)
905

Table 6 Reasons for not participating in social networks (a) (%)
Lack of money Lack of time Lack of interest/trustFormal groupsROSCAs (xitique ) 0.31 0.28 0.30Farmers cooperative association 0.34 0.34 0.25Political group 0.35 0.34 0.21Bank group 0.30 0.28 0.30Civic committees (b) 0.33 0.34 0.24Burials' association 0.34 0.34 0.25Self-help religious/church group 0.30 0.27 0.26Women group 0.34 0.34 0.21Youth group 0.37 0.35 0.22Other groups (c) 0.32 0.36 0.23Informal social interactionCommunity leader 0.08 0.26 0.57Goverment authority 0.16 0.15 0.59Teacher 0.09 0.29 0.48Farming agent 0.21 0.21 0.41Priest 0.15 0.20 0.45Neighbours 0.11 0.17 0.63Health provider 0.20 0.15 0.53Healer 0.14 0.10 0.41Employer 0.21 0.24 0.38Obs. 925Notes: (a) The survey question is: why did you or any member of your family not participate in [....] or exchangeresources with [...]? The alternative answers were: (i) no need, (ii) does not work, (iii) no trust, (iv) no useful, (v) toocostly, (vi) too time consuming. (b) Civic committees include bothn participation in meetings and voluntary labor toimprove community infrastructure. (c) Other groups includes: informal cross-border traders associations or "mukhero",cooperatives of producers, unions, NGOs, agricultural voluntary labor.

Table 7
No Yes No Yes No YesN. of current migrants in the HH 0.64 0.52 0.56 0.71 0.55 0.90HH with internt. migration experience 0.53 0.60 0.52 0.62 0.51 0.76HH receives remittances (%) 0.23 0.28 0.20 0.37 0.22 0.41Female HH head (%) 0.40 0.38 0.40 0.37 0.39 0.40Age of HH head 46.56 45.48 46.31 46.16 46.5 44.87Head no education (%) 0.46 0.33 0.42 0.42 0.43 0.37HH head education- primary (%) 0.47 0.44 0.45 0.50 0.46 0.49HH head education- secondary or more (%) 0.07 0.22 0.12 0.08 0.11 0.14HH head occupation- farmer (%) 0.42 0.45 0.42 0.46 0.41 0.57Household size 4.83 5.57 5.06 4.95 4.87 6.03N. of females in the HH 2.88 3 2.94 2.84 2.81 3.53N. of children in the HH (<5years-old) 0.65 0.86 0.67 0.81 0.65 1.1Residence 5 or more years (dummy) (%) 0.84 0.88 0.84 0.89 0.85 0.84Ethnicity-changana (%) 0.90 0.72 0.86 0.82 0.86 0.79Ethnicity-Ronga (%) 0.08 0.18 0.10 0.13 0.11 0.11Ethnicity-Chope (%) 0.01 0.03 0.01 0.02 0.01 0.04Ethnicity-Other minorities (%) 0.01 0.07 0.03 0.03 0.02 0.05No religion (%) 0.12 0.07 0.11 0.10 0.12 0.04Wealth index (d) -0.41 0.56 -0.2 0 -0.27 0.61Urban area (%) 0.17 0.38 0.23 0.21 0.20 0.36Community characteristicsEthnic fractionalization index 0.18 0.27 0.2 0.23 0.21 0.18Religion fractionalizaiton index 0.66 0.6 0.64 0.65 0.65 0.63Community with pave-road (%) 0.13 0.20 0.18 0.08 0.14 0.22Community with elementary school (%) 0.75 0.80 0.81 0.65 0.80 0.58Community with a Bank (%) 0.03 0.12 0.07 0.02 0.05 0.07Community with a market (%) 0.42 0.43 0.49 0.27 0.42 0.46
No Yes No Yes No YesFormal Group participation (%) 0.29 0.26 0.26 0.32 0.22 0.40Informal exchange (give or receive) (%) 0.26 0.30 0.23 0.41 0.24 0.35Expenses in cerimonies (%) 0.13 0.17 0.11 0.24 0.10 0.25Mutual help (give and receive) (%) 0.04 0.06 0.03 0.11 0.04 0.08
Household and community characteristics by social network measures and migration status (household level)
Notes: (a) Formal group is a binary variable equal to 1 if any household member participates in any of the following formal groups: ROSCAs, bank,
farmers association, burials association, NGOs actions, self-help religious group, political group, women group, civic group, youth group, others. (b)
Give or receive a binary viariable equal to 1 if the HH gived or received products or services from at least one of the following important persons in
the community: traditional leader, elected leader, teacher, agricultural agent, priest, neighbours, health provider, healer, employer. (c) Expenses in
ceremonies is a binary variable equal to 1 if the HH spent any money or product in community's ceremonies and festivals in the last year. (d) The
wealth index is the first component of a principal component analysis that uses household dwelling conditions and assets ownership.
Panel A
Panel BCurrent Migration Remittances Return Migration
Formal groups (a) Give or receive (b) Expenses in ceremonies (c)

Table 8
Linear probability models (standard errors in brackets)(1) (2) (3)
N. of current migrants in the HH -0.047** -0.039** -0.035**(0.017) (0.018) (0.016)
HH receives remittances 0.120*** 0.146*** 0.153***(0.043) (0.048) (0.039)
Female HH head 0.038 0.047(0.041) (0.031)
Age of HH head 0.003 0.003(0.006) (0.004)
Age of HH head squared -0.000 -0.000(0.000) (0.000)
HH head education- primary 0.021 0.011(0.036) (0.033)
HH head education- secondary or more 0.252*** 0.236***(0.064) (0.054)
HH head occupation- farmer 0.069* 0.088***(0.039) (0.031)
HH operating land 0.023 0.015(0.048) (0.039)
HH size 0.014 0.007(0.009) (0.009)
N. of females in the HH -0.039*** -0.036***(0.010) (0.013)
N. of children in the HH (<5years-old) 0.049* 0.047**(0.026) (0.020)
Residence 5 or more years (dummy) 0.074** 0.068*(0.035) (0.041)
Ethnicity-Ronga 0.142** 0.155***(0.052) (0.050)
Ethnicity-Chope 0.249 0.183(0.182) (0.122)
Ethnicity-Other minorities 0.232*** 0.189**(0.086) (0.088)
Religion-Catholic 0.006 0.067(0.056) (0.055)
Religion-Presbyterian -0.126* -0.028(0.070) (0.093)
Religion-Methodist 0.212** 0.230***(0.104) (0.079)
Religion-Anglican -0.118** 0.035(0.056) (0.161)
Religion-Baptist -0.064 0.104(0.116) (0.126)
Religion-Adventist 0.151 0.203*(0.133) (0.118)
Religion-Islam -0.034 -0.036(0.177) (0.144)
Religion-Tradition spiritsm 0.108** 0.090*(0.051) (0.047)
Religion (NS/NR) -0.112*** -0.021(0.039) (0.062)
Wealth index 0.030*** 0.020**(0.009) (0.009)
Urban area (dummy) 0.167*** 0.371(0.059) (0.333)
Community with paved-road -0.060(0.088)
Community with primary school 0.116**(0.051)
Community with a Bank -0.009(0.099)
Community with a market -0.052(0.090)
Community with health facility 0.058(0.095)
Constant 0.273*** -0.156 -0.113(0.049) (0.120) (0.133)
Obs. 905 905 905R-squared 0.012 0.220 0.127N. of community fixed effects 42Robust standard errors clustered at community level in parentheses; *** p<0.01, ** p<0.05, * p<0.1.
Impact of migration and remittances on group participation
Notes: (a) The dependent variable is a binary variable equal to 1 if any member of the household has participated in any of thefollowing groups: ROSCAs, farmers' association, burials association, ONGs actions, self-help religious group, political group,women group, civic group, youth group, others. (b) Remittances variable is a dummy equal to 1 if the HH has receivedremittances, in money or in-kind, in the last year. (c) Wealth index is the first component of a principal component analysis, whichuses dwelling conditions and assets ownership of the HH. (d) Column 3 shows estimates with fixed effects at the community level.The excluded categories are: no education, Changana, no religion.

Table 9
Linear probability models (standard errors in brackets)Daily talk frequency
Give or receive (a)Expenses on ceremonies (b)
N. of current migrants in the HH -0.014 -0.026 -0.005(0.017) (0.016) (0.013)
HH receives remittances 0.020 0.139*** 0.055*(0.043) (0.040) (0.033)
Female HH head -0.030 0.029 0.019(0.033) (0.031) (0.026)
Age of HH head 0.001 -0.001 -0.007**(0.004) (0.004) (0.003)
Age of HH head squared -0.000 0.000 0.000(0.000) (0.000) (0.000)
HH head education- primary -0.074** 0.009 -0.012(0.036) (0.034) (0.028)
HH head education- secondary or more -0.083 0.009 -0.064(0.059) (0.056) (0.045)
HH head occupation- farmer 0.101*** 0.036 0.070***(0.033) (0.032) (0.026)
HH operating land 0.062 0.021 0.009(0.042) (0.040) (0.033)
HHsize -0.022** 0.002 0.016**(0.010) (0.009) (0.007)
N. of females in the HH 0.023* -0.017 -0.026**(0.014) (0.013) (0.011)
N. of children in the HH (<5years-old) 0.034 0.024 0.035**(0.021) (0.020) (0.016)
Residence 5 or more years (dummy) -0.032 0.080* 0.004(0.044) (0.042) (0.034)
Ethnicity-Ronga 0.159*** 0.080 0.017(0.055) (0.052) (0.042)
Ethnicity-Chope 0.295** 0.071 0.194*(0.132) (0.125) (0.102)
Ethnicity-Other minorities 0.049 0.199** 0.100(0.095) (0.090) (0.074)
Religion-Catholic -0.032 0.029 0.005(0.060) (0.057) (0.046)
Religion-Presbyterian -0.191* -0.019 -0.072(0.101) (0.095) (0.077)
Religion-Methodist -0.144* 0.013 0.132**(0.086) (0.081) (0.066)
Religion-Anglican -0.201 -0.327** -0.104(0.174) (0.165) (0.134)
Religion-Baptist -0.269** -0.186 -0.147(0.136) (0.129) (0.105)
Religion-Adventist -0.255** -0.306** 0.269***(0.128) (0.121) (0.098)
Religion-Islam 0.121 -0.137 -0.117(0.156) (0.148) (0.120)
Religion-Tradition spiritsm -0.090* 0.028 -0.004(0.051) (0.049) (0.039)
Religion (NS/NR) -0.157** 0.010 0.012(0.067) (0.063) (0.051)
Wealth index 0.000 -0.006 0.015**(0.009) (0.009) (0.007)
Urban area 0.056 -0.131 0.232(0.360) (0.341) (0.278)
Constant 0.813*** 0.189 0.205*(0.144) (0.136) (0.111)
Observations 905 905 905R-squared 0.064 0.057 0.083N. of community fixed effects 42 42 42Robust standard errors clustered at community level in parentheses; *** p<0.01, ** p<0.05, * p<0.1.
Impact of migration and remittances on informal social interaction (c)
Notes: (a) Give or receive is a binary viariable equal to 1 if the household exchanged (i.e. give or receive) any good or service with anyimportant person in the community in the last month, i.e. with the traditional leader, elected leader, teacher, agricultural agent, priest,neighbors, health provider, healer, employer. (b) Expenses in ceremonies is a binary variable equal to 1 if the HH has espent money orgoods on community ceremonies in the last year. (c) All regressions use fixed effects at the community level. The excluded categories are:no education, Changana, no religion.

Table 10 Impact on the Direction of informal social inrections
Linear probability models (standard errors in brackets)
Give ReceiveGive & receive (mutual help)
N. of current migrants in the HH -0.032** -0.015 -0.021**(0.014) (0.012) (0.008)
HH receives remittances 0.127*** 0.092*** 0.080***(0.035) (0.031) (0.021)
HH and community Controls yes yes yesCommunity fixed effects (42) yes yes yesObs. 905 905 905Robust standard errors clustered at community level in parentheses; *** p<0.01, ** p<0.05, * p<0.1. Notes: (a) Give (receive) is a binary viariable equal to 1 if the HH gave without receiving (received withoutgiving) any good or service to any important person in the community in the last month, i.e. with the traditionalleader, elected leader, teacher, agricultural agent, priest, neighbors, health provider, healer, employer. (b) Give&Received (mutual help) is a binary variable equal to 1 if the HH exchanged something (gave&received)
with any important person in the community. (c) All regressions use fixed effects at the community level. The
excluded categories are: no education, Changana, no religion. Table 11
Linear probability models (standard errors in brackets)
Group particip.
Daily talk frequency
Give or receive
Expenses on ceremonies
Give ReceiveGive & receive (mutual help)
Return migration (c) 0.058*** -0.023 0.064*** 0.073*** 0.088*** 0.020 0.044***(0.021) (0.022) (0.021) (0.017) (0.018) (0.016) (0.011)
Controls yes yes yes yes yes yes yesObservations 905 905 905 905 905 905 905N. of communities 42 42 42 42 42 42 42Robust standard errors clustered at community level in parentheses; *** p<0.01, ** p<0.05, * p<0.1.
Impact of return migration on group participation and informal social interactions

Table 12
(1) (2) (3) (4) (5) (6)
2SLS (a) 3SLS (b) 2SLS (a) 3SLS (b) 2SLS (a) 3SLS (b)
Number of current migrants in the HH -0.313** -0.432*** -0.199** -0.239** -0.231* -0.361***(0.134) (0.130) (0.089) (0.093) (0.136) (0.122)
HH receives remittances 1.068** 1.287*** 0.627** 0.605* 0.872* 1.206***(0.524) (0.477) (0.309) (0.335) (0.514) (0.459)
HH Controls yes yes yes yes yes yesCommunity Controls yes yes yes yes no noCommunity fixed effects (42) no no no no yes yesObservations 905 905 905 905 905 905Overid. Sargan test (Chi-sq.)P-value
Migration Remittances Migration Remittances Migration RemittancesInstruments:Relatives migrated before the war 0.165*** 0.077** 0.164*** 0.076** 0.177*** 0.081***
(0.064) (0.028) (0.064) (0.028) (0.061) (0.029)N.of male hh members age 20-30 in 2005 0.376*** 0.073*** 0.373*** 0.068*** 0.345*** 0.057***
(0.049) (0.022) (0.50) (0.022) (0.038) (0.018)Short-run rainfall deviation 2.145 3.217**
(3.760) (1.837)Permanent jobc ontract of migrants 0.837*** 0.249*** 0.835*** 0.248*** 0.888*** 0.266***
(0.095) (0.039) (0.095) (0.038) (0.067) (0.032)Community remittances rate 0.003 0.006**
(0.004) (0.002)HH Controls yes yes yes yes yes yesCommunity Controls yes yes yes yes no noCommunity fixed effects (42) no no no no yes yesObservations 905 905 905 905 905 905
Joint F-test on all instruments (a)43.5 23.59 44.81 24.54 112.7 35.07
P-value 0.00 0.00 0.00 0.00 0.00 0.00
Joint F-test on two instr. (3SLS results)(b)42.36 4.31 42.36 7.1 42.36 6.57
P-value 0.00 0.02 0.00 0.00 0.00 0.01
Robust standard errors clustered at community level in parentheses; *** p<0.01, ** p<0.05, * p<0.1. Notes: (1) and (2) Instruments include migration experience before war, the number of male household members beween 20 and 30 years old in 2005, whether household
migrant members have a permanent job contract at destination and short-run rainfall deviation (measured as rainfall in 2007 minus the average historical rainfall since 1979).
(3) and (4) replace the latter instrument with the remittances rate in the community of residence. (5) and (6) use household level instruments only (i.e. migration experience
before war, the number of male household members beween 20 and 30 years old in 2005, whether household migrant members have a permanent job contract at destination).
(a) All instruments for each endogenous variable are excluded. (b) Two different instruments for each endogenous variable are excluded (migration experience before war
and the number of adult males beween 20 and 30 years old in 2005 are always excluded from the migration equation).
PANEL A: IV regression estimates of the impact of migration and remittances on group participation
Dependent variablePANEL B: First stage results of 2SLS
2.6120.271
2.4690.291
6.2420.0125
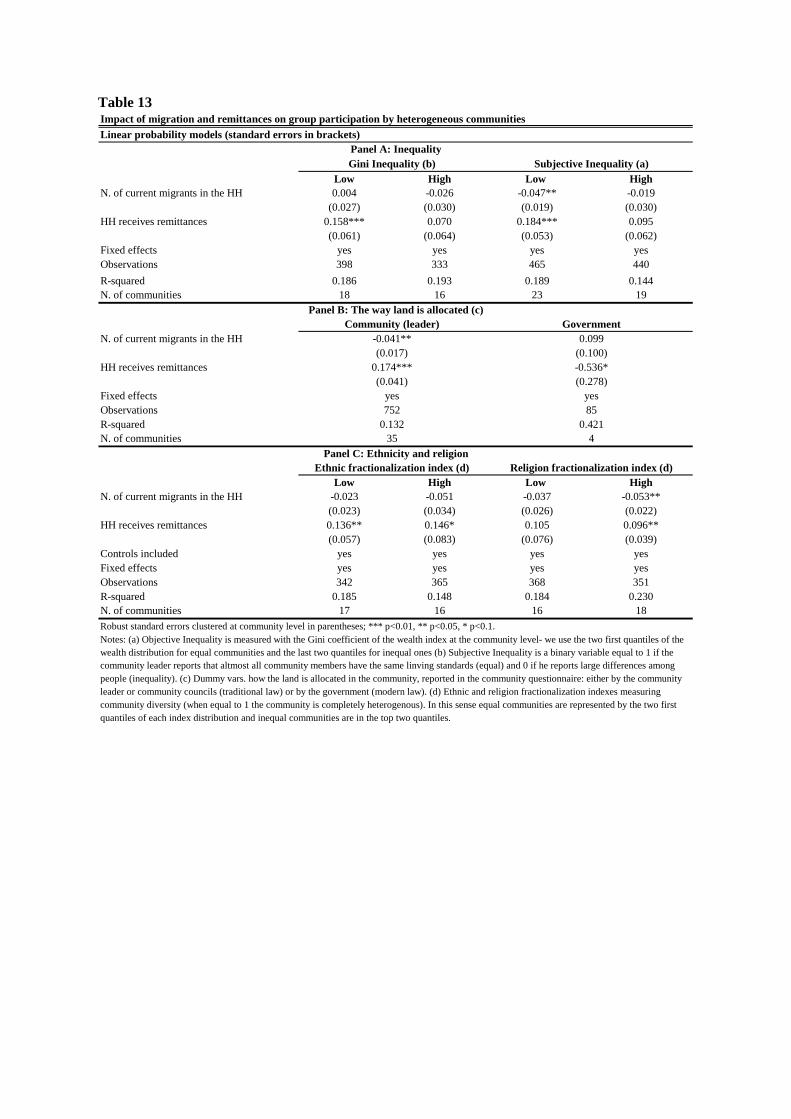
Table 13 Impact of migration and remittances on group participation by heterogeneous communities
Linear probability models (standard errors in brackets)
Low High Low HighN. of current migrants in the HH 0.004 -0.026 -0.047** -0.019
(0.027) (0.030) (0.019) (0.030)HH receives remittances 0.158*** 0.070 0.184*** 0.095
(0.061) (0.064) (0.053) (0.062)Fixed effects yes yes yes yesObservations 398 333 465 440
R-squared 0.186 0.193 0.189 0.144N. of communities 18 16 23 19
N. of current migrants in the HH
HH receives remittances
Fixed effectsObservationsR-squaredN. of communities
Low High Low HighN. of current migrants in the HH -0.023 -0.051 -0.037 -0.053**
(0.023) (0.034) (0.026) (0.022)HH receives remittances 0.136** 0.146* 0.105 0.096**
(0.057) (0.083) (0.076) (0.039)Controls included yes yes yes yesFixed effects yes yes yes yesObservations 342 365 368 351R-squared 0.185 0.148 0.184 0.230N. of communities 17 16 16 18
Robust standard errors clustered at community level in parentheses; *** p<0.01, ** p<0.05, * p<0.1. Notes: (a) Objective Inequality is measured with the Gini coefficient of the wealth index at the community level- we use the two first quantiles of the wealth distribution for equal communities and the last two quantiles for inequal ones (b) Subjective Inequality is a binary variable equal to 1 if the community leader reports that altmost all community members have the same linving standards (equal) and 0 if he reports large differences among people (inequality). (c) Dummy vars. how the land is allocated in the community, reported in the community questionnaire: either by the community leader or community councils (traditional law) or by the government (modern law). (d) Ethnic and religion fractionalization indexes measuring community diversity (when equal to 1 the community is completely heterogenous). In this sense equal communities are represented by the two first quantiles of each index distribution and inequal communities are in the top two quantiles.
Panel A: InequalityGini Inequality (b)
Panel B: The way land is allocated (c)
Subjective Inequality (a)
Community (leader) Government
35
Ethnic fractionalization index (d) Religion fractionalization index (d)Panel C: Ethnicity and religion
yes752
0.13285
0.421
yes
4
-0.041**(0.017)
0.174***(0.041)
0.099(0.100)-0.536*(0.278)

Appendix Table A.1.
Summary statistics at household level
Mean s.d.Number of current migrants in the HH 1.59 (1.18)HH receives remittances 24% (0.43)Female HH head 39% (0.49)Age of HH head 46.27 (17.5)HH head education- primary 46% (0.5)HH head education- secondary or more 11% (0.31)HH head occupation- farmer 43% (0.5)HH operating land 79% (0.41)HHsize 5.03 (2.87)Number of females in the HH 2.91 (1.89)Number of children in the HH (<5years-old) 0.71 (0.88)Residence 5 or more years (dummy) 85% (0.36)Ethnicity-Ronga 11% (0.31)Ethnicity-Chope 1% (0.11)Ethnicity-Other minorities 3% (0.17)Religion-Catholic 17% (0.38)Religion-Presbyterian 3% (0.17)Religion-Methodist 5% (0.22)Religion-Anglican 1% (0.08)Religion-Baptist 1% (0.11)Religion-Adventist 2% (0.12)Religion-Islam 1% (0.1)Religion-Tradition spiritsm 48% (0.5)Religion (NS/NR) 12% (0.32)Wealth index -0.14 (2.13)Urban area 22% (0.42)Community with paved-road 15% (0.36)Community with primary school 77% (0.42)Community with a Bank 6% (0.23)Community with a market 43% (0.49)Health service provider 27% (0.45)

Table A.2
Probit Marginal effects (standard errors in brackets)1 2 3 (b)
N. of current migrants in the HH -0.056** -0.048** -0.040*(0.024) (0.024) (0.021)
HH receives remittances 0.135*** 0.178*** 0.193***(0.048) (0.065) (0.062)
Female HH head 0.052 0.058(0.044) (0.039)
Age of HH head 0.004 0.005(0.007) (0.006)
Age of HH head squared -0.000 -0.000(0.000) (0.000)
HH head education- primary 0.030 0.016(0.039) (0.042)
HH head education- secondary or more 0.300*** 0.276***(0.081) (0.093)
HH head occupation- farmer 0.075* 0.096**(0.043) (0.040)
HH operating land 0.028 0.023(0.053) (0.047)
HHsize 0.016 0.010(0.010) (0.011)
N. of females in the HH -0.042*** -0.044***(0.010) (0.015)
N. of children in the HH (<5years-old) 0.049* 0.050**(0.027) (0.025)
Residence 5 or more years (dummy) 0.086** 0.072*(0.039) (0.042)
Ethnicity-Ronga 0.151** 0.188**(0.062) (0.091)
Ethnicity-Chope 0.270 0.173(0.224) (0.198)
Ethnicity-Other minorities 0.271*** 0.205(0.102) (0.129)
Religion-Catholic 0.023 0.117(0.067) (0.087)
Religion-Presbyterian -0.120* -0.007(0.072) (0.116)
Religion-Methodist 0.270** 0.310*(0.129) (0.163)
Religion-Baptist -0.082 0.171(0.145) (0.205)
Religion-Adventist 0.192 0.299*(0.183) (0.165)
Religion-Islam -0.002 0.005(0.180) (0.158)
Religion-Tradition spiritsm 0.132** 0.116*(0.064) (0.059)
Religion (NS/NR) -0.139*** -0.048(0.049) (0.076)
Wealth index 0.035*** 0.023**(0.009) (0.010)
Urban area 0.192*** 0.001(0.065) (0.113)
Community with paved-road -0.067(0.094)
Community with primary school 0.123**(0.052)
Community with a Bank -0.039(0.093)
Community with a market -0.065(0.104)
Health service provider 0.065(0.124)
Observations 905 905 905N. of communities 42Robust standard errors clustered at community level in parentheses; *** p<0.01, ** p<0.05, * p<0.1.
Impact of migration and remittances on group participation (a)
Notes: (a) The dependent variable of all regressions is a binary variable equal to 1 if any member of the household has participated in any community group. (b) Column 3 shows estimates with fixed effects at the community level.

Table A.3
Probit Marginal effects (standard errors in brackets)
Daily talk frequency
Give or receive
Expenses on ceremonies
Give ReceiveGive & receive (mutual help)
Number of current migrants in the HH -0.021 -0.017 0.001 -0.039** -0.003 -0.010**(0.019) (0.021) (0.014) (0.016) (0.015) (0.005)
HH receives remittances 0.038 0.177*** 0.072* 0.157*** 0.124*** 0.074***(0.046) (0.055) (0.040) (0.052) (0.044) (0.027)
HH controls included yes yes yes yes yes yesCommunity controls included yes yes yes yes yes yesObservations 905 905 905 905 905 905
Robust standard errors clustered at community level in parentheses; *** p<0.01, ** p<0.05, * p<0.1.
Impact of migration and remittances on informal social interactions
Notes: (a) All dependent variables are defined as in table 7 and directions. (b) By using probit regressions, some community fixed effects perfectlypredict failures, requiring us to drop many observations from probit regressions. Adjusting the sample for each different regression specification wouldmake it difficult to compare results across specifications, so that in this table we present probit regressions using our baseline set of community controlsinstead of fixed effects.