Embed Size (px)
Citation preview
Lab 2: Conservation of Momentum
I. Before you come to lab...
II. Background
III. Introduction
A. This lab will give you an opportunity to explore the conservation of momentum in an interesting physical system: the Gauss gun. As
you saw in lecture and in the online videos, the Gauss gun can be used to shoot steel ball bearings at high speeds. The details are
complicated because they involve magnetic forces, which we won't cover in this course. However, the beauty of momentum
conservation is that we don't have to know or care about the details of the interaction: we just look at the initial momentum and the
final momentum and compare them. Are they the same?
B. Objectives for this lab:
1. Investigate conservation of momentum
2. Learn to estimate reading errors
3. Understand and apply error propagation
4. Learn how to use the video analysis features of Logger Pro
5. Learn how to design your own experimental procedures
IV. Materials
A. Magnet, 3 steel ball bearings, and some track
1. What they are: a magnet, 3 steel ball bearings, and some pieces of track. (Your TFs can tell you the masses of the magnet and
balls.)
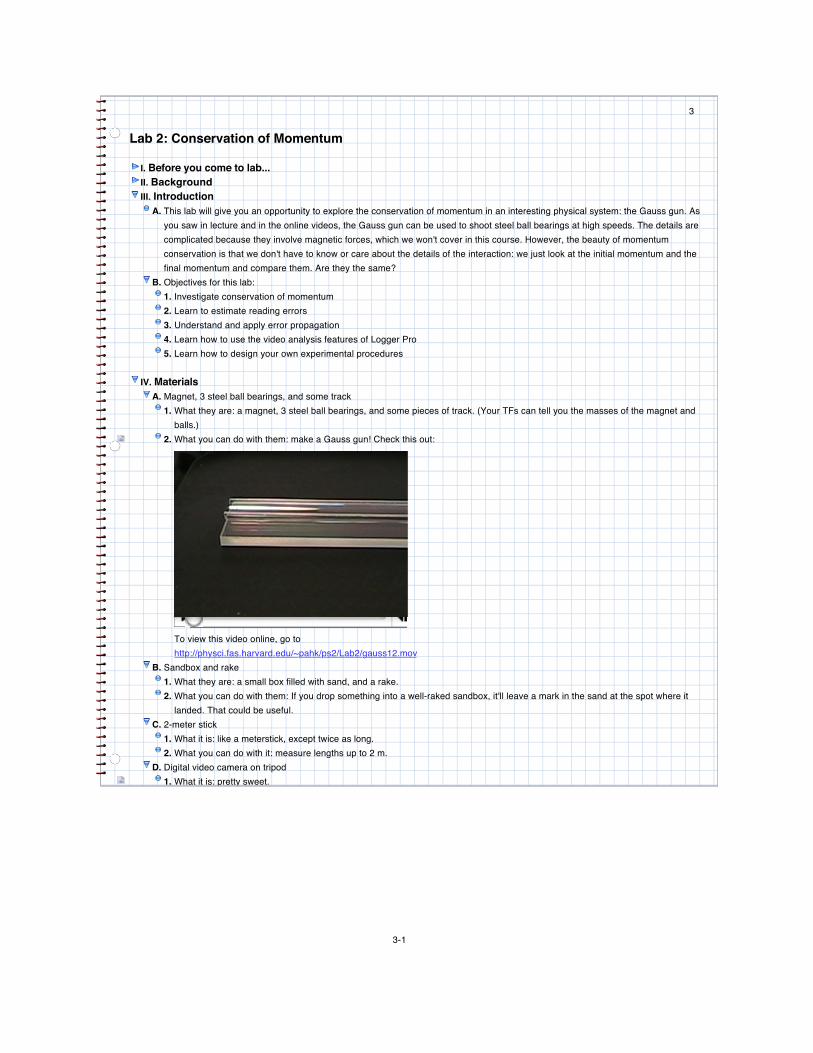
2. What you can do with them: make a Gauss gun! Check this out:
To view this video online, go to
http://physci.fas.harvard.edu/~pahk/ps2/Lab2/gauss12.mov
B. Sandbox and rake
1. What they are: a small box filled with sand, and a rake.
2. What you can do with them: If you drop something into a well-raked sandbox, it'll leave a mark in the sand at the spot where it
landed. That could be useful.
C. 2-meter stick
1. What it is: like a meterstick, except twice as long.
2. What you can do with it: measure lengths up to 2 m.
D. Digital video camera on tripod
1. What it is: pretty sweet.
3-1
3
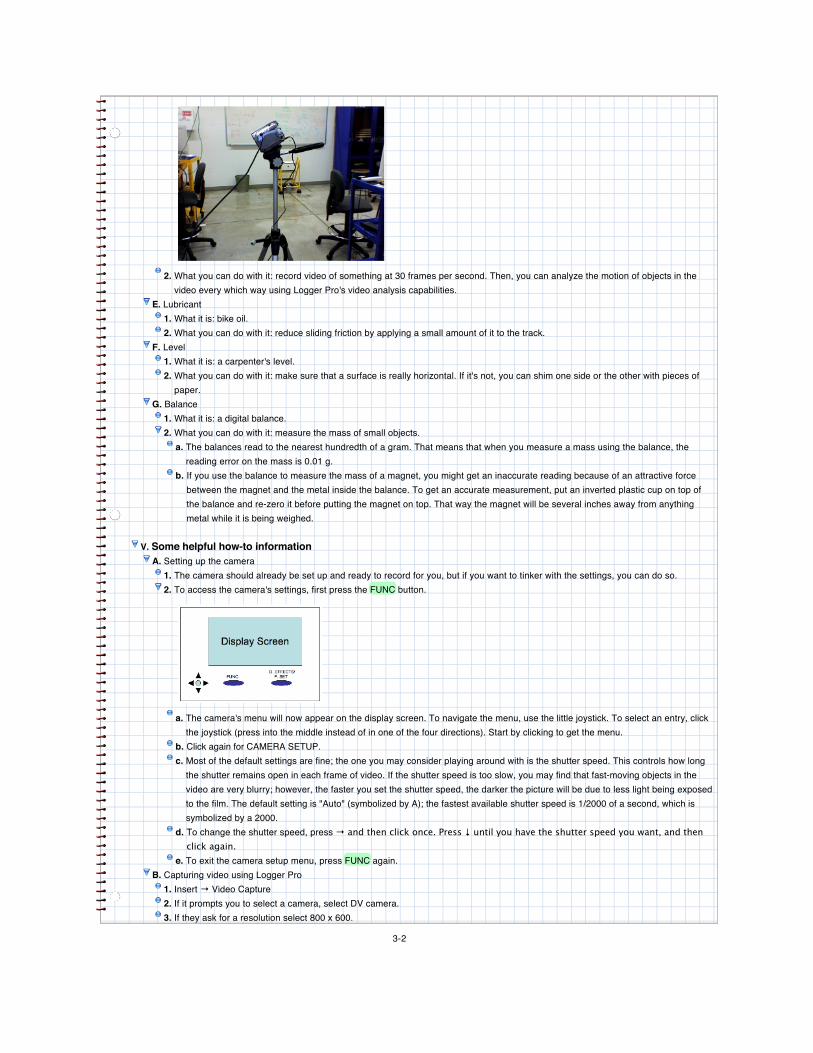
2. What you can do with it: record video of something at 30 frames per second. Then, you can analyze the motion of objects in the
video every which way using Logger Pro's video analysis capabilities.
E. Lubricant
1. What it is: bike oil.
2. What you can do with it: reduce sliding friction by applying a small amount of it to the track.
F. Level
1. What it is: a carpenter's level.
2. What you can do with it: make sure that a surface is really horizontal. If it's not, you can shim one side or the other with pieces of
paper.
G. Balance
1. What it is: a digital balance.
2. What you can do with it: measure the mass of small objects.
a. The balances read to the nearest hundredth of a gram. That means that when you measure a mass using the balance, the
reading error on the mass is 0.01 g.
b. If you use the balance to measure the mass of a magnet, you might get an inaccurate reading because of an attractive force
between the magnet and the metal inside the balance. To get an accurate measurement, put an inverted plastic cup on top of
the balance and re-zero it before putting the magnet on top. That way the magnet will be several inches away from anything
metal while it is being weighed.
V. Some helpful how-to information
A. Setting up the camera
1. The camera should already be set up and ready to record for you, but if you want to tinker with the settings, you can do so.
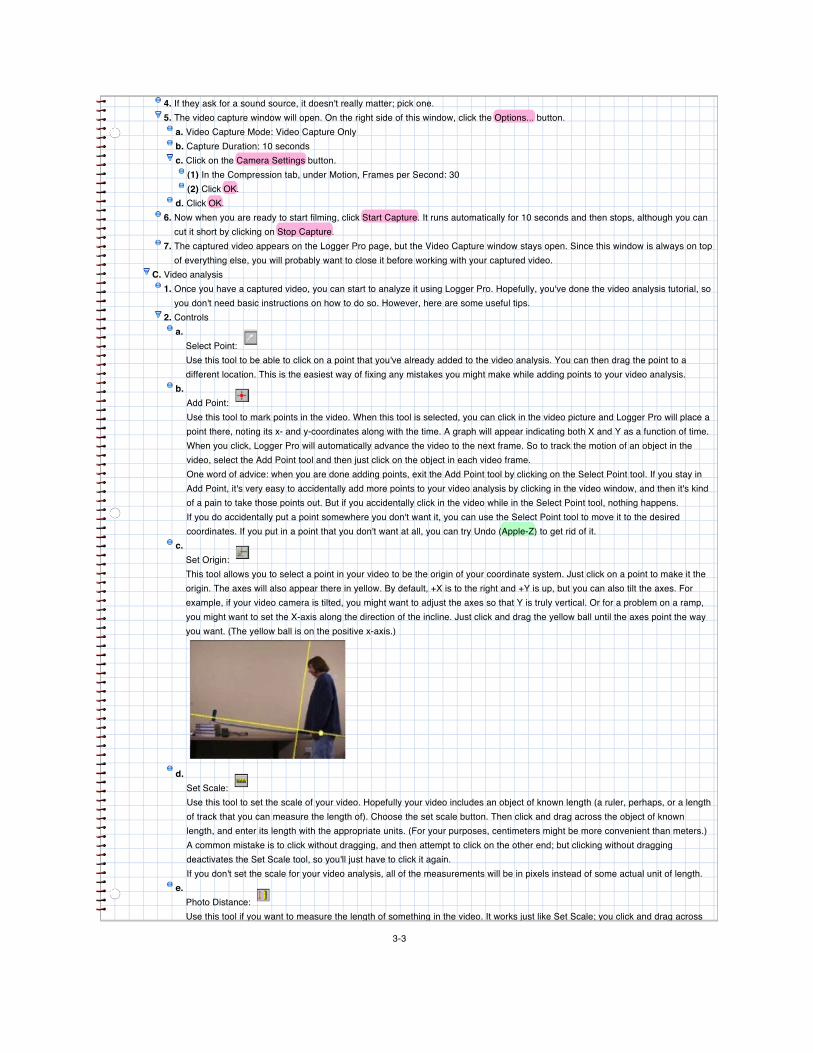
2. To access the camera's settings, first press the FUNC button.
a. The camera's menu will now appear on the display screen. To navigate the menu, use the little joystick. To select an entry, click
the joystick (press into the middle instead of in one of the four directions). Start by clicking to get the menu.
b. Click again for CAMERA SETUP.
c. Most of the default settings are fine; the one you may consider playing around with is the shutter speed. This controls how long
the shutter remains open in each frame of video. If the shutter speed is too slow, you may find that fast-moving objects in the
video are very blurry; however, the faster you set the shutter speed, the darker the picture will be due to less light being exposed
to the film. The default setting is "Auto" (symbolized by A); the fastest available shutter speed is 1/2000 of a second, which is
symbolized by a 2000.
d. To change the shutter speed, press ! and then click once. Press " until you have the shutter speed you want, and then
click again.
e. To exit the camera setup menu, press FUNC again.
B. Capturing video using Logger Pro
1. Insert ! Video Capture
2. If it prompts you to select a camera, select DV camera.
3. If they ask for a resolution select 800 x 600.
3-2
4. If they ask for a sound source, it doesn't really matter; pick one.
5. The video capture window will open. On the right side of this window, click the Options... button.
a. Video Capture Mode: Video Capture Only
b. Capture Duration: 10 seconds
c. Click on the Camera Settings button.
(1) In the Compression tab, under Motion, Frames per Second: 30
(2) Click OK.
d. Click OK.
6. Now when you are ready to start filming, click Start Capture. It runs automatically for 10 seconds and then stops, although you can
cut it short by clicking on Stop Capture.
7. The captured video appears on the Logger Pro page, but the Video Capture window stays open. Since this window is always on top
of everything else, you will probably want to close it before working with your captured video.
C. Video analysis
1. Once you have a captured video, you can start to analyze it using Logger Pro. Hopefully, you've done the video analysis tutorial, so
you don't need basic instructions on how to do so. However, here are some useful tips.
2. Controls
a.
Select Point:
Use this tool to be able to click on a point that you've already added to the video analysis. You can then drag the point to a
different location. This is the easiest way of fixing any mistakes you might make while adding points to your video analysis.
b.
Add Point:
Use this tool to mark points in the video. When this tool is selected, you can click in the video picture and Logger Pro will place a
point there, noting its x- and y-coordinates along with the time. A graph will appear indicating both X and Y as a function of time.
When you click, Logger Pro will automatically advance the video to the next frame. So to track the motion of an object in the
video, select the Add Point tool and then just click on the object in each video frame.
One word of advice: when you are done adding points, exit the Add Point tool by clicking on the Select Point tool. If you stay in
Add Point, it's very easy to accidentally add more points to your video analysis by clicking in the video window, and then it's kind
of a pain to take those points out. But if you accidentally click in the video while in the Select Point tool, nothing happens.
If you do accidentally put a point somewhere you don't want it, you can use the Select Point tool to move it to the desired
coordinates. If you put in a point that you don't want at all, you can try Undo (Apple-Z) to get rid of it.
c.
Set Origin:
This tool allows you to select a point in your video to be the origin of your coordinate system. Just click on a point to make it the
origin. The axes will also appear there in yellow. By default, +X is to the right and +Y is up, but you can also tilt the axes. For
example, if your video camera is tilted, you might want to adjust the axes so that Y is truly vertical. Or for a problem on a ramp,
you might want to set the X-axis along the direction of the incline. Just click and drag the yellow ball until the axes point the way
you want. (The yellow ball is on the positive x-axis.)
d.
Set Scale:
Use this tool to set the scale of your video. Hopefully your video includes an object of known length (a ruler, perhaps, or a length
of track that you can measure the length of). Choose the set scale button. Then click and drag across the object of known
length, and enter its length with the appropriate units. (For your purposes, centimeters might be more convenient than meters.)
A common mistake is to click without dragging, and then attempt to click on the other end; but clicking without dragging
deactivates the Set Scale tool, so you'll just have to click it again.
If you don't set the scale for your video analysis, all of the measurements will be in pixels instead of some actual unit of length.
e.
Photo Distance:
Use this tool if you want to measure the length of something in the video. It works just like Set Scale; you click and drag across
3-3
some length but instead of you telling Logger Pro how long it is, it tells you. (This only works, of course, if you have already set
the scale. If you haven't, it will tell you the "length" in pixels.)
f.
Set Active Point:
This is a really useful tool. It enables you to track the positions of multiple objects in the video. By default, there is only one "point
series" in a video analysis, which is fine if you want to follow only a single object. But you can track the motions of multiple objects
at the same time by clicking on the Set Active Point button and then selecting "Add Point Series." Then you'll be able to add
points in a different color, and the coordinates of those points will be called X2 and Y2. You can do this multiple times, although I
wouldn't advise having more than three point series going at once. Once you have multiple series, you can also use the Set
Active Point tool to toggle between them. For instance, you might want to go back and add a point or two to the original series (X,
Y).
3. You don't have to add a point in every single video frame. By all means, only look at the time slice you are interested in! The best
way to do this is step through the video using the and buttons (or by dragging the scroll slider at the bottom of the video
window) until you are queued up at the time just before interesting things start to happen. Then you can start to add points. Also, if
you like, you can just skip some frames in the middle by clicking , and then add more points later. Logger Pro doesn't mind if
there are unmarked frames in the middle of your video analysis; it just records the points that you do put in.
D. Zooming on a Macintosh
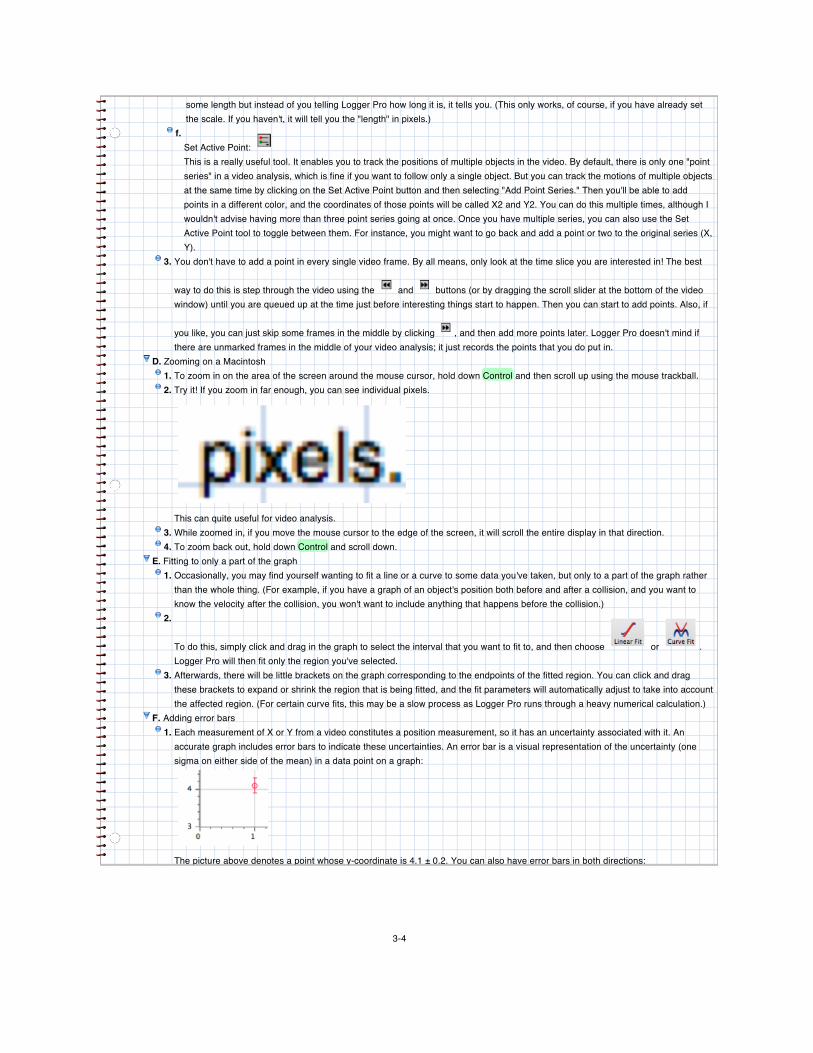
1. To zoom in on the area of the screen around the mouse cursor, hold down Control and then scroll up using the mouse trackball.
2. Try it! If you zoom in far enough, you can see individual pixels.
This can quite useful for video analysis.
3. While zoomed in, if you move the mouse cursor to the edge of the screen, it will scroll the entire display in that direction.
4. To zoom back out, hold down Control and scroll down.
E. Fitting to only a part of the graph
1. Occasionally, you may find yourself wanting to fit a line or a curve to some data you've taken, but only to a part of the graph rather
than the whole thing. (For example, if you have a graph of an object's position both before and after a collision, and you want to
know the velocity after the collision, you won't want to include anything that happens before the collision.)
2.
To do this, simply click and drag in the graph to select the interval that you want to fit to, and then choose or .
Logger Pro will then fit only the region you've selected.
3. Afterwards, there will be little brackets on the graph corresponding to the endpoints of the fitted region. You can click and drag
these brackets to expand or shrink the region that is being fitted, and the fit parameters will automatically adjust to take into account
the affected region. (For certain curve fits, this may be a slow process as Logger Pro runs through a heavy numerical calculation.)
F. Adding error bars
1. Each measurement of X or Y from a video constitutes a position measurement, so it has an uncertainty associated with it. An
accurate graph includes error bars to indicate these uncertainties. An error bar is a visual representation of the uncertainty (one
sigma on either side of the mean) in a data point on a graph:
The picture above denotes a point whose y-coordinate is 4.1 ± 0.2. You can also have error bars in both directions:
3-4
This picture shows the point (1.0 ± 0.3, 4.1 ± 0.2).
2. To add error bars to a graph, first you have to specify the error of the column of data that is being graphed. Either find the column
in a data table and double-click on it, or click on the Data menu ! Column Options and find the column you want.
3. In the Column Options dialog box, click on the Options tab and check the box for Error Bar Calculations. The easiest option is to
use "Fixed Value" and "Error Constant +/-"; in the box, enter the numerical value of the uncertainty for each point (in the same units
as the column itself). Then click OK.
4. Now click the graph, and open the Graph Options dialog box (either by double-clicking in the graph, or going to Options ! Graph
Options). Uncheck the box for Point Protectors and click OK. You should see the error bars appear in the graph.
G. Calculating slopes
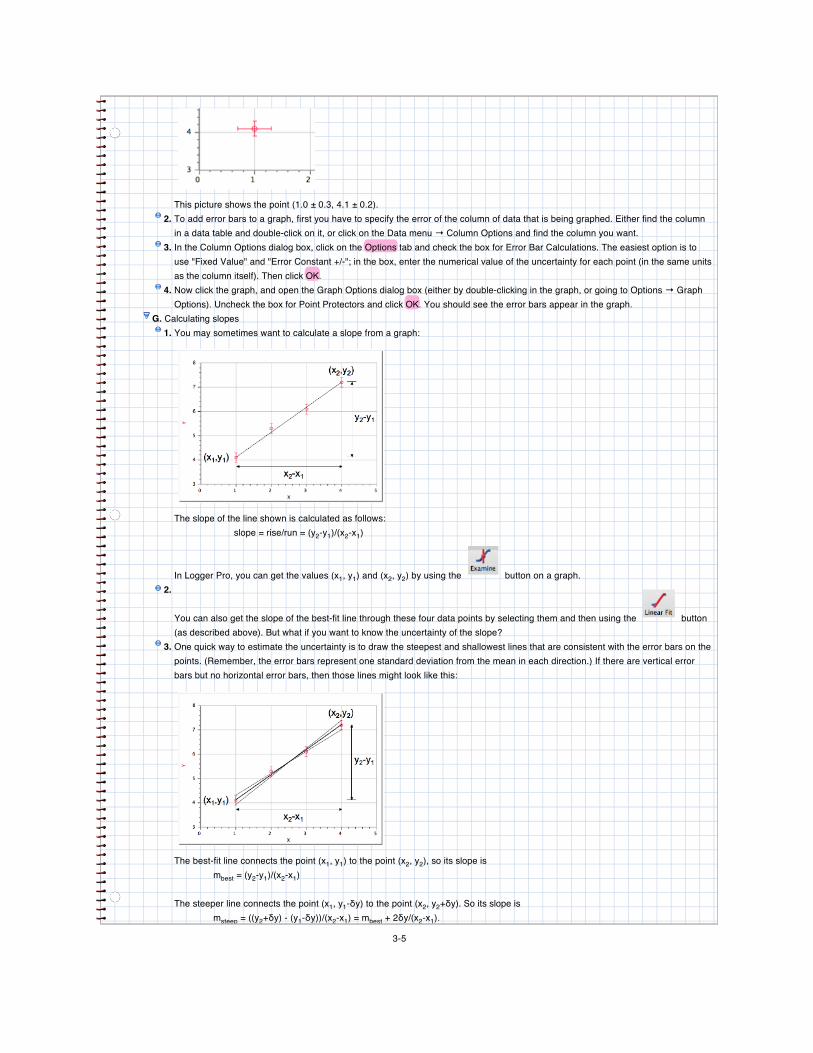
1. You may sometimes want to calculate a slope from a graph:
The slope of the line shown is calculated as follows:
slope = rise/run = (y2-y1)/(x2-x1)
In Logger Pro, you can get the values (x1, y1) and (x2, y2) by using the button on a graph.
2.
You can also get the slope of the best-fit line through these four data points by selecting them and then using the button
(as described above). But what if you want to know the uncertainty of the slope?
3. One quick way to estimate the uncertainty is to draw the steepest and shallowest lines that are consistent with the error bars on the
points. (Remember, the error bars represent one standard deviation from the mean in each direction.) If there are vertical error
bars but no horizontal error bars, then those lines might look like this:
The best-fit line connects the point (x1, y1) to the point (x2, y2), so its slope is
mbest = (y2-y1)/(x2-x1)
The steeper line connects the point (x1, y1-!y) to the point (x2, y2+!y). So its slope is
msteep = ((y2+!y) - (y1-!y))/(x2-x1) = mbest + 2!y/(x2-x1).
3-5
The shallower line connects the point (x1, y1+!y) to the point (x2, y2-!y). Its slope is
mshallow = ((y2-!y) - (y1+!y))/(x2-x1) = mbest - 2!y/(x2-x1).
So you could estimate the uncertainty in the slope from this procedure as !m = 2!y/(x2-x1).
VI. Procedure
A. Before you begin:
1. Take a picture of yourselves using Photo Booth and drag it into the space below:
2. Tell us your names:
B. At the start of lab, discuss your ideas for the procedure with your lab partners. Play around with the magnet and ball bearings and see
what you can set up. Play around with the camera and Logger Pro and see what you can measure. Eventually, you and your lab
group should decide on a procedure. Write it out in full detail below. When you have finished, discuss your plan with your lab TF to
see if she has any helpful advice. Then put your plan into action! Be sure to keep track of any uncertainties that may crop up.
Two warnings about your procedure:
1. Even if you use the bike oil, friction can't be totally eliminated. You need to come up with a plan to measure and/or account for
friction in some way. Talk to your TFs about this.
2. Occasionally, when the balls collide with the magnet, there is a lot of "extra" movement in directions other than along the length of
the track. This will result in the magnet and balls wobbling back and forth and can lead to a very bad measurement. If this happens
to you, just repeat the experiment instead of spending a lot of time analyzing bad data.
C. Use this space to write out your procedure. Be sure to clearly explain what you intend to measure and how. If it helps, you can write it
on a piece of paper and take a picture of it using Photo Booth, just as you did for your group photo.
D. Use this space (and below) to record your measurements, observations, data, graphs, and analysis. Insert as many cells as you want.
E. So, was momentum conserved within your experimental uncertainty? What was the uncertainty?
1. If momentum was not conserved, in which direction was the change in momentum of the system?
2. Can you think of any explanation for why the system's momentum would change in this direction?
VII. Conclusion
A. Submit your lab report online according to the instructions on the plastic sheet at your computer.
B. Super-duper important—don't even think about skipping this step! Before you leave the lab, every member of your lab group
should open a browser and go to
http://physci.fas.harvard.edu/~yourFASusername
and make sure that your lab report is there under the link called "Lab 2." If not, then you haven't submitted it correctly; ask a TF for
help. If your lab report isn't submitted, you won't get credit for doing the lab.
3-6