Embed Size (px)
Citation preview

L05 The Impulse-Momentum Theorem 1
Pre-Lab Exercises Full Name: Lab Section: Hand this in at the beginning of the lab period. The grade for these exercises will be included in your lab grade this week.
1. What formula is typically used to represent the impulse-momentum theorem? 2. If M 1 is firmly attached to the incline, draw a free body diagram for M2.
3. What is the net force on M2 using the designated coordinate system?
4. For a given change in momentum, what effect will a longer time period have on the net
impulse?
L05 The Impulse-Momentum Theorem 2
The Impulse-Momentum Theorem Full Name: Lab Partners’ Names: Lab Section: Introduction: The Impulse-Momentum Theorem finds use in many different daily situations, but it is particularly noticeable as the reason for airbags in automobiles. The airbag causes the same change in momentum, and hence the same impulse, but spreads the impulse out over a longer time interval, thus reducing the magnitude of the force on the passenger. The purpose of this experiment is to confirm the Impulse-Momentum Theorem within the limits of experimental error. Equipment:
Science Workshop Interface Dynamics Track Magnetic Dynamics Cart Motion Sensor Magnetic Force Sensor
Bubble Level Black Bar Masses Balance (500 grams +) Force Sensor Bracket. Wooden Blocks
Procedure: 1. Setting Up the Equipment:
1.1. Open data studio and find the Motion Digital Sensor and Force Analog Sensor. Connect them to the science workshop interface.
1.2. Click on the Force Sensor icon and set the sample rate to 200 Hz.
Click on the Motion Sensor Icon and set the sample rate to 100 Hz.
1.3. Go to the display frame on the upper left. Double click “position” and under the
“General” tab, set precision to three. Do the same thing for “velocity” and “force”.
1.4. Under the display window on the lower left, select “graph”. Select “force” as the desired graph output.
L05 The Impulse-Momentum Theorem 3
1.5. Click on the “Calculate” button in the main toolbar to define the momentum function: 1.5.1 Input the formula for momentum and click “Apply”. 1.5.2 Define the mass as a constant and type in the mass of the cart. Define the velocity as a data measurement and select “Velocity” from the menu.
1.5.3 In the Properties section, define the Name, Variable Name, and Variable Units appropriately.
1.5.4 Finally, click “Apply” again. You should now have a momentum data measurement in the pane to the left that is calculated from the velocity measurement of the Motion Sensor. Drag that momentum data onto the force vs. time graph. You should get a split screen graph with the time axes of both graphs lined up.
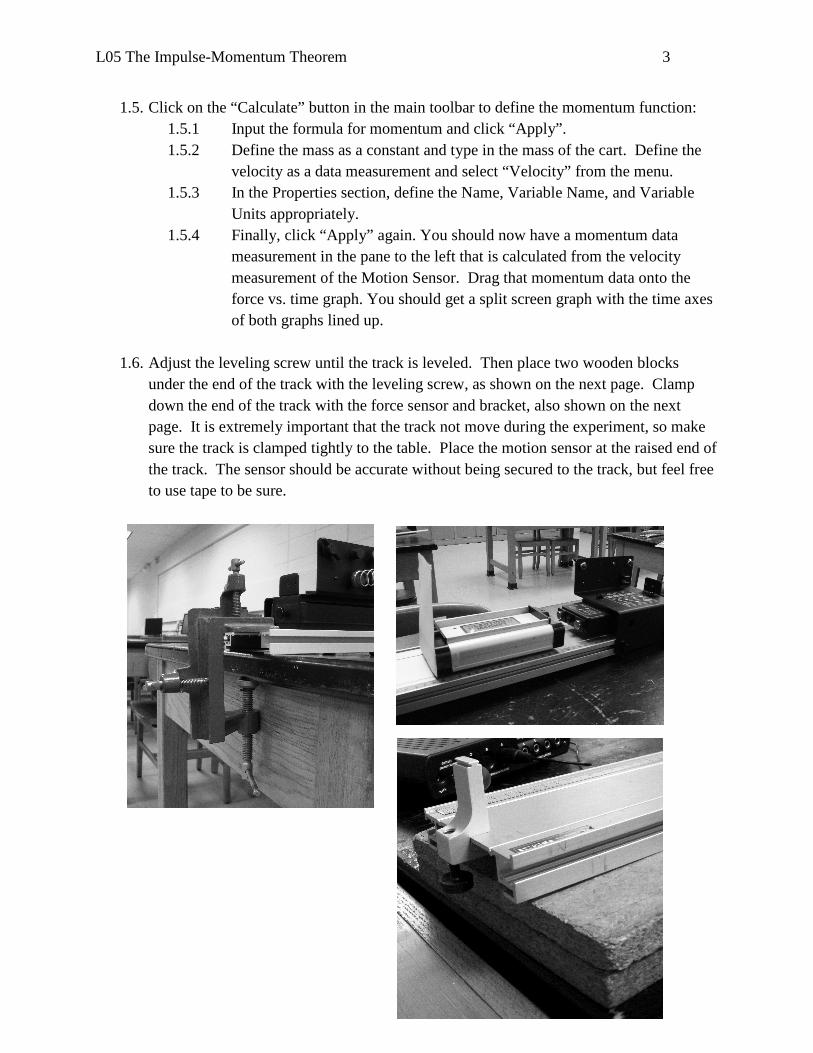
1.6. Adjust the leveling screw until the track is leveled. Then place two wooden blocks under the end of the track with the leveling screw, as shown on the next page. Clamp down the end of the track with the force sensor and bracket, also shown on the next page. It is extremely important that the track not move during the experiment, so make sure the track is clamped tightly to the table. Place the motion sensor at the raised end of the track. The sensor should be accurate without being secured to the track, but feel free to use tape to be sure.
L05 The Impulse-Momentum Theorem 4
2. Measuring the Impulse and Momentum: 2.1. Calculate the angle of the track and the acceleration of the cart due to gravity on the
inclined plane. Refer to your pre-lab or lab 2 if necessary. Record the angle and the acceleration in the table on the following page.
2.2. Measure the mass of the dynamics cart and one black mass, and record these values in the table. Tape a piece of white paper to the back of the cart. The back is the side of the cart that is not magnetic. Test this using the force sensor, which is also magnetic. They will repel each other.
2.3. Tare the force sensor by pushing the tare button through the hole in the side of the force sensor bracket. Make sure the cart is not exerting a force on the sensor when you tare. They are magnetic so the cart must be far away!
2.4. Place the cart about a third of the way up the track and record this position in the table. Make sure the magnetic side of the cart is facing the force sensor. Press the 'start' button to begin recording, and then release the cart, letting it roll towards the force sensor. Stop recording once the cart has bounced at least three times. Note: If the cart scatters off the track repeatedly, start the cart from a lesser distance up the incline.
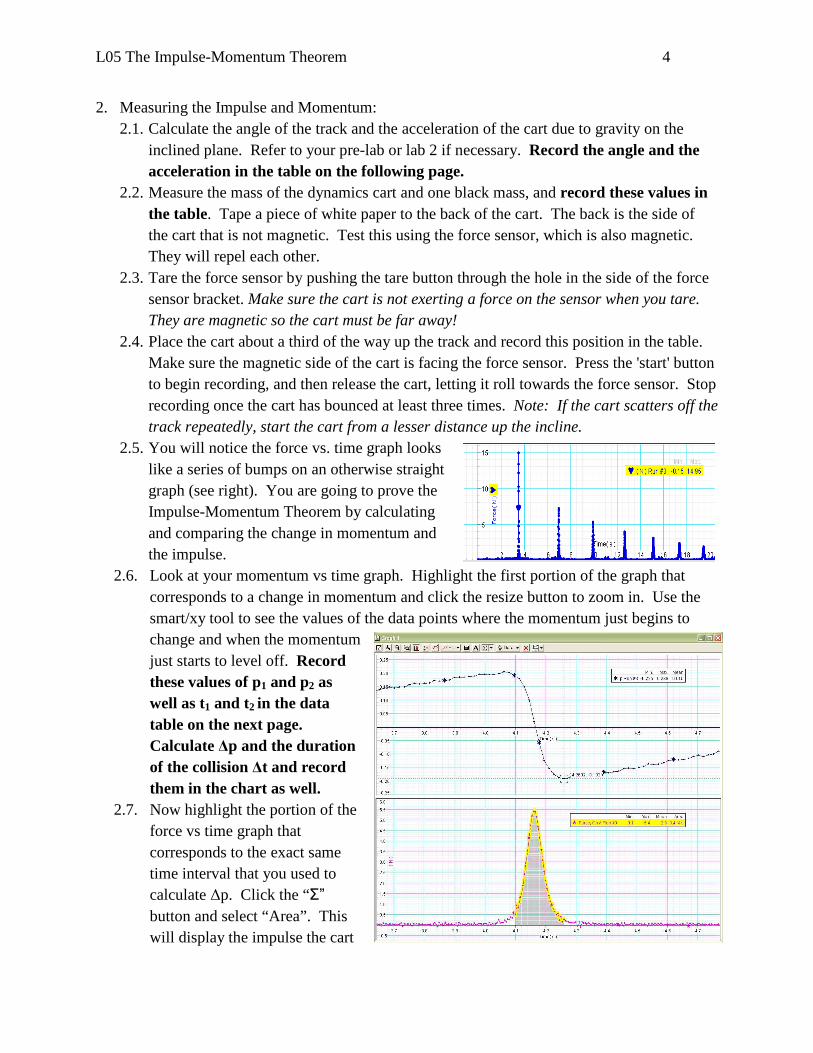
2.5. You will notice the force vs. time graph looks like a series of bumps on an otherwise straight graph (see right). You are going to prove the Impulse-Momentum Theorem by calculating and comparing the change in momentum and the impulse.
2.6. Look at your momentum vs time graph. Highlight the first portion of the graph that corresponds to a change in momentum and click the resize button to zoom in. Use the smart/xy tool to see the values of the data points where the momentum just begins to change and when the momentum just starts to level off. Record these values of p1 and p2 as well as t1 and t2 in the data table on the next page. Calculate ∆p and the duration of the collision ∆t and record them in the chart as well.
2.7. Now highlight the portion of the force vs time graph that corresponds to the exact same time interval that you used to calculate ∆p. Click the “Σ” button and select “Area”. This will display the impulse the cart
L05 The Impulse-Momentum Theorem 5
experienced during the duration Δt = t2 - t1. Record the impulse (area) in the table below.
2.8. Calculate the percent difference between your value for Impulse found from F∆t and Impulse found from ∆p. Record this Percent Difference in the table. If your percent difference is greater than 25%, check for errors and retake your data run if necessary.
2.9. Print a copy of your graph for one of your data runs. Also print a copy of one of your graphs zoomed in, with your ∆t selection highlighted on your force vs time graph and one of the endpoints shown using the smart/xy tool (see graph on page 4 for an example).
2.10. Repeat steps 2.6 and 2.7 for two more bounces from Run 1, the data run you already took. Record your data in the chart below.
2.11. Repeat steps 2.3 through 2.9 for another data run, this time adding the black mass to the top of the cart. Don’t forget to change the mass in your equation for momentum and tare your force sensor! Record your data in the chart below.
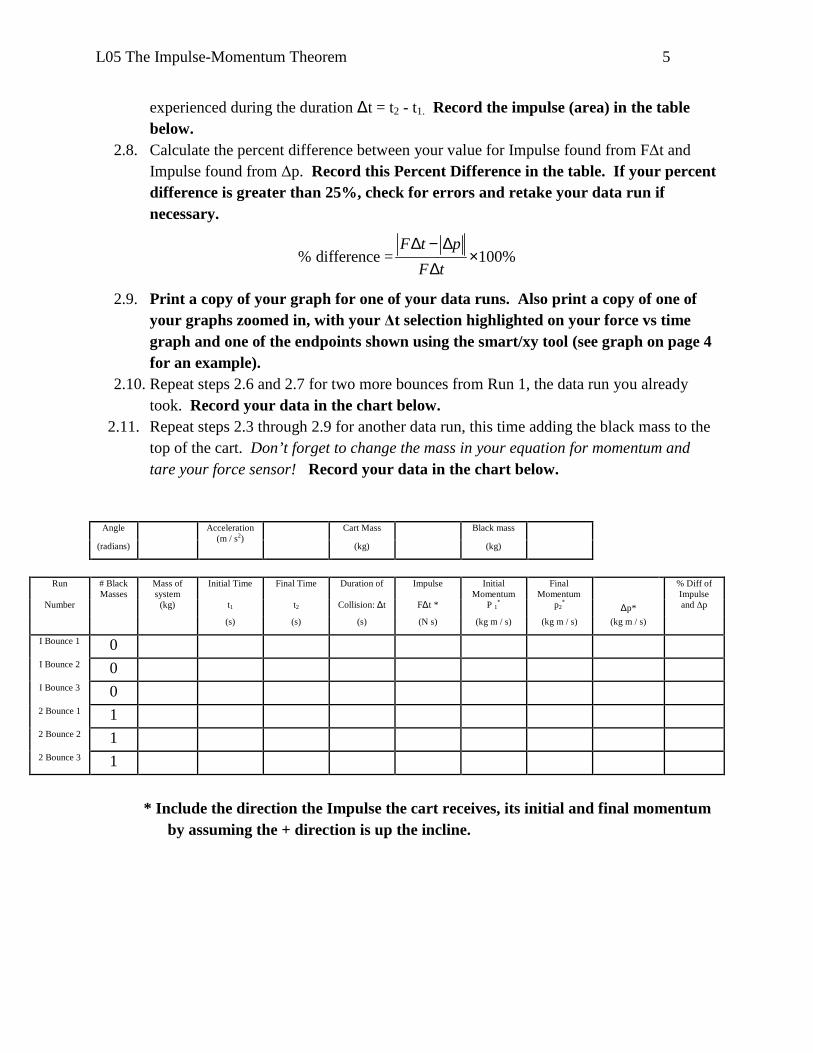
Angle Acceleration (m / s2)
Cart Mass Black mass (radians) (kg) (kg)
Run # Black
Masses Mass of system
Initial Time Final Time Duration of Impulse Initial Momentum
Final Momentum
% Diff of Impulse
Number (kg) t1 t2 Collision: ∆t F∆t * P 1* p2
* Δp* and ∆p
(s) (s) (s) (N s) (kg m / s) (kg m / s) (kg m / s) I Bounce 1 0 I Bounce 2 0 I Bounce 3 0 2 Bounce 1 1 2 Bounce 2 1 2 Bounce 3 1
* Include the direction the Impulse the cart receives, its initial and final momentum
by assuming the + direction is up the incline.
% difference = 100%F t p
F t
∆ − ∆×
∆
L05 The Impulse-Momentum Theorem 6
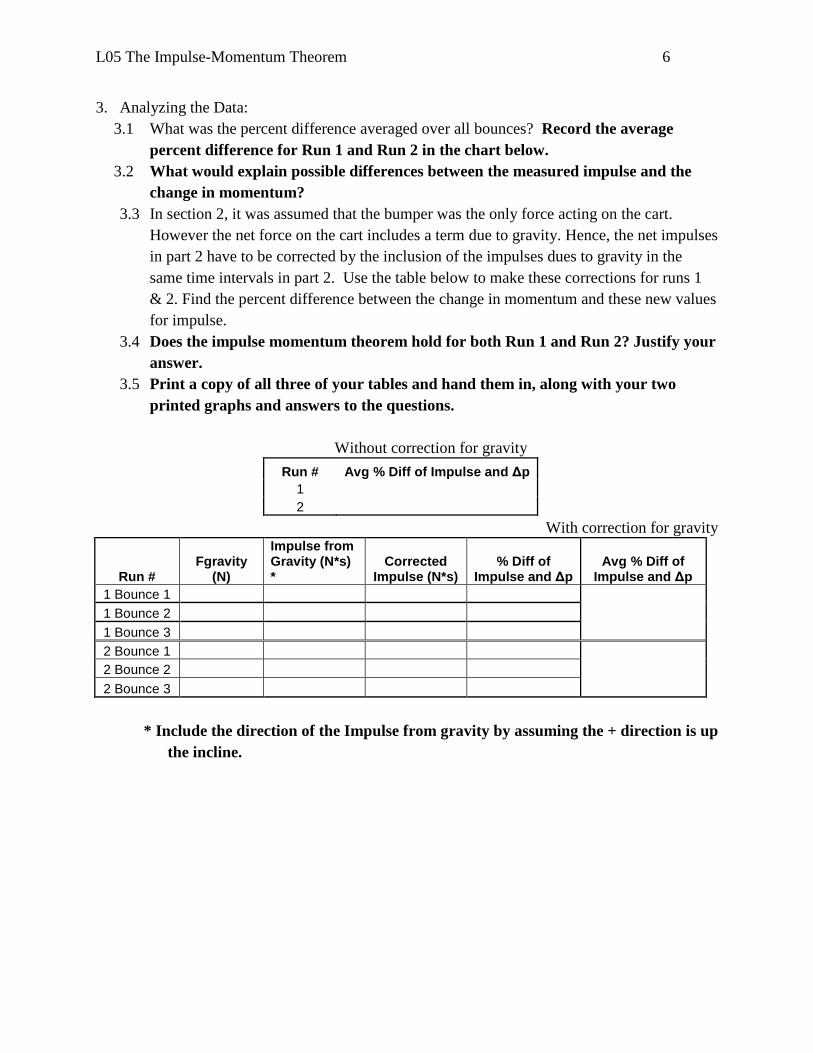
3. Analyzing the Data: 3.1 What was the percent difference averaged over all bounces? Record the average
percent difference for Run 1 and Run 2 in the chart below. 3.2 What would explain possible differences between the measured impulse and the
change in momentum? 3.3 In section 2, it was assumed that the bumper was the only force acting on the cart.
However the net force on the cart includes a term due to gravity. Hence, the net impulses in part 2 have to be corrected by the inclusion of the impulses dues to gravity in the same time intervals in part 2. Use the table below to make these corrections for runs 1 & 2. Find the percent difference between the change in momentum and these new values for impulse.
3.4 Does the impulse momentum theorem hold for both Run 1 and Run 2? Justify your answer.
3.5 Print a copy of all three of your tables and hand them in, along with your two printed graphs and answers to the questions.
Without correction for gravity
Run # Avg % Diff of Impulse and ∆p 1 2
With correction for gravity
Run # Fgravity
(N)
Impulse from Gravity (N*s) *
Corrected Impulse (N*s)
% Diff of Impulse and ∆p
Avg % Diff of Impulse and ∆p
1 Bounce 1
1 Bounce 2 1 Bounce 3 2 Bounce 1
2 Bounce 2
2 Bounce 3
* Include the direction of the Impulse from gravity by assuming the + direction is up
the incline.