Embed Size (px)
Citation preview


Compressed Sensing
Compressed sensing is an exciting, rapidly growing field which has attracted consid-erable attention in electrical engineering, applied mathematics, statistics, and computerscience. Since its initial introduction several years ago an avalanche of results havebeen obtained both of a theoretical as well as practical nature, and various conferences,workshops, and special sessions have been dedicated to this growing research field. Thisbook provides the first detailed introduction to the subject, highlighting recent theoreticaladvances and a range of applications, as well as outlining numerous remaining researchchallenges. After a thorough review of the basic theory, many cutting-edge advancesin the field are presented, including advanced signal modeling, sub-Nyquist samplingof analog signals, hardware prototypes, non-asymptotic analysis of random matrices,adaptive sensing, greedy algorithms, the use of graphical models, and the separation ofmorphologically distinct data components. Each chapter is written by leading researchersin the field, and consistent style and notation are utilized throughout. An extended intro-ductory chapter summarizes the basics of the field so that no prior knowledge is required.Key background information and clear definitions make this book an ideal resource forresearchers, graduate students, and practitioners wanting to join this exciting researcharea. It can also serve as a supplementary textbook for courses on computer vision,coding theory, signal processing, image processing, and algorithms for efficient dataprocessing.
Yonina C. Eldar is a Professor in the Department of Electrical Engineering at the Tech-nion, Israel Institute of Technology, a Research Affiliate with the Research Laboratoryof Electronics at the Massachusetts Institute of Technology, and a Visiting Professorat Stanford University. She has received numerous awards for excellence in researchand teaching, including the Wolf Foundation Krill Prize for Excellence in ScientificResearch, the Hershel Rich Innovation Award, the Weizmann Prize for Exact Sciences,the Michael Bruno Memorial Award from the Rothschild Foundation, and the Muriel &David Jacknow Award for Excellence in Teaching. She is an Associate Editor for sev-eral journals in the areas of signal processing and mathematics and a Signal ProcessingSociety Distinguished Lecturer.
Gitta Kutyniok is an Einstein Professor in the Department of Mathematics at the Tech-nische Universität Berlin, Germany. She has been a Postdoctoral Fellow at Princeton,Stanford, and Yale Universities, and a Full Professor at the Universität Osnabrück,Germany. Her research and teaching have been recognized by various awards, includinga Heisenberg Fellowship and the von Kaven Prize by the German Research Founda-tion, an Einstein Chair by the Einstein Foundation Berlin, awards by the UniversitätPaderborn and the Justus–Liebig Universität Gießen for Excellence in Research, as wellas the Weierstraß Prize for Outstanding Teaching. She is an Associate Editor and alsoCorresponding Editor for several journals in the area of applied mathematics.


Compressed SensingTheory and Applications
Edited by
YONINA C. ELDARTechnion-Israel Institute of Technology, Haifa, Israel
G ITTA KUTYNIOKTechnische Universität Berlin, Germany

cambridge university pressCambridge, New York, Melbourne, Madrid, Cape Town,Singapore, São Paulo, Delhi, Mexico City
Cambridge University PressThe Edinburgh Building, Cambridge CB2 8RU, UK
Published in the United States of America by Cambridge University Press, New York
www.cambridge.orgInformation on this title: www.cambridge.org/9781107005587
© Cambridge University Press 2012
This publication is in copyright. Subject to statutory exceptionand to the provisions of relevant collective licensing agreements,no reproduction of any part may take place without the writtenpermission of Cambridge University Press.
First published 2012
Printed in the United Kingdom at the University Press, Cambridge
A catalogue record for this publication is available from the British Library
Library of Congress Cataloguing in Publication dataCompressed sensing : theory and applications / edited by Yonina C. Eldar, Gitta Kutyniok.
p. cm.Includes bibliographical references and index.ISBN 978-1-107-00558-71. Signal processing. 2. Wavelets (Mathematics) I. Eldar, Yonina C. II. Kutyniok, Gitta.QA601.C638 2012621.382′2–dc23 2011040519
ISBN 978-1-107-00558-7 Hardback
Cambridge University Press has no responsibility for the persistence oraccuracy of URLs for external or third-party internet websites referred toin this publication, and does not guarantee that any content on suchwebsites is, or will remain, accurate or appropriate.

Contents
List of contributors page vii
Preface ix
1 Introduction to compressed sensing 1MARK A. DAVENPORT, MARCO F. DUARTE, YONINA C. ELDAR,AND GITTA KUTYNIOK
2 Second-generation sparse modeling: structured andcollaborative signal analysis 65ALEXEY CASTRODAD, IGNACIO RAMIREZ, GUILLERMO SAPIRO,PABLO SPRECHMANN, AND GUOSHEN YU
3 Xampling: compressed sensing of analog signals 88MOSHE MISHALI AND YONINA C. ELDAR
4 Sampling at the rate of innovation: theory and applications 148JOSE ANTONIO URIGÜEN, YONINA C. ELDAR, P IER LUIG I DRAGOTTI ,AND ZVIKA BEN-HAIM
5 Introduction to the non-asymptotic analysis of random matrices 210ROMAN VERSHYNIN
6 Adaptive sensing for sparse recovery 269JARVIS HAUPT AND ROBERT NOWAK
7 Fundamental thresholds in compressed sensing:a high-dimensional geometry approach 305WEIYU XU AND BABAK HASSIB I
8 Greedy algorithms for compressed sensing 348THOMAS BLUMENSATH, MICHAEL E. DAVIES, AND GABRIEL RILL ING

vi Contents
9 Graphical models concepts in compressed sensing 394ANDREA MONTANARI
10 Finding needles in compressed haystacks 439ROBERT CALDERBANK AND SINA JAFARPOUR
11 Data separation by sparse representations 485GITTA KUTYNIOK
12 Face recognition by sparse representation 515ARVIND GANESH, ANDREW WAGNER, Z IHAN ZHOU, ALLEN Y. YANG, Y I MA,AND JOHN WRIGHT
Index 540

Contributors
Zvika Ben-HaimTechnion-Israel Institute of Technology, Haifa, Israel
Thomas BlumensathUniversity of Oxford, UK
Robert CalderbankDuke University, Durham, USA
Alexey CastrodadUniversity of Minnesota, Minneapolis, USA
Mark A. DavenportStanford University, USA
Michael E. DaviesUniversity of Edinburgh, UK
Pier Luigi DragottiImperial College London, UK
Marco F. DuarteDuke University, Durham, USA
Yonina C. EldarTechnion-Israel Institute of Technology, Haifa, IsraelVisiting Professor at Stanford University, USA
Arvind GaneshUniversity of Illinois, USA
Babak HassibiCalifornia Institute of Technology, Pasadena, USA
Jarvis HauptUniversity of Minnesota, Minneapolis, USA
Sina JafarpourPrinceton University, USA

viii List of contributors
Gitta KutyniokTechnische Universität Berlin, Germany
Yi MaMicrosoft Research Asia, Beijing, China
Moshe MishaliTechnion-Israel Institute of Technology, Haifa, Israel
Andrea MontanariStanford University, USA
Robert NowakUniversity of Wisconsin, Madison, USA
Ignacio RamirezUniversity of Minnesota, Minneapolis, USA
Gabriel RillingUniversity of Edinburgh, UK
Guillermo SapiroUniversity of Minnesota, Minneapolis, USA
Pablo SprechmannUniversity of Minnesota, Minneapolis, USA
Jose Antonio UrigüenImperial College London, UK
Roman VershyninUniversity of Michigan, Ann Arbor, USA
Andrew WagnerUniversity of Illinois, USA
John WrightMicrosoft Research Asia, Beijing, China
Weiyu XuCornell University, USA
Allen Y. YangUniversity of California, Berkeley, USA
Guoshen YuUniversity of Minnesota, Minneapolis, USA
Zihan ZhouUniversity of Illinois, USA

Preface
Compressed sensing (CS) is an exciting, rapidly growing field that has attractedconsiderable attention in electrical engineering, applied mathematics, statistics, and com-puter science. Since its initial introduction several years ago, an avalanche of results havebeen obtained, both of theoretical and practical nature, and various conferences, work-shops, and special sessions have been dedicated to this growing research field. This bookprovides the first comprehensive introduction to the subject, highlighting recent theo-retical advances and a range of applications, as well as outlining numerous remainingresearch challenges.
CS offers a framework for simultaneous sensing and compression of finite-dimensional vectors, that relies on linear dimensionality reduction. Quite surprisingly, itpredicts that sparse high-dimensional signals can be recovered from highly incompletemeasurements by using efficient algorithms. To be more specific, let x be a length-nvector. In CS we do not measure x directly, but rather acquire m < n linear measure-ments of the form y = Ax using an m×n CS matrix A. Ideally, the matrix is designedto reduce the number of measurements as much as possible while allowing for recoveryof a wide class of signals from their measurement vectors y. Thus, we would like tochoose m n. However, this renders the matrix A rank-deficient, meaning that it hasa nonempty nullspace. This implies that for any particular signal x0, an infinite numberof signals x will yield the same measurements y = Ax = Ax0 for the chosen CS matrix.In order to enable recovery, we must therefore limit ourselves to a special class of inputsignals x.
The most prevalent signal structure used in CS is that of sparsity. In its simplest form,sparsity implies that x has only a small number of nonzero values. More generally, CSideas can be applied when a suitable representation of x is sparse. The surprising resultat the heart of CS is that if x (or a suitable representation of x) is k-sparse, i.e., it hasat most k nonzero elements, then it can be recovered from y = Ax using a numberof measurements m that is on the order of k logn. Furthermore, recovery is possibleusing simple, polynomial-time algorithms. In addition, these methods can be shown tobe robust to noise and mismodelling of x. Many of the first research papers in CS weredevoted to the analysis of theoretical guarantees on the CS matrix A in order to enablestable recovery, as well as the development of accompanying efficient algorithms.
This basic discovery has led to a fundamentally new approach to signal processing,image recovery, and compression algorithms, to name a few areas that have benefitedfrom CS. Interestingly, the research field of CS draws from a variety of other areas

x Preface
such as approximation theory, Banach space theory, convex optimization, frame theory,numerical linear algebra, random matrix theory, and signal processing. The combinedefforts of mathematicians, computer scientists, and engineers have led to a deluge ofsignificant contributions to theory and applications of CS. This includes various con-structions of efficient sensing matrices, fast algorithms for sparse recovery, extensionof the notion of sparsity to more general signal structures including low-rank matricesand analog signal models, hardware designs of sub-Nyquist converters that rely on ideasof CS, as well as applications to radar analysis, face recognition, image processing,biomedical imaging, and many more. CS also holds promise for increasing resolutionby exploiting the signal structure. This can potentially revolutionize many applicationssuch as radar and microscopy by making efficient use of the available degrees of freedomin these settings. Consumer electronics, microscopy, civilian and military surveillance,medical imaging, radar and many other applications rely on efficient sampling and areresolution-limited. Reducing the sampling rate in these applications and increasing res-olution can improve the user experience, increase data transfer, improve imaging qualityand reduce exposure time.
This book is the first monograph in the literature to provide a comprehensive surveyof compressed sensing. The potential reader of this book could be a researcher in theareas of applied mathematics, computer science, and electrical engineering, or a relatedresearch area, or a graduate student seeking to learn about CS. The particular design ofthis volume ensures that it can serve as both a state-of-the-art reference for researchersas well as a textbook for students.
The book contains 12 diverse chapters written by recognized leading experts from allover the world covering a large variety of topics. The book begins with a comprehensiveintroduction to CS which serves as a background for the remaining chapters, and alsosets the notation to be used throughout the book. It does not assume any prior knowledgein the field. The following chapters are then organized into 4 categories: Extended signalmodels (Chapters 2–4), sensing matrix design (Chapters 5–6), recovery algorithms andperformance guarantees (Chapters 7–9), and applications (Chapters 10–12). The chaptersare self-contained, covering the most recent research results in the respective topic, andcan all be treated independent of the others.Abrief summary of each chapter is given next.
Chapter 1 provides a comprehensive introduction to the basics of CS. After a briefhistorical overview, the chapter begins with a discussion of sparsity and other low-dimensional signal models. The authors then treat the central question of how toaccurately recover a high-dimensional signal from a small set of measurements andprovide performance guarantees for a variety of sparse recovery algorithms. The chapterconcludes with a discussion of some extensions of the sparse recovery framework.
Chapter 2 goes beyond traditional sparse modeling, and addresses collaborative struc-tured sparsity to add stability and prior information to the representation. In structuredsparse modeling, instead of considering the dictionary atoms as singletons, the atomsare partitioned in groups, and a few groups are selected at a time for the signal encod-ing. Further structure is then added via collaboration, where multiple signals, which areknown to follow the same model, are allowed to collaborate in the coding. The authorsdiscuss applications of these models to image restoration and source separation.

Preface xi
Chapter 3 generalizes CS to reduced-rate sampling of analog signals. It introducesXampling, a unified framework for low rate sampling and processing of signals lying ina union of subspaces. A hardware-oriented viewpoint is advocated throughout, address-ing practical constraints and exemplifying hardware realizations of sub-Nyquist systems.Avariety of analog CS applications are reviewed within the unified Xampling frameworkincluding multiband communications with unknown carrier frequencies, ultrasoundimaging, and wideband radar.
Chapter 4 considers reduced-rate sampling of finite rate of innovation (FRI) analogsignals such as streams of pulses from discrete measurements. Exploiting the fact thatonly a small number of parameters per unit of time are needed to fully describe FRIsignals allows to sample them at rates below Nyquist. The authors provide an overviewof the theory and algorithms along with a diverse set of applications in areas such assuperresolution, radar and ultrasound.
Chapter 5 considers constructions of random CS matrices with proven performanceguarantees. The author provides an overview of basic non-asymptotic methods and con-cepts in random matrix theory. Several tools from geometric functional analysis andprobability theory are put together in order to analyze the extreme singular values ofrandom matrices. This then allows deducing results on random matrices used for sensingin CS.
Chapter 6 investigates the advantages of sequential measurement schemes that adap-tively focus sensing using information gathered throughout the measurement process.This is in contrast to most theory and methods for sparse recovery which are based on anassumption of non-adaptive measurements. In particular, the authors show that adaptivesensing can be significantly more powerful when the measurements are contaminatedwith additive noise.
Chapter 7 introduces a unified high dimensional geometric framework for analyzingthe phase transition phenomenon of 1 minimization in sparse recovery. This frameworkconnects studying the phase transitions of 1 minimization with computing the Grass-mann angles in high dimensional convex geometry. The authors further demonstrate thebroad applications of this Grassmann angle framework by giving sharp phase transitionsfor related recovery methods.
Chapter 8 presents an overview of several greedy methods and explores their theoret-ical properties. Greedy algorithms are very fast and easy to implement and often havesimilar theoretical performance guarantees to convex methods. The authors detail someof the leading greedy approaches for sparse recovery, and consider extensions of thesemethods to more general signal structures.
Chapter 9 surveys recent work in applying ideas from graphical models and messagepassing algorithms to solve large scale regularized regression problems. In particular,the focus is on CS reconstruction via 1 penalized least-squares. The author discusseshow to derive fast approximate message passing algorithms to solve this problem andshows how the analysis of such algorithms allows to prove exact high-dimensional limitresults on the recovery error.
Chapter 10 considers compressed learning, where learning is performed directly inthe compressed domain. The authors provide tight bounds demonstrating that the linear

xii Preface
kernel SVM’s classifier in the measurement domain, with high probability, has trueaccuracy close to the accuracy of the best linear threshold classifier in the data domain.It is also shown that for a family of well-known CS matrices, compressed learning isprovided on the flight. The authors then demonstrate these results in the context of textureanalysis.
Chapter 11 surveys methods for data separation by sparse representations. The authorconsiders the use of sparsity in problems in which the data is composed of two or moremorphologically distinct constituents. The key idea is to choose a deliberately over-complete representation made of several frames, each one providing a sparse expansionof one of the components to be extracted. The morphological difference between thecomponents is then encoded as incoherence conditions of those frames which allows forseparation using CS algorithms.
Chapter 12 applies CS to the classical problem of face recognition. The authors con-sider the problem of recognizing human faces in the presence of real-world nuisancessuch as occlusion and variabilities in pose and illumination. The main idea behind theproposed approach is to explain any query image using a small number of training imagesfrom a single subject category. This core idea is then generalized to account for variousphysical variabilities encountered in face recognition. The authors demonstrate how theresulting system is capable of accurately recognizing subjects out of a database of severalhundred subjects with state-of-the-art accuracy.

1 Introduction to compressed sensingMark A. Davenport, Marco F. Duarte, Yonina C. Eldar, and Gitta Kutyniok
Compressed sensing (CS) is an exciting, rapidly growing, field that has attracted consider-able attention in signal processing, statistics, and computer science, as well as the broaderscientific community. Since its initial development only a few years ago, thousands ofpapers have appeared in this area, and hundreds of conferences, workshops, and specialsessions have been dedicated to this growing research field. In this chapter, we providean up-to-date review of the basics of the theory underlying CS. This chapter shouldserve as a review to practitioners wanting to join this emerging field, and as a referencefor researchers. We focus primarily on the theory and algorithms for sparse recovery infinite dimensions. In subsequent chapters of the book, we will see how the fundamentalspresented in this chapter are expanded and extended in many exciting directions, includ-ing new models for describing structure in both analog and discrete-time signals, newsensing design techniques, more advanced recovery results and powerful new recoveryalgorithms, and emerging applications of the basic theory and its extensions.
1.1 Introduction
We are in the midst of a digital revolution that is driving the development and deploymentof new kinds of sensing systems with ever-increasing fidelity and resolution. The theoreti-cal foundation of this revolution is the pioneering work of Kotelnikov, Nyquist, Shannon,and Whittaker on sampling continuous-time bandlimited signals [162, 195, 209, 247].Their results demonstrate that signals, images, videos, and other data can be exactlyrecovered from a set of uniformly spaced samples taken at the so-called Nyquist rateof twice the highest frequency present in the signal of interest. Capitalizing on this dis-covery, much of signal processing has moved from the analog to the digital domainand ridden the wave of Moore’s law. Digitization has enabled the creation of sensingand processing systems that are more robust, flexible, cheaper and, consequently, morewidely used than their analog counterparts.
As a result of this success, the amount of data generated by sensing systems has grownfrom a trickle to a torrent. Unfortunately, in many important and emerging applications,
Compressed Sensing: Theory and Applications, ed. Yonina C. Eldar and Gitta Kutyniok. Published byCambridge University Press. © Cambridge University Press 2012.
2 M. A. Davenport, M. F. Duarte, Y. C. Eldar, and G. Kutyniok
the resulting Nyquist rate is so high that we end up with far too many samples. Alter-natively, it may simply be too costly, or even physically impossible, to build devicescapable of acquiring samples at the necessary rate [146,241]. Thus, despite extraordinaryadvances in computational power, the acquisition and processing of signals in applica-tion areas such as imaging, video, medical imaging, remote surveillance, spectroscopy,and genomic data analysis continues to pose a tremendous challenge.
To address the logistical and computational challenges involved in dealing with suchhigh-dimensional data, we often depend on compression, which aims at finding the mostconcise representation of a signal that is able to achieve a target level of acceptabledistortion. One of the most popular techniques for signal compression is known astransform coding, and typically relies on finding a basis or frame that provides sparse orcompressible representations for signals in a class of interest [31, 77, 106]. By a sparserepresentation, we mean that for a signal of length n, we can represent it with k n
nonzero coefficients; by a compressible representation, we mean that the signal is well-approximated by a signal with only k nonzero coefficients. Both sparse and compressiblesignals can be represented with high fidelity by preserving only the values and locationsof the largest coefficients of the signal. This process is called sparse approximation,and forms the foundation of transform coding schemes that exploit signal sparsity andcompressibility, including the JPEG, JPEG2000, MPEG, and MP3 standards.
Leveraging the concept of transform coding, compressed sensing has emerged as anew framework for signal acquisition and sensor design that enables a potentially largereduction in the sampling and computation costs for sensing signals that have a sparseor compressible representation. While the Nyquist–Shannon sampling theorem statesthat a certain minimum number of samples is required in order to perfectly capture anarbitrary bandlimited signal, when the signal is sparse in a known basis we can vastlyreduce the number of measurements that need to be stored. Consequently, when sensingsparse signals we might be able to do better than suggested by classical results. Thisis the fundamental idea behind CS: rather than first sampling at a high rate and thencompressing the sampled data, we would like to find ways to directly sense the data in acompressed form – i.e., at a lower sampling rate. The field of CS grew out of the workof Candès, Romberg, and Tao and of Donoho, who showed that a finite-dimensionalsignal having a sparse or compressible representation can be recovered from a smallset of linear, non-adaptive measurements [3, 33, 40–42, 44, 82]. The design of thesemeasurement schemes and their extensions to practical data models and acquisitionsystems are central challenges in the field of CS.
While this idea has only recently gained significant attention in the signal processingcommunity, there have been hints in this direction dating back as far as the eighteenth cen-tury. In 1795, Prony proposed an algorithm for the estimation of the parameters associatedwith a small number of complex exponentials sampled in the presence of noise [201]. Thenext theoretical leap came in the early 1900s, when Carathéodory showed that a positivelinear combination of any k sinusoids is uniquely determined by its value at t = 0 and atany other 2k points in time [46,47]. This represents far fewer samples than the number ofNyquist-rate samples when k is small and the range of possible frequencies is large. In the

Introduction to compressed sensing 3
1990s, this work was generalized by George, Gorodnitsky, and Rao, who studied spar-sity in biomagnetic imaging and other contexts [134–136,202]. Simultaneously, Bresler,Feng, and Venkataramani proposed a sampling scheme for acquiring certain classes ofsignals consisting of k components with nonzero bandwidth (as opposed to pure sinu-soids) under restrictions on the possible spectral supports, although exact recovery wasnot guaranteed in general [29, 117, 118, 237]. In the early 2000s Blu, Marziliano, andVetterli developed sampling methods for certain classes of parametric signals that aregoverned by only k parameters, showing that these signals can be sampled and recoveredfrom just 2k samples [239].
A related problem focuses on recovery of a signal from partial observation of itsFourier transform. Beurling proposed a method for extrapolating these observations todetermine the entire Fourier transform [22]. One can show that if the signal consistsof a finite number of impulses, then Beurling’s approach will correctly recover theentire Fourier transform (of this non-bandlimited signal) from any sufficiently largepiece of its Fourier transform. His approach – to find the signal with smallest 1 normamong all signals agreeing with the acquired Fourier measurements – bears a remarkableresemblance to some of the algorithms used in CS.
More recently, Candès, Romberg, Tao [33, 40–42, 44], and Donoho [82] showed thata signal having a sparse representation can be recovered exactly from a small set oflinear, non-adaptive measurements. This result suggests that it may be possible to sensesparse signals by taking far fewer measurements, hence the name compressed sensing.Note, however, that CS differs from classical sampling in three important respects. First,sampling theory typically considers infinite-length, continuous-time signals. In contrast,CS is a mathematical theory focused on measuring finite-dimensional vectors in Rn.Second, rather than sampling the signal at specific points in time, CS systems typi-cally acquire measurements in the form of inner products between the signal and moregeneral test functions. This is in fact in the spirit of modern sampling methods whichsimilarly acquire signals by more general linear measurements [113, 230]. We will seethroughout this book that randomness often plays a key role in the design of these testfunctions. Third, the two frameworks differ in the manner in which they deal with signalrecovery, i.e., the problem of recovering the original signal from the compressive mea-surements. In the Nyquist–Shannon framework, signal recovery is achieved throughsinc interpolation – a linear process that requires little computation and has a simpleinterpretation. In CS, however, signal recovery is typically achieved using highly non-linear methods.1 See Section 1.6 as well as the survey in [226] for an overview of thesetechniques.
Compressed sensing has already had a notable impact on several applications. Oneexample is medical imaging [178–180, 227], where it has enabled speedups by afactor of seven in pediatric MRI while preserving diagnostic quality [236]. More-over, the broad applicability of this framework has inspired research that extends
1 It is also worth noting that it has recently been shown that nonlinear methods can be used in the context oftraditional sampling as well, when the sampling mechanism is nonlinear [105].

4 M. A. Davenport, M. F. Duarte, Y. C. Eldar, and G. Kutyniok
the CS framework by proposing practical implementations for numerous applica-tions, including sub-Nyquist sampling systems [125, 126, 186–188, 219, 224, 225, 228],compressive imaging architectures [99, 184, 205], and compressive sensor networks[7, 72, 141].
The aim of this book is to provide an up-to-date review of some of the important resultsin CS. Many of the results and ideas in the various chapters rely on the fundamentalconcepts of CS. Since the focus of the remaining chapters is on more recent advances,we concentrate here on many of the basic results in CS that will serve as backgroundmaterial to the rest of the book. Our goal in this chapter is to provide an overview of thefield and highlight some of the key technical results, which are then more fully exploredin subsequent chapters. We begin with a brief review of the relevant mathematical tools,and then survey many of the low-dimensional models commonly used in CS, with anemphasis on sparsity and the union of subspaces models. We next focus attention onthe theory and algorithms for sparse recovery in finite dimensions. To facilitate our goalof providing both an elementary introduction as well as a comprehensive overview ofmany of the results in CS, we provide proofs of some of the more technical lemmas andtheorems in the Appendix.
1.2 Review of vector spaces
For much of its history, signal processing has focused on signals produced by physicalsystems. Many natural and man-made systems can be modeled as linear. Thus, it is naturalto consider signal models that complement this kind of linear structure. This notion hasbeen incorporated into modern signal processing by modeling signals as vectors livingin an appropriate vector space. This captures the linear structure that we often desire,namely that if we add two signals together then we obtain a new, physically meaningfulsignal. Moreover, vector spaces allow us to apply intuitions and tools from geometry inR3, such as lengths, distances, and angles, to describe and compare signals of interest.This is useful even when our signals live in high-dimensional or infinite-dimensionalspaces. This book assumes that the reader is relatively comfortable with vector spaces.We now provide a brief review of some of the key concepts in vector spaces that will berequired in developing the CS theory.
1.2.1 Normed vector spaces
Throughout this book, we will treat signals as real-valued functions having domains thatare either continuous or discrete, and either infinite or finite. These assumptions will bemade clear as necessary in each chapter. We will typically be concerned with normedvector spaces, i.e., vector spaces endowed with a norm.
In the case of a discrete, finite domain, we can view our signals as vectors in an n-dimensional Euclidean space, denoted by Rn. When dealing with vectors in Rn, we will

Introduction to compressed sensing 5
p = 1 p = 2 p = ∞ p = 12
Figure 1.1 Unit spheres in R2 for the p norms with p = 1,2,∞, and for the p quasinorm with p = 1
2 .
make frequent use of the p norms, which are defined for p ∈ [1,∞] as
‖x‖p =
(∑n
i=1 |xi|p)1p , p ∈ [1,∞);
maxi=1,2,...,n
|xi|, p = ∞.(1.1)
In Euclidean space we can also consider the standard inner product in Rn, which wedenote
〈x,z〉 = zT x =
n∑i=1
xizi.
This inner product leads to the 2 norm: ‖x‖2 =√
〈x,x〉.In some contexts it is useful to extend the notion of p norms to the case where p< 1. In
this case, the “norm” defined in (1.1) fails to satisfy the triangle inequality, so it is actuallya quasinorm. We will also make frequent use of the notation ‖x‖0 := |supp(x)|, wheresupp(x) = i : xi = 0 denotes the support of x and |supp(x)| denotes the cardinalityof supp(x). Note that ‖·‖0 is not even a quasinorm, but one can easily show that
limp→0
‖x‖pp = |supp(x)|,
justifying this choice of notation. The p (quasi-)norms have notably different propertiesfor different values of p. To illustrate this, in Figure 1.1 we show the unit sphere, i.e.,x : ‖x‖p = 1, induced by each of these norms in R2.
We typically use norms as a measure of the strength of a signal, or the size of an error.For example, suppose we are given a signal x ∈ R2 and wish to approximate it using apoint in a one-dimensional affine space A. If we measure the approximation error usingan p norm, then our task is to find the x ∈ A that minimizes ‖x− x‖p. The choice ofp will have a significant effect on the properties of the resulting approximation error.An example is illustrated in Figure 1.2. To compute the closest point in A to x usingeach p norm, we can imagine growing an p sphere centered on x until it intersectswith A. This will be the point x ∈ A that is closest to x in the corresponding p norm.We observe that larger p tends to spread out the error more evenly among the twocoefficients, while smaller p leads to an error that is more unevenly distributed and tendsto be sparse. This intuition generalizes to higher dimensions, and plays an important rolein the development of CS theory.

6 M. A. Davenport, M. F. Duarte, Y. C. Eldar, and G. Kutyniok
x
A
x
A
x
x
x
Ax
x
A
x
p = 1 p = 2 p = ∞ p = 12
Figure 1.2 Best approximation of a point in R2 by a one-dimensional subspace using the p norms for
p = 1,2,∞, and the p quasinorm with p = 12 .
1.2.2 Bases and frames
A set φini=1 is called a basis for Rn if the vectors in the set span Rn and are linearly
independent.2 This implies that each vector in the space has a unique representation asa linear combination of these basis vectors. Specifically, for any x ∈ Rn, there exist(unique) coefficients cin
i=1 such that
x =
n∑i=1
ciφi.
Note that if we let Φ denote the n×n matrix with columns given by φi and let c denotethe length-n vector with entries ci, then we can represent this relation more compactlyas
x = Φc.
An important special case of a basis is an orthonormal basis, defined as a set of vectorsφin
i=1 satisfying
〈φi,φj〉 =
1, i = j;
0, i = j.
An orthonormal basis has the advantage that the coefficients c can be easily calculatedas
ci = 〈x,φi〉,
or
c = ΦT x
in matrix notation. This can easily be verified since the orthonormality of the columnsof Φ means that ΦT Φ = I , where I denotes the n×n identity matrix.
It is often useful to generalize the concept of a basis to allow for sets of possibly linearlydependent vectors, resulting in what is known as a frame [48,55,65,163,164,182]. More
2 In any n-dimensional vector space, a basis will always consist of exactly n vectors. Fewer vectors are notsufficient to span the space, while additional vectors are guaranteed to be linearly dependent.

Introduction to compressed sensing 7
formally, a frame is a set of vectors φini=1 in Rd, d < n corresponding to a matrix
Φ ∈ Rd×n, such that for all vectors x ∈ Rd,
A‖x‖22 ≤
∥∥ΦT x∥∥2
2 ≤ B ‖x‖22
with 0 < A ≤ B < ∞. Note that the condition A > 0 implies that the rows of Φ mustbe linearly independent. When A is chosen as the largest possible value and B as thesmallest for these inequalities to hold, then we call them the (optimal) frame bounds. IfA and B can be chosen as A = B, then the frame is called A-tight, and if A = B = 1,then Φ is a Parseval frame. A frame is called equal-norm, if there exists some λ > 0
such that ‖φi‖2 = λ for all i = 1, . . . ,n, and it is unit-norm if λ = 1. Note also that whilethe concept of a frame is very general and can be defined in infinite-dimensional spaces,in the case where Φ is a d×n matrix A and B simply correspond to the smallest andlargest eigenvalues of ΦΦT , respectively.
Frames can provide richer representations of data due to their redundancy [26]: fora given signal x, there exist infinitely many coefficient vectors c such that x = Φc. Inorder to obtain a set of feasible coefficients we exploit the dual frame Φ. Specifically,any frame satisfying
ΦΦT = ΦΦT = I
is called an (alternate) dual frame. The particular choice Φ = (ΦΦT )−1Φ is referred to asthe canonical dual frame. It is also known as the Moore–Penrose pseudoinverse. Notethat since A > 0 requires Φ to have linearly independent rows, this also ensures thatΦΦT is invertible, so that Φ is well-defined. Thus, one way to obtain a set of feasiblecoefficients is via
cd = ΦT x = ΦT (ΦΦT )−1x.
One can show that this sequence is the smallest coefficient sequence in 2 norm, i.e.,‖cd‖2 ≤ ‖c‖2 for all c such that x = Φc.
Finally, note that in the sparse approximation literature, it is also common for a basisor frame to be referred to as a dictionary or overcomplete dictionary respectively, withthe dictionary elements being called atoms.
1.3 Low-dimensional signal models
At its core, signal processing is concerned with efficient algorithms for acquiring, pro-cessing, and extracting information from different types of signals or data. In orderto design such algorithms for a particular problem, we must have accurate models forthe signals of interest. These can take the form of generative models, deterministicclasses, or probabilistic Bayesian models. In general, models are useful for incorporat-ing a priori knowledge to help distinguish classes of interesting or probable signals fromuninteresting or improbable signals. This can help in efficiently and accurately acquiring,processing, compressing, and communicating data and information.
As noted in the introduction, much of classical signal processing is based on thenotion that signals can be modeled as vectors living in an appropriate vector space (or

8 M. A. Davenport, M. F. Duarte, Y. C. Eldar, and G. Kutyniok
subspace). To a large extent, the notion that any possible vector is a valid signal has driventhe explosion in the dimensionality of the data we must sample and process. However,such simple linear models often fail to capture much of the structure present in manycommon classes of signals – while it may be reasonable to model signals as vectors, inmany cases not all possible vectors in the space represent valid signals. In response tothese challenges, there has been a surge of interest in recent years, across many fields,in a variety of low-dimensional signal models that quantify the notion that the numberof degrees of freedom in high-dimensional signals is often quite small compared to theirambient dimensionality.
In this section we provide a brief overview of the most common low-dimensionalstructures encountered in the field of CS. We will begin by considering the traditionalsparse models for finite-dimensional signals, and then discuss methods for generalizingthese classes to infinite-dimensional (continuous-time) signals. We will also briefly dis-cuss low-rank matrix and manifold models and describe some interesting connectionsbetween CS and some other emerging problem areas.
1.3.1 Sparse models
Signals can often be well-approximated as a linear combination of just a few elementsfrom a known basis or dictionary. When this representation is exact we say that the signalis sparse. Sparse signal models provide a mathematical framework for capturing the factthat in many cases these high-dimensional signals contain relatively little informationcompared to their ambient dimension. Sparsity can be thought of as one incarnation ofOccam’s razor — when faced with many possible ways to represent a signal, the simplestchoice is the best one.
Sparsity and nonlinear approximationMathematically, we say that a signal x is k-sparse when it has at most k nonzeros, i.e.,‖x‖0 ≤ k. We let
Σk = x : ‖x‖0 ≤ k
denote the set of all k-sparse signals. Typically, we will be dealing with signals that arenot themselves sparse, but which admit a sparse representation in some basis Φ. In thiscase we will still refer to x as being k-sparse, with the understanding that we can expressx as x = Φc where ‖c‖0 ≤ k.
Sparsity has long been exploited in signal processing and approximation theory fortasks such as compression [77,199,215] and denoising [80], and in statistics and learningtheory as a method for avoiding overfitting [234]. Sparsity also figures prominently inthe theory of statistical estimation and model selection [139, 218], in the study of thehuman visual system [196], and has been exploited heavily in image processing tasks,since the multiscale wavelet transform [182] provides nearly sparse representations fornatural images. An example is shown in Figure 1.3.
As a traditional application of sparse models, we consider the problems of image com-pression and image denoising. Most natural images are characterized by large smooth or

Introduction to compressed sensing 9
(a) (b)
Figure 1.3 Sparse representation of an image via a multiscale wavelet transform. (a) Original image.(b) Wavelet representation. Large coefficients are represented by light pixels, while smallcoefficients are represented by dark pixels. Observe that most of the wavelet coefficients areclose to zero.
textured regions and relatively few sharp edges. Signals with this structure are known tobe very nearly sparse when represented using a multiscale wavelet transform [182].The wavelet transform consists of recursively dividing the image into its low- andhigh-frequency components. The lowest frequency components provide a coarse scaleapproximation of the image, while the higher frequency components fill in the detail andresolve edges. What we see when we compute a wavelet transform of a typical naturalimage, as shown in Figure 1.3, is that most coefficients are very small. Hence, we canobtain a good approximation of the signal by setting the small coefficients to zero, orthresholding the coefficients, to obtain a k-sparse representation. When measuring theapproximation error using an p norm, this procedure yields the best k-term approxima-tion of the original signal, i.e., the best approximation of the signal using only k basiselements.3
Figure 1.4 shows an example of such an image and its best k-term approximation. Thisis the heart of nonlinear approximation [77] – nonlinear because the choice of whichcoefficients to keep in the approximation depends on the signal itself. Similarly, giventhe knowledge that natural images have approximately sparse wavelet transforms, thissame thresholding operation serves as an effective method for rejecting certain commontypes of noise, which typically do not have sparse wavelet transforms [80].
3 Thresholding yields the best k-term approximation of a signal with respect to an orthonormal basis. Whenredundant frames are used, we must rely on sparse approximation algorithms like those described inSection 1.6 [106, 182].
10 M. A. Davenport, M. F. Duarte, Y. C. Eldar, and G. Kutyniok
(a) (b)
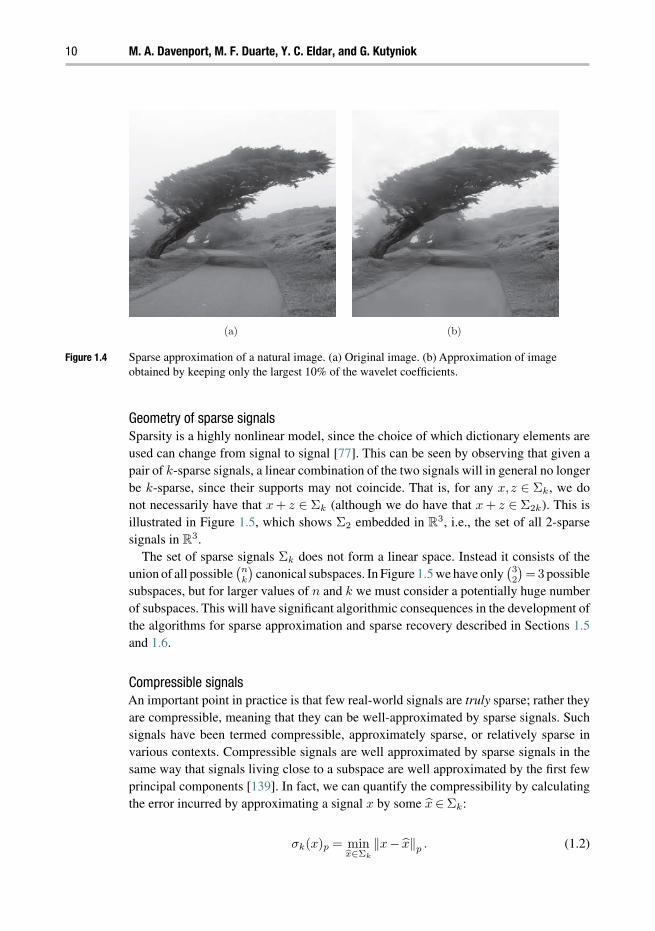
Figure 1.4 Sparse approximation of a natural image. (a) Original image. (b) Approximation of imageobtained by keeping only the largest 10% of the wavelet coefficients.
Geometry of sparse signalsSparsity is a highly nonlinear model, since the choice of which dictionary elements areused can change from signal to signal [77]. This can be seen by observing that given apair of k-sparse signals, a linear combination of the two signals will in general no longerbe k-sparse, since their supports may not coincide. That is, for any x,z ∈ Σk, we donot necessarily have that x + z ∈ Σk (although we do have that x + z ∈ Σ2k). This isillustrated in Figure 1.5, which shows Σ2 embedded in R3, i.e., the set of all 2-sparsesignals in R3.
The set of sparse signals Σk does not form a linear space. Instead it consists of theunion of all possible
(nk
)canonical subspaces. In Figure 1.5 we have only
(32
)=3 possible
subspaces, but for larger values of n and k we must consider a potentially huge numberof subspaces. This will have significant algorithmic consequences in the development ofthe algorithms for sparse approximation and sparse recovery described in Sections 1.5and 1.6.
Compressible signalsAn important point in practice is that few real-world signals are truly sparse; rather theyare compressible, meaning that they can be well-approximated by sparse signals. Suchsignals have been termed compressible, approximately sparse, or relatively sparse invarious contexts. Compressible signals are well approximated by sparse signals in thesame way that signals living close to a subspace are well approximated by the first fewprincipal components [139]. In fact, we can quantify the compressibility by calculatingthe error incurred by approximating a signal x by some x ∈ Σk:
σk(x)p = minx∈Σk
‖x− x‖p . (1.2)

Introduction to compressed sensing 11
Figure 1.5 Union of subspaces defined by Σ2 ⊂ R3, i.e., the set of all 2-sparse signals in R
3.
If x ∈ Σk, then clearly σk(x)p = 0 for any p. Moreover, one can easily show that thethresholding strategy described above (keeping only the k largest coefficients) results inthe optimal approximation as measured by (1.2) for all p norms [77].
Another way to think about compressible signals is to consider the rate of decay oftheir coefficients. For many important classes of signals there exist bases such that thecoefficients obey a power law decay, in which case the signals are highly compressible.Specifically, if x = Φc and we sort the coefficients ci such that |c1| ≥ |c2| ≥ · · · ≥ |cn|,then we say that the coefficients obey a power law decay if there exist constants C1, q > 0
such that
|ci| ≤ C1i−q.
The larger q is, the faster the magnitudes decay, and the more compressible a signal is.Because the magnitudes of their coefficients decay so rapidly, compressible signals canbe represented accurately by k n coefficients. Specifically, for such signals there existconstants C2, r > 0 depending only on C1 and q such that
σk(x)2 ≤ C2k−r.
In fact, one can show that σk(x)2 will decay as k−r if and only if the sorted coefficientsci decay as i−r+1/2 [77].
1.3.2 Finite unions of subspaces
In certain applications, the signal has a structure that cannot be completely expressedusing sparsity alone. For instance, when only certain sparse support patterns are allowable

12 M. A. Davenport, M. F. Duarte, Y. C. Eldar, and G. Kutyniok
in the signal, it is possible to leverage such constraints to formulate more concise signalmodels. We give a few representative examples below; see Chapters 2 and 8 for moredetail on structured sparsity.
• For piecewise-smooth signals and images, the dominant coefficients in the wavelettransform tend to cluster into a connected rooted subtree inside the wavelet parent–child binary tree [79, 103, 104, 167, 168].
• In applications such as surveillance or neuronal recording, the coefficients mightappear clustered together, or spaced apart from each other [49,50,147]. See Chapter 11for more details.
• When multiple sparse signals are recorded simultaneously, their supports might becorrelated according to the properties of the sensing environment [7, 63, 76, 114, 121,185]. One possible structure leads to the multiple measurement vector problem; seeSection 1.7 for more details.
• In certain cases the small number of components of a sparse signal correspond notto vectors (columns of a matrix Φ), but rather to points known to lie in particularsubspaces. If we construct a frame by concatenating bases for such subspaces, thenonzero coefficients of the signal representations form block structures at knownlocations [27,112,114]. See Chapters 3, 11, and 12 for further description and potentialapplications of this model.
Such examples of additional structure can be captured in terms of restricting the feasiblesignal supports to a small subset of the possible
(nk
)selections of nonzero coefficients for
a k-sparse signal. These models are often referred to as structured sparsity models [4,25,102,114,177]. In cases where nonzero coefficients appear in clusters, the structure can beexpressed in terms of a sparse union of subspaces [102, 114]. The structured sparse andunion of subspaces models extend the notion of sparsity to a much broader class of signalsthat can incorporate both finite-dimensional and infinite-dimensional representations.
In order to define these models, recall that for canonically sparse signals, the union Σk
is composed of canonical subspaces Ui that are aligned with k out of the n coordinateaxes of Rn. See, for example, Figure 1.5, which illustrates this for the case where n = 3
and k = 2. Allowing for more general choices of Ui leads to powerful representationsthat accommodate many interesting signal priors. Specifically, given the knowledge thatx resides in one of M possible subspaces U1,U2, . . . ,UM , we have that x lies in the unionof M subspaces [114, 177]:
x ∈ U =
M⋃i=1
Ui.
It is important to note that, as in the generic sparse setting, union models are nonlinear:the sum of two signals from a union U is generally no longer in U . This nonlinearbehavior of the signal set renders any processing that exploits these models more intricate.Therefore, instead of attempting to treat all unions in a unified way, we focus our attentionon some specific classes of union models, in order of complexity.
The simplest class of unions arises when the number of subspaces comprising theunion is finite and each subspace has finite dimensions. We call this setup a finite union

Introduction to compressed sensing 13
of subspaces model. Under the finite-dimensional framework, we revisit the two typesof models described above:
• Structured sparse supports: This class consists of sparse vectors that meet additionalrestrictions on the support (i.e., the set of indices for the vector’s nonzero entries).This corresponds to only certain subspaces Ui out of the
(nk
)subspaces present in Σk
being allowed [4].• Sparse union of subspaces: This class consists of vectors where each subspace Ui
comprising the union is a direct sum of k low-dimensional subspaces [114].
Ui =
k⊕j=1
Aij . (1.3)
Here Ai are a given set of subspaces with dimensions dim(Ai) = di, andi1, i2, . . . , ik select k of these subspaces. Thus, each subspace Ui corresponds to adifferent choice of k out of M subspaces Ai that comprise the sum. This frameworkcan model standard sparsity by letting Aj be the one-dimensional subspace spannedby the jth canonical vector. It can be shown that this model leads to block sparsity, inwhich certain blocks in a vector are zero and others are not [112].
These two cases can be combined to allow for only certain sums of k subspaces to bepart of the union U . Both models can be leveraged to further reduce sampling rate andallow for the application of CS to a broader class of signals.
1.3.3 Unions of subspaces for analog signal models
One of the primary motivations for CS is to design new sensing systems for acquiringcontinuous-time, analog signals or images. In contrast, the finite-dimensional sparsemodel described above inherently assumes that the signal x is discrete. It is sometimespossible to extend this model to continuous-time signals using an intermediate discreterepresentation. For example, a bandlimited, periodic signal can be perfectly representedby a finite-length vector consisting of its Nyquist-rate samples. However, it will oftenbe more useful to extend the concept of sparsity to provide union of subspaces modelsfor analog signals [97,109,114,125,186–188,239]. Two of the broader frameworks thattreat sub-Nyquist sampling of analog signals are Xampling and finite-rate of innovation,which are discussed in Chapters 3 and 4, respectively.
In general, when treating unions of subspaces for analog signals there are three maincases to consider, as elaborated further in Chapter 3 [102]:
• finite unions of infinite-dimensional spaces;• infinite unions of finite-dimensional spaces;• infinite unions of infinite-dimensional spaces.
In each of the three settings above there is an element that can take on infinite values,which is a result of the fact that we are considering analog signals: either the underlyingsubspaces are infinite-dimensional, or the number of subspaces is infinite.
14 M. A. Davenport, M. F. Duarte, Y. C. Eldar, and G. Kutyniok
There are many well-known examples of analog signals that can be expressed as aunion of subspaces. For example, an important signal class corresponding to a finiteunion of infinite-dimensional spaces is the multiband model [109]. In this model, theanalog signal consists of a finite sum of bandlimited signals, where typically the signalcomponents have a relatively small bandwidth but are distributed across a comparativelylarge frequency range [117,118,186,237,238]. Sub-Nyquist recovery techniques for thisclass of signals can be found in [186–188].
Another example of a signal class that can often be expressed as a union of subspaces isthe class of signals having a finite rate of innovation [97,239]. Depending on the specificstructure, this model corresponds to an infinite or finite union of finite-dimensionalsubspaces [19, 125, 126], and describes many common signals having a small numberof degrees of freedom. In this case, each subspace corresponds to a certain choice ofparameter values, with the set of possible values being infinite dimensional, and thus thenumber of subspaces spanned by the model being infinite as well. The eventual goal is toexploit the available structure in order to reduce the sampling rate; see Chapters 3 and 4for more details. As we will see in Chapter 3, by relying on the analog union of subspacesmodel we can design efficient hardware that samples analog signals at sub-Nyquist rates,thus moving the analog CS framework from theory to practice.
1.3.4 Low-rank matrix models
Another model closely related to sparsity is the set of low-rank matrices:
L = M ∈ Rn1×n2 : rank(M) ≤ r.
The set L consists of matrices M such that M =∑r
k=1 σkukv∗k where σ1,σ2, . . . ,σr ≥ 0
are the nonzero singular values, and u1,u2, . . . ,ur ∈ Rn1 , v1,v2, . . . ,vr ∈ Rn2 are thecorresponding singular vectors. Rather than constraining the number of elements usedto construct the signal, we are constraining the number of nonzero singular values. Onecan easily observe that the set L has r(n1 + n2 − r) degrees of freedom by countingthe number of free parameters in the singular value decomposition. For small r thisis significantly less than the number of entries in the matrix – n1n2. Low-rank matri-ces arise in a variety of practical settings. For example, low-rank (Hankel) matricescorrespond to low-order linear, time-invariant systems [198]. In many data-embeddingproblems, such as sensor geolocation, the matrix of pairwise distances will typicallyhave rank 2 or 3 [172, 212]. Finally, approximately low-rank matrices arise naturallyin the context of collaborative filtering systems such as the now-famous Netflix rec-ommendation system [132] and the related problem of matrix completion, where alow-rank matrix is recovered from a small sample of its entries [39,151,204]. While wedo not focus in-depth on matrix completion or the more general problem of low-rankmatrix recovery, we note that many of the concepts and tools treated in this book arehighly relevant to this emerging field, both from a theoretical and algorithmic perspective[36, 38, 161, 203].

Introduction to compressed sensing 15
1.3.5 Manifold and parametric models
Parametric or manifold models form another, more general class of low-dimensionalsignal models. These models arise in cases where (i) a k-dimensional continuouslyvalued parameter θ can be identified that carries the relevant information about a signaland (ii) the signal f(θ) ∈ Rn changes as a continuous (typically nonlinear) function ofthese parameters. Typical examples include a one-dimensional (1-D) signal shifted by anunknown time delay (parameterized by the translation variable), a recording of a speechsignal (parameterized by the underlying phonemes being spoken), and an image of a 3-Dobject at an unknown location captured from an unknown viewing angle (parameterizedby the 3-D coordinates of the object and its roll, pitch, and yaw) [90,176,240]. In theseand many other cases, the signal class forms a nonlinear k-dimensional manifold inRn, i.e.,
M = f(θ) : θ ∈ Θ,
where Θ is the k-dimensional parameter space. Manifold-based methods for imageprocessing have attracted considerable attention, particularly in the machine learningcommunity. They can be applied to diverse applications including data visualization,signal classification and detection, parameter estimation, systems control, clustering,and machine learning [14,15,58,61,89,193,217,240,244]. Low-dimensional manifoldshave also been proposed as approximate models for a number of nonparametric signalclasses such as images of human faces and handwritten digits [30, 150, 229].
Manifold models are closely related to all of the models described above. For example,the set of signals x such that ‖x‖0 = k forms a k-dimensional Riemannian manifold.Similarly, the set of n1 × n2 matrices of rank r forms an r(n1 + n2 − r)-dimensionalRiemannian manifold [233].4
Anumber of the signal models used in this book are closely related to manifold models.For example, the union of subspaces models in Chapter 3, the finite rate of innovationmodels considered in Chapter 4, and the continuum models in Chapter 11 can all beviewed from a manifold perspective. For the most part we will not explicitly exploit thisstructure in the book. However, low-dimensional manifolds have a close connection tomany of the key results in CS. In particular, many of the randomized sensing matricesused in CS can also be shown to preserve the structure in low-dimensional manifolds [6].For details and further applications see [6, 71, 72, 101].
1.4 Sensing matrices
In order to make the discussion more concrete, for the remainder of this chapter we willrestrict our attention to the standard finite-dimensional CS model. Specifically, given a
4 Note that in the case where we allow signals with sparsity less than or equal to k, or matrices of rank lessthan or equal to r, these sets fail to satisfy certain technical requirements of a topological manifold (due tothe behavior where the sparsity/rank changes). However, the manifold viewpoint can still be useful in thiscontext [68].

16 M. A. Davenport, M. F. Duarte, Y. C. Eldar, and G. Kutyniok
signal x ∈ Rn, we consider measurement systems that acquire m linear measurements.We can represent this process mathematically as
y = Ax, (1.4)
where A is an m × n matrix and y ∈ Rm. The matrix A represents a dimensionalityreduction, i.e., it maps Rn, where n is generally large, into Rm, where m is typically muchsmaller than n. Note that in the standard CS framework we assume that the measurementsare non-adaptive, meaning that the rows of A are fixed in advance and do not dependon the previously acquired measurements. In certain settings adaptive measurementschemes can lead to significant performance gains. See Chapter 6 for further details.
As noted earlier, although the standard CS framework assumes that x is a finite-lengthvector with a discrete-valued index (such as time or space), in practice we will often beinterested in designing measurement systems for acquiring continuously indexed signalssuch as continuous-time signals or images. It is sometimes possible to extend this modelto continuously indexed signals using an intermediate discrete representation. For a moreflexible approach, we refer the reader to Chapters 3 and 4. For now we will simply thinkof x as a finite-length window of Nyquist-rate samples, and we temporarily ignore theissue of how to directly acquire compressive measurements without first sampling at theNyquist rate.
There are two main theoretical questions in CS. First, how should we design thesensing matrix A to ensure that it preserves the information in the signal x? Second, howcan we recover the original signal x from measurements y? In the case where our datais sparse or compressible, we will see that we can design matrices A with m n thatensure that we will be able to recover the original signal accurately and efficiently usinga variety of practical algorithms.
We begin in this section by first addressing the question of how to design the sensingmatrix A. Rather than directly proposing a design procedure, we instead consider anumber of desirable properties that we might wish A to have. We then provide someimportant examples of matrix constructions that satisfy these properties.
1.4.1 Null space conditions
A natural place to begin is by considering the null space of A, denoted
N (A) = z : Az = 0.
If we wish to be able to recover all sparse signals x from the measurements Ax, thenit is immediately clear that for any pair of distinct vectors x,x′ ∈ Σk, we must haveAx = Ax′, since otherwise it would be impossible to distinguish x from x′ based solelyon the measurements y. More formally, by observing that if Ax=Ax′ then A(x−x′)=0
with x− x′ ∈ Σ2k, we see that A uniquely represents all x ∈ Σk if and only if N (A)
contains no vectors in Σ2k. While there are many equivalent ways of characterizing thisproperty, one of the most common is known as the spark [86].

Introduction to compressed sensing 17
definition 1.1 The spark of a given matrix A is the smallest number of columns ofA that are linearly dependent.
This definition allows us to pose the following straightforward guarantee.
theorem 1.1 (Corollary 1 of [86]) For any vector y ∈ Rm, there exists at most onesignal x ∈ Σk such that y = Ax if and only if spark(A) > 2k.
Proof. We first assume that, for any y ∈ Rm, there exists at most one signal x ∈ Σk
such that y = Ax. Now suppose for the sake of a contradiction that spark(A)≤ 2k. Thismeans that there exists some set of at most 2k columns that are linearly independent,which in turn implies that there exists an h ∈ N (A) such that h ∈ Σ2k. In this case,since h ∈ Σ2k we can write h = x− x′, where x,x′ ∈ Σk. Thus, since h ∈ N (A) wehave that A(x−x′) = 0 and hence Ax = Ax′. But this contradicts our assumption thatthere exists at most one signal x ∈ Σk such that y = Ax. Therefore, we must have thatspark(A) > 2k.
Now suppose that spark(A) > 2k. Assume that for some y there exist x,x′ ∈Σk suchthat y = Ax = Ax′. We therefore have that A(x−x′) = 0. Letting h = x−x′, we canwrite this as Ah = 0. Since spark(A) > 2k, all sets of up to 2k columns of A are linearlyindependent, and therefore h = 0. This in turn implies x = x′, proving the theorem.
It is easy to see that spark(A) ∈ [2,m + 1]. Therefore, Theorem 1.1 yields therequirement m ≥ 2k.
When dealing with exactly sparse vectors, the spark provides a complete characteri-zation of when sparse recovery is possible. However, when dealing with approximatelysparse signals we must consider somewhat more restrictive conditions on the null spaceof A [57]. Roughly speaking, we must also ensure that N (A) does not contain any vec-tors that are too compressible in addition to vectors that are sparse. In order to state theformal definition we define the following notation that will prove to be useful through-out much of this book. Suppose that Λ ⊂ 1,2, . . . ,n is a subset of indices and letΛc = 1,2, . . . ,n\Λ. By xΛ we typically mean the length n vector obtained by settingthe entries of x indexed by Λc to zero. Similarly, by AΛ we typically mean the m×n
matrix obtained by setting the columns of A indexed by Λc to zero.5
definition 1.2 A matrix A satisfies the null space property (NSP) of order k if thereexists a constant C > 0 such that,
‖hΛ‖2 ≤ C‖hΛc‖1√
k(1.5)
holds for all h ∈N (A) and for all Λ such that |Λ| ≤ k.
The NSP quantifies the notion that vectors in the null space of A should not be tooconcentrated on a small subset of indices. For example, if a vector h is exactly k-sparse,
5 We note that this notation will occasionally be abused to refer to the length |Λ| vector obtained by keepingonly the entries corresponding to Λ, or the m×|Λ| matrix obtained by only keeping the columnscorresponding to Λ, respectively. The usage should be clear from the context, but in most cases there is nosubstantive difference between the two.
18 M. A. Davenport, M. F. Duarte, Y. C. Eldar, and G. Kutyniok
then there exists a Λ such that ‖hΛc‖1 = 0 and hence (1.5) implies that hΛ = 0 as well.Thus, if a matrix A satisfies the NSP then the only k-sparse vector in N (A) is h = 0.
To fully illustrate the implications of the NSP in the context of sparse recovery, wenow briefly discuss how we will measure the performance of sparse recovery algorithmswhen dealing with general non-sparse x. Towards this end, let ∆ : Rm → Rn representour specific recovery method. We will focus primarily on guarantees of the form
‖∆(Ax)−x‖2 ≤ Cσk(x)1√
k(1.6)
for all x, where σk(x)1 is as defined in (1.2). This guarantees exact recovery of allpossible k-sparse signals, but also ensures a degree of robustness to non-sparse signalsthat directly depends on how well the signals are approximated by k-sparse vectors.Such guarantees are called instance-optimal since they guarantee optimal performancefor each instance of x [57]. This distinguishes them from guarantees that only hold forsome subset of possible signals, such as sparse or compressible signals – the quality ofthe guarantee adapts to the particular choice of x. These are also commonly referred toas uniform guarantees since they hold uniformly for all x.
Our choice of norms in (1.6) is somewhat arbitrary. We could easily measure thereconstruction error using other p norms. The choice of p, however, will limit whatkinds of guarantees are possible, and will also potentially lead to alternative formulationsof the NSP. See, for instance, [57]. Moreover, the form of the right-hand side of (1.6)might seem somewhat unusual in that we measure the approximation error as σk(x)1/
√k
rather than simply something like σk(x)2. However, we will see in Section 1.5.3 thatsuch a guarantee is actually not possible without taking a prohibitively large numberof measurements, and that (1.6) represents the best possible guarantee we can hope toobtain.
We will see in Section 1.5 (Theorem 1.8) that the NSP of order 2k is sufficient toestablish a guarantee of the form (1.6) for a practical recovery algorithm (1 minimiza-tion). Moreover, the following adaptation of a theorem in [57] demonstrates that if thereexists any recovery algorithm satisfying (1.6), then A must necessarily satisfy the NSPof order 2k.
theorem 1.2 (Theorem 3.2 of [57]) Let A : Rn → Rm denote a sensing matrix and∆ : Rm → Rn denote an arbitrary recovery algorithm. If the pair (A,∆) satisfies (1.6)then A satisfies the NSP of order 2k.
Proof. Suppose h ∈ N (A) and let Λ be the indices corresponding to the 2k largestentries of h. We next split Λ into Λ0 and Λ1, where |Λ0| = |Λ1| = k. Set x = hΛ1 +hΛc
and x′ =−hΛ0 , so that h = x−x′. Since by construction x′ ∈Σk, we can apply (1.6) toobtain x′ = ∆(Ax′). Moreover, since h ∈N (A), we have
Ah = A(x−x′) = 0

Introduction to compressed sensing 19
so that Ax′ = Ax. Thus, x′ = ∆(Ax). Finally, we have that
‖hΛ‖2 ≤ ‖h‖2 = ‖x−x′‖2 = ‖x−∆(Ax)‖2 ≤ Cσk(x)1√
k=
√2C
‖hΛc‖1√2k
,
where the last inequality follows from (1.6).
1.4.2 The restricted isometry property
While the NSP is both necessary and sufficient for establishing guarantees of the form(1.6), these guarantees do not account for noise. When the measurements are contami-nated with noise or have been corrupted by some error such as quantization, it will beuseful to consider somewhat stronger conditions. In [43], Candès and Tao introducedthe following isometry condition on matrices A and established its important role in CS.
definition 1.3 A matrix A satisfies the restricted isometry property (RIP) of order k
if there exists a δk ∈ (0,1) such that
(1− δk)‖x‖22 ≤ ‖Ax‖2
2 ≤ (1+ δk)‖x‖22 (1.7)
holds for all x ∈ Σk.
If a matrix A satisfies the RIP of order 2k, then we can interpret (1.7) as saying thatA approximately preserves the distance between any pair of k-sparse vectors. This willclearly have fundamental implications concerning robustness to noise. Moreover, thepotential applications of such stable embeddings range far beyond acquisition for thesole purpose of signal recovery. See Chapter 10 for examples of additional applications.
It is important to note that while in our definition of the RIP we assume bounds thatare symmetric about 1, this is merely for notational convenience. In practice, one couldinstead consider arbitrary bounds
α‖x‖22 ≤ ‖Ax‖2
2 ≤ β ‖x‖22
where 0 < α≤ β <∞. Given any such bounds, one can always scale A so that it satisfiesthe symmetric bound about 1 in (1.7). Specifically, multiplying A by
√2/(β +α) will
result in an A that satisfies (1.7) with constant δk = (β−α)/(β +α). While we will notexplicitly show this, one can check that all of the theorems in this chapter based on theassumption that A satisfies the RIP actually hold as long as there exists some scalingof A that satisfies the RIP. Thus, since we can always scale A to satisfy (1.7), we losenothing by restricting our attention to this simpler bound.
Note also that if A satisfies the RIP of order k with constant δk, then for any k′ < k weautomatically have that A satisfies the RIP of order k′ with constant δk′ ≤ δk. Moreover,in [190] it is shown that if A satisfies the RIP of order k with a sufficiently small constant,then it will also automatically satisfy the RIP of order γk for certain γ>1, albeit with asomewhat worse constant.

20 M. A. Davenport, M. F. Duarte, Y. C. Eldar, and G. Kutyniok
lemma 1.1 (Corollary 3.4 of [190]) Suppose that A satisfies the RIP of order k withconstant δk. Let γ be a positive integer. Then A satisfies the RIP of order k′ = γ
⌊k2
⌋with constant δk′ < γ · δk, where · denotes the floor operator.
This lemma is trivial for γ = 1,2, but for γ ≥ 3 (and k ≥ 4) this allows us to extendfrom RIP of order k to higher orders. Note however, that δk must be sufficiently smallin order for the resulting bound to be useful.
The RIP and stabilityWe will see in Sections 1.5 and 1.6 that if a matrix A satisfies the RIP, then this issufficient for a variety of algorithms to be able to successfully recover a sparse signalfrom noisy measurements. First, however, we will take a closer look at whether the RIPis actually necessary. It should be clear that the lower bound in the RIP is a necessarycondition if we wish to be able to recover all sparse signals x from the measurementsAx for the same reasons that the NSP is necessary. We can say even more about thenecessity of the RIP by considering the following notion of stability [67].
definition 1.4 Let A : Rn → Rm denote a sensing matrix and ∆ : Rm → Rn denotea recovery algorithm. We say that the pair (A,∆) is C-stable if for any x ∈ Σk and anye ∈ Rm we have that
‖∆(Ax+ e)−x‖2 ≤ C ‖e‖2 .
This definition simply says that if we add a small amount of noise to the measurements,then the impact of this on the recovered signal should not be arbitrarily large. Theorem 1.3below demonstrates that the existence of any decoding algorithm (potentially impracti-cal) that can stably recover from noisy measurements requires that A satisfy the lowerbound of (1.7) with a constant determined by C.
theorem 1.3 (Theorem 3.1 of [67]) If the pair (A,∆) is C-stable, then
1
C‖x‖2 ≤ ‖Ax‖2 (1.8)
for all x ∈ Σ2k.
Proof. Pick any x,z ∈ Σk. Define
ex =A(z −x)
2and ez =
A(x− z)
2,
and note that
Ax+ ex = Az + ez =A(x+ z)
2.

Introduction to compressed sensing 21
Let x = ∆(Ax + ex) = ∆(Az + ez). From the triangle inequality and the definition ofC-stability, we have that
‖x− z‖2 = ‖x− x+ x− z‖2
≤ ‖x− x‖2 + ‖x− z‖2
≤ C ‖ex‖2 +C ‖ez‖2
= C ‖Ax−Az‖2 .
Since this holds for any x,z ∈ Σk, the result follows.
Note that as C → 1, we have that A must satisfy the lower bound of (1.7) withδ2k = 1− 1/C2 → 0. Thus, if we desire to reduce the impact of noise in our recoveredsignal then we must adjust A so that it satisfies the lower bound of (1.7) with a tighterconstant.
One might respond to this result by arguing that since the upper bound is not necessary,we can avoid redesigning A simply by rescaling A so that as long as A satisfies the RIPwith δ2k < 1, the rescaled version αA will satisfy (1.8) for any constant C. In settingswhere the size of the noise is independent of our choice of A, this is a valid point – byscaling A we are essentially adjusting the gain on the “signal” part of our measurements,and if increasing this gain does not impact the noise, then we can achieve arbitrarily highsignal-to-noise ratios, so that eventually the noise is negligible compared to the signal.
However, in practice we will typically not be able to rescale A to be arbitrarily large.Moreover, in many practical settings the noise is not independent of A. For example,consider the case where the noise vector e represents quantization noise produced by afinite dynamic range quantizer with B bits. Suppose the measurements lie in the interval[−T,T ], and we have adjusted the quantizer to capture this range. If we rescale A byα, then the measurements now lie between [−αT,αT ], and we must scale the dynamicrange of our quantizer by α. In this case the resulting quantization error is simply αe,and we have achieved no reduction in the reconstruction error.
Measurement boundsWe can also consider how many measurements are necessary to achieve the RIP. If weignore the impact of δ2k and focus only on the dimensions of the problem (n, m, and k)then we can establish a simple lower bound, which is proven in Section A.1.
theorem 1.4 (Theorem 3.5 of [67]) Let A be an m×n matrix that satisfies the RIPof order 2k with constant δ2k ∈ (0, 1
2 ]. Then
m ≥ Ck log(n
k
)where C = 1/2log(
√24+1) ≈ 0.28.
Note that the restriction to δ2k ≤ 1/2 is arbitrary and is made merely for convenience –minor modifications to the argument establish bounds for δ2k ≤ δmax for any δmax < 1.

22 M. A. Davenport, M. F. Duarte, Y. C. Eldar, and G. Kutyniok
Moreover, although we have made no effort to optimize the constants, it is worth notingthat they are already quite reasonable.
While the proof is somewhat less direct, one can establish a similar result (in termsof its dependence on n and k) by examining the Gelfand width of the 1 ball [124].However, both this result and Theorem 1.4 fail to capture the precise dependence of m
on the desired RIPconstant δk. In order to quantify this dependence, we can exploit recentresults concerning the Johnson–Lindenstrauss lemma, which relates to embeddings offinite sets of points in low-dimensional spaces [158]. Specifically, it is shown in [156]that if we are given a point cloud with p points and wish to embed these points in Rm
such that the squared 2 distance between any pair of points is preserved up to a factorof 1± ε, then we must have that
m ≥ c0 log(p)
ε2,
where c0 > 0 is a constant.The Johnson-Lindenstrauss lemma is closely related to the RIP. In [5] it is shown that
any procedure that can be used for generating a linear, distance-preserving embeddingfor a point cloud can also be used to construct a matrix that satisfies the RIP. Moreover,in [165] it is shown that if a matrix A satisfies the RIP of order k = c1 log(p) with constantδk, then A can be used to construct a distance-preserving embedding for p points withε = δk/4. Combining these we obtain
m ≥ c0 log(p)
ε2=
16c0k
c1δ2 .
Thus, for very small δ the number of measurements required to ensure that A satisfiesthe RIP of order k will be proportional to k/δ2
k, which may be significantly higher thank log(n/k). See [165] for further details.
The relationship between the RIP and the NSPFinally, we will now show that if a matrix satisfies the RIP, then it also satisfies the NSP.Thus, the RIP is strictly stronger than the NSP.
theorem 1.5 Suppose that A satisfies the RIP of order 2k with δ2k <√
2− 1. ThenA satisfies the NSP of order 2k with constant
C =2
1− (1+√
2)δ2k
.
The proof of this theorem involves two useful lemmas. The first of these followsdirectly from standard norm inequalities by relating a k-sparse vector to a vector in Rk.We include a simple proof for the sake of completeness.
lemma 1.2 Suppose u ∈ Σk. Then
‖u‖1√k
≤ ‖u‖2 ≤√
k‖u‖∞ .

Introduction to compressed sensing 23
Proof. For any u, ‖u‖1 = |〈u,sgn(u)〉|. By applying the Cauchy–Schwarz inequalitywe obtain ‖u‖1 ≤ ‖u‖2 ‖sgn(u)‖2. The lower bound follows since sgn(u) has exactlyk nonzero entries all equal to ±1 (since u ∈ Σk) and thus ‖sgn(u)‖2 =
√k. The upper
bound is obtained by observing that each of the k nonzero entries of u can be upperbounded by ‖u‖∞.
Below we state the second key lemma that we will need in order to prove Theorem 1.5.This result is a general result which holds for arbitrary h, not just vectors h ∈ N (A).It should be clear that when we do have h ∈ N (A), the argument could be simplifiedconsiderably. However, this lemma will prove immensely useful when we turn to theproblem of sparse recovery from noisy measurements in Section 1.5, and thus we estab-lish it now in its full generality. The intuition behind this bound will become more clearafter reading Section 1.5. We state the lemma here, which is proven in Section A.2.
lemma 1.3 Suppose that A satisfies the RIP of order 2k, and let h ∈ Rn, h = 0 bearbitrary. Let Λ0 be any subset of 1,2, . . . ,n such that |Λ0| ≤ k. Define Λ1 as the indexset corresponding to the k entries of hΛc
0with largest magnitude, and set Λ = Λ0 ∪Λ1.
Then
‖hΛ‖2 ≤ α
∥∥hΛc0
∥∥1√
k+β
|〈AhΛ,Ah〉|‖hΛ‖2
,
where
α =
√2δ2k
1− δ2k, β =
1
1− δ2k.
Again, note that Lemma 1.3 holds for arbitrary h. In order to prove Theorem 1.5, wemerely need to apply Lemma 1.3 to the case where h ∈N (A).
Proof of Theorem 1.5. Suppose that h ∈N (A). It is sufficient to show that
‖hΛ‖2 ≤ C‖hΛc‖1√
2k(1.9)
holds for the case where Λ is the index set corresponding to the 2k largest entries of h.Thus, we can take Λ0 to be the index set corresponding to the k largest entries of h andapply Lemma 1.3.
The second term in Lemma 1.3 vanishes since Ah = 0, and thus we have
‖hΛ‖2 ≤ α
∥∥hΛc0
∥∥1√
k.
Using Lemma 1.2,∥∥hΛc0
∥∥1 = ‖hΛ1‖1 + ‖hΛc‖1 ≤
√k‖hΛ1‖2 + ‖hΛc‖1
resulting in
‖hΛ‖2 ≤ α
(‖hΛ1‖2 +
‖hΛc‖1√k
).

24 M. A. Davenport, M. F. Duarte, Y. C. Eldar, and G. Kutyniok
Since ‖hΛ1‖2 ≤ ‖hΛ‖2, we have that
(1−α)‖hΛ‖2 ≤ α‖hΛc‖1√
k.
The assumption δ2k <√
2 − 1 ensures that α < 1, and thus we may divide by 1 − α
without changing the direction of the inequality to establish (1.9) with constant
C =
√2α
1−α=
2δ2k
1− (1+√
2)δ2k
,
as desired.
1.4.3 Coherence
While the spark, NSP, and RIP all provide guarantees for the recovery of k-sparse signals,verifying that a general matrix A satisfies any of these properties would typically requirea combinatorial search over all
(nk
)submatrices. In many cases it is preferable to use
properties of A that are easily computable to provide more concrete recovery guarantees.The coherence of a matrix is one such property [86, 222].
definition 1.5 The coherence of a matrix A, µ(A), is the largest absolute innerproduct between any two columns ai, aj of A:
µ(A) = max1≤i<j≤n
|〈ai,aj〉|‖ai‖2‖aj‖2
.
It is possible to show that the coherence of a matrix is always in the range µ(A) ∈[√n−m
m(n−1) ,1]; the lower bound is known as the Welch bound [207, 214, 245]. Note
that when n m, the lower bound is approximately µ(A) ≥ 1/√
m. The concept ofcoherence can also be extended to certain structured sparsity models and specific classesof analog signals [27, 111, 112].
One can sometimes relate coherence to the spark, NSP, and RIP. For example, thecoherence and spark properties of a matrix can be related by employing the Gersgorincircle theorem [127, 235].
theorem 1.6 (Theorem 2 of [127]) The eigenvalues of an n × n matrix M withentries mij , 1 ≤ i, j ≤ n, lie in the union of n discs di = di(ci, ri), 1 ≤ i ≤ n, centeredat ci = mii and with radius ri =
∑j =i |mij |.
Applying this theorem on the Gram matrix G = ATΛAΛ leads to the following
straightforward result.
lemma 1.4 For any matrix A,
spark(A) ≥ 1+1
µ(A).

Introduction to compressed sensing 25
Proof. Since spark(A) does not depend on the scaling of the columns, we can assumewithout loss of generality that A has unit-norm columns. Let Λ⊆1, . . . ,n with |Λ|= p
determine a set of indices. We consider the restricted Gram matrix G = ATΛAΛ, which
satisfies the following properties:
• gii = 1, 1 ≤ i ≤ p;• |gij | ≤ µ(A), 1 ≤ i, j ≤ p, i = j.
From Theorem 1.6, if∑
j =i |gij | < |gii| then the matrix G is positive definite, so thatthe columns of AΛ are linearly independent. Thus, the spark condition implies (p −1)µ(A) < 1 or, equivalently, p < 1+1/µ(A) for all p < spark(A), yielding spark(A)≥1+1/µ(A).
By merging Theorem 1.1 with Lemma 1.4, we can pose the following condition on A
that guarantees uniqueness.
theorem 1.7 (Theorem 12 of [86]) If
k <1
2
(1+
1
µ(A)
),
then for each measurement vector y ∈ Rm there exists at most one signal x ∈ Σk suchthat y = Ax.
Theorem 1.7, together with the Welch bound, provides an upper bound on the level ofsparsity k that guarantees uniqueness using coherence: k = O(
√m). Another straight-
forward application of the Gersgorin circle theorem (Theorem 1.6) connects the RIP tothe coherence property.
lemma 1.5 If A has unit-norm columns and coherence µ = µ(A), then A satisfies theRIP of order k with δk = (k− 1) µ for all k < 1/µ.
The proof of this lemma is similar to that of Lemma 1.4.
1.4.4 Sensing matrix constructions
Now that we have defined the relevant properties of a matrix A in the context of CS, weturn to the question of how to construct matrices that satisfy these properties. To begin,it is straightforward to show that an m × n Vandermonde matrix V constructed fromm distinct scalars has spark(V ) = m+1 [57]. Unfortunately, these matrices are poorlyconditioned for large values of n, rendering the recovery problem numerically unstable.Similarly, there are known matrices A of size m×m2 that achieve the coherence lowerbound µ(A)= 1/
√m, such as the Gabor frame generated from theAlltop sequence [148]
and more general equiangular tight frames [214]. These constructions restrict the numberof measurements needed to recover a k-sparse signal to be m = O(k2 logn). It is alsopossible to deterministically construct matrices of size m × n that satisfy the RIP oforder k, but such constructions also require m to be relatively large [28, 78, 140, 152].For example, the construction in [78] requires m = O(k2 logn) while the construction

26 M. A. Davenport, M. F. Duarte, Y. C. Eldar, and G. Kutyniok
in [152] requires m = O(knα) for some constant α. In many real-world settings, theseresults would lead to an unacceptably large requirement on m.
Fortunately, these limitations can be overcome by randomizing the matrix construc-tion. For example, random matrices A of size m × n whose entries are independentand identically distributed (i.i.d.) with continuous distributions have spark(A) = m+1
with probability one. More significantly, it can also be shown that random matrices willsatisfy the RIP with high probability if the entries are chosen according to a Gaussian,Bernoulli, or more generally any sub-gaussian distribution. See Chapter 5 for details,and in particular, Theorem 5.65. This theorem states that if a matrix A is chosen accord-ing to a sub-gaussian distribution with m = O
(k log(n/k)/δ2
2k
), then A will satisfy the
RIP of order 2k with probability at least 1− 2exp(−c1δ22km). Note that in light of the
measurement bounds in Section 1.4.2 we see that this achieves the optimal number ofmeasurements up to a constant. It also follows from Theorem 1.5 that these randomconstructions provide matrices satisfying the NSP. Furthermore, it can be shown that ifthe distribution used has zero mean and finite variance, then the coherence converges toµ(A) =
√(2 logn)/m in the asymptotic regime (as m and n grow) [32, 37, 83].
Using random matrices to construct A has a number of additional benefits. To illustratethese, we will focus on the RIP. First, one can show that for random constructions themeasurements are democratic, meaning that it is possible to recover a signal using anysufficiently large subset of the measurements [73, 169]. Thus, by using random A onecan be robust to the loss or corruption of a small fraction of the measurements. Second,and perhaps more significantly, in practice we are often more interested in the settingwhere x is sparse with respect to some basis Φ. In this case what we actually require isthat the product AΦ satisfies the RIP. If we were to use a deterministic construction thenwe would need to explicitly take Φ into account in our construction of A, but when A ischosen randomly we can avoid this consideration. For example, if A is chosen accordingto a Gaussian distribution and Φ is an orthonormal basis then one can easily show thatAΦ will also have a Gaussian distribution, and so provided that m is sufficiently highAΦ will satisfy the RIP with high probability, just as before. Although less obvious,similar results hold for sub-gaussian distributions as well [5]. This property, sometimesreferred to as universality, constitutes a significant advantage of using random matricesto construct A. See Chapter 5 for further details on random matrices and their role in CS.
Finally, we note that since the fully random matrix approach is sometimes impracticalto build in hardware, several hardware architectures have been implemented and/orproposed that enable random measurements to be acquired in practical settings. Examplesinclude the random demodulator [224], random filtering [225], the modulated widebandconverter [187], random convolution [1, 206], and the compressive multiplexer [211].These architectures typically use a reduced amount of randomness and are modeled viamatrices A that have significantly more structure than a fully random matrix. Perhapssomewhat surprisingly, while it is typically not quite as easy as in the fully randomcase, one can prove that many of these constructions also satisfy the RIP and/or havelow coherence. Furthermore, one can analyze the effect of inaccuracies in the matrix A
implemented by the system [54, 149]; in the simplest cases, such sensing matrix errorscan be addressed through system calibration.
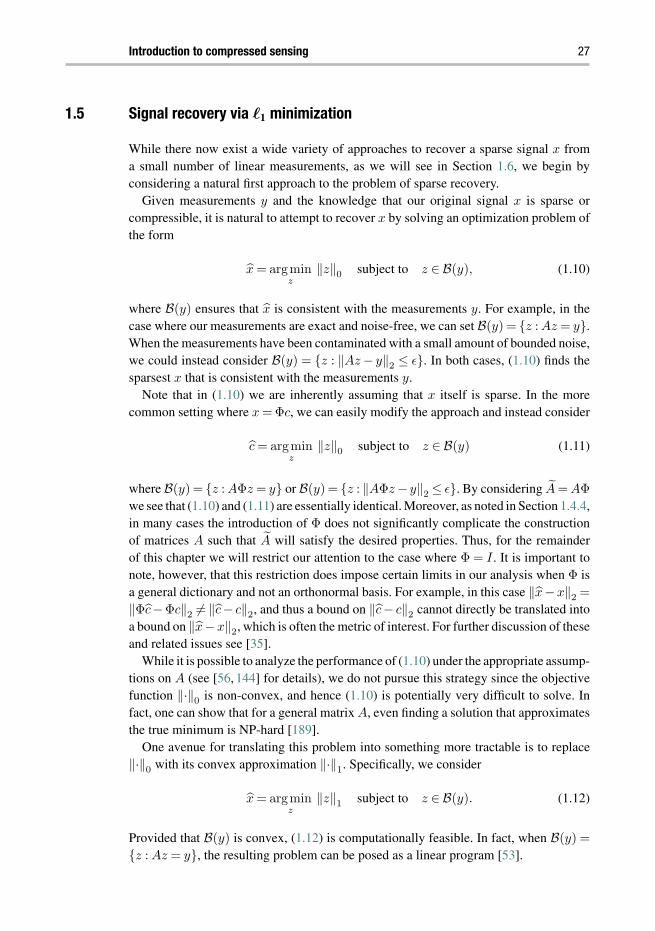
Introduction to compressed sensing 27
1.5 Signal recovery via 1 minimization
While there now exist a wide variety of approaches to recover a sparse signal x froma small number of linear measurements, as we will see in Section 1.6, we begin byconsidering a natural first approach to the problem of sparse recovery.
Given measurements y and the knowledge that our original signal x is sparse orcompressible, it is natural to attempt to recover x by solving an optimization problem ofthe form
x = argminz
‖z‖0 subject to z ∈ B(y), (1.10)
where B(y) ensures that x is consistent with the measurements y. For example, in thecase where our measurements are exact and noise-free, we can set B(y) = z : Az = y.When the measurements have been contaminated with a small amount of bounded noise,we could instead consider B(y) = z : ‖Az − y‖2 ≤ ε. In both cases, (1.10) finds thesparsest x that is consistent with the measurements y.
Note that in (1.10) we are inherently assuming that x itself is sparse. In the morecommon setting where x = Φc, we can easily modify the approach and instead consider
c = argminz
‖z‖0 subject to z ∈ B(y) (1.11)
where B(y) = z : AΦz = y or B(y) = z : ‖AΦz − y‖2 ≤ ε. By considering A = AΦ
we see that (1.10) and (1.11) are essentially identical. Moreover, as noted in Section 1.4.4,in many cases the introduction of Φ does not significantly complicate the constructionof matrices A such that A will satisfy the desired properties. Thus, for the remainderof this chapter we will restrict our attention to the case where Φ = I . It is important tonote, however, that this restriction does impose certain limits in our analysis when Φ isa general dictionary and not an orthonormal basis. For example, in this case ‖x−x‖2 =
‖Φc−Φc‖2 = ‖c− c‖2, and thus a bound on ‖c− c‖2 cannot directly be translated intoa bound on ‖x−x‖2, which is often the metric of interest. For further discussion of theseand related issues see [35].
While it is possible to analyze the performance of (1.10) under the appropriate assump-tions on A (see [56, 144] for details), we do not pursue this strategy since the objectivefunction ‖·‖0 is non-convex, and hence (1.10) is potentially very difficult to solve. Infact, one can show that for a general matrix A, even finding a solution that approximatesthe true minimum is NP-hard [189].
One avenue for translating this problem into something more tractable is to replace‖·‖0 with its convex approximation ‖·‖1. Specifically, we consider
x = argminz
‖z‖1 subject to z ∈ B(y). (1.12)
Provided that B(y) is convex, (1.12) is computationally feasible. In fact, when B(y) =
z : Az = y, the resulting problem can be posed as a linear program [53].

28 M. A. Davenport, M. F. Duarte, Y. C. Eldar, and G. Kutyniok
While it is clear that replacing (1.10) with (1.12) transforms a computationallyintractable problem into a tractable one, it may not be immediately obvious that thesolution to (1.12) will be at all similar to the solution to (1.10). However, there are cer-tainly intuitive reasons to expect that the use of 1 minimization will indeed promotesparsity. As an example, recall that in Figure 1.2, the solutions to the 1 minimizationproblem coincided exactly with the solution to the p minimization problem for anyp < 1, and notably, was sparse. Moreover, the use of 1 minimization to promote orexploit sparsity has a long history, dating back at least to the work of Beurling on Fouriertransform extrapolation from partial observations [22].
Additionally, in a somewhat different context, in 1965 Logan [91,174] showed that abandlimited signal can be perfectly recovered in the presence of arbitrary corruptionson a small interval (see also extensions of these conditions in [91]). Again, the recoverymethod consists of searching for the bandlimited signal that is closest to the observedsignal in the 1 norm. This can be viewed as further validation of the intuition gainedfrom Figure 1.2 – the 1 norm is well-suited to sparse errors.
Historically, the use of 1 minimization on large problems finally became practicalwith the explosion of computing power in the late 1970s and early 1980s. In one ofits first applications, it was demonstrated that geophysical signals consisting of spiketrains could be recovered from only the high-frequency components of these signalsby exploiting 1 minimization [171, 216, 242]. Finally, in the 1990s there was renewedinterest in these approaches within the signal processing community for the purpose offinding sparse approximations to signals and images when represented in overcompletedictionaries or unions of bases [53,182]. Separately, 1 minimization received significantattention in the statistics literature as a method for variable selection in regression, knownas the Lasso [218].
Thus, there are a variety of reasons to suspect that 1 minimization will provide anaccurate method for sparse signal recovery. More importantly, this also constitutes acomputationally tractable approach to sparse signal recovery. In this section we providean overview of 1 minimization from a theoretical perspective. We discuss algorithmsfor 1 minimization in Section 1.6.
1.5.1 Noise-free signal recovery
In order to analyze 1 minimization for various specific choices of B(y), we require thefollowing general result which builds on Lemma 1.3 and is proven in Section A.3.
lemma 1.6 Suppose that A satisfies the RIP of order 2k with δ2k <√
2 − 1. Letx, x ∈ Rn be given, and define h = x−x. Let Λ0 denote the index set corresponding tothe k entries of x with largest magnitude and Λ1 the index set corresponding to the k
entries of hΛc0
with largest magnitude. Set Λ = Λ0 ∪Λ1. If ‖x‖1 ≤ ‖x‖1, then
‖h‖2 ≤ C0σk(x)1√
k+C1
|〈AhΛ,Ah〉|‖hΛ‖2
,
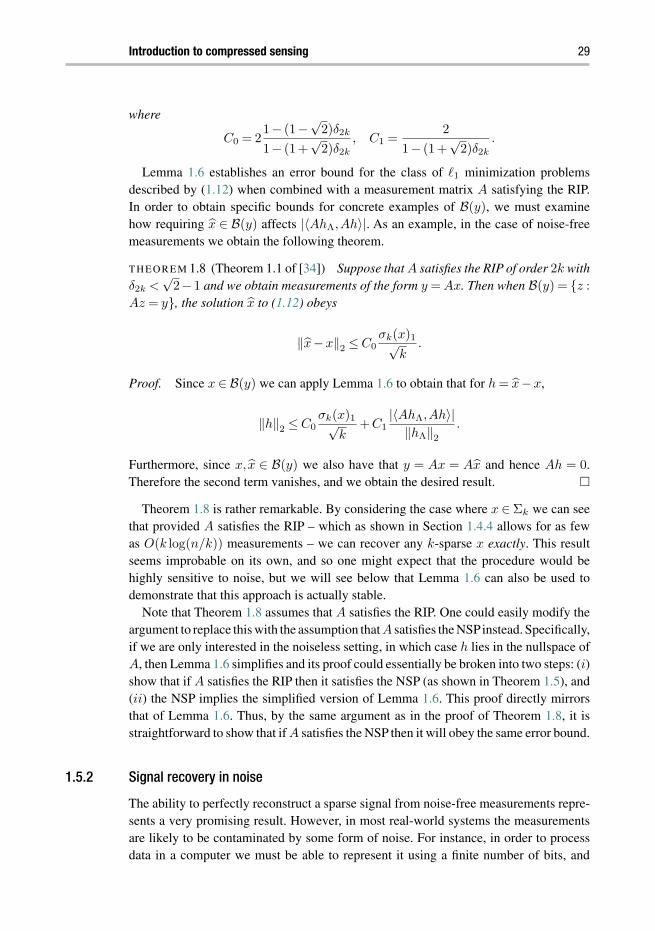
Introduction to compressed sensing 29
where
C0 = 21− (1−
√2)δ2k
1− (1+√
2)δ2k
, C1 =2
1− (1+√
2)δ2k
.
Lemma 1.6 establishes an error bound for the class of 1 minimization problemsdescribed by (1.12) when combined with a measurement matrix A satisfying the RIP.In order to obtain specific bounds for concrete examples of B(y), we must examinehow requiring x ∈ B(y) affects |〈AhΛ,Ah〉|. As an example, in the case of noise-freemeasurements we obtain the following theorem.
theorem 1.8 (Theorem 1.1 of [34]) Suppose that A satisfies the RIP of order 2k withδ2k <
√2−1 and we obtain measurements of the form y = Ax. Then when B(y) = z :
Az = y, the solution x to (1.12) obeys
‖x−x‖2 ≤ C0σk(x)1√
k.
Proof. Since x ∈ B(y) we can apply Lemma 1.6 to obtain that for h = x−x,
‖h‖2 ≤ C0σk(x)1√
k+C1
|〈AhΛ,Ah〉|‖hΛ‖2
.
Furthermore, since x, x ∈ B(y) we also have that y = Ax = Ax and hence Ah = 0.Therefore the second term vanishes, and we obtain the desired result.
Theorem 1.8 is rather remarkable. By considering the case where x ∈ Σk we can seethat provided A satisfies the RIP – which as shown in Section 1.4.4 allows for as fewas O(k log(n/k)) measurements – we can recover any k-sparse x exactly. This resultseems improbable on its own, and so one might expect that the procedure would behighly sensitive to noise, but we will see below that Lemma 1.6 can also be used todemonstrate that this approach is actually stable.
Note that Theorem 1.8 assumes that A satisfies the RIP. One could easily modify theargument to replace this with the assumption that A satisfies the NSPinstead. Specifically,if we are only interested in the noiseless setting, in which case h lies in the nullspace ofA, then Lemma 1.6 simplifies and its proof could essentially be broken into two steps: (i)show that if A satisfies the RIP then it satisfies the NSP (as shown in Theorem 1.5), and(ii) the NSP implies the simplified version of Lemma 1.6. This proof directly mirrorsthat of Lemma 1.6. Thus, by the same argument as in the proof of Theorem 1.8, it isstraightforward to show that if A satisfies the NSP then it will obey the same error bound.
1.5.2 Signal recovery in noise
The ability to perfectly reconstruct a sparse signal from noise-free measurements repre-sents a very promising result. However, in most real-world systems the measurementsare likely to be contaminated by some form of noise. For instance, in order to processdata in a computer we must be able to represent it using a finite number of bits, and
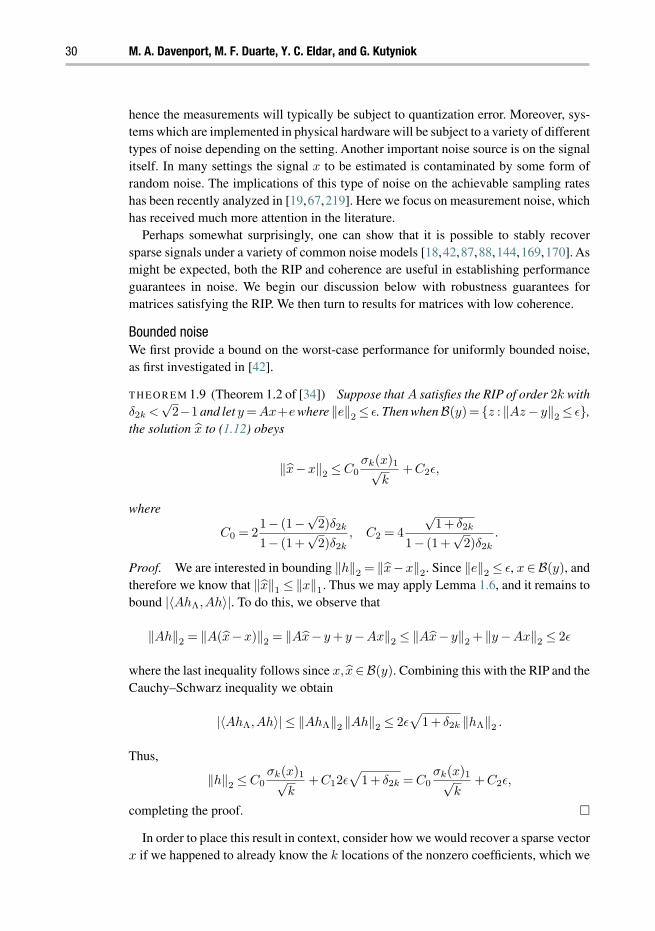
30 M. A. Davenport, M. F. Duarte, Y. C. Eldar, and G. Kutyniok
hence the measurements will typically be subject to quantization error. Moreover, sys-tems which are implemented in physical hardware will be subject to a variety of differenttypes of noise depending on the setting. Another important noise source is on the signalitself. In many settings the signal x to be estimated is contaminated by some form ofrandom noise. The implications of this type of noise on the achievable sampling rateshas been recently analyzed in [19,67,219]. Here we focus on measurement noise, whichhas received much more attention in the literature.
Perhaps somewhat surprisingly, one can show that it is possible to stably recoversparse signals under a variety of common noise models [18,42,87,88,144,169,170]. Asmight be expected, both the RIP and coherence are useful in establishing performanceguarantees in noise. We begin our discussion below with robustness guarantees formatrices satisfying the RIP. We then turn to results for matrices with low coherence.
Bounded noiseWe first provide a bound on the worst-case performance for uniformly bounded noise,as first investigated in [42].
theorem 1.9 (Theorem 1.2 of [34]) Suppose that A satisfies the RIP of order 2k withδ2k <
√2−1 and let y =Ax+e where ‖e‖2 ≤ ε. Then whenB(y)= z : ‖Az − y‖2 ≤ ε,
the solution x to (1.12) obeys
‖x−x‖2 ≤ C0σk(x)1√
k+C2ε,
where
C0 = 21− (1−
√2)δ2k
1− (1+√
2)δ2k
, C2 = 4
√1+ δ2k
1− (1+√
2)δ2k
.
Proof. We are interested in bounding ‖h‖2 = ‖x−x‖2. Since ‖e‖2 ≤ ε, x∈B(y), andtherefore we know that ‖x‖1 ≤ ‖x‖1. Thus we may apply Lemma 1.6, and it remains tobound |〈AhΛ,Ah〉|. To do this, we observe that
‖Ah‖2 = ‖A(x−x)‖2 = ‖Ax− y + y−Ax‖2 ≤ ‖Ax− y‖2 + ‖y−Ax‖2 ≤ 2ε
where the last inequality follows since x, x∈B(y). Combining this with the RIP and theCauchy–Schwarz inequality we obtain
|〈AhΛ,Ah〉| ≤ ‖AhΛ‖2 ‖Ah‖2 ≤ 2ε√
1+ δ2k ‖hΛ‖2 .
Thus,
‖h‖2 ≤ C0σk(x)1√
k+C12ε
√1+ δ2k = C0
σk(x)1√k
+C2ε,
completing the proof.
In order to place this result in context, consider how we would recover a sparse vectorx if we happened to already know the k locations of the nonzero coefficients, which we

Introduction to compressed sensing 31
denote by Λ0. This is referred to as the oracle estimator. In this case a natural approachis to reconstruct the signal using a simple pseudoinverse:6
xΛ0 = A†Λ0
y = (ATΛ0
AΛ0)−1AT
Λ0y
xΛc0= 0.
(1.13)
The implicit assumption in (1.13) is that AΛ0 has full column-rank (and hence we areconsidering the case where AΛ0 is the m× k matrix with the columns indexed by Λc
0removed) so that there is a unique solution to the equation y = AΛ0xΛ0 . With this choice,the recovery error is given by
‖x−x‖2 =∥∥(AT
Λ0AΛ0)
−1ATΛ0
(Ax+ e)−x∥∥
2 =∥∥(AT
Λ0AΛ0)
−1ATΛ0
e∥∥
2 .
We now consider the worst-case bound for this error. Using standard properties of thesingular value decomposition, it is straightforward to show that if A satisfies the RIPof order 2k (with constant δ2k), then the largest singular value of A†
Λ0lies in the range
[1/√
1+ δ2k,1/√
1− δ2k]. Thus, if we consider the worst-case recovery error over all e
such that ‖e‖2 ≤ ε, then the recovery error can be bounded by
ε√1+ δ2k
≤ ‖x−x‖2 ≤ ε√1− δ2k
.
Therefore, in the case where x is exactly k-sparse, the guarantee for the pseudoinverserecovery method, which is given perfect knowledge of the true support of x, cannotimprove upon the bound in Theorem 1.9 by more than a constant value.
We now consider a slightly different noise model. Whereas Theorem 1.9 assumedthat the noise norm ‖e‖2 was small, the theorem below analyzes a different recoveryalgorithm known as the Dantzig selector in the case where
∥∥AT e∥∥
∞ is small [45]. Wewill see below that this will lead to a simple analysis of the performance of this algorithmin Gaussian noise.
theorem 1.10 Suppose that A satisfies the RIP of order 2k with δ2k <√
2− 1 andwe obtain measurements of the form y = Ax + e where
∥∥AT e∥∥
∞ ≤ λ. Then whenB(y) = z :
∥∥AT (Az − y)∥∥
∞ ≤ λ, the solution x to (1.12) obeys
‖x−x‖2 ≤ C0σk(x)1√
k+C3
√kλ,
where
C0 = 21− (1−
√2)δ2k
1− (1+√
2)δ2k
, C3 =4√
2
1− (1+√
2)δ2k
.
6 Note that while the pseudoinverse approach can be improved upon (in terms of 2 error) by insteadconsidering alternative biased estimators [16, 108, 155, 159, 213], this does not fundamentally change theabove conclusions.

32 M. A. Davenport, M. F. Duarte, Y. C. Eldar, and G. Kutyniok
Proof. The proof mirrors that of Theorem 1.9. Since∥∥AT e
∥∥∞ ≤ λ, we again have that
x ∈ B(y), so ‖x‖1 ≤ ‖x‖1 and thus Lemma 1.6 applies. We follow a similar approachas in Theorem 1.9 to bound |〈AhΛ,Ah〉|. We first note that∥∥AT Ah
∥∥∞ ≤
∥∥AT (Ax− y)∥∥
∞ +∥∥AT (y−Ax)
∥∥∞ ≤ 2λ
where the last inequality again follows since x, x∈B(y). Next, note that AhΛ = AΛhΛ.Using this we can apply the Cauchy–Schwarz inequality to obtain
|〈AhΛ,Ah〉| =∣∣⟨hΛ,AT
ΛAh⟩∣∣≤ ‖hΛ‖2
∥∥ATΛAh
∥∥2 .
Finally, since∥∥AT Ah
∥∥∞ ≤ 2λ, we have that every coefficient of AT Ah is at most 2λ,
and thus∥∥AT
ΛAh∥∥
2 ≤√
2k(2λ). Thus,
‖h‖2 ≤ C0σk(x)1√
k+C12
√2kλ = C0
σk(x)1√k
+C3√
kλ,
as desired.
Gaussian noiseFinally, we also consider the performance of these approaches in the presence of Gaussiannoise. The case of Gaussian noise was first considered in [144], which examined theperformance of 0 minimization with noisy measurements. We now see that Theorems 1.9and 1.10 can be leveraged to provide similar guarantees for 1 minimization. To simplifyour discussion we will restrict our attention to the case where x∈Σk, so that σk(x)1 = 0
and the error bounds in Theorems 1.9 and 1.10 depend only on the noise e.To begin, suppose that the coefficients of e ∈ Rm are i.i.d. according to a Gaussian
distribution with mean zero and variance σ2. By using standard properties of the Gaussiandistribution, one can show (see, for example, Corollary 5.17 of Chapter 5) that there existsa constant c0 > 0 such that for any ε > 0,
P(‖e‖2 ≥ (1+ ε)
√mσ
)≤ exp
(−c0ε
2m), (1.14)
where P(E) denotes the probability that the event E occurs. Applying this result toTheorem 1.9 with ε = 1, we obtain the following result for the special case of Gaussiannoise.
corollary 1.1 Suppose that A satisfies the RIP of order 2k with δ2k <√
2 − 1.Furthermore, suppose that x ∈ Σk and that we obtain measurements of the form y =
Ax+ e where the entries of e are i.i.d. N (0,σ2). Then when B(y) = z : ‖Az − y‖2 ≤2√
mσ, the solution x to (1.12) obeys
‖x−x‖2 ≤ 8
√1+ δ2k
1− (1+√
2)δ2k
√mσ
with probability at least 1− exp(−c0m).

Introduction to compressed sensing 33
We can similarly consider Theorem 1.10 in the context of Gaussian noise. If we assumethat the columns of A have unit norm, then each coefficient of AT e is a Gaussian randomvariable with mean zero and variance σ2. Using standard tail bounds for the Gaussiandistribution (see, for example, (5.5) of Chapter 5), we have that
P(∣∣[AT e
]i
∣∣≥ tσ)≤ exp
(−t2/2
)for i = 1,2, . . . ,n. Thus, using the union bound over the bounds for different i, we obtain
P(∥∥AT e
∥∥∞ ≥ 2
√lognσ
)≤ nexp(−2logn) =
1
n.
Applying this to Theorem 1.10, we obtain the following result, which is a simplifiedversion of Theorem 1.1 of [45].
corollary 1.2 Suppose that A has unit-norm columns and satisfies the RIP of order2k with δ2k <
√2− 1. Furthermore, suppose that x ∈ Σk and that we obtain measure-
ments of the form y = Ax + e where the entries of e are i.i.d. N (0,σ2). Then whenB(y) = z :
∥∥AT (Az − y)∥∥
∞ ≤ 2√
lognσ, the solution x to (1.12) obeys
‖x−x‖2 ≤ 4√
2
√1+ δ2k
1− (1+√
2)δ2k
√k lognσ
with probability at least 1− 1n .
Ignoring the precise constants and the probabilities with which the stated boundshold (which we have made no effort to optimize), we observe that in the case whenm = O(k logn) these results appear to be essentially the same. However, there is asubtle difference. Specifically, if m and n are fixed and we consider the effect of varyingk, we can see that Corollary 1.2 yields a bound that is adaptive to this change, providinga stronger guarantee when k is small, whereas the bound in Corollary 1.1 does notimprove as k is reduced. Thus, while they provide very similar guarantees, there arecertain circumstances where the Dantzig selector is preferable. See [45] for furtherdiscussion of the comparative advantages of these approaches.
It can also be seen that results such as Corollary 1.2 guarantee that the Dantzig selectorachieves an error ‖x−x‖2
2 which is bounded by a constant times kσ2 logn, with highprobability. Note that since we typically require m > k logn, this can be substantiallylower than the expected noise power E‖e‖2
2 = mσ2, illustrating the fact that sparsity-based techniques are highly successful in reducing the noise level.
The value kσ2 logn is nearly optimal in several respects. First, an “oracle” estimatorwhich knows the locations of the nonzero components and uses a least-squares tech-nique to estimate their values achieves an estimation error on the order of kσ2. Forthis reason, guarantees such as Corollary 1.2 are referred to as near-oracle results. TheCramér–Rao bound (CRB) for estimating x is also on the order of kσ2 [17]. This is ofpractical interest since the CRB is achieved by the maximum likelihood estimator athigh SNR, implying that for low-noise settings, an error of kσ2 is achievable. However,

34 M. A. Davenport, M. F. Duarte, Y. C. Eldar, and G. Kutyniok
the maximum likelihood estimator is NP-hard to compute, so that near-oracle results arestill of interest. Interestingly, the logn factor seems to be an unavoidable result of thefact that the locations of the nonzero elements are unknown.
Coherence guaranteesThus far, we have examined performance guarantees based on the RIP. As noted inSection 1.4.3, in practice it is typically impossible to verify that a matrix A satisfiesthe RIP or calculate the corresponding RIP constant δ. In this respect, results based oncoherence are appealing, since they can be used with arbitrary dictionaries.
One quick route to coherence-based performance guarantees is to combine RIP-basedresults such as Corollaries 1.1 and 1.2 with coherence bounds such as Lemma 1.5. Thistechnique yields guarantees based only on the coherence, but the results are often overlypessimistic. It is typically more enlightening to instead establish guarantees by directlyexploiting coherence [18, 37, 87, 88]. In order to illustrate the types of guarantees thatthis approach can yield, we provide the following representative examples.
theorem 1.11 (Theorem 3.1 of [88]) Suppose that A has coherence µ and that x∈Σk
with k < (1/µ+1)/4. Furthermore, suppose that we obtain measurements of the formy = Ax+ e. Then when B(y) = z : ‖Az − y‖2 ≤ ε, the solution x to (1.12) obeys
‖x− x‖2 ≤ ‖e‖2 + ε√1−µ(4k− 1)
.
Note that this theorem holds for the case where ε = 0 as well as where ‖e‖2 = 0.Thus, it also applies to the noise-free setting as in Theorem 1.8. Furthermore, there is norequirement that‖e‖2 ≤ ε. In fact, this theorem is valid even when ε=0but‖e‖2 =0. Thisconstitutes a significant difference between this result and Theorem 1.9, and might causeus to question whether we actually need to pose alternative algorithms to handle the noisysetting. However, as noted in [88], Theorem 1.11 is the result of a worst-case analysisand will typically overestimate the actual error. In practice, the performance of (1.12)where B(y) is modified to account for the noise can lead to significant improvements.
In order to describe an additional type of coherence-based guarantee, we must con-sider an alternative, but equivalent, formulation of (1.12). Specifically, consider theoptimization problem
x = argminz
1
2‖Az − y‖2
2 +λ‖z‖1 . (1.15)
This formulation is exploited in the following result, which provides guarantees for(1.15) that go beyond what we have seen so far by providing explicit results concerningthe recovery of the original support of x.
theorem 1.12 (Corollary 1 of [18]) Suppose that A has coherence µ and that x ∈Σk with k ≤ 1/(3µ). Furthermore, suppose that we obtain measurements of the formy = Ax+ e where the entries of e are i.i.d. N (0,σ2). Set
λ =√
8σ2(1+α) log(n−k)
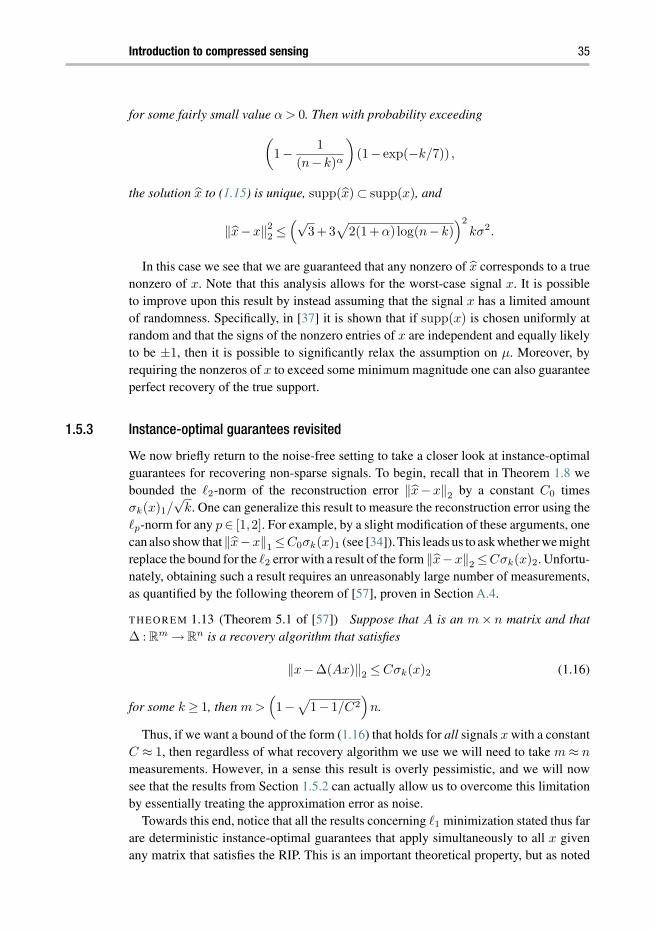
Introduction to compressed sensing 35
for some fairly small value α > 0. Then with probability exceeding(1− 1
(n−k)α
)(1− exp(−k/7)) ,
the solution x to (1.15) is unique, supp(x) ⊂ supp(x), and
‖x−x‖22 ≤
(√3+3
√2(1+α) log(n−k)
)2kσ2.
In this case we see that we are guaranteed that any nonzero of x corresponds to a truenonzero of x. Note that this analysis allows for the worst-case signal x. It is possibleto improve upon this result by instead assuming that the signal x has a limited amountof randomness. Specifically, in [37] it is shown that if supp(x) is chosen uniformly atrandom and that the signs of the nonzero entries of x are independent and equally likelyto be ±1, then it is possible to significantly relax the assumption on µ. Moreover, byrequiring the nonzeros of x to exceed some minimum magnitude one can also guaranteeperfect recovery of the true support.
1.5.3 Instance-optimal guarantees revisited
We now briefly return to the noise-free setting to take a closer look at instance-optimalguarantees for recovering non-sparse signals. To begin, recall that in Theorem 1.8 webounded the 2-norm of the reconstruction error ‖x−x‖2 by a constant C0 timesσk(x)1/
√k. One can generalize this result to measure the reconstruction error using the
p-norm for any p∈ [1,2]. For example, by a slight modification of these arguments, onecan also show that‖x−x‖1 ≤C0σk(x)1 (see [34]). This leads us to ask whether we mightreplace the bound for the 2 error with a result of the form ‖x−x‖2 ≤Cσk(x)2. Unfortu-nately, obtaining such a result requires an unreasonably large number of measurements,as quantified by the following theorem of [57], proven in Section A.4.
theorem 1.13 (Theorem 5.1 of [57]) Suppose that A is an m× n matrix and that∆ : Rm → Rn is a recovery algorithm that satisfies
‖x−∆(Ax)‖2 ≤ Cσk(x)2 (1.16)
for some k ≥ 1, then m >(1−
√1− 1/C2
)n.
Thus, if we want a bound of the form (1.16) that holds for all signals x with a constantC ≈ 1, then regardless of what recovery algorithm we use we will need to take m ≈ n
measurements. However, in a sense this result is overly pessimistic, and we will nowsee that the results from Section 1.5.2 can actually allow us to overcome this limitationby essentially treating the approximation error as noise.
Towards this end, notice that all the results concerning 1 minimization stated thus farare deterministic instance-optimal guarantees that apply simultaneously to all x givenany matrix that satisfies the RIP. This is an important theoretical property, but as noted
36 M. A. Davenport, M. F. Duarte, Y. C. Eldar, and G. Kutyniok
in Section 1.4.4, in practice it is very difficult to obtain a deterministic guarantee thatthe matrix A satisfies the RIP. In particular, constructions that rely on randomness areonly known to satisfy the RIP with high probability. As an example, Theorem 5.65 ofChapter 5 states that if a matrix A is chosen according to a sub-gaussian distributionwith m = O
(k log(n/k)/δ2
2k
), then A will satisfy the RIP of order 2k with probability at
least 1− 2exp(−c1δ22km). Results of this kind open the door to slightly weaker results
that hold only with high probability.Even within the class of probabilistic results, there are two distinct flavors. The typical
approach is to combine a probabilistic construction of a matrix that will satisfy the RIPwith high probability with the previous results in this chapter. This yields a procedurethat, with high probability, will satisfy a deterministic guarantee applying to all possiblesignals x. A weaker kind of result is one that states that given a signal x, we can draw arandom matrix A and with high probability expect certain performance for that signalx. This type of guarantee is sometimes called instance-optimal in probability. The dis-tinction is essentially whether or not we need to draw a new random A for each signal x.This may be an important distinction in practice, but if we assume for the moment thatit is permissible to draw a new matrix A for each x, then we can see that Theorem 1.13may be somewhat pessimistic, exhibited by the following result.
theorem 1.14 Let x ∈ Rn be fixed. Set δ2k <√
2− 1. Suppose that A is an m×n
sub-gaussian random matrix with m = O(k log(n/k)/δ2
2k
). Suppose we obtain mea-
surements of the form y = Ax. Set ε = 2σk(x)2. Then with probability exceeding1 − 2exp(−c1δ
22km) − exp(−c0m), when B(y) = z : ‖Az − y‖2 ≤ ε, the solution
x to (1.12) obeys
‖x−x‖2 ≤ 8√
1+ δ2k − (1+√
2)δ2k
1− (1+√
2)δ2k
σk(x)2.
Proof. First we recall that, as noted above, from Theorem 5.65 of Chapter 5 we have thatA will satisfy the RIP of order 2k with probability at least 1−2exp(−c1δ
22km). Next, let
Λ denote the index set corresponding to the k entries of x with largest magnitude and writex = xΛ +xΛc . Since xΛ ∈Σk, we can write Ax = AxΛ +AxΛc = AxΛ +e. If A is sub-gaussian then AxΛc is also sub-gaussian (see Chapter 5 for details), and one can apply asimilar result to (1.14) to obtain that with probability at least 1−exp(−c0m), ‖AxΛc‖2 ≤2‖xΛc‖2 = 2σk(x)2. Thus, applying the union bound we have that with probabilityexceeding 1− 2exp(−c1δ
22km)− exp(−c0m), we satisfy the necessary conditions to
apply Theorem 1.9 to xΛ, in which case σk(xΛ)1 = 0 and hence
‖x−xΛ‖2 ≤ 2C2σk(x)2.
From the triangle inequality we thus obtain
‖x−x‖2 = ‖x−xΛ +xΛ −x‖2 ≤ ‖x−xΛ‖2 + ‖xΛ −x‖2 ≤ (2C2 +1)σk(x)2
which establishes the theorem.

Introduction to compressed sensing 37
Thus, while it is not possible to achieve a deterministic guarantee of the form in (1.16)without taking a prohibitively large number of measurements, it is possible to show thatsuch performance guarantees can hold with high probability while simultaneously takingfar fewer measurements than would be suggested by Theorem 1.13. Note that the aboveresult applies only to the case where the parameter is selected correctly, which requiressome limited knowledge of x, namely σk(x)2. In practice this limitation can easily beovercome through a parameter selection technique such as cross-validation [243], butthere also exist more intricate analyses of 1 minimization that show it is possible toobtain similar performance without requiring an oracle for parameter selection [248].Note that Theorem 1.14 can also be generalized to handle other measurement matricesand to the case where x is compressible rather than sparse. Moreover, this proof techniqueis applicable to a variety of the greedy algorithms described in Chapter 8 that do notrequire knowledge of the noise level to establish similar results [56, 190].
1.5.4 The cross-polytope and phase transitions
While the RIP-based analysis of 1 minimization allows us to establish a variety ofguarantees under different noise settings, one drawback is that the analysis of how manymeasurements are actually required for a matrix to satisfy the RIP is relatively loose. Analternative approach to analyzing 1 minimization algorithms is to examine them from amore geometric perspective. Towards this end, we define the closed 1 ball, also knownas the cross-polytope:
Cn = x ∈ Rn : ‖x‖1 ≤ 1 .
Note that Cn is the convex hull of 2n points pi2ni=1. Let ACn ⊆Rm denote the convex
polytope defined as either the convex hull of Api2ni=1 or equivalently as
ACn = y ∈ Rm : y = Ax,x ∈ Cn .
For any x ∈ Σk, we can associate a k-face of Cn with the support and sign pattern ofx. One can show that the number of k-faces of ACn is precisely the number of indexsets of size k for which signals supported on them can be recovered by (1.12) withB(y) = z : Az = y. Thus, 1 minimization yields the same solution as 0 minimizationfor all x ∈ Σk if and only if the number of k-faces of ACn is identical to the number ofk-faces of Cn. Moreover, by counting the number of k-faces of ACn, we can quantifyexactly what fraction of sparse vectors can be recovered using 1 minimization with A
as our sensing matrix. See [81, 84, 92–94] for more details and [95] for an overview ofthe implications of this body of work. Note also that by replacing the cross-polytopewith certain other polytopes (the simplex and the hypercube), one can apply the sametechnique to obtain results concerning the recovery of more limited signal classes, suchas sparse signals with non-negative or bounded entries [95].
Given this result, one can then study random matrix constructions from this perspectiveto obtain probabilistic bounds on the number of k-faces of ACn with A generated atrandom, such as from a Gaussian distribution. Under the assumption that k = ρm andm = γn, one can obtain asymptotic results as n →∞. This analysis shows that there is

38 M. A. Davenport, M. F. Duarte, Y. C. Eldar, and G. Kutyniok
a phase transition, i.e., for very large problem sizes there are sharp thresholds dictatingthat the fraction of k-faces preserved will tend to either one or zero with very highprobability, depending on ρ and γ [95]. For the precise values of ρ and γ which willenable successful recovery and for further discussion of similar results, see Chapters 7and 9.
These results provide sharp bounds on the minimum number of measurements requiredin the noiseless case. In general, these bounds are significantly stronger than the corre-sponding measurement bounds obtained within the RIP-based framework, which tendto be extremely loose in terms of the constants involved. However, these sharper boundsalso require somewhat more intricate analysis and typically more restrictive assump-tions on A (such as it being Gaussian). Thus, one of the main strengths of the RIP-basedanalysis presented in this chapter is that it gives results for a very broad class of matricesthat can also be extended to noisy settings.
1.6 Signal recovery algorithms
We now discuss a number of algorithmic approaches to the problem of signal recoveryfrom CS measurements. While this problem has received significant attention in recentyears in the context of CS, many of these techniques pre-date the field of CS. There are avariety of algorithms that have been used in applications such as sparse approximation,statistics, geophysics, and theoretical computer science that were developed to exploitsparsity in other contexts and can be brought to bear on the CS recovery problem. Webriefly review some of these, and refer the reader to later chapters as well as the overviewin [226] for further details.
Note that we restrict our attention here to algorithms that actually reconstruct theoriginal signal x. In some settings the end goal is to solve some kind of inferenceproblem such as detection, classification, or parameter estimation, in which case a fullreconstruction may not be necessary [69–71, 74, 100, 101, 143, 145].
1 minimization algorithmsThe 1 minimization approach analyzed in Section 1.5 provides a powerful frameworkfor recovering sparse signals. The power of 1 minimization is that not only will itlead to a provably accurate recovery, but the formulations described in Section 1.5 arealso convex optimization problems for which there exist efficient and accurate numericalsolvers [194]. For example, (1.12) with B(y) = z : Az = y can be posed as a linear pro-gram. In the cases where B(y) = z : ‖Az − y‖2 ≤ ε or B(y) = z :
∥∥AT (Az − y)∥∥
∞ ≤λ, the minimization problem (1.12) becomes a convex program with a conic constraint.
While these optimization problems could all be solved using general-purpose convexoptimization software, there now also exist a tremendous variety of algorithms designedto explicitly solve these problems in the context of CS. This body of literature has pri-marily focused on the case where B(y) = z : ‖Az − y‖2 ≤ ε. However, there existmultiple equivalent formulations of this program. For instance, the majority of 1 mini-mization algorithms in the literature have actually considered the unconstrained version

Introduction to compressed sensing 39
of this problem, i.e.,
x = argminz
1
2‖Az − y‖2
2 +λ‖z‖1 .
See, for example, [11, 120, 122, 138, 175, 197, 246, 249–251]. Note that for some choiceof the parameter λ this optimization problem will yield the same result as the constrainedversion of the problem given by
x = argminz
‖z‖1 subject to ‖Az − y‖2 ≤ ε.
However, in general the value of λ which makes these problems equivalent is unknowna priori. Several approaches for choosing λ are discussed in [110, 123, 133]. Since inmany settings ε is a more natural parameterization (being determined by the noise orquantization level), it is also useful to have algorithms that directly solve the latterformulation. While there are fewer efforts in this direction, there also exist some excellentsolvers for this problem [12, 13, 231]. Note that [13] also provides solvers for a varietyof other 1 minimization problems, such as for the Dantzig selector.
Greedy algorithmsWhile convex optimization techniques are powerful methods for computing sparserepresentations, there is also a variety of greedy/iterative methods for solving such prob-lems [21, 23, 24, 56, 64, 66, 75, 85, 96, 153, 182, 183, 190–192, 220, 222, 223]. Greedyalgorithms rely on iterative approximation of the signal coefficients and support, eitherby iteratively identifying the support of the signal until a convergence criterion is met, oralternatively by obtaining an improved estimate of the sparse signal at each iteration thatattempts to account for the mismatch to the measured data. Some greedy methods canactually be shown to have performance guarantees that match those obtained for convexoptimization approaches. In fact, some of the more sophisticated greedy algorithms areremarkably similar to those used for 1 minimization described above. However, thetechniques required to prove performance guarantees are substantially different.
We refer the reader to Chapter 8 for a more detailed overview of greedy algorithms andtheir performance. Here we briefly highlight some of the most common methods and theirtheoretical guarantees. Two of the oldest and simplest greedy approaches are OrthogonalMatching Pursuit (OMP) and iterative thresholding. We first consider OMP [183], whichbegins by finding the column of A most correlated with the measurements. The algorithmthen repeats this step by correlating the columns with the signal residual, which isobtained by subtracting the contribution of a partial estimate of the signal from theoriginal measurement vector. The algorithm is formally defined as Algorithm 1.1, whereHk(x) denotes the hard thresholding operator on x that sets all entries to zero exceptfor the k entries of x with largest magnitude. The stopping criterion can consist ofeither a limit on the number of iterations, which also limits the number of nonzeros inx, or a requirement that y ≈ Ax in some sense. Note that in either case, if OMP runsfor m iterations then it will always produce an estimate x such that y = Ax. Iterativethresholding algorithms are often even more straightforward. For an overview see [107].As an example, we consider Iterative Hard Thresholding (IHT) [24], which is described

40 M. A. Davenport, M. F. Duarte, Y. C. Eldar, and G. Kutyniok
Algorithm 1.1 Orthogonal Matching PursuitInputs: CS matrix/dictionary A, measurement vector y
Initialize: x0 = 0, r0 = y, Λ0 = ∅.for i = 1; i := i+1 until stopping criterion is met do
gi ← AT ri−1 form signal estimate from residualΛi ← Λi−1 ∪ supp(H1(gi)) add largest residual entry to supportxi|Λi
← A†Λi
y, xi|Λci← 0 update signal estimate
ri ← y−Axi update measurement residualend forOutput: Sparse representation x
Algorithm 1.2 Iterative Hard ThresholdingInputs: CS matrix/dictionary A, measurement vector y, sparsity level k
Initialize: x0 = 0.for i = 1; i := i+1 until stopping criterion is met do
xi = Hk
(xi−1 +AT (y−Axi−1)
)end forOutput: Sparse representation x
in Algorithm 1.2. Starting from an initial signal estimate x0 = 0, the algorithm iteratesa gradient descent step followed by hard thresholding until a convergence criterionis met.
OMP and IHT both satisfy many of the same guarantees as 1 minimization. For exam-ple, under a slightly stronger assumption on the RIP constant, iterative hard thresholdingsatisfies a very similar guarantee to that of Theorem 1.9. We refer the reader to Chapter 8for further details on the theoretical properties of thresholding algorithms, and focus hereon OMP.
The simplest guarantees for OMP state that for exactly k-sparse x with noise-freemeasurements y = Ax, OMP will recover x exactly in k iterations. This analysis hasbeen performed for both matrices satisfying the RIP [75] and matrices with boundedcoherence [220]. In both results, however, the required constants are relatively small, sothat the results only apply when m = O(k2 log(n)).
There have been many efforts to improve upon these basic results. As one example,in [173] the required number of measurements is reduced to m = O(k1.6 log(n)) byallowing OMP to run for more than k iterations. More recently, it has been shown thatthis can be even further relaxed to the more familiar m = O(k log(n)) and that OMP isstable with respect to bounded noise, yielding a guarantee along the lines of Theorem 1.9but only for exactly sparse signals [254]. Both of these analyses have exploited the RIP.There has also been recent progress in using the RIP to analyze the performance of OMPon non-sparse signals [10]. At present, however, RIP-based analysis of OMP remains atopic of ongoing work.
Introduction to compressed sensing 41
Note that all of the above efforts have aimed at establishing uniform guarantees(although often restricted to exactly sparse signals). In light of our discussion of proba-bilistic guarantees in Section 1.5.3, one might expect to see improvements by consideringless restrictive guarantees. As an example, it has been shown that by considering randommatrices for A OMP can recover k-sparse signals in k iterations with high probabilityusing only m = O(k log(n)) measurements [222]. Similar improvements are also pos-sible by placing restrictions on the smallest nonzero value of the signal, as in [88].Furthermore, such restrictions also enable near-optimal recovery guarantees when themeasurements are corrupted by Gaussian noise [18].
Combinatorial algorithmsIn addition to 1 minimization and greedy algorithms, there is another important classof sparse recovery algorithms that we will refer to as combinatorial algorithms. Thesealgorithms, mostly developed by the theoretical computer science community, in manycases pre-date the compressive sensing literature but are highly relevant to the sparsesignal recovery problem.
The historically oldest of these algorithms were developed in the context of combina-torial group testing [98,116,160,210]. In this problem we suppose that there are n totalitems and k anomalous elements that we wish to find. For example, we might wish toidentify defective products in an industrial setting, or identify a subset of diseased tissuesamples in a medical context. In both of these cases the vector x indicates which elementsare anomalous, i.e., xi = 0 for the k anomalous elements and xi = 0 otherwise. Our goalis to design a collection of tests that allow us to identify the support (and possibly thevalues of the nonzeros) of x while also minimizing the number of tests performed. In thesimplest practical setting these tests are represented by a binary matrix A whose entriesaij are equal to 1 if and only if the jth item is used in the ith test. If the output of thetest is linear with respect to the inputs, then the problem of recovering the vector x isessentially the same as the standard sparse recovery problem in CS.
Another application area in which combinatorial algorithms have proven useful iscomputation on data streams [59,189]. As an example of a typical data streaming prob-lem, suppose that xi represents the number of packets passing through a network routerwith destination i. Simply storing the vector x is typically infeasible since the total num-ber of possible destinations (represented by a 32-bit IP address) is n = 232. Thus, insteadof attempting to store x directly, one can store y = Ax where A is an m×n matrix withm n. In this context the vector y is often called a sketch. Note that in this problem y
is computed in a different manner than in the compressive sensing context. Specifically,in the network traffic example we do not ever observe xi directly, rather we observeincrements to xi (when a packet with destination i passes through the router). Thus weconstruct y iteratively by adding the ith column to y each time we observe an incrementto xi, which we can do since y = Ax is linear. When the network traffic is dominatedby traffic to a small number of destinations, the vector x is compressible, and thus theproblem of recovering x from the sketch Ax is again essentially the same as the sparserecovery problem in CS.

42 M. A. Davenport, M. F. Duarte, Y. C. Eldar, and G. Kutyniok
Despite the fact that in both of these settings we ultimately wish to recover a sparsesignal from a small number of linear measurements, there are also some importantdifferences between these settings and CS. First, in these settings it is natural to assumethat the designer of the reconstruction algorithm also has full control over A, and isthus free to choose A in a manner that reduces the amount of computation required toperform recovery. For example, it is often useful to design A so that it has very fewnonzeros, i.e., the sensing matrix itself is also sparse [8, 128, 154]. In general, mostmethods involve careful construction of the sampling matrix A (although some schemesdo involve “generic” sparse matrices, for example, see [20]). This is in contrast with theoptimization and greedy methods that work with any matrix satisfying the conditionsdescribed in Section 1.4. Of course, this additional structure can often lead to significantlyfaster algorithms [51, 60, 129, 130].
Second, note that the computational complexity of all the convex methods and greedyalgorithms described above is always at least linear in terms of n, since in order to recoverx we must at least incur the computational cost of reading out all n entries of x. Whilethis may be acceptable in most typical CS applications, this becomes impractical when n
is extremely large, as in the network monitoring example. In this context, one may seekto develop algorithms whose complexity is linear only in the length of the representationof the signal, i.e., its sparsity k. In this case the algorithm does not return a completereconstruction of x but instead returns only its k largest elements (and their indices). Assurprising as it may seem, such algorithms are indeed possible. See [60, 129, 130] forexamples.
1.7 Multiple measurement vectors
Many potential applications of CS involve distributed acquisition of multiple correlatedsignals. The multiple signal case where all l signals involved are sparse and exhibitthe same indices for their nonzero coefficients is well known in sparse approximationliterature, where it has been termed the multiple measurement vector (MMV) prob-lem [52, 63, 134, 185, 221, 223, 232]. In the MMV setting, rather than trying to recovereach single sparse vector xi independently for i = 1, . . . , l, the goal is to jointly recoverthe set of vectors by exploiting their common sparse support. Stacking these vectors intothe columns of a matrix X , there will be at most k non-zero rows in X . That is, notonly is each vector k-sparse, but the non-zero values occur on a common location set.We therefore say that X is row-sparse and use the notation Λ = supp(X) to denote theindex set corresponding to non-zero rows.7
MMV problems appear quite naturally in many different application areas. Earlywork on MMV algorithms focused on magnetoencephalography, which is a modalityfor imaging the brain [134, 135, 200]. Similar ideas were also developed in the context
7 The MMV problem can be converted into a block-sparse recovery problem through appropriate rasterizingof the matrix X and the construction of a single matrix A′ ∈ Rlm×ln dependent on the matrixA ∈ Rm×n used for each of the signals.

Introduction to compressed sensing 43
of array processing [135, 157, 181], equalization of sparse communication channels [2,62,119,142], and more recently cognitive radio and multiband communications [9,114,186–188, 252].
Conditions on measurement matricesAs in standard CS, we assume that we are given measurements yil
i=1 where eachvector is of length m < n. Letting Y be the m× l matrix with columns yi, our problemis to recover X assuming a known measurement matrix A so that Y = AX . Clearly, wecan apply any CS method to recover xi from yi as before. However, since the vectorsxi all have a common support, we expect intuitively to improve the recovery ability byexploiting this joint information. In other words, we should in general be able to reducethe number of measurements ml needed to represent X below sl, where s is the numberof measurements required to recover one vector xi for a given matrix A.
Since |Λ| = k, the rank of X satisfies rank(X) ≤ k. When rank(X) = 1, all thesparse vectors xi are multiples of each other, so that there is no advantage to their jointprocessing. However, when rank(X) is large, we expect to be able to exploit the diversityin its columns in order to benefit from joint recovery. This essential result is capturednicely by the following necessary and sufficient uniqueness condition:
theorem 1.15 (Theorem 2 of [76]) A necessary and sufficient condition for themeasurements Y = AX to uniquely determine the row sparse matrix X is that
|supp(X)| < spark(A)− 1+ rank(X)
2. (1.17)
As shown in [76], we can replace rank(X) by rank(Y ) in (1.17). The sufficientdirection of this condition was shown in [185] to hold even in the case where there areinfinitely many vectors xi. A direct consequence of Theorem 1.15 is that matrices X
with larger rank can be recovered from fewer measurements. Alternatively, matrices X
with larger support can be recovered from the same number of measurements. Whenrank(X) = k and spark(A) takes on its largest possible value equal to m+1, condition(1.17) becomes m≥k+1. Therefore, in this best-case scenario, only k+1 measurementsper signal are needed to ensure uniqueness. This is much lower than the value of 2k
obtained in standard CS via the spark (cf. Theorem 1.7), which we refer to here as thesingle measurement vector (SMV) setting. Furthermore, when X is full rank, it can berecovered by a simple algorithm, in contrast to the combinatorial complexity needed tosolve the SMV problem from 2k measurements for general matrices A. See Chapter 8for more details.
Recovery algorithmsA variety of algorithms have been proposed that exploit the joint sparsity in differentways when X is not full rank. As in the SMV setting, two main approaches to solvingMMV problems are based on convex optimization and greedy methods. The analog of(1.10) in the MMV case is
X = arg minX∈Rn×l
‖X‖p,0 subject to Y = AX, (1.18)

44 M. A. Davenport, M. F. Duarte, Y. C. Eldar, and G. Kutyniok
where we define the p,q norms for matrices as
‖X‖p,q =
(∑i
‖xi‖qp
)1/q
with xi denoting the ith row of X . With a slight abuse of notation, we also consider theq = 0 case where ‖X‖p,0 = |supp(X)| for any p. Optimization-based algorithms relaxthe 0 norm in (1.18) and attempt to recover X by mixed norm minimization:
X = arg minX∈Rn×l
‖X‖p,q subject to Y = AX
for some p,q ≥ 1; values for p and q of 1, 2, and ∞ have been advocated [52, 63,114, 121, 221, 223]. The standard greedy approaches in the SMV setting have also beenextended to the MMV case; see Chapter 8 for more details. Furthermore, one can alsoreduce the MMV problem into an SMV problem and solve using standard CS recoveryalgorithms [185]. This reduction can be particularly beneficial in large-scale problems,such as those resulting from analog sampling.
Multiple measurement vector models can also be used to perform blind CS, in whichthe sparsifying basis is learned together with the representation coefficients [131]. Whileall standard CS algorithms assume that the sparsity basis is known in the recoveryprocess, blind CS does not require this knowledge. When multiple measurements areavailable it can be shown that under certain conditions on the sparsity basis, blind CS ispossible thus avoiding the need to know the sparsity basis in both the sampling and therecovery process.
In terms of theoretical guarantees, it can be shown that MMV extensions of SMValgorithms will recover X under similar conditions to the SMV setting in the worst-casescenario [4, 52, 114, 115] so that theoretical equivalence results for arbitrary values ofX do not predict any performance gain with joint sparsity. In practice, however, mul-tichannel reconstruction techniques perform much better than recovering each channelindividually. The reason for this discrepancy is that these results apply to all possible inputsignals, and are therefore worst-case measures. Clearly, if we input the same signal toeach channel, namely when rank(X) = 1, no additional information on the joint supportis provided from multiple measurements. However, as we have seen in Theorem 1.15,higher ranks of the input X improve the recovery ability.
Another way to improve performance guarantees is by considering random valuesof X and developing conditions under which X is recovered with high probability[7, 115, 137, 208]. Average case analysis can be used to show that fewer measurementsare needed in order to recover X exactly [115]. In addition, under a mild condition on thesparsity and on the matrix A, the failure probability decays exponentially in the numberof channels l [115].
Finally, we note that algorithms similar to those used for MMV recovery can also beadapted to block-sparse reconstruction [112, 114, 253].

Introduction to compressed sensing 45
1.8 Summary
Compressed sensing is an exciting, rapidly growing field that has attracted considerableattention in signal processing, statistics, and computer science, as well as the broaderscientific community. Since its initial development, only a few years ago, thousands ofpapers have appeared in this area, and hundreds of conferences, workshops, and specialsessions have been dedicated to this growing research field. In this chapter, we havereviewed some of the basics of the theory underlying CS. We have also aimed, throughoutour summary, to highlight new directions and application areas that are at the frontier ofCS research. This chapter should serve as a review to practitioners wanting to join thisemerging field, and as a reference for researchers. Our hope is that this presentation willattract the interest of both mathematicians and engineers in the desire to encourage furtherresearch into this new frontier as well as promote the use of CS in practical applications.In subsequent chapters of the book, we will see how the fundamentals presented in thischapter are expanded and extended in many exciting directions, including new modelsfor describing structure in both analog and discrete-time signals, new sensing designtechniques, more advanced recovery results and powerful new recovery algorithms, andemerging applications of the basic theory and its extensions.
Acknowledgements
The authors would like to thank Ewout van den Berg, Piotr Indyk, Yaniv Plan, and theauthors contributing to this book for their valuable feedback on a preliminary version ofthis manuscript.
A Appendix: proofs for Chapter 1
A.1 Proof of Theorem 1.4
To prove Theorem 1.4 we first provide a preliminary lemma. The proof of this result isbased on techniques from [166].
lemma A.1 Let k and n satisfying k < n/2 be given. There exists a set X ⊂ Σk suchthat for any x ∈ X we have ‖x‖2 ≤
√k and for any x,z ∈ X with x = z
‖x− z‖2 ≥√
k/2 (A.1)
and
log |X| ≥ k
2log
(n
k
).
Proof. We will begin by considering the set
U = x ∈ 0,+1,−1n: ‖x‖0 = k .

46 M. A. Davenport, M. F. Duarte, Y. C. Eldar, and G. Kutyniok
By construction, ‖x‖22 = k for all x ∈ U . Thus if we construct X by picking elements
from U then we automatically have ‖x‖2 ≤√
k.Next, observe that |U | =
(nk
)2k. Note also that if x, z ∈ U then ‖x− z‖0 ≤ ‖x− z‖2
2,
and thus if ‖x− z‖22 ≤ k/2 then ‖x− z‖0 ≤ k/2. From this we observe that for any fixed
x ∈ U ,∣∣∣z ∈ U : ‖x− z‖22 ≤ k/2
∣∣∣≤ |z ∈ U : ‖x− z‖0 ≤ k/2| ≤(
n
k/2
)3k/2.
Thus, suppose we construct the set X by iteratively choosing points that satisfy (A.1).After adding j points to the set, there are at least(
n
k
)2k − j
(n
k/2
)3k/2
points left to pick from. Thus, we can construct a set of size |X| provided that
|X|(
n
k/2
)3k/2 ≤
(n
k
)2k. (A.2)
Next, observe that
(nk
)(n
k/2
) =(k/2)!(n−k/2)!
k!(n−k)!=
k/2∏i=1
n−k + i
k/2+ i≥(
n
k− 1
2
)k/2
,
where the inequality follows from the fact that (n−k + i)/(k/2+ i) is decreasing as afunction of i. Thus, if we set |X| = (n/k)k/2 then we have
|X|(
3
4
)k/2
=
(3n
4k
)k/2
=(n
k− n
4k
)k/2≤(
n
k− 1
2
)k/2
≤(nk
)(n
k/2
) .Hence, (A.2) holds for |X| = (n/k)k/2, which establishes the lemma.
Using this lemma, we can establish Theorem 1.4.
theorem 1.4 (Theorem 3.5 of [67]) Let A be an m×n matrix that satisfies the RIPof order 2k with constant δ2k ∈ (0,1/2]. Then
m ≥ Ck log(n
k
)where C = 1/2log(
√24+1) ≈ 0.28.
Proof. We first note that since A satisfies the RIP, then for the set of points X inLemma A.1 we have,
‖Ax−Az‖2 ≥√
1− δ2k ‖x− z‖2 ≥√
k/4

Introduction to compressed sensing 47
for all x,z ∈ X , since x− z ∈ Σ2k and δ2k ≤ 1/2. Similarly, we also have
‖Ax‖2 ≤√
1+ δ2k ‖x‖2 ≤√
3k/2
for all x ∈ X .From the lower bound we can say that for any pair of points x,z ∈ X , if we center
balls of radius√
k/4/2 =√
k/16 at Ax and Az, then these balls will be disjoint. Inturn, the upper bound tells us that the entire set of balls is itself contained within a largerball of radius
√3k/2+
√k/16. If we let Bm(r) = x ∈ Rm : ‖x‖2 ≤ r, then
Vol(Bm
(√3k/2+
√k/16
))≥ |X| ·Vol
(Bm
(√k/16
)),
⇔(√
3k/2+√
k/16)m
≥ |X| ·(√
k/16)m
,
⇔(√
24+1)m
≥ |X|,
⇔ m ≥ log |X|log
(√24+1
) .The theorem follows by applying the bound for |X| from Lemma A.1.
A.2 Proof of Lemma 1.3
To begin, we establish the following preliminary lemmas.
lemma A.2 Suppose u,v are orthogonal vectors. Then
‖u‖2 + ‖v‖2 ≤√
2‖u+ v‖2 .
Proof. We begin by defining the 2 × 1 vector w = [‖u‖2 ,‖v‖2]T . By applying
Lemma 1.2 with k = 2, we have ‖w‖1 ≤√
2‖w‖2. From this we obtain
‖u‖2 + ‖v‖2 ≤√
2
√‖u‖2
2 + ‖v‖22.
Since u and v are orthogonal, ‖u‖22 + ‖v‖2
2 = ‖u+ v‖22, which yields the desired result.
lemma A.3 If A satisfies the RIP of order 2k, then for any pair of vectors u,v ∈ Σk
with disjoint support,
|〈Au,Av〉| ≤ δ2k ‖u‖2 ‖v‖2 .
Proof. Suppose u,v∈Σk with disjoint support and that ‖u‖2 = ‖v‖2 =1.Then, u±v∈Σ2k and ‖u± v‖2
2 = 2. Using the RIP we have
2(1− δ2k) ≤ ‖Au±Av‖22 ≤ 2(1+ δ2k).

48 M. A. Davenport, M. F. Duarte, Y. C. Eldar, and G. Kutyniok
Finally, applying the parallelogram identity
|〈Au,Av〉| ≤ 1
4
∣∣∣‖Au+Av‖22 −‖Au−Av‖2
2
∣∣∣≤ δ2k
establishes the lemma.
lemma A.4 Let Λ0 be an arbitrary subset of 1,2, . . . ,n such that |Λ0| ≤ k. For anyvector u ∈ Rn, define Λ1 as the index set corresponding to the k largest entries of uΛc
0
(in absolute value), Λ2 as the index set corresponding to the next k largest entries, andso on. Then ∑
j≥2
∥∥uΛj
∥∥2 ≤
∥∥uΛc0
∥∥1√
k.
Proof. We begin by observing that for j ≥ 2,
∥∥uΛj
∥∥∞ ≤
∥∥uΛj−1
∥∥1
k
since the Λj sort u to have decreasing magnitude. Applying Lemma 1.2 we have
∑j≥2
∥∥uΛj
∥∥2 ≤
√k∑j≥2
∥∥uΛj
∥∥∞ ≤ 1√
k
∑j≥1
∥∥uΛj
∥∥1 =
∥∥uΛc0
∥∥1√
k,
proving the lemma.
We are now in a position to prove Lemma 1.3. The key ideas in this proof followfrom [34].
lemma 1.3 Suppose that A satisfies the RIP of order 2k. Let Λ0 be an arbitrary subsetof 1,2, . . . ,n such that |Λ0| ≤ k, and let h ∈ Rn be given. Define Λ1 as the index setcorresponding to the k entries of hΛc
0with largest magnitude, and set Λ = Λ0∪Λ1. Then
‖hΛ‖2 ≤ α
∥∥hΛc0
∥∥1√
k+β
|〈AhΛ,Ah〉|‖hΛ‖2
,
where
α =
√2δ2k
1− δ2k, β =
1
1− δ2k.
Proof. Since hΛ ∈ Σ2k, the lower bound of the RIP immediately yields
(1− δ2k)‖hΛ‖22 ≤ ‖AhΛ‖2
2 . (A.3)
Define Λj as in Lemma A.4, then since AhΛ = Ah−∑
j≥2 AhΛj , we can rewrite (A.3)as
(1− δ2k)‖hΛ‖22 ≤ 〈AhΛ,Ah〉−
⟨AhΛ,
∑j≥2
AhΛj
⟩. (A.4)

Introduction to compressed sensing 49
In order to bound the second term of (A.4), we use Lemma A.3, which implies that∣∣⟨AhΛi ,AhΛj
⟩∣∣≤ δ2k ‖hΛi‖2
∥∥hΛj
∥∥2 , (A.5)
for any i, j. Furthermore, LemmaA.2 yields ‖hΛ0‖2+‖hΛ1‖2 ≤√
2‖hΛ‖2. Substitutinginto (A.5) we obtain∣∣∣∣∣∣
⟨AhΛ,
∑j≥2
AhΛj
⟩∣∣∣∣∣∣=∣∣∣∣∣∣∑j≥2
⟨AhΛ0 ,AhΛj
⟩+∑j≥2
⟨AhΛ1 ,AhΛj
⟩∣∣∣∣∣∣≤∑j≥2
∣∣⟨AhΛ0 ,AhΛj
⟩∣∣+∑j≥2
∣∣⟨AhΛ1 ,AhΛj
⟩∣∣≤ δ2k ‖hΛ0‖2
∑j≥2
∥∥hΛj
∥∥2 + δ2k ‖hΛ1‖2
∑j≥2
∥∥hΛj
∥∥2
≤√
2δ2k ‖hΛ‖2
∑j≥2
∥∥hΛj
∥∥2 .
From Lemma A.4, this reduces to∣∣∣∣∣∣⟨
AhΛ,∑j≥2
AhΛj
⟩∣∣∣∣∣∣≤√2δ2k ‖hΛ‖2
∥∥hΛc0
∥∥1√
k. (A.6)
Combining (A.6) with (A.4) we obtain
(1− δ2k)‖hΛ‖22 ≤
∣∣∣∣∣∣〈AhΛ,Ah〉−⟨
AhΛ,∑j≥2
AhΛj
⟩∣∣∣∣∣∣≤ |〈AhΛ,Ah〉|+
∣∣∣∣∣∣⟨
AhΛ,∑j≥2
AhΛj
⟩∣∣∣∣∣∣≤ |〈AhΛ,Ah〉|+
√2δ2k ‖hΛ‖2
∥∥hΛc0
∥∥1√
k,
which yields the desired result upon rearranging.
A.3 Proof of Lemma 1.6
We now return to the proof of Lemma 1.6. The key ideas in this proof follow from [34].
lemma 1.6 Suppose that A satisfies the RIP of order 2k with δ2k <√
2 − 1. Letx, x ∈ Rn be given, and define h = x−x. Let Λ0 denote the index set corresponding tothe k entries of x with largest magnitude and Λ1 the index set corresponding to the k
50 M. A. Davenport, M. F. Duarte, Y. C. Eldar, and G. Kutyniok
entries of hΛc0
with largest magnitude. Set Λ = Λ0 ∪Λ1. If ‖x‖1 ≤ ‖x‖1, then
‖h‖2 ≤ C0σk(x)1√
k+C1
|〈AhΛ,Ah〉|‖hΛ‖2
,
where
C0 = 21− (1−
√2)δ2k
1− (1+√
2)δ2k
, C1 =2
1− (1+√
2)δ2k
.
Proof. We begin by observing that h = hΛ +hΛc , so that from the triangle inequality
‖h‖2 ≤ ‖hΛ‖2 + ‖hΛc‖2 . (A.7)
We first aim to bound ‖hΛc‖2. From Lemma A.4 we have
‖hΛc‖2 =
∥∥∥∥∥∥∑j≥2
hΛj
∥∥∥∥∥∥2
≤∑j≥2
∥∥hΛj
∥∥2 ≤
∥∥hΛc0
∥∥1√
k, (A.8)
where the Λj are defined as in Lemma A.4, i.e., Λ1 is the index set corresponding to thek largest entries of hΛc
0(in absolute value), Λ2 as the index set corresponding to the next
k largest entries, and so on.We now wish to bound
∥∥hΛc0
∥∥1. Since ‖x‖1 ≥‖x‖1, by applying the triangle inequality
we obtain
‖x‖1 ≥ ‖x+h‖1 = ‖xΛ0 +hΛ0‖1 +∥∥xΛc
0+hΛc
0
∥∥1
≥ ‖xΛ0‖1 −‖hΛ0‖1 +∥∥hΛc
0
∥∥1 −
∥∥xΛc0
∥∥1 .
Rearranging and again applying the triangle inequality,∥∥hΛc0
∥∥1 ≤ ‖x‖1 −‖xΛ0‖1 + ‖hΛ0‖1 +
∥∥xΛc0
∥∥1
≤ ‖x−xΛ0‖1 + ‖hΛ0‖1 +∥∥xΛc
0
∥∥1 .
Recalling that σk(x)1 =∥∥xΛc
0
∥∥1 = ‖x−xΛ0‖1,∥∥hΛc
0
∥∥1 ≤ ‖hΛ0‖1 +2σk(x)1. (A.9)
Combining this with (A.8) we obtain
‖hΛc‖2 ≤ ‖hΛ0‖1 +2σk(x)1√k
≤ ‖hΛ0‖2 +2σk(x)1√
k
where the last inequality follows from Lemma 1.2. By observing that ‖hΛ0‖2 ≤ ‖hΛ‖2this combines with (A.7) to yield
‖h‖2 ≤ 2‖hΛ‖2 +2σk(x)1√
k. (A.10)

Introduction to compressed sensing 51
We now turn to establishing a bound for ‖hΛ‖2. Combining Lemma 1.3 with (A.9)and applying Lemma 1.2 we obtain
‖hΛ‖2 ≤ α
∥∥hΛc0
∥∥1√
k+β
|〈AhΛ,Ah〉|‖hΛ‖2
≤ α‖hΛ0‖1 +2σk(x)1√
k+β
|〈AhΛ,Ah〉|‖hΛ‖2
≤ α‖hΛ0‖2 +2ασk(x)1√
k+β
|〈AhΛ,Ah〉|‖hΛ‖2
.
Since ‖hΛ0‖2 ≤ ‖hΛ‖2,
(1−α)‖hΛ‖2 ≤ 2ασk(x)1√
k+β
|〈AhΛ,Ah〉|‖hΛ‖2
.
The assumption that δ2k <√
2−1 ensures that α< 1. Dividing by (1−α) and combiningwith (A.10) results in
‖h‖2 ≤(
4α
1−α+2
)σk(x)1√
k+
2β
1−α
|〈AhΛ,Ah〉|‖hΛ‖2
.
Plugging in for α and β yields the desired constants.
A.4 Proof of Theorem 1.13
theorem 1.13 (Theorem 5.1 of [57]) Suppose that A is an m× n matrix and that∆ : Rm → Rn is a recovery algorithm that satisfies
‖x−∆(Ax)‖2 ≤ Cσk(x)2 (A.11)
for some k ≥ 1, then m >(1−
√1− 1/C2
)n.
Proof. We begin by letting h∈Rn denote any vector in N (A). We write h = hΛ +hΛc
where Λ is an arbitrary set of indices satisfying |Λ| ≤ k. Set x = hΛc , and note thatAx = AhΛc = Ah−AhΛ = −AhΛ, since h ∈ N (A). Since hΛ ∈ Σk, (A.11) impliesthat ∆(Ax) = ∆(−AhΛ) = −hΛ. Hence, ‖x−∆(Ax)‖2 = ‖hΛc − (−hΛ)‖2 = ‖h‖2.Furthermore, we observe that σk(x)2 ≤ ‖x‖2, since by definition σk(x)2 ≤ ‖x− x‖2
for all x∈Σk, including x = 0. Thus ‖h‖2 ≤C ‖hΛc‖2. Since ‖h‖22 = ‖hΛ‖2
2 +‖hΛc‖22,
this yields
‖hΛ‖22 = ‖h‖2
2 −‖hΛc‖22 ≤ ‖h‖2
2 −1
C2 ‖h‖22 =
(1− 1
C2
)‖h‖2
2 .
This must hold for any vector h ∈N (A) and for any set of indices Λ such that |Λ| ≤ k.In particular, let vin−m
i=1 be an orthonormal basis for N (A), and define the vectors

52 M. A. Davenport, M. F. Duarte, Y. C. Eldar, and G. Kutyniok
hini=1 as follows:
hj =
n−m∑i=1
vi(j)vi. (A.12)
We note that hj =∑n−m
i=1 〈ej ,vi〉vi where ej denotes the vector of all zeros except for a 1
in the jth entry. Thus we see that hj = PN ej where PN denotes an orthogonal projectiononto N (A). Since ‖PN ej‖2
2 + ‖PN ⊥ej‖22 = ‖ej‖2
2 = 1, we have that ‖hj‖2 ≤ 1. Thus,by setting Λ = j for hj we observe that
∣∣∣∣∣n−m∑i=1
|vi(j)|2∣∣∣∣∣2
= |hj(j)|2 ≤(
1− 1
C2
)‖hj‖2
2 ≤ 1− 1
C2 .
Summing over j = 1,2, . . . ,n, we obtain
n√
1− 1/C2 ≥n∑
j=1
n−m∑i=1
|vi(j)|2 =
n−m∑i=1
n∑j=1
|vi(j)|2 =
n−m∑i=1
‖vi‖22 = n−m,
and thus m ≥(1−
√1− 1/C2
)n, as desired.
References
[1] W. Bajwa, J. Haupt, G. Raz, S. Wright, and R. Nowak. Toeplitz-structured compressedsensing matrices. Proc IEEE Work Stat Sig Proce, Madison, WI, 2007.
[2] W. Bajwa, J. Haupt, A. Sayeed, and R. Nowak. Compressed channel sensing: Anew approach to estimating sparse multipath channels. Proc IEEE, 98(6):1058–1076,2010.
[3] R. Baraniuk. Compressive sensing. IEEE Signal Proc Mag, 24(4):118–120, 124,2007.
[4] R. Baraniuk, V. Cevher, M. Duarte, and C. Hegde. Model-based compressive sensing.IEEE Trans. Inform Theory, 56(4):1982–2001, 2010.
[5] R. Baraniuk, M. Davenport, R. DeVore, and M. Wakin. A simple proof of the restrictedisometry property for random matrices. Const Approx, 28(3):253–263, 2008.
[6] R. Baraniuk and M. Wakin. Random projections of smooth manifolds. Found ComputMath, 9(1):51–77, 2009.
[7] D. Baron, M. Duarte, S. Sarvotham, M. Wakin, and R. Baraniuk. Distributed compressedsensing of jointly sparse signals. Proc Asilomar Conf Sign, Syst Comput, Pacific Grove,CA, 2005.
[8] D. Baron, S. Sarvotham, and R. Baraniuk. Sudocodes – Fast measurement and recon-struction of sparse signals. Proc IEEE Int Symp Inform Theory (ISIT), Seattle, WA,2006.
[9] J. Bazerque and G. Giannakis. Distributed spectrum sensing for cognitive radio networksby exploiting sparsity. IEEE Trans Sig Proc, 58(3):1847–1862, 2010.

Introduction to compressed sensing 53
[10] P. Bechler and P. Wojtaszczyk. Error estimates for orthogonal matching pursuit and randomdictionaries. Const Approx, 33(2):273–288, 2011.
[11] A. Beck and M. Teboulle. A fast iterative shrinkage-thresholding algorithm for linearinverse problems. SIAM J Imag Sci, 2(1):183–202, 2009.
[12] S. Becker, J. Bobin, and E. Candès. NESTA: A fast and accurate first-order method forsparse recovery. SIAM J Imag Sci, 4(1):1–39, 2011.
[13] S. Becker, E. Candès, and M. Grant. Templates for convex cone problems with applicationsto sparse signal recovery. Math Prog Comp, 3(3):165–218, 2011.
[14] M. Belkin and P. Niyogi. Laplacian eigenmaps for dimensionality reduction and datarepresentation. Neural Comput, 15(6):1373–1396, 2003.
[15] M. Belkin and P. Niyogi. Semi-supervised learning on Riemannian manifolds. MachLearning, 56:209–239, 2004.
[16] Z. Ben-Haim and Y. C. Eldar. Blind minimax estimation. IEEE Trans. Inform Theory,53(9):3145–3157, 2007.
[17] Z. Ben-Haim and Y. C. Eldar. The Cramer-Rao bound for estimating a sparse parametervector. IEEE Trans Sig Proc, 58(6):3384–3389, 2010.
[18] Z. Ben-Haim, Y. C. Eldar, and M. Elad. Coherence-based performance guarantees forestimating a sparse vector under random noise. IEEE Trans Sig Proc, 58(10):5030–5043,2010.
[19] Z. Ben-Haim, T. Michaeli, and Y. C. Eldar. Performance bounds and design criteria forestimating finite rate of innovation signals. Preprint, 2010.
[20] R. Berinde, A. Gilbert, P. Indyk, H. Karloff, and M. Strauss. Combining geometry andcombinatorics: A unified approach to sparse signal recovery. Proc Allerton Conf Commun.Control, Comput, Monticello, IL, Sept. 2008.
[21] R. Berinde, P. Indyk, and M. Ruzic. Practical near-optimal sparse recovery in the 1 norm.In Proc Allerton Conf Comm Control, Comput, Monticello, IL, Sept. 2008.
[22] A. Beurling. Sur les intégrales de Fourier absolument convergentes et leur application àune transformation fonctionelle. In Proc Scandi Math Congr, Helsinki, Finland, 1938.
[23] T. Blumensath and M. Davies. Gradient pursuits. IEEE Trans Sig Proc, 56(6):2370–2382,2008.
[24] T. Blumensath and M. Davies. Iterative hard thresholding for compressive sensing. ApplComput Harmon Anal, 27(3):265–274, 2009.
[25] T. Blumensath and M. Davies. Sampling theorems for signals from the union of finite-dimensional linear subspaces. IEEE Trans Inform Theory, 55(4):1872–1882, 2009.
[26] B. Bodmann, P. Cassaza, and G. Kutyniok. A quantitative notion of redundancy for finiteframes. Appl Comput Harmon Anal, 30(3):348–362, 2011.
[27] P. Boufounos, H. Rauhut, and G. Kutyniok. Sparse recovery from combined fusion framemeasurements. IEEE Trans Inform Theory, 57(6):3864–3876, 2011.
[28] J. Bourgain, S. Dilworth, K. Ford, S. Konyagin, and D. Kutzarova. Explicit constructionsof RIP matrices and related problems. Duke Math J, 159(1):145–185, 2011.
[29] Y. Bresler and P. Feng. Spectrum-blind minimum-rate sampling and reconstruction of 2-Dmultiband signals. Proc IEEE Int Conf Image Proc (ICIP), Zurich, Switzerland, 1996.
[30] D. Broomhead and M. Kirby. The Whitney reduction network: A method for computingautoassociative graphs. Neural Comput, 13:2595–2616, 2001.
[31] A. Bruckstein, D. Donoho, and M. Elad. From sparse solutions of systems of equations tosparse modeling of signals and images. SIAM Rev, 51(1):34–81, 2009.

54 M. A. Davenport, M. F. Duarte, Y. C. Eldar, and G. Kutyniok
[32] T. Cai and T. Jiang. Limiting laws of coherence of random matrices with applications totesting covariance structure and construction of compressed sensing matrices. Ann Stat,39(3):1496–1525, 2011.
[33] E. Candès. Compressive sampling. Proc Int Congre Math, Madrid, Spain, 2006.[34] E. Candès. The restricted isometry property and its implications for compressed sensing.
C R Acad Sci, Sér I, 346(9-10):589–592, 2008.[35] E. Candès, Y. C. Eldar, D. Needell, and P. Randall. Compressed sensing with coherent and
redundant dictionaries. Appl Comput Harmon Anal, 31(1):59–73, 2010.[36] E. Candès, X. Li, Y. Ma, and J. Wright. Robust principal component analysis? J ACM,
58(1):1–37, 2009.[37] E. Candès and Y. Plan. Near-ideal model selection by 1 minimization. Ann Stat,
37(5A):2145–2177, 2009.[38] E. Candès and Y. Plan. Matrix completion with noise. Proc IEEE, 98(6):925–936, 2010.[39] E. Candès and B. Recht. Exact matrix completion via convex optimization. Found Comput
Math, 9(6):717–772, 2009.[40] E. Candès and J. Romberg. Quantitative robust uncertainty principles and optimally sparse
decompositions. Found Comput Math, 6(2):227–254, 2006.[41] E. Candès, J. Romberg, and T. Tao. Robust uncertainty principles: Exact signal recon-
struction from highly incomplete frequency information. IEEE Trans Inform Theory,52(2):489–509, 2006.
[42] E. Candès, J. Romberg, and T. Tao. Stable signal recovery from incomplete and inaccuratemeasurements. Comm Pure Appl Math, 59(8):1207–1223, 2006.
[43] E. Candès and T. Tao. Decoding by linear programming. IEEE Trans Inform Theory,51(12):4203–4215, 2005.
[44] E. Candès and T. Tao. Near optimal signal recovery from random projections: Universalencoding strategies? IEEE Trans Inform Theory, 52(12):5406–5425, 2006.
[45] E. Candès and T. Tao. The Dantzig selector: Statistical estimation when p is much largerthan n. Ann Stat, 35(6):2313–2351, 2007.
[46] C. Carathéodory. Über den Variabilitätsbereich der Koeffizienten von Potenzreihen, diegegebene Werte nicht annehmen. Math Ann, 64:95–115, 1907.
[47] C. Carathéodory. Über den Variabilitätsbereich der Fourierschen Konstanten von positivenharmonischen Funktionen. Rend Circ Mat Palermo, 32:193–217, 1911.
[48] P. Casazza and G. Kutyniok. Finite Frames. Birkhäuser, Boston, MA, 2012.[49] V. Cevher, M. Duarte, C. Hegde, and R. Baraniuk. Sparse signal recovery using Markov
random fields. In Proc Adv Neural Proc Syst(NIPS), Vancouver, BC, 2008.[50] V. Cevher, P. Indyk, C. Hegde, and R. Baraniuk. Recovery of clustered sparse signals from
compressive measurements. Proc Sampling Theory Appl (SampTA), Marseilles, France,2009.
[51] M. Charikar, K. Chen, and M. Farach-Colton. Finding frequent items in data streams. InProc Int Coll Autom Lang Programm, Málaga, Spain, 2002.
[52] J. Chen and X. Huo. Theoretical results on sparse representations of multiple-measurementvectors. IEEE Trans Sig Proc, 54(12):4634–4643, 2006.
[53] S. Chen, D. Donoho, and M. Saunders. Atomic decomposition by basis pursuit. SIAM JSci Comp, 20(1):33–61, 1998.
[54] Y. Chi, L. Scharf, A. Pezeshki, and R. Calderbank. Sensitivity to basis mismatch incompressed sensing. IEEE Trans Sig Proc, 59(5):2182–2195, 2011.
Introduction to compressed sensing 55
[55] O. Christensen. An Introduction to Frames and Riesz Bases. Birkhäuser, Boston, MA,2003.
[56] A. Cohen, W. Dahmen, and R. DeVore. Instance optimal decoding by thresholding in com-pressed sensing. Int Conf Harmonic Analysis and Partial Differential Equations, Madrid,Spain, 2008.
[57] A. Cohen,W. Dahmen, and R. DeVore. Compressed sensing and bestk-term approximation.J Am Math Soc, 22(1):211–231, 2009.
[58] R. Coifman and M. Maggioni. Diffusion wavelets. Appl Comput Harmon Anal, 21(1):53–94, 2006.
[59] G. Cormode and M. Hadjieleftheriou. Finding the frequent items in streams of data. CommACM, 52(10):97–105, 2009.
[60] G. Cormode and S. Muthukrishnan. Improved data stream summaries: The count-minsketch and its applications. J Algorithms, 55(1):58–75, 2005.
[61] J. Costa and A. Hero. Geodesic entropic graphs for dimension and entropy estimation inmanifold learning. IEEE Trans Sig Proc, 52(8):2210–2221, 2004.
[62] S. Cotter and B. Rao. Sparse channel estimation via matching pursuit with application toequalization. IEEE Trans Commun, 50(3):374–377, 2002.
[63] S. Cotter, B. Rao, K. Engan, and K. Kreutz-Delgado. Sparse solutions to linear inverseproblems with multiple measurement vectors. IEEE Trans Sig Proc, 53(7):2477–2488,2005.
[64] W. Dai and O. Milenkovic. Subspace pursuit for compressive sensing signal reconstruction.IEEE Trans Inform Theory, 55(5):2230–2249, 2009.
[65] I. Daubechies. Ten Lectures on Wavelets. SIAM, Philadelphia, PA, 1992.[66] I. Daubechies, M. Defrise, and C. De Mol. An iterative thresholding algorithm for linear
inverse problems with a sparsity constraint. Comm Pure Appl Math, 57(11):1413–1457,2004.
[67] M. Davenport. Random observations on random observations: Sparse signal acquisitionand processing. PhD thesis, Rice University, 2010.
[68] M. Davenport and R. Baraniuk. Sparse geodesic paths. Proc AAAI Fall Symp ManifoldLearning, Arlington, VA, 2009.
[69] M. Davenport, P. Boufounos, and R. Baraniuk. Compressive domain interference can-cellation. Proc Work Struc Parc Rep Adap Signaux (SPARS), Saint-Malo, France,2009.
[70] M. Davenport, P. Boufounos, M. Wakin, and R. Baraniuk. Signal processing withcompressive measurements. IEEE J Sel Top Sig Proc, 4(2):445–460, 2010.
[71] M. Davenport, M. Duarte, M. Wakin, et al. The smashed filter for compressive classificationand target recognition. In Proc IS&T/SPIE Symp Elec Imag: Comp Imag, San Jose, CA,2007.
[72] M. Davenport, C. Hegde, M. Duarte, and R. Baraniuk. Joint manifolds for data fusion.IEEE Trans Image Proc, 19(10):2580–2594, 2010.
[73] M. Davenport, J. Laska, P. Boufounos, and R. Baraniuk. A simple proof that randommatrices are democratic. Technical Report TREE 0906, Rice Univ., ECE Dept, 2009.
[74] M. Davenport, S. Schnelle, J. P. Slavinsky, et al. A wideband compressive radio receiver.Proc IEEE Conf Mil Comm (MILCOM), San Jose, CA, 2010.
[75] M. Davenport and M. Wakin. Analysis of orthogonal matching pursuit using the restrictedisometry property. IEEE Trans Inform Theory, 56(9):4395–4401, 2010.

56 M. A. Davenport, M. F. Duarte, Y. C. Eldar, and G. Kutyniok
[76] M. Davies and Y. C. Eldar. Rank awareness in joint sparse recovery. To appear in IEEETrans Inform Theory, 2011.
[77] R. DeVore. Nonlinear approximation. Acta Numer, 7:51–150, 1998.[78] R. DeVore. Deterministic constructions of compressed sensing matrices. J Complex,
23(4):918–925, 2007.[79] M. Do and C. La. Tree-based majorize-minimize algorithm for compressed sensing with
sparse-tree prior. Int Workshop Comput Adv Multi-Sensor Adapt Proc (CAMSAP), SaintThomas, US Virgin Islands, 2007.
[80] D. Donoho. Denoising by soft-thresholding. IEEE Trans Inform Theory, 41(3):613–627,1995.
[81] D. Donoho. Neighborly polytopes and sparse solutions of underdetermined linearequations. Technical Report 2005-04, Stanford Univ., Stat. Dept, 2005.
[82] D. Donoho. Compressed sensing. IEEE Trans Inform Theory, 52(4):1289–1306,2006.
[83] D. Donoho. For most large underdetermined systems of linear equations, the minimal1-norm solution is also the sparsest solution. Comm Pure Appl Math, 59(6):797–829,2006.
[84] D. Donoho. High-dimensional centrally symmetric polytopes with neighborliness propor-tional to dimension. Discrete Comput Geom, 35(4):617–652, 2006.
[85] D. Donoho, I. Drori, Y. Tsaig, and J.-L. Stark. Sparse solution of underdetermined lin-ear equations by stagewise orthogonal matching pursuit. Tech Report Stanford Univ.,2006.
[86] D. Donoho and M. Elad. Optimally sparse representation in general (nonorthogonal)dictionaries via 1 minimization. Proc Natl Acad Sci, 100(5):2197–2202, 2003.
[87] D. Donoho and M. Elad. On the stability of basis pursuit in the presence of noise. EURASIPSig Proc J, 86(3):511–532, 2006.
[88] D. Donoho, M. Elad, and V. Temlyahov. Stable recovery of sparse overcompleterepresentations in the presence of noise. IEEE Trans Inform Theory, 52(1):6–18, 2006.
[89] D. Donoho and C. Grimes. Hessian eigenmaps: Locally linear embedding techniques forhigh-dimensional data. Proc Natl Acad. Sci, 100(10):5591–5596, 2003.
[90] D. Donoho and C. Grimes. Image manifolds which are isometric to Euclidean space. JMath Imag Vision, 23(1):5–24, 2005.
[91] D. Donoho and B. Logan. Signal recovery and the large sieve. SIAM J Appl Math,52(6):577–591, 1992.
[92] D. Donoho and J. Tanner. Neighborliness of randomly projected simplices in highdimensions. Proc Natl Acad Sci, 102(27):9452–9457, 2005.
[93] D. Donoho and J. Tanner. Sparse nonnegative solutions of undetermined linear equationsby linear programming. Proc Natl Acad Sci, 102(27):9446–9451, 2005.
[94] D. Donoho and J. Tanner. Counting faces of randomly-projected polytopes when theprojection radically lowers dimension. J Am Math Soc, 22(1):1–53, 2009.
[95] D. Donoho and J. Tanner. Precise undersampling theorems. Proc IEEE, 98(6):913–924,2010.
[96] D. Donoho and Y. Tsaig. Fast solution of 1 norm minimization problems when the solutionmay be sparse. IEEE Trans Inform Theory, 54(11):4789–4812, 2008.
[97] P. Dragotti, M. Vetterli, and T. Blu. Sampling moments and reconstructing signals of finiterate of innovation: Shannon meets Strang-Fix. IEEE Trans Sig Proc, 55(5):1741–1757,2007.

Introduction to compressed sensing 57
[98] D. Du and F. Hwang. Combinatorial Group Testing and Its Applications. World Scientific,Singapore, 2000.
[99] M. Duarte, M. Davenport, D. Takhar, et al. Single-pixel imaging via compressive sampling.IEEE Sig Proc Mag, 25(2):83–91, 2008.
[100] M. Duarte, M. Davenport, M. Wakin, and R. Baraniuk. Sparse signal detection from inco-herent projections. Proc IEEE Int Conf Acoust, Speech, Sig Proc (ICASSP), Toulouse,France, 2006.
[101] M. Duarte, M. Davenport, M. Wakin, et al. Multiscale random projections for compressiveclassification. Proc IEEE Int Conf Image Proc (ICIP), San Antonio, TX, Sept. 2007.
[102] M. Duarte and Y. C. Eldar. Structured compressed sensing: Theory and applications. IEEETrans Sig Proc, 59(9):4053–4085, 2011.
[103] M. Duarte, M. Wakin, and R. Baraniuk. Fast reconstruction of piecewise smooth signalsfrom random projections. Proc Work Struc Parc Rep Adap Signaux (SPARS), Rennes,France, 2005.
[104] M. Duarte, M. Wakin, and R. Baraniuk. Wavelet-domain compressive signal reconstructionusing a hidden Markov tree model. Proc IEEE Int Conf Acoust, Speech, Signal Proc(ICASSP), Las Vegas, NV, Apr. 2008.
[105] T. Dvorkind, Y. C. Eldar, and E. Matusiak. Nonlinear and non-ideal sampling: Theory andmethods. IEEE Trans Sig Proc, 56(12):471–481, 2009.
[106] M. Elad. Sparse and Redundant Representations: From Theory to Applications in Signaland Image Processing. Springer, New York, NY, 2010.
[107] M. Elad, B. Matalon, J. Shtok, and M. Zibulevsky. A wide-angle view at iterated shrinkagealgorithms. Proc SPIE Optics Photonics: Wavelets, San Diego, CA, 2007.
[108] Y. C. Eldar. Rethinking biased estimation: Improving maximum likelihood and the Cramer-Rao bound Found. Trends Sig Proc, 1(4):305–449, 2008.
[109] Y. C. Eldar. Compressed sensing of analog signals in shift-invariant spaces. IEEE TransSig Proc, 57(8):2986–2997, 2009.
[110] Y. C. Eldar. Generalized SURE for exponential families: Applications to regularization.IEEE Trans Sig Proc, 57(2):471–481, 2009.
[111] Y. C. Eldar. Uncertainty relations for shift-invariant analog signals. IEEE Trans InformTheory, 55(12):5742–5757, 2009.
[112] Y. C. Eldar, P. Kuppinger, and H. Bölcskei. Block-sparse signals: Uncertainty relations andefficient recovery. IEEE Trans Sig Proc, 58(6):3042–3054, 2010.
[113] Y. C. Eldar and T. Michaeli. Beyond bandlimited sampling. IEEE Sig Proc Mag, 26(3):48–68, 2009.
[114] Y. C. Eldar and M. Mishali. Robust recovery of signals from a structured union of subspaces.IEEE Trans Inform Theory, 55(11):5302–5316, 2009.
[115] Y. C. Eldar and H. Rauhut. Average case analysis of multichannel sparse recovery usingconvex relaxation. IEEE Trans Inform Theory, 6(1):505–519, 2010.
[116] Y. Erlich, N. Shental,A.Amir, and O. Zuk. Compressed sensing approach for high through-put carrier screen. Proc Allerton Conf Commun Contr Comput, Monticello, IL, Sept.2009.
[117] P. Feng. Universal spectrum blind minimum rate sampling and reconstruction of multibandsignals. PhD thesis, University of Illinois at Urbana-Champaign, Mar. 1997.
[118] P. Feng and Y. Bresler. Spectrum-blind minimum-rate sampling and reconstruction ofmultiband signals. Proc IEEE Int Conf Acoust, Speech, Sig Proc (ICASSP), Atlanta, GA,May 1996.

58 M. A. Davenport, M. F. Duarte, Y. C. Eldar, and G. Kutyniok
[119] I. Fevrier, S. Gelfand, and M. Fitz. Reduced complexity decision feedback equalization formultipath channels with large delay spreads. IEEE Trans Communi, 47(6):927–937, 1999.
[120] M. Figueiredo, R. Nowak, and S. Wright. Gradient projections for sparse reconstruction:Application to compressed sensing and other inverse problems. IEEE J Select Top Sig Proc,1(4):586–597, 2007.
[121] M. Fornassier and H. Rauhut. Recovery algorithms for vector valued data with joint sparsityconstraints. SIAM J Numer Anal, 46(2):577–613, 2008.
[122] J. Friedman, T. Hastie, and R. Tibshirani. Regularization paths for generalized linear modelsvia coordinate descent. J Stats Software, 33(1):1–22, 2010.
[123] N. Galatsanos and A. Katsaggelos. Methods for choosing the regularization parameter andestimating the noise variance in image restoration and their relation. IEEE Trans ImageProc, 1(3):322–336, 1992.
[124] A. Garnaev and E. Gluskin. The widths of Euclidean balls. Dokl An SSSR, 277:1048–1052,1984.
[125] K. Gedalyahu and Y. C. Eldar. Time-delay estimation from low-rate samples: A union ofsubspaces approach. IEEE Trans Sig Proc, 58(6):3017–3031, 2010.
[126] K. Gedalyahu, R. Tur, and Y. C. Eldar. Multichannel sampling of pulse streams at the rateof innovation. IEEE Trans Sig Proc, 59(4):1491–1504, 2011.
[127] S. Geršgorin. Über die Abgrenzung der Eigenwerte einer Matrix. Izv. Akad Nauk SSSR SerFiz.-Mat, 6:749–754, 1931.
[128] A. Gilbert and P. Indyk. Sparse recovery using sparse matrices. Proc IEEE, 98(6):937–947,2010.
[129] A. Gilbert, Y. Li, E. Porat, and M. Strauss. Approximate sparse recovery: Optimizing timeand measurements. Proc ACM Symp Theory Comput, Cambridge, MA, Jun. 2010.
[130] A. Gilbert, M. Strauss, J. Tropp, and R. Vershynin. One sketch for all: Fast algorithms forcompressed sensing. Proc ACM Symp Theory Comput, San Diego, CA, Jun. 2007.
[131] S. Gleichman and Y. C. Eldar. Blind compressed sensing. To appear in IEEE Trans InformTheory, 57(10):6958–6975, 2011.
[132] D. Goldberg, D. Nichols, B. Oki, and D. Terry. Using collaborative filtering to weave aninformation tapestry. Commun ACM, 35(12):61–70, 1992.
[133] G. Golub and M. Heath. Generalized cross-validation as a method for choosing a goodridge parameter. Technometrics, 21(2):215–223, 1970.
[134] I. Gorodnitsky, J. George, and B. Rao. Neuromagnetic source imaging with FOCUSS:A recursive weighted minimum norm algorithm. Electroen Clin Neuro, 95(4):231–251,1995.
[135] I. Gorodnitsky and B. Rao. Sparse signal reconstruction from limited data using FOCUSS:A re-weighted minimum norm algorithm. IEEE Trans Sig Proc, 45(3):600–616, 1997.
[136] I. Gorodnitsky, B. Rao, and J. George. Source localization in magnetoencephalographyusing an iterative weighted minimum norm algorithm. Proc Asilomar Conf Sig, Syst andComput, Pacific Grove, CA, Oct. 1992.
[137] R. Gribonval, H. Rauhut, K. Schnass, and P. Vandergheynst. Atoms of all channels, unite!Average case analysis of multi-channel sparse recovery using greedy algorithms. J FourierAnal Appl, 14(5):655–687, 2008.
[138] E. Hale, W. Yin, and Y. Zhang. A fixed-point continuation method for 1-regularized mini-mization with applications to compressed sensing. Technical Report TR07-07, Rice Univ.,CAAM Dept, 2007.

Introduction to compressed sensing 59
[139] T. Hastie, R. Tibshirani, and J. Friedman. The Elements of Statistical Learning. Springer,New York, NY, 2001.
[140] J. Haupt, L. Applebaum, and R. Nowak. On the restricted isometry of deterministicallysubsampled Fourier matrices. Conf Inform Sci Syste (CISS), Princeton, NJ, 2010.
[141] J. Haupt, W. Bajwa, M. Rabbat, and R. Nowak. Compressed sensing for networked data.IEEE Sig Proc Mag, 25(2):92–101, 2008.
[142] J. Haupt, W. Bajwa, G. Raz, and R. Nowak. Toeplitz compressed sensing matrices withapplications to sparse channel estimation. IEEE Trans Inform Theory, 56(11):5862–5875,2010.
[143] J. Haupt, R. Castro, R. Nowak, G. Fudge, and A. Yeh. Compressive sampling for signalclassification. Proc Asilomar Conf Sig, Syste, Comput, Pacific Grove, CA, 2006.
[144] J. Haupt and R. Nowak. Signal reconstruction from noisy random projections. IEEE TransInform Theory, 52(9):4036–4048, 2006.
[145] J. Haupt and R. Nowak. Compressive sampling for signal detection. In Proc. IEEE Int.Conf Acoust, Speech, Sig Proc (ICASSP), Honolulu, HI, 2007.
[146] D. Healy.Analog-to-information: BAA#05-35, 2005.Available online at http://www.darpa.mil/mto/solicitations/baa05-35/s/index.html.
[147] C. Hegde, M. Duarte, and V. Cevher. Compressive sensing recovery of spike trains using astructured sparsity model. Proc Work Struc Parc Rep Adap Signaux (SPARS), Saint-Malo,France, 2009.
[148] M. Herman and T. Strohmer. High-resolution radar via compressed sensing. IEEE TransSig Proc, 57(6):2275–2284, 2009.
[149] M. Herman and T. Strohmer. General deviants: An analysis of perturbations in compressedsensing. IEEE J Select Top Sig Proc, 4(2):342–349, 2010.
[150] G. Hinton, P. Dayan, and M. Revow. Modelling the manifolds of images of handwrittendigits. IEEE Trans Neural Networks, 8(1):65–74, 1997.
[151] L. Hogben. Handbook of Linear Algebra. Discrete Mathematics and its Applications.Chapman & Hall / CRC, Boca Raton, FL, 2007.
[152] P. Indyk. Explicit constructions for compressed sensing of sparse signals. Proc. ACM-SIAMSymp Discrete Algorithms (SODA), San Franciso, CA, 2008.
[153] P. Indyk and M. Ruzic. Near-optimal sparse recovery in the 1 norm. In Proc IEEE SympFound Comp Science (FOCS), Philadelphia, PA, 2008.
[154] S. Jafarpour, W. Xu, B. Hassibi, and R. Calderbank. Efficient and robust compressedsensing using optimized expander graphs. IEEE Trans Inform Theory, 55(9):4299–4308,2009.
[155] W. James and C. Stein. Estimation of quadratic loss. In Proc 4th Berkeley Symp MathStatist Prob, 1: 361–379. University of California Press, Berkeley, 1961.
[156] T. Jayram and D. Woodruff. Optimal bounds for Johnson-Lindenstrauss transforms andstreaming problems with sub-constant error. Proc ACM-SIAM Symp Discrete Algorithms(SODA), San Francisco, CA, 2011.
[157] B. Jeffs. Sparse inverse solution methods for signal and image processing applications. InProc IEEE Int Conf Acoust, Speech Sig Proce (ICASSP), Seattle, WA, 1998.
[158] W. Johnson and J. Lindenstrauss. Extensions of Lipschitz mappings into a Hilbert space.Proc Conf Modern Anal Prob, New Haven, CT, 1982.
[159] G. Judge and M. Bock. The Statistical Implications of Pre-Test and Stein-Rule Estimatorsin Econometrics. North-Holland, Amsterdam, 1978.

60 M. A. Davenport, M. F. Duarte, Y. C. Eldar, and G. Kutyniok
[160] R. Kainkaryam,A. Breux,A. Gilbert, P. Woolf, and J. Schiefelbein. poolMC: Smart poolingof mRNA samples in microarray experiments. BMC Bioinformatics, 11(1):299, 2010.
[161] R. Keshavan, A. Montanari, and S. Oh. Matrix completion from a few entries. IEEE TransInform Theory, 56(6):2980–2998, 2010.
[162] V. Kotelnikov. On the carrying capacity of the ether and wire in telecommunications. IzdRed Upr Svyazi RKKA, Moscow, Russia, 1933.
[163] J. Kovacevic and A. Chebira. Life beyond bases: The advent of frames (Part I). IEEE SigProc Mag, 24(4):86–104, 2007.
[164] J. Kovacevic and A. Chebira. Life beyond bases: The advent of frames (Part II). IEEE SigProc Mag, 24(4):115–125, 2007.
[165] F. Krahmer and R. Ward. New and improved Johnson-Lindenstrauss embeddings via therestricted isometry property. SIAM J Math Anal, 43(3):1269–1281, 2011.
[166] T. Kühn. A lower estimate for entropy numbers. J Approx Theory, 110(1):120–124, 2001.[167] C. La and M. Do. Signal reconstruction using sparse tree representation. Proc SPIE Optics
Photonics: Wavelets, San Diego, CA, 2005.[168] C. La and M. Do. Tree-based orthogonal matching pursuit algorithm for signal reconstruc-
tion. IEEE Int Conf Image Proc (ICIP), Atlanta, GA, 2006.[169] J. Laska, P. Boufounos, M. Davenport, and R. Baraniuk. Democracy in action: Quanti-
zation, saturation, and compressive sensing. Appl Comput Harman Anal, 31(3):429–443,2011.
[170] J. Laska, M. Davenport, and R. Baraniuk. Exact signal recovery from corrupted measure-ments through the pursuit of justice. Proc Asilomar Conf Sign, Syste Compute, PacificGrove, CA, 2009.
[171] S. Levy and P. Fullagar. Reconstruction of a sparse spike train from a portion of its spectrumand application to high-resolution deconvolution. Geophysics, 46(9):1235–1243, 1981.
[172] N. Linial, E. London, and Y. Rabinovich. The geometry of graphs and some of itsalgorithmic applications. Combinatorica, 15(2):215–245, 1995.
[173] E. Livshitz. On efficiency of Orthogonal Matching Pursuit. Preprint, 2010.[174] B. Logan. Properties of high-pass signals. PhD thesis, Columbia University, 1965.[175] I. Loris. On the performance of algorithms for the minimization of 1-penalized functions.
Inverse Problems, 25(3):035008, 2009.[176] H. Lu. Geometric theory of images. PhD thesis, University of California, San Diego, 1998.[177] Y. Lu and M. Do. Sampling signals from a union of subspaces. IEEE Sig Proce Mag,
25(2):41–47, 2008.[178] M. Lustig, D. Donoho, and J. Pauly. Rapid MR imaging with compressed sensing and
randomly under-sampled 3DFT trajectories. Proc Ann Meeting of ISMRM, Seattle, WA,2006.
[179] M. Lustig, J. Lee, D. Donoho, and J. Pauly. Faster imaging with randomly perturbed,under-sampled spirals and 1 reconstruction. Proc Ann Meeting ISMRM, Miami, FL, 2005.
[180] M. Lustig, J. Santos, J. Lee, D. Donoho, and J. Pauly. Application of compressed sensingfor rapid MR imaging. Proc Work Struc Parc Rep Adap Sign (SPARS), Rennes, France,2005.
[181] D. Malioutov, M. Cetin, and A. Willsky. A sparse signal reconstruction perspective forsource localization with sensor arrays. IEEE Trans Sign Proce, 53(8):3010–3022, 2005.
[182] S. Mallat. A Wavelet Tour of Signal Processing. Academic Press, San Diego, CA, 1999.[183] S. Mallat and Z. Zhang. Matching pursuits with time-frequency dictionaries. IEEE Trans
Sig Proc, 41(12):3397–3415, 1993.

Introduction to compressed sensing 61
[184] R. Marcia, Z. Harmany, and R. Willett. Compressive coded aperture imaging. ProcIS&T/SPIE Symp Elec Imag: Comp Imag, San Jose, CA, 2009.
[185] M. Mishali and Y. C. Eldar. Reduce and boost: Recovering arbitrary sets of jointly sparsevectors. IEEE Trans Sig Proc, 56(10):4692–4702, 2008.
[186] M. Mishali and Y. C. Eldar. Blind multi-band signal reconstruction: Compressed sensingfor analog signals. IEEE Trans Sig Proc, 57(3):993–1009, 2009.
[187] M. Mishali and Y. C. Eldar. From theory to practice: Sub-Nyquist sampling of sparsewideband analog signals. IEEE J Select Top Sig Proc, 4(2):375–391, 2010.
[188] M. Mishali, Y. C. Eldar, O. Dounaevsky, and E. Shoshan. Xampling: Analog to digital atsub-Nyquist rates. IET Circ Dev Syst, 5(1):8–20, 2011.
[189] S. Muthukrishnan. Data Streams: Algorithms and Applications, Foundations and Trendsin Theoretical Computer Science. Now Publishers, Boston, MA, 2005.
[190] D. Needell and J. Tropp. CoSaMP: Iterative signal recovery from incomplete and inaccuratesamples. Appl Comput Harmon Anal, 26(3):301–321, 2009.
[191] D. Needell and R. Vershynin. Uniform uncertainty principle and signal recovery viaregularized orthogonal matching pursuit. Found Comput Math, 9(3):317–334, 2009.
[192] D. Needell and R. Vershynin. Signal recovery from incomplete and inaccurate mea-surements via regularized orthogonal matching pursuit. IEEE J Select Top Sig Proc,4(2):310–316, 2010.
[193] P. Niyogi. Manifold regularization and semi-supervised learning: Some theoreticalanalyses. Technical Report TR-2008-01, Univ. of Chicago, Comput Sci Dept., 2008.
[194] J. Nocedal and S. Wright. Numerical Optimization. Springer-Verlag, 1999.[195] H. Nyquist. Certain topics in telegraph transmission theory. Trans AIEE, 47:617–644,
1928.[196] B. Olshausen and D. Field. Emergence of simple-cell receptive field properties by learning
a sparse representation. Nature, 381:607–609, 1996.[197] S. Osher, Y. Mao, B. Dong, and W. Yin. Fast linearized Bregman iterations for compressive
sensing and sparse denoising. Commun Math Sci, 8(1):93–111, 2010.[198] J. Partington. An Introduction to Hankel Operators. Cambridge University Press, Cam-
bridge, 1988.[199] W. Pennebaker and J. Mitchell. JPEG Still Image Data Compression Standard. Van
Nostrand Reinhold, 1993.[200] J. Phillips, R. Leahy, and J. Mosher. MEG-based imaging of focal neuronal current sources.
IEEE Trans Med Imaging, 16(3):338–348, 1997.[201] R. Prony. Essai expérimental et analytique sur les lois de la Dilatabilité des fluides élastiques
et sur celles de la Force expansive de la vapeur de l’eau et de la vapeur de l’alkool, àdifférentes températures. J de l’École Polytechnique, Floréal et Prairial III, 1(2):24–76,1795. R. Prony is Gaspard Riche, baron de Prony.
[202] B. Rao. Signal processing with the sparseness constraint. Proc IEEE Int Conf Acoust,Speech, Sig Proc (ICASSP), Seattle, WA, 1998.
[203] B. Recht. A simpler approach to matrix completion. To appear in J. Machine LearningRese, 12(12):3413–3430, 2011.
[204] B. Recht, M. Fazel, and P. Parrilo. Guaranteed minimum rank solutions of matrix equationsvia nuclear norm minimization. SIAM Rev, 52(3):471–501, 2010.
[205] R. Robucci, L. Chiu, J. Gray, et al. Compressive sensing on a CMOS separable transformimage sensor. Proc IEEE Int Conf Acoust, Speech, Sig Proc (ICASSP), Las Vegas, NV,2008.

62 M. A. Davenport, M. F. Duarte, Y. C. Eldar, and G. Kutyniok
[206] J. Romberg. Compressive sensing by random convolution. SIAM J Imag Sci, 2(4):1098–1128, 2009.
[207] M. Rosenfeld. In praise of the Gram matrix, The Mathematics of Paul Erdos II, 318–323.Springer, Berlin, 1996.
[208] K. Schnass and P. Vandergheynst. Average performance analysis for thresholding. IEEESig Proc Letters, 14(11):828–831, 2007.
[209] C. Shannon. Communication in the presence of noise. Proc Inst Radio Engineers, 37(1):10–21, 1949.
[210] N. Shental, A. Amir, and O. Zuk. Identification of rare alleles and their carriers usingcompressed se(que)nsing. Nucl Acids Res, 38(19):e179, 2009.
[211] J. P. Slavinsky, J. Laska, M. Davenport, and R. Baraniuk. The compressive multiplexerfor multi-channel compressive sensing. Proc IEEE Int Conf Acoust, Speech, Sig Proc(ICASSP), Prague, Czech Republic, 2011.
[212] A. So and Y. Ye. Theory of semidefinite programming for sensor network localization.Math Programming, Series A B, 109(2):367–384, 2007.
[213] C. Stein. Inadmissibility of the usual estimator for the mean of a multivariate normal dis-tribution. Proc 3rd Berkeley Symp Math Statist Prob, 1: 197–206. University of CaliforniaPress, Berkeley, 1956.
[214] T. Strohmer and R. Heath. Grassmanian frames with applications to coding and commu-nication. Appl Comput Harmon Anal, 14(3):257–275, 2003.
[215] D. Taubman and M. Marcellin. JPEG 2000: Image Compression Fundamentals, Standardsand Practice. Kluwer, 2001.
[216] H. Taylor, S. Banks, and J. McCoy. Deconvolution with the 1 norm. Geophysics, 44(1):39–52, 1979.
[217] J. Tenenbaum, V. de Silva, and J. Landford. A global geometric framework for nonlineardimensionality reduction. Science, 290:2319–2323, 2000.
[218] R. Tibshirani. Regression shrinkage and selection via the Lasso. J Roy Statist Soc B,58(1):267–288, 1996.
[219] J. Treichler, M. Davenport, and R. Baraniuk. Application of compressive sensing to thedesign of wideband signal acquisition receivers. Proc US/Australia Joint Work. DefenseApps of Signal Processing (DASP), Lihue, HI, 2009.
[220] J. Tropp. Greed is good: Algorithmic results for sparse approximation. IEEE Trans InformTheory, 50(10):2231–2242, 2004.
[221] J. Tropp. Algorithms for simultaneous sparse approximation. Part II: Convex relaxation.Sig Proc, 86(3):589–602, 2006.
[222] J. Tropp and A. Gilbert. Signal recovery from partial information via orthogonal matchingpursuit. IEEE Trans Inform. Theory, 53(12):4655–4666, 2007.
[223] J. Tropp, A. Gilbert, and M. Strauss. Algorithms for simultaneous sparse approximation.Part I: Greedy pursuit. Sig Proc, 86(3):572–588, 2006.
[224] J. Tropp, J. Laska, M. Duarte, J. Romberg, and R. Baraniuk. Beyond Nyquist: Efficientsampling of sparse, bandlimited signals. IEEE Trans Inform Theory, 56(1):520–544, 2010.
[225] J. Tropp, M. Wakin, M. Duarte, D. Baron, and R. Baraniuk. Random filters for compressivesampling and reconstruction. Proc IEEE Int Conf Acoust, Speech, Sig Proc (ICASSP),Toulouse, France, 2006.
[226] J. Tropp and S. Wright. Computational methods for sparse solution of linear inverseproblems. Proc IEEE, 98(6):948–958, 2010.

Introduction to compressed sensing 63
[227] J. Trzasko and A. Manduca. Highly undersampled magnetic resonance image recon-struction via homotopic 0-minimization. IEEE Trans Med Imaging, 28(1):106–121,2009.
[228] R. Tur, Y. C. Eldar, and Z. Friedman. Innovation rate sampling of pulse streams withapplication to ultrasound imaging. IEEE Trans Sig Proc, 59(4):1827–1842, 2011.
[229] M. Turk and A. Pentland. Eigenfaces for recognition. J Cogni Neurosci, 3(1):71–86, 1991.[230] M. Unser. Sampling – 50 years after Shannon. Proc IEEE, 88(4):569–587, 2000.[231] E. van den Berg and M. Friedlander. Probing the Pareto frontier for basis pursuit solutions.
SIAM J Sci Comp, 31(2):890–912, 2008.[232] E. van den Berg and M. Friedlander. Theoretical and empirical results for recovery from
multiple measurements. IEEE Trans Inform Theory, 56(5):2516–2527, 2010.[233] B. Vandereycken and S. Vandewalle. Riemannian optimization approach for computing
low-rank solutions of Lyapunov equations. Proc SIAM Conf Optimization, Boston, MA,2008.
[234] V. Vapnik. The Nature of Statistical Learning Theory. Springer-Verlag, New York,1999.
[235] R. Varga. Geršgorin and His Circles. Springer, Berlin, 2004.[236] S. Vasanawala, M. Alley, R. Barth, et al. Faster pediatric MRI via compressed sensing.
Proc Ann Meeting Soc Pediatric Radiology (SPR), Carlsbad, CA, 2009.[237] R. Venkataramani andY. Bresler. Further results on spectrum blind sampling of 2-D signals.
Proc IEEE Int Conf Image Proc (ICIP), Chicago, IL, 1998.[238] R. Venkataramani and Y. Bresler. Perfect reconstruction formulas and bounds on alias-
ing error in sub-Nyquist nonuniform sampling of multiband signals. IEEE Trans InformTheory, 46(6):2173–2183, 2000.
[239] M. Vetterli, P. Marziliano, and T. Blu. Sampling signals with finite rate of innovation. IEEETrans Sig Proc, 50(6):1417–1428, 2002.
[240] M. Wakin, D. Donoho, H. Choi, and R. Baraniuk. The multiscale structure of non-differentiable image manifolds. Proc SPIE Optics Photonics: Wavelets, San Diego, CA,2005.
[241] R. Walden. Analog-to-digital converter survey and analysis. IEEE J Sel Areas Commun,17(4):539–550, 1999.
[242] C. Walker and T. Ulrych. Autoregressive recovery of the acoustic impedance. Geophysics,48(10):1338–1350, 1983.
[243] R. Ward. Compressive sensing with cross validation. IEEE Trans Inform Theory,55(12):5773–5782, 2009.
[244] K. Weinberger and L. Saul. Unsupervised learning of image manifolds by semidefiniteprogramming. Int J Computer Vision, 70(1):77–90, 2006.
[245] L. Welch. Lower bounds on the maximum cross correlation of signals. IEEE Trans InformTheory, 20(3):397–399, 1974.
[246] Z. Wen, W. Yin, D. Goldfarb, and Y. Zhang.Afast algorithm for sparse reconstruction basedon shrinkage, subspace optimization and continuation. SIAM J Sci Comput, 32(4):1832–1857, 2010.
[247] E. Whittaker. On the functions which are represented by the expansions of the interpolationtheory. Proc Roy Soc Edin Sec A, 35:181–194, 1915.
[248] P. Wojtaszczyk. Stability and instance optimality for Gaussian measurements in com-pressed sensing. Found Comput Math, 10(1):1–13, 2010.

64 M. A. Davenport, M. F. Duarte, Y. C. Eldar, and G. Kutyniok
[249] S. Wright, R. Nowak, and M. Figueiredo. Sparse reconstruction by separable approxima-tion. IEEE Trans Sig Proc, 57(7):2479–2493, 2009.
[250] A. Yang, S. Sastray, A. Ganesh, and Y. Ma. Fast 1-minimization algorithms and an appli-cation in robust face recognition: A review. Proc IEEE Int Conf Image Proc (ICIP), HongKong, 2010.
[251] W. Yin, S. Osher, D. Goldfarb, and J. Darbon. Bregman iterative algorithms for 1-minimization with applications to compressed sensing. SIAM J Imag Sci, 1(1):143–168,2008.
[252] Z. Yu, S. Hoyos, and B. Sadler. Mixed-signal parallel compressed sensing and receptionfor cognitive radio. Proc IEEE Int Conf Acoust, Speech, Sig Proc (ICASSP), Las Vegas,NV, 2008.
[253] M. Yuan and Y. Lin. Model selection and estimation in regression with grouped variables.J Roy Stat Soc Ser B, 68(1):49–67, 2006.
[254] T. Zhang. Sparse recovery with Orthogonal Matching Pursuit under RIP. IEEE TransInform Theory, 59(9):6125–6221, 2011.

2 Second-generation sparse modeling:structured and collaborativesignal analysisAlexey Castrodad, Ignacio Ramirez, Guillermo Sapiro, Pablo Sprechmann,and Guoshen Yu
In this chapter the authors go beyond traditional sparse modeling, and address collabo-rative structured sparsity to add stability and prior information to the representation. Instructured sparse modeling, instead of considering the dictionary atoms as singletons,the atoms are partitioned in groups, and a few groups are selected at a time for thesignal encoding. A complementary way of adding structure, stability, and prior informa-tion to a model is via collaboration. Here, multiple signals, which are known to followthe same model, are allowed to collaborate in the coding. The first studied frameworkconnects sparse modeling with Gaussian Mixture Models and leads to state-of-the-artimage restoration. The second framework derives a hierarchical structure on top of thecollaboration and is well fitted for source separation. Both models enjoy very importanttheoretical virtues as well.
2.1 Introduction
In traditional sparse modeling, it is assumed that a signal can be accurately repre-sented by a sparse linear combination of atoms from a (learned) dictionary. A largeclass of signals, including most natural images and sounds, is well described by thismodel, as demonstrated by numerous state-of-the-art results in various signal processingapplications.
From a data modeling point of view, sparsity can be seen as a form of regulariza-tion, that is, as a device to restrict or control the set of coefficient values which areallowed in the model to produce an estimate of the data. The idea is that, by reducing theflexibility of the model (that is, the ability of a model to fit given data), one gains robust-ness by ruling out unrealistic estimates of the coefficients. In traditional sparse models,regularization translates to the requirement that “a few nonzero coefficients should beenough to represent the data well.”
Compressed Sensing: Theory and Applications, ed. Yonina C. Eldar and Gitta Kutyniok. Published byCambridge University Press. © Cambridge University Press 2012.

66 A. Castrodad, I. Ramirez, G. Sapiro, P. Sprechmann, and G. Yu
However, a great deal of flexibility in sparse models is still present in the usually verylarge possible number of nonzero coefficients subsets, a number which grows exponen-tially with the number of atoms in the dictionary. It turns out that, in certain applications(for example, inverse filtering), where the problem of estimating the model coefficientsis very ill-posed, the reduction in the flexibility of the model (sometimes also referredto as degree of freedom) provided by traditional sparse models may not be enough toproduce both stable and accurate estimates. Note that each set of nonzero coefficientsdefines one subspace, and therefore standard sparse models permit an often very largenumber of subspaces for data representation.
To further reduce the flexibility of the model, and obtain more stable estimates (whichat the same time are often faster to compute), structured sparse models impose furtherrestrictions on the possible subsets of the estimated active coefficients. For example,groups of atoms are forced to be simultaneously selected, thereby reducing the numberof subspaces utilized to represent the data.
Another reason to add structure to sparse models is to incorporate prior knowledgeabout the signal of interest and how it can be represented. For example, in factor analysisproblems, where one is interested in finding those factors which play a role in predictingresponse variables, an explanatory factor is often known to be represented by groupsof input variables. In those cases, selecting the input variables in groups rather thanindividually produces better results [43].
Another complementary way of adding structure, stability, and prior information, to amodel is via collaboration. Here, if multiple signals, which are known to follow the samemodel, are allowed to collaborate in the coding, further stability is obtained in the overallsparse representation, leading to more accurate estimates. In audio signal processing, forexample, sounds are typically locally stationary, and dependency can be added betweencoefficients in consecutive short-time frames to improve the signal’s estimate [39].
This chapter presents two concrete structured and collaborative sparse models thatare shown to be effective for various applications in image and audio processing, andpattern recognition. Incorporating prior knowledge about the underlying signals, bothmodels account for structure by constructing the dictionary with groups of atoms andcalculating the coding in a collaborative way.
Section 1.2 presents a structured sparse model for image restoration problems suchas inpainting, zooming, and deblurring [42]. Since these inverse problems are ill-posed,stabilizing the estimation is indispensable to obtain accurate estimates. The structureddictionary is composed of a number of PCA (Principal Component Analysis) bases,each capturing one class of signals, for example local patterns of different directions forimages. A signal is estimated with a collaborative linear filter using a single PCA fromthe collection, and the best estimation is then used as the corresponding representation.This method is less flexible, more stable, and computationally much less expensive thantraditional sparse modeling, leading to state-of-the-art results in a number of ill-posedproblems. The model follows a Gaussian mixture model interpretation as well, therebyconnecting these classical linear models with sparse coding.
Section 1.3 describes a collaborative hierarchical sparse model for a number of sourceseparation and pattern recognition tasks [32]. The source separation problem naturally

On structured sparsity 67
arises in a variety of signal processing applications such as audio segmentation andmaterial identification in hyperspectral imaging. The structured dictionary in this case iscomposed by a set of sub-dictionaries, each of them learned to sparsely model one of a setof possible classes. The coding is performed by efficiently (and collaboratively) solving aconvex optimization problem that combines standard sparsity with group sparsity. Aftercoding the mixed signal, the sources can be recovered by reconstructing the sub-signalsassociated to the used sub-dictionaries. Having stable atom selection is thus particularlyimportant for these tasks of source identification. The collaborative filtering in the codingis critical to further stabilize the sparse representation, letting the samples collaboratein identifying the classes (sources), while allowing different samples to have differentinternal representations (inside the group). As an important special case, one can addresspattern recognition problems by characterizing the signals based on the group selection,similarly to the above model, where each PCA represents a class of signal. Comparingwith the classic sparse modeling, again this collaborative and structured sparse modelimproves both the signal recognition and reconstruction.
The rest of this chapter provides additional details on these examples of structured andcollaborative sparse modeling, further connects between them, and presents a numberof examples in image restoration, source separation in audio, image classification, andhyperspectral image segmentation. For additional details and theoretical foundations, aswell as the full color figures here reproduced in black and white, see [9, 31, 32, 42].
2.2 Image restoration and inverse problems
Image restoration often requires to solve an inverse problem, where the image u to berecovered is estimated from a measurement
y = Au+ ε,
obtained through a non-invertible linear degradation operator A, and contaminated by anadditive noise ε. Typical degradation operators include masking, sub-sampling in a uni-form grid and convolution, the corresponding inverse problems often named inpaintingor interpolation, zooming, and deblurring. Estimating u requires some prior informationon the image, or equivalently, image models. Finding good image models is therefore atthe heart of image estimation.
As mentioned in Section 1.1, sparse models have been shown to be very effectivefor some of the aforementioned image processing applications. First, because the sparserepresentation hypothesis applies very well to image data (in particular when imagepatches are considered instead of entire images), and second, due to the noise-rejectionproperties of sparsity-regularized regression models.
However, for certain applications, the degree of freedom of classical sparse modelsis too large for the estimates to be stable, unless further structure (prior information) isadded to the system. This section describes a structured and collaborative sparse mod-eling framework introduced in [42] that provides general and computationally efficient

68 A. Castrodad, I. Ramirez, G. Sapiro, P. Sprechmann, and G. Yu
solutions for image restoration problems. Preliminary theoretical results supporting thismodel can be found at [40], while applications for non-imaging types of signals arereported in [21].
2.2.1 Traditional sparse modeling
Traditional sparse estimation using learned dictionaries provides the foundation toseveral effective algorithms for solving inverse problems. However, issues such ashighly correlated atoms in the dictionary (high mutual coherence), or excessive degreeof freedom, often lead to instability and errors in the estimation. Some of thesealgorithms [13, 18, 23, 38] are briefly reviewed below.
A signal u ∈ Rm is estimated by taking advantage of prior information specified viaa dictionary Φ ∈ Rm×n, having n columns corresponding to a set of atoms φi : i =
1, . . . ,n, in which an approximation to u can be sparsely represented. This dictionarymay be a basis (e.g., DCT, Wavelet) or some redundant frame with n ≥ m. Sparsitymeans that u can be well approximated by a representation uT over a subspace VT
generated by a small number |T | n of column vectors φii∈T of Φ:
u = uT + εT = Φx+ εT , (2.1)
where x ∈ Rn is the transform coefficient vector with support T = i : xi = 0, and‖εT ‖2 ‖u‖2 is a small approximation error. The support set T is also commonlyreferred to as the active set.Asparse representation ofu in terms of a redundant dictionaryΦ can be calculated for example by solving the following 1-regularized regressionproblem [11],
x =1
2argmin
x‖Φx−u‖2
+λ ‖x‖1 , (2.2)
which is also known as the Lagrangian version of the Lasso [33]. Other alternativesinclude for example the greedy Matching Pursuit algorithm [24]. The parameter λ con-trols the trade-off between sparsity and approximation accuracy. See [27] for more onthis parameter and [45, 44] for non-parametric sparse models.
Sparse inversion algorithms try to estimate, from the degraded signal y = Au + ε,the support T and the coefficients x in T that specify the representation of u in theapproximation subspace VT . It results from (2.1) that
y = AΦx+ ε′, with ε′ = AεT + ε. (2.3)
This means that y is well approximated by the same sparse set T of atoms and the samecoefficients x in the transformed dictionary Ψ=AΦ, whose columns are the transformedvectors ψi = Aφii=1,...,n. Therefore, a sparse approximation y = Ψx of y could inprinciple be calculated with the 1 minimization (2.2) using the transformed dictionaryAΦ
x = argminx
1
2‖Ψx−y‖2 +λ‖x‖1. (2.4)
The resulting sparse estimation of u is
u = Φx. (2.5)

On structured sparsity 69
Figure 2.1 Coherence of the transformed dictionary AΦ. Here φi and φi′ are respectively a constant atomand an oscillatory one in Φ, and A is the regular sub-sampling operator. Transformed by theoperator, Aφi and Aφi′ in AΦ become identical.
This simple approach is often ineffective, motivating the introduction of structureand collaboration for inverse problems. This is because the geometric properties ofnon-invertible operators A such as sub-sampling on a uniform grid and convolution,do not guarantee correct recovery of representation coefficients via penalized 1 basedestimation algorithms. For example, conditions based on the restricted isometry property[8, 12], are violated by such operators even for very low sparsity levels |T |. The sameoccurs with the recovery guarantees which are based on the mutual coherence of thetransformed dictionary Ψ = AΦ, which measures the orthogonality of its atoms [34].Stable and accurate sparse inverse problem estimation requires that the transformeddictionary Ψ be incoherent enough (that is, close to orthogonal). The estimation may beunstable if some of the columns in Ψ are too similar. This can be seen in the following toyexample. Let φi and φi′ be respectively a constant atom and an oscillatory one, and letA be a sub-sampling operator, as illustrated in Figure 2.1. After sub-sampling ψi = Aφi
and ψi′ =Aφi′ coincide. Therefore the sparse estimation (1.4) can’t distinguish betweenthem, which results in an unstable inverse problem estimate (2.5). The coherence of Ψ
depends on Φ as well as on the operator A. Operators A such as sub-sampling ona uniform grid and convolution, usually lead to a coherent Ψ, which makes accurateinverse problem estimation difficult.
In the unstable scenario of inverse filtering, the degree of freedom of traditional sparsemodels is another source of instability. Without further constraints, for a dictionary withn atoms, the number of possible subspaces VT where the signal can be represented is(
n|T |), usually very large. For example, in a local patch-based sparse estimation setting
with patches of size 8×8, typical values of n = 256 and |T |= 8 result in a huge(256
8
)∼
1014 number of possible subspaces to choose from, further stressing the inaccuracy(and relatively high computational complexity) of estimating the correct x given thetransformed dictionary AΦ. Adding structure to the dictionary, where atoms are selectedin groups, reduces the number of possible subspaces, thereby stabilizing the selection.We describe next a particular case of this, where atoms are grouped and a single group isselected at a time, with a drastic reduction in the number of possible subspaces, and at thesame time improvement in computational cost and restoration accuracy. For additionalstructured sparse models and results, see for example [4, 15, 20] as well as the model inthe next section. This collection of works clearly show the advantages of adding structureto sparse models, in particular when the structure can be naturally derived or learned from

70 A. Castrodad, I. Ramirez, G. Sapiro, P. Sprechmann, and G. Yu
(a) (b)
Figure 2.2 (a) Unstructured standard overcomplete dictionary. Each column represents an atom in thedictionary. In traditional sparse estimation it is allowed to select any combination of atoms(marked by the darkest columns). (b) The underlying structured sparse dictionary of theproposed approach. The dictionary is composed of a family of PCA bases whose atoms arepre-ordered by their associated eigenvalues. For each image patch, an optimal linear estimator iscalculated in each PCA basis, and the best linear estimate among the bases is selected (B2).
the data. This has been shown to have advantages at all levels, from the theoretical results,with improved bounds when compared to standard sparsity, to the practical applications.
2.2.2 Structured sparse modeling
Figure 2.2(b) illustrates the proposed structured sparse modeling dictionary, comparewith standard sparse modeling as represented in Figure 2.2(a). Structure is introducedto constrain the atoms selection and thus stabilize the sparse estimation. The dictionaryis composed of a union of c blocks, each block being a PCA basis whose atoms arepre-ordered by their associated eigenvalues. To estimate a signal, a collaborative linearestimator is calculated in each PCA basis, and the best linear estimate among thesebases is selected with a non-linear model selection at the block level. The resultingpiecewise linear estimator (PLE) sharply reduces the degree of freedom of the model(only c options) with respect to the traditional sparse estimation, thus stabilizing theestimate.
The proposed structured sparse modeling is based on the Gaussian mixture model. Thisfollows from the straightforward relationship between Gaussian functions and PCAs,basically the latter being the eigenvectors of the covariance matrix of the former.
Gaussian mixture model (GMM)Natural images include rich and non-stationary content, whereas, when restricted to localwindows, image structures appear to be simpler and are therefore easier to model. Tothis end, an image is first decomposed into overlapping
√m×
√m patches,
yj = Ajuj + εj , with 1 ≤ j ≤ p, (2.6)
where p is the total number of patches, Aj is the degradation operator restricted to thepatch j, yj and uj are respectively the degraded and original image patches, and εj is thenoise restricted to the patch. The noise is assumed to be white Gaussian, εj ∼N (0,σ2I),where I is the identity matrix. Treated as a signal, each of the patches is estimated, andtheir corresponding estimates are finally combined and averaged, leading to the estimateof the image.
The GMM describes local image patches with a mixture of Gaussian distributions.Assume there exist c Gaussian distributions, N (µr,Σr)1≤r≤c, parameterized by their

On structured sparsity 71
means µr and covariances Σr,
f(uj) =1
(2π)m/2|Σrj |1/2 exp
(−1
2(uj −µrj
)T Σ−1rj
(uj −µrj)
). (2.7)
Each image patch uj is independently drawn from one of these Gaussian distri-butions. This is represented by an unknown index rj ∈ [1, c],1 ≤ j ≤ p. In thisframework, estimating uj1≤j≤p from yj1≤j≤p can then be cast into the followingsubproblems:
• Estimate the Gaussian parameters (µr,Σr)1≤r≤c, from the degraded datayj1≤j≤p.
• Identify the Gaussian distribution rj that generates uj , ∀1 ≤ j ≤ p.• Estimate uj from its generating Gaussian distribution (µrj
,Σrj), ∀1 ≤ j ≤ p.
This problem is overall non-convex. The next section will present a maximum a poste-riori expectation-maximization (MAP-EM) algorithm that calculates a local-minimumsolution [2].
MAP-EM algorithmFollowing initialization, which is addressed in detail in [42], the MAP-EM algorithmiterations alternate between two steps, an E-step and an M-step, described next.
E-step: signal estimation and model selectionIn the E-step, the estimates of the Gaussian parameters (µr, Σr)1≤r≤c are assumedto be known. To simplify the notation, we assume without loss of generality that theGaussian distributions have zero means, µr = 0, as one can always center the imagepatches with respect to the means.
Each image patch uj is calculated to maximize the log a-posteriori probability (MAP)logf(uj |yj , Σrj ). It can be shown that this maximization can be calculated in two steps:first, the MAP estimate of uj is computed in terms of each Gaussian model, and thenthe model with largest MAP probability is selected. More specifically:
1. Signal estimation with each Gaussian modelGiven a Gaussian signal model u∼N (0, Σr), the MAP estimate
urj = argmin
u
(‖Aju−yj‖2 +σ2uT Σ−1
r u)
(2.8)
is calculated. One can verify, [42], that the solution to (1.8) can be obtained withlinear filtering
urj = Hr,jyj , (2.9)
whereHr,j = (AT
j Aj +σ2Σ−1r )−1AT
j (2.10)
is a Wiener filter matrix. Assuming Σr is positive definite, since ATj Aj is semi-
definite positive, ATj Aj + σ2Σ−1
r is also positive definite and its inverse is welldefined.

72 A. Castrodad, I. Ramirez, G. Sapiro, P. Sprechmann, and G. Yu
2. Best model selectionThe best Gaussian model rj that generates the maximum MAP probabilitylogf(uj |yj , Σrj
) among all the models is then selected with the estimated urj
rj = argminr
(‖Ajur
j −y‖2 +σ2(urj)
T Σ−1r ur
j +σ2 log
∣∣∣Σr
∣∣∣) . (2.11)
The signal estimate is obtained by plugging in the best model rj in the MAP estimate,
uj = urj
j . (2.12)
M-step: model estimationIn the M-step, the Gaussian model selection rj and the signal estimate uj of all the patchesare assumed to be known. Let Cr be the ensemble of the patch indices j that are assignedto the rth Gaussian model, i.e., Cr = j : rj = r, and let |Cr| be its cardinality. Theparameters of each Gaussian model are collaboratively found via maximum likelihood,using all the patches assigned to that Gaussian cluster,
µr =1
|Cr|∑j∈Cr
uj and Σr =1
|Cr|∑j∈Cr
(uj − µr)(uj − µr)T . (2.13)
The empirical covariance estimate may be improved through regularization when thereis lack of data [29]. In this case, a simple eigenvalue-based regularization is used, Σr ←Σr + εI, where ε is a small constant [42].
As the MAP-EM algorithm described above iterates, the joint MAP probability of theobserved signals, f(uj1≤j≤p|yj1≤j≤p,µr, Σr1≤r≤c), always increases. This canbe observed by interpreting the E- and M-steps as a block-coordinate descent optimiza-tion algorithm [19]. In the experiments reported below, both the patch clustering andresulting PSNR converge after a few iterations.
The computational cost of the EM-MAP algorithm is dominated by the E-step, whichconsists basically of a set of linear filtering operations. For typical applications such aszooming and deblurring where the degradation operators Aj are translation-invariantand do not depend on the patch index j, i.e., Aj ≡ A,∀1 ≤ j ≤ p, the Wiener filtermatrices Hr,j ≡Hr (1.10) can be precomputed for each of the c Gaussian distributions.Calculating (1.9) thus requires only 2m2 floating-point operations (flops), where m isthe image patch size. For a translation-variant degradation Aj , random masking forexample, Hr,i needs to be calculated at each position where Aj changes. In this case,the calculation is dominated by the matrix inversion in (1.10) which can be implementedwith m3/3 flops through a Cholesky factorization [6].
Structured sparse estimation in PCA basesThe PCA bases bridge the GMM/MAP-EM framework presented above with the sparseestimation model described in Section 2.2.1, the former leading to structured sparseestimation.
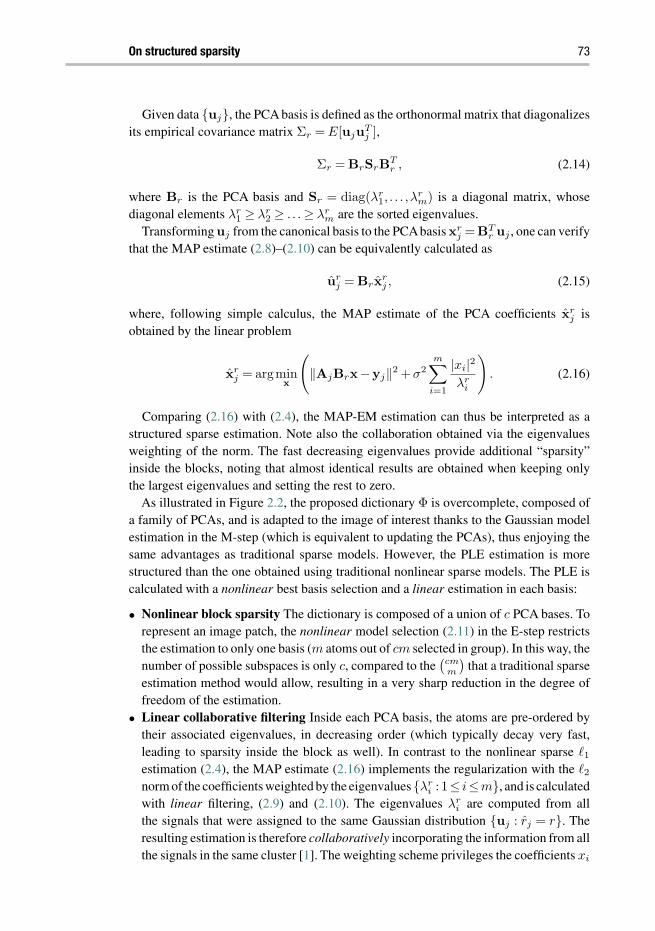
On structured sparsity 73
Given data uj, the PCA basis is defined as the orthonormal matrix that diagonalizesits empirical covariance matrix Σr = E[ujuT
j ],
Σr = BrSrBTr , (2.14)
where Br is the PCA basis and Sr = diag(λr1, . . . ,λ
rm) is a diagonal matrix, whose
diagonal elements λr1 ≥ λr
2 ≥ . . . ≥ λrm are the sorted eigenvalues.
Transforming uj from the canonical basis to the PCAbasis xrj =BT
r uj , one can verifythat the MAP estimate (2.8)–(2.10) can be equivalently calculated as
urj = Brxr
j , (2.15)
where, following simple calculus, the MAP estimate of the PCA coefficients xrj is
obtained by the linear problem
xrj = argmin
x
(‖AjBrx−yj‖2 +σ2
m∑i=1
|xi|2λr
i
). (2.16)
Comparing (2.16) with (2.4), the MAP-EM estimation can thus be interpreted as astructured sparse estimation. Note also the collaboration obtained via the eigenvaluesweighting of the norm. The fast decreasing eigenvalues provide additional “sparsity”inside the blocks, noting that almost identical results are obtained when keeping onlythe largest eigenvalues and setting the rest to zero.
As illustrated in Figure 2.2, the proposed dictionary Φ is overcomplete, composed ofa family of PCAs, and is adapted to the image of interest thanks to the Gaussian modelestimation in the M-step (which is equivalent to updating the PCAs), thus enjoying thesame advantages as traditional sparse models. However, the PLE estimation is morestructured than the one obtained using traditional nonlinear sparse models. The PLE iscalculated with a nonlinear best basis selection and a linear estimation in each basis:
• Nonlinear block sparsity The dictionary is composed of a union of c PCA bases. Torepresent an image patch, the nonlinear model selection (2.11) in the E-step restrictsthe estimation to only one basis (m atoms out of cm selected in group). In this way, thenumber of possible subspaces is only c, compared to the
(cmm
)that a traditional sparse
estimation method would allow, resulting in a very sharp reduction in the degree offreedom of the estimation.
• Linear collaborative filtering Inside each PCA basis, the atoms are pre-ordered bytheir associated eigenvalues, in decreasing order (which typically decay very fast,leading to sparsity inside the block as well). In contrast to the nonlinear sparse 1estimation (2.4), the MAP estimate (2.16) implements the regularization with the 2norm of the coefficients weighted by the eigenvaluesλr
i : 1≤ i≤m, and is calculatedwith linear filtering, (2.9) and (2.10). The eigenvalues λr
i are computed from allthe signals that were assigned to the same Gaussian distribution uj : rj = r. Theresulting estimation is therefore collaboratively incorporating the information from allthe signals in the same cluster [1]. The weighting scheme privileges the coefficients xi

74 A. Castrodad, I. Ramirez, G. Sapiro, P. Sprechmann, and G. Yu
(a) (b) (c)
Figure 2.3 (a) Lena image. (b) Patch clustering obtained with the initial directional PCAs. The patches aredensely overlapped and each pixel represents the model rj selected for the 8× 8 patch around it,different gray levels encoding different direction values of rj, from 1 to c = 19. (c) Patchclustering at the 2nd iteration.
corresponding to the principal directions with large eigenvalues λi, where the energyis likely to be high, and penalizes the others. For ill-posed inverse problems, thecollaborative prior information incorporated in the eigenvalues λr
i 1≤i≤m furtherstabilizes the estimate. Note that this weighting scheme, which comes directly fromthe mixture of Gaussians/PCA model, is fundamentally different from standard andpopular re-weighted schemes, e.g., [7, 10], where the weights are signal and coefficientdependent.
2.2.3 Experimental results
We now present a number of experimental results obtained with the above describedmodel. For additional results and comparisons, see [42]. In particular, the reader isreferred to this extended report showing how standard sparsity fails in challenging inverseproblems, while PLE, at a significantly lower computational cost, succeeds in obtainingaccurate reconstructions. In fact, the structured sparsity PLE model leads to state-of-the-art results in numerous image inverse problems at a fraction of the computational costof comparable (in reconstruction accuracy) algorithms.
First, Figure 2.3 illustrates the Lena image and the corresponding patch clustering, i.e.,(evolution of) the model selection rj . The patches are densely overlapped and each pixelin Figure 2.3(b) represents the model rj selected for the 8× 8 patch around it, differentgray levels encoding different values of rj . For example, on the edge of the hat, patcheswhere the image patterns follow similar directions are clustered together, as expected.On uniform regions such as the background, where there is no directional preference,all the bases provide equally sparse representations. As the log |Σr|=
∑mi=1 logλr
i termin the model selection (1.11) is initially 0 for all the Gaussian models, the clustering israndom in these regions. As the MAP-EM algorithm evolves, the clustering improves.
Figure 2.4 illustrates, in an inpainting context on Barbara’s cloth, which is rich intexture, the evolution of the patch clustering as well as that of typical PCA bases as

On structured sparsity 75
(a) (b) (c) (d) (e)
Figure 2.4 Evolution of the representations. (a) The original image cropped from Barbara. (b) The imagemasked with 30 percent available data. (c) Bottom: The first few atoms of an initial PCA basiscorresponding to the texture on the right of the image. Top: The resulting patch clustering afterthe 1st iteration. Different gray levels represent different clusters. (d) Bottom: The first fewatoms of the PCA basis updated after the 2nd iteration. Top: The resulting patch clustering afterthe 2nd iteration. (e) The inpainting estimate after the 2nd iteration (32.30 dB).
(a) Original image (b) Low-resolution image (c) Global 1: 22.70 dB (d) Global OMP: 28.24 dB
(e) Block 1 26.35 dB (f) Block OMP: 29.27 dB (g) Block weighted
1: 35.94 dB
(h) Block weighted
2: 36.45 dB
Figure 2.5 Comparison of different estimation methods on super-resolution zooming. (a) The originalimage cropped from Lena. (b) The low-resolution image, shown at the same scale by pixelduplication. From (c) to (h) are the super-resolution results obtained with different estimationmethods. See text for more details.
the MAP-EM algorithm iterates. The clustering becomes cleaner as the algorithm iter-ates. Some high-frequency atoms are promoted to better capture the oscillatory patterns,resulting in a significant PSNR improvement of more than 3 dB. On contour imagessuch as Lena’s hat illustrated in Figure 2.5, on the contrary, although the patch cluster-ing becomes cleaner as the algorithm iterates, the resulting local PSNR evolves littleafter the initialization, which already produces an accurate estimation, since the initial

76 A. Castrodad, I. Ramirez, G. Sapiro, P. Sprechmann, and G. Yu
directional PCA bases themselves are calculated over synthetic contour images. Theresulting PSNRs typically converge in three to five iterations.
Figure 2.5 shows, in a zooming context on a typical region of Lena, the gain of intro-ducing structure in sparse inverse problem estimation. An overcomplete dictionary Φ
composed of a family of PCA bases Br1≤r≤c, illustrated in Figure 2.2(b), is learnedas described above, and is then fed to the following estimation schemes. (i) Global 1and OMP: the ensemble of Φ is used as an overcomplete dictionary, and the zoom-ing estimation is calculated with the sparse estimate (1.4) through, respectively, an 1minimization or an orthogonal matching pursuit (OMP). (ii) Block 1 and OMP: thesparse estimate is calculated in each PCA basis Br through 1 minimization and OMPrespectively, and the best estimate is selected with a model selection procedure similarto (2.11), thereby reducing the degree of freedom in the estimation with respect to theglobal 1 and OMP [41]. (iii) Block weighted 1 : on top of the block 1, weights areincluded for each coefficient amplitude in the regularizer,
xrj = argmin
x
(‖AjBrx−yj‖2 +σ2
m∑i=1
|xi|τ ri
), (2.17)
with the weights τ ri = (λr
i )1/2, where λr
i are the eigenvalues of the rth PCA basis. Theweighting scheme penalizes the atoms that are less likely to be important, followingthe spirit of the weighted 2 deduced from the MAP estimate. (iv) Block weighted 2:the proposed PLE. Comparing with (2.17), the difference is that the weighted 2 (2.16)takes the place of the weighted 1, thereby transforming the problem into a stable andcomputationally efficient piecewise linear estimation.
The global 1 and OMPproduce some clear artifacts along the contours, which degradethe PSNRs. The block 1 or OMP considerably improves the results (especially for 1).Comparing with the block 1 or OMP, a very significant improvement is achieved byadding the collaborative weights on top of the block 1. The proposed PLE with the blockweighted 2, computed with linear filtering, further improves the estimation accuracyover the block weighted 1, with a much lower computational cost.
These illustrative examples show the high quality of the results achieved with the pro-posed structured and collaborative sparse model. In [42] we show that this extremely sim-ple and computationally efficient approach leads to state-of-the-art results in a number ofapplications. We now move to a different way of introducing structure and collaborationin sparse modeling, this time tailored to source identification and separation instead ofsignal reconstruction. Note that the PLE model can also be extended to consider more thanone PCA (dictionary block) active at a time, coming closer to the model presented next.
2.3 Source identification and separation via structured andcollaborative models
In the previous section it was shown that imposing structure in a model is an effectiveway of stabilizing the solutions of otherwise highly unstable inverse problems such as

On structured sparsity 77
image deblurring. In general, adding structure to a model further restricts the span of amodel to those solutions that are compatible with our prior knowledge.
In this section, another set of applications is presented where prior information natu-rally translates into structural constraints on the solutions of sparse models, leading to anew family of structured sparse models. The model now presented was first introducedin [32], where the reader is referred to for additional details as well as connections withthe literature such as [17, 20]. The applications for source identification, in particular inmusic, was introduced in [31], and the pattern detection classification in [28].
Problem statement
In the source separation problem, an observed signal y is assumed to be a linear super-position (mixture) of several (say c) sources, plus additive noise, y =
∑cr=1 αryr + ε,
and the primary task is to estimate each of the unmixed sources yr out of it. If the taskis only to identify the active sources, the problem is called source identification. In turn,the source identification problem includes as a special case the pattern classificationproblem, in which only one out of the c sources is assumed to be present at a time, thatis, αr is nonzero for only one index r0. The E-step of the MAP-EM algorithm presentedin Section 1.2.2 is an example of the latter case.
Note that, in the source identification setting (including pattern classification), sincethe original sources do not need to be recovered, the modeling can be done in terms offeatures extracted from the original signals in a non-bijective way.
In all the above problems, a sparsity assumption arises naturally when one can assumethat, out of the c sources, only a few k c of them are actually active (nonzero). Thiscan happen for example in a piece of music, where only a few instruments are playingsimultaneously.
Continuing with the music example, traditional sparse modeling tools can be usedto learn a dictionary Br for each one of the c possible instruments [22], such that thesound produced by each instrument at each instant is efficiently represented by a fewatoms from its corresponding dictionary. Concatenating the dictionaries (as shown inFigure 2.2), Φ = [B1|B2| . . . |Bc], any mixture signal produced by that ensemble willbe represented accurately as a sparse linear combination of the atoms of this largerdictionary Φ. However, contrary to a general sparse model, in this case one expects theresulting sparsity patterns to have a particular structure: only a few blocks are active ata time, and inside these blocks, only a few atoms participate in the representation of thecorresponding class.
Translated to the coefficients vector x, this constitutes a hierarchical sparsity assump-tion, where only a few out of many possible groups are active (each group of coefficientsis associated to an instrument sub-dictionary), and, within each active group, only afew atoms are required to represent the sound produced by the corresponding instru-ment accurately. The first model presented in this section imposes these assumptionsexplicitly in the model, promoting a hierarchical sparsity pattern in the sparse codes. Incases where these assumptions hold, it can be shown that the success in recovering theunmixed sources can only improve using this model.

78 A. Castrodad, I. Ramirez, G. Sapiro, P. Sprechmann, and G. Yu
The second model presented, also designed for source separation and identificationproblems, further exploits typical prior knowledge available in such problems. Contin-uing with the music example, one can assume by temporal continuity that, over shortcontiguous passages of a piece, the few instruments that are playing simultaneously willremain approximately the same, whereas the sound each of them produces can vary morerapidly. This new prior knowledge can be exploited by imposing, during coding, thatall samples in a given time window have the same few active groups (same few instru-ments playing), thus resulting in a collaborative coding scheme. However, it cannot beexpected that the sound produced in each of these samples by each instrument will be thesame, thus the collaboration has to address only the detection of the active groups, whileallowing the in-group sparsity patterns (representing the actual sound at each instant) tovary from sample to sample.
We begin this section by briefly introducing the Lasso and Group Lasso sparse regres-sion models, which form the foundation to the models described above. The hierarchicaland collaborative hierarchical models are then presented, along with examples of theirapplication to tasks from image and audio analysis.
2.3.1 The Group Lasso
Given a data sample y, and a dictionary Φ, the 1 regularizer in the Lasso formulation(2.4) induces sparsity in the resulting code x. This is desirable not only from a regu-larization point of view, but also from a model selection perspective, where one wantsto identify the features or factors (atoms) that play an active part in generating eachsample y.
In many situations, however, one knows that certain groups of features can becomeactive or inactive only simultaneously (e.g. measurements of gene expression levels).In that case, structure can be added to the model so that the relevant factors are rep-resented not as singletons, but as predefined groups of atoms. This particular caseof structured sparsity was introduced in [43] and is referred to as the Group Lassomodel.
In the setting presented here, the coefficients vector x is partitioned into blocks, x =
(x1,x2, . . . ,xc), such that each block corresponds to the sub-dictionary with the sameindex in Φ = [B1|B2| . . . |Bc]. To perform group-selection according to this structure,the Group Lasso solves the following problem,
minx∈Rn
1
2‖y−Φx‖2
2 +λ
c∑r=1
‖xr‖2 . (2.18)
The Group Lasso regularizer∑n
r=1 ‖xr‖2 can be seen as an 1 norm on Euclidean normsof the sub-vectors of coefficients from the same group xr. This is a generalization of the1 regularizer, as the latter arises from the special case where each coefficient in x is itsown group (the groups are singletons), and as such, its effect on the groups of x is also anatural generalization of the one obtained with the Lasso: it “turns on/off” coefficientsin groups. Note that in contrast with the PLE model presented before, and since now the

On structured sparsity 79
number of active blocks is unknown, an optimization of this type is needed. When onlyone block is active at a time as in the PLE model, it is more efficient to simply try allblocks in the search for the best one.
The model selection properties of the Group Lasso have been studied both fromthe statistical (consistency, oracle properties) and compressive sensing (exact signalrecovery) points of view, in both cases as extensions of the corresponding results for theLasso [3, 14, 43].
2.3.2 The Hierarchical Lasso
The Group Lasso trades sparsity at the single-coefficient level with sparsity at a grouplevel, while, inside each group, the solution is generally dense. If Group Lasso is appliedto analyze a mixture of signals with a dictionary Φ constructed by concatenating class-specific sub-dictionaries Br (as explained before), it will be unable to recover thehierarchical sparsity pattern in the coefficient vector. It will produce a vector of coef-ficients where, hopefully, only the groups of coefficients corresponding to the sourcesactive in the mixture are nonzero. However, due to the properties of the Group Lassoregularizer, the solutions within each group will be generally dense, that is, all or mostof the coefficients in an active group will be nonzero.
Since each sub-dictionary Br is learned for representing signals from its class in asparse manner, the entire dictionary Φ is appropriate to sparsely represent signals of allthe classes, as well as mixtures of them. Therefore, a sparsity-aware method such as theLasso is consistent with that model, and will produce efficient representations of suchsignals. However, Lasso will not be aware of the group structure, and will thus be unableto perform model selection.
The following model, referred to as Hierarchical Lasso (HiLasso hereafter), combinesthe group-selection properties of Group Lasso while being consistent with the in-groupsparsity assumptions of the Lasso by simply combining the regularization terms fromthose two formulations (again, see [32] for the original developments on this and relationsto the literature),
minx∈Rn
1
2‖yj −Φx‖2
2 +λ2
c∑r=1
‖xr‖2 +λ1 ‖x‖1 . (2.19)
The hierarchical sparsity pattern produced by the solutions of (2.19) is depicted inFigure 2.6(a). For simplicity of the description all the groups are assumed to have the samenumber of elements. The extension to the general case is obtained by multiplying eachgroup norm by the square root of the number of atoms inside the corresponding group.This model then achieves the desired effect of promoting sparsity at the group/class levelwhile at the same time leading to overall sparse feature selection.
The selection of λ1 and λ2 has an important influence on the sparsity of the obtainedsolution. Intuitively as λ2/λ1 increases, the group constraint becomes dominant and thesolution tends to be more sparse at a group level but less sparse within groups.
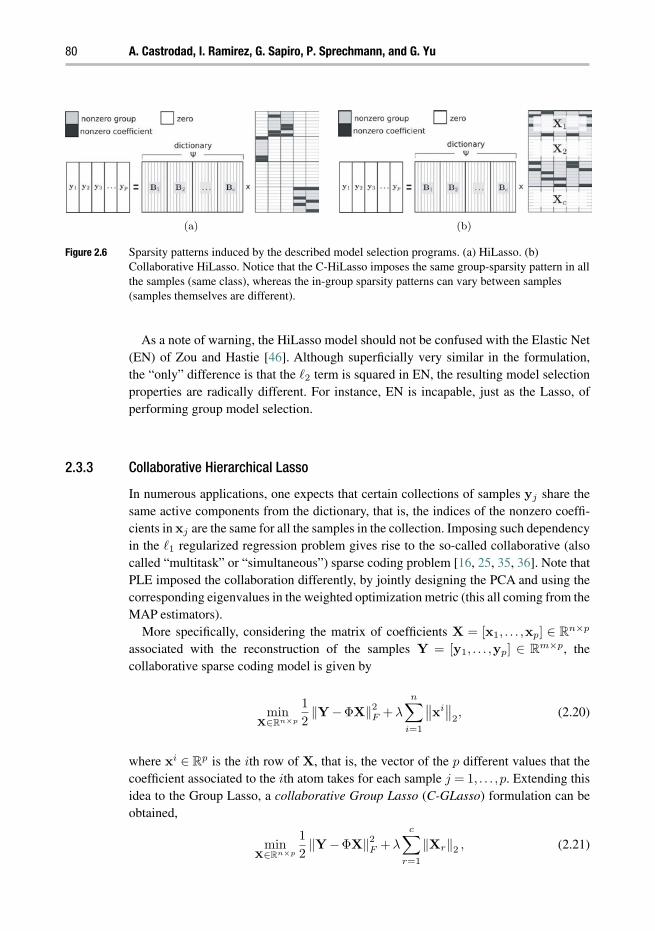
80 A. Castrodad, I. Ramirez, G. Sapiro, P. Sprechmann, and G. Yu
(a) (b)
Figure 2.6 Sparsity patterns induced by the described model selection programs. (a) HiLasso. (b)Collaborative HiLasso. Notice that the C-HiLasso imposes the same group-sparsity pattern in allthe samples (same class), whereas the in-group sparsity patterns can vary between samples(samples themselves are different).
As a note of warning, the HiLasso model should not be confused with the Elastic Net(EN) of Zou and Hastie [46]. Although superficially very similar in the formulation,the “only” difference is that the 2 term is squared in EN, the resulting model selectionproperties are radically different. For instance, EN is incapable, just as the Lasso, ofperforming group model selection.
2.3.3 Collaborative Hierarchical Lasso
In numerous applications, one expects that certain collections of samples yj share thesame active components from the dictionary, that is, the indices of the nonzero coeffi-cients in xj are the same for all the samples in the collection. Imposing such dependencyin the 1 regularized regression problem gives rise to the so-called collaborative (alsocalled “multitask” or “simultaneous”) sparse coding problem [16, 25, 35, 36]. Note thatPLE imposed the collaboration differently, by jointly designing the PCA and using thecorresponding eigenvalues in the weighted optimization metric (this all coming from theMAP estimators).
More specifically, considering the matrix of coefficients X = [x1, . . . ,xp] ∈ Rn×p
associated with the reconstruction of the samples Y = [y1, . . . ,yp] ∈ Rm×p, thecollaborative sparse coding model is given by
minX∈Rn×p
1
2‖Y−ΦX‖2
F +λ
n∑i=1
∥∥xi∥∥
2, (2.20)
where xi ∈ Rp is the ith row of X, that is, the vector of the p different values that thecoefficient associated to the ith atom takes for each sample j = 1, . . . ,p. Extending thisidea to the Group Lasso, a collaborative Group Lasso (C-GLasso) formulation can beobtained,
minX∈Rn×p
1
2‖Y−ΦX‖2
F +λ
c∑r=1
‖Xr‖2 , (2.21)

On structured sparsity 81
whereXr indicates the sub-matrix of rows ofXwhich belong to group r. This regularizeris the natural extension of the regularizer in (1.18) for the collaborative case.
The second model described in this section, called Collaborative Hierarchical Lasso(C-HiLasso), combines the collaborative coding idea with the hierarchical sparse modelpresented in the previous section. However, in this case, collaboration is performed onlyat the group level, leaving the 1 part decoupled between samples. The formulation is asfollows [32],
minX∈Rn×p
1
2‖Y−ΦX‖2
F +λ2
c∑r=1
‖Xr‖2 +
p∑j=1
λ1 ‖xj‖1 . (2.22)
The sparsity patterns obtained with solutions to (2.22) is shown in Figure 2.6(b). Thismodel contains the collaborative Group Lasso as a particular case when λ1 = 0, and thenon-collaborative Lasso (effectively decomposing into p Lasso problems, one for eachsignal uj , j =1, . . . ,p) by setting λ2 =0.Additional levels of hierarchy and collaborationcan be easily included in the model.
In this way, the model encourages all the signals to share the same groups (classes),while allowing the active sets inside each group to vary between signals. The idea behindthis is to model mixture signals such as the music example presented in the introductionto this section, where it is reasonable to assume that the same instruments (groups) areactive during several consecutive signal samples, but the actual sound produced by agiven instrument varies from sample to sample.
The coding of C-HiLasso is described in detail in [32]. The algorithm is an iterativeprocedure that decouples the overall problem into two simpler sub-problems: one thatbreaks the multi-signal problem into p single-signal Lasso-like sparse coding problems,and another that treats the multi-signal case as a collaborative Group Lasso-like problem.The scheme is guaranteed to converge to the global optimum and it consists of a series ofsimple vector soft-thresholding operations derived from a combination of theAlternatingDirection Method of Multipliers (ADMOM) [5] with SPARSA [37].
As with the traditional sparse regression problems, Lasso and Group Lasso, it is ofspecial interest to know under which conditions the HiLasso will be able to recoverthe true underlying sparse vector of coefficients x given an observation y. This is ofparamount importance to the source identification and classification problems, whereone is interested more in x and its active set rather than in recovering x. This hasbeen carefully studied in [32], where we provide conditions for the existence of uniquesolutions of the HiLasso model and for the correct recovery of the active set.
2.3.4 Experimental results
This section presents four different examples to show how C-HiLasso can be applied insignal processing tasks. First, three different examples on source separation and identifi-cation, covering a wide range of signal types, are presented. Then, an object recognitionapplication is presented to illustrate how the ideas behind C-HiLasso can be used forpattern recognition tasks.

82 A. Castrodad, I. Ramirez, G. Sapiro, P. Sprechmann, and G. Yu
Digits separation under missing informationThis example addresses the separation of digit images. Although this is a rather artificialexample, it is useful to clearly show the concepts explained in the previous sections.Hand-written digit images are an example where sparse models have been shown to beeffective [28]. In this case, each sample vector contains the gray level intensities of an√
m×√
m image of a hand-written digit. The dataset used is the USPS dataset, whichcontains several samples of each digit from 0 to 9, and is divided, as usual, into a trainingand a testing subset.
In this example, each sub-dictionaryBr is learned from the training samples to sparselyrepresent a single digit. The set of mixtures, Y, is then simulated by drawing randomdigits “3” and “5” from the testing dataset, and then setting 60 percent of the pixelsto 0. The simulated input was then encoded using C-HiLasso and Lasso. Figure 2.7shows the recovered coefficients for each method. One can see that only C-HiLasso cansuccessfully detect which digits were present in the mixture. The collaborative codingtechnique, that considers jointly all signals to perform the model selection, is crucial
(a) (b) (c) (d)
(e) (f)
Figure 2.7 Example of recovered digits (3 and 5) from a mixture with 60 percent of missing components.(a) Noiseless mixture. (b) Observed mixture with missing pixels highlighted in dark gray. (c) and(d) Recovered digits 3 and 5 respectively. (e) and (f) Active set recovered for all samples usingthe C-HiLasso and Lasso respectively. The coefficients corresponding to the sub-dictionaries fordigits 3 and 5 are marked as gray bands. Active sets of the recovered coefficients matrix X areshown as a binary matrix the same size as X (atom indices in the vertical axis and sample indicesin the horizontal axis), with black dots indicating nonzero coefficients. Notice that the C-HiLassoexploits the hypothesis of collaborative group-sparsity, succeeding in recovering the correctactive groups in all the samples. The Lasso, which lacks this prior knowledge, is clearly notcapable of doing so, and active sets spread all over the groups.
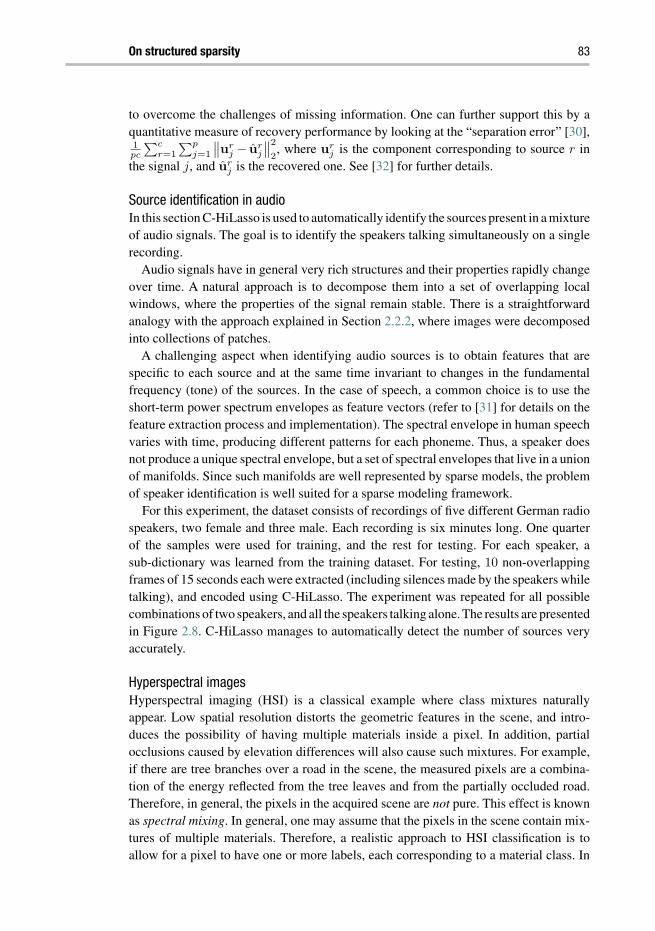
On structured sparsity 83
to overcome the challenges of missing information. One can further support this by aquantitative measure of recovery performance by looking at the “separation error” [30],1pc
∑cr=1
∑pj=1
∥∥urj − ur
j
∥∥22, where ur
j is the component corresponding to source r inthe signal j, and ur
j is the recovered one. See [32] for further details.
Source identification in audioIn this section C-HiLasso is used to automatically identify the sources present in a mixtureof audio signals. The goal is to identify the speakers talking simultaneously on a singlerecording.
Audio signals have in general very rich structures and their properties rapidly changeover time. A natural approach is to decompose them into a set of overlapping localwindows, where the properties of the signal remain stable. There is a straightforwardanalogy with the approach explained in Section 2.2.2, where images were decomposedinto collections of patches.
A challenging aspect when identifying audio sources is to obtain features that arespecific to each source and at the same time invariant to changes in the fundamentalfrequency (tone) of the sources. In the case of speech, a common choice is to use theshort-term power spectrum envelopes as feature vectors (refer to [31] for details on thefeature extraction process and implementation). The spectral envelope in human speechvaries with time, producing different patterns for each phoneme. Thus, a speaker doesnot produce a unique spectral envelope, but a set of spectral envelopes that live in a unionof manifolds. Since such manifolds are well represented by sparse models, the problemof speaker identification is well suited for a sparse modeling framework.
For this experiment, the dataset consists of recordings of five different German radiospeakers, two female and three male. Each recording is six minutes long. One quarterof the samples were used for training, and the rest for testing. For each speaker, asub-dictionary was learned from the training dataset. For testing, 10 non-overlappingframes of 15 seconds each were extracted (including silences made by the speakers whiletalking), and encoded using C-HiLasso. The experiment was repeated for all possiblecombinations of two speakers, and all the speakers talking alone. The results are presentedin Figure 2.8. C-HiLasso manages to automatically detect the number of sources veryaccurately.
Hyperspectral imagesHyperspectral imaging (HSI) is a classical example where class mixtures naturallyappear. Low spatial resolution distorts the geometric features in the scene, and intro-duces the possibility of having multiple materials inside a pixel. In addition, partialocclusions caused by elevation differences will also cause such mixtures. For example,if there are tree branches over a road in the scene, the measured pixels are a combina-tion of the energy reflected from the tree leaves and from the partially occluded road.Therefore, in general, the pixels in the acquired scene are not pure. This effect is knownas spectral mixing. In general, one may assume that the pixels in the scene contain mix-tures of multiple materials. Therefore, a realistic approach to HSI classification is toallow for a pixel to have one or more labels, each corresponding to a material class. In
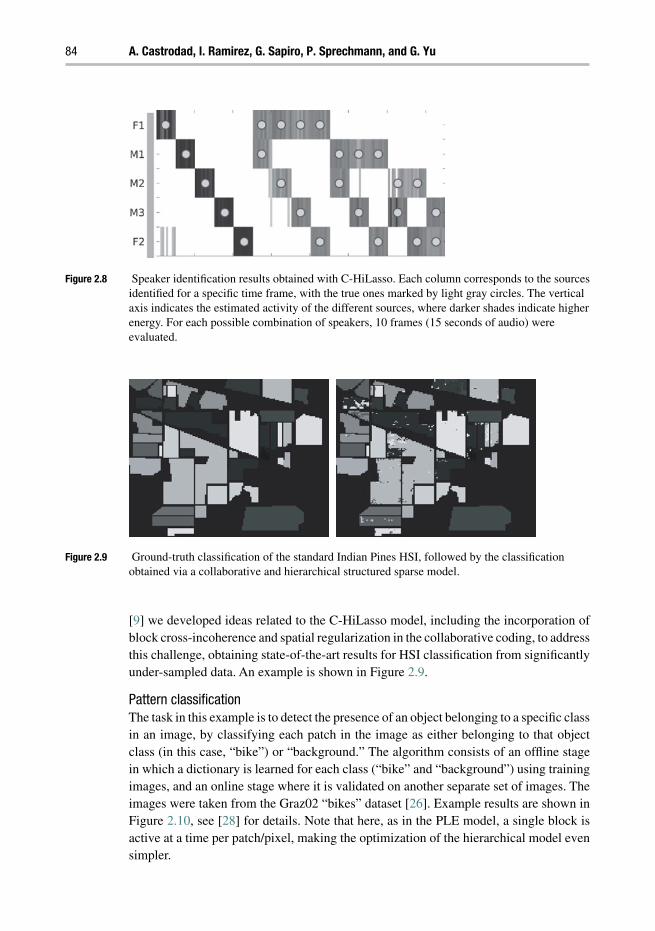
84 A. Castrodad, I. Ramirez, G. Sapiro, P. Sprechmann, and G. Yu
Figure 2.8 Speaker identification results obtained with C-HiLasso. Each column corresponds to the sourcesidentified for a specific time frame, with the true ones marked by light gray circles. The verticalaxis indicates the estimated activity of the different sources, where darker shades indicate higherenergy. For each possible combination of speakers, 10 frames (15 seconds of audio) wereevaluated.
Figure 2.9 Ground-truth classification of the standard Indian Pines HSI, followed by the classificationobtained via a collaborative and hierarchical structured sparse model.
[9] we developed ideas related to the C-HiLasso model, including the incorporation ofblock cross-incoherence and spatial regularization in the collaborative coding, to addressthis challenge, obtaining state-of-the-art results for HSI classification from significantlyunder-sampled data. An example is shown in Figure 2.9.
Pattern classificationThe task in this example is to detect the presence of an object belonging to a specific classin an image, by classifying each patch in the image as either belonging to that objectclass (in this case, “bike”) or “background.” The algorithm consists of an offline stagein which a dictionary is learned for each class (“bike” and “background”) using trainingimages, and an online stage where it is validated on another separate set of images. Theimages were taken from the Graz02 “bikes” dataset [26]. Example results are shown inFigure 2.10, see [28] for details. Note that here, as in the PLE model, a single block isactive at a time per patch/pixel, making the optimization of the hierarchical model evensimpler.

On structured sparsity 85
(a) (b) (c) (d)
Figure 2.10 Bike detection on the Graz dataset. Two example images are shown, with their correspondingdetection maps to the right. Lighter shades indicate that the corresponding patches are more“bike-like.”
2.4 Concluding remarks
In this chapter we introduced models for collaborative and structured sparse representa-tions, leading to state-of-the-art results in classical applications and expanding the reachof sparse modeling to new arenas. We motivated such models by the need both to stabi-lize the coding and to introduce available prior knowledge about the signals and tasks athand. This second generation of sparse models is still in infancy (while standard sparsemodels are already in adolescence), opening the door to numerous new developments atall levels, from the theory to the applications into old and new problems.
Acknowledgements
We thank our collaborators on the topics described in this chapter: S. Mallat, Y. Eldar,L. Carin, Z. Xing, J. Greer, P. Cancela, and E. Bosch. We have learned from them a lot,and they make this research much more fun. Work partially supported by NSF, ONR,NGA, ARO, and NSSEFF.
References
[1] J. Abernethy, F. Bach, T. Evgeniou, and J.P. Vert. A new approach to collaborative filtering:Operator estimation with spectral regularization. J Mach Learn Res, 10:803–826, 2009.
[2] S. Allassonniere, Y. Amit, and A. Trouvé. Towards a coherent statistical framework for densedeformable template estimation. J R Statist Soc B, 69(1):3–29, 2007.
[3] F. Bach. Consistency of the group lasso and multiple kernel learning. J Mach Learn Res,9:1179–1225, 2008.
[4] R. G. Baraniuk, V. Cevher, M. F. Duarte, and C. Hegde. Model-based compressive sensing.IEEE Trans IT, 56(4):1982–2001, 2010.
[5] D. Bertsekas and J. Tsitsiklis. Parallel and Distributed Comptutation: Numerical Methods.Prentice Hall, 1989.
[6] S. P. Boyd and L. Vandenberghe. Convex Optimization. Cambridge University Press, 2004.[7] E. J. Candès, M. Wakin, and S. Boyd. Enhancing sparsity by reweighted 1 minimization.
J Fourier Anal Appl, 14(5):877–905, 2008.

86 A. Castrodad, I. Ramirez, G. Sapiro, P. Sprechmann, and G. Yu
[8] E.J. Candés and T. Tao. Near-optimal signal recovery from random projections: Universalencoding strategies? IEEE Trans Inform Theory, 52(12):5406–5425, 2006.
[9] A. Castrodad, Z. Xing, J. Greer, et al. Learning discriminative sparse models for sourceseparation and mapping of hyperspectral imagery. Submitted, 2010.
[10] R. Chartrand and W. Yin. Iteratively reweighted algorithms for compressive sensing. 2008.[11] S. S. Chen, D. L. Donoho, and M. A. Saunders. Atomic decomposition by basis pursuit.
SIAM J Sci Comp, 20:33, 1999.[12] D. L. Donoho. Compressed sensing. IEEE Trans Inform Theory, 52(4):1289–1306, 2006.[13] M. Elad, J. L. Starck, P. Querre, and D. L. Donoho. Simultaneous cartoon and texture image
inpainting using morphological component analysis (MCA). Appl Comput Harmon Anal,19(3):340–358, 2005.
[14] Y. C. Eldar, P. Kuppinger, and H. Bölcskei. Compressed sensing of block-sparse signals:Uncertainty relations and efficient recovery. IEEE Trans Sig Proc, 58:3042–3054, 2010.
[15] Y. C. Eldar and M. Mishali. Robust recovery of signals from a structured union of subspaces.IEEE Trans Inform Theory, 55(11):5302–5316, 2009.
[16] Y. C. Eldar and H. Rauhut. Average case analysis of multichannel sparse recovery usingconvex relaxation. IEEE Trans Inform Theory, 56:505–519, 2010.
[17] J. Friedman, T. Hastie, and R. Tibshirani. A note on the group lasso and a sparse group lasso.Preprint, 2010.
[18] O. G. Guleryuz. Nonlinear approximation based image recovery using adaptive sparse recon-structions and iterated denoising–Part II: Adaptive algorithms. IEEE Trans Image Proc,15(3):555–571, 2006.
[19] R. J. Hathaway. Another interpretation of the EM algorithm for mixture distributions. StatProb Letters, 4(2):53–56, 1986.
[20] R. Jenatton, J. Audibert, and F. Bach. Structured variable selection with sparsity-inducingnorms. Technical Report arXiv:0904.3523v1, INRIA, 2009.
[21] F. Leger, G. Yu, and G. Sapiro. Efficient matrix completion with Gaussian models. Inhttp://arxiv.org/abs/1010.4050, 2010.
[22] J. Mairal, F. Bach, J. Ponce, and G. Sapiro. Online dictionary learning for sparse coding. InICML ’09: Proc 26th Ann Inte Conf Mach Learning, 689–696, New York, 2009.
[23] J. Mairal, M. Elad, and G. Sapiro. Sparse representation for color image restoration. IEEETrans Image Proc, 17, 2008.
[24] S. G. Mallat and Z. Zhang. Matching pursuits with time-frequency dictionaries. IEEE TransSig Proc, 41(12):3397–3415, 1993.
[25] M. Mishali and Y. C. Eldar. Reduce and boost: Recovering arbitrary sets of jointly sparsevectors. IEEE Trans Sig Proc, 56(10):4692–4702, 2008.
[26] A. Opelt, A. Pinz, M. Fussenegger, and P. Auer. Generic object recognition with boosting.IEEE Trans PAMI, 28(3), 2006.
[27] I. Ramirez and G. Sapiro. Universal regularizers for robust sparse coding and modeling.Submitted, http://arxiv.org/abs/1003.2941, 2010.
[28] I. Ramirez, P. Sprechmann, and G. Sapiro. Classification and clustering via dictionary learningwith structured incoherence. CVPR, 2010.
[29] J. Schafer and K. Strimmer.Ashrinkage approach to large-scale covariance matrix estimationand implications for functional genomics. Statist Appl Genet Mol Biol, 4(1):1175, 2005.
[30] N. Shoham and M. Elad. Alternating KSVD-denoising for texture separation. IEEE 25thConvention Electr Electron Eng Israel, 2008.

On structured sparsity 87
[31] P. Sprechmann, I. Ramirez, P. Cancela, and G. Sapiro. Collaborative sources identificationin mixed signals via hierarchical sparse modeling. http://arxiv.org/abs/1010.4893, 2010.
[32] P. Sprechmann, I. Ramirez, G. Sapiro, andY. C. Eldar. C-HiLasso:Acollaborative hierarchicalsparse modeling framework. http://arxiv.org/abs/1003.0400, 2010.
[33] R. Tibshirani. Regression shrinkage and selection via the lasso. J Roy Stat Soci: 267–288,1996.
[34] J. Tropp. Greed is good: Algorithmic results for sparse approximation. IEEE Trans InformTheory, 50(10):2231–2242, 2004.
[35] J. A. Tropp. Algorithms for simultaneous sparse approximation. Part ii: Convex relaxation.Signal Processing, special issue “Sparse approximations in signal and image processing,”86:589–602, 2006.
[36] B. Turlach, W. Venables, and S. Wright. Simultaneous variable selection. Technometrics,27:349–363, 2004.
[37] S. Wright, R. Nowak, and M. Figueiredo. Sparse reconstruction by separable approximation.IEEE Trans Sig Proc, 57(7):2479–2493, 2009.
[38] J. Yang, J. Wright, T. Huang, and Y. Ma. Image super-resolution via sparse representation.Accepted IEEE Trans Image Proc, 2010.
[39] G. Yu, S. Mallat, and E. Bacry. Audio denoising by time-frequency block thresholding. IEEETrans Sig Proc, 56(5):1830–1839, 2008.
[40] G. Yu and G. Sapiro. Statistical compressive sensing of Gaussian mixture models. Inhttp://arxiv.org/abs/1010.4314, 2010.
[41] G. Yu, G. Sapiro, and S. Mallat. Image modeling and enhancement via structured sparsemodel selection. ICIP, Hong Kong, 2010.
[42] G. Yu, G. Sapiro, and S. Mallat. Solving inverse problems with piecewise lin-ear estimators: From Gaussian mixture models to structured sparsity. Submitted,http://arxiv.org/abs/1006.3056, 2010.
[43] M. Yuan and Y. Lin. Model selection and estimation in regression with grouped variables. JRoy Stat Soc, Ser B, 68:49–67, 2006.
[44] M. Zhou, H. Chen, J. Paisley, et al. Nonparametric Bayesian dictionary learn-ing for analysis of noisy and incomplete images. IMA Preprint, Apr. 2010,http://www.ima.umn.edu/preprints/apr2010/2307.pdf.
[45] M. Zhou, H. Chen, J. Paisley, et al. Non-parametric Bayesian dictionary learning for sparseimage representations. Adv. NIPS, 2009.
[46] H. Zou and T. Hastie. Regularization and variable selection via the elastic net. J Roy Stat SocSer B, 67:301–320, 2005.

3 Xampling: compressed sensingof analog signalsMoshe Mishali and Yonina C. Eldar
This chapter generalizes compressed sensing (CS) to reduced-rate sampling of analogsignals. It introduces Xampling, a unified framework for low-rate sampling and pro-cessing of signals lying in a union of subspaces. Xampling consists of two main blocks:analog compression that narrows down the input bandwidth prior to sampling with com-mercial devices followed by a nonlinear algorithm that detects the input subspace prior toconventional signal processing. A variety of analog CS applications are reviewed withinthe unified Xampling framework including a general filter-bank scheme for sparse shift-invariant spaces, periodic nonuniform sampling and modulated wideband conversion formultiband communications with unknown carrier frequencies, acquisition techniquesfor finite rate of innovation signals with applications to medical and radar imaging,and random demodulation of sparse harmonic tones. A hardware-oriented viewpointis advocated throughout, addressing practical constraints and exemplifying hardwarerealizations where relevant.
3.1 Introduction
Analog-to-digital conversion (ADC) technology constantly advances along the route thatwas delineated in the last century by the celebrated Shannon–Nyquist [1, 2] theorem,essentially requiring the sampling rate to be at least twice the highest frequency in thesignal. This basic principle underlies almost all digital signal processing (DSP) applica-tions such as audio, video, radio receivers, wireless communications, radar applications,medical devices, optical systems and more. The ever growing demand for data, as well asadvances in radio frequency (RF) technology, have promoted the use of high-bandwidthsignals, for which the rates dictated by the Shannon–Nyquist theorem impose demandingchallenges on the acquisition hardware and on the subsequent storage and DSP proces-sors. A holy grail of compressed sensing is to build acquisition devices that exploit signalstructure in order to reduce the sampling rate, and subsequent demands on storage andDSP. In such an approach, the actual information contents should dictate the sampling
Compressed Sensing: Theory and Applications, ed. Yonina C. Eldar and Gitta Kutyniok. Published byCambridge University Press. © Cambridge University Press 2012.

Xampling: compressed sensing of analog signals 89
rate, rather than the ambient signal bandwidth. Indeed, CS was motivated in part by thedesire to sample wideband signals at rates far below the Shannon–Nyquist rate, whilestill maintaining the vital information encoded in the underlying signal [3, 4].
At its core, CS is a mathematical framework that studies rate reduction in a discretesetup. A vector x of length n represents a signal of interest. A measurement vectory = Ax is computed using an m×n matrix A. In a typical CS setup m n, so thatthere are fewer measurements in y than the ambient dimension of x. Since A is non-invertible in this setting, recovery must incorporate some prior knowledge on x. Thestructure that is widely assumed in CS is sparsity, namely that x has only a few nonzeroentries. Convex programming, e.g., 1 minimization, and various greedy methods havebeen shown to be successful in reconstructing sparse signals x from short measurementvectors y.
The discrete machinery nicely captures the notion of reduced-rate sampling by thechoice mn and affirms robust recovery from incomplete measurements. Nevertheless,since the starting point is of a finite-dimensional vector x, one important aspect is notclearly addressed – how to actually acquire an analog input x(t) at a low-rate. In manyapplications, our interest is to process and represent signals which arrive from the physicaldomain and are therefore naturally represented as continuous-time functions rather thandiscrete vectors. A conceptual route to implementing CS in these real-world problemsis to first obtain a discrete high-rate representation using standard hardware, and thenapply CS to reduce dimensionality. This, however, contradicts the motivation at theheart of CS: reducing acquisition rate as much as possible. Achieving the holy grail ofcompressive ADCs requires a broader framework which can treat more general signalmodels including analog signals with various types of structure, as well as practicalmeasurement schemes that can be implemented in hardware. To further gain advantagefrom the sampling rate decrease, processing speed in the digital domain should also bereduced. Our goal therefore is to develop an end-to-end system, consisting of sampling,processing, and reconstruction, where all operations are performed at a low-rate, belowthe Nyquist-rate of the input.
The key to developing low-rate analog sensing methods is relying on structure in theinput. Signal processing algorithms have a long history of leveraging structure for varioustasks. As an example, MUSIC [5] and ESPRIT [6] are popular techniques for spectrumestimation that exploit signal structure. Model-order selection methods in estimation[7], parametric estimation and parametric feature detection [8] are further exampleswhere structure is heavily exploited. In our context, we are interested in utilizing signalmodels in order to reduce sampling rate. Classic approaches to sub-Nyquist samplinginclude carrier demodulation [9], undersampling [10], and nonuniform methods [11–13],which all assume a linear model corresponding to a bandlimited input with predefinedfrequency support and fixed carrier frequencies. In the spirit of CS, where unknownnonzero locations result in a nonlinear model, we would like to extend the classicaltreatment to analog inputs with unknown frequency support, as well as more broadly toscenarios that involve nonlinear input structures. The approach we take in this chapterfollows the recently proposed Xampling framework [14], which treats a nonlinear modelof union of subspaces (UoS). In this structure, originally introduced by Lu and Do [15],
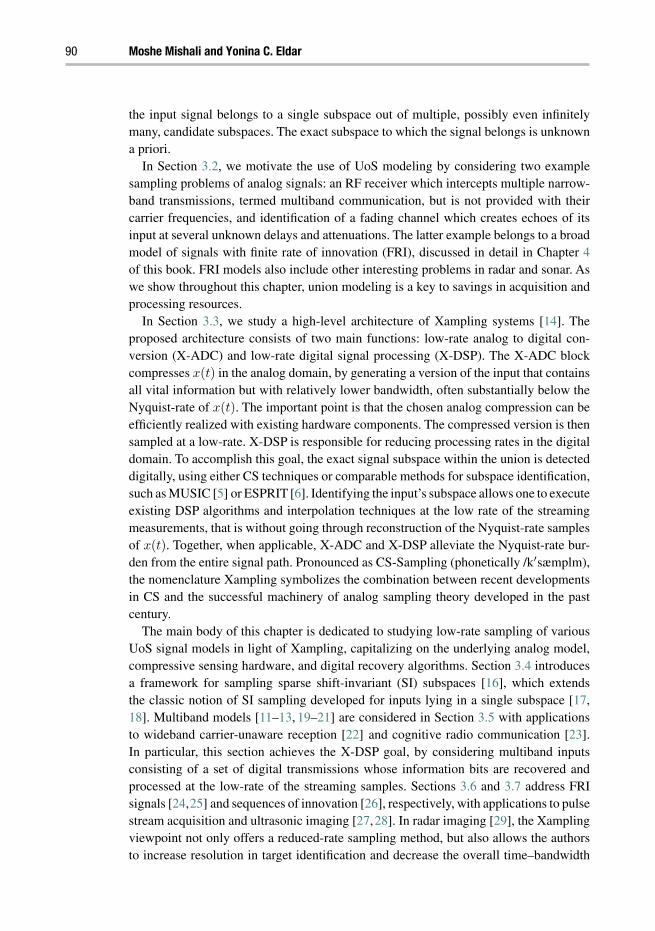
90 Moshe Mishali and Yonina C. Eldar
the input signal belongs to a single subspace out of multiple, possibly even infinitelymany, candidate subspaces. The exact subspace to which the signal belongs is unknowna priori.
In Section 3.2, we motivate the use of UoS modeling by considering two examplesampling problems of analog signals: an RF receiver which intercepts multiple narrow-band transmissions, termed multiband communication, but is not provided with theircarrier frequencies, and identification of a fading channel which creates echoes of itsinput at several unknown delays and attenuations. The latter example belongs to a broadmodel of signals with finite rate of innovation (FRI), discussed in detail in Chapter 4of this book. FRI models also include other interesting problems in radar and sonar. Aswe show throughout this chapter, union modeling is a key to savings in acquisition andprocessing resources.
In Section 3.3, we study a high-level architecture of Xampling systems [14]. Theproposed architecture consists of two main functions: low-rate analog to digital con-version (X-ADC) and low-rate digital signal processing (X-DSP). The X-ADC blockcompresses x(t) in the analog domain, by generating a version of the input that containsall vital information but with relatively lower bandwidth, often substantially below theNyquist-rate of x(t). The important point is that the chosen analog compression can beefficiently realized with existing hardware components. The compressed version is thensampled at a low-rate. X-DSP is responsible for reducing processing rates in the digitaldomain. To accomplish this goal, the exact signal subspace within the union is detecteddigitally, using either CS techniques or comparable methods for subspace identification,such as MUSIC [5] or ESPRIT [6]. Identifying the input’s subspace allows one to executeexisting DSP algorithms and interpolation techniques at the low rate of the streamingmeasurements, that is without going through reconstruction of the Nyquist-rate samplesof x(t). Together, when applicable, X-ADC and X-DSP alleviate the Nyquist-rate bur-den from the entire signal path. Pronounced as CS-Sampling (phonetically /k′sæmplm),the nomenclature Xampling symbolizes the combination between recent developmentsin CS and the successful machinery of analog sampling theory developed in the pastcentury.
The main body of this chapter is dedicated to studying low-rate sampling of variousUoS signal models in light of Xampling, capitalizing on the underlying analog model,compressive sensing hardware, and digital recovery algorithms. Section 3.4 introducesa framework for sampling sparse shift-invariant (SI) subspaces [16], which extendsthe classic notion of SI sampling developed for inputs lying in a single subspace [17,18]. Multiband models [11–13, 19–21] are considered in Section 3.5 with applicationsto wideband carrier-unaware reception [22] and cognitive radio communication [23].In particular, this section achieves the X-DSP goal, by considering multiband inputsconsisting of a set of digital transmissions whose information bits are recovered andprocessed at the low-rate of the streaming samples. Sections 3.6 and 3.7 address FRIsignals [24,25] and sequences of innovation [26], respectively, with applications to pulsestream acquisition and ultrasonic imaging [27,28]. In radar imaging [29], the Xamplingviewpoint not only offers a reduced-rate sampling method, but also allows the authorsto increase resolution in target identification and decrease the overall time–bandwidth

Xampling: compressed sensing of analog signals 91
product of the radar system (when the noise is not too large). Section 3.8 describessampling strategies that are based on application of CS on discretized analog models, e.g.,sampling a sparse sum of harmonic tones [30] and works on quantized CS radar [31–33].
Besides reviewing sampling strategies, we provide some insights into analog sensing.In Section 3.5, we use the context of multiband sampling to exemplify a full developmentcycle of analog CS systems, from theory to hardware. The cycle begins with a nonuniformmethod [19] that is derived from the sparse-SI framework. Analyzing this approach ina more practical perspective, reveals that nonuniform acquisition requires ADC deviceswith Nyquist-rate front end since they are connected directly to the wideband input.We next review the hardware-oriented design of the modulated wideband converter(MWC) [20,22], which incorporates RF preprocessing to compress the wideband input,so that actual sampling is carried out by commercial low-rate and low-bandwidth ADCdevices. To complete the cycle, we take a glimpse at circuit challenges and solutionsas reported in the design of an MWC hardware prototype [22]. The MWC appears tobe the first reported wideband technology borrowing CS ideas with provable hardwarethat samples and processes wideband signals at a rate that is directly proportional tothe actual bandwidth occupation and not the highest frequency (280 MHz sampling of2 GHz Nyquist-rate inputs in [22]).
Xampling advocates use of traditional tools from sampling theory for modeling analogsignals, according to which a continuous-time signal x(t) is determined by a countablesequence c[n] of numbers, e.g., a bandlimited input x(t) and its equally spaced point-wise values c[n] = x(nT ). The UoS approach is instrumental in capturing similar infinitestructures by taking to infinity either the dimensions of the individual subspaces, the num-ber of subspaces in the union or both. In Section 3.8 we review alternative analog CSmethods which treat continuous signals that are determined by a finite set of parameters.This approach was taken, for example, in the development of the random demodulator(RD) [30] and works on quantized CS radar [31–33]. Whilst effective in the finite sce-narios for which they were developed, the application of these methods to general analogmodels (which possess a countable representation) can lead to performance degradation.We exemplify differences when comparing hardware and software complexities of theRD and MWC systems. Visualizing radar performance of quantized [33] vs. analog [29]approaches further demonstrates the possible differences. Based on the insights gainedthroughout this chapter, several operative conclusions are suggested in Section 3.9 forextending CS to general analog signals.
3.2 From subspaces to unions
The traditional paradigm in sampling theory assumes that x(t) lies in a single subspace.Bandlimited sampling is undoubtedly the most studied example. Subspace modeling isquite powerful, as it allows perfect recovery of the signal from its linear and nonlinearsamples under very broad conditions [17, 18, 34–36]. Furthermore, recovery can beachieved by digital and analog filtering. This is a very appealing feature of the subspacemodel, which generalizes the Shannon–Nyquist theorem to a broader set of input classes.
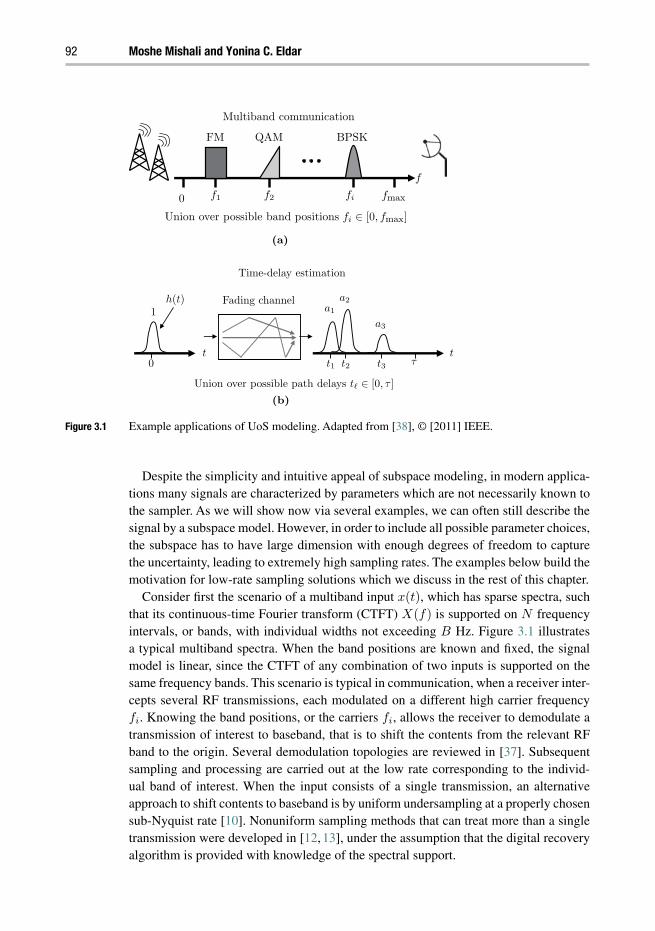
92 Moshe Mishali and Yonina C. Eldar
(a)
tt1
a1
t2
a2
t3
a3
t0
1
h(t)
τ
Fading channel
Time-delay estimation
Union over possible path delays t ∈ [0, τ ]
(b)
Multiband communication
Union over possible band positions fi ∈ [0, fmax]
f
0 f1 f2 fmax
FM QAM BPSK
fi
Figure 3.1 Example applications of UoS modeling. Adapted from [38], © [2011] IEEE.
Despite the simplicity and intuitive appeal of subspace modeling, in modern applica-tions many signals are characterized by parameters which are not necessarily known tothe sampler. As we will show now via several examples, we can often still describe thesignal by a subspace model. However, in order to include all possible parameter choices,the subspace has to have large dimension with enough degrees of freedom to capturethe uncertainty, leading to extremely high sampling rates. The examples below build themotivation for low-rate sampling solutions which we discuss in the rest of this chapter.
Consider first the scenario of a multiband input x(t), which has sparse spectra, suchthat its continuous-time Fourier transform (CTFT) X(f) is supported on N frequencyintervals, or bands, with individual widths not exceeding B Hz. Figure 3.1 illustratesa typical multiband spectra. When the band positions are known and fixed, the signalmodel is linear, since the CTFT of any combination of two inputs is supported on thesame frequency bands. This scenario is typical in communication, when a receiver inter-cepts several RF transmissions, each modulated on a different high carrier frequencyfi. Knowing the band positions, or the carriers fi, allows the receiver to demodulate atransmission of interest to baseband, that is to shift the contents from the relevant RFband to the origin. Several demodulation topologies are reviewed in [37]. Subsequentsampling and processing are carried out at the low rate corresponding to the individ-ual band of interest. When the input consists of a single transmission, an alternativeapproach to shift contents to baseband is by uniform undersampling at a properly chosensub-Nyquist rate [10]. Nonuniform sampling methods that can treat more than a singletransmission were developed in [12, 13], under the assumption that the digital recoveryalgorithm is provided with knowledge of the spectral support.

Xampling: compressed sensing of analog signals 93
When the carrier frequencies fi are unknown, we are interested in the set of all pos-sible multiband signals that occupy up to NB Hz of the spectrum. In this scenario, thetransmissions can lie anywhere below fmax. At first sight, it may seem that sampling atthe Nyquist rate
fNYQ = 2fmax, (3.1)
is necessary, since every frequency interval below fmax appears in the support of somemultiband x(t). On the other hand, since each specific x(t) in this model fills only aportion of the Nyquist range (only NB Hz), we intuitively expect to be able to reduce thesampling rate below fNYQ. Standard demodulation cannot be used since fi are unknown,which makes this sampling problem challenging.
Another interesting application is estimation of time delays from observation of asignal of the following form
x(t) =
L∑=1
a h(t− t), t ∈ [0, τ ]. (3.2)
For fixed time delays t, (3.2) defines a linear space of inputs with L degrees of freedom,one per each amplitude a. In this case, L samples of x(t) can be used to reconstruct theinput x(t). In practice, however, there are many interesting situations with unknown t.Inputs of this type belong to the broader family of FRI signals [24, 25], and are treatedin detail in Chapter 4 of this book. For example, when a communication channel intro-duces multipath fading, the transmitter can assist the receiver in channel identificationby sending a short probing pulse h(t). Since the receiver knows the shape of h(t), itcan resolve the delays t and use this information to decode the following informationmessages. Another example is radar, where the delays t correspond to target locations,while the amplitudes a encode Doppler shifts indicating target speeds. Medical imagingtechniques, e.g., ultrasound, use signals of the form (3.2) to probe density changes inhuman tissues as a vital tool in medical diagnosis. Underwater acoustics also conformwith (3.2). Since in all these applications, the pulse h(t) is short in time, sampling x(t)
according to its Nyquist bandwidth, which is effectively that of h(t), results in unnec-essarily large sampling rates. In contrast, it follows intuitively from (3.2), that only2L unknowns determine x(t), namely t,a, 1 ≤ ≤ L. Since with unknown delays,(3.2) describes a nonlinear model, subspace modeling cannot achieve the optimal sam-pling rate of 2L/τ , which in all the above applications can be substantially lower thanNyquist.
The example applications above motivate the need for signal modeling that is moresophisticated than the conventional single subspace approach. In order to capture real-world scenarios within a convenient mathematical formulation without unnecessarilyincreasing the rate, we introduce in the next section the Xampling framework whichtreats UoS signal classes and is applicable to many interesting applications. Using theXampling framework, we will analyze sampling strategies for several union modelsin detail, and show that although sampling can still be obtained by linear filtering,recovery becomes more involved and requires nonlinear algorithms, following the spiritof CS.

94 Moshe Mishali and Yonina C. Eldar
3.3 Xampling
In this section, we introduce Xampling – our proposed framework for acquisition anddigital processing of UoS signal models [14].
3.3.1 Union of subspaces
As motivated earlier, the key to reduced-rate sampling of analog signals is based on UoSmodeling of the input set. The concept of allowing more than a single input subspacewas first suggested by Lu and Do in [15]. We denote by x(t) an analog signal in theHilbert space H = L2(R), which lies in a parameterized family of subspaces
x(t) ∈ U =⋃λ∈Λ
Aλ, (3.3)
where Λ is an index set, and each individual Aλ is a subspace of H. The key propertyof the UoS model (3.3) is that the input x(t) resides within Aλ∗ for some λ∗ ∈ Λ, buta priori, the exact subspace index λ∗ is unknown. For example, multiband signals withunknown carriers fi can be described by (3.3), where each Aλ corresponds to signalswith specific carrier positions and the union is taken over all possible fi ∈ [0,fmax].Pulses with unknown time delays of the form (3.2) also obey UoS modeling, where eachAλ is an L-dimensional subspace that captures the coefficients a, whereas the unionover all possible delays t ∈ [0, τ ] provides an efficient way to group these subspaces toa single set U .
Union of subspaces modeling enables treating x(t) directly in its analog formulation.This approach is fundamentally different than previous attempts to treat similar prob-lems, which rely on discretization of the analog input to finite representations. Namely,models in which both cardinalities, Λ and each Aλ, are finite. Standard CS which treatsvectors in Rn having at most k nonzeros is a special case of a finite representation.Each individual subspace has dimensions k, defined by the locations of the nonzeros,and the union is over
(nk
)possibilities of choosing the nonzero locations. In Section 3.8,
we discuss in detail the difference between union modeling and discretization. As weshow, the major consequences of imposing a finite representation on an analog signalthat does not inherently conform to a finite model are twofold: model sensitivity andhigh computational loads. Therefore, the main core of this chapter focuses on the the-ory and applications developed for general UoS modeling (3.3). We note that there areexamples of continuous-time signals that naturally possess finite representations. Onesuch example are trigonometric polynomials. However, our interest here is in signals ofthe form described in Section 3.2, that do not readily admit a finite representation.
The union (3.3) over all possible signal locations forms a nonlinear signal set U ,where its nonlinearity refers to the fact that the sum (or any linear combination) ofx1(t),x2(t) ∈ U does not lie in U , in general. Consequently, U is a true subset of the

Xampling: compressed sensing of analog signals 95
linear affine space
Σ =
x(t) =
∑λ∈Λ
αλxλ(t) : αλ ∈ R, xλ(t) ∈Aλ
, (3.4)
which we refer to as the Nyquist subspace of U . Since every x(t) ∈ U also belongs toΣ, one can in principle apply conventional sampling strategies with respect to the singlesubspace Σ [18]. However, this technically correct approach often leads to practicallyinfeasible sampling systems with a tremendous waste of expensive hardware and soft-ware resources. For example, in multiband sampling, Σ is the fmax-bandlimited space,for which no rate reduction is possible. Similarly, in time-delay estimation problems, Σ
has the high bandwidth of h(t), and again no rate reduction can be achieved.We define the sampling problem for the union set (3.3) as the design of a system that
provides:
1. ADC: an acquisition operator which converts the analog input x(t)∈U to a sequencey[n] of measurements,
2. DSP: a toolbox of processing algorithms, which uses y[n] to perform classic tasks,e.g., estimation, detection, data retrieval etc., and
3. DAC: a method for reconstructing x(t) from the samples y[n].
In order to exclude from consideration inefficient solutions, such as those treating theNyquist subspace Σ and not exploiting the union structure, we adopt as a general designconstraint that the above goals should be accomplished with minimum use of resources.Minimizing the sampling rate, for example, excludes inefficient Nyquist-rate solutionsand promotes potential approaches to wisely incorporate the union structure to stand thisresource constraint. For reference, this requirement is outlined as
ADC + DSP + DAC → minimum use of resources. (3.5)
In practice, besides constraining the sampling rate, (3.5) translates to the minimizationof several other resources of interest, including the number of devices in the acquisitionstage, design complexity, processing speed, memory requirements, power dissipation,system cost, and more.
In essence, the UoS model follows the spirit of classic sampling theory by assumingthat x(t) belongs to a single underlying subspace Aλ∗ . However, in contrast to thetraditional paradigm, the union setting permits uncertainty in the exact signal subspace,opening the door to interesting sampling problems. The challenge posed in (3.5) isto treat the uncertainty of the union model at an overall complexity (of hardware andsoftware) that is comparable with a system which knows the exactAλ∗ . In Section 3.5, wedescribe strategies which acquire and process signals from the multiband union at a lowrate, proportional to NB. Sections 3.6 and 3.7 describe variants of FRI unions, including(3.2), and their low-rate sampling solutions, which approach the rate of innovation 2L/τ .A line of other UoS applications that are described throughout this chapter exhibit similarrationale – the sampling rate is reduced by exploiting the fact that the input belongs to

96 Moshe Mishali and Yonina C. Eldar
x(t) Union
compression
P : U → S
x(t)Detection
x(t) ∈ Aλ∗Subspace
DSP
ADC deviceSubspace
reconstruction
X-ADC X-DSP
y[n]
Commercial Nonlinear
Reduce analog bandwidth
prior to sampling
Reduce digital complexity
Gain backward compatibility
Low-rate, Standard Low-rate, Standard
Compressed sensing algorithms /
MUSIC / ESPRIT
Analog
Figure 3.2 Xampling – A pragmatic framework for signal acquisition and processing in union of subspaces.Adapted from [14], © [2011] IEEE.
a single subspace Aλ∗ , even though the exact subspace index λ∗ is unknown. The nextsubsection proposes a systematic architecture for the design of sampling systems for UoSsignal classes. As we show in the ensuing sections, this architecture unifies a variety ofsampling strategies developed for different instances of UoS models.
3.3.2 Architecture
The Xampling system we propose has the high-level architecture presented in Figure 3.2[14]. The first two blocks, termed X-ADC, perform the conversion of x(t) to digital.An operator P compresses the high-bandwidth input x(t) into a signal with lower band-width, effectively capturing the entire union U by a subspace S with substantially lowersampling requirements. A commercial ADC device then takes pointwise samples of thecompressed signal, resulting in the sequence of samples y[n]. The role of P in Xamplingis to narrow down the analog bandwidth, so that low-rate ADC devices can subsequentlybe used. As in digital compression, the goal is to capture all vital information of the inputin the compressed version, though here this functionality is achieved by hardware ratherthan software. The design of P therefore needs to wisely exploit the union structure, inorder not to lose any essential information while reducing the bandwidth.
In the digital domain, Xampling consists of three computational blocks. A nonlinearstep detects the signal subspace Aλ∗ from the low-rate samples. Compressed sensingalgorithms, e.g., those described in the relevant chapters of this book, as well as com-parable methods for subspace identification, e.g., MUSIC [5] or ESPRIT [6], can beused for that purpose. Once the index λ∗ is determined, we gain backward compatibil-ity, meaning standard DSP methods apply and commercial DAC devices can be usedfor signal reconstruction. The combination of nonlinear detection and standard DSP isreferred to as X-DSP. As we demonstrate, besides backward compatibility, the nonlin-ear detection decreases computational loads, since the subsequent DSP and DAC stagesneed to treat only the single subspace Aλ∗ , complying with (3.5). The important point is

Xampling: compressed sensing of analog signals 97
that the detection stage can be performed efficiently at the low acquisition rate, withoutrequiring Nyquist-rate processing.
Xampling is a generic template architecture. It does not specify the exact acquisitionoperator P or nonlinear detection method to be used. These are application-dependentfunctions. Our goal in introducing Xampling is to propose a high-level systemarchitecture and a basic set of guidelines:
1. an analog pre-processing unit to compress the input bandwidth,2. commercial low-rate ADC devices for actual acquisition at a low-rate,3. subspace detection in software, and4. standard DSP and DAC methods.
The Xampling framework is developed in [14] based on two basic assumptions:
(A1) DSP is the main purpose of signal acquisition, and(A2) the ADC device has limited bandwidth.
The DSP assumption (A1) highlights the ultimate use of many sampling systems – sub-stituting analog processing by modern software algorithms. Digital signal processingis perhaps the most profound reason for signal acquisition: hardware development canrarely compete with the convenience and flexibilities that software environments pro-vide. In many applications, therefore, DSP is what essentially motivates the ADC anddecreasing processing speeds can sometimes be an important requirement, regardless ofwhether the sampling rate is reduced as well. In particular, the digital flow proposed inFigure 3.2 is beneficial even when a high ADC rate is acceptable. In this case, x(t) canbe acquired directly without narrowing down its bandwidth prior to ADC, but we wouldstill like to reduce computational loads and storage requirements in the digital domain.This can be accomplished by imitating rate reduction in software, detecting the signalsubspace, and processing at the actual information bandwidth. The compounded usageof both X-ADC and X-DSP is for mainstream applications, where reducing the rate ofboth signal acquisition and processing is of interest.
Assumption (A2) basically says that we expect the conversion device to have limitedfront-end bandwidth. The X-ADC can be realized on a circuit board, chip design, opticalsystem, or other appropriate hardware. In all these platforms, the front-end has certainbandwidth limitations which obey (A2), thereby motivating the use of a preceding analogcompression step P in order to capture all vital information within a narrow range offrequencies that the acquisition device can handle. Section 3.5 elaborates on this property.
Considering the architecture of Figure 3.2 in conjunction with requirement (3.5)reveals an interesting aspect of Xampling. In standard CS, most of the system com-plexity concentrates in digital reconstruction, since sensing is as simple as applyingy = Ax. In Xampling, we attempt to balance between analog and digital complexities.As discussed in Section 3.8, a properly chosen analog preprocessing operator P can leadto substantial savings in digital complexities and vice versa.
We next describe sampling solutions for UoS models according to the Xamplingparadigm. In general, when treating unions of analog signals, there are three main casesto consider:

98 Moshe Mishali and Yonina C. Eldar
• finite unions of infinite-dimensional spaces;• infinite unions of finite-dimensional spaces;• infinite unions of infinite-dimensional spaces.
In each one of the three settings above there is an element that can take on infinite values,which is a result of the fact that we are considering general analog signals: either theunderlying subspaces Aλ are infinite dimensional, or the number of subspaces |Λ| isinfinite. In the next sections, we present general theory and results behind each of thesecases, and focus in additional detail on a representative example application for eachclass. Sections 3.4 and 3.5 cover the first scenario, introducing the sparse-SI frameworkand reviewing multiband sampling strategies, respectively. Sections 3.6 and 3.7 discussvariants of innovation rate sampling and cover the other two cases. Methods that arebased on completely finite unions, when both |Λ| and Aλ are finite, are discussed inSection 3.8. While surveying these different cases, we will attempt to shed light intopragmatic considerations that underlie Xampling, and hint on possible routes to promotethese compressive methods to actual hardware realizations.
3.4 Sparse shift-invariant framework
3.4.1 Sampling in shift-invariant subspaces
We first briefly introduce the notion of sampling in SI subspaces, which plays a key rolein the development of standard (subspace) sampling theory [17, 18]. We then discusshow to incorporate the union structure into SI settings.
Shift invariant signals are characterized by a set of generators h(t),1 ≤ ≤ Nwhere in principle N can be finite or infinite (as is the case in Gabor or wavelet expansionsof L2). Here we focus on the case in which N is finite. Any signal in such an SI spacecan be written as
x(t) =
N∑=1
∑n∈Z
d[n]h(t−nT ), (3.6)
for some set of sequences d[n] ∈ 2,1 ≤ ≤ N and period T . This model encom-passes many signals used in communication and signal processing including bandlimitedfunctions, splines [39], multiband signals (with known carrier positions) [11, 12], andpulse amplitude modulation signals.
The subspace of signals described by (3.6) has infinite dimensions, since every signalis associated with infinitely many coefficients d[n],1 ≤ ≤ N. Any such signal canbe recovered from samples at a rate of N/T ; one possible sampling paradigm at theminimal rate is given in Figure 3.3 [16, 34].
Here x(t) is filtered with a bank of N filters, each with impulse response s(t) whichcan be almost arbitrary. The outputs are uniformly sampled with period T , resulting inthe sample sequences c[n]. Denote by c(ω) a vector collecting the frequency responsesof c[n], 1≤ ≤N , and similarly d(ω) for the frequency responses of d[n], 1≤ ≤N .

Xampling: compressed sensing of analog signals 99
t = nT
x(t)
s∗1(−t)
s∗N (−t)
c1[n]
cN [n]
d1[n]
dN [n]
n∈Zδ(t − nT )
h1(t)
hN (t)
x(t)
t = nT
G−1(ejωT )
n∈Zδ(t − nT )
Analog
sampling
kernels
Digital
processing
Analog
interpolation
kernels
Figure 3.3 Sampling and reconstruction in shift-invariant spaces [16, 34]. Adapted from [16], © [2009]IEEE.
Then, it can be shown that [16]
c(ω) = G(ejωT )d(ω), (3.7)
where G(ejωT ) is an N ×N matrix, with entries
[G(ejωT )
]i
=1
T
∑k∈Z
S∗i
(ω
T− 2π
Tk
)H
(ω
T− 2π
Tk
). (3.8)
The notations Si(ω),H(ω) stand for the CTFT of si(t),h(t), respectively. To allowrecovery, the condition on the sampling filters si(t) is that (3.8) results in an invertiblefrequency response G(ejωT ). The signal is then recovered by processing the sampleswith a filter bank with frequency response G−1(ejωT ). In this way, we invert (3.7) andobtain the vectors
d(ω) = G−1(ejωT )c(ω). (3.9)
Each output sequence d[n] is then modulated by a periodic impulse train∑
n∈Zδ(t−
nT ) with period T , followed by filtering with the corresponding analog filter h(t). Inpractice, interpolation with finitely many samples gives sufficiently accurate reconstruc-tion, provided that h(t) decay fast enough [40], similar to finite interpolation in theShannon–Nyquist theorem.
3.4.2 Sparse union of SI subspaces
In order to incorporate further structure into the generic SI model (3.6), we treat signalsof the form (3.6) involving a small number K of generators, chosen from a finite set Λ
of N generators. Specifically, we consider the input model
x(t) =∑
||=K
∑n∈Z
d[n]h(t−nT ), (3.10)

100 Moshe Mishali and Yonina C. Eldar
where || = K means a sum over at most K elements. If the K active generators areknown, then according to Figure 3.3 it suffices to sample at a rate of K/T correspondingto uniform samples with period T at the output of K appropriate filters. A more difficultquestion is whether the rate can be reduced if we know that only K of the generators areactive, but do not know in advance which ones. In terms of (3.10) this means that only K
of the sequences d[n] have nonzero energy. Consequently, for each value n, ‖d[n]‖0 ≤K, where d[n] = [d1[n], . . .,dN [n]]T collects the unknown generator coefficients fortime instance n.
For this model, it is possible to reduce the sampling rate to as low as 2K/T [16] asfollows. We target a compressive sampling system that produces a vector of low-ratesamples y[n] = [y1[n], . . .,yp[n]]T at t = nT which satisfies a relation
y[n] = Ad[n], ‖d[n]‖0 ≤ K, (3.11)
with a sensing matrix A that allows recovery of sparse vectors. The choice p<N reducesthe sampling rate below Nyquist. In principle, a parameterized family of underdeterminedsystems, by the time index n in the case of (3.11), can be treated by applying CSrecovery algorithms independently for each n. A more robust and efficient techniquewhich exploits the joint sparsity over n is described in the next section. The question istherefore how to design a sampling scheme which would boil down to a relation such as(3.11) in the digital domain. Figure 3.4 provides a system for obtaining y[n], where thefollowing theorem gives the expression for its sampling filters w(t) [16].
theorem 3.1 Let s(t) be a set of N filters and G(ejωT ) the response matrix definedin (3.9) (so that s(t) can be used in the Nyquist-rate scheme of Figure 3.3), and let Abe a given p×N sensing matrix. Sampling x(t) with a bank of filters w(t),1 ≤ ≤ p
defined by
w(ω) = A∗G−∗(ejωT )s(ω), (3.12)
t = nT
x(t)
w∗1(−t)
w∗p(−t)
y1[n]
yp[n]
d1[n]
dN [n]
n∈Zδ(t − nT )
h1(t)
hN (t)
x(t)
t = nT
n∈Zδ(t − znT )Low-rate sampling 2K/T
CTFsubspace detection
Realtime
reconstruction
I
Figure 3.4 Compressive sensing acquisition for sparse union of shift-invariant subspaces. Adaptedfrom [16], © [2009] IEEE.

Xampling: compressed sensing of analog signals 101
gives a set of compressed measurements y[n],1 ≤ ≤ p that satisfies (3.11). In(3.12), the vectors w(ω),s(ω) have th elements W(ω),S(ω), denoting CTFTs of thecorresponding filters, and (·)−∗ denotes the conjugate of the inverse.
The filters w(t) of Figure 3.4 form an analog compression operator P as suggested inthe X-ADC architecture. The sampling rate is effectively reduced by taking linear com-binations of the outputs c[n] of the Nyquist scheme of Figure 3.3, with combinationcoefficients defined by the sensing matrix A. This structure is revealed by examining(3.12) – sampling by w[n] is tantamount to filtering x(t) by s(t), applying G−1(ejωT )
to obtain the sparse set of sequences d[n], and then combining these sequences byan underdetermined matrix A. A more general result of [16] enables further flexibil-ity in choosing the sampling filters by letting w(ω) = P∗(ejωT )A∗G∗(ejωT )s(ω),for some arbitrary invertible p × p matrix P∗(ejωT ). In this case, (3.11) holds withrespect to sequences obtained by post-processing the compressive measurements y[n]
by P−1(ejωT ).The sparse-SI model (3.10) can be generalized to a sparse sum of arbitrary subspaces,
where each subspaceAλ of the union (3.3) consists of a direct sum of K low-dimensionalsubspaces [41]
Aλ =⊕
|j|=K
Vj . (3.13)
Here Vj ,1 ≤ j ≤ N are a given set of subspaces with dimensions dim(Vj) = vj , andas before |j| = K denotes a sum over K indices. Thus, each subspace Aλ correspondsto a different choice of K subspaces Vj that comprise the sum. The sparse-SI model isa special case of (3.13), in which each Vj is an SI subspace with a single shift kernelhj(t). In [41], sampling and reconstruction algorithms are developed for the case offinite Λ and finite-dimensional Aλ. The approach utilizes the notion of set transformsto cast the sampling problem into an underdetermined system with an unknown block-sparse solution, which is found via a polynomial-time mixed-norm optimization program.Block-sparsity is studied in more detail in [41–44].
3.4.3 Infinite measurement model and continuous to finite
In the sparse-SI framework, the acquisition scheme is mapped into the system (3.11).Reconstruction of x(t) therefore depends on our ability to resolve d[n] from thisunderdetermined system. More generally, we are interested in solving a parameterizedunderdetermined linear system with sensing matrix dimensions p×N,p < N
y(θ) = Ax(θ), θ ∈ Θ, (3.14)
where Θ is a set whose cardinality can be infinite. In particular, Θ may be uncountable,such as the frequencies ω ∈ [−π,π) of (3.12), or countable as in (3.11). The system(3.14) is referred to as an infinite measurement vector (IMV) model with sparsity K,if the vectors x(Θ) = x(θ) share a joint sparsity pattern [45]. That is, the nonzeroelements are supported within a fixed location set I of size K.

102 Moshe Mishali and Yonina C. Eldar
The IMV model includes as a special case standard CS, when taking Θ = θ∗ to be asingle element set. It also includes the case of a finite set Θ, termed multiple measurementvectors (MMV) in the CS literature [45–50]. In the finite cases it is easy to see that ifσ(A) ≥ 2k, where σ(A) = spark(A)− 1 is the Kruskal-rank of A, then x(Θ) is theunique K-sparse solution of (3.14) [48]. A simple necessary and sufficient condition interms of rank(y(Θ)) is derived in [51], which improves upon earlier (sufficient only)conditions in [48]. Similar conditions hold for a jointly K-sparse IMV system [45].
The major difficulty with the IMV model is how to recover the solution set x(Θ) fromthe infinitely many equations (3.14). One strategy is to solve (3.14) independently foreach θ. However, this strategy may be computationally intensive in practice, since itwould require to execute a CS solver for each individual θ; for example, in the contextof (3.11), this amounts to solving a sparse recovery problem for each time instance n. Amore efficient strategy exploits the fact that x(Θ) are jointly sparse, so that the index set
I = l : xl(θ) = 0 (3.15)
is independent of θ. Therefore, I can be estimated from several instances of y(Θ), whichincreases the robustness of the estimate. Once I is found, recovery of the entire set x(Θ)
is straightforward. To see this, note that using I , (3.14) can be written as
y(θ) = AIxI(θ), θ ∈ Θ, (3.16)
where AI denotes the matrix containing the columns of A whose indices belong to I , andxI(θ) is the vector consisting of entries of x(θ) in locations I . Since x(Θ) is K-sparse,|I| ≤ K. Therefore, the columns of AI are linearly independent (because σ(A) ≥ 2K),
implying that A†IAI = I, where A†
I =(AH
I AI
)−1AH
I is the pseudo-inverse of AI and
(·)H denotes the Hermitian conjugate. Multiplying (3.16) by A†I on the left gives
xI(θ) = A†Iy(θ), θ ∈ Θ. (3.17)
The components in x(θ) not supported on S are all zero. In contrast to applying a CSsolver for each θ, (3.17) requires only one matrix-vector multiplication pery(θ), typicallyrequiring far fewer computations.
It remains to determine I efficiently. In [45] it was shown that I can be found exactlyby solving a finite MMV. The steps used to formulate this MMV are grouped under ablock referred to as continuous-to-finite (CTF). The essential idea is that every finitecollection of vectors spanning the subspace span(y(Θ)) contains sufficient informationto recover I , as incorporated in the following theorem [45]:
theorem 3.2 Suppose that σ(A) ≥ 2K, and let V be a matrix with column spanequal to span(y(Θ)). Then, the linear system
V = AU (3.18)
has a unique K-sparse solution U whose support equals I .

Xampling: compressed sensing of analog signals 103
Q =θ∈Θ
y(θ)yH(θ)dθ Q = VVH
Construct a frame for span(y(Θ)) Robust estimate of I = supp(x(Θ))
Continuous-to-finite (CTF) block
y(Θ) ISolve MMV
V = AUfor sparsest U0
I = supp(U0)
Figure 3.5 The fundamental stages for the recovery of the nonzero location set I in an IMV model usingonly one finite-dimensional program. Adapted from [45], © [2008] IEEE.
The advantage of Theorem 3.2 is that it allows us to avoid the infinite structure of(3.14) and instead find the finite set I by solving a single MMV system of the form(3.18).
For example, in the sparse SI model, such a frame can be constructed by
Q =∑
n
y[n]yH [n], (3.19)
where typically 2K snapshots y[n] are sufficient [20]. Optionally, Q is decomposedto another frame V, such that Q = VVH , allowing removal of the noise space [20].Applying the CTF in this setting provides a robust estimate of I = supp(d[n]), namelythe indices of the active generators that comprise x(t). This is essentially the subspacedetection part of X-DSP, where the joint support set I determines the signal subspaceAλ∗ . The crux of the CTF now becomes apparent – the indices of the nonidentically zerorows of the matrix U0 that solves the finite underdetermined system (3.19) coincide withthe index set I = supp(d[n]) that is associated with the continuous signal x(t) [45].Once I is found, (3.11) can be inverted on the column subset I by (3.17), where the timeindex n takes the role of θ. Reconstruction from that point on is carried out in real time;one matrix-vector multiplication (3.17) per incoming vector of samples y[n] recoversdI [n], denoting the entries of d[n] indicated by I .
Figure 3.5 summarizes the CTF steps for identifying the nonzero location set of anIMV system. In the figure, the summation (3.19) is formulated as integration over θ ∈Θ
for the general IMV setting (3.14). The additional requirement of Theorem 3.2 is toconstruct a frame matrix V having column span equal to span(y(Θ)), which, in practice,is computed efficiently from the samples.
The mapping of Figure 3.4 to an IMV system (3.11) and the CTF recovery create a niceconnection to results of standard CS. The number of branches p is the number of rowsin A, and the choice of sampling filters w(t) translate to its entries via Theorem 3.1.Since recovery boils down to solving an MMV system with sensing matrix A, we shoulddesign the hardware so that the resulting matrix A in (3.12) has “nice” CS properties.1
Precisely, an MMV system of size p×N and joint sparsity of order K needs to be solvedcorrectly with that A. In practice, to solve the MMV (3.18), we can make use of existingalgorithms from the CS literature, cf. [45–49]. The Introduction and relevant chapters
1 We comment that most known constructions of “nice” CS matrices involve randomness. In practice, theX-ADC hardware is fixed and defines a deterministic sensing matrix A for the corresponding IMV system.

104 Moshe Mishali and Yonina C. Eldar
of this book describe various conditions on CS matrices to ensure stable recovery. Thedimension requirements of the specific MMV solver in use will impact the number ofbranches p, and consequently the total sampling rate.
The sparse-SI framework can be used, in principle, to reduce the rate of any signal ofthe form (3.10). In the next section, we treat multiband signals and derive a sub-Nyquistacquisition strategy for this model from the general sparse-SI architecture of Figure 3.4.
3.5 From theory to hardware of multiband sampling
The prime goal of Xampling is to enable theoretical ideas to develop from the mathto hardware, to real-world applications. In this section, we study sub-Nyquist samplingof multiband signals in the eyes of a practitioner, aiming to design low-rate samplinghardware. We define the multiband model and propose a union formulation that fitsthe sparse-SI framework introduced in the previous section. A periodic nonuniformsampling (PNS) solution [19] is then derived from Figure 3.4. Moving on to practicalaspects, we examine front-end bandwidth specifications of commercial ADC devices,and conclude that devices with Nyquist-rate bandwidth are required whenever the ADCis directly connected to a wideband input. Consequently, although PNS as well as thegeneral architecture of Figure 3.4, enable in principle sub-Nyquist sampling, in practice,high analog bandwidth is necessary, which can be limiting in high-rate applications. Toovercome this possible limitation, an alternative scheme, the MWC [20], is presentedand analyzed. We conclude our study with a glimpse at circuit aspects that are uniqueto Xampling systems, as were reported in the circuit design of an MWC prototypehardware [22].
3.5.1 Signal model and sparse-SI formulation
The class of multiband signals models a scenario in which x(t) consists of severalconcurrent RF transmissions. A receiver that intercepts a multiband x(t) sees the typicalspectral support that is depicted in Figure 3.1. We assume that the multiband spectrumcontains at most N (symmetric) frequency bands with carriers fi, each of maximalwidth B. The carriers are limited to a maximal frequency fmax. The information bandsrepresent analog messages or digital bits transmitted over a shared channel.
When the carrier frequencies fi are fixed, the resulting signal model can be describedas a subspace, and standard demodulation techniques may be used to sample each of thebands at a low-rate. A more challenging scenario is when the carriers fi are unknown.This situation arises, for example, in spectrum sensing for mobile cognitive radio (CR)receivers [23, 52], which aim at utilizing unused frequency regions on an opportunisticbasis. Commercialization of CR technology necessitates a spectrum sensing mechanismthat can sense a wideband spectrum which consists of several narrowband transmissions,and determines in real time which frequency bands are active.
Since each combination of carrier frequencies determines a single subspace, a multi-band signal can be described in terms of a union of subspaces. In principle, fi lies in
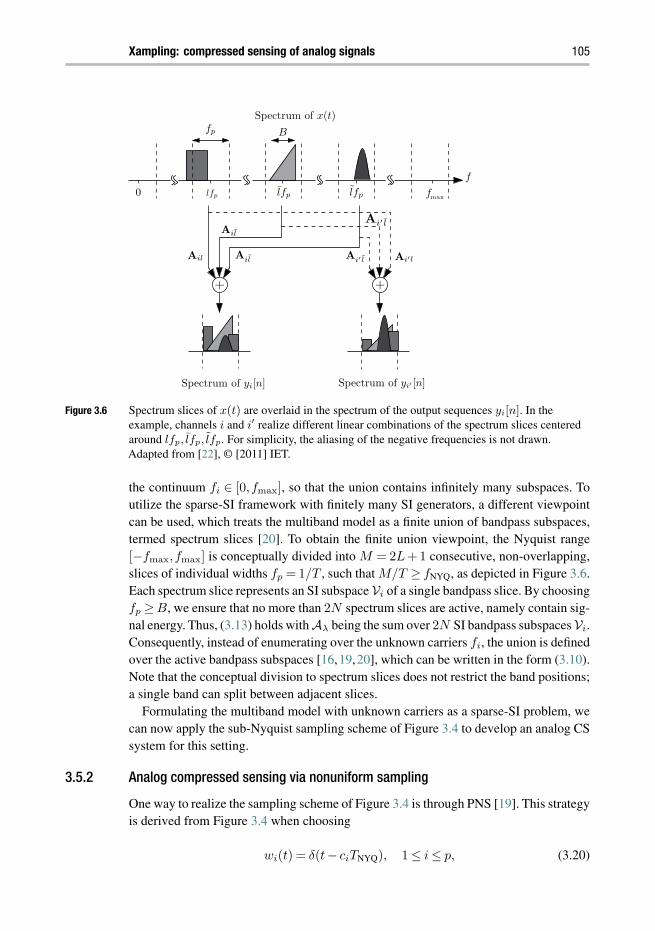
Xampling: compressed sensing of analog signals 105
f
0 maxf
fp
lfp lfp lfp
+
Ail
Ail
Ail
Spectrum of x(t)
Spectrum of yi[n] Spectrum of yi [n]
+
Ai l
Ai l
Ai l
B
Figure 3.6 Spectrum slices of x(t) are overlaid in the spectrum of the output sequences yi[n]. In theexample, channels i and i′ realize different linear combinations of the spectrum slices centeredaround lfp, lfp, lfp. For simplicity, the aliasing of the negative frequencies is not drawn.Adapted from [22], © [2011] IET.
the continuum fi ∈ [0,fmax], so that the union contains infinitely many subspaces. Toutilize the sparse-SI framework with finitely many SI generators, a different viewpointcan be used, which treats the multiband model as a finite union of bandpass subspaces,termed spectrum slices [20]. To obtain the finite union viewpoint, the Nyquist range[−fmax,fmax] is conceptually divided into M = 2L+1 consecutive, non-overlapping,slices of individual widths fp = 1/T , such that M/T ≥ fNYQ, as depicted in Figure 3.6.Each spectrum slice represents an SI subspace Vi of a single bandpass slice. By choosingfp ≥B, we ensure that no more than 2N spectrum slices are active, namely contain sig-nal energy. Thus, (3.13) holds with Aλ being the sum over 2N SI bandpass subspaces Vi.Consequently, instead of enumerating over the unknown carriers fi, the union is definedover the active bandpass subspaces [16,19,20], which can be written in the form (3.10).Note that the conceptual division to spectrum slices does not restrict the band positions;a single band can split between adjacent slices.
Formulating the multiband model with unknown carriers as a sparse-SI problem, wecan now apply the sub-Nyquist sampling scheme of Figure 3.4 to develop an analog CSsystem for this setting.
3.5.2 Analog compressed sensing via nonuniform sampling
One way to realize the sampling scheme of Figure 3.4 is through PNS [19]. This strategyis derived from Figure 3.4 when choosing
wi(t) = δ(t− ciTNYQ), 1 ≤ i ≤ p, (3.20)

106 Moshe Mishali and Yonina C. Eldar
T = MTNYQ
M = 7 M M
1
1 13
3
3
4
4
4
c1TNYQ
delay
y1[n]
nT
yp[n]
nT
cpTNYQ
x(t)
Figure 3.7 Periodic nonuniform sampling for sub-Nyquist sensing. In the example, out of M = 7 points,only p = 3 are active, with time shifts ci = 1,3,4.
where TNYQ =1/fNYQ is the Nyquist period, and using a sampling period of T =MTNYQ.Here ci are integers which select part of the uniform Nyquist grid, resulting in p uniformsequences
yi[n] = x((nM + ci)TNYQ). (3.21)
The sampling sequences are illustrated in Figure 3.7. It can be shown that the PNSsequences yi[n] satisfy an IMV system of the form (3.11) with d[n] representing thecontents of the th bandpass slice. The sensing matrix A in this setting has ith entry
Ai = ej 2πM ci, (3.22)
that is a partial discrete Fourier transform (DFT), obtained by taking only the row indicesci from the full M × M DFT matrix. The CS properties of partial-DFT matrices arestudied in [4], for example.
To recover x(t), we can apply the CTF framework and obtain spectrum blind recon-struction (SBR) of x(t) [19]. Specifically, a frame Q is computed with (3.19) and isoptionally decomposed to another frame V (to combat noise). Solving (3.18) then indi-cates the active sequences d[n], and equivalently estimates the frequency support ofx(t) at a coarse resolution of slice width fp. Continuous reconstruction is then obtainedby standard lowpass interpolation of the active sequences d[n] and modulation to thecorresponding positions on the spectrum. This procedure is termed SBR4 in [19], where4 designates that under the choice of p ≥ 4N sampling sequences (and additional con-ditions), this algorithm guarantees perfect reconstruction of a multiband x(t). With theearlier choice fp = 1/T ≥ B, the average sampling rate can be as low as 4NB.
The rate can be further reduced by a factor of 2 exploiting the way a multiband spectrais arranged in spectrum slices. Using several CTF instances, an algorithm reducing therequired rate was developed in [19] under the name SBR2, leading to p ≥ 2N samplingbranches, so that the sampling rate can approach 2NB. This is essentially the provableoptimal rate [19], since regardless of the sampling strategy, theoretic arguments show that2NB is the lowest possible sampling rate for multiband signals with unknown spectrumsupport [19]. Figure 3.8 depicts recovery performance in Monte Carlo simulations of a(complex-valued) multiband model with N =3 bands, widths B =1 GHz and fNYQ =20
GHz. Recovery of noisy signals is also simulated in [19]. We demonstrate robustness to

Xampling: compressed sensing of analog signals 107
2 4 6 8 10 12 14 160
0.2
0.4
0.6
0.8
1
# sampling branches p
Em
pir
icalsu
ccess
rate
SBR4SBR2
(a)
2 4 6 8 10 12 14 16
10−2
10−1
100
101
# sampling branches p
Avera
ge
run
tim
e(s
econds)
SBR4SBR2
(b)
Figure 3.8 Comparing algorithms SBR4 and SBR2. (a) Empirical recovery rate for different sampling ratesand (b) digital complexity as measured by average run time. Adapted from [19], © [2009] IEEE.
noise later on in this section in the context of MWC sampling. The robustness followsfrom that of the MMV system used for SBR.
We note that PNS was utilized for multiband sampling already in classic studies,though the traditional goal was to approach a rate of NB samples/second. This rate isoptimal according to the Landau theorem [53], though achieving it for all input signalsis possible only when the spectral support is known and fixed. When the carrier frequen-cies are unknown, the optimal rate is 2NB [19]. Indeed, [11, 54] utilized knowledge ofthe band positions to design a PNS grid and the required interpolation filters for recon-struction. The approaches in [12, 13] were semi-blind: a sampler design independentof band positions combined with the reconstruction algorithm of [11] which requiresexact support knowledge. Other techniques targeted the rate NB by imposing alterna-tive constraints on the input spectrum [21]. Here we demonstrate how analog CS tools[16, 45] can lead to a fully blind sampling system of multiband inputs with unknownspectra at the appropriate optimal rate [19]. A more thorough discussion in [19] studiesthe differences between the analog CS method presented here based on [16, 19, 45] andearlier approaches.
3.5.3 Modeling practical ADC devices
Analog CS via PNS results in a simple acquisition strategy, which consists of p delaycomponents and p uniform ADC devices. Furthermore, if high sampling rate is not anobstacle and only low processing rates are of interest, then PNS can be simulated byfirst sampling x(t) at its Nyquist rate and then reducing the rate digitally by discardingsome of the samples. Nonuniform topologies of this class are also popular in the designof Nyquist-rate time-interleaved ADC devices, in which case p = M [55, 56].

108 Moshe Mishali and Yonina C. Eldar
Realization of a PNS grid with standard ADCs remains simple as long as the inputbandwidth is not too high. For high bandwidth signals, PNS is potentially limited, aswe now explain by zooming into the drawing of the ADC device of Figure 3.2. In thesignal processing community, an ADC is often modeled as an ideal pointwise samplerthat takes snapshots of x(t) at a constant rate of r samples/second. The sampling rate r
is the main parameter that is highlighted in the datasheets of popular ADC devices; seeonline catalogs [57, 58] for many examples.
For most analysis purposes, the first-order model of pointwise acquisition approxi-mates the true ADC operation sufficiently well. Another property of practical devices,also listed in datasheets, is about to play a major role in the UoS settings – the analogbandwidth power b. The parameter b measures the −3 dB point in the frequency responseof theADC device, which stems from the responses of all circuitries comprising the inter-nal front-end. See the datasheet quote of AD9057 in Figure 3.9. Consequently, inputswith frequencies up to b Hz can be reliably converted. Any information beyond b is atten-uated and distorted. Figure 3.9 depicts an ADC model in which the pointwise sampler ispreceded by a lowpass filter with cutoff b, in order to take into account the bandwidth lim-itation [20]. In Xampling, the input signal x(t) belongs to a union set U which typicallyhas high bandwidth, e.g., multiband signals whose spectrum reaches up to fmax or FRIsignals with wideband pulse h(t). This explains the necessity of an analog compressionoperator P to reduce the bandwidth prior to the actual ADC. The next stage can thenemploy commercial devices with low analog bandwidth b.
The Achilles heel of nonuniform sampling is the pointwise acquisition of a widebandinput. While the rate of each sequence yi[n] is low, namely fNYQ/M , the ADC devicestill needs to capture a snapshot of a wideband input with frequencies possibly reachingup to fmax. In practice, this requires an ADC with front-end bandwidth that reaches theNyquist rate, which can be challenging in wideband scenarios.
3.5.4 Modulated wideband converter
To circumvent analog bandwidth issues, an alternative to PNS sensing referred to as themodulated wideband converter (MWC) was developed in [20]. The MWC combines thespectrum slices d[n] according to the scheme depicted in Figure 3.10. This architectureallows one to implement an effective demodulator without the carrier frequencies beingknown to the receiver. A nice feature of the MWC is a modular design so that for knowncarrier frequencies the same receiver can be used with fewer channels or lower samplingrate. Furthermore, by increasing the number of channels or the rate on each channel thesame realization can be used for sampling full band signals at the Nyquist rate.
The MWC consists of an analog front-end with p channels. In the ith channel, the inputsignal x(t) is multiplied by a periodic waveform pi(t) with period T , lowpass filteredby an analog filter with impulse response h(t) and cutoff 1/2T , and then sampled at ratefs = 1/T . The mixing operation scrambles the spectrum of x(t), such that a portion ofthe energy of all bands appears in baseband. Specifically, since pi(t) is periodic, it has a

Xampling: compressed sensing of analog signals 109
Analog bandwidth limitation b Sampling rate r
(a)
Analog
maximal rate
r samples/seccutoff b
Digital
lowpasspointwise
sampler
(b)
Figure 3.9 (a) Datasheet of AD9057 (with permission, source: www.analog.com/static/imported-files/data_sheets/AD9057.pdf). (b) Modeling the inherent bandwidth limitation of the ADC front-endas a lowpass filter preceding pointwise acquisition. Adapted from [20], © [2010] IEEE.
Fourier expansion
pi(t) =
∞∑=−∞
ciej 2π
T t. (3.23)
In the frequency domain, mixing by pi(t) is tantamount to convolution between X(f)
and the Fourier transform of pi(t). The latter is a weighted Dirac-comb, with Diraclocations on f = l/T and weights ci. Thus, as before, the spectrum is conceptuallydivided into slices of width 1/T , represented by the unknown sequences d[n], and aweighted-sum of these slices is shifted to the origin [20]. The lowpass filter h(t) transfersonly the narrowband frequencies up to fs/2 from that mixture to the output sequenceyi[n]. The output has the same aliasing pattern that was illustrated in Figure 3.6. Sensing

110 Moshe Mishali and Yonina C. Eldar
yi[n]
h(t)
p1(t)
h(t)
pp(t)
x(t)
yp[n]
y1[n]
Lowpass t = nT
T -periodic
1/Ts
pi(t)
RF front-end Low-rate A DC
(Low analog bandwidth)
Figure 3.10 Block diagram of the modulated wideband converter. The input passes through p parallelbranches, where it is mixed with a set of periodic functions pi(t), lowpass filtered and sampledat a low rate. Adapted from [22], © [2011] IET.
with the MWC results in the IMV system (3.11) with a sensing matrix A whose entriesare the Fourier expansion coefficients ci.
The basic MWC parameter setting is [20]
p ≥ 4N, fs =1
T≥ B. (3.24)
Using the SBR2 algorithm of [19], the required number of branches is p ≥ 2N so thatthe sampling rate is reduced by a factor of 2 and can approach the minimal rate of 2NB.Advanced configurations enable additional hardware savings by collapsing the numberof branches p by a factor of q at the expense of increasing the sampling rate of eachchannel by the same factor, ultimately enabling a single-channel sampling system [20].This property is unique to MWC sensing, since it decouples the aliasing from the actualacquisition.
The periodic functions pi(t) define a sensing matrix A with entries ci. Thus, asbefore, pi(t) need to be chosen such that the resulting A has “nice” CS properties. Inprinciple, any periodic function with high-speed transitions within the period T cansatisfy this requirement. One possible choice for pi(t) is a sign-alternating function,with M = 2L + 1 sign intervals within the period T [20]. Popular binary patterns,e.g., Gold or Kasami sequences, are especially suitable for the MWC [59]. Imperfectsign alternations are allowed as long as periodicity is maintained [22]. This property iscrucial since precise sign alternations at high speeds are extremely difficult to maintain,whereas simple hardware wirings ensure that pi(t) = pi(t + T ) for every t ∈ R [22].Another important practical design aspect is that a filter h(t) with non-flat frequency
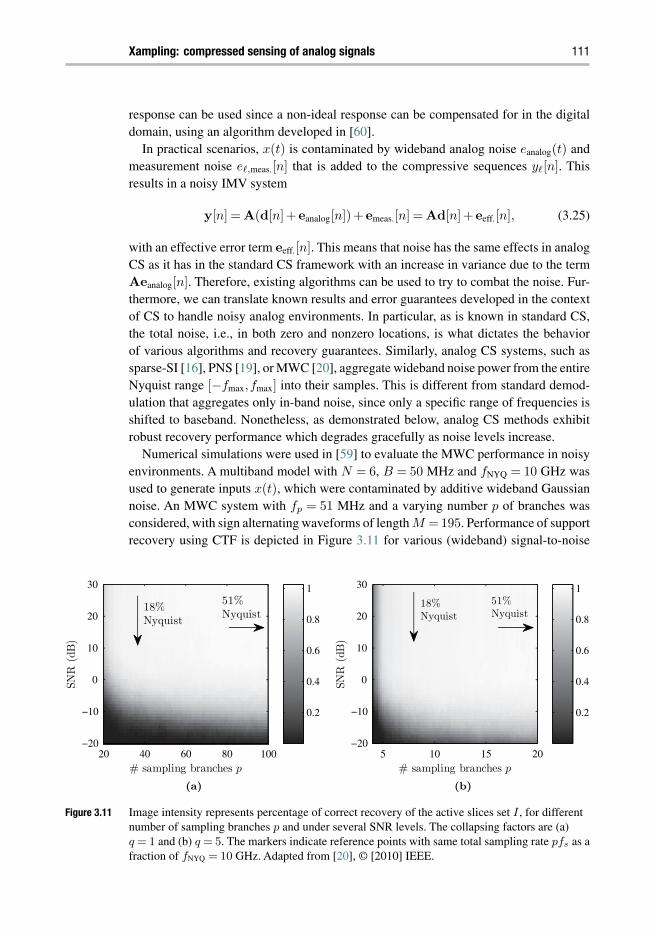
Xampling: compressed sensing of analog signals 111
response can be used since a non-ideal response can be compensated for in the digitaldomain, using an algorithm developed in [60].
In practical scenarios, x(t) is contaminated by wideband analog noise eanalog(t) andmeasurement noise e,meas.[n] that is added to the compressive sequences y[n]. Thisresults in a noisy IMV system
y[n] = A(d[n]+eanalog[n])+emeas.[n] = Ad[n]+eeff.[n], (3.25)
with an effective error term eeff.[n]. This means that noise has the same effects in analogCS as it has in the standard CS framework with an increase in variance due to the termAeanalog[n]. Therefore, existing algorithms can be used to try to combat the noise. Fur-thermore, we can translate known results and error guarantees developed in the contextof CS to handle noisy analog environments. In particular, as is known in standard CS,the total noise, i.e., in both zero and nonzero locations, is what dictates the behaviorof various algorithms and recovery guarantees. Similarly, analog CS systems, such assparse-SI [16], PNS [19], or MWC [20], aggregate wideband noise power from the entireNyquist range [−fmax,fmax] into their samples. This is different from standard demod-ulation that aggregates only in-band noise, since only a specific range of frequencies isshifted to baseband. Nonetheless, as demonstrated below, analog CS methods exhibitrobust recovery performance which degrades gracefully as noise levels increase.
Numerical simulations were used in [59] to evaluate the MWC performance in noisyenvironments. A multiband model with N = 6, B = 50 MHz and fNYQ = 10 GHz wasused to generate inputs x(t), which were contaminated by additive wideband Gaussiannoise. An MWC system with fp = 51 MHz and a varying number p of branches wasconsidered, with sign alternating waveforms of length M = 195. Performance of supportrecovery using CTF is depicted in Figure 3.11 for various (wideband) signal-to-noise
# sampling branches p
SN
R(d
B)
20 40 60 80 100−20
−10
0
10
20
30
0.2
0.4
0.6
0.8
151%
Nyquist18%
Nyquist
(a)
# sampling branches p
SN
R(d
B)
5 10 15 20−20
−10
0
10
20
30
0.2
0.4
0.6
0.8
151%
Nyquist18%
Nyquist
(b)
Figure 3.11 Image intensity represents percentage of correct recovery of the active slices set I , for differentnumber of sampling branches p and under several SNR levels. The collapsing factors are (a)q = 1 and (b) q = 5. The markers indicate reference points with same total sampling rate pfs as afraction of fNYQ = 10 GHz. Adapted from [20], © [2010] IEEE.

112 Moshe Mishali and Yonina C. Eldar
ratio (SNR) levels. Two MWC configurations were tested: a basic version with samplingrate fp per branch, and an advanced setup with a collapsing factor q = 5, in which caseeach branch samples at rate qfp. The results affirm saving in hardware branches by afactor of 5 while maintaining comparable recovery performance. Signal reconstructionis demonstrated in the next subsection using samples obtained by a hardware MWCprototype.
Note that the MWC achieves a similar effect of aliasing bandpass slices to the originas does the PNS system. However, in contrast to PNS, the MWC accomplishes this goalwith analog pre-processing prior to sampling, as proposed in Xampling, which allowsthe use of standard low-rate ADCs. In other words, the practical aspects of front-endbandwidth motivate a solution which departs from the generic scheme of Figure 3.4.This is analogous to the advantage of standard demodulation over plain undersampling;both demodulation and undersampling can shift a single bandpass subspace to the origin.However, while undersampling requires anADC with Nyquist-rate front-end bandwidth,demodulation uses RF technology to interact with the wideband input, thereby requiringonly low-rate and low-bandwidth ADC devices.
3.5.5 Hardware design
The MWC has been implemented as a board-level hardware prototype [22]. The hardwarespecifications cover inputs with 2 GHz Nyquist rate and NB = 120 MHz spectrumoccupation. The prototype has p = 4 sampling branches, with total sampling rate of280 MHz, far below the 2 GHz Nyquist rate. In order to save analog components, thehardware realization incorporates the advanced configuration of the MWC [20] witha collapsing factor q = 3. In addition, a single shift-register provides a basic periodicpattern, from which p periodic waveforms are derived using delays, that is, by tapping p
different locations of the register. Photos of the hardware are presented in Figure 3.12.Several nonordinary RF blocks in the MWC prototype are highlighted in Figure 3.12.
These non-ordinary circuitries stem from the unique application of sub-Nyquist sam-pling as described in detail in [22]. For instance, ordinary analog mixers are specifiedand commonly used with a pure sinusoid in their oscillator port. The MWC, however,requires simultaneous mixing with the many sinusoids comprising pi(t). This resultsin attenuation of the output and substantial nonlinear distortion not accounted for indatasheet specifications. To address this challenge, power control, special equalizers,and local adjustments on datasheet specifications were used in [22] in order to designthe analog acquisition, taking into account the non-ordinary mixer behavior due to theperiodic mixing.
Another circuit challenge pertains to generating pi(t) with 2 GHz alternation rates. Thewaveforms can be generated either by analog or digital means. Analog waveforms, suchas sinusoid, square, or sawtooth waveforms, are smooth within the period, and thereforedo not have enough transients at high frequencies which is necessary to ensure sufficientaliasing. On the other hand, digital waveforms can be programmed to any desired numberof alternations within the period, but are required to meet timing constraints on the orderof the clock period. For 2 GHz transients, the clock interval 1/fNYQ = 480 picosecs leads
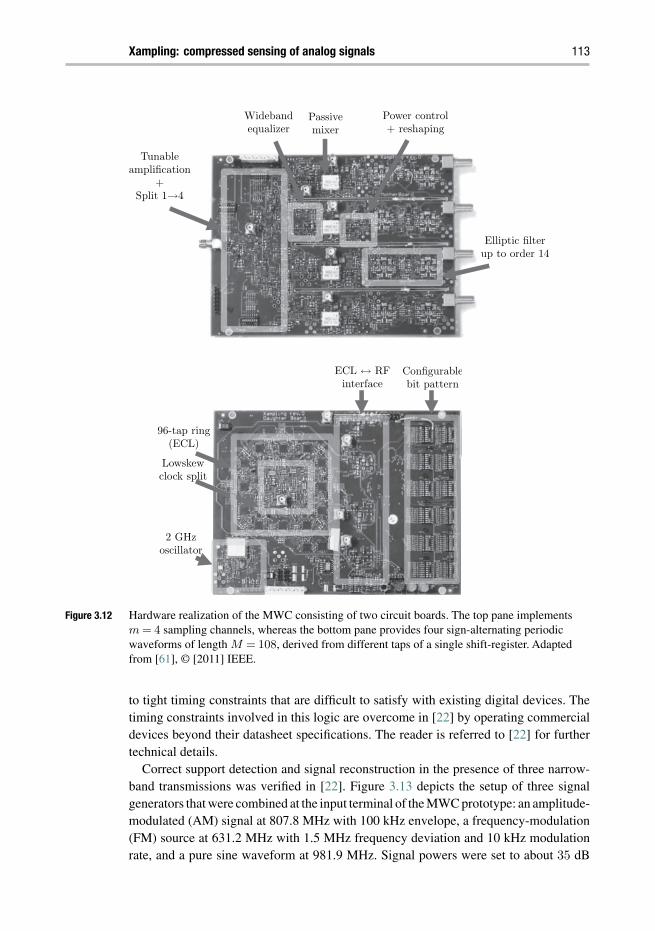
Xampling: compressed sensing of analog signals 113
Tunable
amplification
+
Split 1→4
Wideband
equalizer
Power control
+ reshaping
Elliptic filter
up to order 14
Passive
mixer
96-tap ring
(ECL)
Lowskew
clock split
2 GHz
oscillator
ECL ↔ RF
interface
Configurable
bit pattern
Figure 3.12 Hardware realization of the MWC consisting of two circuit boards. The top pane implementsm = 4 sampling channels, whereas the bottom pane provides four sign-alternating periodicwaveforms of length M = 108, derived from different taps of a single shift-register. Adaptedfrom [61], © [2011] IEEE.
to tight timing constraints that are difficult to satisfy with existing digital devices. Thetiming constraints involved in this logic are overcome in [22] by operating commercialdevices beyond their datasheet specifications. The reader is referred to [22] for furthertechnical details.
Correct support detection and signal reconstruction in the presence of three narrow-band transmissions was verified in [22]. Figure 3.13 depicts the setup of three signalgenerators that were combined at the input terminal of the MWC prototype: an amplitude-modulated (AM) signal at 807.8 MHz with 100 kHz envelope, a frequency-modulation(FM) source at 631.2 MHz with 1.5 MHz frequency deviation and 10 kHz modulationrate, and a pure sine waveform at 981.9 MHz. Signal powers were set to about 35 dB

634
633
632
631
Frequency (MHz)
630
629
628
0.1
0.2
0.3
0.4
0.5
0.6
0.7
0.8
0.9
0.012
1.5 1
0.5 0
–0.5
Amplitude
–1
–1.5 –2
0.01
50.
020.
025
0.03
0.03
5T
ime
(mSe
c)T
ime
(mSe
c)
0.04
0.04
50.
050.
055
0.06
++
Figu
re3.
13T
hree
sign
alge
nera
tors
are
com
bine
dto
the
syst
emin
putt
erm
inal
.The
spec
trum
ofth
elo
w-r
ate
sam
ples
(firs
tcha
nnel
)re
veal
sov
erla
pped
alia
sing
atba
seba
nd.T
here
cove
ryal
gori
thm
finds
the
corr
ectc
arri
ers
and
reco
nstr
ucts
the
orig
inal
indi
vidu
alsi
gnal
s.A
dapt
edfr
om[2
2],©
[201
1]IE
T.

Xampling: compressed sensing of analog signals 115
SNR with respect to the wideband noise that folded to baseband. The carrier positionswere chosen so that their aliases overlay at baseband, as the photos in Figure 3.13 demon-strate. The CTF was executed and detected the correct support set I . The unknown carrierfrequencies were estimated up to 10 kHz accuracy. In addition, the figure demonstratescorrect reconstruction of the AM and FM signal contents. Our lab experiments also indi-cate an average of 10 millisecond duration for the digital computations, including CTFsupport detection and carrier estimation. The small dimensions of A (12×100 in the pro-totype configuration) is what makes the MWC practically feasible from a computationalperspective.
The results of Figure 3.13 connect between theory and practice. The same digitalalgorithms that were used in the numerical simulations of [20] are successfully appliedin [22] on real data, acquired by the hardware. This demonstrates that the theoreti-cal principles are sufficiently robust to accommodate circuit non-idealities, which areinevitable in practice. A video recording of these experiments and additional documen-tation for the MWC hardware are available at http://webee.technion.ac.il/Sites/People/YoninaEldar/Info/hardware.html. A graphical package demonstrating the MWCnumerically is available at http://webee.technion.ac.xil/Sites/People/YoninaEldar/Info/software/GUI/MWC_GUI.htm.
The MWC board appears to be the first reported hardware example borrowing ideasfrom CS to realize a sub-Nyquist sampling system for wideband signals, where the sam-pling and processing rates are directly proportional to the actual bandwidth occupationand not the highest frequency. Alternative approaches which employ discretization ofthe analog input are discussed in Section 3.8. The realization of these methods recoversignals with Nyquist-rates below 1 MHz, falling outside of the class of wideband sam-plers. Additionally, the signal representations that result from discretization have sizeproportional to the Nyquist frequency, leading to recovery problems in the digital domainthat are much larger than those posed by the MWC.
3.5.6 Sub-Nyquist signal processing
A nice feature of the MWC recovery stage is that it interfaces seamlessly with stan-dard DSPs by providing (samples of) the narrowband quadrature information signalsIi(t),Qi(t) which build the ith band of interest
si(t) = Ii(t)cos(2πfit)+Qi(t)sin(2πfit). (3.26)
The signals Ii(t),Qi(t) could have been obtained by classic demodulation had the car-riers fi been known. In the union settings, with unknown carrier frequencies fi, thiscapability is provided by a digital algorithm, named Back-DSP, that is developed in [14]and illustrated in Figure 3.14. The Back-DSP algorithm2 translates the sequences d[n]
to the narrowband signals Ii(t),Qi(t) that standard DSP packages expect to receive,
2 Matlab code is available online at http://webee.technion.ac.il/Sites/People/YoninaEldar/Info/software/FR/FR.htm.

116 Moshe Mishali and Yonina C. Eldar
Align/stitch
dl[n]
dl+1[n]
si[n]
sj [n]
Balanced quadricorrelator
Ii(t),Q i(t)
Carrier fi
Narrowband
information
Figure 3.14 The flow of information extractions begins with detecting the band edges. The slices are filtered,aligned and stitched appropriately to construct distinct quadrature sequences si[n] perinformation band. The balanced quadricorrelator finds the carrier fi and extracts the narrowbandinformation signals. Adapted from [38], © [2011] IEEE.
−300 −200 −100 0 100 200 3000
0.05
0.1
0.15
0.2
0.25
0.3
0.35
CFO (kHz)
Perc
enta
ge o
f si
mul
atio
ns p
er b
in
99% in150 kHz
(a)
0 5 10 15 20 25 300
0.2
0.4
0.6
0.8
1
SNR [dB]
Perc
enta
ge o
f si
mul
atio
ns
200 kHz100 kHz70 kHz30 kHz
|CFO| within
(b)
Figure 3.15 The distribution of CFO for fixed SNR=10 dB (a). The curves (b) represent the percentage ofsimulations in which the CFO magnitude is within the specified range. Adapted from [14], ©[2011] IEEE.
thereby providing backward compatibility. Only low-rate computations, proportional tothe rate of Ii(t),Qi(t), are used. Back-DSP first detects the band edges, then separatesbands occupying the same slice to distinct sequences and stitches together energy thatwas split between adjacent slices. Finally, the balanced quadricorrelator [62] is appliedin order to estimate the carrier frequencies.
Numerical simulations of the Back-DSP algorithm, in a wideband setup similar to theone of Figure 3.11, evaluated the Back-DSP performance in two aspects. The carrierfrequency offset (CFO), estimated vs. true value of fi, is plotted in Figure 3.15. Inmost cases, algorithm Back-DSP approaches the true carriers as close as 150 kHz. Forreference, the 40 part-per-million (ppm) CFO specifications of IEEE 802.11 standardstolerate 150 kHz offsets for transmissions located around 3.75 GHz [63]. To verify dataretrieval, a binary phase-shift keying (BPSK) transmission was generated, such that the

Xampling: compressed sensing of analog signals 117
band energy splits between two adjacent spectrum slices. A Monte Carlo simulation wasused to compute bit error rate (BER) at the output of Back-DSP. Estimated BERs for 3 dBand 5 dB SNR, respectively, are better than 0.77 · 10−6 and 0.71 · 10−6. No erroneousbits were detected for SNR of 7 and 9 dB. See [14] for full results.
3.6 Finite rate of innovation signals
The second class we consider are analog signals in infinite unions of finite-dimensionalspaces; these are continuous-time signals that can be characterized by a finite numberof coefficients, also termed finite rate of innovation (FRI) signals as coined by Vetterliet al. [24, 25]. One important problem that is studied in this framework is that of time-delay estimation, in which the input contains several, say L, echoes of a known pulseshape h(t), though the echo positions t and amplitudes a are unknown [64]. Time-delay estimation is analogous to estimation of frequencies and amplitudes in a mixtureof sinusoids. Both problems were widely studied in the classic literature [5, 65–69],with parametric estimation techniques that date back to methods developed by Rife andBoorstyn in 1974 [70] and earlier by David Slepian in the 1950s. The classic approachesfocused on improving estimation performance in the digital domain, so that the errorin estimating the time delays, or equivalently the sinusoid frequencies, approaches theoptimal defined by the relevant Cramér–Rao bounds. The starting point, however, isdiscrete samples at the Nyquist rate of the input. The concept of FRI is fundamentallydifferent, as it aims to obtain similar estimates from samples taken at the rate of inno-vation, namely proportional to 2L samples per observation interval, rather than at thetypically much higher rate corresponding to the Nyquist bandwidth of h(t). Chapter 4in this book provides a comprehensive review of the FRI field. In the present chapter,we focus on Xampling-related aspects, with emphasis on possible hardware configura-tions for sub-Nyquist FRI acquisition. Recovery algorithms are briefly reviewed for thechapter to be self-contained.
3.6.1 Analog signal model
As we have seen in Section 3.4, the SI model (3.6) is a convenient way to describe analogsignals in infinite-dimensional spaces. We can use a similar approach to describe analogsignals that lie within finite-dimensional spaces by restricting the number of unknowngains a[n] to be finite, leading to the parameterization
x(t) =
L∑=1
ah(t). (3.27)
In order to incorporate infiniteness into this model, we assume that each generator h(t)
has an unknown parameter α associated with it, which can take on values in a continuous
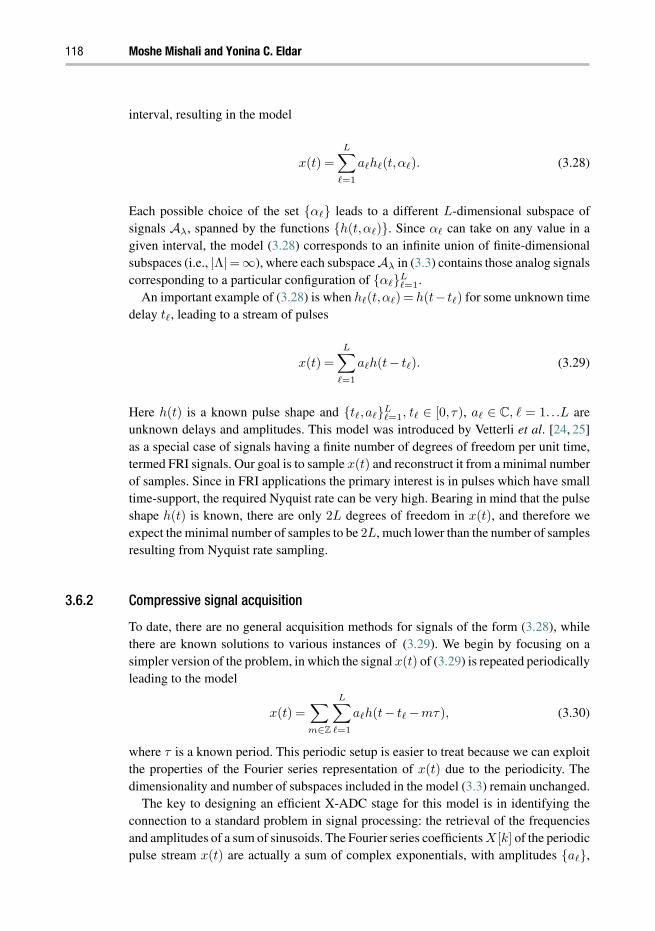
118 Moshe Mishali and Yonina C. Eldar
interval, resulting in the model
x(t) =
L∑=1
ah(t,α). (3.28)
Each possible choice of the set α leads to a different L-dimensional subspace ofsignals Aλ, spanned by the functions h(t,α). Since α can take on any value in agiven interval, the model (3.28) corresponds to an infinite union of finite-dimensionalsubspaces (i.e., |Λ|=∞), where each subspace Aλ in (3.3) contains those analog signalscorresponding to a particular configuration of αL
=1.An important example of (3.28) is when h(t,α) = h(t− t) for some unknown time
delay t, leading to a stream of pulses
x(t) =
L∑=1
ah(t− t). (3.29)
Here h(t) is a known pulse shape and t,aL=1, t ∈ [0, τ), a ∈ C, = 1. . .L are
unknown delays and amplitudes. This model was introduced by Vetterli et al. [24, 25]as a special case of signals having a finite number of degrees of freedom per unit time,termed FRI signals. Our goal is to sample x(t) and reconstruct it from a minimal numberof samples. Since in FRI applications the primary interest is in pulses which have smalltime-support, the required Nyquist rate can be very high. Bearing in mind that the pulseshape h(t) is known, there are only 2L degrees of freedom in x(t), and therefore weexpect the minimal number of samples to be 2L, much lower than the number of samplesresulting from Nyquist rate sampling.
3.6.2 Compressive signal acquisition
To date, there are no general acquisition methods for signals of the form (3.28), whilethere are known solutions to various instances of (3.29). We begin by focusing on asimpler version of the problem, in which the signal x(t) of (3.29) is repeated periodicallyleading to the model
x(t) =∑m∈Z
L∑=1
ah(t− t −mτ), (3.30)
where τ is a known period. This periodic setup is easier to treat because we can exploitthe properties of the Fourier series representation of x(t) due to the periodicity. Thedimensionality and number of subspaces included in the model (3.3) remain unchanged.
The key to designing an efficient X-ADC stage for this model is in identifying theconnection to a standard problem in signal processing: the retrieval of the frequenciesand amplitudes of a sum of sinusoids. The Fourier series coefficients X[k] of the periodicpulse stream x(t) are actually a sum of complex exponentials, with amplitudes a,

Xampling: compressed sensing of analog signals 119
and frequencies directly related to the unknown time-delays [24]:
X[k] =1
τH(2πk/τ)
L∑=1
ae−j2πkt/τ , (3.31)
where H(ω) is the CTFT of the pulse h(t). Therefore, once the Fourier coefficients areknown, the unknown delays and amplitudes can be found using standard tools developedin the context of array processing and spectral estimation [24,71]. For further details seeChapter 4 in this book. Our focus here is on how to obtain the Fourier coefficients X[k]
efficiently from x(t).There are several X-ADC operators P which can be used to obtain the Fourier coef-
ficients from time-domain samples of the signal. One choice is to set P to be a lowpassfilter, as suggested in [24]. The resulting reconstruction requires 2L + 1 samples andtherefore presents a near-critical sampling scheme. A general condition on the samplingkernel s(t) that enables obtaining the Fourier coefficients was derived in [27]: its CTFTS(ω) should satisfy
S(ω) =
0, ω = 2πk/τ,k /∈Knonzero, ω = 2πk/τ,k ∈Karbitrary, otherwise,
(3.32)
where K is a set of 2L consecutive indices such that H (2πk/τ) = 0 for all k ∈K. Theresulting X-ADC consists of a filter with a suitable impulse response s(t) followed by auniform sampler.
A special class of filters satisfying (3.32) are Sum of Sincs (SoS) in the frequencydomain [27], which lead to compactly supported filters in the time domain. These filtersare given in the Fourier domain by
G(ω) =τ√2π
∑k∈K
bk sinc
(ω
2π/τ−k
), (3.33)
where bk = 0, k ∈ K. It is easy to see that this class of filters satisfies (3.32) byconstruction. Switching to the time domain leads to
g(t) = rect
(t
τ
)∑k∈K
bkej2πkt/τ . (3.34)
For the special case in which K = −p, . . .,p and bk = 1,
g(t) = rect
(t
τ
) p∑k=−p
ej2πkt/τ = rect
(t
τ
)Dp(2πt/τ), (3.35)
where Dp(t) denotes the Dirichlet kernel.While periodic streams are mathematically convenient, finite pulse streams of the form
(3.29) are ubiquitous in real-world applications. A finite pulse stream can be viewed as a

120 Moshe Mishali and Yonina C. Eldar
restriction of a periodic FRI signal to a single period. As long as the analog preprocessingP does not involve values of x(t) outside the observation interval [0, τ ], this implies thatsampling and reconstruction methods developed for the periodic case also apply to finitesettings. Treating time-limited signals with lowpass P , however, may be difficult sinceit has infinite time support, beyond the interval [0, τ ] containing the finite pulse stream.Instead, we can choose fast-decaying sampling kernels or SoS filters such as (3.34) thathave compact time support τ by construction.
To treat the finite case, a Gaussian sampling kernel was proposed in [24]; however, thismethod is numerically unstable since the samples are multiplied by a rapidly divergingor decaying exponent. As an alternative, we may use compactly supported samplingkernels for certain classes of pulse shapes based on splines [25]; this enables obtainingmoments of the signal rather than its Fourier coefficients. These kernels have severaladvantages in practice as detailed in the next chapter. The moments are then processed ina similar fashion (see the next subsection for details). However, this approach is unstablefor high values of L [25]. To improve robustness, the SoS class is extended to the finitecase by exploiting the compact support of the filters [27]. This approach exhibits superiornoise robustness when compared to the Gaussian and spline methods, and can be usedfor stable reconstruction even for very high values of L, e.g., L = 100.
The model of (3.29) can be further extended to the infinite stream case, in which
x(t) =∑∈Z
ah(t− t), t,a ∈ R. (3.36)
Both [25] and [27] exploit the compact support of their sampling filters, and showthat under certain conditions the infinite stream may be divided into a series of finiteproblems, which are solved independently with the existing finite algorithm. However,both approaches operate far from the rate of innovation, since proper spacing is requiredbetween the finite streams in order to allow the reduction stage, mentioned earlier. Inthe next section we consider a special case of (3.36) in which the time delays repeatperiodically (but not the amplitudes). As we will show in this special case, efficientsampling and recovery is possible even using a single filter, and without requiring thepulse h(t) to be time limited.
An alternative choice of analog compression operator P to enable recovery of infinitestreams of pulses is to introduce multichannel sampling schemes. This approach was firstconsidered for Dirac streams, where moments of the signal were obtained by a successivechain of integrators [72]. Unfortunately, the method is highly sensitive to noise. A simplesampling and reconstruction scheme consisting of two channels, each with an RC circuit,was presented in [73] for the special case where there is no more than one Dirac persampling period.Amore general multichannel architecture that can treat a broader class ofpulses, while being much more stable, is depicted in Figure 3.16 [28]. The system is verysimilar to the MWC presented in the previous section, and as such it also complies withthe general Xampling architecture. In each channel of this X-ADC, the signal is mixedwith a modulating waveform s(t), followed by an integrator, resulting in a mixture ofthe Fourier coefficients of the signal. By correct choice of the mixing coefficients, the

Xampling: compressed sensing of analog signals 121
x(t)
1T Im
(·)dt c1[m]t = mT
cp[m]t = mT
s1(t) =k∈K
s1ke−j 2π
Tkt
sp(t) =k∈K
spke−j 2π
Tkt
1T Im
(·)dt
Figure 3.16 Extended sampling scheme using modulating waveforms for an infinite pulse stream. Adaptedfrom [28], © [2011] IEEE.
Fourier coefficients may be extracted from the samples by a simple matrix inversion.This method exhibits superior noise robustness over the integrator chain method [72]and allows for more general compactly supported pulse-shapes. A recent method studiedmultichannel sampling for analog signals comprised of several, possibly overlapping,finite duration pulses with unknown shapes and time positions [74].
From a practical hardware perspective it is often more convenient to implement themultichannel scheme rather than a single-channel acquisition with an analog filter thatsatisfies the SoS structure. It is straightforward to show that the SoS filtering approachcan also be implemented in the form of Figure 3.16 with coefficient matrix S = Q whereQ is chosen according to the definition following (3.37), for the SoS case. We point outthat the multichannel architecture of Figure 3.16 can be readily implemented using theMWC prototype hardware. Mixing functions s(t) comprised of finitely many sinusoidscan be obtained by properly filtering a general periodic waveform. Integration over T isa first-order lowpass filter which can be assembled in place of the typically higher-orderfilter of the MWC system [61].
3.6.3 Recovery algorithms
In both the single-channel and multichannel approaches, recovery of the unknown delaysand amplitudes proceeds according to Xampling by detecting the parameters t thatidentify the signal subspace. The approach consists of two steps. First, the vector ofsamples c is related to the Fourier coefficients vector x through a p×|K| mixing matrixQ, as
c = Qx. (3.37)
Here p≥ 2L represents the number of samples. When using the SoS approach with a filterS(ω), Q=VS where S is a p×p diagonal matrix with diagonal elements S∗(−2π/τ),1 ≤ ≤ p, and V is a p×|K| Vandermonde matrix with th element given by ej2πT/τ ,1 ≤ ≤ p, where T denotes the sampling period. For the multichannel architecture of
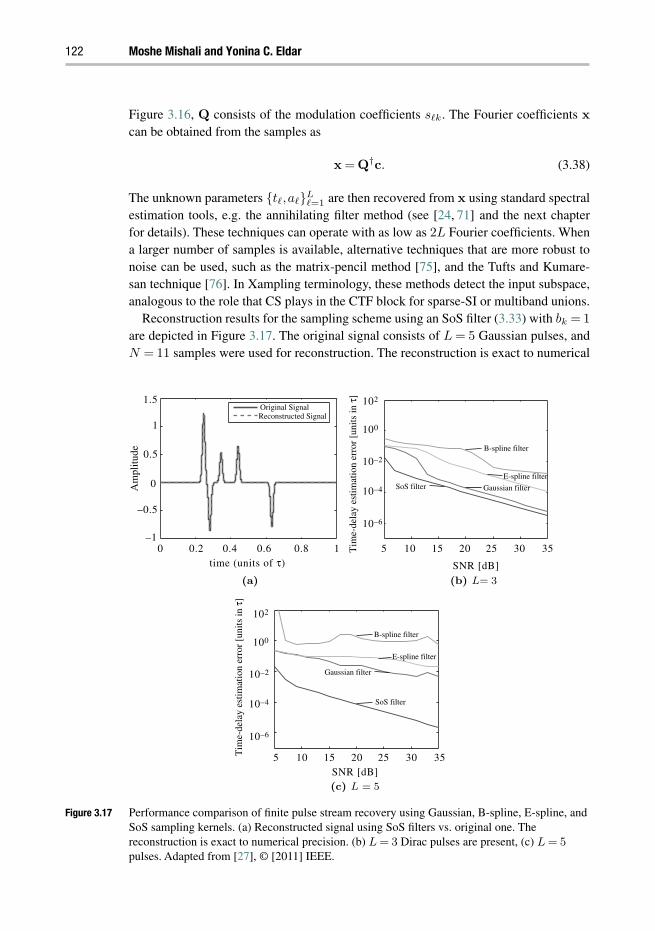
122 Moshe Mishali and Yonina C. Eldar
Figure 3.16, Q consists of the modulation coefficients sk. The Fourier coefficients xcan be obtained from the samples as
x = Q†c. (3.38)
The unknown parameters t,aL=1 are then recovered from x using standard spectral
estimation tools, e.g. the annihilating filter method (see [24, 71] and the next chapterfor details). These techniques can operate with as low as 2L Fourier coefficients. Whena larger number of samples is available, alternative techniques that are more robust tonoise can be used, such as the matrix-pencil method [75], and the Tufts and Kumare-san technique [76]. In Xampling terminology, these methods detect the input subspace,analogous to the role that CS plays in the CTF block for sparse-SI or multiband unions.
Reconstruction results for the sampling scheme using an SoS filter (3.33) with bk = 1
are depicted in Figure 3.17. The original signal consists of L = 5 Gaussian pulses, andN = 11 samples were used for reconstruction. The reconstruction is exact to numerical
-
(a) (b) L= 3
(c) L = 5
1.5
1
0.5
0
–0.5
–1
102
100
10–2
10–4
10–6
102
100
10–2
10–4
10–6
0 0.2 0.4 0.6 0.8 1 5 10 15 20 25 30 35
5 10Tim
e-de
lay
estim
atio
n er
ror
[uni
ts in
τ]
Am
plitu
de
Tim
e-de
lay
estim
atio
n er
ror
[uni
ts in
τ]
time (units of τ) SNR [dB]
SNR [dB]15 20 25 30
SoS filter
SoS filter
Original SignalReconstructed Signal
Gaussian filter
Gaussian filter
E-spline filter
B-spline filter
35
E-spline filter
B-spline filter
Figure 3.17 Performance comparison of finite pulse stream recovery using Gaussian, B-spline, E-spline, andSoS sampling kernels. (a) Reconstructed signal using SoS filters vs. original one. Thereconstruction is exact to numerical precision. (b) L = 3 Dirac pulses are present, (c) L = 5pulses. Adapted from [27], © [2011] IEEE.

Xampling: compressed sensing of analog signals 123
precision. A comparison of the performance of various methods in the presence of noiseis depicted in Figure 3.17 for a finite stream consisting of 3 and 5 pulses. The pulse-shapeis a Dirac delta, and white Gaussian noise is added to the samples with a proper levelin order to reach the desired SNR for all methods. All approaches operate using 2L+1
samples. The results affirm stable recovery when using SoS filters. Chapter 4 of thisbook reviews in detail FRI recovery in the presence of noise [77] and outlines potentialapplications in super-resolution imaging [78], ultrasound [27], and radar imaging [29].
3.7 Sequences of innovation signals
The conventional SI setting (3.6) treats a single input subspace spanned by the shiftsof N given generators h(t). Combining the SI setting (3.6) and the time uncertaintiesof Section 3.6, we now incorporate structure by assuming that each generator h(t)
is given up to some unknown parameter α associated with it, leading to an infiniteunion of infinite-dimensional spaces. As with its finite counterpart, there is currentlyno general sampling framework available to treat such signals. Instead, we focus on aspecial time-delay scenario of this model for which efficient sampling techniques havebeen developed.
3.7.1 Analog signal model
An interesting special case of the general model (3.28) is when h(t) = h(t) and α = trepresent unknown delays, leading to [26, 28, 29]
x(t) =∑n∈Z
L∑=1
a[n]h(t− t −nT ), (3.39)
where t = tL=1 is a set of unknown time delays contained in the time interval
[0,T ), a[n] are arbitrary bounded energy sequences, presumably representing low-rate streams of information, and h(t) is a known pulse shape. For a given set of delayst, each signal of the form (3.39) lies in an SI subspace Aλ, spanned by L generatorsh(t− t)L
=1. Since the delays can take on any values in the continuous interval [0,T ),the set of all signals of the form (3.39) constitutes an infinite union of SI subspaces,i.e., |Λ| = ∞. Additionally, since any signal has parameters a[n]n∈Z, each of the Aλ
subspaces has infinite cardinality. This model generalizes (3.36) with time delays thatrepeat periodically, where (3.39) allows the pulse shapes to have infinite support.
3.7.2 Compressive signal acquisition
To obtain a Xampling system, we follow a similar approach to that in Section 3.4, whichtreats a structured SI setting where there are N possible generators. The difference thoughis that in this current case there are infinitely many possibilities. Therefore, we replace the
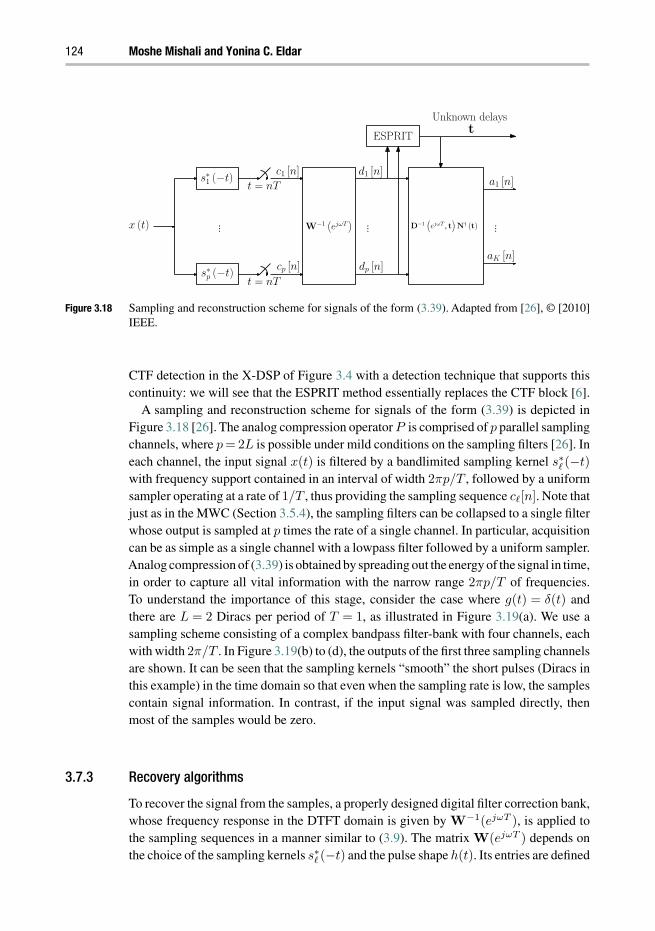
124 Moshe Mishali and Yonina C. Eldar
s∗1 (−t)
...x (t)
t = nT
t = nT
...
c1 [n]
s∗p (−t) cp [n]
W−1 ejωT
d1 [n]
dp [n]
D−1 ejωT , t N† (t) ...
a1 [n]
aK [n]
ESPRIT tUnknown delays
Figure 3.18 Sampling and reconstruction scheme for signals of the form (3.39). Adapted from [26], © [2010]IEEE.
CTF detection in the X-DSP of Figure 3.4 with a detection technique that supports thiscontinuity: we will see that the ESPRIT method essentially replaces the CTF block [6].
A sampling and reconstruction scheme for signals of the form (3.39) is depicted inFigure 3.18 [26]. The analog compression operator P is comprised of p parallel samplingchannels, where p = 2L is possible under mild conditions on the sampling filters [26]. Ineach channel, the input signal x(t) is filtered by a bandlimited sampling kernel s∗
(−t)
with frequency support contained in an interval of width 2πp/T , followed by a uniformsampler operating at a rate of 1/T , thus providing the sampling sequence c[n]. Note thatjust as in the MWC (Section 3.5.4), the sampling filters can be collapsed to a single filterwhose output is sampled at p times the rate of a single channel. In particular, acquisitioncan be as simple as a single channel with a lowpass filter followed by a uniform sampler.Analog compression of (3.39) is obtained by spreading out the energy of the signal in time,in order to capture all vital information with the narrow range 2πp/T of frequencies.To understand the importance of this stage, consider the case where g(t) = δ(t) andthere are L = 2 Diracs per period of T = 1, as illustrated in Figure 3.19(a). We use asampling scheme consisting of a complex bandpass filter-bank with four channels, eachwith width 2π/T . In Figure 3.19(b) to (d), the outputs of the first three sampling channelsare shown. It can be seen that the sampling kernels “smooth” the short pulses (Diracs inthis example) in the time domain so that even when the sampling rate is low, the samplescontain signal information. In contrast, if the input signal was sampled directly, thenmost of the samples would be zero.
3.7.3 Recovery algorithms
To recover the signal from the samples, a properly designed digital filter correction bank,whose frequency response in the DTFT domain is given by W−1(ejωT ), is applied tothe sampling sequences in a manner similar to (3.9). The matrix W(ejωT ) depends onthe choice of the sampling kernels s∗
(−t) and the pulse shape h(t). Its entries are defined
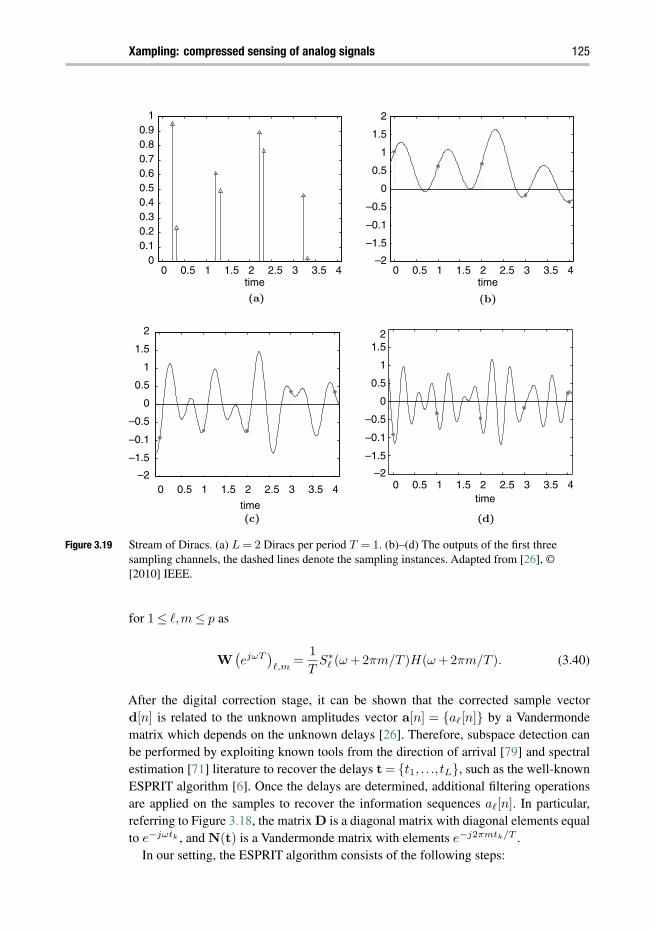
Xampling: compressed sensing of analog signals 125
0 0.5 1 1.5 2 2.5 3 3.5 40
0.10.20.30.40.50.60.70.80.9
1
time time
time
(a)
0 0.5 1 1.5 2 2.5 3 3.5 4
0 0.5 1 1.5 2 2.5 3 3.5 40 0.5 1 1.5 2 2.5 3 3.5 4
(b)
–0.5
–0.1
–1.5
–2
0
0.5
1
1.5
2
–0.5
–0.1
–1.5
–2
0
0.5
1
1.52
–0.5
–0.1
–1.5
–2
0
0.5
1
1.5
2
time(c) (d)
Figure 3.19 Stream of Diracs. (a) L = 2 Diracs per period T = 1. (b)–(d) The outputs of the first threesampling channels, the dashed lines denote the sampling instances. Adapted from [26], ©[2010] IEEE.
for 1 ≤ ,m ≤ p as
W(ejωT
),m
=1
TS∗
(ω +2πm/T )H(ω +2πm/T ). (3.40)
After the digital correction stage, it can be shown that the corrected sample vectord[n] is related to the unknown amplitudes vector a[n] = a[n] by a Vandermondematrix which depends on the unknown delays [26]. Therefore, subspace detection canbe performed by exploiting known tools from the direction of arrival [79] and spectralestimation [71] literature to recover the delays t = t1, . . ., tL, such as the well-knownESPRIT algorithm [6]. Once the delays are determined, additional filtering operationsare applied on the samples to recover the information sequences a[n]. In particular,referring to Figure 3.18, the matrix D is a diagonal matrix with diagonal elements equalto e−jωtk , and N(t) is a Vandermonde matrix with elements e−j2πmtk/T .
In our setting, the ESPRIT algorithm consists of the following steps:
126 Moshe Mishali and Yonina C. Eldar
1. Construct the correlation matrix Rdd =∑
n∈Zd [n]dH [n].
2. Perform an SVD decomposition of Rdd and construct the matrix Es consisting of theL singular vectors associated with the non-zero singular values in its columns.
3. Compute the matrix Φ=E†s↓Es↑. The notations Es↓ and Es↑ denote the sub matrices
extracted from Es by deleting its last/first row respectively.4. Compute the eigenvalues of Φ, λi, i = 1,2, . . .,L.5. Retrieve the unknown delays by ti = − T
2π arg(λi).
In general, the number of sampling channels p required to ensure unique recovery ofthe delays and sequences using the proposed scheme has to satisfy p ≥ 2L [26]. Thisleads to a minimal sampling rate of 2L/T . For certain signals, the sampling rate can bereduced even further to (L+1)/T [26]. Interestingly, the minimal sampling rate is notrelated to the Nyquist rate of the pulse h(t). Therefore, for wideband pulse shapes, thereduction in rate can be quite substantial. As an example, consider the setup in [80], usedfor characterization of ultra-wide band wireless indoor channels. Under this setup, pulseswith bandwidth of W = 1 GHz are transmitted at a rate of 1/T = 2 MHz. Assuming thatthere are 10 significant multipath components, we can reduce the sampling rate down to40 MHz compared with the 2 GHz Nyquist rate.
We conclude by noting that the approach of [26] imposes only minimal conditionson the possible generator h(t) in (3.39), so that in principle almost arbitrary generatorscan be treated according to Figure 3.18, including h(t) with unlimited time support. Asmentioned earlier, implementing this sampling strategy can be as simple as collapsing theentire system to a single channel that consists of a lowpass filter and a uniform sampler.Reconstruction, however, involves a p×p bank of digital filters W−1(ejωT ), which canbe computationally demanding. In scenarios with time-limited h(t) sampling with themultichannel scheme of Figure 3.16 can be more convenient, since digital filtering is notrequired so that ESPRIT is applied directly on the samples [28].
3.7.4 Applications
Problems of the form (3.39) appear in a variety of different settings. For example, themodel (3.39) can describe multipath medium identification problems, which arise inapplications such as radar [81], underwater acoustics [82], wireless communications [83],and more. In this context, pulses with known shape are transmitted through a multipathmedium, which consists of several propagation paths, at a constant rate. As a result thereceived signal is composed of delayed and weighted replicas of the transmitted pulses.The delays t represent the propagation delays of each path, while the sequences a[n]
describe the time-varying gain coefficient of each multipath component.An example of multipath channel identification is shown in Figure 3.20. The channel
consists of four propagation paths and is probed by pulses at a rate of 1/T . The outputis sampled at a rate of 5/T , with white Gaussian noise with SNR of 20 dB added to thesamples. Figure 3.20 demonstrates recovery of the propagations delays, and the time-varying gain coefficients, from low-rate samples corrupted by noise. This is essentially

Xampling: compressed sensing of analog signals 127
0.2 0.3 0.4 0.5 0.6 0.7 0.8 0.9 10
0.1
0.2
0.3
0.4
0.5
0.6
0.7
0.8
0.9
1
delay [T]
tap
ener
gy
mag
nitu
de
(a)
0 20 40 60 80 100 –1.5
–1
–0.5
0
0.5
1
1.5
n
(b)
channelestimated channel
originalrecovered
Figure 3.20 Channel estimation with p = 5 sampling channels, and SNR = 20 dB. (a) Delay recovery. (b)Recovery of the time-varying gain coefficient of the first path. Adapted from [26], © [2010]IEEE.
a combination of X-ADC and X-DSP, where the former is used to reduce the samplingrate, while the latter is responsible for translating the compressed sample sequences c[n]
to the set of low-rate streams d[n], which convey the actual information to the receiver.In this example the scheme of Figure 3.18 was used with a bank of ideal band-pass filterscovering consecutive frequency bands:
S (ω) =
T, ω ∈
[(− 1) 2π
T , 2πT
]0, otherwise.
(3.41)
As can be seen, even in the presence of noise, the channel is recovered almost perfectlyfrom low-rate samples. Applications to radar are explored in Chapter 4 and later on inSection 3.8.5.
3.8 Union modeling vs. finite discretization
The approach we have been describing so far treats analog signals by taking advantageof a UoS model, where the inherent infiniteness of the analog signal enters either throughthe dimensions of the underlying subspaces Aλ, the cardinality of the union |Λ|, or both.An alternative strategy is to assume that the analog signal has some finite representationto begin with, i.e., that both Λ and Aλ are finite. Sampling in this case can be readilymapped to a standard underdetermined CS system y = Ax (that is with a single vectorof unknowns rather than infinitely many as in the IMV setting).
The methods we review in this section treat continuous signals that have an under-lying finite parameterization: the RD [30] and quantized CS radar [31–33]. In additionto surveying [30–33], we examine the option of applying sampling strategies devel-oped for finite settings on general analog models with infinite cardinalities. To address

128 Moshe Mishali and Yonina C. Eldar
this option, we compare hardware and digital complexities of the RD and MWC sys-tems when treating multiband inputs, and imaging performance of quantized [31–33]vs. analog radar [29]. In order to obtain a close approximation to union modeling, asufficiently dense discretization of the input is required, which in turn can degrade per-formance in various practical metrics. Thus, whilst methods such as [30–33] are effectivefor the models for which they were developed, their application to general analog sig-nals, presumably by discretization, may limit the range of signal classes that can betreated.
3.8.1 Random demodulator
The RD approach treats signals consisting of a discrete set of harmonic tones with thesystem that is depicted in Figure 3.21 [30].
Signal model A multitone signal f(t) consists of a sparse combination of integralfrequencies:
f(t) =∑ω∈Ω
aωej2πωt, (3.42)
where Ω is a finite set of K out of an even number Q of possible harmonics
Ω ⊂ 0,±∆,±2∆, . . .,±(0.5Q− 1)∆,0.5Q∆ . (3.43)
The model parameters are the tone spacing ∆, number of active tones K, and grid lengthQ. The Nyquist rate is Q∆. Whenever normalized, ∆ is omitted from formulae under theconvention that all variables take nominal values (e.g., R = 10 instead of R = 10 Hz).
Sampling The input signal f(t) is mixed by a pseudorandom chipping sequence pc(t)
which alternates at a rate of W . The mixed output is then integrated and dumped at aconstant rate R, resulting in the sequence y[n], 1≤n≤R. The development in [30] usesthe following parameter setup
∆ = 1, W = Q, R ∈ Z such thatW
R∈ Z. (3.44)
t = nR
f(t) y[n]
Pseudorandom
±1 generator at
rate W
Seed
pc(t)
t
t− 1R
“CS block”
Solve
0
∆
Q∆2
(Q−1)∆2
s Signal sythesis f(t)
Multitone model
(3.46) (3.43)
Figure 3.21 Block diagram of the random demodulator. Adapted from [30], © [2010] IEEE.

Xampling: compressed sensing of analog signals 129
It was proven in [30] that if W/R is an integer and (3.44) holds, then the vector ofsamples y = [y[1], . . . ,y[R]]T can be written as
y = Φx, x = Fs, ‖s‖0 ≤ K. (3.45)
The matrix Φ has dimensions R×W , effectively capturing the mechanism of integrationover W/R Nyquist intervals, where the polarity of the input is flipped on each intervalaccording to the chipping function pc(t). See Figure 3.23(a) in the sequel for furtherdetails on Φ. The W -squared DFT matrix F accounts for the sparsity in the frequencydomain. The vector s has Q entries sω which are up to a constant scaling from thecorresponding tone amplitudes aω. Since the signal has only K active tones, ‖s‖0 ≤ K.
Reconstruction Equation (3.45) is an underdetermined system that can be solved withexisting CS algorithms, e.g., 1 minimization or greedy methods. As before, a “nice”CS matrix Φ is required in order to solve (3.45) with sparsity order K efficiently withexisting polynomial-time algorithms. In Figure 3.21, the CS block refers to solving (3.45)with a polynomial-time CS algorithm and a “nice” Φ, which requires a sampling rate onthe order of [30]
R ≈ 1.7K log(W/K +1). (3.46)
Once the sparse s is found, the amplitudes aω are determined from sω by constant scaling,and the output f(t) is synthesized according to (3.42).
3.8.2 Finite-model sensitivity
The RD system is sensitive to inputs with tones slightly displaced from the theoreticalgrid, as was indicated by several studies [14,84,85]. For example, [14] repeated the devel-opments of [30] for an unnormalized multitone model, with ∆ as a free parameter andW,R that are not necessarily integers. The measurements still obey the underdeterminedsystem (3.45) as before, where now [14]
W = Q∆, R = NR∆,W
R∈ Z, (3.47)
and NR is the number of samples taken by the RD. The equalities in (3.47) imply thatthe rates W,R need to be perfectly synchronized with the tones spacing ∆. If (3.47) doesnot hold, either due to hardware imperfections so that the rates W,R deviate from theirnominal values, or due to model mismatch so that the actual spacing ∆ is different thanwhat was assumed, then the reconstruction error grows high.
The following toy-example demonstrates this sensitivity. Let W = 1000,R = 100 Hz,with ∆ = 1 Hz. Construct f(t) by drawing K = 30 locations uniformly at random onthe tones grid and normally distributed amplitudes aω. Basis pursuit gave exact recoveryf(t) = f(t) for ∆ = 1. For 5 part-per-million (ppm) deviation in ∆ the squared-errorreached 37%:
∆ = 1+0.000005 → ‖f(t)− f(t)‖2
‖f(t)‖2 = 37%. (3.48)

130 Moshe Mishali and Yonina C. Eldar
0.32 0.34 0.36 0.38 0.4−50
0
50
Time (sec)
Am
plitu
de
Perfect sync. (∆=1)
(a)
0.32 0.34 0.36 0.38 0.4−50
0
50
Time (sec)
Am
plitu
de
5 ppm deviation (∆=1.000005)
(b)
−500 0 5000
1
2
3
4
5
Frequency (Hz)
Am
plitu
de
(×10
4)
Perfect sync. (∆=1)
(c)
−500 0 5000
1
2
3
4
5
Frequency (Hz)
Am
plitu
de
(×104)
5 ppm deviation (∆=1.000005)
(d)
Figure 3.22 Effects of non-integral tones on the output of the random demodulator. Panels (a),(b) plot therecovered signal in the time domain. The frequency contents are compared in panels (c),(d).Adapted from [14], © [2011] IEEE.
Figure 3.22 plots f(t) and f(t) in time and frequency, revealing many spurious tonesdue to the model mismatch. The equality W = Q in the normalized setup (3.44) hintsat the required synchronization, though the dependency on the tones spacing is implicitsince ∆ = 1. With ∆ = 1, this issue appears explicitly.
The sensitivity that is demonstrated in Figure 3.22 is a source of error already in thefinite multitone setting (3.42). The implication is that utilizing the RD for the counterpartproblem of sampling multiband signals with continuous spectra requires a sufficientlydense grid of tones. Otherwise, a non-negligible portion of the multiband energy residesoff the grid, which can lead to recovery errors due to the model mismatch. As discussedbelow, a dense grid of tones translates to high computational loads in the digital domain.
The MWC is less sensitive to model mismatches in comparison. Since only inequalitiesare used in (3.24), the number of branches p and aliasing rate fp can be chosen withsome safeguards with respect to the specified number of bands N and individual widthsB. Thus, the system can handle inputs with more than N bands and widths larger than
Xampling: compressed sensing of analog signals 131
B, up to the safeguards that were set. The band positions are not restricted to any specificdisplacement with respect to the spectrum slices; a single band can split between slices,as depicted in Figure 3.6. Nonetheless, both the PNS [19] and MWC [20] approachesrequire specifying the multiband spectra by a pair of maximal quantities (N,B). Thismodeling can be inefficient (in terms of resulting sampling rate) when the individual bandwidths are significantly different from each other. For example, a multiband model withN1 bands of lengths B1 = k1b and N2 bands of lengths B2 = k2b is described by a pair(N1 +N2,max(B1,B2)), with spectral occupation potentially larger than actually used.A more flexible modeling in this scenario would assume only the total actual bandwidthbeing occupied, i.e., N1B1 +N2B2. This issue can partially be addressed at the expenseof hardware size by designing the system (PNS/MWC) to accommodate N1k1 +N2k2
bands of lengths b.
3.8.3 Hardware complexity
We next compare the hardware complexity of the RD/MWC systems. In both approaches,the acquisition stage is mapped into an underdetermined CS system: Figure 3.21 leadsto a standard sparse recovery problem (3.45) in the RD system, while in the MWCapproach, Figure 3.10 results in an IMV problem (3.11). A crucial point is that thehardware needs to be sufficiently accurate for that mapping to hold, since this is thebasis for reconstruction. While the RD and MWC sampling stages seem similar, theyrely on different analog properties of the hardware to ensure accurate mapping to CS,which in turn imply different design complexities.
To better understand this issue, we examine Figure 3.23.The figure depicts the Nyquist-equivalent of each method, which is the system that samples the input at its Nyquist rateand then computes the relevant sub-Nyquist samples by applying the sensing matrixdigitally. The RD-equivalent integrates and dumps the input at rate W , and then appliesΦ on Q serial measurements, x = [x[1], . . .,x[Q]]T . To coincide with the sub-Nyquistsamples of Figure 3.21, Φ = HD is used, where D is diagonal with ±1 entries, accord-ing to the values pc(t) takes on t = n/W , and H sums over W/R entries [30]. TheMWC-equivalent has M channels, with the th channel demodulating the relevant spec-trum slice to the origin and sampling at rate 1/T , which results in d[n]. The sensingmatrix A is applied on d[n]. While sampling according to the equivalent systems ofFigure 3.23 is a clear waste of resources, it enables us to view the internal mecha-nism of each strategy. Note that the reconstruction algorithms remain the same; it doesnot matter whether the samples were actually obtained at a sub-Nyquist rate, accord-ing to Figures 3.21 or 3.10, or if they were computed after sampling according toFigure 3.23.
Analog compression In the RD approach, time-domain properties of the hardwaredictate the necessary accuracy. For example, the impulse-response of the integratorneeds to be a square waveform with a width of 1/R seconds, so that H has exactly W/R
consecutive 1’s in each row. For a diagonal D, the sign alternations of pc(t) need to besharply aligned on 1/W time intervals. If either of these properties is non-ideal, then the

132 Moshe Mishali and Yonina C. Eldar
f(t) t
t− 1W
t = nW
Apply
sensing matrix Φ1 · · · 1
1 · · · 1. . .1 · · · 1
WR
±1
±1
. . .
H D
x[1]
x[Q]
y[1]
y[NR]
Nyquist-rate
Nyquist-equivalent of RD
Nyquist-equivalent of MWC
(a)
x(t)
exp(j2 t/T )
h(t)
Apply
sensing matrix
A = cil
y[1]
y[m]
h(t)
h(t)
d1[n]
dM [n]
d [n]
Nyquist-rate
t = nT
(b)
Figure 3.23 The Nyquist-equivalents of the RD (a) and MWC (b) sample the input at its Nyquist rate andapply the sensing matrix digitally. Adapted from [14], © [2011] IEEE.
mapping to CS becomes nonlinear and signal dependent. Precisely, (3.45) becomes [30]
y = H(x)D(x)x. (3.49)
Anon-integer ratio W/R affects both H and D [30]. Since f(t) is unknown, x, H(x) andD(x) are also unknown. It is suggested in [30] to train the system on example signals,so as to approximate a linear system. Note that if (3.47) is not satisfied, then the DFTexpansion also becomes nonlinear and signal-dependent x = F(∆)s. The form factor ofthe RD is therefore the time-domain accuracy that can be achieved in practice.
The MWC requires periodicity of the waveforms pi(t) and lowpass response for h(t),which are both frequency-domain properties. The sensing matrix A is constant as longas pi(t) are periodic, regardless of the time-domain appearance of these waveforms.Therefore, non-ideal time-domain properties of pi(t) have no effect on the MWC. Theconsequence is that stability in the frequency domain dictates the form factor of theMWC. For example, 2 GHz periodic functions were demonstrated in a circuit prototypeof the MWC [22]. More broadly, circuit publications report the design of high-speedsequence generators up to 23 and even 80 GHz speeds [86, 87], where stable frequencyproperties are verified experimentally. Accurate time-domain appearance is not consid-ered a design factor in [86, 87], and is in fact not maintained in practice as shown in
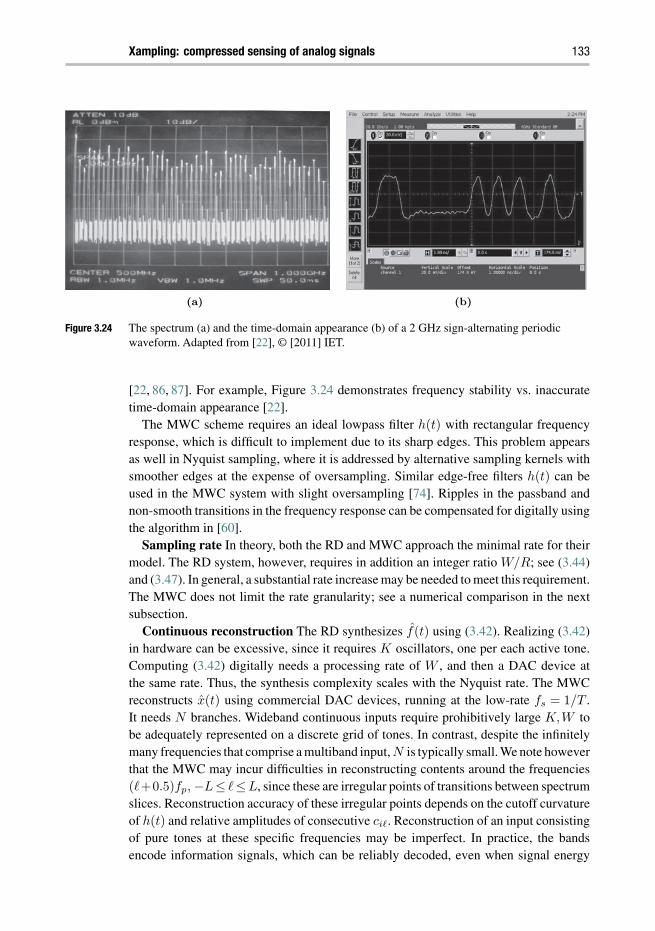
Xampling: compressed sensing of analog signals 133
(a) (b)
Figure 3.24 The spectrum (a) and the time-domain appearance (b) of a 2 GHz sign-alternating periodicwaveform. Adapted from [22], © [2011] IET.
[22, 86, 87]. For example, Figure 3.24 demonstrates frequency stability vs. inaccuratetime-domain appearance [22].
The MWC scheme requires an ideal lowpass filter h(t) with rectangular frequencyresponse, which is difficult to implement due to its sharp edges. This problem appearsas well in Nyquist sampling, where it is addressed by alternative sampling kernels withsmoother edges at the expense of oversampling. Similar edge-free filters h(t) can beused in the MWC system with slight oversampling [74]. Ripples in the passband andnon-smooth transitions in the frequency response can be compensated for digitally usingthe algorithm in [60].
Sampling rate In theory, both the RD and MWC approach the minimal rate for theirmodel. The RD system, however, requires in addition an integer ratio W/R; see (3.44)and (3.47). In general, a substantial rate increase may be needed to meet this requirement.The MWC does not limit the rate granularity; see a numerical comparison in the nextsubsection.
Continuous reconstruction The RD synthesizes f(t) using (3.42). Realizing (3.42)in hardware can be excessive, since it requires K oscillators, one per each active tone.Computing (3.42) digitally needs a processing rate of W , and then a DAC device atthe same rate. Thus, the synthesis complexity scales with the Nyquist rate. The MWCreconstructs x(t) using commercial DAC devices, running at the low-rate fs = 1/T .It needs N branches. Wideband continuous inputs require prohibitively large K,W tobe adequately represented on a discrete grid of tones. In contrast, despite the infinitelymany frequencies that comprise a multiband input, N is typically small. We note howeverthat the MWC may incur difficulties in reconstructing contents around the frequencies(+0.5)fp, −L≤ ≤L, since these are irregular points of transitions between spectrumslices. Reconstruction accuracy of these irregular points depends on the cutoff curvatureof h(t) and relative amplitudes of consecutive ci. Reconstruction of an input consistingof pure tones at these specific frequencies may be imperfect. In practice, the bandsencode information signals, which can be reliably decoded, even when signal energy

134 Moshe Mishali and Yonina C. Eldar
Table 3.1. Model and hardware comparison
RD (multitone) MWC (multiband)
Model parameters K,Q,∆ N,B,fmax
System parameters R,W,NR m,1/TSetup (3.44) (3.24)
Sensitive, Eq. (3.47), Figure 3.22 Robust
Form factor time-domain appearance frequency-domain stabilityRequirements accurate 1/R integration periodic pi(t)
sharp alternations pc(t)ADC topology integrate-and-dump commercialRate gap due to (3.44) approach minimalDAC 1 device at rate W N devices at rate fs
is located around the frequencies (l + 0.5)fp. As discussed in Section 3.5.6, when thebands contain digital transmissions and the SNR is sufficiently high, algorithm Back-DSP [14] enables recovery of the underlying information bits, and in turn allows DSP ata low rate, even when a band energy is split between adjacent slices. This algorithm alsoallows reconstruction of x(t) with only N DAC devices instead of 2N that are requiredfor arbitrary multiband reconstruction. Table 3.1 summarizes the model and hardwarecomparison.
3.8.4 Computational loads
In this subsection, we compare computational loads when treating multiband signals,either using the MWC system or in the RD framework by discretizing the continuousfrequency axis to a grid of Q = fNYQ tones, out of which only K = NB are active [30].We emphasize that the RD system was designed for multitone inputs, though for thestudy of computational loads we examine the RD on multiband inputs by considering acomparable grid of tones of the same Nyquist bandwidth. Table 3.2 compares between theRD and MWC for an input with 10 GHz Nyquist rate and 300 MHz spectral occupancy.For the RD we consider two discretization configurations, ∆ = 1 Hz and ∆ = 100 Hz.The table reveals high computational loads that stem from the dense discretization thatis required to represent an analog multiband input. We also included the sampling rateand DAC speeds to complement the previous section. The notation in the table is self-explanatory, though a few aspects are emphasized below.
The sensing matrix Φ = HD of the RD has dimensions
Φ : R×W ∝ K ×Q (huge). (3.50)
The dimension scales with the Nyquist rate; already for Q = 1 MHz Nyquist-rate input,there are 1 million unknowns in (3.45). The sensing matrixAof the MWC has dimensions
A : m×M ∝ N × fNYQ
B(small). (3.51)
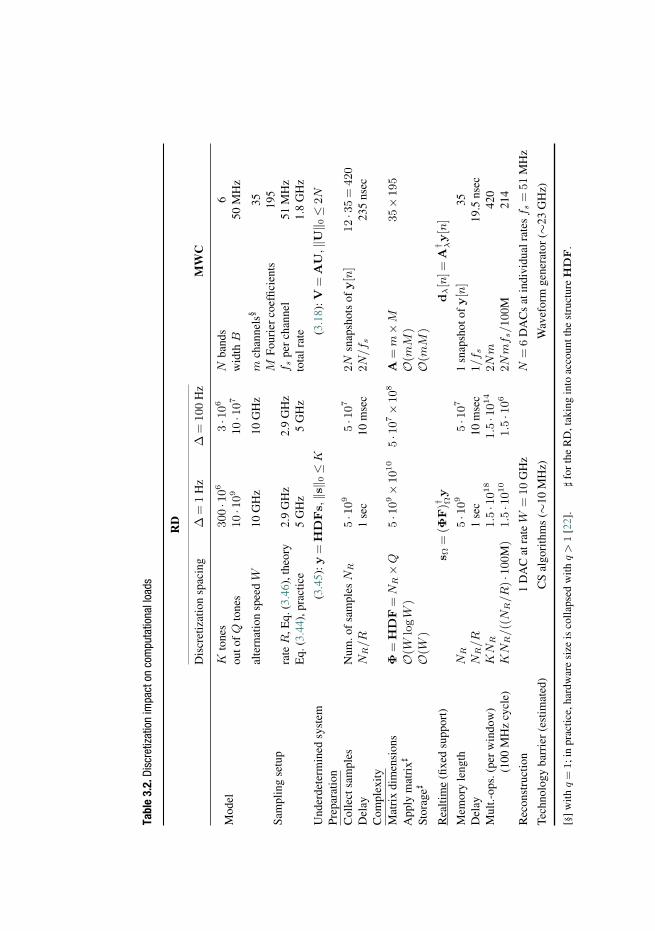
Tabl
e3.
2.Di
scre
tizat
ion
impa
cton
com
puta
tiona
lloa
ds
RD
Dis
cret
izat
ion
spac
ing
∆=
1H
z∆
=10
0H
zM
WC
Mod
elK
tone
s30
0·1
063
·106
Nba
nds
6ou
tofQ
tone
s10
·109
10·1
07w
idth
B50
MH
z
Sam
plin
gse
tup
alte
rnat
ion
spee
dW
10G
Hz
10G
Hz
mch
anne
ls§
35M
Four
ier
coef
ficie
nts
195
rate
R,E
q.(3
.46)
,the
ory
2.9
GH
z2.
9G
Hz
f spe
rch
anne
l51
MH
zE
q.(3
.44)
,pra
ctic
e5
GH
z5
GH
zto
talr
ate
1.8
GH
z
Und
erde
term
ined
syst
em(3
.45)
:y=
HD
Fs,
‖s‖ 0
≤K
(3.1
8):V
=A
U,‖U
‖ 0≤
2NPr
epar
atio
nC
olle
ctsa
mpl
esN
um.o
fsa
mpl
esN
R5
·109
5·1
072N
snap
shot
sof
y[n
]12
·35
=42
0D
elay
NR
/R
1se
c10
mse
c2N
/f s
235
nsec
Com
plex
ityM
atri
xdi
men
sion
sΦ
=H
DF
=N
R×
Q5
·109
×10
10
5·1
07×
108
A=
m×
M35
×19
5A
pply
mat
rix
O(W
logW
)O
(mM
)St
orag
eO
(W)
O(m
M)
Rea
ltim
e(fi
xed
supp
ort)
s Ω=
(ΦF
)† Ωy
dλ[n
]=A
† λy[n
]
Mem
ory
leng
thN
R5
·109
5·1
071
snap
shot
ofy[n
]35
Del
ayN
R/R
1se
c10
mse
c1/
f s19
.5ns
ecM
ult.-
ops.
(per
win
dow
)K
NR
1.5
·101
81.
5·1
014
2Nm
420
(100
MH
zcy
cle)
KN
R/((
NR
/R
)·10
0M)
1.5
·101
01.
5·1
062N
mf s
/10
0M21
4
Rec
onst
ruct
ion
1D
AC
atra
teW
=10
GH
zN
=6
DA
Cs
atin
divi
dual
rate
sf s
=51
MH
z
Tech
nolo
gyba
rrie
r(e
stim
ated
)C
Sal
gori
thm
s(∼
10M
Hz)
Wav
efor
mge
nera
tor
(∼23
GH
z)
[§]
with
q=
1;in
prac
tice,
hard
war
esi
zeis
colla
psed
with
q>
1[2
2].
fo
rth
eR
D,t
akin
gin
toac
coun
tthe
stru
ctur
eH
DF
.

136 Moshe Mishali and Yonina C. Eldar
For the comparable spectral occupancy we consider, Φ has dimensions that are six toeight orders of magnitude higher, in both the row and column dimensions, than theMWC sensing matrix A. The size of the sensing matrix is a prominent factor since itaffects many digital complexities: the delay and memory length that are associated withcollecting the measurements, the number of multiplications when applying the sensingmatrix on a vector, and the storage requirement of the matrix. See the table for a numericalcomparison of these factors.
We also compare the reconstruction complexity, in the more simple scenario that thesupport is fixed. In this setting, the recovery is merely a matrix-vector multiplicationwith the relevant pseudo-inverse. As before, the size of Φ results in long delay and hugememory length for collecting the samples. The number of scalar multiplications (Mult.-ops.) for applying the pseudo-inverse reveals again orders of magnitude differences. Weexpressed the Mult.-ops. per block of samples, and in addition scaled them to operationsper clock cycle of a 100 MHz DSP processor.
We conclude the table with our estimation of the technology barrier of each approach.Computational loads and memory requirements in the digital domain are the bottleneckof the RD approach. Therefore the size of CS problems that can be solved with availableprocessors limits the recovery. We estimate that W ≈ 1 MHz may be already quitedemanding using convex solvers, whereas W ≈ 10 MHz is probably the barrier usinggreedy methods.3 The MWC is limited by the technology for generating the periodicwaveforms pi(t), which depends on the specific choice of waveform. The estimatedbarrier of 23 GHz refers to implementation of the periodic waveforms according to[86, 87], though realizing a full MWC system at these high rates can be a challengingtask. Our barrier estimates are roughly consistent with the hardware publications ofthese systems: [89, 90] report the implementation of (single, parallel) RD for Nyquist-rate W = 800 kHz. An MWC prototype demonstrates faithful reconstruction of fNYQ =
2 GHz wideband inputs [22].
3.8.5 Analog vs. discrete CS radar
The question of whether finite modeling can be used to treat general analog scenarioswas also studied in [29] in the context of radar imaging. Here, rate reduction can betranslated to increased resolution and decreased time–bandwidth product of the radarsystem.
An intercepted radar signal x(t) has the form
x(t) =
K∑k=1
αkh(t− tk)ej2πνkt (3.52)
with each triplet (tk,νk,αk) corresponding to an echo of the radar waveform h(t) froma distinct target [91]. Equation (3.52) represents an infinite union, parameterized by
3 A bank of RD channels was studied in [88], the parallel system duplicates the analog issues and itscomputational complexity is not improved by much.
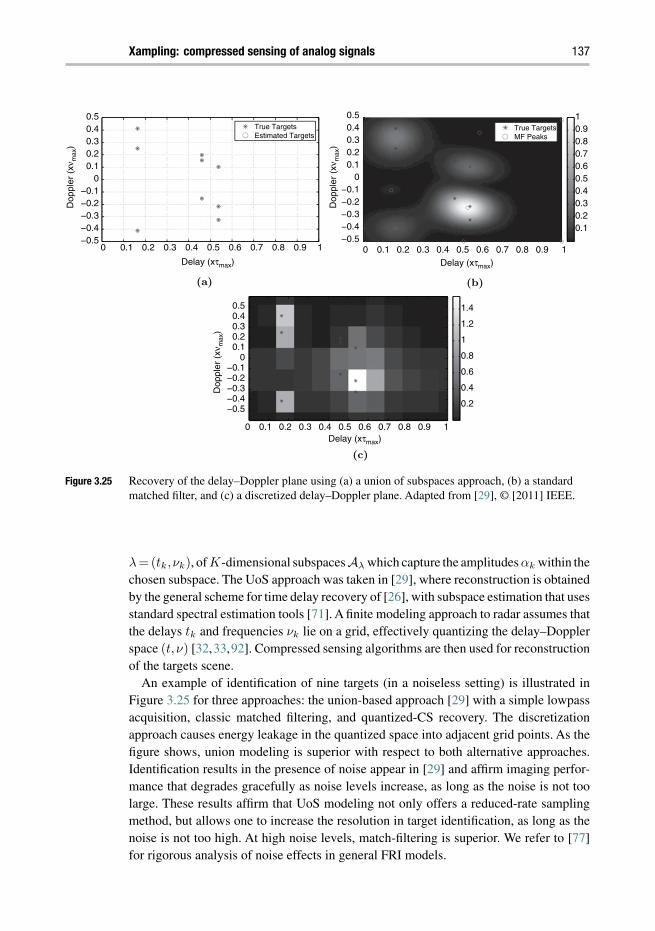
Xampling: compressed sensing of analog signals 137
0 0.1 0.2 0.3 0.4 0.5 0.6 0.7 0.8 0.9 1−0.5−0.4−0.3−0.2−0.1
00.10.20.30.40.5
True TargetsEstimated Targets
(a)
0 0.1 0.2 0.3 0.4 0.5 0.6 0.7 0.8 0.9 1−0.5−0.4−0.3−0.2−0.1
00.10.20.30.40.5
Delay (xτmax) Delay (xτmax)
Delay (xτmax)
Dop
pler
(xν
max
)
Dop
pler
(xν
max
)
Dop
pler
(xν
max
)
0.10.20.30.40.50.60.70.80.91
True TargetsMF Peaks
(b)
0 0.1 0.2 0.3 0.4 0.5 0.6 0.7 0.8 0.9 1
−0.5−0.4−0.3−0.2−0.1
00.10.20.30.40.5
0.2
0.4
0.6
0.8
1
1.2
1.4
(c)
Figure 3.25 Recovery of the delay–Doppler plane using (a) a union of subspaces approach, (b) a standardmatched filter, and (c) a discretized delay–Doppler plane. Adapted from [29], © [2011] IEEE.
λ=(tk,νk), of K-dimensional subspacesAλ which capture the amplitudes αk within thechosen subspace. The UoS approach was taken in [29], where reconstruction is obtainedby the general scheme for time delay recovery of [26], with subspace estimation that usesstandard spectral estimation tools [71]. A finite modeling approach to radar assumes thatthe delays tk and frequencies νk lie on a grid, effectively quantizing the delay–Dopplerspace (t,ν) [32,33,92]. Compressed sensing algorithms are then used for reconstructionof the targets scene.
An example of identification of nine targets (in a noiseless setting) is illustrated inFigure 3.25 for three approaches: the union-based approach [29] with a simple lowpassacquisition, classic matched filtering, and quantized-CS recovery. The discretizationapproach causes energy leakage in the quantized space into adjacent grid points. As thefigure shows, union modeling is superior with respect to both alternative approaches.Identification results in the presence of noise appear in [29] and affirm imaging perfor-mance that degrades gracefully as noise levels increase, as long as the noise is not toolarge. These results affirm that UoS modeling not only offers a reduced-rate samplingmethod, but allows one to increase the resolution in target identification, as long as thenoise is not too high. At high noise levels, match-filtering is superior. We refer to [77]for rigorous analysis of noise effects in general FRI models.

138 Moshe Mishali and Yonina C. Eldar
A property of great interest in radar applications is the time–bandwidth WT productof the system, where W refers to the bandwidth of the transmitted pulse h(t) and T indi-cates the round-trip time between radar station and targets. Ultimately we would like tominimize both quantities, sinceW impacts antenna size and sampling rate, whileT posesa physical limitation on latency, namely the time it takes to identify targets. Uncertaintyprinciples, though, imply that we cannot minimize both W and T simultaneously. Theanalog CS radar approach results in minimal time–bandwidth product, much lower thanthat obtained using standard matched-filtering techniques; see [29] for a precise com-parison. Practical aspects of sparsity-based radar imaging, such as improved decodingtime of target identification from compressive measurements as well as efficient matrixstructures for radar sensing, are studied in [93].
3.9 Discussion
Table 3.3 summarizes the various applications we surveyed, suggesting that Xamplingis broad enough to capture a multitude of engineering solutions, under the same logicalflow of operations. We conclude with a discussion on the properties and insights intoanalog sensing highlighted throughout this chapter.
3.9.1 Extending CS to analog signals
The influential works by Donoho [3] and Candès et al. [4] coined the CS terminol-ogy, in which the goal is to reduce the sampling rate below Nyquist. These pioneeringworks established CS via a study of underdetermined systems, where the sensing matrixabstractly replaces the role of the sampling operator, and the ambient dimensions repre-sent the high Nyquist rate. In practice, however, the study of underdetermined systemsdoes not hint at the actual sub-Nyquist sampling of analog signals. One cannot apply asensing matrix on a set of Nyquist rate samples, as performed in the conceptual systemsin Figure 3.23, since that would contradict the whole idea of reducing the sampling rate.The previous sections demonstrate how extensions of CS to continuous signals can besignificantly different in many practical aspects. Based on the insights gained, we drawseveral operative conclusions in Table 3.4 regarding the choice of analog compressionP in continuous-time CS systems. The first point follows immediately from Figure 3.22and basically implies that model and sampler parameters should not be tightly related,implicitly or explicitly. We elaborate below on the other two suggestions.
Input signals are eventually generated by some source, which has its own accuracyspecifications. Therefore, if designing P imposes constraints on the hardware that arenot stricter than those required to generate the input signal, then there are no essentiallimitations on the input range. We support this conclusion by several examples. TheMWC requires accuracy that is achieved with RF technology, which also defines thepossible range of multiband transmissions. The same principle of shifting spectral slicesto the origin with different weights can be achieved by PNS [19]. This strategy, however,can result in a narrower input range that can be treated, since current RF technology

Tabl
e3.
3.Ap
plic
atio
nsof
unio
nof
subs
pace
s
Car
dina
lity
Sign
alA
nalo
gSu
bspa
ceA
pplic
atio
nm
odel
unio
nsu
bspa
ces
com
pres
sion
dete
ctio
n
Spar
se-S
I[1
6]se
e(3
.10)
finite
∞fil
ter-
bank
,Fig
ure
3.4
CT
F
PNS
[19]
mul
tiban
d,Fi
gure
3.6
finite
∞tim
esh
ifts
CT
F[4
5]
MW
C[2
0]m
ultib
and,
Figu
re3.
6fin
ite∞
peri
odic
mix
ing
+lo
wpa
ssC
TF
[45]
RD
[30]
f(t
)=
∑ ω
aωej
2π
ωt
finite
finite
sign
flipp
ing
+C
S
ω∈
disc
rete
grid
Ωin
tegr
ate-
dum
p
FRI
x(t
)=
L ∑ =
1d
g(t
−t
)
peri
odic
[24,
94]
x(t
)=
x(t
+T
)∞
finite
low
pass
anni
hila
ting
filte
r[2
4,94
]fin
ite[2
5]0
≤t≤
T∞
finite
splin
esm
omen
tsfa
ctor
ing
[25]
peri
odic
/fini
te[2
7,28
]ei
ther
ofth
eab
ove
∞fin
iteSo
Sfil
teri
ngan
nihi
latin
gfil
ter
Sequ
ence
sof
see
(3.3
9)∞
∞lo
wpa
ss,o
rM
USI
C[5
]or
inno
vatio
n[2
6,28
]pe
riod
icm
ixin
g+
inte
grat
e-du
mp
ESP
RIT
[6]
NY
FR[9
5]m
ultib
and
finite
∞jit
tere
dun
ders
ampl
ing
n/a

140 Moshe Mishali and Yonina C. Eldar
Table 3.4. Suggested guidelines for extending CS to analog signals
#1 set system parameters with safeguards to accommodate possible modelmismatches
#2 incorporate design constraints on P that suit the technology generatingthe source signals
#3 balance between nonlinear (subspace detection) and linear (interpola-tion) reconstruction complexities
can generate source signals at frequencies that exceed front-end bandwidths of existingADC devices [20]. Multiband inputs generated by optical sources, however, may requirea different compression stage P than that of the RF-based MWC system.
Along the same line, time-domain accuracy constraints may limit the range of multi-tone inputs that can be treated in the RD approach, if these signals are generated by RFsources. On the other hand, consider a model of piecewise constant inputs, with knotsat the integers and only K non-identically zero pieces out of Q. Sampling these signalswith the RD system would map to (3.45), but with an identity basis instead of the DFTmatrix F. In this setting, the time-domain accuracy required to ensure that the mappingto (3.45) holds is within the tolerances of the input source.
Moving on to our third suggestion, we attempt to reason the computational loadsencountered in Table 3.2. Over 1 second, both approaches reconstruct their inputs froma comparable set of numbers; K = 300 · 106 tone coefficients or 2Nfs = 612 · 106
amplitudes of active sequences d[n]. The difference is, however, that the RD recoversall these unknowns by a single execution of a nonlinear CS algorithm on the system(3.45), which has large dimensions. In contrast, the MWC splits the recovery task to asmall-size nonlinear part (i.e., CTF) and real-time linear interpolation. This distinctioncan be traced back to model assumptions. The nonlinear part of a multitone model,namely the number of subspaces |Λ| =
(QK
), is exponentially larger than
(M2N
)which
specifies a multiband union of the same Nyquist bandwidth. Clearly, a prerequisite forbalancing computation loads is an input model with as many unknowns as possible in itslinear part (subspaces Aλ), so as to decrease the nonlinear cardinality |Λ| of the union.The important point is that in order to benefit from such modeling, P must be properlydesigned to incorporate this structure and reduce computational loads.
For example, consider a block-sparse multitone model with K out of Q tones, suchthat the active tones are clustered in K/d blocks of length d. A plain RD system whichdoes not incorporate this block structure would still result in a large R × W sensingmatrix with its associated digital complexities. Block-sparse recovery algorithms, e.g.,[43], can be used to partially decrease the complexity, but the bottleneck remains the factthat the hardware compression is mapped to a large sensing matrix.4 A potential analog
4 Note that simply modifying the chipping and integrate-dumping intervals, in the existing scheme ofFigure 3.21, to d times larger results in a sensing matrix smaller by the same factor, though (3.45) in thissetting would force reconstructing each block of tones by a single tone, presumably corresponding to amodel of K/d active tones out of Q/d at spacing d∆.

Xampling: compressed sensing of analog signals 141
compression for this block-sparse model can be an MWC system designed for N = K/d
and B = d∆ specifications.Our conclusions here stem from the study of the RD and MWC systems, and are
therefore mainly relevant for choosing P in Xampling systems that map their hardwareto underdetermined systems and incorporate CS algorithms for recovery. Nonetheless,our suggestions above do not necessitate such a relation to CS, and may hold moregenerally with regard to other compression techniques.
Finally, we point out the Nyquist-folding receiver (NYFR) of [95] which suggests aninteresting alternative route towards sub-Nyquist sampling. This method introduces adeliberate jitter in an undersampling grid, which results in induced phase modulationsat baseband such that the modulation magnitudes depend on the unknown carrier posi-tions. This strategy is exceptional as it relies on a time-varying acquisition effect, whichdeparts from the linear time-invariant P that unifies all the works we surveyed herein.In principle, to enable recovery, one would need to infer the magnitudes of the phasemodulations. A reconstruction algorithm was not reported yet for this class of sampling,which is why we do not elaborate further on this method. Nonetheless, this is an interest-ing venue for developing sub-Nyquist strategies and opens a wide range of possibilitiesto explore.
3.9.2 Is CS a universal sampling scheme?
The discussion on extending CS to analog signals draws an interesting connection to thenotion of CS universality. In the discrete setup of sensing, the measurement model isy=Φx and the signal is sparse in some given transform basis x=Ψs. The concept of CSuniversality refers to the attractive property of sensing with Φ without knowledge of Ψ,so that Ψ enters only in the reconstruction algorithm. This notion is further emphasizedwith the default choice of the identity basis Ψ = I in many CS publications, whichis justified by no loss of generality, since Ψ is conceptually absorbed into the sensingmatrix Φ.
In contrast, in many analog CS systems, the hardware design benefits from incor-porating knowledge on the sparsity basis of the input. Refer to the Nyquist-equivalentsystem of the MWC in Figure 3.23(b), for example. The input x(t) is conceptually firstpreprocessed into a set of high-rate streams of measurements d[n], and then a sensingmatrix A = ci is applied to reduce the rate. In PNS [20], the same set of streamsd[n] is sensed by the partial DFT matrix (3.22), which depends on the time shifts ci ofthe PNS sequences. This sensing structure also appears in Theorem 3.1, where the termG−∗(ejωT )s(ω) in (3.12) first generates d[n], and then a sensing matrix A is applied.In all these scenarios, the intermediate sequences d[n] are sparse for all n, so that thesensing hardware effectively incorporates knowledge on the (continuous) sparsity basisof the input.
Figure 3.26 generalizes this point. The analog compression stage P in Xamplingsystems can be thought of as a two-stage sampling system. First, a sparsifying stagewhich generates a set of high-rate streams of measurements, out of which only a feware nonidentically zero. Second, a sensing matrix is applied, where in principle, any

142 Moshe Mishali and Yonina C. Eldar
x(t) Sparsifying
stageSensing matrix
A
Low-rate ADCs
Analog compression P
(Universal)
Figure 3.26 Analog compression operator P in X-ADC architecture consists of a sparsifying stage andsensing matrix, which are combined into one efficient analog preprocessing stage.
sensing matrix can be used in that stage. In practice, however, the trick is to choose asensing matrix which can be combined with the sparsifying part into a single hardwaremechanism, so that the system does not actually go through Nyquist-rate sampling.This combination is achieved by periodic mixing in the MWC system, time delaysin the case of PNS, and the filters w(t) in the sparse-SI framework of Theorem 3.1.We can therefore suggest a slightly different interpretation of the universality conceptfor analog CS systems, which is the flexibility to choose any sensing matrix A in thesecond stage of P , provided that it can be efficiently combined with the given sparsifyingstage.
3.9.3 Concluding remarks
Starting from the work in [15], union of subspaces models appear at the frontier ofresearch on sampling methods. The ultimate goal is to build a complete sampling theoryfor UoS models of the general form (3.3) and then derive specific sampling solutions forapplications of interest. Although several promising advances have already been made[15, 16, 26, 41, 44], this esteemed goal is yet to be accomplished.
In this chapter we described a line of works which extend CS ideas to the analogdomain based on UoS modeling. The Xampling framework of [14] unifies the treatmentof several classes of UoS signals, by leveraging insights and pragmatic considerationsinto the generic architecture of Figure 3.2.
Our hope is that the template scheme of Figure 3.2 can serve as a substrate for devel-oping future sampling strategies for UoS models, and inspire future developments thatwill eventually lead to a complete generalized sampling theory in unions of subspaces.
Acknowledgements
The authors would like to thank Kfir Gedalyahu and Ronen Tur for their collaborationon many topics related to this review and for authorizing the use of their figures, andWaheed Bajwa for many useful comments.

Xampling: compressed sensing of analog signals 143
References
[1] C. E. Shannon. Communication in the presence of noise. Proc IRE, 37:10–21, 1949.[2] H. Nyquist. Certain topics in telegraph transmission theory. Trans AIEE, 47(2):617–644, 1928.[3] D. L. Donoho. Compressed sensing. IEEE Trans Inf Theory, 52(4):1289–1306, 2006.[4] E. J. Candès, J. Romberg, and T. Tao. Robust uncertainty principles: Exact signal reconstruc-
tion from highly incomplete frequency information. IEEE Trans Inf Theory, 52(2):489–509,2006.
[5] R. Schmidt. Multiple emitter location and signal parameter estimation. IEEE Trans. Anten-nas Propag, 34(3):276–280, 1986. First presented at RADC Spectrum Estimation Workshop,Griffiss AFB, NY, 1979.
[6] R. Roy and T. Kailath. ESPRIT-estimation of signal parameters via rotational invariancetechniques. IEEE Trans Acoust, Speech Sig Proc, 37(7):984–995, 1989.
[7] P. Stoica and Y. Selen. Model-order selection: A review of information criterion rules. IEEESig Proc Mag, 21(4):36–47, 2004.
[8] S. Baker, S. K. Nayar, and H. Murase. Parametric feature detection. Int J Comp Vision, 27(1):27–50, 1998.
[9] J. Crols and M. S. J. Steyaert. Low-IF topologies for high-performance analog front ends offully integrated receivers. IEEE Trans Circ Syst II: Analog Digital Sig Proc, 45(3):269–282,1998.
[10] R. G. Vaughan, N. L. Scott, and D. R. White. The theory of bandpass sampling. IEEE TransSig Proc, 39(9):1973–1984, 1991.
[11] Y. P. Lin and P. P. Vaidyanathan. Periodically nonuniform sampling of bandpass signals. IEEETrans Circu Syst II, 45(3):340–351, 1998.
[12] C. Herley and P. W. Wong. Minimum rate sampling and reconstruction of signals with arbitraryfrequency support. IEEE Trans Inf Theory, 45(5):1555–1564, 1999.
[13] R. Venkataramani and Y. Bresler. Perfect reconstruction formulas and bounds on aliasing errorin sub-Nyquist nonuniform sampling of multiband signals. IEEE Trans Inf Theory, 46(6):2173–2183, 2000.
[14] M. Mishali, Y. C. Eldar, and A. Elron. Xampling: Signal acquisition and processing in unionof subspaces. IEEE Trans Sig Proc, 59(10):4719–4734, 2011.
[15] Y. M. Lu and M. N. Do. A theory for sampling signals from a union of subspaces. IEEE TransSig Proc, 56(6):2334–2345, 2008.
[16] Y. C. Eldar. Compressed sensing of analog signals in shift-invariant spaces. IEEE Trans SigProc, 57(8):2986–2997, 2009.
[17] M. Unser. Sampling – 50 years after Shannon. Proc IEEE, 88(4):569–587, 2000.[18] Y. C. Eldar and T. Michaeli. Beyond bandlimited sampling. IEEE Sig Proc Mag, 26(3):48–68,
2009.[19] M. Mishali and Y. C. Eldar. Blind multi-band signal reconstruction: compressed sensing for
analog signals. IEEE Trans Sig Proc, 57(3):993–1009, 2009.[20] M. Mishali and Y. C. Eldar. From theory to practice: Sub-Nyquist sampling of sparse wideband
analog signals. IEEE J Sel Topics Sig Proc, 4(2):375–391, 2010.[21] P. Feng and Y. Bresler. Spectrum-blind minimum-rate sampling and reconstruction of
multiband signals. Proc IEEE Int Conf ASSP, 3:1688–1691, 1996.[22] M. Mishali, Y. C. Eldar, O. Dounaevsky, and E. Shoshan. Xampling: Analog to digital at
sub-Nyquist rates. IET Circ Dev Syst, 5(1):8–20, 2011.
144 Moshe Mishali and Yonina C. Eldar
[23] M. Mishali and Y. C. Eldar. Wideband spectrum sensing at sub-Nyquist rates. IEEE Sig ProcMag, 28(4):102–135, 2011.
[24] M. Vetterli, P. Marziliano, and T. Blu. Sampling signals with finite rate of innovation. IEEETrans Sig Proc, 50(6):1417–1428, 2002.
[25] P. L. Dragotti, M. Vetterli, and T. Blu. Sampling moments and reconstructing signals of finiterate of innovation: Shannon meets Strang fix. IEEE Trans Sig Proc, 55(5):1741–1757, 2007.
[26] K. Gedalyahu and Y. C. Eldar. Time delay estimation from low-rate samples: A union ofsubspaces approach. IEEE Trans Sig Proc, 58(6):3017–3031, 2010.
[27] R. Tur, Y. C. Eldar, and Z. Friedman. Innovation rate sampling of pulse streams with applicationto ultrasound imaging. IEEE Trans Sig Proc, 59(4):1827–1842, 2011.
[28] K. Gedalyahu, R. Tur, and Y. C. Eldar. Multichannel sampling of pulse streams at the rate ofinnovation. IEEE Trans Sig Proc, 59(4):1491–1504, 2011.
[29] W. U. Bajwa, K. Gedalyahu, and Y. C. Eldar. Identification of parametic underspread linearsystems super-resolution radar. IEEE Trans Sig Proc, 59(6):2548–2561, 2011.
[30] J. A. Tropp, J. N. Laska, M. F. Duarte, J. K. Romberg, and R. G. Baraniuk. Beyond Nyquist:Efficient sampling of sparse bandlimited signals. IEEE Trans Inf Theory, 56(1):520–544, 2010.
[31] A. W. Habboosh, R. J. Vaccaro, and S. Kay. An algorithm for detecting closely spaceddelay/Doppler components. ICASSP 1997: 535–538, 1997.
[32] W. U. Bajwa,A. M. Sayeed, and R. Nowak. Learning sparse doubly-selective channels. AllertonConf Commun Contr Comput, 575–582, 2008.
[33] M. A. Herman and T. Strohmer. High-resolution radar via compressed sensing. IEEE TransSig Proc, 57(6):2275–2284, 2009.
[34] M. Unser and A. Aldroubi. A general sampling theory for nonideal acquisition devices. IEEETrans Sig Proc, 42(11):2915–2925, 1994.
[35] A. Aldroubi and K. Gröchenig. Non-uniform sampling and reconstruction in shift-invariantspaces. SIAM Rev, 43(4):585–620, 2001.
[36] T. G. Dvorkind, Y. C. Eldar, and E. Matusiak. Nonlinear and non-ideal sampling: Theory andmethods. IEEE Trans Sig Proc, 56(12):5874–5890, 2008.
[37] M. A. Davenport, P. T. Boufounos, M. B. Wakin, and R. G. Baraniuk. Signal processing withcompressive measurements. IEEE J Sel Topics Sig Proc, 4(2):445–460, 2010.
[38] M. Mishali and Y. C. Eldar. Sub-Nyquist sampling: Bridging theory and practice. IEEE SigProc Mag, 2011.
[39] M. Unser. Splines: A perfect fit for signal and image processing. IEEE Sig Proc Mag, 16(6):22–38, 1999.
[40] T. Blu and M. Unser. Quantitative Fourier analysis of approximation techniques: Part I –Interpolators and projectors. IEEE Trans Sig Proc, 47(10):2783–2795, 1999.
[41] Y. C. Eldar and M. Mishali. Robust recovery of signals from a structured union of subspaces.IEEE Trans Inf Theory, 55(11):5302–5316, 2009.
[42] M. Yuan and Y. Lin. Model selection and estimation in regression with grouped variables. JRoy Stat Soc Ser B Stat Methodol, 68(1):49–67, 2006.
[43] Y. C. Eldar, P. Kuppinger, and H. Bölcskei. Block-sparse signals: Uncertainty relations andefficient recovery. IEEE Trans Sig Proc, 58(6):3042–3054, 2010.
[44] R. G. Baraniuk, V. Cevher, M. F. Duarte, and C. Hegde. Model-based compressive sensing.IEEE Trans Inf Theory, 56(4):1982–2001, 2010.
[45] M. Mishali and Y. C. Eldar. Reduce and boost: Recovering arbitrary sets of jointly sparsevectors. IEEE Trans Sig Proc, 56(10):4692–4702, 2008.

Xampling: compressed sensing of analog signals 145
[46] J. A. Tropp. Algorithms for simultaneous sparse approximation. Part I: Greedy pursuit. SigProc (Special Issue on Sparse Approximations in Signal and Image Processing). 86:572–588,2006.
[47] J. A. Tropp. Algorithms for simultaneous sparse approximation. Part II: Convex relaxation. SigProc (Special Issue on Sparse Approximations in Signal and Image Processing). 86:589–602,2006.
[48] S. F. Cotter, B. D. Rao, K. Engan, and K. Kreutz-Delgado. Sparse solutions to linear inverseproblems with multiple measurement vectors. IEEE Trans Sig Proc, 53(7):2477–2488, 2005.
[49] J. Chen and X. Huo. Theoretical results on sparse representations of multiple-measurementvectors. IEEE Trans Sig Proc, 54(12):4634–4643, 2006.
[50] Y. C. Eldar and H. Rauhut.Average case analysis of multichannel sparse recovery using convexrelaxation. IEEE Trans Inf Theory, 56(1):505–519, 2010.
[51] M. E. Davies and Y. C. Eldar. Rank awareness in joint sparse recovery. To appear in IEEETrans Inf Theory.
[52] J. Mitola III. Cognitive radio for flexible mobile multimedia communications. Mobile Netw.Appl, 6(5):435–441, 2001.
[53] H. J. Landau. Necessary density conditions for sampling and interpolation of certain entirefunctions. Acta Math, 117:37–52, 1967.
[54] A. Kohlenberg. Exact interpolation of band-limited functions. J Appl Phys, 24:1432–1435,1953.
[55] W. Black and D. Hodges. Time interleaved converter arrays. In: Solid-State CircuitsConference. Digest of Technical Papers. 1980 IEEE Int, XXIII: 14–15.
[56] P. Nikaeen and B. Murmann. Digital compensation of dynamic acquisition errors at the front-end of high-performance A/D converters. IEEE Trans Sig Proc, 3(3):499–508, 2009.
[57] A/D Converters. Analog Devices Corp:[Online]. Available: www.analog.com/en/analog-to-digital-converters/ad-converters/products/index.html, 2009.
[58] Data converters. Texas Instruments Corp. 2009:[Online].Available: http://focus.ti.com/analog/docs/dataconvertershome.tsp.
[59] M. Mishali and Y. C. Eldar. Expected-RIP: Conditioning of the modulated wideband converter.Inform Theory Workshop, IEEE: 343–347, 2009.
[60] Y. Chen, M. Mishali, Y. C. Eldar, and A. O. Hero III. Modulated wideband converter withnon-ideal lowpass filters. ICASSP: 3630–3633, 2010.
[61] M. Mishali, R. Hilgendorf, E. Shoshan, I. Rivkin, and Y. C. Eldar. Generic sensing hardwareand real-time reconstruction for structured analog signals. ISCAS: 1748–1751, 2011.
[62] F. Gardner. Properties of frequency difference detectors. IEEE Trans Commun, 33(2):131–138,1985.
[63] Wireless LAN Medium Access Control (MAC) and Physical Layer (PHY) specifications:High-speed physical layer in the 5 GHz band. IEEE Std 80211a-1999.
[64] A. Quazi. An overview on the time delay estimate in active and passive systems for targetlocalization. IEEE Trans Acoust, Speech Sig Proc, 29(3):527–533, 1981.
[65] A. Bruckstein, T. J. Shan, and T. Kailath. The resolution of overlapping echos. IEEE TransAcoust, Speech, Sig Proc, 33(6):1357–1367, 1985.
[66] M. A. Pallas and G. Jourdain. Active high resolution time delay estimation for large BT signals.IEEE Trans Sig Proc, 39(4):781–788, 1991.
[67] Z. Q. Hou and Z. D. Wu. A new method for high resolution estimation of time delay. ICASSP’82. 7:420–423, 1982.
146 Moshe Mishali and Yonina C. Eldar
[68] H. Saarnisaari. TLS-ESPRIT in a time delay estimation. In: IEEE 47th Vehic Techn Conf,3:1619–1623, 1997.
[69] F. X. Ge, D. Shen, Y. Peng, and V. O. K. Li. Super-resolution time delay estimation in multipathenvironments. IEEE Trans Circ Syst, I: 54(9):1977–1986, 2007.
[70] D. Rife and R. Boorstyn. Single tone parameter estimation from discrete-time observations.IEEE Trans Inf Theory, 20(5):591– 598, 1974.
[71] P. Stoica and R. Moses. Introduction to Spectral Analysis. Upper Saddle River, NJ: Prentice-Hall; 1997.
[72] J. Kusuma and V. K. Goyal. Multichannel sampling of parametric signals with a successiveapproximation property. IEEE Int. Conf Image Proc (ICIP): 1265–1268, 2006.
[73] C. S. Seelamantula, and M. Unser.Ageneralized sampling method for finite-rate-of-innovation-signal reconstruction. IEEE Sig Proc Letters, 15:813–816, 2008.
[74] E. Matusiak and Y. C. Eldar. Sub-Nyquist sampling of short pulses: Theory. Submitted to IEEETrans Sig Theory; [Online] arXivorg 10103132. 2010 Oct;.
[75] Y. Hua and T. K. Sarkar. Matrix pencil method for estimating parameters of exponentiallydamped/undamped sinusoids in noise. IEEE Trans Acoust, Speech, Sig Proc, 38(5):814–824,1990.
[76] D. W. Tufts and R. Kumaresan. Estimation of frequencies of multiple sinusoids: Making linearprediction perform like maximum likelihood. Proc IEEE, 70(9):975–989, 1982.
[77] Z. Ben-Haim, T. Michaeli, and Y. C. Eldar. Performance bounds and design criteria for estimat-ing finite rate of innovation signals. Submitted to IEEE Trans Inf Theory; [Online] arXivorg10092221. 2010 Sep;.
[78] L. Baboulaz and P. L. Dragotti. Exact feature extraction using finite rate of innovation principleswith an application to image super-resolution. IEEE Trans Image Proc, 18(2):281–298, 2009.
[79] H. Krim and M. Viberg. Two decades of array signal processing research: The parametricapproach. IEEE Sig Proc Mag, 13(4):67–94, 1996.
[80] M. Z. Win and R. A. Scholtz. Characterization of ultra-wide bandwidth wireless indoorchannels: A communication-theoretic view. IEEE J Sel Areas Commun, 20(9):1613–1627,2002.
[81] A. Quazi. An overview on the time delay estimate in active and passive systems for targetlocalization. IEEE Trans Acoust, Speech, Sig Proc, 29(3):527–533, 1981.
[82] R. J. Urick. Principles of Underwater Sound. New York: McGraw-Hill; 1983.[83] G. L. Turin. Introduction to spread-spectrum antimultipath techniques and their application to
urban digital radio. Proc IEEE, 68(3):328–353, 1980.[84] M. F. Duarte and R. G. Baraniuk. Spectral compressive sensing;[Online]. Available:
www.math.princeton.edu/∼mduarte/images/SCS-TSP.pdf, 2010.[85] Y. Chi, A. Pezeshki, L. Scharf, and R. Calderbank. Sensitivity to basis mismatch in compressed
sensing. ICASSP 2010; 3930–3933, 2010.[86] E. Laskin and S. P. Voinigescu. A 60 mW per Lane, 4×23-Gb/s 27−1 PRBS Generator. IEEE
J Solid-State Circ, 41(10):2198–2208, 2006.[87] T. O. Dickson, E. Laskin, I. Khalid, et al. An 80-Gb/s 231 −1 pseudorandom binary sequence
generator in SiGe BiCMOS technology. IEEE J Solid-State Circ, 40(12):2735–2745, 2005.[88] Z. Yu, S. Hoyos, and B. M. Sadler. Mixed-signal parallel compressed sensing and reception
for cognitive radio. ICASSP 2008: 3861–3864, 2008.[89] T. Ragheb, J. N. Laska, H. Nejati, et al. A prototype hardware for random demodulation based
compressive analog-to-digital conversion. 51st Midwest Symp Circ Syst, 2008. MWSCAS:37–40, 2008.

Xampling: compressed sensing of analog signals 147
[90] Z. Yu, X. Chen, S. Hoyos, et al. Mixed-signal parallel compressive spectrum sensing forcognitive radios. Int J Digit Multimedia Broadcast, 2010.
[91] M. I. Skolnik. Introduction to Radar Systems. 3rd edn. New York: McGraw-Hill; 2001.[92] X. Tan, W. Roberts, J. Li, and P. Stoica. Range-Doppler imaging via a train of probing pulses.
IEEE Trans Sig Proc, 57(3):1084–1097, 2009.[93] L. Applebaum, S. D. Howard, S. Searle, and R. Calderbank. Chirp sensing codes: Determin-
istic compressed sensing measurements for fast recovery. Appl Comput Harmon Anal, 26(2):283–290, 2009.
[94] I. Maravic and M. Vetterli. Sampling and reconstruction of signals with finite rate of innovationin the presence of noise. IEEE Trans Sig Proc, 53(8):2788–2805, 2005.
[95] G. L. Fudge, R. E. Bland, M.A. Chivers, et al.ANyquist folding analog-to-information receiver.Proc 42nd Asilomar Conf Sig, Syst Comput: 541–545, 2008.
4 Sampling at the rate of innovation:theory and applicationsJose Antonio Urigüen, Yonina C. Eldar, Pier Luigi Dragotti,and Zvika Ben-Haim
Parametric signals, such as streams of short pulses, appear in many applications includingbio-imaging, radar, and spread-spectrum communication. The recently developed finiterate of innovation (FRI) framework has paved the way to low-rate sampling of suchsignals, by exploiting the fact that only a small number of parameters per unit of time areneeded to fully describe them. For example, a stream of pulses can be uniquely definedby the time delays of the pulses and their amplitudes, which leads to far fewer degreesof freedom than the signal’s Nyquist rate samples. This chapter provides an overviewof FRI theory, algorithms, and applications. We begin by discussing theoretical resultsand practical algorithms allowing perfect reconstruction of FRI signals from a minimalnumber of samples. We then turn to treat recovery from noisy measurements. Finally, weoverview a diverse set of applications of FRI theory, in areas such as super-resolution,radar, and ultrasound.
4.1 Introduction
We live in an analog world, but we would like our digital computers to interact with it.For example, sound is a continuous-time phenomenon, which can be characterized by thevariations in air pressure as a function of time. For digital processing of such real-worldsignals to be possible, we require a sampling mechanism which converts continuoussignals to discrete sequences of numbers, while preserving the information present inthose signals.
In classical sampling theory, which dates back to the beginning of the twentieth cen-tury [1–3], a bandlimited signal whose maximum frequency is fmax is sampled at orabove the Nyquist rate 2fmax. It is well known that the signal can then be perfectlyreconstructed from its samples. Unfortunately, real-world signals are rarely truly band-limited, if only because most signals have finite duration in time. Even signals whichare approximately bandlimited often have to be sampled at a fairly high Nyquist rate,requiring expensive sampling hardware and high-throughput digital machinery.
Compressed Sensing: Theory and Applications, ed. Yonina C. Eldar and Gitta Kutyniok. Published byCambridge University Press. © Cambridge University Press 2012.

Sampling at the rate of innovation: theory and applications 149
Classical sampling theory necessitates a high sampling rate whenever a signal has ahigh bandwidth, even if the actual information content in the signal is low. For instance,a piecewise linear signal is non-differentiable; it is therefore not bandlimited, and more-over, its Fourier transform decays at the fairly low-rate O(1/f2). However, the signalis completely described by the positions of knots (transitions between linear segments)and the signal values at those positions. Thus, as long as the knots are known to have aminimum separation, this signal has a finite information rate. It seems wasteful to samplesuch signals at the Nyquist rate. It would be more efficient to have a variety of samplingtechniques, tailored to different signal models, such as bandlimited or piecewise linearsignals. Such an approach echoes the fundamental quest of compressive sampling, whichis to capture only the essential information embedded in a signal. This chapter, togetherwith Chapter 3, on Xampling, applies the idea of compressed sensing to certain classesof analog signals. While the focus of Xampling is on signals lying in unions of subspacesand on developing a unified architecture for efficient sampling of various classes of sig-nals, here we concentrate on a comprehensive review of finite rate of innovation (FRI)theory.
To be specific, suppose that a function x(t) has the property that any finite durationsegment of length τ is completely determined by no more than K parameters. In thiscase, the function x(t) is said to have a local rate of innovation equal to K/τ [4], becauseit has no more than K degrees of freedom every τ seconds. In general, a signal is said tohave FRI if its local rate of innovation is finite for a sufficiently large τ . For example, theaforementioned piecewise linear signal has this property. Many important signal models,such as splines and pulse streams, also satisfy the FRI property, and will be explored indepth later in this chapter.
An elegant and powerful result is that, in many cases, certain types of FRI signalscan be reconstructed without error from samples taken at the rate of innovation [4]. Theadvantage of this result is self-evident: FRI signals need not be bandlimited, and even ifthey are, the Nyquist frequency can be much higher than the rate of innovation. Thus,by using FRI techniques, the sampling rate required for perfect reconstruction can belowered substantially. However, exploiting these capabilities requires careful design ofthe sampling mechanism and of the digital post-processing. The purpose of this chapteris to review the theory, recovery techniques, and applications of the FRI model.
4.1.1 The sampling scheme
Consider the sampling setup shown in Figure 4.1, where the original continuous-timesignal x(t) is filtered before being uniformly sampled at a rate of fs = 1/T . The filteringmay be a design choice or may be due to the acquisition device. If we denote the filteredversion of x(t) by y(t) = h(t) ∗x(t), then the samples yn are given by
yn = y(nT ) =
⟨x(t),ϕ
(t
T−n
)⟩=
∫ ∞
−∞x(t)ϕ
(t
T−n
)dt, (4.1)
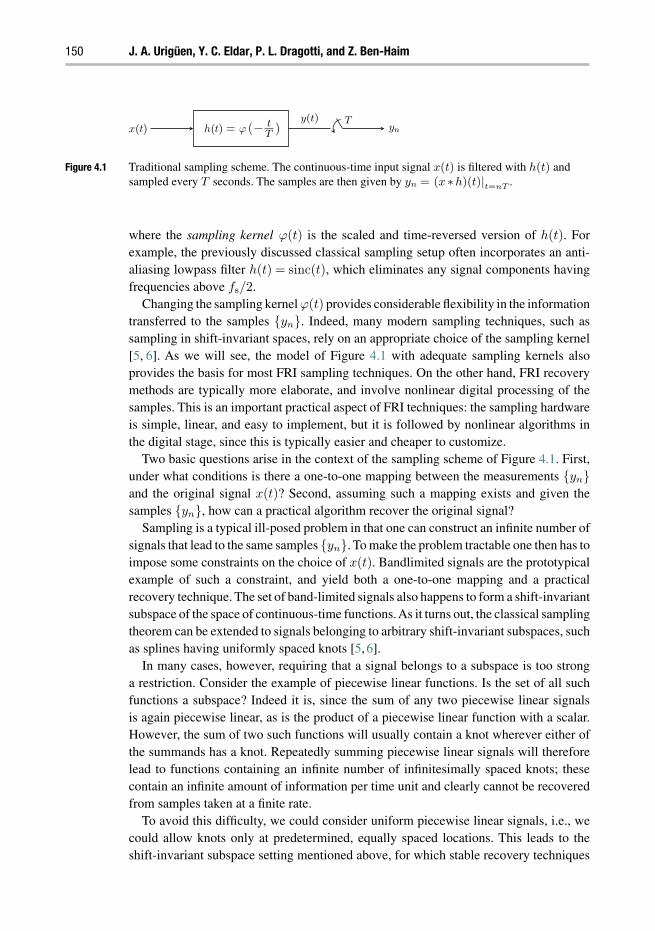
150 J. A. Urigüen, Y. C. Eldar, P. L. Dragotti, and Z. Ben-Haim
x t( ) ( ((
) = ))
h t ϕtT
Tyn
y t
Figure 4.1 Traditional sampling scheme. The continuous-time input signal x(t) is filtered with h(t) andsampled every T seconds. The samples are then given by yn = (x ∗h)(t)|t=nT .
where the sampling kernel ϕ(t) is the scaled and time-reversed version of h(t). Forexample, the previously discussed classical sampling setup often incorporates an anti-aliasing lowpass filter h(t) = sinc(t), which eliminates any signal components havingfrequencies above fs/2.
Changing the sampling kernel ϕ(t) provides considerable flexibility in the informationtransferred to the samples yn. Indeed, many modern sampling techniques, such assampling in shift-invariant spaces, rely on an appropriate choice of the sampling kernel[5, 6]. As we will see, the model of Figure 4.1 with adequate sampling kernels alsoprovides the basis for most FRI sampling techniques. On the other hand, FRI recoverymethods are typically more elaborate, and involve nonlinear digital processing of thesamples. This is an important practical aspect of FRI techniques: the sampling hardwareis simple, linear, and easy to implement, but it is followed by nonlinear algorithms inthe digital stage, since this is typically easier and cheaper to customize.
Two basic questions arise in the context of the sampling scheme of Figure 4.1. First,under what conditions is there a one-to-one mapping between the measurements ynand the original signal x(t)? Second, assuming such a mapping exists and given thesamples yn, how can a practical algorithm recover the original signal?
Sampling is a typical ill-posed problem in that one can construct an infinite number ofsignals that lead to the same samples yn. To make the problem tractable one then has toimpose some constraints on the choice of x(t). Bandlimited signals are the prototypicalexample of such a constraint, and yield both a one-to-one mapping and a practicalrecovery technique. The set of band-limited signals also happens to form a shift-invariantsubspace of the space of continuous-time functions.As it turns out, the classical samplingtheorem can be extended to signals belonging to arbitrary shift-invariant subspaces, suchas splines having uniformly spaced knots [5, 6].
In many cases, however, requiring that a signal belongs to a subspace is too stronga restriction. Consider the example of piecewise linear functions. Is the set of all suchfunctions a subspace? Indeed it is, since the sum of any two piecewise linear signalsis again piecewise linear, as is the product of a piecewise linear function with a scalar.However, the sum of two such functions will usually contain a knot wherever either ofthe summands has a knot. Repeatedly summing piecewise linear signals will thereforelead to functions containing an infinite number of infinitesimally spaced knots; thesecontain an infinite amount of information per time unit and clearly cannot be recoveredfrom samples taken at a finite rate.
To avoid this difficulty, we could consider uniform piecewise linear signals, i.e., wecould allow knots only at predetermined, equally spaced locations. This leads to theshift-invariant subspace setting mentioned above, for which stable recovery techniques
Sampling at the rate of innovation: theory and applications 151
exist [6]. However, instead of forcing fixed knot positions, one could merely require,for example, a combination of a finite number of piecewise linear signals with arbitraryknown locations. In many cases, such a restriction better characterizes real-world signals,although it can no longer be modeled as a linear subspace. Rather, this is an instance ofa union of subspaces [7, 8]: each choice of valid knot positions forms a subspace, andthe class of allowed signals is the union of such subspaces. The minimum separationmodel also satisfies the FRI property, and can be recovered efficiently from samplestaken at the rate of innovation. The union of subspaces structure, which is explored inmore detail in Chapter 3, is useful in developing a geometrical intuition of FRI recoverytechniques. There is, however, a distinction between the union of subspaces and FRImodels. In particular, there exist FRI settings which cannot be described in terms ofunions of subspaces, for example, when the signal parameters do not include an amplitudecomponent. There are also unions of subspaces which do not conform to the FRI scenario,in particular when the parameters affect the signal in a non-local manner, so that finite-duration segments are not determined by a finite number of parameters.
Our discussion thus far has concentrated on perfect recovery of FRI signals in theabsence of noise. However, empirical observations indicate that, for some noisy FRIsignals, substantial performance improvements are achievable when the sampling rateis increased beyond the rate of innovation [9–12]. This leads to two areas of activeresearch on FRI: first, the development of algorithms with improved noise robustness[9–11,13–17], and, second, the derivation of bounds on the best possible performance ata given noise level [12,16]. By comparing FRI techniques with performance bounds, wewill demonstrate that while noise treatment has improved in recent years, there remaincases in which state-of-the-art techniques can still be enhanced.
4.1.2 History of FRI
The idea of analyzing FRI signals was first proposed by Vetterli et al. [4]. Although theminimal sampling rate required for such settings has been derived, no generic recon-struction scheme exists for the general problem. Nonetheless, some special cases havebeen treated in previous work, including streams of pulses, which will be our focus inthis chapter.
A stream of pulses can be viewed as a parametric signal, uniquely defined by the timedelays of the pulses and their amplitudes. An efficient sampling scheme for periodicstreams of impulses, having K impulses in each period, was proposed in [4]. Usingthis technique, one obtains a set of Fourier series coefficients of the periodic signal.Once these coefficients are known, the problem of determining the time delays andamplitudes of the pulses becomes that of finding the frequencies and amplitudes of asum of sinusoids. The latter is a standard problem in spectral analysis [18] which can besolved using conventional approaches, such as the annihilating filter method [18,19], aslong as the number of samples is no smaller than 2K. This result is intuitive since 2K
is the number of degrees of freedom in each period: K time delays and K amplitudes.Periodic streams of pulses are mathematically convenient to analyze, but not very
practical. By contrast, finite streams of pulses are prevalent in applications such as

152 J. A. Urigüen, Y. C. Eldar, P. L. Dragotti, and Z. Ben-Haim
ultrasound imaging [10]. The first treatment of finite Dirac streams appears in [4], inwhich a Gaussian sampling kernel was proposed. The time delays and amplitudes are thenestimated from the samples. However, this approach is subject to numerical instability,caused by the exponential decay of the kernel.Adifferent approach, based on moments ofthe signal, was developed in [9], where the sampling kernels have compact time support.This method treats streams of Diracs, differentiated Diracs, and short pulses with compactsupport. The moments characterize the input akin to the Fourier coefficients used in [4].In fact, the time delays and pulses can again be determined from the moments by usingstandard spectral estimation tools.Another technique that utilizes finite-support samplingkernels, was proposed in [10]. This approach has improved numerical stability, thanksto the choice of the sampling kernel, especially for high rates of innovation. The methodwas then generalized in [11].
Infinite streams of pulses arise in applications such as ultra-wideband (UWB) com-munications, where the communicated data changes frequently. Using a compactlysupported filter [9], and under certain limitations on the signal, the infinite stream canbe divided into a sequence of separate finite problems. The individual finite cases maybe treated using methods for the finite setting; however, this leads to a sampling ratethat is higher than the rate of innovation. A technique achieving the rate of innovationwas proposed in [11], based on a multichannel sampling scheme which uses a numberof sampling kernels in parallel.
In related work, a semi-periodic pulse model was proposed in [17], wherein the pulsetime delays do not change from period to period, but the amplitudes vary. This is a hybridcase in which the number of degrees of freedom in the time delays is finite, but thereis an infinite number of degrees of freedom in the amplitudes. Therefore, the proposedrecovery scheme generally requires an infinite number of samples.
The effect of digital noise on the recovery procedure was first analyzed by Maravic andVetterli [13], where an improved model-based approach was proposed. In this technique,known as the subspace estimator, proper use of the algebraic structure of the signalsubspace is exploited, leading to improved noise robustness. An iterative version of thesubspace estimator was later proposed by Blu et al. [19]. This approach is optimal for thesinc sampling kernel of [4], but can also be adapted to compactly supported kernels. Finiterate of innovation recovery in the presence of noise was also examined from a stochasticmodeling perspective by Tan and Goyal [14] and by Erdozain and Crespo [15]. Theperformance in the presence of analog noise has been recently examined in [12]. Treatinganalog noise allows the interaction between FRI techniques and the underlying samplingmethods to be analyzed. In particular, bounds are obtained which are independent of thesampling method. For different classes of FRI signals, this allows one to identify anoptimal sampling approach that achieves the bound. In addition, it is shown that undercertain scenarios the sampling schemes of [11] are optimal in the presence of analognoise. This framework can also be used to identify FRI settings in which noise-freerecovery techniques deteriorate substantially under slight noise levels.
There has also been some work on FRI setups departing from the simple one-dimensional scheme of Figure 4.1. We have already mentioned multichannel setups,in which sampling is performed simultaneously using several distinct kernels, but

Sampling at the rate of innovation: theory and applications 153
with a lower total sampling rate [11, 17, 20]. The problem of recovering an FRI pulsestream in which the pulse shape is unknown was examined in [21]. Some forms ofdistributed sampling have been studied in [22]. There has also been work on multidi-mensional FRI signals, i.e., signals which are a function of two or more parameters(such as images) [23, 24]. The many applications of FRI theory include image super-resolution [25, 26], ultrasound imaging [10], radar [27], multipath identification [17],and wideband communications [28, 29].
4.1.3 Chapter outline
Throughout the rest of the chapter, we treat the basic concepts underlying FRI theory ingreater detail. We mainly focus on FRI pulse streams, and consider in particular the casesof periodic, finite, infinite, and semi-periodic pulse streams. In Section 4.2, we provide ageneral definition and some examples of FRI signals. In Section 4.3, we treat the problemof recovering FRI signals from noiseless samples taken at the rate of innovation. Specif-ically, we concentrate on a pulse stream input signal and develop recovery proceduresfor various types of sampling kernels. Modifications of these techniques when noise ispresent in the system are discussed in Section 4.4. Simulations illustrating the ability torecover FRI signals are provided in Section 4.5. We conclude the chapter in Section 4.6with several extensions of the FRI model and a brief discussion of some of its practicalapplication areas.
4.1.4 Notation and conventions
The following notation will be used throughout the chapter. R, C and Z denote thesets of real, complex, and integer numbers, respectively. Boldface uppercase lettersM denote matrices, while boldface lowercase letters v indicate vectors. The iden-tity matrix is denoted I. The notation Ma×b explicitly indicates that the matrix isof dimensions a × b. The superscripts (·)T , (·)∗, (·)−1, and (·)†, when referring tooperations on matrices or vectors, mean the transpose, Hermitian conjugate, inverse,and Moore–Penrose pseudoinverse respectively. Continuous-time functions are denotedx(t), whereas discrete-time sequences are denoted xn or x[n]. The expectation operatoris E(·). The box function rect(t) equals 1 in the range [−1/2,1/2] and 0 elsewhere. TheHeaviside or step function u(t) is 0 for t < 0 and 1 for t ≥ 0.
The continuous-time Fourier transform x(ω) of the function x(t) is defined as
x(ω) ∫ ∞
−∞x(t)e−jtωdt, (4.2)
while the discrete-time Fourier transform (DTFT) of a sequence a[n] is given by
a(ejωT ) ∑n∈Z
a[n]e−jωnT . (4.3)

154 J. A. Urigüen, Y. C. Eldar, P. L. Dragotti, and Z. Ben-Haim
The Fourier series xmm∈Z of a τ -periodic function is defined as
xm 1
τ
∫ τ
0x(t)e−j2πm t
τ dt. (4.4)
We will also use the Fourier series (4.4) for finite-duration signals, i.e., signals whosesupport is contained in [0, τ ].
We conclude the section with some identities which will be used in several proofsthroughout the chapter. These are the Poisson summation formula [30]∑
n∈Z
x(t+nT ) =1
T
∑k∈Z
x
(2πk
T
)ej2πk t
T (4.5)
and Parseval’s theorem for the equivalence of the inner product [30, 31]
〈x(t),y(t)〉 =1
2π〈x(ω), y(ω)〉 , (4.6)
where 〈x(t),y(t)〉 =∫∞
−∞ x∗(t)y(t)dt.
4.2 Signals with finite rate of innovation
As explained at the beginning of this chapter, FRI signals are those that can be describedby a finite number of parameters per unit time. In this section we introduce the originaldefinition as stated by Vetterli et al. in [4]. In addition, we provide some examples ofFRI signals that can be sampled and perfectly reconstructed at their rate of innovationusing the techniques of [4, 9–11, 17]. We also formally define periodic, semi-periodic,and finite duration signals.
4.2.1 Definition of signals with FRI
The concept of FRI is intimately related to parametric signal modeling. If a signal vari-ation depends on a few unknown parameters, then we can see it as having a limitednumber of degrees of freedom per unit time.
More precisely, given a set of known functions gr(t)R−1r=0 , arbitrary shifts tk, and
amplitudes γk,r, consider a signal of the form:
x(t) =∑k∈Z
R−1∑r=0
γk,rgr(t− tk). (4.7)
Since the set of functions gr(t)R−1r=0 is known, the only free parameters of the signal
are the coefficients γk,r and the time shifts tk. Consider a counting function Cx(ta, tb)
that is able to compute the number of parameters over a time interval [ta, tb]. The rate ofinnovation is defined as follows
ρ = limτ→∞
1
τCx
(−τ
2,τ
2
). (4.8)

Sampling at the rate of innovation: theory and applications 155
definition 4.1 [4] A signal with Finite Rate of Innovation can be defined as a signalwith a parametric representation such as that given by (4.7), and with a finite ρ givenby (4.8).
Another useful concept is that of a local rate of innovation over a window of size τ ,defined as:
ρτ (t) =1
τCx
(t− τ
2, t+
τ
2
). (4.9)
Note that ρτ (t) clearly tends to ρ as τ tends to infinity.Given an FRI signal with a rate of innovation ρ, we expect to be able to recover x(t)
from ρ samples (or parameters) per unit time. The rate of innovation turns out to haveanother interesting interpretation in the presence of noise: it is a lower bound on the ratiobetween the average mean squared error (MSE) achievable by any unbiased estimatorof x(t) and the noise variance, regardless of the sampling method [12].
4.2.2 Examples of FRI signals
It is well known from classical sampling theory that a signal bandlimited to [−B/2,B/2]
can be expressed as an infinite sum of properly weighted and shifted versions of the sinc
function:
x(t) =∑n∈Z
x[n] sinc(Bt−n) , (4.10)
where x[n] = 〈x(t),B sinc(Bt−n)〉. Comparing Equations (4.10) and (4.7) imme-diately reveals that a bandlimited signal can be interpreted as having finite rate ofinnovation. In this case, we can say that the signal x(t) has B degrees of freedom persecond, since it is exactly defined by a sequence of numbers x[n]n∈Z spaced T = B−1
seconds apart, given that the basis function sinc is known.This idea can be generalized by replacing the sinc basis function with any other
function ϕ(t). The set of signals
x(t) =∑n∈Z
x[n]ϕ(Bt−n) , (4.11)
defines a shift-invariant subspace, which is not necessarily bandlimited, but that again hasa rate of innovation ρ = B. Such functions can be efficiently sampled and reconstructedusing linear methods [5,6], and thus typically do not require the more elaborate techniquesof FRI theory. However, many FRI families of signals form a union of subspaces [7,8],rather than a subspace, and can still be sampled and perfectly reconstructed at the rateof innovation. As a motivation for the forthcoming analysis, several examples of suchsignals are plotted in Figure 4.2 and described below. For simplicity, these examplesdescribe finite-duration FRI signals defined over the range [0,1], but the extension toinfinite or periodic FRI models is straightforward.

156 J. A. Urigüen, Y. C. Eldar, P. L. Dragotti, and Z. Ben-Haim
0 0.2 0.4 0.6 0.8 1
−1
−0.5
0
0.5
1
(a) Train of Diracs.
0 0.2 0.4 0.6 0.8 10
50
100
150
200
250
300
(b) Nonuniform spline.
0 0.2 0.4 0.6 0.8 1
−1
−0.8
−0.6
−0.4
−0.2
0
0.2
0.4
(c) Piecewise polynomial.
0 0.2 0.4 0.6 0.8 1
−1
−0.5
0
0.5
1
(d) Piecewise sinusoidal.
0 0.2 0.4 0.6 0.8 1
−1
−0.5
0
0.5
1
(e) Stream of pulses. (f) 2-D set of bilevel polygons.
Figure 4.2 Examples of FRI signals that can be sampled and perfectly reconstructed at the rate ofinnovation.

Sampling at the rate of innovation: theory and applications 157
(i) The first signal of interest is a stream of K Diracs with amplitudes akK−1k=0 and
time locations tkK−1k=0 . Mathematically, x(t) can be written as
x(t) =
K−1∑k=0
akδ(t− tk). (4.12)
The signal has 2K degrees of freedom, because it has K amplitudes and K locationsthat are unknown. A typical realization of such a signal can be seen in Figure 4.2(a).
(ii) A signal x(t) is a nonuniform spline of order R with amplitudes akK−1k=0 and knots
at tkK−1k=0 ∈ [0,1] if and only if its (R+1)th derivative is a stream of K weighted
Diracs. Equivalently, such a signal consists of K +1 segments, each of which is apolynomial of degree R, such that the entire function is differentiable R times. Thissignal also has 2K degrees of freedom, because it is only the K amplitudes and K
locations of the Diracs that are unknown. An example is the piecewise linear signaldescribed in Section 4.1 and shown in Figure 4.2(b). The second derivative of thissignal is the train of Diracs shown in (a).
(iii) A stream of K differentiated Diracs with amplitudes akrK−1,Rk−1k=0,r=0 and time
locations tkK−1k=0 is similar to the stream of Diracs, but combining linearly a set
of properly displaced and weighted differentiated Diracs, δ(r)(t). Mathematically,we can write:
x(t) =
K−1∑k=0
Rk−1∑r=0
akrδ(r)(t− tk). (4.13)
In this case, the number of degrees of freedom of the signal is determined by K
locations and K =∑K−1
k=0 Rk different weights.(iv) Asignal x(t) is a piecewise polynomial with K segments of maximum degree R−1
(R > 0) if and only if its Rth derivative is a stream of differentiated Diracs. Thesignal again has K +K degrees of freedom. An example is shown in Figure 4.2(c).The difference between a piecewise polynomial and a spline is that the former isnot differentiable at the knots.
(v) Another family of signals, considered in [16], are piecewise sinusoidal functions.These are a linear combination of truncated sinusoids, with unknown amplitudesakd, angular frequencies ωkd, and phases θkd, so that
x(t) =
K−1∑k=0
D−1∑d=0
akd cos(ωkdt− θkd)ξd(t), (4.14)
with ξd(t) = u(t− td)−u(t− td+1), where td are locations to be determined, andu(t) is the Heaviside step function. Figure 4.2(d) shows an example of such a signal.
(vi) An important example we focus on in this chapter is a stream of pulses, which isuniquely defined by a known pulse shape p(t) and the unknown locations tkK−1
k=0and amplitudes akK−1
k=0 that characterize the pulses. The signal can thus be

158 J. A. Urigüen, Y. C. Eldar, P. L. Dragotti, and Z. Ben-Haim
expressed mathematically as
x(t) =
K−1∑k=0
akp(t− tk). (4.15)
The stream of pulses has 2K degrees of freedom. A realization of a train of pulsesis shown in Figure 4.2(e).
(vii) Finally, it is also possible to consider FRI signals in higher dimensions. For instance,a 2-D-stream of Diracs can be written as
f(x,y) =
K−1∑k=0
akδ(x−xk,y− yk). (4.16)
In Figure 4.2(f) we show another type of two-dimensional signal, a 2-D set of bilevelpolygons.
We conclude this section by focusing on streams of pulses, which are the prototypicalsignals we use from now on in the remainder of the chapter. We thus assume for simplicitya single pulse shape p(t) in (4.7), and describe an infinite-length stream of pulses as
x(t) =∑k∈Z
akp(t− tk). (4.17)
Periodic FRI signals turn out to be particularly convenient for analysis, and will bediscussed in depth in Section 4.3.1. If we assume that there are only K different timelocations tk and amplitudes ak in (4.17), and that they are repeated every τ , wehave
x(t) =∑m∈Z
K−1∑k=0
akp(t− tk −mτ). (4.18)
The total number of parameters determining the signal for each period is thus 2K, leadingto a rate of innovation given by 2K/τ .
Another variant is a finite-duration pulse stream, which consists of K pulses, whoseshifts tk are known to be located within a finite segment of length τ . Under theassumption of a single pulse shape p(t), we can express finite-duration FRI signals as
x(t) =
K−1∑k=0
akp(t− tk). (4.19)
Such signals are of practical relevance, since it is unrealistic to expect any measuredsignal to continue indefinitely. Here again, a finite number of parameters determinesx(t) entirely. In this case we are interested in the local rate of innovation ρτ = 2K/τ .
We will also consider semi-periodic signals, which we define as signals of the form
x(t) =
K−1∑k=0
∑m∈Z
ak[m]p(t− tk −mτ). (4.20)

Sampling at the rate of innovation: theory and applications 159
Such signals are similar to the periodic pulse stream (4.18), with amplitudes that varyfrom period to period. Signals from this class can be used, for example, to describe thepropagation of a pulse with known shape p(t) which is transmitted at a constant rate1/τ through a medium consisting of K paths. Each path has a constant delay tk anda time-varying gain ak[m] [17]. Due to the delays being repeated over the subsequentperiods of the signal, estimation in this model is simpler than in the finite or infinitesignal cases [11, 12].
4.3 Sampling and recovery of FRI signals in the noise-free setting
In this section, we present the basic mechanisms for reconstruction of pulse stream FRIsignals from their low-rate samples. Recovery is achieved by first linearly combiningthe samples in order to obtain a new set of measurements xm, which represent theFourier transform of x(t), and then recovering the FRI signal parameters from xm.The latter stage is equivalent to the problem of determining the frequencies of a signalformed by a sum of complex exponentials. This problem has been treated extensively inthe array processing literature, and can be solved using conventional tools from spectralestimation theory [18] such as the matrix pencil [32], subspace-based estimators [33,34],and the annihilating filter [19].
Recovery of FRI signals is most readily understood in the setting of a periodic streamof pulses given by (4.18), and this is therefore the first scenario we explore. We laterdiscuss recovery techniques that use finite-support sampling kernels. These can be usedin the finite setting of Equation (4.19) as well as the original infinite FRI model ofEquation (4.7). Finally, we also discuss a technique for recovering semi-periodic signalsof the form (4.20).
4.3.1 Sampling using the sinc kernel
Consider a τ -periodic stream of K pulses p(t) at locations tkK−1k=0 and with amplitudes
akK−1k=0 , as defined in (4.18). The pulse shape is known a priori, and therefore the signal
has only 2K degrees of freedom per period.Since x(t) is periodic it can be represented in terms of its Fourier series coefficients
xm as
x(t) =
K−1∑k=0
ak
∑m∈Z
p(t− tk −mτ) (4.21)
(a)=
K−1∑k=0
ak1
τ
∑m∈Z
p
(2πm
τ
)ej2πm
t−tkτ
=∑m∈Z
xmej2πm tτ ,
160 J. A. Urigüen, Y. C. Eldar, P. L. Dragotti, and Z. Ben-Haim
where in (a) we used Poisson summation formula (4.5), and
xm =1
τp
(2πm
τ
)K−1∑k=0
ake−j2πmtkτ , (4.22)
are the Fourier series coefficients of x(t).If we have direct access to a set K of M consecutive Fourier coefficients for which
p(2πm/τ) = 0, and M ≥ 2K, then it is possible to retrieve the 2K free parametersak, tk, k = 0,1, . . .,K − 1 by using conventional tools from spectral analysis [18]such as Prony’s method or the annihilating filter method [18, 19]. To show this fact wefirst write (4.22) as
xmp−1(
2πm
τ
)=
1
τ
K−1∑k=0
akumk , (4.23)
where uk = e−j2πtkτ and p−1 denotes the multiplicative inverse of p. Since p(t) is known
a priori, we assume for simplicity of notation that p(2πm/τ)= 1 for m∈K; this happensfor example when x(t) is a stream of Diracs. Otherwise one must simply divide eachmeasurement by the corresponding value of p(2πm/τ).
In order to find the values uk in (4.23), let hmKm=0 denote the filter whose
z-transform is
h(z) =
K∑m=0
hmz−m =
K−1∏m=0
(1−ukz−1) . (4.24)
That is, the roots of h(z) equal the values uk to be found. Then, it follows that:
hm ∗ xm =
K∑i=0
hixm−i =
K∑i=0
K−1∑k=0
akhium−ik =
K−1∑k=0
akumk
K∑i=0
hiu−ik︸ ︷︷ ︸
=0
= 0 (4.25)
where the last equality is due to the fact that h(uk) = 0. The filter hm is called anannihilating filter, since it zeroes the signal xm. Its roots uniquely define the set of valuesuk, provided that the locations tk are distinct.
Assuming without loss of generality that h0 = 1, the identity in (4.25) can be writtenin matrix/vector form as
x−1 x−2 · · · x−K
x0 x−1 · · · x−K+1...
.... . .
...xK−2 xK−3 · · · x−1
h1
h2...
hK
= −
x0
x1...
xK−1
(4.26)
which reveals that we need at least 2K consecutive values of xm to solve the abovesystem. Once the filter has been found, the locations tk are retrieved from the zeros uk
of the z-transform in (4.24). Given the locations, the weights ak can then be obtained byconsidering for instance K consecutive Fourier series coefficients in (4.23). For example,
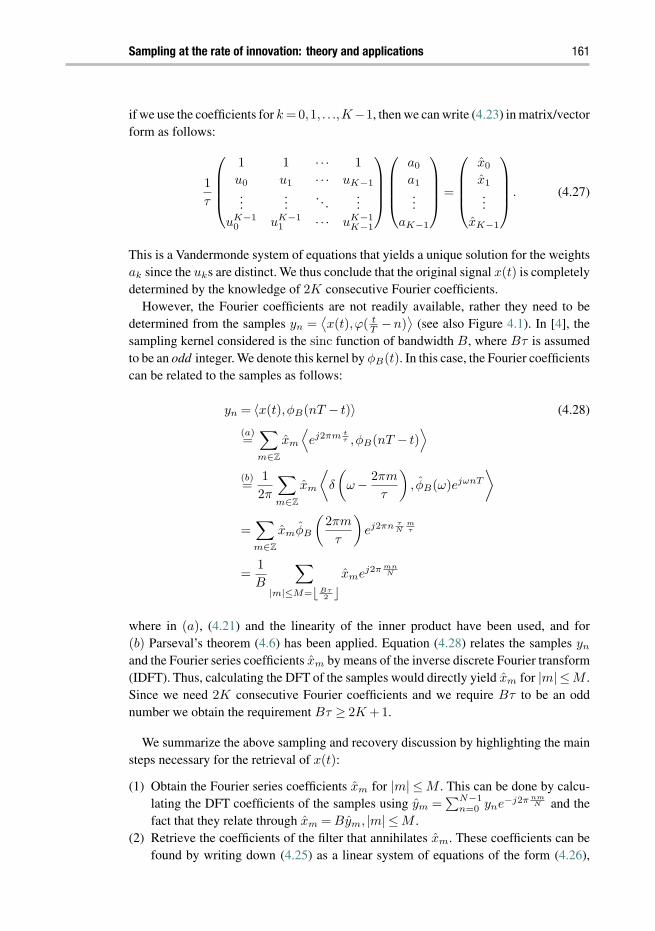
Sampling at the rate of innovation: theory and applications 161
if we use the coefficients for k = 0,1, . . .,K−1, then we can write (4.23) in matrix/vectorform as follows:
1
τ
1 1 · · · 1
u0 u1 · · · uK−1...
.... . .
...uK−1
0 uK−11 · · · uK−1
K−1
a0
a1...
aK−1
=
x0
x1...
xK−1
. (4.27)
This is a Vandermonde system of equations that yields a unique solution for the weightsak since the uks are distinct. We thus conclude that the original signal x(t) is completelydetermined by the knowledge of 2K consecutive Fourier coefficients.
However, the Fourier coefficients are not readily available, rather they need to bedetermined from the samples yn =
⟨x(t),ϕ( t
T −n)⟩
(see also Figure 4.1). In [4], thesampling kernel considered is the sinc function of bandwidth B, where Bτ is assumedto be an odd integer. We denote this kernel by φB(t). In this case, the Fourier coefficientscan be related to the samples as follows:
yn = 〈x(t),φB(nT − t)〉 (4.28)
(a)=∑m∈Z
xm
⟨ej2πm t
τ ,φB(nT − t)⟩
(b)=
1
2π
∑m∈Z
xm
⟨δ
(ω− 2πm
τ
), φB(ω)ejωnT
⟩
=∑m∈Z
xmφB
(2πm
τ
)ej2πn τ
Nmτ
=1
B
∑|m|≤M= Bτ
2 xmej2π mn
N
where in (a), (4.21) and the linearity of the inner product have been used, and for(b) Parseval’s theorem (4.6) has been applied. Equation (4.28) relates the samples yn
and the Fourier series coefficients xm by means of the inverse discrete Fourier transform(IDFT). Thus, calculating the DFT of the samples would directly yield xm for |m| ≤M .Since we need 2K consecutive Fourier coefficients and we require Bτ to be an oddnumber we obtain the requirement Bτ ≥ 2K +1.
We summarize the above sampling and recovery discussion by highlighting the mainsteps necessary for the retrieval of x(t):
(1) Obtain the Fourier series coefficients xm for |m| ≤ M . This can be done by calcu-lating the DFT coefficients of the samples using ym =
∑N−1n=0 yne−j2π nm
N and thefact that they relate through xm = Bym, |m| ≤ M .
(2) Retrieve the coefficients of the filter that annihilates xm. These coefficients can befound by writing down (4.25) as a linear system of equations of the form (4.26),
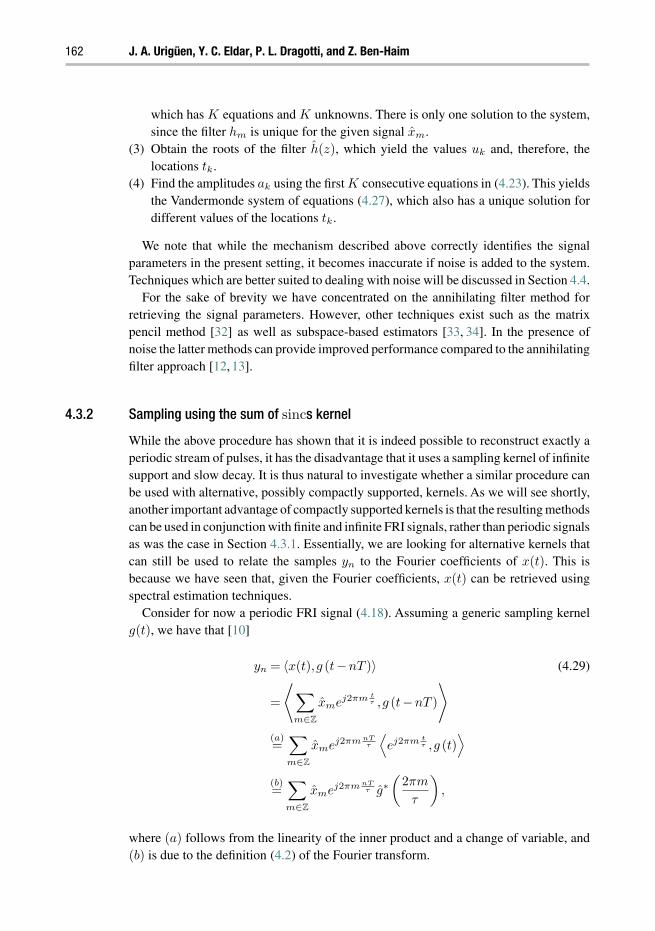
162 J. A. Urigüen, Y. C. Eldar, P. L. Dragotti, and Z. Ben-Haim
which has K equations and K unknowns. There is only one solution to the system,since the filter hm is unique for the given signal xm.
(3) Obtain the roots of the filter h(z), which yield the values uk and, therefore, thelocations tk.
(4) Find the amplitudes ak using the first K consecutive equations in (4.23). This yieldsthe Vandermonde system of equations (4.27), which also has a unique solution fordifferent values of the locations tk.
We note that while the mechanism described above correctly identifies the signalparameters in the present setting, it becomes inaccurate if noise is added to the system.Techniques which are better suited to dealing with noise will be discussed in Section 4.4.
For the sake of brevity we have concentrated on the annihilating filter method forretrieving the signal parameters. However, other techniques exist such as the matrixpencil method [32] as well as subspace-based estimators [33, 34]. In the presence ofnoise the latter methods can provide improved performance compared to the annihilatingfilter approach [12, 13].
4.3.2 Sampling using the sum of sincs kernel
While the above procedure has shown that it is indeed possible to reconstruct exactly aperiodic stream of pulses, it has the disadvantage that it uses a sampling kernel of infinitesupport and slow decay. It is thus natural to investigate whether a similar procedure canbe used with alternative, possibly compactly supported, kernels. As we will see shortly,another important advantage of compactly supported kernels is that the resulting methodscan be used in conjunction with finite and infinite FRI signals, rather than periodic signalsas was the case in Section 4.3.1. Essentially, we are looking for alternative kernels thatcan still be used to relate the samples yn to the Fourier coefficients of x(t). This isbecause we have seen that, given the Fourier coefficients, x(t) can be retrieved usingspectral estimation techniques.
Consider for now a periodic FRI signal (4.18). Assuming a generic sampling kernelg(t), we have that [10]
yn = 〈x(t),g (t−nT )〉 (4.29)
=
⟨∑m∈Z
xmej2πm tτ ,g (t−nT )
⟩(a)=∑m∈Z
xmej2πm nTτ
⟨ej2πm t
τ ,g (t)⟩
(b)=∑m∈Z
xmej2πm nTτ g∗
(2πm
τ
),
where (a) follows from the linearity of the inner product and a change of variable, and(b) is due to the definition (4.2) of the Fourier transform.

Sampling at the rate of innovation: theory and applications 163
Having control over the filter g(t), we now impose the following condition on itsFourier transform:
g∗ (ω) =
0, ω = 2πm
τ , m /∈K,
nonzero, ω = 2πmτ , m ∈K,
arbitrary, otherwise,
(4.30)
where K is a set of coefficients which will be determined shortly. Then, we have
yn =∑m∈K
xmej2πm nTτ g∗
(2πm
τ
). (4.31)
In general, the system in (4.31) has a unique solution provided the number of samples N
is no smaller than the cardinality of K, which we will call M = |K|. The reason is that, inthis case, the matrix defined by the elements ej2πm nT
τ is left-invertible. The idea is thateach sample yn is a combination of the elements xm, and the kernel g(t) is designed topass the coefficients for m∈K and suppress those for m /∈K. Note that for any real filtersatisfying (4.30), we have that if m ∈ K, then −m ∈ K, since by conjugate symmetryg (2πm/τ) = g∗ (−2πm/τ).
In the particular situation in which the number of samples N equals M , and when thesampling period T is related to the total period τ by T = τ/N , we can write
yn =∑m∈K
g∗mxmej 2πmn
N (4.32)
where g∗m = g∗ (2πm/τ). This equation relates the samples yn and the Fourier coef-
ficients of the input xm through a “weighted” IDFT. This means that calculating theDFT of the samples yields each of the weighted Fourier series coefficients DFTyn =
ym = g∗mxm or, equivalently, the coefficients themselves by inversion of each equation,
xm = g∗−1m ym. Thus, sampling with a filter that satisfies (4.30) allows us to obtain the
Fourier coefficients xm in a simple manner.It is straightforward to see that one particular case of a filter obeying (4.30) is the
sinc function g(t) = sinc(Bt) with B = M/τ . A family of alternative kernels satisfying(4.30) was introduced in [10] and is known as the family of Sum of Sincs (SoS). Thisclass of kernels is defined in the frequency domain as
g(ω) = τ∑m∈K
bm sinc
(ω2πτ
−m
), (4.33)
where bm = 0 for m ∈ K. The resulting filter is real valued if m ∈ K implies −m ∈ Kand bm = b∗
−m. In the time domain, the sampling kernel is of compact support, and canbe written as
g(t) = rect
(t
τ
)∑m∈K
bmej2πm tτ . (4.34)

164 J. A. Urigüen, Y. C. Eldar, P. L. Dragotti, and Z. Ben-Haim
−0.5 0 0.5−2
−1
0
1
2
3
4
5
6
t /τ
ConstantHamming
(a) Time domain.
−250 −200−150 −100 −50 0 50 100 150 200 250−0.1
0
0.1
0.2
0.3
0.4
0.5
0.6
ω [rad/s]
ConstantHamming
(b) Frequency domain.
Figure 4.3 SoS sampling kernels. The figures show the time and frequency domain representations of theSoS family of kernels given by (4.34) and (4.33) for bm = 1,∀m and when the coefficientsfollow a Hamming window pattern.
The filter can be further generalized when using a function φ(t) instead of the sinc in(4.33). This could be useful when we need a smoother time implementation than theone involving the rect function as in (4.34). A key feature of g(t) is that it is com-pactly supported in time. This will become important when sampling finite-length FRIsignals.
One interesting set of coefficients is bm = 1 for m = −p, . . . ,p, so that the filter in(4.34) becomes:
g(t) = rect
(t
τ
) p∑m=−p
ej2πm tτ = rect
(t
τ
)Dp
(2πt
τ
)(4.35)
where Dp(t) is the Dirichlet kernel. It is shown in [10] that under certain conditions thischoice is optimal in the presence of noise. Figure 4.3 shows this kernel together with theone obtained when the coefficients bm form a Hamming window [10]. Here M is thecardinality of the set K and M ≥ 2K. In general, the free parameters bkk∈K may beoptimized for different goals.
To summarize, given the samples yn, we need to obtain their DFT, and the resultingsequence is related to the Fourier series coefficients xm through (4.32) (we use N = M
and τ = NT ). We can then build a system of equations as in (4.26) to determine theannihilating filter coefficients, from which the locations tk are found by calculatingits roots. Finally we build another system of equations like (4.27) to determine theamplitudes ak, using (4.32).
The fact that the SoS kernels have compact support allows us to depart from the case ofperiodic signals, facilitating sampling finite- and infinite-length FRI signals, as discussedbelow.

Sampling at the rate of innovation: theory and applications 165
Sampling finite streams of pulsesFinite streams of pulses can be processed based on the above analysis for the periodiccase. For the finite-length scenario, we need to relate the samples obtained from the finitestream of pulses to those of the periodic stream. Let x(t) be a finite FRI signal of theform (4.19). It is shown in [10] that
yn = 〈x(t), g (t−nT )〉 = 〈x(t),g (t−nT )〉 (4.36)
where x(t) is the periodic continuation of the finite stream x(t), and where we havedefined the periodic extension of the filter g(t) as g(t) =
∑m∈Z
g(t−mτ). Therefore,the set of samples yn = 〈x(t),g (t−nT )〉, which uniquely represent a τ -periodic streamof pulses, are equivalent to those that could be obtained by sampling the finite-lengthsignal x(t) with the τ -periodic extension of the filter, g (t−nT ).
However, it is not practical to use an infinitely long sampling kernel. Assume the pulsep(t) is equal to zero for any |t| ≥ R/2. Then, the samples have the form [10]
yn =
⟨x(t),
r∑m=−r
g(t−nT −mτ)
⟩, (4.37)
where r =⌈
Rτ +32
⌉−1. The advantage of this approach is that we can immediately follow
the same retrieval procedure as with the periodic stream of pulses. The reason is that nowwe obtain the same set of samples given by Equation (4.36) sampling the finite-lengthsignal x(t) with the finite support kernel
gr(t) =
r∑m=−r
g(t−nT −mτ). (4.38)
Moreover, if the support of p(t) satisfies R ≤ τ , then r = 1, and the extension of g(t)
will contain only three repetitions, i.e. gr(t) = g(t)+ g(t+ τ)+ g(t− τ).The multichannel sampling scheme of [11] can also be used to sample finite FRI
signals. As we will see in Section 4.3.4, the use of a filter (or modulator) bank allows usto avoid forming a delayed pulse as in gr(t). In cases in which such delays are difficultto implement in hardware, it may be advantageous to use multiple channels without theneed for delays.
Sampling infinite-length streams of pulsesA similar technique may also be used to sample and recover infinite-length FRI pulsestreams of the form
x(t) =∑k∈Z
akp(t− tk). (4.39)
Concretely, in this case, we assume the signal is characterized by bursts of maximalduration τ which contain at most K pulses, separated by quiet phases of a certain length.This separation depends on the support of the sampling kernel which, in turn, is related

166 J. A. Urigüen, Y. C. Eldar, P. L. Dragotti, and Z. Ben-Haim
to the pulse shape p(t). For example, in order to sample a finite-length stream of Diracswe showed that the filter g3p(t) = g(t) + g(t± τ) was capable of sampling the signalleading to its perfect reconstruction. The support of the filter is 3τ and we then knowthat, if we want to use a sequential retrieval algorithm for the infinite-length input signalcase, the separation of consecutive bursts has to be at least 3τ/2. However, this techniquerequires a sampling rate which is higher than the rate of innovation. Achieving perfectreconstruction for infinite FRI signals from samples taken at the rate of innovationrequires a multichannel sampling scheme, and is the subject of Section 4.3.4.
4.3.3 Sampling using exponential reproducing kernels
Another important class of compact support kernels that can be used to sample FRIsignals is given by the family of exponential reproducing kernels.
An exponential reproducing kernel is any function ϕ(t) that, together with its shiftedversions, can generate complex exponentials of the form eαmt. Specifically,∑
n∈Z
cm,nϕ(t−n) = eαmt (4.40)
where m = 0,1, . . .,P and α0,λ ∈ C. The coefficients are given by cm,n =
〈eαmt, ϕ(t−n)〉, where ϕ(t) is the dual of ϕ(t), that is, 〈ϕ(t−n), ϕ(t−k)〉 = δn,k.When we use these kernels in the FRI process, the choice of the exponents in (4.40) isrestricted to αm = α0 + mλ with α0,λ ∈ C and m = 0,1, . . .,P . This is done to allowthe use of the annihilating filter method at the reconstruction stage. This point will bemore evident later on.
The theory related to the reproduction of exponentials relies on the concept ofE-splines [35]. A function βα(t) with Fourier transform βα(ω) = 1−eα−jω
jω−α is called anE-spline of first order, with α ∈ C. The time domain representation of such a func-tion is βα(t) = eαt rect(t− 1/2). The function βα(t) is of compact support, and alinear combination of its shifted versions βα(t − n) reproduces the exponential eαt.Higher-order E-splines can be obtained through convolution of first-order ones, e.g.,βα(t) = (βα0 ∗βα1 ∗ . . . ∗βαP
)(t), where α = (α0,α1, . . . ,αP ). This can also be writtenin the Fourier domain as follows:
βα(ω) =
P∏k=0
1− eαk−jω
jω−αk. (4.41)
Higher-order E-splines are also of compact support and, combined with their shiftedversions, βα(t − n), can reproduce any exponential in the subspace spanned byeα0 ,eα1 , . . . ,eαP [9, 35]. Notice that the exponent αm can be complex, which indi-cates that E-splines need not be real. However, this can be avoided by choosing complexconjugate exponents. Figure 4.4 shows examples of real E-spline functions of ordersone to four. Finally, note that the exponential reproduction property is preserved throughconvolution [9, 35] and, therefore, any function ϕ(t) = ψ(t) ∗βα(t), combined with its

Sampling at the rate of innovation: theory and applications 167
0 1 2 3 4 50
0.2
0.4
0.6
0.8
1P = 1P = 2P = 3P = 4
Figure 4.4 Example of exponential reproducing kernels. The shortest function shown is obtained byconvolving two first-order splines with complex parameters ±jω0 = ±j 2π
Nand N = 32
samples, resulting in a real function. The successive E-splines, shown in order from left to right,are obtained by convolving kernels with parameters αm = jω0(2m−P ), m = 0, . . . ,P .
shifted versions, is also able to reproduce the exponentials in the subspace spanned byeα0 ,eα1 , . . . ,eαP .
Reconstruction of FRI signals using exponential reproducing kernels is better under-stood in the time domain. For simplicity, we assume that p(t) is a Dirac function, eventhough other types of pulses can be sampled and perfectly recovered. In fact, any pulsesatisfying p(ω) = 0 for ω = αm can be used. Here αm, m = 0,1, . . .,P are the exponentsof the exponentials reproduced by the kernel. This is due to the fact that sampling astream of pulses with the kernel ϕ(t) is equivalent to sampling a stream of Diracs withthe kernel p(t) ∗ ϕ(t). The above condition guarantees that p(t) ∗ ϕ(t) is still able toreproduce exponentials.
Consider a finite-duration FRI signal of length τ :
x(t) =
K−1∑k=0
akδ(t− tk). (4.42)
Assuming a sampling period of T = τ/N , the measurements are
yn =
⟨x(t),ϕ
(t
T−n
)⟩=
K−1∑k=0
akϕ
(tkT
−n
), (4.43)
for n=0,1, . . .,N−1. The E-spline reconstruction scheme, first proposed in [9], operatesas follows. The samples are first linearly combined with the coefficients cm,n of (4.40)

168 J. A. Urigüen, Y. C. Eldar, P. L. Dragotti, and Z. Ben-Haim
to obtain the new measurements
sm =
N−1∑n=0
cm,nyn, m = 0,1, . . .,P. (4.44)
Then, using (4.43), we have that
sm =
⟨x(t),
∑n
cm,nϕ
(t
T−n
)⟩=
∫ ∞
−∞x(t)eαmtdt (4.45)
=
K−1∑k=0
akumk , m = 0,1, . . .,P
where ak = akeα0tkT and uk = eλ
tkT . Here we have used the fact that αm = α0 + mλ.
Note that the new measurements sm represent the bilateral Laplace transform of x(t) atlocations αm, m = 0,1, . . .,P . These measurements are again in a power sum series formas those discussed in the previous sections. Therefore the pairs of unknowns ak,uk canbe retrieved from sm =
∑K−1k=0 akum
k using the annihilating filter method. Consequently,the main steps in the reconstruction of FRI signals with exponential reproducing kernelsare the same as those discussed previously. The only difference is that the samples werepreviously combined using a weighted DFT, whereas in this case the linear combinationis dictated by the coefficients cm,n. Since 2K consecutive coefficients sm are needed torun the annihilating filter method, we have the condition P ≥ 2K − 1.
We conclude by highlighting the generality of exponential reproducing kernels. First,when the exponent αm is purely imaginary, that is, when αm = jωm, then sm = x(ωm)
is precisely the Fourier transform of x(t) at ωm. Since x(t) is time-limited, this can bethought of as the Fourier series coefficients of the signal. In this case, and for a properchoice of the parameters N and P , it can be shown [36] that the coefficients cm,n con-stitute a DFT. For this situation the above analysis converges to the one of Section 4.3.1.Moreover, the SoS sampling kernel introduced in Section 4.3.2 is an exponential repro-ducing kernel of this type [36]. Second, when αm = 0, m = 0,1, . . .,P , the E-splinebecomes a polynomial spline (or B-spline). In general, when αm = 0, any exponentialreproducing kernel reduces to a kernel satisfying the Strang–Fix conditions [37]. Theseare still valid sampling kernels but reproduce polynomials rather than exponentials.Functions satisfying Strang–Fix conditions are extensively used in wavelet theory andthe above result provides an intriguing connection between sampling of FRI signals andwavelets. This connection allows us to combine FRI theory with wavelets to developefficient centralized and distributed algorithms for the compression of piecewise smoothfunctions [38,39]. Finally, it is possible to show that any device whose input and outputare related by linear differential equations can be turned into an exponential reproducingkernel and can therefore be used to sample FRI signals [9]. This includes, for example,any linear electrical circuit. Given the ubiquity of such devices and the fact that in manycases the sampling kernel is given and cannot be modified, FRI theory with exponentialreproducing kernels becomes even more relevant in practical scenarios.

Sampling at the rate of innovation: theory and applications 169
4.3.4 Multichannel sampling
The techniques discussed so far were based on uniform sampling of the signal x(t) con-volved with a single kernel h(t) (see Figure 4.1). While this is the simplest possiblesampling scheme, improved performance and lower sampling rates can be achieved atthe cost of slightly more complex hardware. In particular, one can consider a multi-channel sampling setup, in which the signal x(t) is convolved with P different kernelss∗1(−t), . . . ,s∗
P (−t), and the output of each channel is sampled at a rate 1/T [11, 17].The set of samples in this case is given by
c[m] = 〈s(t−mT ),x(t)〉 , = 1, . . . ,P, m ∈ Z. (4.46)
The system is said to have a total sampling rate of P/T . Note that the standard (single-channel) scenario is a special case of this scheme, which can be obtained either bychoosing P = 1 sampling channels, or with P > 1 copies of the sampling kernel h(t)
which are shifted in time.An alternative multichannel structure can be obtained in which the filter is replaced
by a modulator (i.e. multiplier) followed by an integrator. In this case the output of eachbranch is given by
c[m] =
∫ mT
(m−1)Tx(t)s(t), = 1, . . . ,P, m ∈ Z, (4.47)
where s(t) is the modulating function on the th branch. This scheme is particularlysimple, and as we show below, can be used to treat all classes of FRI signals: periodic,finite, infinite, and semi-periodic, under the assumption that the pulse p(t) is compactlysupported. In contrast, the filterbank approach is beneficial in particular for semi-periodicpulse streams and can accommodate arbitrary pulse shapes p(t), including infinite-lengthfunctions. Furthermore, the multichannel filter bank structure can often be collapsed to asingle sampling channel followed by a serial to parallel converter, in order to produce theparallel sampling sequences in (4.46). Thus, when applicable, this scheme may lead tosavings in hardware over the modulator-based approach, while still retaining the benefitsof low sampling rate.
Due to its generality and simplicity, we begin by discussing the modulator-basedmultichannel structure. The merits of this approach are best exposed by first consideringa τ -periodic stream of K pulses.
Before proceeding we note that alternative multichannel systems have been proposedin the literature. In [20] a multichannel extension of the method in [9] was presented.This scheme allows reduced sampling rate in each channel, but the overall sampling rateis similar to [9] and therefore does not achieve the rate of innovation. Two alternativemultichannel methods were proposed in [40] and [41]. These approaches, which arebased on a chain of integrators [40] and exponential filters [41], allow only sampling ofinfinite streams of Diracs at the rate of innovation. In addition, we show in the simulationsection, that these methods are unstable, especially for high rates of innovation.

170 J. A. Urigüen, Y. C. Eldar, P. L. Dragotti, and Z. Ben-Haim
x(t)
1τ
τ0 (·)dt
1τ
τ0 (·)dt
e+j 2πτ Kt
X [−K]
e−j 2πτ Kt
X [+K]
Figure 4.5 Multichannel sampling scheme for periodic FRI signals. The resulting samples are the Fourierseries coefficients of x(t). Note that we only sample once every period, thus T = τ .
Periodic FRI signalsConsider a τ -periodic stream of K pulses, as in (4.18). Recall from Section 4.3.1 that ifthe Fourier coefficients of this signal are available, then standard techniques of spectralanalysis can be used to recover the unknown pulse shifts and amplitudes. The multi-channel setup, shown in Figure 4.5, provides a simple and intuitive method for obtainingthese Fourier coefficients by correlating the signal x(t) with the Fourier basis functions
s(t) =
ej 2π
τ t, t ∈ [0, τ ],
0, elsewhere,(4.48)
for ∈L, where L is a set of 2K contiguous integers. We set the sampling interval T tobe equal to the signal period τ , yielding a total sampling rate of 2K/T for all channels.Thus we have a sampling scheme functioning at the rate of innovation, and yielding 2K
Fourier coefficients of x(t). These can then be used to recover the original signal, forexample using the annihilating filter method discussed in Section 4.3.1. An additionaladvantage of this approach is that the kernels have compact support; indeed, the supportcorresponds to precisely one period of the FRI signal, which is smaller than the supportof the kernel proposed in Section 4.3.2. This property will facilitate the extension of themultichannel system to infinite FRI signals.
Instead of functions of the form (4.48), one can just as well use sampling kernels whichare a linear combination of these sinusoids, as in Figure 4.6. This can be advantageousfrom a hardware point of view, since it may be difficult in practice to implement accuratesinusoids. On the other hand, by allowing such linear combinations, the modulatingfunctions s(t) can be chosen to have a simple form, such as lowpassed versions ofbinary sequences [11]. These sequences were shown to be advantageous in other sub-Nyquist configurations as well, such as the modulated wideband converter, designed tosample wideband signals at sub-Nyquist rates [42,43], and sampling of streams of pulseswith unknown shapes [21]. In addition, in real-life scenarios one or more channels mightfail, due to malfunction or noise corruption, and therefore we lose the information stored
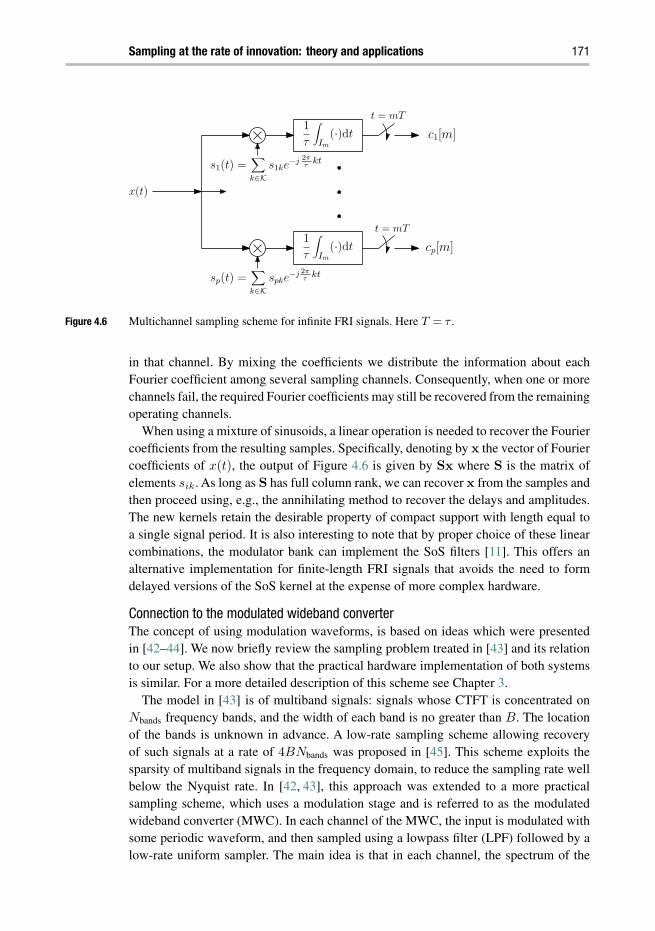
Sampling at the rate of innovation: theory and applications 171
x(t)
1τ Im
(·)dt c1[m]t = mT
cp[m]t = mT
s1(t) =k∈K
s1ke−j 2π
τkt
sp(t) =k∈K
spke−j 2π
τkt
1τ Im
(·)dt
Figure 4.6 Multichannel sampling scheme for infinite FRI signals. Here T = τ .
in that channel. By mixing the coefficients we distribute the information about eachFourier coefficient among several sampling channels. Consequently, when one or morechannels fail, the required Fourier coefficients may still be recovered from the remainingoperating channels.
When using a mixture of sinusoids, a linear operation is needed to recover the Fouriercoefficients from the resulting samples. Specifically, denoting by x the vector of Fouriercoefficients of x(t), the output of Figure 4.6 is given by Sx where S is the matrix ofelements sik. As long as S has full column rank, we can recover x from the samples andthen proceed using, e.g., the annihilating method to recover the delays and amplitudes.The new kernels retain the desirable property of compact support with length equal toa single signal period. It is also interesting to note that by proper choice of these linearcombinations, the modulator bank can implement the SoS filters [11]. This offers analternative implementation for finite-length FRI signals that avoids the need to formdelayed versions of the SoS kernel at the expense of more complex hardware.
Connection to the modulated wideband converterThe concept of using modulation waveforms, is based on ideas which were presentedin [42–44]. We now briefly review the sampling problem treated in [43] and its relationto our setup. We also show that the practical hardware implementation of both systemsis similar. For a more detailed description of this scheme see Chapter 3.
The model in [43] is of multiband signals: signals whose CTFT is concentrated onNbands frequency bands, and the width of each band is no greater than B. The locationof the bands is unknown in advance. A low-rate sampling scheme allowing recoveryof such signals at a rate of 4BNbands was proposed in [45]. This scheme exploits thesparsity of multiband signals in the frequency domain, to reduce the sampling rate wellbelow the Nyquist rate. In [42, 43], this approach was extended to a more practicalsampling scheme, which uses a modulation stage and is referred to as the modulatedwideband converter (MWC). In each channel of the MWC, the input is modulated withsome periodic waveform, and then sampled using a lowpass filter (LPF) followed by alow-rate uniform sampler. The main idea is that in each channel, the spectrum of the

172 J. A. Urigüen, Y. C. Eldar, P. L. Dragotti, and Z. Ben-Haim
signal is shuffled, such that a portion of the energy of all bands appears at baseband.Mixing the frequency bands in [43] is analogous to mixing the Fourier coefficients inFigure 4.6.
We note here some differences between the methods. First, following the mixing stage,we use an integrator in contrast to the LPF used in [43]. This is a result of the differentsignal quantities measured: Fourier coefficients in our work as opposed to the frequencybands content in [43]. The second difference is in the purpose of the mixing procedure.In [43] mixing is performed to reduce the sampling rate relative to the Nyquist rate.In our setting, the mixing is used in order to simplify hardware implementation and toimprove robustness to failure in one of the sampling channels.
Nonetheless, the hardware considerations in the mixing stage in both systems aresimilar. Recently, a prototype of the MWC has been implemented in hardware [42].This design is composed of P = 4 sampling channels, where the repetition rate of themodulating waveforms is 1/T ≈ 20 MHz. In each period there are 108 rectangularpulses. This prototype, with certain modifications, can be used to implement our samplingscheme as well. These modifications mainly include adding shaping filters on modulatingwaveforms lines, and reducing the number of rectangular pulses in each period.
Infinite FRI signalsConsider an infinite-duration FRI signal of the form (4.39), where we use T = τ . Further-more, suppose that the T -local rate of innovation is 2K/T , for some specified value T .Thus, there are no more than K pulses in any interval of size T , i.e. Im = [(m−1)T,mT ].Assume further that the pulses do not overlap interval boundaries, i.e., if tk ∈ Im thenp(t− tk) = 0 for all t /∈ Im. Such a requirement automatically holds if p(t) is a Dirac,and will hold with high probability as long as the support of p(t) is substantially smallerthan T .
The signal parameters in each interval can now be treated separately. Specifically,consider the T -periodic signal obtained by periodic continuation of the values of x(t)
within a particular interval Im. This periodic signal can be recovered by obtaining 2K ofits Fourier coefficients. As explained above, these coefficients can be determined usingsampling kernels of the form (4.48), whose support is limited to the interval Im itself(rather than its periodic continuation).
This precise technique can thus be used directly on the non-periodic signal x(t),since the portion of the periodic signal which is sampled includes only the intervalIm [11]. Specifically, this requires obtaining a sample from each of the channels onceevery T seconds, and using P ≥ 2K channels. The resulting procedure is equivalent to amultichannel sampling scheme with rate 1/T , as depicted in Figure 4.6. Observe that thesuccess of this technique hinges on the availability of sampling kernels whose supportis limited to a single period of the periodic waveform. The output of the channel isequal to c[m] = Sx[m] where S is the matrix of elements sik, and x[m] are the Fouriercoefficients of x(t) over the interval Im. We can then invert S to obtain the Fouriercoefficients over each interval.

Sampling at the rate of innovation: theory and applications 173
Semi-periodic FRI signalsThe multichannel scheme is also effective for reconstructing FRI signals having thesemi-periodic structure of (4.20). That is, signals consisting of K pulses occurring atrepeated intervals T , with amplitudes ak[m] which vary from one period to the next.The modulator approach can be used as in the infinite case, with the difference that nowthe samples from different periods can be jointly processed to improve performance.
Specifically, as before, we can recover x[m] from the output of the modulator bank.Since the delays are constant for each interval Im, it can be shown (after normalizingthe Fourier coefficients by the Fourier coefficients of the pulse if necessary) that in thefrequency domain
x[m] = N(t)a[m], m ∈ Z, (4.49)
where a[m] is the vector of coefficients ak[m], and N(t) is the P ×K Vandermonde
matrix with kth element e−j2πktT . When only one time instant m is available, we can
solve (4.49) by using the annihilating filter method to recover the delays t, and thenthe coefficients ak[m]. However, now we have many vectors x[m] that share the samedelays, namely, use the same matrixN. This allows the use of robust methods that recoverthe delays more reliably, by jointly processing the samples for all m. Examples includethe ESPRIT [46] or MUSIC [47] algorithms. These approaches, known as subspacemethods, are far more robust than techniques based on a single set of samples. Theyproceed by computing the correlation matrix
∑m∈Z
x[m]xT [m], and then separate therange of this matrix into two subspaces, the signal and noise subspaces. The delaysassociated with the matrix N are then found by exploiting this decomposition.
Clearly, the condition for the general infinite model P ≥ 2K is a sufficient conditionhere as well in order to ensure recovery of x(t). However the additional prior on thesignal’s structure can be used to reduce the number of sampling channels. In particularit is sufficient to use
P ≥ 2K − η +1 (4.50)
channels, where η is the dimension of the minimal subspace containing the vector seta[m],m∈ Z. This condition implies that in some cases the number of channels P canbe reduced beyond the lower limit 2K for the general model.
An alternative scheme for the semi-periodic setting is the filterbank system. The advan-tage of this technique is that one need not assume the existence of distinct pulse intervals,nor is it necessary for the pulse shape to have compact support [17]. Here as well wewill exploit the periodicity to jointly process the samples by using subspace methods.
When the pulse shape p(t) is arbitrary, the derivation departs somewhat from thecanonical technique presented in Section 4.3.1. This is a result of the fact that the signalis not periodic and cannot be divided into distinct intervals, so that one can no longerspeak of its Fourier series. Instead, assume that the sampling interval T equals the signalperiod τ . The DTFT of the samples (4.46) is then
c
(ejωT
)=
1
T
∑m∈Z
s∗
(ω− 2π
Tm
)x
(ω− 2π
Tm
)(4.51)

174 J. A. Urigüen, Y. C. Eldar, P. L. Dragotti, and Z. Ben-Haim
where the Fourier transform of a function f(t) is denoted f(ω). By computing the Fouriertransform of the semi-periodic signal x(t) of (4.20), we have
c
(ejωT
)=
K−1∑k=0
ak
(ejωT
)e−jωtk
1
T
∑m∈Z
s∗
(ω− 2π
Tm
)p
(ω− 2π
Tm
)ej 2π
T mtk ,
(4.52)where we used the fact that ak
(ejωT
)is 2π/T -periodic.
Let us restrict our attention to ω ∈ [0,2π/T ), which can be done without loss ofinformation since expressions in the DTFT domain are 2π/T -periodic. Denote byc(ejωT ) the length-P column vector whose th element is c(e
jωT ), and by a(ejωT )
the length-K column vector whose kth element is ak(ejωT ). Also define the vectort = (t0, . . . , tK−1)
T . We can then write (4.52) in matrix form as
c(ejωT
)= M
(ejωT ,t
)D(ejωT ,t
)a(ejωT
). (4.53)
Here M(ejωT ,t
)is a P ×K matrix whose kth element is
Mk
(ejωT ,t
)=
1
T
∑m∈Z
s∗
(ω− 2π
Tm
)p
(ω− 2π
Tm
)ej 2π
T mtk , (4.54)
and D(ejωT ,t
)is a diagonal matrix whose kth diagonal element equals e−jωtk .
Defining the vector b(ejωT
)as
b(ejωT
)= D
(ejωT ,t
)a(ejωT
), (4.55)
we can rewrite (4.53) in the form
c(ejωT
)= M
(ejωT ,t
)b(ejωT
). (4.56)
Our problem can then be reformulated as that of recovering b(ejωT
)and the unknown
delay set t from the vectors c(ejωT
), for all ω ∈ [0,2π/T ). Once these are known, the
vectors a(ejωT
)can be recovered using the relation in (4.55).
To proceed, we focus our attention on sampling filters s(ω) with finite support in thefrequency domain, contained in the frequency range
F =
[2π
Tγ,
2π
T(P +γ)
], (4.57)
where γ ∈ Z is an index which determines the working frequency band F . This choiceshould be such that it matches the frequency occupation of p(t) (although p(t) doesnot have to be bandlimited). This freedom allows our sampling scheme to support bothcomplex and real-valued signals. For simplicity, we assume here that γ = 0. Under thischoice of filters, each element Mk
(ejωT ,t
)of (4.54) can be expressed as
Mk
(ejωT ,t
)=
P∑m=1
Wm
(ejωT
)Nmk (t) , (4.58)

Sampling at the rate of innovation: theory and applications 175
where W(ejωT
)is a P ×P matrix whose mth element is given by
Wm
(ejωT
)=
1
Ts∗
(ω +
2π
T(m− 1+ γ)
)p
(ω +
2π
T(m− 1+ γ)
),
and N(t) is a P ×K Vandermonde matrix. Substituting (4.58) into (4.56), we have
c(ejωT ) = W(ejωT
)N(t)b(ejωT ). (4.59)
If W(ejωT
)is stably invertible, then we can define the modified measurement vector
d(ejωT
)as d
(ejωT
)= W−1
(ejωT
)c(ejωT
). This vector satisfies
d(ejωT
)= N(t)b
(ejωT
). (4.60)
Since N(t) is not a function of ω, from the linearity of the DTFT, we can express (4.60)in the time domain as
d [n] = N(t)b [n] , n ∈ Z. (4.61)
The elements of the vectors d [n] and b [n] are the discrete time sequences, obtained fromthe inverse DTFT of the elements of the vectors b
(ejωT
)and d
(ejωT
)respectively.
Equation (4.61) has the same structure as (4.49) and can therefore be treated in asimilar fashion. Relying on methods such as ESPRIT and MUSIC one can first recovert from the measurements [17]. After t is known, the vectors b
(ejωT
)and a
(ejωT
)can
be found using linear filtering relations by
b(ejωT
)= N† (t)d
(ejωT
). (4.62)
Since N(t) is a Vandermonde matrix, its columns are linearly independent, andconsequently N†N = IK . Using (4.55),
a(ejωT
)= D−1 (ejωT ,t
)N† (t)d
(ejωT
). (4.63)
The resulting sampling and reconstruction scheme is depicted in Figure 4.7.Our last step is to derive conditions on the filters s∗
1(−t), . . . ,s∗P (−t) and the function
p(t) such that the matrix W(ejωT
)will be stably invertible. To this end, we decompose
the matrix W(ejωT
)as
W(ejωT
)= S
(ejωT
)P(ejωT
)(4.64)
where S(ejωT
)is a P ×P matrix whose mth element is
Sm
(ejωT
)=
1
Ts∗
(ω +
2π
T(m− 1+ γ)
)(4.65)
and P(ejωT
)is a P ×P diagonal matrix with mth diagonal element
Pmm
(ejωT
)= p
(ω +
2π
T(m− 1+ γ)
). (4.66)

176 J. A. Urigüen, Y. C. Eldar, P. L. Dragotti, and Z. Ben-Haim
s∗1 (−t)
...x (t)
t = nT
t = nT
...
c1 [n]
s∗p (−t)
cp [n]
W−1 ejωT
d1 [n]
dp [n]
D−1 ejωT , t N† (t) ...
a1 [n]
aK [n]
Figure 4.7 Sampling and reconstruction scheme for a semi-periodic signal.
We can guarantee stable invertibility of W(ejωT ) by ensuring that both S(ejωT ) andP(ejωT ) are stably invertible. From (4.66), it is readily seen that the matrix P(ejωT ) isstably invertible if there exist constants a,b ∈ R such that
0 < a ≤ |p(ω)| ≤ b < ∞ almost everywhere ω ∈F . (4.67)
In addition, the filters s∗ (−t) should be chosen in such a way that they form a stably
invertible matrix S(ejωT
). One example of a set of sampling kernels satisfying this
requirement is the ideal bandpass filterbank given by
s(ω) =
T, ω ∈
[(− 1) 2π
T , 2πT
],
0, otherwise.(4.68)
Another example is an LPF with cutoff πP/T followed by a uniform sampler at a rateof P/T . The samples can then be converted into P parallel streams to mimic the outputof P branches. Further discussion of sampling kernels satisfying these requirements canbe found in [17].
To summarize, we derived a general technique for the recovery of pulse parametersfrom a semi-periodic pulse stream. The technique is outlined in Figure 4.7. This methodis guaranteed to perfectly recover the signal parameters from samples taken at a totalrate of 2K/T or higher, provided that the pulse shape satisfies the stability condition(4.67) and the sampling kernels are chosen so as to yield a stable recovery matrix, forexample by using the bandpass filterbank (4.68).
4.4 The effect of noise on FRI recovery
Real-world signals are often contaminated by noise and thus do not conform preciselyto the FRI scheme. Furthermore, like any mathematical model, the FRI framework isan approximation which does not precisely hold in practical scenarios, an effect knownas mismodeling error. It is therefore of interest to design noise-robust FRI recoverytechniques.

Sampling at the rate of innovation: theory and applications 177
x(t) h(t) = ϕ − tT
yn
Analog noise
T
Digital noise
Acquisition device
Figure 4.8 Noise perturbations in a “real-world” sampling set up. The continuous signal x(t) can becorrupted both in the analog and the digital paths.
Noise may arise both in the analog and digital domains, i.e., before and after sampling,as illustrated in Figure 4.8. The resulting samples can then be written as
yn = 〈x(t),h(t−nT )〉+ εn (4.69)
with εn being the overall noise introduced in the process.When noise is present, it is no longer possible to perfectly recover the original signal
from its samples. However, one can sometimes mitigate the effects of noise by oversam-pling, i.e., by increasing the sampling rate beyond the rate of innovation. In Section 4.4.3we describe several modifications of the recovery techniques of Section 4.3 designedfor situations in which a larger number of measurements is available. These are basedon the noise model we introduce in Section 4.4.2.
Oversampling increases the number of measurements of the signal, and it is conse-quently not surprising that this technique can sometimes be used to improve performanceunder noise. However, the degree to which improvement is possible depends on the set-ting under consideration. Indeed, in some cases sampling at the rate of innovation isoptimal even in the presence of noise, and cannot be improved by oversampling. Reach-ing such conclusions requires a theoretical analysis of the effects of noise on the abilityto recover FRI signals. This issue will be discussed in Sections 4.4.1 and 4.4.2.
4.4.1 Performance bounds under continuous-time noise
In the next two sections, we analyze the effect of noise on the accuracy with which FRIsignals can be recovered.Astandard tool for accomplishing this is the Cramér–Rao bound(CRB), which is a lower bound on the MSE achievable by any unbiased estimator [48].As such, it provides a measure of the difficulty of a given estimation problem, and canindicate whether or not existing techniques come close to optimal. It can also be used tomeasure the relative merit of different types of measurements. Thus, we will see that theCRB can identify which of the sampling kernels proposed in Section 4.3 provides morerobustness to noise, as well as quantify the benefit achievable by oversampling.
As we have already mentioned, in practical applications two types of noise may arise,namely, continuous-time noise which corrupts the signal prior to sampling, and discretenoise contributed by the sampling system (see Figure 4.8). To simplify the discussion,we separately examine each of these models: we begin below with continuous-time noiseand discuss sampling noise in Section 4.4.2. Further details concerning the combinedeffect of the two sources of noise can be found in [12].

178 J. A. Urigüen, Y. C. Eldar, P. L. Dragotti, and Z. Ben-Haim
For the purpose of the performance analysis, we focus on finite-duration FRI signals ofthe form (4.19). Thus, our signal x(t) is determined by a finite number 2K of parametersak, tkK−1
k=0 . For future use, we define the parameter vector
θ = (t0, . . . , tK−1,a0, . . . ,aK−1)T . (4.70)
An important aspect of continuous-time noise is that it is independent of the samplingprocess. This noise model can thus be used to identify ultimate limits on the achievableestimation accuracy of a given signal. To be specific, suppose we sample the signal
y(t) = x(t)+w(t) (4.71)
where x(t) is the finite-duration FRI signal (4.19) and w(t) is continuous-time whiteGaussian noise with variance σ2.
Sampling-indifferent boundTo bound the MSE that can be achieved by any sampling method, it is of interest to derivethe CRB for estimating x(t) directly from the continuous-time process y(t). Clearly, nosampling mechanism can do better than exhausting all of the information containedin y(t).
This bound turns out to have a particularly simple closed-form expression whichdepends on the number of pulses in the signal (or, equivalently, on the rate of innovation) –but not on the class of FRI signals being estimated. Indeed, for a signal x(t) of duration τ ,it can be shown that the MSE of any unbiased, finite-variance estimator x(t) satisfies [12]
1
τ
∫E(|x(t)− x(t)|2
)dt ≥ ρτσ2 (4.72)
where we recall that the τ -local rate of innovation satisfies ρτ = 2K/τ for finite FRIsignals.
Thus, in the noisy setting, the rate of innovation can be given a new interpretationas the ratio between the best achievable MSE and the noise variance σ2. This is to becontrasted with the characterization of the rate of innovation in the noise-free case asthe lowest sampling rate allowing for perfect recovery of the signal; indeed, when noiseis present, perfect recovery is no longer possible.
Bound for sampled measurementsWe next consider a lower bound for estimating x(t) from samples of the signal y(t) of(4.71). To keep the discussion general, we consider samples of the form
yn = 〈y(t),ϕn(t)〉 , n = 0, . . . ,N − 1 (4.73)
whereϕn(t) is a set of sampling kernels. For example, pointwise sampling at the outputof an anti-aliasing filter ϕ(−t) corresponds to the sampling kernels ϕn(t) = ϕ(t−nT ).We denote by Φ the subspace spanned by the sampling kernels. In this setting, the samplesinherit the noise w(t) embedded in the signal y(t). Note that unless the sampling kernels

Sampling at the rate of innovation: theory and applications 179
ϕn(t) happen to be orthogonal, the resulting measurements will not be statisticallyindependent. This is a crucial difference with respect to the sampling noise model ofSection 4.4.2 below.
We assume that there exists a Fréchet derivative ∂x/∂θ which quantifies the sensitivityof x(t) to changes in θ. Informally, ∂x/∂θ is an operator from R2K to the space ofsquare-integrable functions L2 such that
x(t)|θ+δ ≈ x(t)|θ +∂x
∂θδ. (4.74)
Suppose for a moment that there exist elements in the range space of ∂x/∂θ which areorthogonal to Φ. This implies that one can perturb x(t) without changing the distributionof the measurements y0, . . . , yN−1. This situation occurs, for example, when the numberof measurements N is smaller than the number 2K of parameters defining x(t). While itmay still be possible to reconstruct some of the information concerning x(t) from thesemeasurements, this is an undesirable situation from an estimation point of view. Thuswe will assume that
∂x
∂θ∩Φ⊥ = 0. (4.75)
Under these assumptions, it can be shown that any unbiased, finite-variance estimatorx(t) of x(t) from the samples (4.73) satisfies [12]
1
τ
∫E(|x(t)− x(t)|2
)dt ≥ σ2
τTr
[(∂x
∂θ
)∗(∂x
∂θ
)((∂x
∂θ
)∗PΦ
(∂x
∂θ
))−1]
(4.76)
where PΦ is the projection onto the subspace Φ.Note that despite the involvement of continuous-time operators, the expression within
the trace in (4.76) is a 2K×2K matrix and can therefore be computed numerically. Alsoobserve that, in contrast to the continuous-time bound of (4.72), the sampled bounddepends on the value of θ. Thus, for a specific sampling scheme, some signals canpotentially be more difficult to estimate than others.
As expected, the sampled bound (4.76) is never lower than the ultimate (sample-indifferent) bound (4.72). However, the two bounds can sometimes coincide. If thisoccurs, then at least in terms of the performance bounds, estimators based on the samples(4.73) will suffer no degradation compared with the “ideal” estimator based on the entireset of continuous-time measurements. Such a situation occurs if x(t)∈Φ for any feasiblevalue of x(t), a situation which we refer to as “Nyquist-equivalent” sampling. In thiscase, PΦ
∂x∂θ = ∂x
∂θ , so that (4.76) reduces to
1
τ
∫E(|x(t)− x(t)|2
)dt ≥ σ2
τTr(I2K×2K) = σ2ρτ (4.77)
and the two bounds coincide.Many practical FRI signal models are not contained in any finite-dimensional sub-
space, and in these cases, any increase in the sampling rate can improve estimation

180 J. A. Urigüen, Y. C. Eldar, P. L. Dragotti, and Z. Ben-Haim
performance. Even if there exists a subspace containing the entire family of FRI signals,its dimension is often much larger than the number of parameters 2K defining thesignal; consequently, fully exploiting the information in the signal requires sampling atthe Nyquist-equivalent rate, which is potentially much higher than the rate of innovation.This fact provides an analytical explanation of the empirically observed phenomena thatoversampling often provides improvement over sampling at the rate of innovation in thepresence of noise. A practical example of the benefit of oversampling is described inSection 4.5.
It is interesting to examine this phenomenon from a union of subspaces viewpoint.Suppose that the set of feasible signals X can be described as a union of an infinitenumber of subspaces Uα indexed by the continuous parameter α, so that
X =⋃α
Uα. (4.78)
In this case, a finite sampling rate captures all of the information present in the signal ifand only if
dim
(∑α
Uα
)< ∞ (4.79)
where dim(M) is the dimension of the subspace M. By contrast, in the noise-free case,it has been previously shown [7] that the number of samples required to recover x(t) isgiven by
maxα1,α2
dim(Uα1 +Uα2), (4.80)
i.e., the largest dimension among sums of two subspaces belonging to the union. In gen-eral, the dimension of (4.79) will be much higher than (4.80), illustrating the qualitativedifference between the noisy and noise-free settings. For example, if the subspaces Uα
are finite dimensional, then (4.80) is also necessarily finite, whereas (4.79) need not be.The bounds developed for analog noise can also be used to optimize the sampling
kernels for a given fixed rate. Under certain assumptions, it can be shown that for thecase of finite pulse streams, using exponential functions, or Fourier samples, as in theschemes of [10, 11], is optimal. However, in some cases of pulse shapes the boundsdemonstrate that there is room for substantial improvement in the reconstruction stageof these algorithms. Another insight gained from these bounds is that estimation in thesemi-periodic setting is far more robust than in the infinite case. As we have discussed,this is because joint processing of the samples is possible. As a rule of thumb, it appearsthat for union of subspace signals, performance is improved at low-rates if most of theparameters identify the position within the subspace, rather than the subspace itself.
4.4.2 Performance bounds under sampling noise
In this section, we derive the CRB for estimating the parameters of a finite-duration FRIsignal (4.19) from samples, in the presence of discrete sampling noise. Specifically, we
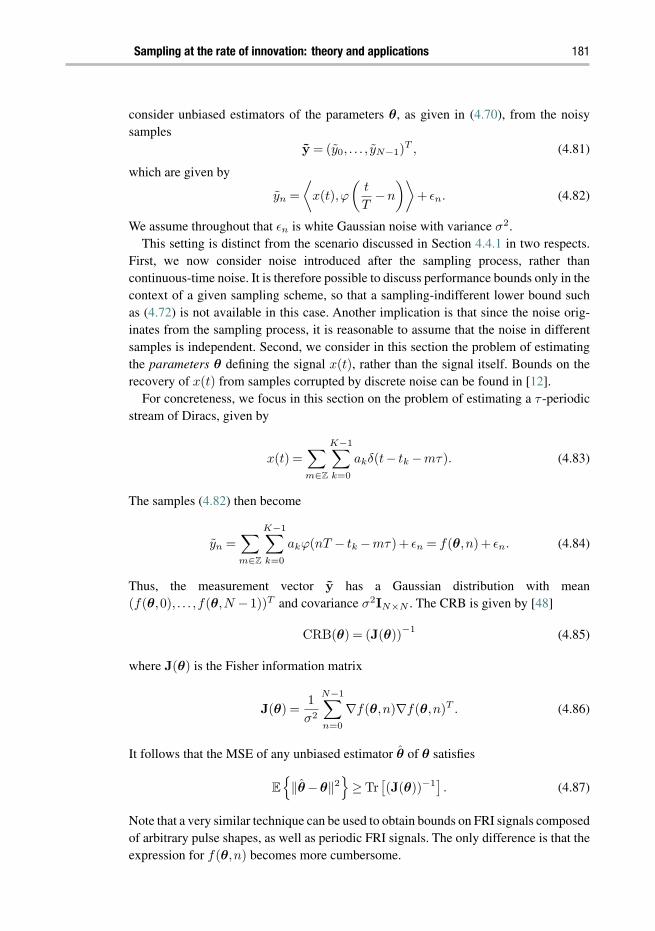
Sampling at the rate of innovation: theory and applications 181
consider unbiased estimators of the parameters θ, as given in (4.70), from the noisysamples
y = (y0, . . . , yN−1)T , (4.81)
which are given by
yn =
⟨x(t),ϕ
(t
T−n
)⟩+ εn. (4.82)
We assume throughout that εn is white Gaussian noise with variance σ2.This setting is distinct from the scenario discussed in Section 4.4.1 in two respects.
First, we now consider noise introduced after the sampling process, rather thancontinuous-time noise. It is therefore possible to discuss performance bounds only in thecontext of a given sampling scheme, so that a sampling-indifferent lower bound suchas (4.72) is not available in this case. Another implication is that since the noise orig-inates from the sampling process, it is reasonable to assume that the noise in differentsamples is independent. Second, we consider in this section the problem of estimatingthe parameters θ defining the signal x(t), rather than the signal itself. Bounds on therecovery of x(t) from samples corrupted by discrete noise can be found in [12].
For concreteness, we focus in this section on the problem of estimating a τ -periodicstream of Diracs, given by
x(t) =∑m∈Z
K−1∑k=0
akδ(t− tk −mτ). (4.83)
The samples (4.82) then become
yn =∑m∈Z
K−1∑k=0
akϕ(nT − tk −mτ)+ εn = f(θ,n)+ εn. (4.84)
Thus, the measurement vector y has a Gaussian distribution with mean(f(θ,0), . . . ,f(θ,N − 1))T and covariance σ2IN×N . The CRB is given by [48]
CRB(θ) = (J(θ))−1 (4.85)
where J(θ) is the Fisher information matrix
J(θ) =1
σ2
N−1∑n=0
∇f(θ,n)∇f(θ,n)T . (4.86)
It follows that the MSE of any unbiased estimator θ of θ satisfies
E‖θ−θ‖2
≥ Tr
[(J(θ))−1] . (4.87)
Note that a very similar technique can be used to obtain bounds on FRI signals composedof arbitrary pulse shapes, as well as periodic FRI signals. The only difference is that theexpression for f(θ,n) becomes more cumbersome.

182 J. A. Urigüen, Y. C. Eldar, P. L. Dragotti, and Z. Ben-Haim
Table 4.1. Summary of the uncertainties on the locations and amplitudes for various samplingkernels. The uncertainties are obtained from the Cramér–Rao Bounds derived in the Appendix.
Kernel ∆t0τ
≥ ∆a0|a0| ≥
sinc 1π
√τN
3(B2τ2−1)PSNR− 1
2√
τN
PSNR− 12
B-spline 23
1N
√τN
PSNR− 12 2√
3
√τN
PSNR− 12
E-spline ω0−cosω0 sinω0ω0 sinω0
1ω0N
√τN
PSNR− 12 1
ω0
√ω20−cos2 ω0 sin2 ω0
ω0 sin2 ω0
√τN
PSNR− 12
SoS 12π
√τN
∑k∈K |bk|2∑
k∈K k2|bk|2 PSNR− 12
√τN
PSNR− 12
Comparing sampling kernels in the presence of noiseAs an example for which closed-form expressions of the CRB can be obtained, we nowconsider the special case of estimating the parameters of a periodic stream of Diracsin which each period contains a single pulse. We thus have K = 1, and the unknownparameters are θ = (t0,a0)
T . While this is a very simple case, the ability to derivea closed form will enable us to reach conclusions about the relative merit of varioussampling schemes. In particular, we will compare the bounds obtained using the sinc,B-spline, E-spline, and SoS sampling kernels.
The CRBs for estimating this periodic FRI signal using various kernels are derived intheAppendix. The square root of the resulting MSE is then used to bound the uncertaintiesin the locations and amplitudes. The expressions obtained for B-splines and E-splinesdepend on t0. We remove this dependency by assuming that t0 is uniformly distributedover τ and then compute the expected values of the uncertainties. We restrict our analysisto cardinal and trigonometric exponential splines [35]. For all the derivations and thesummary given in this section we define the peak signal-to-noise ratio (SNR) as PSNR=
(a0/σ)2. To obtain a fair comparison between the sampling kernels under consideration
the kernels are normalized to have unit norm.To compare the different kernels, assume that the sinc kernel is chosen with Bτ = N
for odd N and Bτ = N −1 for even N , as is commonly accepted [19]. Also assume thatthe SoS kernel has bk =1 for all k, which yields optimal results for this kernel [10]. Underthese assumptions, it can be seen from Table 4.1 that the uncertainties in the locationfor all the kernels follow the same trend, up to a constant factor: they are proportionalto 1
N
√τN PSNR− 1
2 . Thus, performance improves considerably with an increase in thesampling rate (corresponding to larger values of N ), and also improves as the squareroot of the SNR. Interestingly, it can easily be shown that the SoS kernel has preciselythe same uncertainty as that of the sinc kernel. To see this, note that |K| = 2M +1 andthat the number of samples has to satisfy N ≥ |K| ≥ 2K.
Using typical values for the parameters of the results given in Table 4.1 we can comparethe performance of the kernels. For instance, assume a fixed interval τ = 1, and constantnumber of samples N = 32, with sampling period T = τ/N for all the kernels, bk = 1,∀k

Sampling at the rate of innovation: theory and applications 183
for the SoS, P = 1 for the B-spline and P = 1 and ω0 = 2π/N for the E-spline, withonly K = 1 Diracs. In this situation, the sinc and SoS kernels have the best behavior,both in terms of uncertainty in the location and amplitude. For the B-spline and E-splinekernels of lowest possible order (P = 1), the uncertainties are almost identical, andslightly worse than optimal. For any support larger than the minimum, the uncertaintiesachieved by these latter kernels increase.
4.4.3 FRI techniques improving robustness to sampling noise
A central step in each of the reconstruction algorithms examined in Section 4.3 wasthe search for an annihilating filter hmK
m=0 which satisfies a given system of linearequations (4.26). This annihilation equation was obtained by observing that x∗h = 0 forany filter hm whose z-transform has roots (zeros) at the values uk = e−j2π
tkτ K−1
k=0 .In the noise-free setting it was sensible to choose hm having degree K, the lowestpossible degree for a filter with K zeros. However, any filter of degree L ≥ K can alsobe chosen, as long as ukK−1
k=0 are among its L zeros. Conversely, any filter whichannihilates the coefficients xm is also such that the values uk are among its zeros.
When noise is present in the system, we can no longer compute the sequence xmprecisely; instead, we have access only to a noisy version ˆxm. On the other hand, sincethe annihilating equation is satisfied for any contiguous sequence within xm, we canchoose to increase the number of measurements, and consequently obtain the sequenceˆxm in the range −M ≤ m ≤ M , for some M > L/2. The annihilating equation canthen be written as
ˆx−M+Lˆx−M+L−1 · · · ˆx−M
ˆx−M+L+1 ˆx−M+L · · · ˆx−M+1...
.... . .
...ˆxM
ˆxM−1 · · · ˆxM−L
h0
h1...
hL
≈
0
0...0
(4.88)
which has 2M − L + 1 equations and L + 1 unknowns. The equation is not satisfiedexactly due to the presence of noise in the measurements ˆxm. Equivalently, we canwrite the same equation more compactly as
Ah≈ 0 (4.89)
where the tilde sign in A serves to remind us of the fact that this matrix contains noisymeasurements. We will denote by A the matrix obtained when we form the same systemof equations with noiseless measurements.
Note that we do not require h0 = 1. Indeed, there exist L−K +1 linearly independentpolynomials of degree L with zeros at uk. Thus, there are L−K +1 independent vectorsh that satisfy (4.88). In other words, the rank of A never exceeds K. This is a key pointwhich forms the basis for many of the methods for signal reconstruction in the presenceof noise. We now review two such techniques, namely the total least-squares approachand Cadzow iterative algorithm introduced in [19]. Note that for these techniques to work

184 J. A. Urigüen, Y. C. Eldar, P. L. Dragotti, and Z. Ben-Haim
as explained next, the sampled noise εn has to be a set of additive, white and Gaussianmeasurements.
Total least-squares approachIn the presence of noise, the measurements xm are not known precisely, and one there-fore has access only to a noisy version A of matrix A, so that the modified annihilatingequation (4.89) is true. However, it is reasonable to seek an approximate solution to(4.89) by using the method of total least-squares (TLS) [19], which is defined as thesolution to the minimization problem
minh
‖Ah‖2 subject to ‖h‖2 = 1. (4.90)
It is not difficult to show that the filter h solving (4.90) is given by the singular vectorcorresponding to the smallest singular value of A. Once the filter h is found, one candetermine its roots and hence identify the time delays, as explained in Section 4.3.
Cadzow iterative denoising algorithmWhen the level of noise increases, the TLS approach becomes unreliable. Therefore, itis necessary to use a technique that reduces the noise prior to applying TLS. The idea ofthe Cadzow technique is to exploit the fact that the noise-free matrix A is Toeplitz withrank K. Our goal is therefore to find a rank-K Toeplitz matrix A′ which is closest tothe noisy matrix A, in the sense of a minimal Frobenius norm. Thus, we would like tosolve the optimization problem
minA′
‖A−A′‖2F such that rank(A′) ≤ K and A′ is Toeplitz. (4.91)
To solve (4.91), we employ an algorithm that iteratively updates a target matrix B untilconvergence. The iterations alternate between finding the best rank-K approximationand finding the best Toeplitz approximation to B. Thus, we must independently solvethe two optimization problems
minA′
‖B−A′‖2F such that rank(A′) ≤ K (4.92)
and
minA′
‖B−A′‖2F such that A′ is Toeplitz. (4.93)
The solution to (4.93) is easily obtained by averaging the diagonals of B. To solve(4.92), we compute the singular value decomposition (SVD) B = USV∗ of B, whereU and V are unitary and S is a diagonal matrix whose diagonal entries are the singularvalues of B. We then discard all but the K largest singular values in S. In other words,we construct a diagonal matrix S′ whose diagonal contains the K largest entries in S,and zero elsewhere. The rank-K matrix closest to B is then given by US′V∗.
The entire iterative algorithm for solving (4.91) can be summarized as follows:

Sampling at the rate of innovation: theory and applications 185
1. Let B equal the original (noisy) measurement matrix A.2. Compute the SVD decomposition of B such that B = USV∗, where U and V are
unitary and S is diagonal.3. Build the diagonal matrix S′ consisting of the K largest elements in S, and zero
elsewhere.4. Update B to its best rank-K approximation B = US′V∗.5. Update B to its best Toeplitz approximation by averaging over the diagonals of B.6. Repeat from step (2.) until convergence or until a specified number of iterations has
been performed.
Applying even a small number of iterations of Cadzow’s algorithm will yield a matrixA′ whose error ‖A′ − A‖2
F is much lower than the error of the original measure-ment matrix A. This procedure works best when A is as close as possible to a squarematrix [19], and so a good choice would be to use L = M =
⌊Bτ2
⌋. The denoised
matrix A′ can then be used in conjunction with the TLS technique, as describedpreviously.
4.5 Simulations
In this section we provide some results obtained from implementation of the FRI methodswe described. We first show how perfect reconstruction is possible using the proposedkernels in the absence of noise. We then demonstrate the performance of the variouskernels when samples are corrupted by additive i.i.d. Gaussian noise. In all simulationswe consider only real-valued sampling kernels.
4.5.1 Sampling and reconstruction in the noiseless setting
Figure 4.9 shows an example of the sampling and reconstruction process of Section 4.3.1for periodic inputs consisting of Diracs. Note that in this setting, using a sinc samplingkernel, or an SoS filter with bk = 1 is equivalent. In Figure 4.9(a) we show the originaland reconstructed signals plotted together, while in Figure 4.9(b) we plot the filteredinput and the samples taken at a uniform interval. The reconstruction of the signal isexact to numerical precision.
Figure 4.10 shows perfect reconstruction of K = 4 closely spaced Diracs using areal-valued E-spline. Here again, reconstruction is exact to numerical precision.
As a final example, consider a periodic input x(t) in which each period consists ofK = 5 delayed and weighted versions of a Gaussian pulse, with τ = 1. We select theamplitudes and locations at random. Sampling is performed using an SoS kernel withindices K=−K,. . . ,K and cardinality M = |K|= 2K +1 = 11. We filter x(t) with g(t)
defined in (4.34), and set the coefficients bk,k∈K to be a length-M symmetric Hammingwindow. The output of the filter is sampled uniformly N times, with sampling periodT = τ/N , where N = M = 11. The sampling process is depicted in Figure 4.11(b).The reconstructed and original signals are depicted in Figure 4.11(a). Once again theestimation and reconstruction are exact to numerical precision.

186 J. A. Urigüen, Y. C. Eldar, P. L. Dragotti, and Z. Ben-Haim
0 0.1 0.2 0.3 0.4 0.5 0.6 0.7 0.8 0.9 0
0.1
0.2
0.3
0.4
0.5
0.6
0.7
0.8
(a) Original and reconstruction.
0 0.2 0.4 0.6 0.8 1−0.4
−0.2
0
0.2
0.4
0.6
0.8
1
(b) Samples.
Figure 4.9 Example of sampling and reconstruction of a stream of Diracs with a sinc kernel. (a) The originalsignal along with its reconstruction, exact to numerical precision. (b) Convolution of the sinckernel with the input. The samples, taken at uniform intervals of T seconds, are also indicated.
0 0.2 0.4 0.6 0.8 10
0.1
0.2
0.3
0.4
0.5
0.6
0.7
0.8
0.9
−0.2 0 0.2 0.4 0.6 0.8 1 1.20
0.5
1
1.5
2
2.5
3
3.5
4
4.5
(a) Original and reconstruction. (b) Samples.
Figure 4.10 Sampling and reconstruction of K = 4 closely spaced Diracs with the E-spline kernel. (a) Theoriginal signal along with its reconstruction, exact to numerical precision. (b) Convolution of theE-spline kernel with the input. The samples, taken at uniform intervals of T seconds, are alsoindicated.
4.5.2 Sampling and reconstruction in the presence of noise
In the presence of noise, exact retrieval of the input signal is no longer possible. In orderto obtain reasonable recovery, it is necessary to employ some denoising strategies, suchas those explained in Section 4.4.

Sampling at the rate of innovation: theory and applications 187
1.5
1
0.5
0
–0.5
–1
1.5
1
0.5
0
–0.5
–10 0.2 0.4
time [units of τ]
Am
plitu
de
Am
plitu
de
0.6 0.8
Original signal Filter outputLow-rate samplesEstimates parameters
1 0 0.2 0.4
time [units of τ]
0.6 0.8 1
(a) Original and reconstruction. (b) Samples.
Figure 4.11 Example of sampling and reconstruction of a stream of pulses with an SoS kernel. (a) The trainof pulses, with Gaussian shape, and the estimated parameters. (b) Convolution of the input withthe SoS kernel, and the samples taken at uniform intervals.
Periodic pulse streamsWe start by showing that the proposed robust reconstruction strategies can achieve theCRBs on digital noise given in Section 4.4.2 for a wide range of SNRs. We concentrateon the SoS kernel with coefficients bk = 1. Notice that in this case, the SoS is theDirichlet function and is therefore equivalent to the periodic sinc of [19]. Figure 4.12shows the results of the SoS kernel when the input is a periodic train of K = 3 Diracs,and the samples are corrupted by i.i.d. Gaussian noise with SNR = 10 dB, where we
define the SNR as SNR =‖y‖2
2Nσ2 , for a single realization. We use M =
⌊Bτ2
⌋, and 20
iterations of Cadzow. The result shows that there is a very small error in the estimatedlocations despite the fairly low SNR. There is, however, a bigger error when estimatingthe amplitudes. This happens because the kernel is optimized to minimize the error inthe estimation of the location of the Diracs rather than in the amplitude.
Now we consider a periodic stream with a single Dirac (e.g. K =1). In the simulations,the amplitude of the Dirac is fixed. The samples are corrupted by i.i.d. Gaussian noisewith variance σ2 such that the SNR ranges from −10 dB to 30 dB. We define the errorin time-delay estimation as the average over all experiments of ‖t− t‖2
2, where t and tdenote the true and estimated time delays, respectively, sorted in increasing order. Wethen calculate the square root of the average to obtain the MSE, which equals the standarddeviation for unbiased estimators. Figure 4.13 shows the results obtained from averaging10 000 realizations and using 10 iterations of Cadzow’s algorithm. More specifically,4.13(a) shows the estimated positions with respect to the real location and 4.13(b)the estimation error compared to the deviation predicted by the CRB. The retrieval ofthe FRI signal made of one Dirac is almost optimal for SNR levels above 5 dB sincethe uncertainty on these locations reaches the (unbiased) theoretical minimum given byCRBs.

188 J. A. Urigüen, Y. C. Eldar, P. L. Dragotti, and Z. Ben-Haim
0 0.1 0.2 0.3 0.4 0.5 0.6 0.7 0.8 0.90
0.1
0.2
0.3
0.4
0.5
0.6
0.7
0.8
0 0.2 0.4 0.6 0.8 1−0.4
−0.2
0
0.2
0.4
0.6
0.8
1
(a) Original and reconstruction. (b) Samples.
Figure 4.12 Example of sampling and reconstruction of a stream of Diracs with an SoS kernel. (a) Theoriginal signal to be sampled and its reconstruction, overlapping the input. (b) Convolution ofthe kernel with the input. The noisy samples are also shown.
−10 0 10 20 30 40 500
0.2
0.4
0.6
0.8
1Single Dirac / 21 Noisy samples
Input SNR (dB)
Posi
tion
Retrieved locationsCramér−Rao bound
(a) Scatter plot.
−10 0 10 20 30 40 5010−5
10−3
10−1
100Single Dirac / 21 Noisy samples
Input SNR (dB)
Posi
tion
(b) Standard deviation.
Observed standard deviationCramér−Rao bound
Figure 4.13 Retrieval of the locations of a FRI signal. (a) Scatterplot of the locations. (b) Standard deviation(averaged over 10 000 realizations) compared to the Cramér–Rao lower bound.
The reconstruction quality can be further improved at the expense of oversampling.This is illustrated in Figure 4.14 where two Diracs are reconstructed. Here we showrecovery performance for oversampling factors of 2, 4, and 8.
In the following simulation, we consider exponential reproducing kernels and ana-lyze their performance in the presence of noise. Any exponential reproducing kernelis of the form ϕ(t) = ψ(t) ∗ βα(t) where βα(t) is the E-spline with exponents α =
α0,α1, . . .,αP and ψ(t) can essentially be any function, even a distribution. The aimhere is to understand how to set both α and ψ(t) in order to have maximum resilience

Sampling at the rate of innovation: theory and applications 189
10–2
10–4
10–6
10–8
10 20
Factor 8
No oversampling
30 40 50SNR [dB]
Tim
e-de
lay
estim
atio
n er
ror
[uni
ts o
f τ]
Figure 4.14 Effect of oversampling. The performance of the recovery improves for all SNR when moresamples are available.
to noise when noise is additive i.i.d. Gaussian as assumed so far. It turns out that thebest choice of the exponents is αm = j2π m
N [36]. The choice of ψ(t) is not unique anddepends on the desired support of ϕ(t). If ϕ(t) has the same support as the SoS kernel,then the best choice of ψ(t) leads to an exponential reproducing kernel with the propertythat its coefficients cm,n constitute a DFT. Moreover, when the order P of the result-ing exponential reproducing kernel equals P = N − 1 then the kernel behaves like theDirichlet function [36]. The simulation results of Figure 4.15 confirm the above analysis.Here we retrieve two Diracs in the presence of noise using an E-spline with arbitraryexponents (P = 9, d), an E-spline with the correct exponents αm = j2π m
N (P = 9, o),and finally using two of the most stable exponential reproducing kernels (P = 15,30, n)(the best being the Dirichlet function). We use the notation “d” to indicate default kernel,“o” orthogonal rows of coefficients, and “n” orthonormal rows.
Here, we have N = 31 samples and the input x(t) is a τ -periodic stream of Diracs,where τ = 1 second. We run 1000 experiments contaminating the samples with i.i.d.Gaussian noise of desired SNR by controlling its variance, and we denoise the calcu-lated moments doing 30 iterations of Cadzow’s denoising algorithm. We can see theimprovement in performance by going from the first to the last type of exponentialreproducing kernel. In fact, as expected, proper choice of the exponents αm improvesthe estimation of the locations, and the appropriate choice of ψ(t) enhances the resultsfurther. Interestingly, if we use pure E-splines βα(t) then there is an order from whichthe performance declines. In Figure 4.15 we plot the optimum order (P = 9). In contrast,when we design the optimum exponential reproducing kernel the performance improvesconstantly until it matches that of the Dirichlet kernel.
Finite pulse streamsWe now turn to demonstrate FRI recovery methods when using finite pulse streams. Weexamine four scenarios, in which the signal consists of K = 2,3,5,20 Diracs.1 In our
1 Due to computational complexity of calculating the time-domain expression for high-order E-splines, thefunctions were simulated up to order 9, which allows for K = 5 pulses.

190 J. A. Urigüen, Y. C. Eldar, P. L. Dragotti, and Z. Ben-Haim
0 5 10 15 20 3010−4
10−3
10−2
10−1P = 9, dP = 9, oP = 15, nP = 30, n
Figure 4.15 Sampling with exponential reproducing kernels. Results of the estimation of the location ofK = 2 Diracs in the presence of noise. The performance of exponential reproducing kernels canbe enhanced by proper selection of the parameter αm (solid line with -o-) and depending on thechoice of ψ(t) (dashed-dotted lines).
setup, the time delays are equally distributed in the window [0, τ), with τ = 1, and remainconstant throughout the experiments. All amplitudes are set to one. The index set of theSoS filter is K = −K,. . . ,K. Both B-splines and E-splines are taken of order 2K −1,and for E-splines we use purely imaginary exponents, equally distributed around thecomplex unit circle. The sampling period for all methods is T = τ/N , where the numberof samples is N = 2K +1 = 5,7,11,41 for the SoS and N = 2K +1+S = 9,13,21,81
for the spline-based methods, where S is the spline support. Hard thresholding wasimplemented in order to improve the spline methods. The threshold was chosen to be3σ, where σ is the standard deviation of the noise. For the Gaussian sampling kernelthe parameter σg was optimized and took on the value of σg = 0.25,0.28,0.32,0.9,respectively.
The results are given in Figure 4.16. For K = 2 all methods are stable, where E-splines exhibit better performance than B-splines, and Gaussian and SoS approachesdemonstrate the lowest errors. As the value of K grows, the advantage of the SoS filterbecomes more prominent, where for K ≥ 5, the performance of Gaussian and both splinemethods deteriorate and have errors approaching the order of τ . In contrast, the SoS filterretains its performance nearly unchanged even up to K = 20, where the B-spline andGaussian methods are unstable.
Infinite pulse streamsWe now demonstrate the performance of FRI methods for infinite pulse streams in thepresence of white Gaussian noise, when working at the rate of innovation. We comparethree methods that can achieve the innovation rate in the infinite case: an integrator-based approach detailed in [40], exponential filters [41], and the multichannel approachdescribed in Section 4.3.4 based on modulators. For the modulators, we examine three

Sampling at the rate of innovation: theory and applications 191
5 10 15 20 25 30 35
10−6
10−4
10−2
100
102
5 10 15 20 25 30 35
10−6
10−4
10−2
100
102
5 10 15 20 25 30 35
10−6
10−4
10−2
100
102
B-spline filterGaussian filter
E-spline filterSoS filter
SNR [dB]
Tim
e-de
lay
estim
atio
n er
ror
[uni
ts o
f τ]
B-spline filter
Gaussian filter
E-spline filterSoS filter
SNR [dB]
Tim
e-de
lay
estim
atio
n er
ror
[uni
ts o
f τ]
5 10 15 20 25 30 35
10−6
10−4
10−2
100
102
B-spline filter
Gaussian filter
E-spline filter
SoS filter
SNR [dB]
Tim
e-de
lay
estim
atio
n er
ror
[uni
ts o
f τ]
(c) K = 5.
(a) K = 2. (b) K = 3.
B-spline filter
Gaussian filter
SoS filter
SNR [dB]
Tim
e-de
lay
estim
atio
n er
ror
[uni
ts o
f τ]
(d) K = 20.
Figure 4.16 Performance in the presence of noise: finite stream case. SoS, B-spline, E-spline, and Gaussiansampling kernels. (a) K = 2 Dirac pulses are present, (b) K = 3 pulses, (c) high value of K = 5pulses, and (d) the performance for a very high value of K = 20 (without E-spline simulation,due to computational complexity of calculating the time-domain expression for highvalues of K).
waveforms: cosine and sine waveform (tones), filtered rectangular alternating pulses(rectangular), and waveforms obtained from delayed versions of the SoS filter (SoS).Following [41], the parameters defining the impulse response of the exponential filtersare chosen as α = 0.2T and β = 0.8T .
We focus on one period of the input signal, which consists of K = 10 Diracs withtimes chosen in the interval [0,T ) and amplitudes equal one, and P = 21 channels.The estimation error of the time delays versus the SNR is depicted in Figure 4.17, forthe various approaches. The instability of the integrators and exponential filters basedmethods becomes apparent for these high orders. The SoS approach, in contrast, achieves

192 J. A. Urigüen, Y. C. Eldar, P. L. Dragotti, and Z. Ben-Haim
40
20
–20
–40
–60
–80 tonesrectangularSoSintegratorsexponentials
–100
–120
–1400 20 40
SNR [dB]60 80 100
0
MSE
[dB
]
*
Figure 4.17 Performance in the presence of noise at the rate of innovation. The signal consists of K = 10Diracs.
good estimation results. There is a slight advantage for the schemes based on tones andSoS, over alternating pulses, where the first two configurations have similar performance.
4.5.3 Periodic vs. semi-periodic FRI signals
As we have seen above, the reconstruction of signals of the form (4.18) in the pres-ence of noise is often severely hampered when sampled at or slightly above the rateof innovation. Rather than indicating a lack of appropriate algorithms, in many casesthis phenomenon results from fundamental limits on the ability to recover such signalsfrom noisy measurements. A similar effect was demonstrated [10] in the finite pulsestream model (4.19). On the other hand, some types of FRI signals exhibit remarkablenoise resilience, and do not appear to require substantial oversampling in the presenceof noise [17]. As we now show, the CRB for analog noise can be used to verify that suchphenomena arise from a fundamental difference between families of FRI signals.
As an example, we compare the CRB for reconstructing the periodic signal (4.18)with the semi-periodic signal (4.20). Recall that in the former case, each period consistsof pulses having unknown amplitudes and time shifts. By contrast, in the latter signal,the time delays are identical throughout all periods, but the amplitudes can change fromone period to the next.
While these are clearly different types of signals, an effort was made to form a faircomparison between the reconstruction capabilities in the two cases. To this end, wechose an identical pulse g(t) in both cases. We selected the signal segment [0, τ ], whereτ = 1, and chose the signal parameters so as to guarantee an identical τ -local rate ofinnovation. We also used identical sampling kernels in both settings: specifically, wechose the kernels which measure the N lowest frequency components of the signal.
To simplify the analysis and focus on the fundamental differences between thesesettings, we will assume in this section that the pulses p(t) are compactly supported, andthat the time delays are chosen such that pulses from one period do not overlap with

Sampling at the rate of innovation: theory and applications 193
20 40 60 80 100 120 140 160 180 20010−9
10−8
10−7
10−6
10−5
10−4
10−3
Number of samples, N
CR
BSampled CRB, periodic signalSampled CRB, semi−periodic signalContinuous−time CRB
Figure 4.18 Comparison between the CRB for a periodic signal (4.18) and a semi-periodic signal (4.20).
other periods. For the periodic signal, we chose K = 10 pulses with random delays andamplitudes. A period of τ = 1 was selected. This implies that the signal of interest isdetermined by 2K = 20 parameters (K amplitudes and K time delays). To construct asemi-periodic signal with the same number of parameters, we chose a period of T = 1/9
containing K = 2 pulses. The segment [0, τ ] then contains precisely M = 9 periods, fora total of 20 parameters. While it may seem plausible to require the same number ofperiods for both signals, this would actually disadvantage the periodic approach, as itwould require the estimation of much more closely spaced pulses.
Note that since the number of parameters to be estimated is identical in both signalmodels, the continuous-time CRBs for the two settings coincide (see Section 4.4.1).Consequently, for a large number of measurements, the sampled bounds also converge tothe same values. However, when the number of samples is closer to the rate of innovation,the bound on the reconstruction error for the semi-periodic signal is much lower than thatof the periodic signal, as shown in Figure 4.18. As mentioned above, this is in agreementwith previously reported findings for the two types of signals [4, 11, 17].
To find an explanation for this difference, it is helpful to recall that both signalscan be described using the union of subspaces viewpoint. Each of the signals in thisexperiment is defined by precisely 20 parameters, which determine the subspace towhich the signal belongs and the position within this subspace. Specifically, the valuesof the time delays select the subspace, and the pulse amplitudes define a point withinthis subspace. Thus, in the above setting, the periodic signal contains 10 parameters forselecting the subspace and 10 additional parameters determining the position within it;whereas for the semi-periodic signal, only 2 parameters determine the subspace whilethe remaining 18 parameters set the location in the subspace. Evidently, identification ofthe subspace is challenging, especially in the presence of noise, but once the subspace isdetermined, the remaining parameters can be estimated using a simple linear operation (aprojection onto the chosen subspace). Consequently, if many of the unknown parameters

194 J. A. Urigüen, Y. C. Eldar, P. L. Dragotti, and Z. Ben-Haim
identify the position within a subspace, estimation can be performed more accurately.This may provide an explanation for the difference between the two examined signalmodels.
4.6 Extensions and applications
4.6.1 Sampling piecewise sinusoidal signals
While most of the previous sections have concentrated on sampling streams of pulses,the theory of FRI extends beyond this class of signals and can be applied, for instance, tosample piecewise polynomial signals or classes of 2-D signals. In this section we demon-strate that piecewise sinusoidal signals can also be sampled and perfectly reconstructedusing FRI theory [16].
The signals we consider can be written as follows:
x(t) =
D∑d=1
N∑n=1
Ad,n cos(ωd,nt+ θd,n)ξd(t),
where ξd(t) = u(t − td) − u(t − td+1) and −∞ < t1 < .. . < td < .. . < tD+1 < ∞.Namely, we consider piecewise sinusoidal signals with a maximum of D pieces andwith a maximum of N sinusoids per piece. Piecewise sinusoidal signals are traditionallydifficult to sample because they are not bandlimited, have information concentrated bothin time and frequency (e.g., time location of the switching points, frequency of each sinewave), and finally cannot be sparsely described in a basis or a frame. However, they arecompletely specified by a finite number of parameters and are therefore FRI signals.
We assume, for simplicity, that the signal x(t) is acquired using an exponentialreproducing kernel; however, similar analysis applies to the sinc and SoS kernels.We have seen in (4.44) and (4.45) that given the samples yn the new measurementssm =
∑N−1n=0 cm,nyn, m = 0,1, . . .,P correspond to the Laplace transform of x(t)
evaluated at αm = α0 + mλ. In the piecewise sinusoidal case the Laplace transformis given by:
sm =
D∑d=1
2N∑n=1
Ad,n[etd+1(jωd,n+αm) − etd(jωd,n+αm)]
(jωd,n +αm), (4.94)
where Ad,n = Ad,nejθd,n . We now define the polynomial Q(αm) as follows:
Q(αm) =
D∏d=1
2N∏n=1
(jωd,n +αm) =
J∑j=0
rjαjm. (4.95)
Multiplying both sides of the equation by Q(αm) we obtain:
Q(αm)sm =
D∑d=1
2N∑n=1
Ad,nR(αm)[etd+1(jωd,n+αm) − etd(jωd,n+αm)], (4.96)
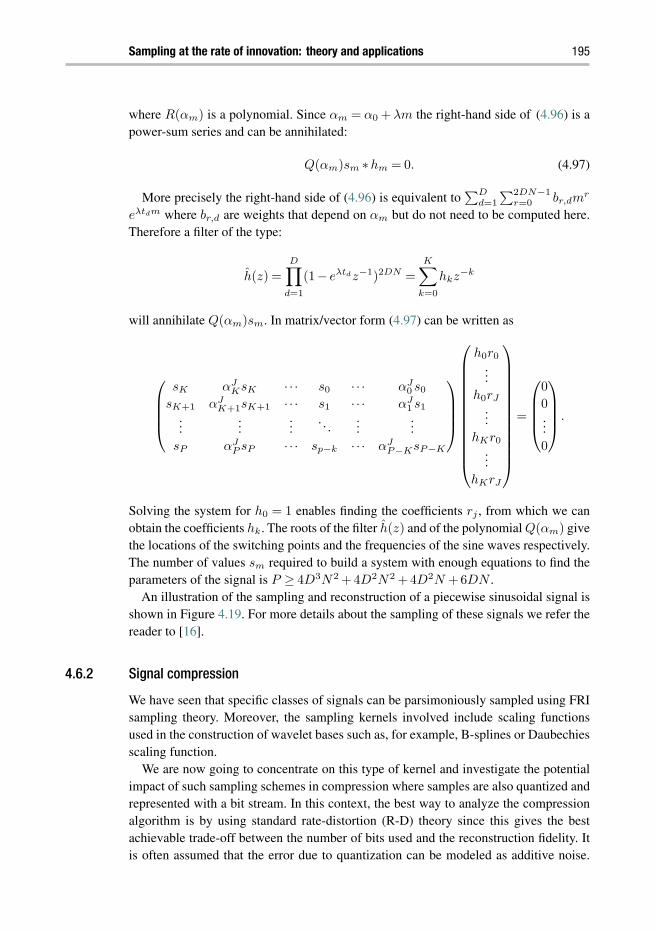
Sampling at the rate of innovation: theory and applications 195
where R(αm) is a polynomial. Since αm = α0 +λm the right-hand side of (4.96) is apower-sum series and can be annihilated:
Q(αm)sm ∗hm = 0. (4.97)
More precisely the right-hand side of (4.96) is equivalent to∑D
d=1∑2DN−1
r=0 br,dmr
eλtdm where br,d are weights that depend on αm but do not need to be computed here.Therefore a filter of the type:
h(z) =
D∏d=1
(1− eλtdz−1)2DN =
K∑k=0
hkz−k
will annihilate Q(αm)sm. In matrix/vector form (4.97) can be written as
sK αJ
KsK · · · s0 · · · αJ0 s0
sK+1 αJK+1sK+1 · · · s1 · · · αJ
1 s1...
......
. . ....
...sP αJ
P sP · · · sp−k · · · αJP−KsP−K
h0r0...
h0rJ
...hKr0
...hKrJ
=
0
0...0
.
Solving the system for h0 = 1 enables finding the coefficients rj , from which we canobtain the coefficients hk. The roots of the filter h(z) and of the polynomial Q(αm) givethe locations of the switching points and the frequencies of the sine waves respectively.The number of values sm required to build a system with enough equations to find theparameters of the signal is P ≥ 4D3N2 +4D2N2 +4D2N +6DN .
An illustration of the sampling and reconstruction of a piecewise sinusoidal signal isshown in Figure 4.19. For more details about the sampling of these signals we refer thereader to [16].
4.6.2 Signal compression
We have seen that specific classes of signals can be parsimoniously sampled using FRIsampling theory. Moreover, the sampling kernels involved include scaling functionsused in the construction of wavelet bases such as, for example, B-splines or Daubechiesscaling function.
We are now going to concentrate on this type of kernel and investigate the potentialimpact of such sampling schemes in compression where samples are also quantized andrepresented with a bit stream. In this context, the best way to analyze the compressionalgorithm is by using standard rate-distortion (R-D) theory since this gives the bestachievable trade-off between the number of bits used and the reconstruction fidelity. Itis often assumed that the error due to quantization can be modeled as additive noise.

196 J. A. Urigüen, Y. C. Eldar, P. L. Dragotti, and Z. Ben-Haim
0 0.25 0.5 0.75 1 [sec]−5
0
5
(a)
0 0.25 0.5 0.75 1 [sec]−2
0
2
(b)
0 0.25 0.5 0.75 1 [sec]−5
0
5
(c)
Figure 4.19 Sampling a piecewise sinusoidal signal. (a) The original continuous-time waveform, this is madeof two truncated sinewaves. (b) The observed samples. (c) The reconstructed signal, where theretrieval of the two switch points and of the sine waves parameters is exact to machine precision.
While this assumption is normally not accurate, it allows us to connect R-D theory withthe CRB discussed in the previous section and therefore relate the theory of samplingFRI signals with compression.
The classes of signals we consider here are piecewise smooth functions, that is, func-tions which are made of regular pieces. The regularity of a function is normally measuredusing the Lipschitz coefficients [49]. We thus assume that the signals we consider aremade of pieces with Lipschitz regularity α.
The FRI-based compression algorithm we propose is characterized by a simple lin-ear encoding strategy and a more complex decoding. This is in contrast with standardwavelet-based compression algorithms that involve a fairly sophisticated encoding strat-egy, but simple decoding. There might be situations, however, where it is important tohave simple encoders. In our setup, at the encoder the signal is decomposed using astandard wavelet transform and the resulting coefficients are quantized linearly. Thismeans that the lowpass coefficients (equivalent to the samples in the FRI framework)are quantized first followed by the wavelet coefficients from the coarse to the finest scale.
At the decoder, the FRI reconstruction strategy is used to estimate the discontinu-ities in the signal using the scaling coefficients, while the other coefficients are used toreconstruct the smooth parts of the signals. By modeling the quantization error and anymodel mismatch as additive noise, one can use the CRB to estimate the performanceof this compression strategy. The rate-distortion behavior of this FRI-based algorithmis [38, 39]:
DFRI(R) ≤ c1R−2α + c2 (4.98)

Sampling at the rate of innovation: theory and applications 197
where c2 is a systematic estimation error due to the model mismatch. Standard wavelet-based compression algorithms instead are characterized by a complex encoder and asimple decoder and can achieve the optimal rate-distortion behavior [50]:
Dwave(R) ≤ c3R−2α. (4.99)
This indicates that if the systematic error in (4.98) is sufficiently small the FRI-basedalgorithm, which shifts the complexity from the encoder to the decoder, can achieve thesame performance of the best wavelet-based compression algorithms for a wide rangeof bit rates.
4.6.3 Super-resolution imaging
An image super-resolution algorithm aims at creating a single detailed image, calleda super-resolved image (SR) from a set of low-resolution input images of the samescene [51]. If different images from the same scene have been taken such that theirrelative shifts are not integer-multiple of the pixel size, then sub-pixel information existsamong the set. This allows us to obtain higher resolution accuracy of the scene once theimages have been properly registered.
Image registration involves any group of transformations that removes the disparitybetween any two low-resolution (LR) images. This is followed by image fusion, whichblends the properly aligned LR images into a higher resolution output, possibly removingblur and noise introduced by the system [26].
The registration step is crucial in order to obtain a good quality SR image. The theoryof FRI can be extended to provide super-resolution imaging, combined with B-splineor E-spline processing. The key idea of this approach is that, using a proper modelfor the point-spread function of the scene acquisition system, it is possible to retrievethe underlying “continuous geometric moments” of the irradiance light-field. From thisinformation, and assuming the disparity between any two images can be characterizedby a global affine transformation, the set of images can be exactly registered.
Concretely, if the smoothing kernel that models the 2-D image acquisition is consid-ered to be a B-spline or a more generic function such as a spline, then the continuousmoments of the image can be found using a proper linear combination of the sam-ples [25, 26]. From them, it is possible to find the central and complex moments of thesignal, from which the disparities between any two LR images can be estimated. Thus,this allows for proper registration of the set of input images, which can now be combinedinto a super-resolved output. Figure 4.20 shows an example of the results obtained usingthe method presented in [26].
4.6.4 Ultrasound imaging
Another application of the stream of pulses FRI framework is ultrasound imaging [10].In this application, an acoustic pulse is transmitted into the scanned tissue. Echoes ofthe pulse bounce off scatterers within the tissue, and create a signal consisting of a
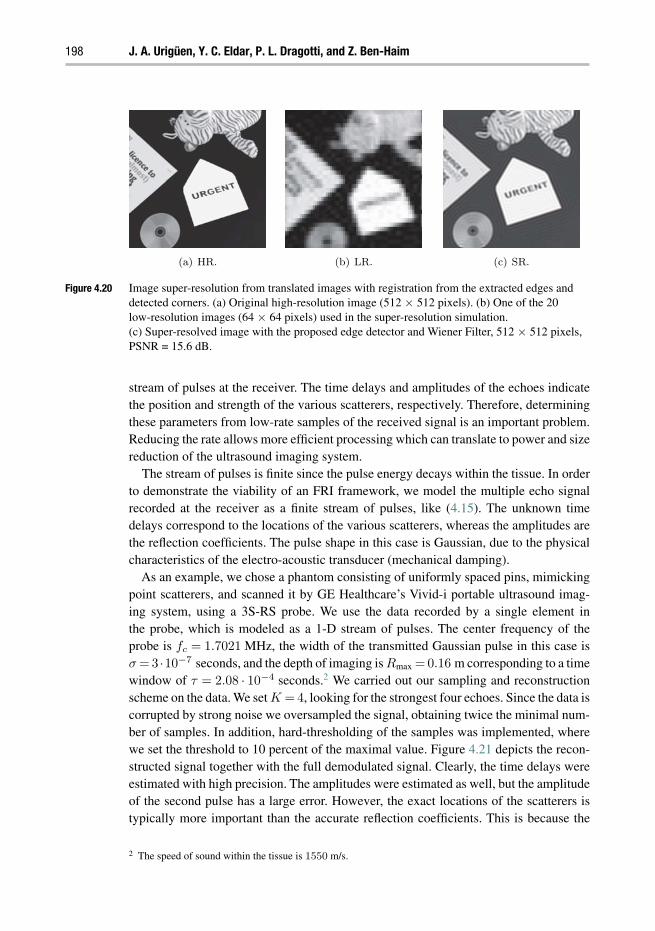
198 J. A. Urigüen, Y. C. Eldar, P. L. Dragotti, and Z. Ben-Haim
(a) HR. (b) LR. (c) SR.
Figure 4.20 Image super-resolution from translated images with registration from the extracted edges anddetected corners. (a) Original high-resolution image (512 × 512 pixels). (b) One of the 20low-resolution images (64 × 64 pixels) used in the super-resolution simulation.(c) Super-resolved image with the proposed edge detector and Wiener Filter, 512 × 512 pixels,PSNR = 15.6 dB.
stream of pulses at the receiver. The time delays and amplitudes of the echoes indicatethe position and strength of the various scatterers, respectively. Therefore, determiningthese parameters from low-rate samples of the received signal is an important problem.Reducing the rate allows more efficient processing which can translate to power and sizereduction of the ultrasound imaging system.
The stream of pulses is finite since the pulse energy decays within the tissue. In orderto demonstrate the viability of an FRI framework, we model the multiple echo signalrecorded at the receiver as a finite stream of pulses, like (4.15). The unknown timedelays correspond to the locations of the various scatterers, whereas the amplitudes arethe reflection coefficients. The pulse shape in this case is Gaussian, due to the physicalcharacteristics of the electro-acoustic transducer (mechanical damping).
As an example, we chose a phantom consisting of uniformly spaced pins, mimickingpoint scatterers, and scanned it by GE Healthcare’s Vivid-i portable ultrasound imag-ing system, using a 3S-RS probe. We use the data recorded by a single element inthe probe, which is modeled as a 1-D stream of pulses. The center frequency of theprobe is fc = 1.7021 MHz, the width of the transmitted Gaussian pulse in this case isσ = 3 ·10−7 seconds, and the depth of imaging is Rmax = 0.16 m corresponding to a timewindow of τ = 2.08 · 10−4 seconds.2 We carried out our sampling and reconstructionscheme on the data. We set K = 4, looking for the strongest four echoes. Since the data iscorrupted by strong noise we oversampled the signal, obtaining twice the minimal num-ber of samples. In addition, hard-thresholding of the samples was implemented, wherewe set the threshold to 10 percent of the maximal value. Figure 4.21 depicts the recon-structed signal together with the full demodulated signal. Clearly, the time delays wereestimated with high precision. The amplitudes were estimated as well, but the amplitudeof the second pulse has a large error. However, the exact locations of the scatterers istypically more important than the accurate reflection coefficients. This is because the
2 The speed of sound within the tissue is 1550 m/s.
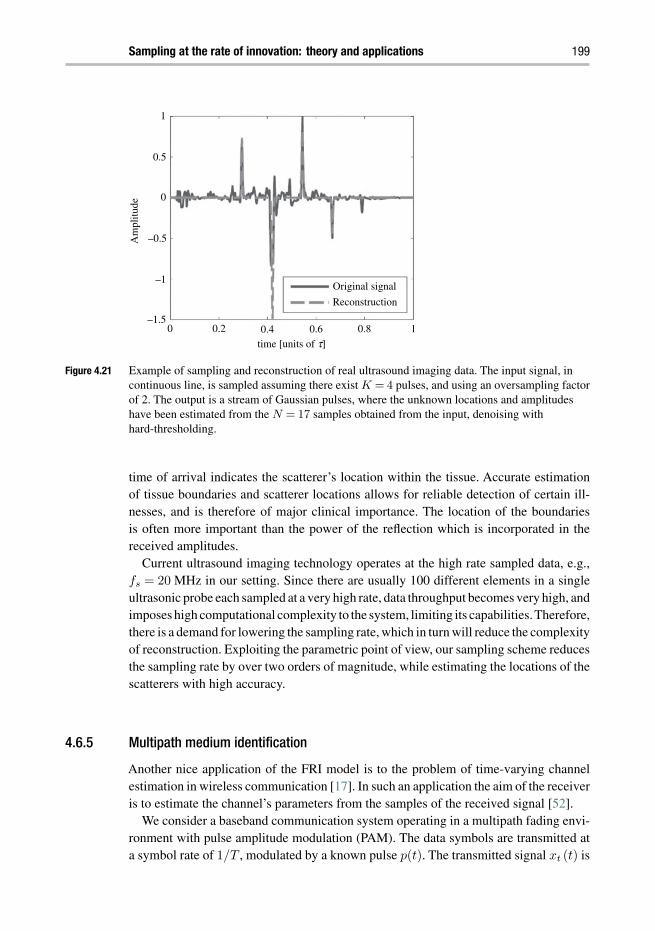
Sampling at the rate of innovation: theory and applications 199
1
0.5
0
–0.5Am
plitu
de
–1
–1.50 0.2 0.4 0.6
time [units of τ]
0.8
Original signal
Reconstruction
1
Figure 4.21 Example of sampling and reconstruction of real ultrasound imaging data. The input signal, incontinuous line, is sampled assuming there exist K = 4 pulses, and using an oversampling factorof 2. The output is a stream of Gaussian pulses, where the unknown locations and amplitudeshave been estimated from the N = 17 samples obtained from the input, denoising withhard-thresholding.
time of arrival indicates the scatterer’s location within the tissue. Accurate estimationof tissue boundaries and scatterer locations allows for reliable detection of certain ill-nesses, and is therefore of major clinical importance. The location of the boundariesis often more important than the power of the reflection which is incorporated in thereceived amplitudes.
Current ultrasound imaging technology operates at the high rate sampled data, e.g.,fs = 20 MHz in our setting. Since there are usually 100 different elements in a singleultrasonic probe each sampled at a very high rate, data throughput becomes very high, andimposes high computational complexity to the system, limiting its capabilities.Therefore,there is a demand for lowering the sampling rate, which in turn will reduce the complexityof reconstruction. Exploiting the parametric point of view, our sampling scheme reducesthe sampling rate by over two orders of magnitude, while estimating the locations of thescatterers with high accuracy.
4.6.5 Multipath medium identification
Another nice application of the FRI model is to the problem of time-varying channelestimation in wireless communication [17]. In such an application the aim of the receiveris to estimate the channel’s parameters from the samples of the received signal [52].
We consider a baseband communication system operating in a multipath fading envi-ronment with pulse amplitude modulation (PAM). The data symbols are transmitted ata symbol rate of 1/T , modulated by a known pulse p(t). The transmitted signal xt (t) is
200 J. A. Urigüen, Y. C. Eldar, P. L. Dragotti, and Z. Ben-Haim
given by
xT (t) =
Nsym∑n=1
d [n]p(t−nT ) (4.100)
where d [n] are the data symbols taken from a finite alphabet, and Nsym is the totalnumber of transmitted symbols.
The transmitted signal xT (t) passes through a baseband time-varying multipathchannel whose impulse response is modeled as
h(τ, t) =
K∑k=1
αk (t)δ (τ − τk) (4.101)
where αk (t) is the path time-varying complex gain for the kth multipath propagationpath and τk is the corresponding time delay. The total number of paths is denoted by K.We assume that the channel is slowly varying relative to the symbol rate, so that the pathgains are considered to be constant over one symbol period:
αk (t) = αk [nT ] for t ∈ [nT,(n+1)T ] . (4.102)
In addition, we assume that the propagation delays are confined to one symbol, i.e.τk ∈ [0,T ). Under these assumptions, the received signal at the receiver is given by
xR (t) =
K∑k=1
Nsym∑n=1
ak [n]p(t− τk −nT )+n(t) (4.103)
where ak [n] = αk [nT ]d [n] and n(t) denotes the channel noise.The received signal xR (t) fits the semi-periodic FRI signal model. Therefore, we can
use the methods we described to recover the time delays of the propagation paths. Inaddition, if the transmitted symbols are known to the receiver, then the time-varying pathgains can be recovered from the sequences ak [n]. As a result our sampling scheme canestimate the channel’s parameters from samples of the output at a low-rate, proportionalto the number of paths.
As an example, we can look at the channel estimation problem in code division multipleaccess (CDMA) communication. This problem was handled using subspace techniquesin [53,54]. In these works the sampling is done at the chip rate 1/Tc or above, where Tc isthe chip duration given by Tc = T/N and N is the spreading factor which is usually high(1023, for example, in GPS applications). In contrast, our sampling scheme can providerecovery of the channel’s parameters at a sampling rate of 2K/T . For a channel with asmall number of paths, this sampling rate can be significantly lower than the chip rate.
4.6.6 Super-resolution radar
We end with an application of the semi-periodic model (4.20) to super-resolutionradar [27].
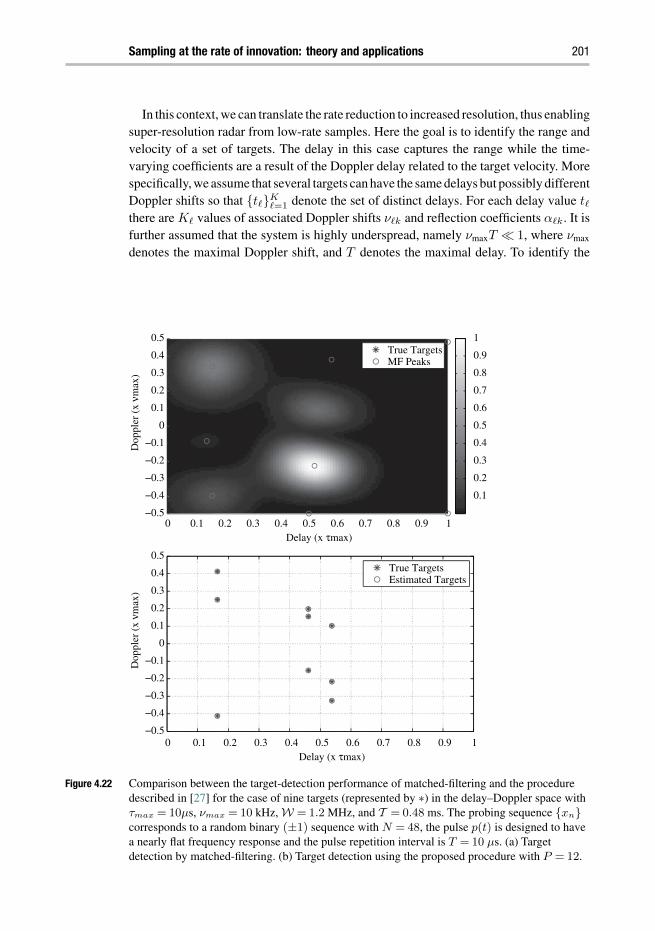
Sampling at the rate of innovation: theory and applications 201
In this context, we can translate the rate reduction to increased resolution, thus enablingsuper-resolution radar from low-rate samples. Here the goal is to identify the range andvelocity of a set of targets. The delay in this case captures the range while the time-varying coefficients are a result of the Doppler delay related to the target velocity. Morespecifically, we assume that several targets can have the same delays but possibly differentDoppler shifts so that tK
=1 denote the set of distinct delays. For each delay value tthere are K values of associated Doppler shifts νk and reflection coefficients αk. It isfurther assumed that the system is highly underspread, namely νmaxT 1, where νmax
denotes the maximal Doppler shift, and T denotes the maximal delay. To identify the
0 0.1 0.2 0.3 0.4 0.5 0.6 0.7 0.8 0.9 1−0.5
−0.4
−0.3
−0.2
−0.1
0
0.1
0.2
0.3
0.4
0.5
Delay (x τmax)
Dop
pler
(x
νmax
)
0.1
0.2
0.3
0.4
0.5
0.6
0.7
0.8
0.9
1True TargetsMF Peaks
0 0.1 0.2 0.3 0.4 0.5 0.6 0.7 0.8 0.9 1−0.5
−0.4
−0.3
−0.2
−0.1
0
0.1
0.2
0.3
0.4
0.5
Delay (x τmax)
Dop
pler
(x
νmax
)
True TargetsEstimated Targets
Figure 4.22 Comparison between the target-detection performance of matched-filtering and the proceduredescribed in [27] for the case of nine targets (represented by ∗) in the delay–Doppler space withτmax = 10µs, νmax = 10 kHz, W = 1.2 MHz, and T = 0.48 ms. The probing sequence xncorresponds to a random binary (±1) sequence with N = 48, the pulse p(t) is designed to havea nearly flat frequency response and the pulse repetition interval is T = 10 µs. (a) Targetdetection by matched-filtering. (b) Target detection using the proposed procedure with P = 12.

202 J. A. Urigüen, Y. C. Eldar, P. L. Dragotti, and Z. Ben-Haim
targets we transmit the signal
xT =
N−1∑n=0
xnp(t−nT ), (4.104)
where xn is a known N -length probing sequence, and p(t) is a known pulse shape. Thereceived signal can then be described in the form (4.20), where the sequences a[n]
satisfy
a[n] = xn
K∑k=1
αkej2πνknT . (4.105)
The delays and the sequences a[n] can be recovered using the general scheme fortime-delay recovery. The Doppler shifts and reflection coefficients are then determinedfrom the sequences a[n] using standard spectral estimation tools [18]. The targets can beexactly identified as long as the bandwidth of the transmitted pulse satisfiesW ≥ 4πK/T ,and the length of the probing sequence satisfies N ≥ 2maxK [27]. This leads to aminimal time–bandwidth product of the input signal of WT ≥ 8πK maxK, whichis much lower than that obtained using standard radar processing techniques, such asmatched-filtering (MF).
An example of the identification of nine close targets is illustrated in Figure 4.22(a).The sampling filter used is a simple LPF. The original and recovered targets are shownon the Doppler–delay plane. Evidently all the targets were correctly identified using ourFRI-based method. The result obtained by MF, with the same time–bandwidth product,is shown in Figure 4.22(b). Clearly the FRI method has superior resolution than thestandard MF. Thus, the FRI viewpoint not only offers a reduced-rate sampling method,but allows us to increase the resolution in target identification.
4.7 Acknowledgement
Y. Eldar would like to thank Kfir Gedalyahu for many helpful comments.
Appendix to Chapter 4: Cramér–Rao bound derivations
Cramér–Rao bounds for the sinc kernel
Here we focus on the simplified case in which the input is a single τ -periodic Dirac, forwhich we can obtain a closed-form expression for (4.85).
In the absence of noise, the samples taken at uniform intervals of time T with K =
1 Dirac, can be expressed as:
yn = a0ψ(nT − t0) = f(θ,n) (4.106)

Sampling at the rate of innovation: theory and applications 203
where ψ(t) is the Dirichlet kernel
ψ(t) =∑m∈Z
φB (t−mτ) =1
Bτ
sin(
π(2M+1)tτ
)sin
(πtτ
) =1
Bτ
sin(πBt)
sin(
πtτ
) (4.107)
and θ = (t0,a0)T . The Fisher information matrix is the following square and size 2×2
matrix:
I(θ) = σ−2
( ∑N−1n=0 (a0ψ
′(nT − t0))2 ∑N−1
n=0 a0ψ′(nT − t0)ψ(nT − t0)∑N−1
n=0 ψ(nT − t0)a0ψ′(nT − t0)
∑N−1n=0 (ψ(nT − t0))
2
).
(4.108)
In order to evaluate the summations it is convenient to use the Fourier seriesrepresentations of the signals ψ(t) and ψ′(t) because the following holds [55]:
N−1∑n=0
f(nT )g∗(nT )(a)=
N−1∑n=0
(∑k
fkej2πkn Tτ
)(∑k′
g∗k′e−j2πk′n T
τ
)(4.109)
=∑
k
fk
∑k′
g∗k′
1− ej2π(k−k′)N Tτ
e−j2π(k−k′) Tτ
(b)=∑
k
fk
∑k′
g∗k′Nδk,k′ = N
∑k
fkg∗k,
where in (a) we have used the fact that f(t) and g(t) are assumed to be periodic, and in(b) the fact that for τ = NT the sum is only nonzero when k = k′.
Furthermore, if we call ψk the coefficients for ψ(t), then ψ′k = j2π k
τ ψk would be
the coefficients for its derivative and ψ(t0)k = e−j2πk
t0τ ψk the coefficients for its shifted
version by t0.These last equivalences and (4.109) simplify the calculations of the sums in (4.108),
because the function ψ(t) is characterized by the Fourier series coefficients ψk = 1Bτ |k|≤
M and ψk = 0 otherwise. Element (1,1) in (4.108) can therefore be calculated as
σ−2N−1∑n=0
(a0ψ′(nT − t0))
2= σ−2a2
0N∑
|k|≤M
ψ′ke−j2πk
t0τ ψ′∗
k ej2πkt0τ (4.110)
[I(θ)]11 = N
(a0
σ
2π
Bτ2
)2M(M +1)(2M +1)
3.
The other elements in (4.108) can be calculated likewise. Due to the fact that the elementsin the anti-diagonal are zero, the inverse of the Fisher information matrix can be computedby just inverting the diagonal elements, yielding
CRB(θ) =
1N
(σa0
Bτ2
2π
)23
M(M+1)(2M+1) 0
0 1N σ2B2τ2 1
2M+1
, (4.111)
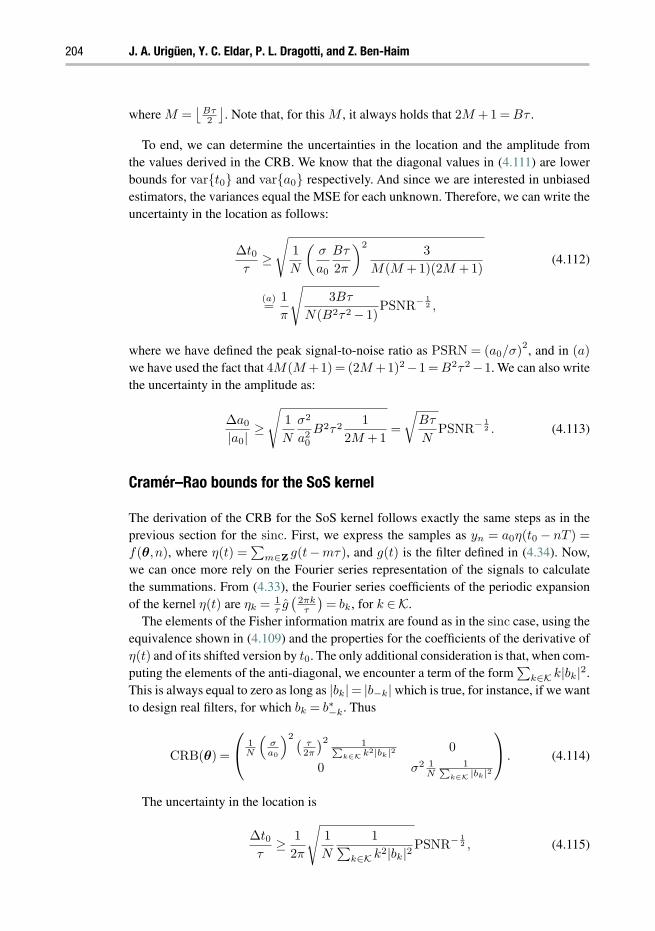
204 J. A. Urigüen, Y. C. Eldar, P. L. Dragotti, and Z. Ben-Haim
where M =⌊
Bτ2
⌋. Note that, for this M , it always holds that 2M +1 = Bτ .
To end, we can determine the uncertainties in the location and the amplitude fromthe values derived in the CRB. We know that the diagonal values in (4.111) are lowerbounds for vart0 and vara0 respectively. And since we are interested in unbiasedestimators, the variances equal the MSE for each unknown. Therefore, we can write theuncertainty in the location as follows:
∆t0τ
≥
√1
N
(σ
a0
Bτ
2π
)23
M(M +1)(2M +1)(4.112)
(a)=
1
π
√3Bτ
N(B2τ2 − 1)PSNR− 1
2 ,
where we have defined the peak signal-to-noise ratio as PSRN = (a0/σ)2, and in (a)
we have used the fact that 4M(M +1) = (2M +1)2 −1 = B2τ2 −1. We can also writethe uncertainty in the amplitude as:
∆a0
|a0|≥√
1
N
σ2
a20B2τ2 1
2M +1=
√Bτ
NPSNR− 1
2 . (4.113)
Cramér–Rao bounds for the SoS kernel
The derivation of the CRB for the SoS kernel follows exactly the same steps as in theprevious section for the sinc. First, we express the samples as yn = a0η(t0 − nT ) =
f(θ,n), where η(t) =∑
m∈Z g(t−mτ), and g(t) is the filter defined in (4.34). Now,we can once more rely on the Fourier series representation of the signals to calculatethe summations. From (4.33), the Fourier series coefficients of the periodic expansionof the kernel η(t) are ηk = 1
τ g( 2πk
τ
)= bk, for k ∈K.
The elements of the Fisher information matrix are found as in the sinc case, using theequivalence shown in (4.109) and the properties for the coefficients of the derivative ofη(t) and of its shifted version by t0. The only additional consideration is that, when com-puting the elements of the anti-diagonal, we encounter a term of the form
∑k∈K k|bk|2.
This is always equal to zero as long as |bk|= |b−k| which is true, for instance, if we wantto design real filters, for which bk = b∗
−k. Thus
CRB(θ) =
1N
(σa0
)2 (τ2π
)2 1∑k∈K k2|bk|2 0
0 σ2 1N
1∑k∈K |bk|2
. (4.114)
The uncertainty in the location is
∆t0τ
≥ 1
2π
√1
N
1∑k∈K k2|bk|2
PSNR− 12 , (4.115)
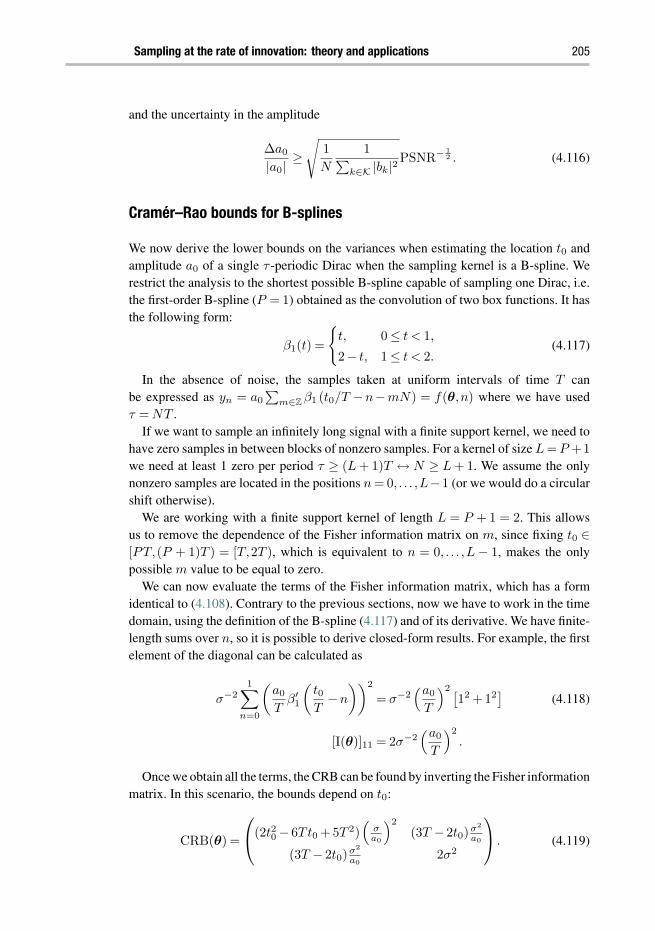
Sampling at the rate of innovation: theory and applications 205
and the uncertainty in the amplitude
∆a0
|a0|≥√
1
N
1∑k∈K |bk|2
PSNR− 12 . (4.116)
Cramér–Rao bounds for B-splines
We now derive the lower bounds on the variances when estimating the location t0 andamplitude a0 of a single τ -periodic Dirac when the sampling kernel is a B-spline. Werestrict the analysis to the shortest possible B-spline capable of sampling one Dirac, i.e.the first-order B-spline (P = 1) obtained as the convolution of two box functions. It hasthe following form:
β1(t) =
t, 0 ≤ t < 1,
2− t, 1 ≤ t < 2.(4.117)
In the absence of noise, the samples taken at uniform intervals of time T canbe expressed as yn = a0
∑m∈Z
β1 (t0/T −n−mN) = f(θ,n) where we have usedτ = NT .
If we want to sample an infinitely long signal with a finite support kernel, we need tohave zero samples in between blocks of nonzero samples. For a kernel of size L = P +1
we need at least 1 zero per period τ ≥ (L + 1)T ↔ N ≥ L + 1. We assume the onlynonzero samples are located in the positions n = 0, . . . ,L−1 (or we would do a circularshift otherwise).
We are working with a finite support kernel of length L = P + 1 = 2. This allowsus to remove the dependence of the Fisher information matrix on m, since fixing t0 ∈[PT,(P + 1)T ) = [T,2T ), which is equivalent to n = 0, . . . ,L − 1, makes the onlypossible m value to be equal to zero.
We can now evaluate the terms of the Fisher information matrix, which has a formidentical to (4.108). Contrary to the previous sections, now we have to work in the timedomain, using the definition of the B-spline (4.117) and of its derivative. We have finite-length sums over n, so it is possible to derive closed-form results. For example, the firstelement of the diagonal can be calculated as
σ−21∑
n=0
(a0
Tβ′
1
(t0T
−n
))2
= σ−2(a0
T
)2 [12 +12] (4.118)
[I(θ)]11 = 2σ−2(a0
T
)2.
Once we obtain all the terms, the CRB can be found by inverting the Fisher informationmatrix. In this scenario, the bounds depend on t0:
CRB(θ) =
(2t20 − 6Tt0 +5T 2)(
σa0
)2(3T − 2t0)
σ2
a0
(3T − 2t0)σ2
a02σ2
. (4.119)

206 J. A. Urigüen, Y. C. Eldar, P. L. Dragotti, and Z. Ben-Haim
In order to remove the dependence on t0, we can consider various options. For instance,we may calculate the expected value of CRB(θ) assuming that t0 is uniformly distributedover τ . This leads to:
∆t0τ
≥ 1
N
√2
3PSNR− 1
2 , (4.120)
∆a0
|a0|≥
√2PSNR− 1
2 . (4.121)
Cramér–Rao bounds for E-splines
To conclude, we derive lower bounds on the variances of the estimated location andamplitude for a τ -periodic single Dirac when the sampling kernel is an E-spline. Themethod is the same as that explained for B-splines, but requires further assumptions.
We restrict the analysis to cardinal exponential splines, which we also assume to betrigonometric [35]. The first property means that the exponential splines are defined on auniform grid, and the second property that the complex parameters are purely imaginaryand equally spaced around the origin, which yields a real-valued function.
We need to be careful when working with E-splines for two main reasons. The firstis that the periodicity of the complex exponentials causes the moments to be periodictoo. This imposes a limit in the locations that can be retrieved. The second is that E-splines are no longer a basis for certain combinations of the complex parameters [35].These conditions, plus the fact that we want that the exponential reproduction formulacoefficients form an orthogonal basis with ω0 = 2π/N , translate into a bound for t0which has to satisfy t0 < NT/2 = τ/2, and for the number of samples, which requiresN > max(P + 1,2P ). For a more detailed explanation of these conditions, we referto [56].
If we focus on the first-order real E-spline, then it is possible to derive a closed-formexpression for the CRB. Note that this function is obtained through convolution of thezero-order components having complex parameters ±jω0. The obtained kernel has thefollowing form:
e1(t) =
sin(ω0t)
ω0, 0 ≤ t < 1,
− sin(ω0(t− 2))
ω0, 1 ≤ t < 2.
(4.122)
The CRB can be obtained by inverting the Fisher information matrix, derived similarlyto the B-spline case. In this situation, again the bounds depend on t0. Calculating theaverage values leads to:
∆t0τ
≥ 1
N
√ω0 − cosω0 sinω0
ω0 sin2 ω0PSNR− 1
2 , (4.123)
∆a0
|a0|≥√
ω0ω0 +cosω0 sinω0
sin2 ω0PSNR− 1
2 . (4.124)

Sampling at the rate of innovation: theory and applications 207
References
[1] E. T. Whittaker. On the functions which are represented by the expansions of the interpolationtheory. Proc. Roy Soc Edin A, 35:181–194, 1915.
[2] H. Nyquist, Certain topics in telegraph transmission theory. Trans AIEE, 47:617–644, 1928.[3] C. Shannon. A mathematical theory of communication. Bell Syst Tech J. 27:379–423, 623–
656, 1948.[4] M. Vetterli, P. Marziliano, and T. Blu. Sampling signals with finite rate of innovation. IEEE
Trans Signal Proc, 50:1417–1428, 2002.[5] Y. C. Eldar and T. Michaeli. Beyond bandlimited sampling. IEEE Sig Proc Mag, 26:48–68,
2009.[6] M. Unser. Sampling – 50 years after Shannon, in Proc IEEE, pp. 569–587, 2000.[7] Y. M. Lu and M. N. Do. A theory for sampling signals from a union of subspaces. IEEE Trans
Sig Proc, 56(6):2334–2345, 2008.[8] M. Mishali and Y. C. Eldar. Robust recovery of signals from a structured union of subspaces.
IEEE Trans Inf Theory, 55:5302–5316, 2009.[9] P. L. Dragotti, M. Vetterli, and T. Blu. Sampling moments and reconstructing signals of
finite rate of innovation: Shannon meets Strang-Fix. IEEE Tran Sig Proc, 55(5):1741–1757,2007.
[10] R. Tur, Y. C. Eldar, and Z. Friedman. Innovation rate sampling of pulse streams withapplication to ultrasound imaging. IEEE Trans Sig Proc, 59(4):1827–1842, 2011.
[11] K. Gedalyahu, R. Tur, and Y. C. Eldar. Multichannel sampling of pulse streams at the rate ofinnovation. IEEE Trans Sig Proc, 59(4):1491–1504, 2011.
[12] Z. Ben-Haim, T. Michaeli, and Y. C. Eldar. Performance bounds and design criteria for esti-mating finite rate of innovation signals. SensorArray and Multichannel Processing Workshop(SAM), Jerusalem, October 4–7, 2010.
[13] I. Maravic and M. Vetterli. Sampling and reconstruction of signals with finite rate ofinnovation in the presence of noise. IEEE Trans Sig Proc, 53:2788–2805, 2005.
[14] V. Y. F. Tan and V. K. Goyal. Estimating signals with finite rate of innovation from noisysamples: A stochastic algorithm. IEEE Trans Sig Proc, 56(10):5135–5146, 2008.
[15] A. Erdozain and P. M. Crespo. A new stochastic algorithm inspired on genetic algorithmsto estimate signals with finite rate of innovation from noisy samples. Sig Proc, 90:134–144,2010.
[16] J. Berent, P. L. Dragotti, and T. Blu. “Sampling piecewise sinusoidal signals with finite rateof innovation methods.” IEEE Trans Sig Proc, 58(2):613–625, 2010.
[17] K. Gedalyahu and Y. C. Eldar, Time delay estimation from low rate samples: A union ofsubspaces approach. IEEE Trans Sig Proc, 58:3017–3031, 2010.
[18] P. Stoica and R. L. Moses. Introduction to Spectral Analysis. Englewood Cliffs, NJ: Prentice-Hall, 2000.
[19] T. Blu, P. L. Dragotti, M. Vetterli, P. Marziliano, and L. Coulot. Sparse sampling of signalinnovations. IEEE Sig Proc Mag, 25(2):31–40, 2008.
[20] H. Akhondi Asl, P. L. Dragotti, and L. Baboulaz. Multichannel sampling of signals with finiterate of innovation. IEEE Sig Proc Letters, 17:762–765, 2010.
[21] E. Matusiak and Y. C. Eldar, Sub-Nyquist sampling of short pulses: Part I, to appear in IEEETrans Sig Proc arXiv:1010.3132v1.
[22] A. Hormati, O. Roy, Y. M. Lu, and M. Vetterli. Distributed sampling of signals linked bysparse filtering: Theory and applications. Trans Sig Proc, 58(3):1095–1109, 2010.
208 J. A. Urigüen, Y. C. Eldar, P. L. Dragotti, and Z. Ben-Haim
[23] I. Maravic and M. Vetterli. Exact sampling results for some classes of parametric non-bandlimited 2-D signals. IEEE Trans Sig Proc, 52(1):175–189, 2004.
[24] P. Shukla and P. L. Dragotti, Sampling schemes for multidimensional signals with finite rateof innovation. IEEE Trans Sig Proc, 2006.
[25] L. Baboulaz and P. L. Dragotti. Distributed acquisition and image super-resolution based oncontinuous moments from samples. Proc IEEE Int Conf Image Proc (ICIP), pp. 3309–3312,2006.
[26] L. Baboulaz and P. L. Dragotti. Exact feature extraction using finite rate of innovation princi-ples with an application to image super-resolution. IEEE Trans Image Proc, 18(2):281–298,2009.
[27] W. U. Bajwa, K. Gedalyahu, and Y. C. Eldar. Identification of parametric underspread linearsystems and super-resolution radar, to appear in IEEE Trans Sig Proc, 59(6):2548–2561,2011.
[28] I. Maravic, J. Kusuma, and M. Vetterli. Low-sampling rate UWB channel characterizationand synchronization, J Commu Networks KOR, special issue on ultra-wideband systems,5(4):319–327, 2003.
[29] I. Maravic, M. Vetterli, and K. Ramchandran. Channel estimation and synchronization withsub-Nyquist sampling and application to ultra-wideband systems. Proc IEEE Int SympCircuits Syst, 5:381–384, 2004.
[30] M. Vetterli and J. Kovacevic. Wavelets and Subband Coding. Englewood Cliffs, NJ: PrenticeHall, 1995.
[31] I. Gohberg and S. Goldberg. Basic Operator Theory. Boston, MA: Birkhäuser, 1981.[32] Y. Hua and T. K. Sarkar, Matrix pencil method for estimating parameters of exponentially
damped/undamped sinusoids in noise. IEEE Trans Acoust, Speech, Sig Proc, 70:1272–1281,1990.
[33] S.Y. Kung, K. S.Arun, and D. V. B. Rao. State-space and singular-value decomposition-basedapproximation methods for the harmonic retrieval problem. J Opt Soci Amer, 73:1799–1811,1983.
[34] B. D. Rao and K. S. Arun. Model based processing of signals: A state space approach, ProcIEEE, 80(2):283–309, 1992.
[35] M. Unser and T. Blu. Cardinal exponential splines: Part I – Theory and filtering algorithms.IEEE Trans Sig Proc, 53:1425–1438, 2005.
[36] J. A. Urigüen, P. L. Dragotti, and T. Blu. On the exponential reproducing kernels for sam-pling signals with finite rate of innovation. Proc 9th Int Workshop Sampling Theory Appl(SampTA’11), Singapore, May 2–6, 2011.
[37] G. Strang and G. Fix, Fourier analysis of the finite element variational method. Construc AspFunct Anal; 796–830, 1971.
[38] V. Chaisinthop and P. L. Dragotti. Semi-parametric compression of piecewise smoothfunctions. Proc. Europ Sig Proc Conf (EUSIPCO), 2009.
[39] V. Chaisinthop and P. L. Dragotti, Centralized and distributed semi-parametric compressionof piecewise smooth functions. IEEE Trans Sig Proc, 59(7):3071–3085, 2011.
[40] J. Kusuma and V. Goyal, Multichannel sampling of parametric signals with a successiveapproximation property. IEEE Int Conf Image Proc (ICIP2006): 1265–1268, 2006.
[41] H. Olkkonen and J. Olkkonen. Measurement and reconstruction of impulse train by parallelexponential filters. IEEE Sig Proc Letters, 15:241–244, 2008.
[42] M. Mishali, Y. C. Eldar, O. Dounaevsky, and E. Shoshan. Xampling: Analog to digital atsub-Nyquist rates. IET Circ, Devices Syst, 5:8–20, 2011.

Sampling at the rate of innovation: theory and applications 209
[43] M. Mishali and Y. C. Eldar. From theory to practice: Sub-Nyquist sampling of sparsewideband analog signals. IEEE J Sel Top Sig Proc, 4:375–391, 2010.
[44] Y. C. Eldar and V. Pohl. Recovering signals from lowpass data. IEEE Trans Sig Proc,58(5):2636–2646, 2010.
[45] M. Mishali and Y. C. Eldar. Blind multiband signal reconstruction: Compressed sensing foranalog signals, IEEE Trans Sig Proc, 57(3):993–1009, 2009.
[46] R. Roy and T. Kailath. ESPRIT-estimation of signal parameters via rotational invariancetechniques. IEEE Trans Acoust, Speech Sig Proc, 37:984–995, 1989.
[47] R. Schmidt. Multiple emitter location and signal parameter estimation. IEEE Trans AntennasPropagation, 34:276–280, 1986.
[48] S. M. Kay. Fundamentals of Statistical Sig Processing: Estimation Theory. Englewood Cliffs,NJ: Prentice Hall, 1993.
[49] S. Mallat. A Wavelet Tour of Signal Processing. Academic Press, 1998.[50] A. Cohen, I. Daubechies, O. G. Guleryuzz, and M. T. Orchard. On the importance of combin-
ing wavelet-based nonlinear approximation with coding strategies. IEEE Trans Inf Theory,48:1895–1921, 2002.
[51] S. Farsiu, D. Robinson, M. Elad, and P. Milanfar. Advances and challenges in super-resolution. Int J Imaging Syst Technol, 13(10):1327–1344, 2004.
[52] H. Meyr, M. Moeneclaey, and S. A. Fechtel. Digital Communication Receivers:Synchronization, Channel Estimation, and Signal Processing. NewYork: Wiley-Interscience,1997.
[53] S. E. Bensley and B. Aazhang. Subspace-based channel estimation for code division multipleaccess communication systems. IEEE Trans Commun, 44(8):1009–1020, 1996.
[54] E. G. Strom, S. Parkvall, S. L. Miller, and B. E. Ottersten. DS-CDMA synchronization intime-varying fading channels. IEEE J Selected Areas in Commun, 14(8):1636–1642, 1996.
[55] L. Coulot, M.Vetterli,T. Blu, and P. L. Dragotti, Sampling signals with finite rate of innovationin the presence of noise. Tech. rep., École Polytechnique Federale de Lausanne, Switzerland,2007.
[56] F. J. Homann and P. L. Dragotti. Robust sampling of ‘almost’ sparse signals. Tech. rep.,Imperial College London, 2008.
5 Introduction to the non-asymptoticanalysis of random matricesRoman Vershynin
This is a tutorial on some basic non-asymptotic methods and concepts in random matrixtheory. The reader will learn several tools for the analysis of the extreme singular valuesof random matrices with independent rows or columns. Many of these methods sprungoff from the development of geometric functional analysis since the 1970s. They haveapplications in several fields, most notably in theoretical computer science, statistics andsignal processing. A few basic applications are covered in this text, particularly for theproblem of estimating covariance matrices in statistics and for validating probabilisticconstructions of measurement matrices in compressed sensing. This tutorial is writtenparticularly for graduate students and beginning researchers in different areas, includ-ing functional analysts, probabilists, theoretical statisticians, electrical engineers, andtheoretical computer scientists.
5.1 Introduction
Asymptotic and non-asymptotic regimesRandom matrix theory studies properties of N ×n matrices A chosen from some distri-bution on the set of all matrices. As dimensions N and n grow to infinity, one observesthat the spectrum of A tends to stabilize. This is manifested in several limit laws, whichmay be regarded as random matrix versions of the central limit theorem. Among them isWigner’s semicircle law for the eigenvalues of symmetric Gaussian matrices, the circularlaw for Gaussian matrices, the Marchenko–Pastur law for Wishart matrices W = A∗A
where A is a Gaussian matrix, the Bai–Yin and Tracy–Widom laws for the extremeeigenvalues of Wishart matrices W . The books [51, 5, 23, 6] offer thorough introductionto the classical problems of random matrix theory and its fascinating connections.
The asymptotic regime where the dimensions N,n→∞ is well suited for the purposesof statistical physics, e.g. when random matrices serve as finite-dimensional models ofinfinite-dimensional operators. But in some other areas including statistics, geometricfunctional analysis, and compressed sensing, the limiting regime may not be very useful[69]. Suppose, for example, that we ask about the largest singular value smax(A) (i.e.
Compressed Sensing: Theory and Applications, ed. Yonina C. Eldar and Gitta Kutyniok. Published byCambridge University Press. © Cambridge University Press 2012.

Non-asymptotic random matrix theory 211
the largest eigenvalue of (A∗A)1/2); to be specific assume that A is an n × n matrixwhose entries are independent standard normal random variables. The asymptotic ran-dom matrix theory answers this question as follows: the Bai–Yin law (see Theorem 5.31)states that
smax(A)/2√
n → 1 almost surely
as the dimension n → ∞. Moreover, the limiting distribution of smax(A) is known tobe the Tracy–Widom law (see [71, 27]). In contrast to this, a non-asymptotic answer tothe same question is the following: in every dimension n, one has
smax(A) ≤ C√
n with probability at least 1− e−n,
here C is an absolute constant (see Theorems 5.32 and 5.39). The latter answer is lessprecise (because of an absolute constant C) but more quantitative because for fixeddimensions n it gives an exponential probability of success.1 This is the kind of answerwe will seek in this text – guarantees up to absolute constants in all dimensions, and withlarge probability.
Tall matrices are approximate isometriesThe following heuristic will be our guideline: tall random matrices should act as approx-imate isometries. So, an N ×n random matrix A with N n should act almost like anisometric embedding of n
2 into N2 :
(1− δ)K‖x‖2 ≤ ‖Ax‖2 ≤ (1+ δ)K‖x‖2 for all x ∈ Rn
where K is an appropriate normalization factor and δ 1. Equivalently, this says thatall the singular values of A are close to each other:
(1− δ)K ≤ smin(A) ≤ smax(A) ≤ (1+ δ)K,
where smin(A) and smax(A) denote the smallest and the largest singular values of A. Yetequivalently, this means that tall matrices are well conditioned: the condition number ofA is κ(A) = smax(A)/smin(A) ≤ (1+ δ)/(1− δ) ≈ 1.
In the asymptotic regime and for random matrices with independent entries, our heuris-tic is justified by Bai–Yin’s law, which is Theorem 5.31 below. Loosely speaking, it statesthat as the dimensions N,n increase to infinity while the aspect ratio N/n is fixed, wehave √
N −√
n ≈ smin(A) ≤ smax(A) ≈√
N +√
n. (5.1)
In these notes, we study N ×n random matrices A with independent rows or independentcolumns, but not necessarily independent entries. We develop non-asymptotic versions
1 For this specific model (Gaussian matrices),Theorems 5.32 and 5.35 even give a sharp absolute constantC ≈ 2 here. But the result mentioned here is much more general as we will see later; it only requiresindependence of rows or columns of A.

212 Roman Vershynin
of (5.1) for such matrices, which should hold for all dimensions N and n. The desiredresults should have the form
√N −C
√n ≤ smin(A) ≤ smax(A) ≤
√N +C
√n (5.2)
with large probability, e.g. 1−e−N , where C is an absolute constant.2 For tall matrices,where N n, both sides of this inequality would be close to each other, which wouldguarantee that A is an approximate isometry.
Models and methodsWe shall study quite general models of random matrices – those with independent rowsor independent columns that are sampled from high-dimensional distributions. We willplace either strong moment assumptions on the distribution (sub-gaussian growth ofmoments), or no moment assumptions at all (except finite variance). This leads us tofour types of main results:
1. Matrices with independent sub-gaussian rows: Theorem 5.392. Matrices with independent heavy-tailed rows: Theorem 5.413. Matrices with independent sub-gaussian columns: Theorem 5.584. Matrices with independent heavy-tailed columns: Theorem 5.62
These four models cover many natural classes of random matrices that occur in appli-cations, including random matrices with independent entries (Gaussian and Bernoulli inparticular) and random sub-matrices of orthogonal matrices (random Fourier matricesin particular).
The analysis of these four models is based on a variety of tools of probability theoryand geometric functional analysis, most of which have not been covered in the texts on the“classical” random matrix theory. The reader will learn basics on sub-gaussian and sub-exponential random variables, isotropic random vectors, large deviation inequalities forsums of independent random variables, extensions of these inequalities to random matri-ces, and several basic methods of high-dimensional probability such as symmetrization,decoupling, and covering (ε-net) arguments.
ApplicationsIn these notes we shall emphasize two applications, one in statistics and one in com-pressed sensing. Our analysis of random matrices with independent rows immediatelyapplies to a basic problem in statistics – estimating covariance matrices of high-dimensional distributions. If a random matrix A has i.i.d. rows Ai, then A∗A =∑
i Ai ⊗Ai is the sample covariance matrix. If A has independent columns Aj , thenA∗A = (〈Aj ,Ak〉)j,k is the Gram matrix. Thus our analysis of the row-independent andcolumn-independent models can be interpreted as a study of sample covariance matricesand Gram matrices of high-dimensional distributions. We will see in Section 5.4.3 that
2 More accurately, we should expect C = O(1) to depend on easily computable quantities of thedistribution, such as its moments. This will be clear from the context.

Non-asymptotic random matrix theory 213
for a general distribution in Rn, its covariance matrix can be estimated from a sampleof size N = O(n logn) drawn from the distribution. Moreover, for sub-gaussian distri-butions we have an even better bound N = O(n). For low-dimensional distributions,much fewer samples are needed – if a distribution lies close to a subspace of dimensionr in Rn, then a sample of size N = O(r logn) is sufficient for covariance estimation.
In compressed sensing, the best known measurement matrices are random.Asufficientcondition for a matrix to succeed for the purposes of compressed sensing is given bythe restricted isometry property. Loosely speaking, this property demands that all sub-matrices of given size be well-conditioned. This fits well in the circle of problems of thenon-asymptotic random matrix theory. Indeed, we will see in Section 5.6 that all basicmodels of random matrices are nice restricted isometries. These include Gaussian andBernoulli matrices, more generally all matrices with sub-gaussian independent entries,and even more generally all matrices with sub-gaussian independent rows or columns.Also, the class of restricted isometries includes random Fourier matrices, more generallyrandom sub-matrices of bounded orthogonal matrices, and even more generally matri-ces whose rows are independent samples from an isotropic distribution with uniformlybounded coordinates.
Related sourcesThis chapter is a tutorial rather than a survey, so we focus on explaining methods ratherthan results. This forces us to make some concessions in our choice of the subjects.Concentration of measure and its applications to random matrix theory are only brieflymentioned. For an introduction into concentration of measure suitable for a beginner,see [9] and [49, Chapter 14]; for a thorough exposition see [56, 43]; for connectionswith random matrices see [21, 44]. The monograph [45] also offers an introduction intoconcentration of measure and related probabilistic methods in analysis and geometry,some of which we shall use in these notes.
We completely avoid the important (but more difficult) model of symmetric randommatrices with independent entries on and above the diagonal. Starting from the workof Füredi and Komlos [29], the largest singular value (the spectral norm) of symmetricrandom matrices has been a subject of study in many works; see e.g. [50, 83, 58] andthe references therein.
We also did not even attempt to discuss sharp small deviation inequalities (of Tracy–Widom type) for the extreme eigenvalues. Both these topics and much more arediscussed in the surveys [21, 44, 69], which serve as bridges between asymptotic andnon-asymptotic problems in random matrix theory.
Because of the absolute constant C in (5.2), our analysis of the smallest singular value(the “hard edge”) will only be useful for sufficiently tall matrices, where N ≥ C2n.For square and almost square matrices, the hard edge problem will be only brieflymentioned in Section 5.3. The surveys [76, 69] discuss this problem at length, and theyoffer a glimpse of connections to other problems of random matrix theory and additivecombinatorics.
Many of the results and methods presented in these notes are known in one formor another. Some of them are published while some others belong to the folklore of

214 Roman Vershynin
probability in Banach spaces, geometric functional analysis, and related areas. Whenavailable, historic references are given in Section 5.7.
AcknowledgementsThe author is grateful to the colleagues who made a number of improving suggestions forthe earlier versions of the manuscript, in particular to Richard Chen, Alexander Litvak,Deanna Needell, Holger Rauhut, S. V. N. Vishwanathan, and the anonymous referees.Special thanks are due to Ulas Ayaz and Felix Krahmer who thoroughly read the entiretext, and whose numerous comments led to significant improvements of this tutorial.
5.2 Preliminaries
5.2.1 Matrices and their singular values
The main object of our study will be an N ×n matrix A with real or complex entries.We shall state all results in the real case; the reader will be able to adjust them to thecomplex case as well. Usually but not always one should think of tall matrices A, thosefor which N ≥ n > 1. By passing to the adjoint matrix A∗, many results can be carriedover to “flat” matrices, those for which N ≤ n.
It is often convenient to study A through the n×n symmetric positive semidefinitematrix, the matrix A∗A. The eigenvalues of |A| :=
√A∗A are therefore non-negative
real numbers. Arranged in a non-decreasing order, they are called the singular values3
of A and denoted s1(A) ≥ ·· · ≥ sn(A) ≥ 0. Many applications require estimates on theextreme singular values
smax(A) := s1(A), smin(A) := sn(A).
The smallest singular value is only of interest for tall matrices, since for N < n oneautomatically has smin(A) = 0.
Equivalently, smax(A) and smin(A) are respectively the smallest number M and thelargest number m such that
m‖x‖2 ≤ ‖Ax‖2 ≤ M‖x‖2 for all x ∈ Rn. (5.3)
In order to interpret this definition geometrically, we look at A as a linear operator fromRn into RN . The Euclidean distance between any two points in Rn can increase by atmost the factor smax(A) and decrease by at most the factor smax(A) under the action of A.Therefore, the extreme singular values control the distortion of the Euclidean geometryunder the action of A. If smax(A)≈ smin(A)≈ 1 then A acts as an approximate isometry,or more accurately an approximate isometric embedding of n
2 into N2 .
3 In the literature, singular values are also called s-numbers.

Non-asymptotic random matrix theory 215
The extreme singular values can also be described in terms of the spectral norm of A,which is by definition
‖A‖ = ‖A‖n2 →N
2= sup
x∈Rn\0
‖Ax‖2
‖x‖2= sup
x∈Sn−1‖Ax‖2. (5.4)
Equation (5.3) gives a link between the extreme singular values and the spectral norm:
smax(A) = ‖A‖, smin(A) = 1/‖A†‖
where A† denotes the pseudoinverse of A; if A is invertible then A† = A−1.
5.2.2 Nets
Nets are convenient means to discretize compact sets. In our study we will mostly needto discretize the unit Euclidean sphere Sn−1 in the definition of the spectral norm (5.4).Let us first recall a general definition of an ε-net.
definition 5.1 (Nets, covering numbers) Let (X,d) be a metric space and let ε > 0.A subset Nε of X is called an ε-net of X if every point x ∈ X can be approximatedto within ε by some point y ∈ Nε, i.e. so that d(x,y) ≤ ε. The minimal cardinality ofan ε-net of X , if finite, is denoted N (X,ε) and is called the covering number of X (atscale ε).4
From a characterization of compactness we remember that X is compact if and onlyif N (X,ε) < ∞ for each ε > 0. A quantitative estimate on N (X,ε) would give us aquantitative version of compactness of X .5 Let us therefore take a simple example ofa metric space, the unit Euclidean sphere Sn−1 equipped with the Euclidean metric6
d(x,y) = ‖x− y‖2, and estimate its covering numbers.
lemma 5.2 (Covering numbers of the sphere) The unit Euclidean sphere Sn−1
equipped with the Euclidean metric satisfies for every ε > 0 that
N (Sn−1,ε) ≤(1+
2
ε
)n
.
Proof. This is a simple volume argument. Let us fix ε > 0 and choose Nε to be amaximal ε-separated subset of Sn−1. In other words, Nε is such that d(x,y) ≥ ε for allx,y ∈Nε, x = y, and no subset of Sn−1 containing Nε has this property.7
4 Equivalently, N (X,ε) is the minimal number of balls with radii ε and with centers in X needed tocover X .
5 In statistical learning theory and geometric functional analysis, logN (X,ε) is called the metric entropy ofX . In some sense it measures the “complexity” of metric space X .
6 A similar result holds for the geodesic metric on the sphere, since for small ε these two distances areequivalent.
7 One can in fact construct Nε inductively by first selecting an arbitrary point on the sphere, and at each nextstep selecting a point that is at distance at least ε from those already selected. By compactness, thisalgorithm will terminate after finitely many steps and it will yield a set Nε as we required.

216 Roman Vershynin
The maximality property implies that Nε is an ε-net of Sn−1. Indeed, otherwise therewould exist x∈ Sn−1 that is at least ε-far from all points in Nε. So Nε ∪x would stillbe an ε-separated set, contradicting the minimality property.
Moreover, the separation property implies via the triangle inequality that the balls ofradii ε/2 centered at the points in Nε are disjoint. On the other hand, all such balls lie in(1+ε/2)Bn
2 where Bn2 denotes the unit Euclidean ball centered at the origin. Comparing
the volume gives vol(
ε2Bn
2)· |Nε| ≤ vol
((1 + ε
2 )Bn2). Since vol
(rBn
2)
= rn vol(Bn2 )
for all r ≥ 0, we conclude that |Nε| ≤ (1+ ε2 )n/( ε
2 )n = (1+ 2ε )n as required.
Nets allow us to reduce the complexity of computations with linear operators. Onesuch example is the computation of the spectral norm. To evaluate the spectral norm bydefinition (5.4) one needs to take the supremum over the whole sphere Sn−1. However,one can essentially replace the sphere by its ε-net:
lemma 5.3 (Computing the spectral norm on a net) Let A be an N ×n matrix, andlet Nε be an ε-net of Sn−1 for some ε ∈ [0,1). Then
maxx∈Nε
‖Ax‖2 ≤ ‖A‖ ≤ (1− ε)−1 maxx∈Nε
‖Ax‖2.
Proof. The lower bound in the conclusion follows from the definition. To prove theupper bound let us fix x ∈ Sn−1 for which ‖A‖ = ‖Ax‖2, and choose y ∈ Nε whichapproximates x as ‖x − y‖2 ≤ ε. By the triangle inequality we have ‖Ax − Ay‖2 ≤‖A‖‖x− y‖2 ≤ ε‖A‖. It follows that
‖Ay‖2 ≥ ‖Ax‖2 −‖Ax−Ay‖2 ≥ ‖A‖− ε‖A‖ = (1− ε)‖A‖.
Taking the maximum over all y ∈Nε in this inequality, we complete the proof.
A similar result holds for symmetric n×n matrices A, whose spectral norm can becomputed via the associated quadratic form: ‖A‖ = supx∈Sn−1 |〈Ax,x〉|. Again, onecan essentially replace the sphere by its ε-net:
lemma 5.4 (Computing the spectral norm on a net) Let A be a symmetric n × n
matrix, and let Nε be an ε-net of Sn−1 for some ε ∈ [0,1). Then
‖A‖ = supx∈Sn−1
|〈Ax,x〉| ≤ (1− 2ε)−1 supx∈Nε
|〈Ax,x〉|.
Proof. Let us choose x ∈ Sn−1 for which ‖A‖ = |〈Ax,x〉|, and choose y ∈Nε whichapproximates x as ‖x− y‖2 ≤ ε. By the triangle inequality we have
|〈Ax,x〉− 〈Ay,y〉| = |〈Ax,x− y〉+ 〈A(x− y),y〉|
≤ ‖A‖‖x‖2‖x− y‖2 + ‖A‖‖x− y‖2‖y‖2 ≤ 2ε‖A‖.
It follows that |〈Ay,y〉| ≥ |〈Ax,x〉|−2ε‖A‖= (1−2ε)‖A‖. Taking the maximum overall y ∈Nε in this inequality completes the proof.
Non-asymptotic random matrix theory 217
5.2.3 Sub-gaussian random variables
In this section we introduce the class of sub-gaussian random variables,8 those whosedistributions are dominated by the distribution of a centered gaussian random variable.This is a convenient and quite wide class, which contains in particular the standardnormal and all bounded random variables.
Let us briefly recall some of the well-known properties of the standard normal ran-dom variable X . The distribution of X has density 1√
2πe−x2/2 and is denoted N(0,1).
Estimating the integral of this density between t and ∞ one checks that the tail of astandard normal random variable X decays super-exponentially:
P|X| > t =2√2π
∫ ∞
t
e−x2/2 dx ≤ 2e−t2/2, t ≥ 1, (5.5)
see e.g. [26, Theorem 1.4] for a more precise two-sided inequality. The absolute momentsof X can be computed as
(E|X|p)1/p =√
2[Γ((1+ p)/2)
Γ(1/2)
]1/p
= O(√
p), p ≥ 1. (5.6)
The moment generating function of X equals
Eexp(tX) = et2/2, t ∈ R. (5.7)
Now let X be a general random variable. We observe that these three properties areequivalent – a super-exponential tail decay like in (5.5), the moment growth (5.6), andthe growth of the moment generating function like in (5.7). We will then focus on theclass of random variables that satisfy these properties, which we shall call sub-gaussianrandom variables.
lemma 5.5 (Equivalence of sub-gaussian properties) Let X be a random variable.Then the following properties are equivalent with parameters Ki > 0 differing fromeach other by at most an absolute constant factor.9
1. Tails: P|X| > t ≤ exp(1− t2/K21 ) for all t ≥ 0;
2. Moments: (E|X|p)1/p ≤ K2√
p for all p ≥ 1;3. Super-exponential moment: Eexp(X2/K2
3 ) ≤ e.
Moreover, if EX = 0 then properties 1–3 are also equivalent to the following one:
4. Moment generating function: Eexp(tX) ≤ exp(t2K24 ) for all t ∈ R.
8 It would be more rigorous to say that we study sub-gaussian probability distributions. The same concernssome other properties of random variables and random vectors we study later in this text. However, it isconvenient for us to focus on random variables and vectors because we will form random matrices out ofthem.
9 The precise meaning of this equivalence is the following. There exists an absolute constant C such thatproperty i implies property j with parameter Kj ≤ CKi for any two properties i, j = 1,2,3.

218 Roman Vershynin
Proof. 1 ⇒ 2 Assume property 1 holds. By homogeneity, rescaling X to X/K1 we canassume that K1 = 1. Recall that for every non-negative random variable Z, integrationby parts yields the identity EZ =
∫∞0 PZ ≥ udu. We apply this for Z = |X|p. After
change of variables u = tp, we obtain using property 1 that
E|X|p =
∫ ∞
0P|X| ≥ tptp−1 dt ≤
∫ ∞
0e1−t2ptp−1 dt =
(ep2
)Γ(p2
)≤(ep
2
)(p2
)p/2.
Taking the pth root yields property 2 with a suitable absolute constant K2.2 ⇒ 3 Assume property 2 holds. As before, by homogeneity we may assume that
K2 = 1. Let c > 0 be a sufficiently small absolute constant. Writing the Taylor series ofthe exponential function, we obtain
Eexp(cX2) = 1+
∞∑p=1
cpE(X2p)
p!≤ 1+
∞∑p=1
cp(2p)p
p!≤ 1+
∞∑p=1
(2c/e)p.
The first inequality follows from property 2; in the second one we use p! ≥ (p/e)p. Forsmall c this gives Eexp(cX2) ≤ e, which is property 3 with K3 = c−1/2.
3⇒ 1Assume property 3 holds.As before we may assume that K3 =1. Exponentiatingand using Markov’s inequality10 and then property 3, we have
P|X| > t = PeX2 ≥ et2 ≤ e−t2EeX2 ≤ e1−t2 .
This proves property 1 with K1 = 1.2 ⇒ 4 Let us now assume that EX = 0 and property 2 holds; as usual we can assume
that K2 = 1. We will prove that property 4 holds with an appropriately large absoluteconstantC =K4. This will follow by estimatingTaylor series for the exponential function
Eexp(tX) = 1+ tEX +
∞∑p=2
tpEXp
p!≤ 1+
∞∑p=2
tppp/2
p!≤ 1+
∞∑p=2
(e|t|√
p
)p
. (5.8)
The first inequality here follows from EX = 0 and property 2; the second one holdssince p! ≥ (p/e)p. We compare this with Taylor’s series for
exp(C2t2) = 1+
∞∑k=1
(C|t|)2k
k!≥ 1+
∞∑k=1
(C|t|√k
)2k
= 1+∑p∈2N
( C|t|√p/2
)p
. (5.9)
The first inequality here holds because p!≤ pp; the second one is obtained by substitutionp=2k. One can show that the series in (5.8) is bounded by the series in (5.9). We concludethat Eexp(tX) ≤ exp(C2t2), which proves property 4.
10 This simple argument is sometimes called exponential Markov’s inequality.

Non-asymptotic random matrix theory 219
4 ⇒ 1 Assume property 4 holds; we can also assume that K4 = 1. Let λ > 0 be aparameter to be chosen later. By exponential Markov inequality, and using the bound onthe moment generating function given in property 4, we obtain
PX ≥ t = PeλX ≥ eλt ≤ e−λtEeλX ≤ e−λt+λ2.
Optimizing in λ and thus choosing λ = t/2 we conclude that PX ≥ t ≤ e−t2/4.Repeating this argument for −X , we also obtain PX ≤ −t ≤ e−t2/4. Combiningthese two bounds we conclude that P|X| ≥ t ≤ 2e−t2/4 ≤ e1−t2/4. Thus property 1holds with K1 = 2. The lemma is proved.
remark 5.6 1. The constants 1 and e in properties 1 and 3 respectively are chosen forconvenience. Thus the value 1 can be replaced by any positive number and the valuee can be replaced by any number greater than 1.
2. The assumption EX = 0 is only needed to prove the necessity of property 4; thesufficiency holds without this assumption.
definition 5.7 (Sub-gaussian random variables) A random variable X that satisfiesone of the equivalent properties 1–3 in Lemma 5.5 is called a sub-gaussian randomvariable. The sub-gaussian norm of X , denoted ‖X‖ψ2 , is defined to be the smallest K2
in property 2. In other words,11
‖X‖ψ2 = supp≥1
p−1/2(E|X|p)1/p.
The class of sub-gaussian random variables on a given probability space is thus anormed space. By Lemma 5.5, every sub-gaussian random variable X satisfies:
P|X| > t ≤ exp(1− ct2/‖X‖2ψ2
) for all t ≥ 0; (5.10)
(E|X|p)1/p ≤ ‖X‖ψ2
√p for all p ≥ 1; (5.11)
Eexp(cX2/‖X‖2ψ2
) ≤ e;
if EX = 0 then Eexp(tX) ≤ exp(Ct2‖X‖2ψ2
) for all t ∈ R, (5.12)
where C,c > 0 are absolute constants. Moreover, up to absolute constant factors, ‖X‖ψ2
is the smallest possible number in each of these inequalities.
Example 5.8 Classical examples of sub-gaussian random variables are Gaussian,Bernoulli and all bounded random variables.
1. (Gaussian): A standard normal random variable X is sub-gaussian with ‖X‖ψ2 ≤C
where C is an absolute constant. This follows from (5.6). More generally, if X isa centered normal random variable with variance σ2, then X is sub-gaussian with‖X‖ψ2 ≤ Cσ.
11 The sub-gaussian norm is also called ψ2 norm in the literature.

220 Roman Vershynin
2. (Bernoulli): Consider a random variable X with distribution PX =−1= PX =
1=1/2. We call X a symmetric Bernoulli random variable. Since |X|=1, it followsthat X is a sub-gaussian random variable with ‖X‖ψ2 = 1.
3. (Bounded): More generally, consider any bounded random variable X , thus |X| ≤M
almost surely for some M . Then X is a sub-gaussian random variable with ‖X‖ψ2 ≤M . We can write this more compactly as ‖X‖ψ2 ≤ ‖X‖∞.
A remarkable property of the normal distribution is rotation invariance. Given a finitenumber of independent centered normal random variables Xi, their sum
∑i Xi is also a
centered normal random variable, obviously with Var(∑
i Xi) =∑
i Var(Xi). Rotationinvariance passes onto sub-gaussian random variables, although approximately:
lemma 5.9 (Rotation invariance) Consider a finite number of independent centeredsub-gaussian random variables Xi. Then
∑i Xi is also a centered sub-gaussian random
variable. Moreover, ∥∥∑i
Xi
∥∥2ψ2
≤ C∑
i
‖Xi‖2ψ2
where C is an absolute constant.
Proof. The argument is based on estimating the moment generating function. Usingindependence and (5.12) we have for every t ∈ R:
Eexp(t∑
i
Xi
)= E
∏i
exp(tXi) =∏
i
Eexp(tXi) ≤∏
i
exp(Ct2‖Xi‖2ψ2
)
= exp(t2K2) where K2 = C∑
i
‖Xi‖2ψ2
.
Using the equivalence of properties 2 and 4 in Lemma 5.5 we conclude that ‖∑
i Xi‖ψ2 ≤C1K where C1 is an absolute constant. The proof is complete.
The rotation invariance immediately yields a large deviation inequality for sums ofindependent sub-gaussian random variables:
proposition 5.10 (Hoeffding-type inequality) Let X1, . . . ,XN be independentcentered sub-gaussian random variables, and let K = maxi ‖Xi‖ψ2 . Then for everya = (a1, . . . ,aN ) ∈ RN and every t ≥ 0, we have
P∣∣∣ N∑
i=1
aiXi
∣∣∣≥ t≤ e · exp
(− ct2
K2‖a‖22
)where c > 0 is an absolute constant.
Proof. The rotation invariance (Lemma 5.9) implies the bound ‖∑
i aiXi‖2ψ2
≤C∑
i a2i ‖Xi‖2
ψ2≤ CK2‖a‖2
2. Property (5.10) yields the required tail decay.
remark 5.11 One can interpret these results (Lemma 5.9 and Proposition 5.10) asone-sided non-asymptotic manifestations of the central limit theorem. For example,
Non-asymptotic random matrix theory 221
consider the normalized sum of independent symmetric Bernoulli random variablesSN = 1√
N
∑Ni=1 εi. Proposition 5.10 yields the tail bounds P|SN | > t ≤ e · e−ct2 for
any number of terms N . Up to the absolute constants e and c, these tails coincide withthose of the standard normal random variable (5.5).
Using moment growth (5.11) instead of the tail decay (5.10), we immediately obtainfrom Lemma 5.9 a general form of the well-known Khintchine inequality:
corollary 5.12 (Khintchine inequality) Let Xi be a finite number of independentsub-gaussian random variables with zero mean, unit variance, and ‖Xi‖ψ2 ≤ K. Then,for every sequence of coefficients ai and every exponent p ≥ 2 we have
(∑i
a2i
)1/2 ≤(E∣∣∑
i
aiXi
∣∣p)1/p ≤ CK√
p(∑
i
a2i
)1/2
where C is an absolute constant.
Proof. The lower bound follows by independence and Hölder’s inequality: indeed,(E∣∣∑
i aiXi
∣∣p)1/p ≥(E∣∣∑
i aiXi
∣∣2)1/2=(∑
i a2i
)1/2. For the upper bound, we argue
as in Proposition 5.10, but use property (5.11).
5.2.4 Sub-exponential random variables
Although the class of sub-gaussian random variables is natural and quite wide, it leavesout some useful random variables which have tails heavier than gaussian. One suchexample is a standard exponential random variable – a non-negative random variablewith exponential tail decay
PX ≥ t = e−t, t ≥ 0. (5.13)
To cover such examples, we consider a class of sub-exponential random variables,those with at least an exponential tail decay. With appropriate modifications, the basicproperties of sub-gaussian random variables hold for sub-exponentials. In particular, aversion of Lemma 5.5 holds with a similar proof for sub-exponential properties, exceptfor property 4 of the moment generating function. Thus for a random variable X thefollowing properties are equivalent with parameters Ki > 0 differing from each otherby at most an absolute constant factor:
P|X| > t ≤ exp(1− t/K1) for all t ≥ 0; (5.14)
(E|X|p)1/p ≤ K2p for all p ≥ 1; (5.15)
Eexp(X/K3) ≤ e. (5.16)
definition 5.13 (Sub-exponential random variables) A random variable X that sat-isfies one of the equivalent properties (5.14)–(5.16) is called a sub-exponential random
222 Roman Vershynin
variable. The sub-exponential norm of X , denoted ‖X‖ψ1 , is defined to be the smallestparameter K2. In other words,
‖X‖ψ1 = supp≥1
p−1(E|X|p)1/p.
lemma 5.14 (Sub-exponential is sub-gaussian squared) A random variable X is sub-gaussian if and only if X2 is sub-exponential. Moreover,
‖X‖2ψ2
≤ ‖X2‖ψ1 ≤ 2‖X‖2ψ2
.
Proof. This follows easily from the definition.
The moment generating function of a sub-exponential random variable has a similarupper bound as in the sub-gaussian case (property 4 in Lemma 5.5). The only realdifference is that the bound only holds in a neighborhood of zero rather than on thewhole real line. This is inevitable, as the moment generating function of an exponentialrandom variable (5.13) does not exist for t ≥ 1.
lemma 5.15 (Mgf of sub-exponential random variables) Let X be a centered sub-exponential random variable. Then, for t such that |t| ≤ c/‖X‖ψ1 , one has
Eexp(tX) ≤ exp(Ct2‖X‖2ψ1
)
where C,c > 0 are absolute constants.
Proof. The argument is similar to the sub-gaussian case. We can assume that ‖X‖ψ1 =1
by replacing X with X/‖X‖ψ1 and t with t‖X‖ψ1 . Repeating the proof of the implication2 ⇒ 4 of Lemma 5.5 and using E|X|p ≤ pp this time, we obtain that Eexp(tX) ≤ 1+∑∞
p=2(e|t|)p. If |t|≤ 1/2e then the right-hand side is bounded by1+2e2t2 ≤ exp(2e2t2).This completes the proof.
Sub-exponential random variables satisfy a large deviation inequality similar to theone for sub-gaussians (Proposition 5.10). The only significant difference is that two tailshave to appear here – a gaussian tail responsible for the central limit theorem, and anexponential tail coming from the tails of each term.
proposition 5.16 (Bernstein-type inequality) Let X1, . . . ,XN be independent cen-tered sub-exponential random variables, and K = maxi ‖Xi‖ψ1 . Then for every a =
(a1, . . . ,aN ) ∈ RN and every t ≥ 0, we have
P∣∣∣ N∑
i=1
aiXi
∣∣∣≥ t≤ 2exp
[− cmin
( t2
K2‖a‖22,
t
K‖a‖∞
)]where c > 0 is an absolute constant.

Non-asymptotic random matrix theory 223
Proof. Without loss of generality, we assume that K = 1 by replacing Xi with Xi/K
and t with t/K. We use the exponential Markov inequality for the sum S =∑
i aiXi
and with a parameter λ > 0:
PS ≥ t = PeλS ≥ eλt ≤ e−λtEeλS = e−λt∏
i
Eexp(λaiXi).
If |λ| ≤ c/‖a‖∞ then |λai| ≤ c for all i, so Lemma 5.15 yields
PS ≥ t ≤ e−λt∏
i
exp(Cλ2a2i ) = exp(−λt+Cλ2‖a‖2
2).
Choosing λ = min(t/2C‖a‖22, c/‖a‖∞), we obtain that
PS ≥ t ≤ exp[−min
( t2
4C‖a‖22,
ct
2‖a‖∞
)].
Repeating this argument for−Xi instead ofXi, we obtain the same bound for P−S ≥ t.A combination of these two bounds completes the proof.
corollary 5.17 Let X1, . . . ,XN be independent centered sub-exponential randomvariables, and let K = maxi ‖Xi‖ψ1 . Then, for every ε ≥ 0, we have
P∣∣∣ N∑
i=1
Xi
∣∣∣≥ εN≤ 2exp
[− cmin
( ε2
K2 ,ε
K
)N]
where c > 0 is an absolute constant.
Proof. This follows from Proposition 5.16 for ai = 1 and t = εN .
remark 5.18 (Centering) The definitions of sub-gaussian and sub-exponential randomvariables X do not require them to be centered. In any case, one can always center X
using the simple fact that if X is sub-gaussian (or sub-exponential), then so is X −EX .Moreover,
‖X −EX‖ψ2 ≤ 2‖X‖ψ2 , ‖X −EX‖ψ1 ≤ 2‖X‖ψ1 .
This follows by the triangle inequality ‖X −EX‖ψ2 ≤ ‖X‖ψ2 + ‖EX‖ψ2 along with‖EX‖ψ2 = |EX| ≤ E|X| ≤ ‖X‖ψ2 , and similarly for the sub-exponential norm.
5.2.5 Isotropic random vectors
Now we carry our work over to higher dimensions. We will thus be working with randomvectors X in Rn, or equivalently probability distributions in Rn.
While the concept of the mean µ = EZ of a random variable Z remains the same inhigher dimensions, the second moment EZ2 is replaced by the n× n second momentmatrix of a random vector X , defined as
Σ = Σ(X) = EX ⊗X = EXXT

224 Roman Vershynin
where ⊗ denotes the outer product of vectors in Rn. Similarly, the concept of varianceVar(Z) = E(Z−µ)2 = EZ2−µ2 of a random variable is replaced in higher dimensionswith the covariance matrix of a random vector X , defined as
Cov(X) = E(X −µ)⊗ (X −µ) = EX ⊗X −µ⊗µ
where µ = EX . By translation, many questions can be reduced to the case of centeredrandom vectors, for which µ = 0 and Cov(X) = Σ(X). We will also need a higher-dimensional version of unit variance:
definition 5.19 (Isotropic random vectors) A random vector X in Rn is calledisotropic if Σ(X) = I . Equivalently, X is isotropic if
E〈X,x〉2 = ‖x‖22 for all x ∈ Rn. (5.17)
Suppose Σ(X) is an invertible matrix, which means that the distribution of X is notessentially supported on any proper subspace of Rn. Then Σ(X)−1/2X is an isotropicrandom vector in Rn. Thus every non-degenerate random vector can be made isotropicby an appropriate linear transformation.12 This allows us to mostly focus on studyingisotropic random vectors in the future.
lemma 5.20 Let X,Y be independent isotropic random vectors in Rn. Then E‖X‖22 =
n and E〈X,Y 〉2 = n.
Proof. The first part follows from E‖X‖22 = Etr(X ⊗X) = tr(EX ⊗X) = tr(I) = n.
The second part follows by conditioning on Y , using isotropy of X and using the firstpart for Y : this way we obtain E〈X,Y 〉2 = E‖Y ‖2
2 = n.
Example 5.21
1. (Gaussian): The (standard) Gaussian random vector X in Rn chosen accordingto the standard normal distribution N(0, I) is isotropic. The coordinates of X areindependent standard normal random variables.
2. (Bernoulli): A similar example of a discrete isotropic distribution is given by aBernoulli random vector X in Rn whose coordinates are independent symmetricBernoulli random variables.
3. (Product distributions): More generally, consider a random vector X in Rn whosecoordinates are independent random variables with zero mean and unit variance. Thenclearly X is an isotropic vector in Rn.
4. (Coordinate): Consider a coordinate random vector X , which is uniformly dis-tributed in the set
√nein
i=1 where eini=1 is the canonical basis of Rn. Clearly X
is an isotropic random vector in Rn.13
12 This transformation (usually preceded by centering) is a higher-dimensional version of standardizing ofrandom variables, which enforces zero mean and unit variance.
13 The examples of Gaussian and coordinate random vectors are somewhat opposite – one is verycontinuous and the other is very discrete. They may be used as test cases in our study of random matrices.

Non-asymptotic random matrix theory 225
5. (Frame): This is a more general version of the coordinate random vector. A frame isa set of vectors uiM
i=1 in Rn which obeys an approximate Parseval’s identity, i.e.there exist numbers A,B > 0 called frame bounds such that
A‖x‖22 ≤
M∑i=1
〈ui,x〉2 ≤ B‖x‖22 for all x ∈ Rn.
If A = B the set is called a tight frame. Thus, tight frames are generalizations oforthogonal bases without linear independence. Given a tight frame uiM
i=1 withbounds A = B = M , the random vector X uniformly distributed in the set uiM
i=1is clearly isotropic in Rn.14
6. (Spherical): Consider a random vector X uniformly distributed on the unit Euclideansphere in Rn with center at the origin and radius
√n. Then X is isotropic. Indeed, by
rotation invariance E〈X,x〉2 is proportional to ‖x‖22; the correct normalization
√n
is derived from Lemma 5.20.7. (Uniform on a convex set): In convex geometry, a convex set K in Rn is
called isotropic if a random vector X chosen uniformly from K according tothe volume is isotropic. As we noted, every full-dimensional convex set can bemade into an isotropic one by an affine transformation. Isotropic convex sets look“well conditioned,” which is advantageous in geometric algorithms (e.g. volumecomputations).
We generalize the concepts of sub-gaussian random variables to higher dimensionsusing one-dimensional marginals.
definition 5.22 (Sub-gaussian random vectors) We say that a random vector X inRn is sub-gaussian if the one-dimensional marginals 〈X,x〉 are sub-gaussian randomvariables for all x ∈ Rn. The sub-gaussian norm of X is defined as
‖X‖ψ2 = supx∈Sn−1
‖〈X,x〉‖ψ2 .
Remark 5.23 (Properties of high-dimensional distributions) The definitions of isotro-pic and sub-gaussian distributions suggest that, more generally, natural properties ofhigh-dimensional distributions may be defined via one-dimensional marginals. This is anatural way to generalize properties of random variables to random vectors. For example,we shall call a random vector sub-exponential if all of its one-dimensional marginals aresub-exponential random variables, etc.
One simple way to create sub-gaussian distributions in Rn is by taking a product ofn sub-gaussian distributions on the line:
14 There is clearly a reverse implication, too, which shows that the class of tight frames can be identifiedwith the class of discrete isotropic random vectors.
226 Roman Vershynin
lemma 5.24 (Product of sub-gaussian distributions) Let X1, . . . ,Xn be independentcentered sub-gaussian random variables. Then X = (X1, . . . ,Xn) is a centered sub-gaussian random vector in Rn, and
‖X‖ψ2 ≤ C maxi≤n
‖Xi‖ψ2
where C is an absolute constant.
Proof. This is a direct consequence of the rotation invariance principle, Lemma 5.9.Indeed, for every x = (x1, . . . ,xn) ∈ Sn−1 we have
‖〈X,x〉‖ψ2 =
∥∥∥ n∑i=1
xiXi
∥∥∥ψ2
≤ C
n∑i=1
x2i ‖Xi‖2
ψ2≤ C max
i≤n‖Xi‖ψ2
where we used that∑n
i=1 x2i = 1. This completes the proof.
Example 5.25 Let us analyze the basic examples of random vectors introduced earlierin Example 5.21.
1. (Gaussian, Bernoulli): Gaussian and Bernoulli random vectors are sub-gaussian;their sub-gaussian norms are bounded by an absolute constant. These are particularcases of Lemma 5.24.
2. (Spherical): A spherical random vector is also sub-gaussian; its sub-gaussian normis bounded by an absolute constant. Unfortunately, this does not follow fromLemma 5.24 because the coordinates of the spherical vector are not independent.Instead, by rotation invariance, the claim clearly follows from the following geomet-ric fact. For every ε ≥ 0, the spherical cap x ∈ Sn−1 : x1 > ε makes up at mostexp(−ε2n/2) proportion of the total area on the sphere.15 This can be proved directlyby integration, and also by elementary geometric considerations [9, Lemma 2.2].
3. (Coordinate): Although the coordinate random vector X is formally sub-gaussianas its support is finite, its sub-gaussian norm is too big: ‖X‖ψ2 =
√n 1. So we
would not think of X as a sub-gaussian random vector.4. (Uniform on a convex set): For many isotropic convex sets K (called ψ2 bodies),
a random vector X uniformly distributed in K is sub-gaussian with ‖X‖ψ2 = O(1).For example, the cube [−1,1]n is a ψ2 body by Lemma 5.24, while the appropri-ately normalized cross-polytope x∈ Rn : ‖x‖1 ≤M is not. Nevertheless, Borell’slemma (which is a consequence of Brunn–Minkowski inequality) implies a weakerproperty, that X is always sub-exponential, and ‖X‖ψ1 = supx∈Sn−1 ‖〈X,x〉‖ψ1 isbounded by an absolute constant. See [33, Section 2.2.b3] for a proof and discussionof these ideas.
15 This fact about spherical caps may seem counter-intuitive. For example, for ε = 0.1 the cap looks similarto a hemisphere, but the proportion of its area goes to zero very fast as dimension n increases. This is astarting point of the study of the concentration of measure phenomenon, see [43].

Non-asymptotic random matrix theory 227
5.2.6 Sums of independent random matrices
In this section, we mention without proof some results of classical probability theoryin which scalars can be replaced by matrices. Such results are useful in particular forproblems on random matrices, since we can view a random matrix as a generalizationof a random variable. One such remarkable generalization is valid for the Khintchineinequality, Corollary 5.12. The scalars ai can be replaced by matrices, and the absolutevalue by the Schatten norm. Recall that for 1≤ p≤∞, the p-Schatten norm of an n×n
matrix A is defined as the p norm of the sequence of its singular values:
‖A‖Cnp
= ‖(si(A))ni=1‖p =
( n∑i=1
si(A)p)1/p
.
For p = ∞, the Schatten norm equals the spectral norm ‖A‖ = maxi≤n si(A). Usingthis one can quickly check that already for p = logn the Schatten and spectral norms areequivalent: ‖A‖Cn
p≤ ‖A‖ ≤ e‖A‖Cn
p.
theorem 5.26 (Non-commutative Khintchine inequality, see [61] Section 9.8) LetA1, . . . ,AN be self-adjoint n × n matrices and ε1, . . . ,εN be independent symmetricBernoulli random variables. Then, for every 2 ≤ p < ∞, we have
E∥∥∥ N∑
i=1
εiAi
∥∥∥≤ C1√
logn∥∥∥( N∑
i=1
A2i
)1/2∥∥∥where C is an absolute constant.
remark 5.27 1. The scalar case of this result, for n = 1, recovers the classicalKhintchine inequality, Corollary 5.12, for Xi = εi.
2. By the equivalence of Schatten and spectral norms for p = logn, a version of non-commutative Khintchine inequality holds for the spectral norm:
c1√logn
∥∥∥( N∑i=1
A2i
)1/2∥∥∥≤ E∥∥∥ N∑
i=1
εiAi
∥∥∥≤ C1√
logn∥∥∥( N∑
i=1
A2i
)1/2∥∥∥ (5.18)
where C1, c1 > 0 are absolute constants. The logarithmic factor is unfortunately essen-tial; its role will be clear when we discuss applications of this result to random matricesin the next sections.
corollary 5.28 (Rudelson’s inequality [65]) Let x1, . . . ,xN be vectors in Rn andε1, . . . ,εN be independent symmetric Bernoulli random variables. Then
E∥∥∥ N∑
i=1
εixi ⊗xi
∥∥∥≤ C√
logmin(N,n) ·maxi≤N
‖xi‖2 ·∥∥∥ N∑
i=1
xi ⊗xi
∥∥∥1/2
where C is an absolute constant.

228 Roman Vershynin
Proof. One can assume that n≤N by replacing Rn with the linear span of x1, . . . ,xNif necessary. The claim then follows from (5.18), since
∥∥∥( N∑i=1
(xi ⊗xi)2)1/2∥∥∥=
∥∥∥ N∑i=1
‖xi‖22 xi ⊗xi
∥∥∥1/2≤ max
i≤N‖xi‖2
∥∥∥ N∑i=1
xi ⊗xi
∥∥∥1/2.
Ahlswede and Winter [4] pioneered a different approach to matrix-valued inequalitiesin probability theory, which was based on trace inequalities like the Golden–Thompsoninequality. A development of this idea leads to remarkably sharp results. We quote onesuch inequality from [77]:
theorem 5.29 (Non-commutative Bernstein-type inequality [77]) Consider a finitesequence Xi of independent centered self-adjoint random n× n matrices. Assume wehave for some numbers K and σ that
‖Xi‖ ≤ K almost surely,∥∥∑
i
EX2i
∥∥≤ σ2.
Then, for every t ≥ 0 we have
P∥∥∑
i
Xi
∥∥≥ t≤ 2n · exp
( −t2/2
σ2 +Kt/3
). (5.19)
remark 5.30 This is a direct matrix generalization of a classical Bernstein’s inequalityfor bounded random variables. To compare it with our version of Bernstein’s inequal-ity for sub-exponentials, Proposition 5.16, note that the probability bound in (5.19) isequivalent to 2n · exp
[− cmin
(t2
σ2 , tK
)]where c > 0 is an absolute constant. In both
results we see a mixture of Gaussian and exponential tails.
5.3 Random matrices with independent entries
We are ready to study the extreme singular values of random matrices. In this section,we consider the classical model of random matrices whose entries are independent andcentered random variables. Later we will study the more difficult models where only therows or the columns are independent.
The reader may keep in mind some classical examples of N × n random matriceswith independent entries. The most classical example is the Gaussian random matrix A
whose entries are independent standard normal random variables. In this case, the n×n
symmetric matrix A∗A is called a Wishart matrix; it is a higher-dimensional version ofchi-square distributed random variables.
The simplest example of discrete random matrices is the Bernoulli random matrix A
whose entries are independent symmetric Bernoulli random variables. In other words,Bernoulli random matrices are distributed uniformly in the set of all N ×n matrices with±1 entries.
Non-asymptotic random matrix theory 229
5.3.1 Limit laws and Gaussian matrices
Consider an N ×n random matrix A whose entries are independent centered identicallydistributed random variables. By now, the limiting behavior of the extreme singularvalues of A, as the dimensions N,n →∞, is well understood:
theorem 5.31 (Bai–Yin’s law, see [8]) Let A = AN,n be an N ×n random matrixwhose entries are independent copies of a random variable with zero mean, unit variance,and finite fourth moment. Suppose that the dimensions N and n grow to infinity whilethe aspect ratio n/N converges to a constant in [0,1]. Then
smin(A) =√
N −√
n+ o(√
n), smax(A) =√
N +√
n+ o(√
n) almost surely.
As we pointed out in the introduction, our program is to find non-asymptotic versionsof Bai–Yin’s law. There is precisely one model of random matrices, namely Gaussian,where an exact non-asymptotic result is known:
theorem 5.32 (Gordon’s theorem for Gaussian matrices) Let A be an N ×n matrixwhose entries are independent standard normal random variables. Then
√N −
√n ≤ Esmin(A) ≤ Esmax(A) ≤
√N +
√n.
The proof of the upper bound, which we borrowed from [21], is based on Slepian’scomparison inequality for Gaussian processes.16
lemma 5.33 (Slepian’s inequality, see [45] Section 3.3) Consider two Gaussian pro-cesses (Xt)t∈T and (Yt)t∈T whose increments satisfy the inequality E|Xs − Xt|2 ≤E|Ys −Yt|2 for all s, t ∈ T . Then Esupt∈T Xt ≤ Esupt∈T Yt.
Proof of Theorem 5.32. We recognize smax(A) = maxu∈Sn−1, v∈SN−1〈Au,v〉 to bethe supremum of the Gaussian process Xu,v = 〈Au,v〉 indexed by the pairs of vectors(u,v) ∈ Sn−1 × SN−1. We shall compare this process to the following one whosesupremum is easier to estimate: Yu,v = 〈g,u〉 + 〈h,v〉 where g ∈ Rn and h ∈ RN
are independent standard Gaussian random vectors. The rotation invariance of Gaus-sian measures makes it easy to compare the increments of these processes. For every(u,v),(u′,v′) ∈ Sn−1 ×SN−1, one can check that
E|Xu,v −Xu′,v′ |2 =
n∑i=1
N∑j=1
|uivj −u′iv
′j |2 ≤‖u−u′‖2
2+‖v−v′‖22 = E|Yu,v −Yu′,v′ |2.
Therefore Lemma 5.33 applies, and it yields the required bound
Esmax(A) = Emax(u,v)
Xu,v ≤ Emax(u,v)
Yu,v = E‖g‖2 +E‖h‖2 ≤√
N +√
n.
16 Recall that a Gaussian process (Xt)t∈T is a collection of centered normal random variables Xt on thesame probability space, indexed by points t in an abstract set T .

230 Roman Vershynin
Similar ideas are used to estimate Esmin(A) = Emaxv∈SN−1 minu∈Sn−1〈Au,v〉, see[21]. One uses in this case Gordon’s generalization of Slepian’s inequality for minimaxof Gaussian processes [35, 36, 37], see [45, Section 3.3].
While Theorem 5.32 is about the expectation of singular values, it also yields a largedeviation inequality for them. It can be deduced formally by using the concentration ofmeasure in the Gauss space.
proposition 5.34 (Concentration in Gauss space, see [43]) Let f be a real-valuedLipschitz function on Rn with Lipschitz constant K, i.e. |f(x)−f(y)| ≤K‖x−y‖2 forall x,y ∈Rn (such functions are also called K-Lipschitz). Let X be the standard normalrandom vector in Rn. Then for every t ≥ 0 one has
Pf(X)−Ef(X) > t ≤ exp(−t2/2K2).
corollary 5.35 (Gaussian matrices, deviation; see [21]) Let A be an N ×n matrixwhose entries are independent standard normal random variables. Then for every t≥ 0,with probability at least 1− 2exp(−t2/2) one has
√N −
√n− t ≤ smin(A) ≤ smax(A) ≤
√N +
√n+ t.
Proof. Note that smin(A), smax(A) are 1-Lipschitz functions of matrices A consideredas vectors in RNn. The conclusion now follows from the estimates on the expectation(Theorem 5.32) and Gaussian concentration (Proposition 5.34).
Later in these notes, we find it more convenient to work with the n×n positive-definitesymmetric matrix A∗A rather than with the original N ×n matrix A. Observe that thenormalized matrix A = 1√
NA is an approximate isometry (which is our goal) if and only
if A∗A is an approximate identity:
lemma 5.36 (Approximate isometries) Consider a matrix B that satisfies
‖B∗B − I‖ ≤ max(δ,δ2) (5.20)
for some δ > 0. Then
1− δ ≤ smin(B) ≤ smax(B) ≤ 1+ δ. (5.21)
Conversely, if B satisfies (5.21) for some δ > 0 then ‖B∗B − I‖ ≤ 3max(δ,δ2).
Proof. Inequality (5.20) holds if and only if∣∣‖Bx‖2
2−1∣∣≤max(δ,δ2) for all x∈Sn−1.
Similarly, (5.21) holds if and only if∣∣‖Bx‖2 − 1
∣∣≤ δ for all x ∈ Sn−1. The conclusionthen follows from the elementary inequality
max(|z − 1|, |z − 1|2) ≤ |z2 − 1| ≤ 3max(|z − 1|, |z − 1|2) for all z ≥ 0.

Non-asymptotic random matrix theory 231
Lemma 5.36 reduces our task of proving inequalities (5.2) to showing an equivalent(but often more convenient) bound
∥∥ 1
NA∗A− I
∥∥≤ max(δ,δ2) where δ = O(√
n/N).
5.3.2 General random matrices with independent entries
Now we pass to a more general model of random matrices whose entries are independentcentered random variables with some general distribution (not necessarily normal). Thelargest singular value (the spectral norm) can be estimated by Latala’s theorem for generalrandom matrices with non-identically distributed entries:
theorem 5.37 (Latala’s theorem [42]) Let A be a random matrix whose entries aij
are independent centered random variables with finite fourth moment. Then
Esmax(A) ≤ C[max
i
(∑j
Ea2ij
)1/2+max
j
(∑i
Ea2ij
)1/2+(∑
i,j
Ea4ij
)1/4].
If the variance and the fourth moments of the entries are uniformly bounded, thenLatala’s result yields smax(A) = O(
√N +
√n). This is slightly weaker than our goal
(5.2), which is smax(A) =√
N + O(√
n) but still satisfactory for most applications.Results of the latter type will appear later in the more general model of random matriceswith independent rows or columns.
Similarly, our goal (5.2) for the smallest singular value is smin(A) ≥√
N −O(√
n).Since the singular values are non-negative anyway, such an inequality would only beuseful for sufficiently tall matrices, N n. For almost square and square matrices,estimating the smallest singular value (known also as the hard edge of spectrum) isconsiderably more difficult. The progress on estimating the hard edge is summarizedin [69]. If A has independent entries, then indeed smin(A) ≥ c(
√N −
√n), and the
following is an optimal probability bound:
theorem 5.38 (Independent entries, hard edge [68]) Let A be an n×n random matrixwhose entries are independent identically distributed sub-gaussian random variableswith zero mean and unit variance. Then for ε ≥ 0,
P(smin(A) ≤ ε(
√N −
√n− 1)
)≤ (Cε)N−n+1 + cN
where C > 0 and c ∈ (0,1) depend only on the sub-gaussian norm of the entries.
This result gives an optimal bound for square matrices as well (N = n).
5.4 Random matrices with independent rows
In this section, we focus on a more general model of random matrices, where we onlyassume independence of the rows rather than all entries. Such matrices are naturally

232 Roman Vershynin
generated by high-dimensional distributions. Indeed, given an arbitrary probability dis-tribution in Rn, one takes a sample of N independent points and arranges them as therows of an N ×n matrix A. By studying spectral properties of A one should be able tolearn something useful about the underlying distribution. For example, as we will seein Section 5.4.3, the extreme singular values of A would tell us whether the covariancematrix of the distribution can be estimated from a sample of size N .
The picture will vary slightly depending on whether the rows of A are sub-gaussian orhave arbitrary distribution. For heavy-tailed distributions, an extra logarithmic factor hasto appear in our desired inequality (5.2). The analysis of sub-gaussian and heavy-tailedmatrices will be completely different.
There is an abundance of examples where the results of this section may be useful. Theyinclude all matrices with independent entries, whether sub-gaussian such as Gaussianand Bernoulli, or completely general distributions with mean zero and unit variance. Inthe latter case one is able to surpass the fourth moment assumption which is necessaryin Bai–Yin’s law, Theorem 5.31.
Other examples of interest come from non-product distributions, some of which wesaw in Example 5.21. Sampling from discrete objects (matrices and frames) fits well inthis framework, too. Given a deterministic matrix B, one puts a uniform distribution onthe set of the rows of B and creates a random matrix A as before – by sampling someN random rows from B. Applications to sampling will be discussed in Section 5.4.4.
5.4.1 Sub-gaussian rows
The following result goes in the direction of our goal (5.2) for random matrices withindependent sub-gaussian rows.
theorem 5.39 (Sub-gaussian rows) Let A be an N × n matrix whose rows Ai areindependent sub-gaussian isotropic random vectors in Rn. Then for every t ≥ 0, withprobability at least 1− 2exp(−ct2) one has
√N −C
√n− t ≤ smin(A) ≤ smax(A) ≤
√N +C
√n+ t. (5.22)
Here C = CK , c = cK > 0 depend only on the sub-gaussian norm K = maxi ‖Ai‖ψ2 ofthe rows.
This result is a general version of Corollary 5.35 (up to absolute constants); insteadof independent Gaussian entries we allow independent sub-gaussian rows. This ofcourse covers all matrices with independent sub-gaussian entries such as Gaussian andBernoulli. It also applies to some natural matrices whose entries are not independent.One such example is a matrix whose rows are independent spherical random vectors(Example 5.25).
Proof. The proof is a basic version of a covering argument, and it has three steps.We need to control ‖Ax‖2 for all vectors x on the unit sphere Sn−1. To this end, wediscretize the sphere using a net N (the approximation step), establish a tight control of‖Ax‖2 for every fixed vector x ∈N with high probability (the concentration step), and

Non-asymptotic random matrix theory 233
finish off by taking a union bound over all x in the net. The concentration step will bebased on the deviation inequality for sub-exponential random variables, Corollary 5.17.
Step 1: Approximation. Recalling Lemma 5.36 for the matrix B = A/√
N we seethat the conclusion of the theorem is equivalent to
∥∥ 1
NA∗A− I
∥∥≤ max(δ,δ2) =: ε where δ = C
√n
N+
t√N
. (5.23)
Using Lemma 5.4, we can evaluate the operator norm in (5.23) on a 14 -net N of the unit
sphere Sn−1:
∥∥ 1
NA∗A− I
∥∥≤ 2maxx∈N
∣∣⟨( 1
NA∗A− I)x,x
⟩∣∣= 2maxx∈N
∣∣ 1
N‖Ax‖2
2 − 1∣∣.
So to complete the proof it suffices to show that, with the required probability,
maxx∈N
∣∣ 1
N‖Ax‖2
2 − 1∣∣≤ ε
2.
By Lemma 5.2, we can choose the net N so that it has cardinality |N | ≤ 9n.Step 2: Concentration. Let us fix any vector x ∈ Sn−1. We can express ‖Ax‖2
2 as asum of independent random variables
‖Ax‖22 =
N∑i=1
〈Ai,x〉2 =:
N∑i=1
Z2i (5.24)
where Ai denote the rows of the matrix A. By assumption, Zi = 〈Ai,x〉 are inde-pendent sub-gaussian random variables with EZ2
i = 1 and ‖Zi‖ψ2 ≤ K. Therefore, byRemark 5.18 and Lemma 5.14, Z2
i −1 are independent centered sub-exponential randomvariables with ‖Z2
i − 1‖ψ1 ≤ 2‖Z2i ‖ψ1 ≤ 4‖Zi‖2
ψ2≤ 4K2.
We can therefore use an exponential deviation inequality, Corollary 5.17, to controlthe sum (5.24). Since K ≥ ‖Zi‖ψ2 ≥ 1√
2(E|Zi|2)1/2 = 1√
2, this gives
P∣∣ 1
N‖Ax‖2
2 − 1∣∣≥ ε
2
= P
∣∣ 1
N
N∑i=1
Z2i − 1
∣∣≥ ε
2
≤ 2exp
[− c1
K4 min(ε2,ε)N]
= 2exp[− c1
K4 δ2N]≤ 2exp
[− c1
K4 (C2n+ t2)]
where the last inequality follows by the definition of δ and using the inequality (a+b)2 ≥a2 + b2 for a,b ≥ 0.
Step 3: Union bound. Taking the union bound over all vectors x in the net N ofcardinality |N | ≤ 9n, we obtain
P
maxx∈N
∣∣ 1
N‖Ax‖2
2 − 1∣∣≥ ε
2
≤ 9n · 2exp
[− c1
K4 (C2n+ t2)]≤ 2exp
(− c1t
2
K4
)

234 Roman Vershynin
where the second inequality follows for C = CK sufficiently large, e.g. C =
K2√
ln9/c1. As we noted in Step 1, this completes the proof of the theorem.
remark 5.40 (Non-isotropic distributions)
1. Aversion of Theorem 5.39 holds for general, non-isotropic sub-gaussian distributions.Assume that A is an N × n matrix whose rows Ai are independent sub-gaussianrandom vectors in Rn with second moment matrix Σ. Then for every t ≥ 0, thefollowing inequality holds with probability at least 1− 2exp(−ct2):
∥∥ 1
NA∗A−Σ
∥∥≤ max(δ,δ2) where δ = C
√n
N+
t√N
. (5.25)
Here as before C = CK , c = cK > 0 depend only on the sub-gaussian norm K =
maxi ‖Ai‖ψ2 of the rows. This result is a general version of (5.23). It follows by astraightforward modification of the argument of Theorem 5.39.
2. A more natural, multiplicative form of (5.25) is the following. Assume that Σ−1/2Ai
are isotropic sub-gaussian random vectors, and let K be the maximum of their sub-gaussian norms. Then for every t≥ 0, the following inequality holds with probabilityat least 1− 2exp(−ct2):
∥∥ 1
NA∗A−Σ
∥∥≤ max(δ,δ2)‖Σ‖, where δ = C
√n
N+
t√N
. (5.26)
Here again C = CK , c = cK > 0. This result follows from Theorem 5.39 applied tothe isotropic random vectors Σ−1/2Ai.
5.4.2 Heavy-tailed rows
The class of sub-gaussian random variables in Theorem 5.39 may sometimes be toorestrictive in applications. For example, if the rows of A are independent coordinateor frame random vectors (Examples 5.21 and 5.25), they are poorly sub-gaussian andTheorem 5.39 is too weak. In such cases, one would use the following result instead,which operates in remarkable generality.
theorem 5.41 (Heavy-tailed rows) Let A be an N × n matrix whose rows Ai areindependent isotropic random vectors in Rn. Let m be a number such that ‖Ai‖2 ≤
√m
almost surely for all i. Then for every t ≥ 0, one has
√N − t
√m ≤ smin(A) ≤ smax(A) ≤
√N + t
√m (5.27)
with probability at least 1− 2n · exp(−ct2), where c > 0 is an absolute constant.
Recall that (E‖Ai‖22)
1/2 =√
n by Lemma 5.20. This indicates that one would typicallyuse Theorem 5.41 with m = O(n). In this case the result takes the form
√N − t
√n ≤ smin(A) ≤ smax(A) ≤
√N + t
√n (5.28)

Non-asymptotic random matrix theory 235
with probability at least 1 − 2n · exp(−c′t2). This is a form of our desired inequality(5.2) for heavy-tailed matrices. We shall discuss this more after the proof.
Proof. We shall use the non-commutative Bernstein’s inequality, Theorem 5.29.Step 1: Reduction to a sum of independent random matrices. We first note that
m ≥ n ≥ 1 since by Lemma 5.20 we have E‖Ai‖22 = n. Now we start an argument
parallel to Step 1 of Theorem 5.39. Recalling Lemma 5.36 for the matrix B = A/√
N
we see that the desired inequalities (5.27) are equivalent to
∥∥ 1
NA∗A− I
∥∥≤ max(δ,δ2) =: ε where δ = t
√m
N. (5.29)
We express this random matrix as a sum of independent random matrices:
1
NA∗A− I =
1
N
N∑i=1
Ai ⊗Ai − I =
N∑i=1
Xi, where Xi :=1
N(Ai ⊗Ai − I);
note that Xi are independent centered n×n random matrices.Step 2: Estimating the mean, range, and variance. We are going to apply the
non-commutative Bernstein inequality, Theorem 5.29, for the sum∑
i Xi. Since Ai areisotropic random vectors, we have EAi⊗Ai = I which implies that EXi = 0 as requiredin the non-commutative Bernstein inequality.
We estimate the range of Xi using that ‖Ai‖2 ≤√
m and m ≥ 1:
‖Xi‖ ≤ 1
N(‖Ai ⊗Ai‖+1) =
1
N(‖Ai‖2
2 +1) ≤ 1
N(m+1) ≤ 2m
N=: K.
To estimate the total variance ‖∑
i EX2i ‖, we first compute
X2i =
1
N2
[(Ai ⊗Ai)
2 − 2(Ai ⊗Ai)+ I],
so using that the isotropy assumption EAi ⊗Ai = I we obtain
EX2i =
1
N2
[E(Ai ⊗Ai)
2 − I]. (5.30)
Since (Ai ⊗Ai)2 = ‖Ai‖2
2 Ai ⊗Ai is a positive semidefinite matrix and ‖Ai‖22 ≤ m by
assumption, we have∥∥E(Ai ⊗Ai)
2∥∥ ≤ m · ‖EAi ⊗Ai‖ = m. Putting this into (5.30)
we obtain
‖EX2i ‖ ≤ 1
N2 (m+1) ≤ 2m
N2
where we again used that m ≥ 1. This yields17
∥∥∥ N∑i=1
EX2i
∥∥∥≤ N ·maxi
‖EX2i ‖ =
2m
N=: σ2.
17 Here the seemingly crude application of the triangle inequality is actually not so loose. If the rows Ai areidentically distributed, then so are X2
i , which makes the triangle inequality above into an equality.
236 Roman Vershynin
Step 3: Application of the non-commutative Bernstein’s inequality. ApplyingTheorem 5.29 (see Remark 5.30) and recalling the definitions of ε and δ in (5.29),we bound the probability in question as
P∥∥∥ 1
NA∗A− I
∥∥∥≥ ε
= P∥∥∥ N∑
i=1
Xi
∥∥∥≥ ε≤ 2n · exp
[− cmin
( ε2
σ2 ,ε
K
)]≤ 2n · exp
[− cmin(ε2,ε) · N
2m
]= 2n · exp
(− cδ2N
2m
)= 2n · exp(−ct2/2).
This completes the proof.
Theorem 5.41 for heavy-tailed rows is different from Theorem 5.39 for sub-gaussianrows in two ways: the boundedness assumption18 ‖Ai‖2
2 ≤m appears, and the probabilitybound is weaker. We will now comment on both differences.
remark 5.42 (Boundedness assumption) Observe that some boundedness assumptionon the distribution is needed in Theorem 5.41. Let us see this on the following example.Choose δ ≥ 0 arbitrarily small, and consider a random vector X = δ−1/2ξY in Rn whereξ is a 0,1-valued random variable with Eξ = δ (a “selector”) and Y is an independentisotropic random vector in Rn with an arbitrary distribution. Then X is also an isotropicrandom vector. Consider an N × n random matrix A whose rows Ai are independentcopies of X . However, if δ ≥ 0 is suitably small then A = 0 with high probability, henceno nontrivial lower bound on smin(A) is possible.
Inequality (5.28) fits our goal (5.2), but not quite. The reason is that the probabilitybound is only nontrivial if t≥C
√logn. Therefore, in reality Theorem 5.41 asserts that
√N −C
√n logn ≤ smin(A) ≤ smax(A) ≤
√N +C
√n logn (5.31)
with probability, say 0.9. This achieves our goal (5.2) up to a logarithmic factor.
remark 5.43 (Logarithmic factor) The logarithmic factor cannot be removed from(5.31) for some heavy-tailed distributions. Consider for instance the coordinate distri-bution introduced in Example 5.21. In order that smin(A) > 0 there must be no zerocolumns in A. Equivalently, each coordinate vector e1, . . . ,en must be picked at leastonce in N independent trials (each row of A picks an independent coordinate vector).Recalling the classical coupon collector’s problem, one must make at least N ≥Cn logn
trials to make this occur with high probability. Thus the logarithm is necessary in theleft-hand side of (5.31).19
18 Going a little ahead, we would like to point out that the almost sure boundedness can be relaxed to thebound in expectation Emaxi ‖Ai‖2
2 ≤ m, see Theorem 5.45.19 This argument moreover shows the optimality of the probability bound in Theorem 5.41. For example, for
t =√
N/2√
n the conclusion (5.28) implies that A is well conditioned (i.e.√N/2 ≤ smin(A) ≤ smax(A) ≤ 2
√N ) with probability 1−n · exp(−cN/n). On the other hand, by
the coupon collector’s problem we estimate the probability that smin(A) > 0 as1−n · (1− 1
n)N ≈ 1−n · exp(−N/n).

Non-asymptotic random matrix theory 237
A version of Theorem 5.41 holds for general, non-isotropic distributions. It isconvenient to state it in terms of the equivalent estimate (5.29):
theorem 5.44 (Heavy-tailed rows, non-isotropic) Let A be an N ×n matrix whoserows Ai are independent random vectors in Rn with the common second moment matrixΣ = EAi ⊗Ai. Let m be a number such that ‖Ai‖2 ≤
√m almost surely for all i. Then
for every t≥ 0, the following inequality holds with probability at least 1−n ·exp(−ct2):
∥∥ 1
NA∗A−Σ
∥∥≤ max(‖Σ‖1/2δ,δ2) where δ = t
√m
N. (5.32)
Here c > 0 is an absolute constant. In particular, this inequality yields
‖A‖ ≤ ‖Σ‖1/2√
N + t√
m. (5.33)
Proof. We note that m ≥ ‖Σ‖ because ‖Σ‖ = ‖EAi ⊗ Ai‖ ≤ E‖Ai ⊗ Ai‖ =
E‖Ai‖22 ≤ m. Then (5.32) follows by a straightforward modification of the argument of
Theorem 5.41. Furthermore, if (5.32) holds then by the triangle inequality
1
N‖A‖2 =
∥∥ 1
NA∗A
∥∥≤ ‖Σ‖+∥∥ 1
NA∗A−Σ
∥∥≤ ‖Σ‖+ ‖Σ‖1/2δ + δ2 ≤ (‖Σ‖1/2 + δ)2.
Taking square roots and multiplying both sides by√
N , we obtain (5.33).
The almost sure boundedness requirement in Theorem 5.41 may sometimes be toorestrictive in applications, and it can be relaxed to a bound in expectation:
theorem 5.45 (Heavy-tailed rows; expected singular values) Let A be an N × n
matrix whose rows Ai are independent isotropic random vectors in Rn. Let m :=
Emaxi≤N ‖Ai‖22. Then
Emaxj≤n
|sj(A)−√
N | ≤ C√
m logmin(N,n)
where C is an absolute constant.
The proof of this result is similar to that of Theorem 5.41, except that this time wewill use Rudelson’s Corollary 5.28 instead of matrix Bernstein’s inequality. To this end,we need a link to symmetric Bernoulli random variables. This is provided by a generalsymmetrization argument:
lemma 5.46 (Symmetrization) Let (Xi) be a finite sequence of independent randomvectors valued in some Banach space, and (εi) be independent symmetric Bernoullirandom variables. Then
E∥∥∥∑
i
(Xi −EXi)
∥∥∥≤ 2E∥∥∥∑
i
εiXi
∥∥∥. (5.34)

238 Roman Vershynin
Proof. We define random variables Xi = Xi −X ′i where (X ′
i) is an independent copyof the sequence (Xi). Then Xi are independent symmetric random variables, i.e. thesequence (Xi) is distributed identically with (−Xi) and thus also with (εiXi). ReplacingEXi by EX ′
i in (5.34) and using Jensen’s inequality, symmetry, and triangle inequality,we obtain the required inequality
E∥∥∥∑
i
(Xi −EXi)
∥∥∥≤ E∥∥∥∑
i
Xi
∥∥∥= E∥∥∥∑
i
εiXi
∥∥∥≤ E
∥∥∥∑i
εiXi
∥∥∥+E∥∥∥∑
i
εiX′i
∥∥∥= 2E∥∥∥∑
i
εiXi
∥∥∥.
We will also need a probabilistic version of Lemma 5.36 on approximate isometries.The proof of that lemma was based on the elementary inequality |z2 − 1| ≥ max(|z −1|, |z − 1|2) for z ≥ 0. Here is a probabilistic version:
lemma 5.47 Let Z be a non-negative random variable. Then E|Z2−1| ≥max(E|Z−1|,(E|Z − 1|)2).
Proof. Since |Z − 1| ≤ |Z2 − 1| pointwise, we have E|Z − 1| ≤ E|Z2 − 1|. Next,since |Z − 1|2 ≤ |Z2 − 1| pointwise, taking square roots and expectations we obtainE|Z − 1| ≤ E|Z2 − 1|1/2 ≤ (E|Z2 − 1|)1/2, where the last bound follows by Jensen’sinequality. Squaring both sides completes the proof.
Proof of Theorem 5.45. Step 1: Application of Rudelson’s inequality. As in the proofof Theorem 5.41, we are going to control
E := E∥∥ 1
NA∗A− I
∥∥= E∥∥∥ 1
N
N∑i=1
Ai ⊗Ai − I∥∥∥≤ 2
NE∥∥∥ N∑
i=1
εiAi ⊗Ai
∥∥∥where we used Symmetrization Lemma 5.46 with independent symmetric Bernoullirandom variables εi (which are independent of A as well). The expectation in the right-hand side is taken both with respect to the random matrix A and the signs (εi). Taking firstthe expectation with respect to (εi) (conditionally on A) and afterwards the expectationwith respect to A, we obtain by Rudelson’s inequality (Corollary 5.28) that
E ≤ C√
l
NE(
maxi≤N
‖Ai‖2 ·∥∥∥ N∑
i=1
Ai ⊗Ai
∥∥∥1/2)
where l = logmin(N,n). We now apply the Cauchy–Schwarz inequality. Since by thetriangle inequality E
∥∥ 1N
∑Ni=1 Ai ⊗Ai
∥∥= E∥∥ 1
N A∗A∥∥≤ E +1, it follows that
E ≤ C
√ml
N(E +1)1/2.

Non-asymptotic random matrix theory 239
This inequality is easy to solve in E. Indeed, considering the cases E ≤ 1 and E > 1
separately, we conclude that
E = E∥∥ 1
NA∗A− I
∥∥≤ max(δ,δ2), where δ := C
√2ml
N.
Step 2: Diagonalization. Diagonalizing the matrix A∗A one checks that
∥∥ 1
NA∗A− I
∥∥= maxj≤n
∣∣sj(A)2
N− 1
∣∣= max(∣∣smin(A)2
N− 1
∣∣, ∣∣smax(A)2
N− 1
∣∣).
It follows that
max(E∣∣smin(A)2
N− 1
∣∣,E∣∣smax(A)2
N− 1
∣∣)≤ max(δ,δ2)
(we replaced the expectation of maximum by the maximum of expectations). UsingLemma 5.47 separately for the two terms on the left-hand side, we obtain
max(E∣∣smin(A)√
N− 1
∣∣,E∣∣smax(A)√N
− 1∣∣)≤ δ.
Therefore
Emaxj≤n
∣∣sj(A)√N
− 1∣∣= Emax
(∣∣smin(A)√N
− 1∣∣, ∣∣∣smax(A)√
N− 1
∣∣∣)≤ E
(∣∣smin(A)√N
− 1∣∣+ ∣∣smax(A)√
N− 1
∣∣)≤ 2δ.
Multiplying both sides by√
N completes the proof.
In a way similar to Theorem 5.44 we note that a version of Theorem 5.45 holds forgeneral, non-isotropic distributions.
theorem 5.48 (Heavy-tailed rows, non-isotropic, expectation) Let A be an N × n
matrix whose rows Ai are independent random vectors in Rn with the common secondmoment matrix Σ = EAi ⊗Ai. Let m := Emaxi≤N ‖Ai‖2
2. Then
E∥∥ 1
NA∗A−Σ
∥∥≤ max(‖Σ‖1/2δ,δ2) where δ = C
√m logmin(N,n)
N.
Here C is an absolute constant. In particular, this inequality yields
(E‖A‖2)1/2 ≤ ‖Σ‖1/2
√N +C
√m logmin(N,n).
Proof. The first part follows by a simple modification of the proof of Theorem 5.45.The second part follows from the first like in Theorem 5.44.

240 Roman Vershynin
remark 5.49 (Non-identical second moments) The assumption that the rows Ai havea common second moment matrix Σ is not essential in Theorems 5.44 and 5.48. Thereader will be able to formulate more general versions of these results. For example,if Ai have arbitrary second moment matrices Σi = EAi ⊗ Ai then the conclusion ofTheorem 5.48 holds with Σ = 1
N
∑Ni=1 Σi.
5.4.3 Applications to estimating covariance matrices
One immediate application of our analysis of random matrices is in statistics, for thefundamental problem of estimating covariance matrices. Let X be a random vector inRn; for simplicity we assume that X is centered, EX = 0.20 Recall that the covariancematrix of X is the n×n matrix Σ = EX ⊗X , see Section 5.2.5.
The simplest way to estimate Σ is to take some N independent samples Xi from thedistribution and form the sample covariance matrix ΣN = 1
N
∑Ni=1 Xi ⊗ Xi. By the
law of large numbers, ΣN → Σ almost surely as N →∞. So, taking sufficiently manysamples we are guaranteed to estimate the covariance matrix as well as we want. This,however, does not address the quantitative aspect: what is the minimal sample size N
that guarantees approximation with a given accuracy?The relation of this question to random matrix theory becomes clear when we arrange
the samples Xi =:Ai as rows of the N ×n random matrix A. Then the sample covariancematrix is expressed as ΣN = 1
N A∗A. Note that A is a matrix with independent rowsbut usually not independent entries (unless we sample from a product distribution). Weworked out the analysis of such matrices in Section 5.4, separately for sub-gaussian andgeneral distributions. As an immediate consequence of Theorem 5.39, we obtain:
corollary 5.50 (Covariance estimation for sub-gaussian distributions) Considera sub-gaussian distribution in Rn with covariance matrix Σ, and let ε ∈ (0,1), t ≥ 1.Then with probability at least 1− 2exp(−t2n) one has
If N ≥ C(t/ε)2n then ‖ΣN −Σ‖ ≤ ε.
Here C = CK depends only on the sub-gaussian norm K = ‖X‖ψ2 of a random vectortaken from this distribution.
Proof. It follows from (5.25) that for every s ≥ 0, with probability at least 1 −2exp(−cs2) we have ‖ΣN − Σ‖ ≤ max(δ,δ2) where δ = C
√n/N + s/
√N . The
conclusion follows for s = C ′t√
n where C ′ = C ′K is sufficiently large.
Summarizing, Corollary 5.50 shows that the size
N = O(n)
suffices to approximate the covariance matrix of a sub-gaussian distribution in Rn bythe sample covariance matrix.
20 More generally, in this section we estimate the second moment matrix EX ⊗X of an arbitrary randomvector X (not necessarily centered).

Non-asymptotic random matrix theory 241
remark 5.51 (Multiplicative estimates, Gaussian distributions) A weak point ofCorollary 5.50 is that the sub-gaussian norm K may in turn depend on ‖Σ‖.
To overcome this drawback, instead of using (5.25) in the proof of this result onecan use the multiplicative version (5.26). The reader is encouraged to state a generalresult that follows from this argument. We just give one special example for arbitrarycentered Gaussian distributions in Rn. For every ε ∈ (0,1), t ≥ 1, the following holdswith probability at least 1− 2exp(−t2n):
If N ≥ C(t/ε)2n then ‖ΣN −Σ‖ ≤ ε‖Σ‖.
Here C is an absolute constant.
Finally, Theorem 5.44 yields a similar estimation result for arbitrary distributions,possibly heavy-tailed:
corollary 5.52 (Covariance estimation for arbitrary distributions) Consider a dis-tribution in Rn with covariance matrix Σ and supported in some centered Euclideanball whose radius we denote
√m. Let ε∈ (0,1) and t≥ 1. Then the following holds with
probability at least 1−n−t2:
If N ≥ C(t/ε)2‖Σ‖−1m logn then ‖ΣN −Σ‖ ≤ ε‖Σ‖.
Here C is an absolute constant.
Proof. It follows from Theorem 5.44 that for every s ≥ 0, with probability at least1−n ·exp(−cs2) we have ‖ΣN −Σ‖≤max(‖Σ‖1/2δ,δ2) where δ = s
√m/N . There-
fore, if N ≥ (s/ε)2‖Σ‖−1m then ‖ΣN − Σ‖ ≤ ε‖Σ‖. The conclusion follows withs = C ′t
√logn where C ′ is a sufficiently large absolute constant.
Corollary 5.52 is typically used with m = O(‖Σ‖n). Indeed, if X is a randomvector chosen from the distribution in question, then its expected norm is easy to esti-mate: E‖X‖2
2 = tr(Σ) ≤ n‖Σ‖. So, by Markov’s inequality, most of the distributionis supported in a centered ball of radius
√m where m = O(n‖Σ‖). If all distribu-
tion is supported there, i.e. if ‖X‖ = O(√
n‖Σ‖) almost surely, then the conclusion ofCorollary 5.52 holds with sample size N ≥ C(t/ε)2n logn.
remark 5.53 (Low-rank estimation) In certain applications, the distribution in Rn
lies close to a low-dimensional subspace. In this case, a smaller sample suffices forcovariance estimation. The intrinsic dimension of the distribution can be measured withthe effective rank of the matrix Σ, defined as
r(Σ) =tr(Σ)
‖Σ‖ .
One always has r(Σ) ≤ rank (Σ) ≤ n, and this band is sharp.For example, if X is an isotropic random vector in Rn then Σ = I and r(Σ) = n. A
more interesting example is where X takes values in some r-dimensional subspace E,

242 Roman Vershynin
and the restriction of the distribution of X onto E is isotropic. The latter means thatΣ = PE , where PE denotes the orthogonal projection in Rn onto E. Therefore in thiscase r(Σ) = r. The effective rank is a stable quantity compared with the usual rank. Fordistributions that are approximately low-dimensional, the effective rank is still small.
The effective rank r = r(Σ) always controls the typical norm of X , as E‖X‖22 =
tr(Σ) = r‖Σ‖. It follows by Markov’s inequality that most of the distribution is sup-ported in a ball of radius
√m where m = O(r‖Σ‖). Assume that all of the distribution
is supported there, i.e. if ‖X‖ = O(√
r‖Σ‖) almost surely. Then the conclusion ofCorollary 5.52 holds with sample size N ≥ C(t/ε)2r logn.
We can summarize this discussion in the following way: the sample size
N = O(n logn)
suffices to approximate the covariance matrix of a general distribution in Rn by thesample covariance matrix. Furthermore, for distributions that are approximately low-dimensional, a smaller sample size is sufficient. Namely, if the effective rank of Σ
equals r then a sufficient sample size is
N = O(r logn).
remark 5.54 (Boundedness assumption) Without the boundedness assumption on thedistribution, Corollary 5.52 may fail. The reasoning is the same as in Remark 5.42: for anisotropic distribution which is highly concentrated at the origin, the sample covariancematrix will likely equal 0.
Still, one can weaken the boundedness assumption using Theorem 5.48 insteadof Theorem 5.44 in the proof of Corollary 5.52. The weaker requirement is thatEmaxi≤N ‖Xi‖2
2 ≤ m where Xi denote the sample points. In this case, the covari-ance estimation will be guaranteed in expectation rather than with high probability; weleave the details for the interested reader.
A different way to enforce the boundedness assumption is to reject any sample pointsXi that fall outside the centered ball of radius
√m. This is equivalent to sampling
from the conditional distribution inside the ball. The conditional distribution satisfiesthe boundedness requirement, so the results discussed above provide a good covarianceestimation for it. In many cases, this estimate works even for the original distribution –namely, if only a small part of the distribution lies outside the ball of radius
√m. We
leave the details for the interested reader; see e.g. [81].
5.4.4 Applications to random sub-matrices and sub-frames
The absence of any moment hypotheses on the distribution in Section 5.4.2 (exceptfinite variance) makes these results especially relevant for discrete distributions. Onesuch situation arises when one wishes to sample entries or rows from a given matrix B,thereby creating a random sub-matrix A. It is a big program to understand what we canlearn about B by seeing A, see [34, 25, 66]. In other words, we ask – what properties

Non-asymptotic random matrix theory 243
of B pass onto A? Here we shall only scratch the surface of this problem: we noticethat random sub-matrices of certain size preserve the property of being an approximateisometry.
corollary 5.55 (Random sub-matrices) Consider an M × n matrix B such thatsmin(B) = smax(B) =
√M .21 Let m be such that all rows Bi of B satisfy ‖Bi‖2 ≤
√m.
Let A be an N ×n matrix obtained by sampling N random rows from B uniformly andindependently. Then for every t≥ 0, with probability at least 1−2n ·exp(−ct2) one has
√N − t
√m ≤ smin(A) ≤ smax(A) ≤
√N + t
√m.
Here c > 0 is an absolute constant.
Proof. By assumption, I = 1M B∗B = 1
M
∑Mi=1 Bi ⊗Bi. Therefore, the uniform dis-
tribution on the set of the rows B1, . . . ,BM is an isotropic distribution in Rn. Theconclusion then follows from Theorem 5.41.
Note that the conclusion of Corollary 5.55 does not depend on the dimension M ofthe ambient matrix B. This happens because this result is a specific version of samplingfrom a discrete isotropic distribution (uniform on the rows of B), where size M of thesupport of the distribution is irrelevant.
The hypothesis of Corollary 5.55 implies that 1M
∑Mi=1 ‖Bi‖2
2 = n.22 Hence byMarkov’s inequality, most of the rows Bi satisfy ‖Bi‖2 = O(
√n). This indicates that
Corollary 5.55 would be often used with m=O(n).Also, to ensure a positive probabilityof success, the useful magnitude of t would be t∼
√logn. With this in mind, the extremal
singular values of A will be close to each other (and to√
N ) if N t2m ∼ n logn.Summarizing, Corollary 5.55 states that a random O(n logn)× n sub-matrix of an
M ×n isometry is an approximate isometry.23
Another application of random matrices with heavy-tailed isotropic rows is forsampling from frames. Recall that frames are generalizations of bases without linearindependence, see Example 5.21. Consider a tight frame uiM
i=1 in Rn, and for thesake of convenient normalization, assume that it has bounds A = B = M . We are inter-ested in whether a small random subset of uiM
i=1 is still a nice frame in Rn. Such aquestion arises naturally because frames are used in signal processing to create redun-dant representations of signals. Indeed, every signal x ∈ Rn admits frame expansionx = 1
M
∑Mi=1〈ui,x〉ui. Redundancy makes frame representations more robust to errors
and losses than basis representations. Indeed, we will show that if one loses all exceptN = O(n logn) random coefficients 〈ui,x〉 one is still able to reconstruct x from thereceived coefficients 〈uik
,x〉 as x ≈ 1N
∑Nk=1〈uik
,x〉uik. This boils down to showing
21 The first hypothesis says B∗B = MI . Equivalently, B := 1√M
B is an isometry, i.e. ‖Bx‖2 = ‖x‖2 for
all x. Equivalently, the columns of B are orthonormal.22 To recall why this is true, take trace of both sides in the identity I = 1
M
∑Mi=1 Bi ⊗Bi.
23 For the purposes of compressed sensing, we shall study the more difficult uniform problem for randomsub-matrices in Section 5.6. There B itself will be chosen as a column sub-matrix of a given M ×Mmatrix (such as DFT), and one will need to control all such B simultaneously, see Example 5.73.

244 Roman Vershynin
that a random subset of size N = O(n logn) of a tight frame in Rn is an approximatetight frame.
corollary 5.56 (Random sub-frames, see [80]) Consider a tight frame uiMi=1
in Rn with frame bounds A = B = M . Let number m be such that all frame elementssatisfy ‖ui‖2 ≤
√m. Let viN
i=1 be a set of vectors obtained by sampling N randomelements from the frame uiM
i=1 uniformly and independently. Let ε ∈ (0,1) and t ≥ 1.Then the following holds with probability at least 1− 2n−t2:
If N ≥ C(t/ε)2m logn then viNi=1 is a frame in Rn
with bounds A = (1− ε)N , B = (1+ ε)N . Here C is an absolute constant.In particular, if this event holds, then every x ∈ Rn admits an approximate
representation using only the sampled frame elements:
∥∥∥ 1
N
N∑i=1
〈vi,x〉vi −x∥∥∥≤ ε‖x‖.
Proof. The assumption implies that I = 1M
∑Mi=1 ui ⊗ui. Therefore, the uniform dis-
tribution on the set uiMi=1 is an isotropic distribution in Rn. Applying Corollary 5.52
with Σ = I and ΣN = 1N
∑Ni=1 vi ⊗vi we conclude that ‖ΣN −I‖≤ ε with the required
probability. This clearly completes the proof.
As before, we note that 1M
∑Mi=1 ‖ui‖2
2 = n, so Corollary 5.56 would be often usedwith m = O(n). This shows, liberally speaking, that a random subset of a frame in Rn
of size N = O(n logn) is again a frame.
remark 5.57 (Non-uniform sampling) The boundedness assumption ‖ui‖2 ≤√
m,although needed in Corollary 5.56, can be removed by non-uniform sampling. To this end,one would sample from the set of normalized vectors ui :=
√n ui
‖ui‖2with probabilities
proportional to ‖ui‖22. This defines an isotropic distribution in Rn, and clearly ‖ui‖2 =√
n. Therefore, by Theorem 5.56, a random sample of N = O(n logn) vectors obtainedthis way forms an almost tight frame in Rn. This result does not require any boundon ‖ui‖2.
5.5 Random matrices with independent columns
In this section we study the extreme singular values of N ×n random matrices A withindependent columns Aj . We are guided by our ideal bounds (5.2) as before. The samephenomenon occurs in the column independent model as in the row independent model –sufficiently tall random matrices A are approximate isometries. As before, being tall willmean N n for sub-gaussian distributions and N n logn for arbitrary distributions.
The problem is equivalent to studying Gram matrices G = A∗A = (〈Aj ,Ak〉)nj,k=1 of
independent isotropic random vectors A1, . . . ,An in RN . Our results can be interpreted

Non-asymptotic random matrix theory 245
using Lemma 5.36 as showing that the normalized Gram matrix 1N G is an approximate
identity for N,n as above.Let us first try to prove this with a heuristic argument. By Lemma 5.20 we know that the
diagonal entries of 1N G have mean 1
N E‖Aj‖22 = 1 and off-diagonal ones have zero mean
and standard deviation 1N (E〈Aj ,Ak〉2)1/2 = 1√
N. If, hypothetically, the off-diagonal
entries were independent, then we could use the results of matrices with independententries (or even rows) developed in Section 5.4. The off-diagonal part of 1
N G wouldhave norm O(
√nN ) while the diagonal part would approximately equal I . Hence we
would have ∥∥ 1
NG− I
∥∥= O(√ n
N
), (5.35)
i.e. 1N G is an approximate identity for N n. Equivalently, by Lemma 5.36, (5.35)
would yield the ideal bounds (5.2) on the extreme singular values of A.Unfortunately, the entries of the Gram matrix G are obviously not independent. To
overcome this obstacle we shall use the decoupling technique of probability theory [22].We observe that there is still enough independence encoded in G. Consider a principalsub-matrix (AS)∗(AT ) of G = A∗A with disjoint index sets S and T . If we condition on(Ak)k∈T then this sub-matrix has independent rows. Using an elementary decouplingtechnique, we will indeed seek to replace the full Gram matrix G by one such decoupledS ×T matrix with independent rows, and finish off by applying results of Section 5.4.
By transposition one can try to reduce our problem to studying the n×N matrix A∗.It has independent rows and the same singular values as A, so one can apply results ofSection 5.4. The conclusion would be that, with high probability,
√n−C
√N ≤ smin(A) ≤ smax(A) ≤
√n+C
√N.
Such an estimate is only good for flat matrices (N ≤ n). For tall matrices (N ≥ n) thelower bound would be trivial because of the (possibly large) constant C. So, from nowon we can focus on tall matrices (N ≥ n) with independent columns.
5.5.1 Sub-gaussian columns
Here we prove a version of Theorem 5.39 for matrices with independent columns.
theorem 5.58 (Sub-gaussian columns) Let A be an N × n matrix (N ≥ n) whosecolumns Ai are independent sub-gaussian isotropic random vectors in RN with ‖Aj‖2 =√
N a. s. Then for every t ≥ 0, the inequality holds
√N −C
√n− t ≤ smin(A) ≤ smax(A) ≤
√N +C
√n+ t (5.36)
with probability at least 1− 2exp(−ct2), where C = C ′K , c = c′
K > 0 depend only onthe sub-gaussian norm K = maxj ‖Aj‖ψ2 of the columns.
The only significant difference between Theorem 5.39 for independent rows and The-orem 5.58 for independent columns is that the latter requires normalization of columns,

246 Roman Vershynin
‖Aj‖2 =√
N almost surely. Recall that by isotropy of Aj (see Lemma 5.20) one alwayshas (E‖Aj‖2
2)1/2 =
√N , but the normalization is a bit stronger requirement. We will
discuss this more after the proof of Theorem 5.58.
remark 5.59 (Gram matrices are an approximate identity) By Lemma 5.36, theconclusion of Theorem 5.58 is equivalent to
∥∥ 1
NA∗A− I‖ ≤ C
√n
N+
t√N
with the same probability 1− 2exp(−ct2). This establishes our ideal inequality (5.35).In words, the normalized Gram matrix of n independent sub-gaussian isotropic randomvectors in RN is an approximate identity whenever N n.
The proof of Theorem 5.58 is based on the decoupling technique [22]. What we willneed here is an elementary decoupling lemma for double arrays. Its statement involvesthe notion of a random subset of a given finite set. To be specific, we define a randomset T of [n] with a given average size m ∈ [0,n] as follows. Consider independent0,1 valued random variables δ1, . . . , δn with Eδi = m/n; these are sometimes calledindependent selectors. Then we define the random subset T = i ∈ [n] : δi = 1. Itsaverage size equals E|T | = E
∑ni=1 δi = m.
lemma 5.60 (Decoupling) Consider a double array of real numbers (aij)ni,j=1 such
that aii = 0 for all i. Then ∑i,j∈[n]
aij = 4E∑
i∈T,j∈T c
aij
where T is a random subset of [n] with average size n/2. In particular,
4 minT⊆[n]
∑i∈T,j∈T c
aij ≤∑
i,j∈[n]
aij ≤ 4 maxT⊆[n]
∑i∈T,j∈T c
aij
where the minimum and maximum are over all subsets T of [n].
Proof. Expressing the random subset as T = i∈ [n] : δi =1where δi are independentselectors with Eδi = 1/2, we see that
E∑
i∈T,j∈T c
aij = E∑
i,j∈[n]
δi(1− δj)aij =1
4
∑i,j∈[n]
aij ,
where we used that Eδi(1− δj) = 1/4 for i = j and the assumption aii = 0. This provesthe first part of the lemma. The second part follows trivially by estimating expectationby maximum and minimum.
Proof of Theorem 5.58. Step 1: Reductions. Without loss of generality we can assumethat the columns Ai have zero mean. Indeed, multiplying each column Ai by ±1 arbitrar-ily preserves the extreme singular values of A, the isotropy of Ai, and the sub-gaussian

Non-asymptotic random matrix theory 247
norms of Ai. Therefore, by multiplying Ai by independent symmetric Bernoulli randomvariables we achieve that Ai have zero mean.
For t = O(√
N) the conclusion of Theorem 5.58 follows from Theorem 5.39 bytransposition. Indeed, the n×N random matrix A∗ has independent rows, so for t ≥ 0
we have
smax(A) = smax(A∗) ≤
√n+CK
√N + t (5.37)
with probability at least 1− 2exp(−cKt2). Here cK > 0 and we can obviously assumethat CK ≥ 1. For t ≥ CK
√N it follows that smax(A) ≤
√N +
√n + 2t, which yields
the conclusion of Theorem 5.58 (the left-hand side of (5.36) being trivial). So, it sufficesto prove the conclusion for t ≤ CK
√N . Let us fix such t.
It would be useful to have some a priori control of smax(A) = ‖A‖. We thus considerthe desired event
E :=smax(A) ≤ 3CK
√N.
Since 3CK
√N ≥
√n+CK
√N + t, by (5.37) we see that E is likely to occur:
P(Ec) ≤ 2exp(−cKt2). (5.38)
Step 2: Approximation. This step is parallel to Step 1 in the proof of Theorem 5.39,except now we shall choose ε := δ. This way we reduce our task to the following. LetN be a 1
4 -net of the unit sphere Sn−1 such that |N | ≤ 9n. It suffices to show that withprobability at least 1− 2exp(−c′
Kt2) one has
maxx∈N
∣∣∣ 1
N‖Ax‖2
2 − 1
∣∣∣≤ δ
2, where δ = C
√n
N+
t√N
.
By (5.38), it is enough to show that the probability
p := P
maxx∈N
∣∣∣ 1
N‖Ax‖2
2 − 1
∣∣∣> δ
2and E
(5.39)
satisfies p ≤ 2exp(−c′′Kt2), where c′′
K > 0 may depend only on K.Step 3: Decoupling. As in the proof of Theorem 5.39, we will obtain the required
bound for a fixed x ∈N with high probability, and then take a union bound over x. Solet us fix any x = (x1, . . . ,xn) ∈ Sn−1. We expand
‖Ax‖22 =
∥∥∥ n∑j=1
xjAj
∥∥∥2
2=
n∑j=1
x2j‖Aj‖2
2 +∑
j,k∈[n], j =k
xjxk〈Aj ,Ak〉. (5.40)
Since ‖Aj‖22 = N by assumption and ‖x‖2 = 1, the first sum equals N . Therefore,
subtracting N from both sides and dividing by N , we obtain the bound∣∣∣ 1
N‖Ax‖2
2 − 1
∣∣∣≤ ∣∣∣ 1
N
∑j,k∈[n], j =k
xjxk〈Aj ,Ak〉∣∣∣.

248 Roman Vershynin
The sum in the right-hand side is 〈G0x,x〉 where G0 is the off-diagonal part of the Grammatrix G =A∗A.As we indicated at the beginning of Section 5.5, we are going to replaceG0 by its decoupled version whose rows and columns are indexed by disjoint sets. Thisis achieved by Decoupling Lemma 5.60: we obtain∣∣∣ 1
N‖Ax‖2
2 − 1
∣∣∣≤ 4
NmaxT⊆[n]
|RT (x)|, where RT (x) =∑
j∈T,k∈T c
xjxk〈Aj ,Ak〉.
We substitute this into (5.39) and take the union bound over all choices of x ∈ N andT ⊆ [n]. As we know, |N | ≤ 9n, and there are 2n subsets T in [n]. This gives
p ≤ P
maxx∈N ,T⊆[n]
|RT (x)| > δN
8and E
≤ 9n · 2n · max
x∈N ,T⊆[n]P|RT (x)| > δN
8and E
. (5.41)
Step 4: Conditioning and concentration. To estimate the probability in (5.41), wefix a vector x ∈ N and a subset T ⊆ [n] and we condition on a realization of randomvectors (Ak)k∈T c . We express
RT (x) =∑j∈T
xj〈Aj ,z〉 where z =∑
k∈T c
xkAk. (5.42)
Under our conditioning z is a fixed vector, so RT (x) is a sum of independent randomvariables. Moreover, if event E holds then z is nicely bounded:
‖z‖2 ≤ ‖A‖‖x‖2 ≤ 3CK
√N. (5.43)
If in turn (5.43) holds then the terms 〈Aj ,z〉 in (5.42) are independent centered sub-gaussian random variables with ‖〈Aj ,z〉‖ψ2 ≤ 3KCK
√N . By Lemma 5.9, their linear
combination RT (x) is also a sub-gaussian random variable with
‖RT (x)‖ψ2 ≤ C1
(∑j∈T
x2j‖〈Aj ,z〉‖2
ψ2
)1/2≤ CK
√N (5.44)
where CK depends only on K.We can summarize these observations as follows. Denoting the conditional probability
by PT =P · |(Ak)k∈T c and the expectation with respect to (Ak)k∈T c by ET c , we obtainby (5.43) and (5.44) that
P|RT (x)| > δN
8and E
≤ ET cPT
|RT (x)| > δN
8and ‖z‖2 ≤ 3CK
√N
≤ 2exp[− c1
( δN/8
CK
√N
)2]= 2exp
(− c2δ
2N
C2K
)≤ 2exp
(− c2C
2n
C2K
− c2t2
C2K
).

Non-asymptotic random matrix theory 249
The second inequality follows because RT (x) is a sub-gaussian random variable (5.44)whose tail decay is given by (5.10). Here c1, c2 > 0 are absolute constants. The lastinequality follows from the definition of δ. Substituting this into (5.41) and choosing C
sufficiently large (so that ln36 ≤ c2C2/C2
K), we conclude that
p ≤ 2exp(− c2t
2/C2K
).
This proves an estimate that we desired in Step 2. The proof is complete.
remark 5.61 (Normalization assumption) Some a priori control of the norms of thecolumns ‖Aj‖2 is necessary for estimating the extreme singular values, since
smin(A) ≤ mini≤n
‖Aj‖2 ≤ maxi≤n
‖Aj‖2 ≤ smax(A).
With this in mind, it is easy to construct an example showing that a normalizationassumption ‖Ai‖2 =
√N is essential in Theorem 5.58; it cannot even be replaced by a
boundedness assumption ‖Ai‖2 = O(√
N).Indeed, consider a random vector X =
√2ξY in RN where ξ is a 0,1-valued random
variable with Eξ = 1/2 (a “selector”) and X is an independent spherical random vectorin Rn (see Example 5.25). Let A be a random matrix whose columns Aj are independentcopies of X . Then Aj are independent centered sub-gaussian isotropic random vectorsin Rn with ‖Aj‖ψ2 = O(1) and ‖Aj‖2 ≤
√2N a.s. So all assumptions of Theorem 5.58
except normalization are satisfied. On the other hand PX = 0 = 1/2, so matrix A hasa zero column with overwhelming probability 1− 2−n. This implies that smin(A) = 0
with this probability, so the lower estimate in (5.36) is false for all nontrivial N,n,t.
5.5.2 Heavy-tailed columns
Here we prove a version of Theorem 5.45 for independent heavy-tailed columns.We thus consider N ×n random matrices A with independent columns Aj . In addition
to the normalization assumption ‖Aj‖2 =√
N already present in Theorem 5.58 for sub-gaussian columns, our new result must also require an a priori control of the off-diagonalpart of the Gram matrix G = A∗A = (〈Aj ,Ak〉)n
j,k=1.
theorem 5.62 (Heavy-tailed columns) Let A be an N × n matrix (N ≥ n) whosecolumns Aj are independent isotropic random vectors in RN with ‖Aj‖2 =
√N a. s.
Consider the incoherence parameter
m :=1
NEmax
j≤n
∑k∈[n],k =j
〈Aj ,Ak〉2.
Then E∥∥ 1
N A∗A− I∥∥≤ C0
√m logn
N . In particular,
Emaxj≤n
|sj(A)−√
N | ≤ C√
m logn. (5.45)

250 Roman Vershynin
Let us briefly clarify the role of the incoherence parameter m, which controls thelengths of the rows of the off-diagonal part of G. After the proof we will see that acontrol of m is essential in Theorem 5.41. But for now, let us get a feel of the typicalsize of m. We have E〈Aj ,Ak〉2 = N by Lemma 5.20, so for every row j we see that1N
∑k∈[n],k =j〈Aj ,Ak〉2 = n−1. This indicates that Theorem 5.62 would be often used
with m = O(n).In this case, Theorem 5.41 establishes our ideal inequality (5.35) up to a logarithmic
factor. In words, the normalized Gram matrix of n independent isotropic random vectorsin RN is an approximate identity whenever N n logn.
Our proof of Theorem 5.62 will be based on decoupling, symmetrization and anapplication of Theorem 5.48 for a decoupled Gram matrix with independent rows. Thedecoupling is done similarly to Theorem 5.58. However, this time we will benefit fromformalizing the decoupling inequality for Gram matrices:
lemma 5.63 (Matrix decoupling) Let B be a N ×n random matrix whose columnsBj satisfy ‖Bj‖2 = 1. Then
E‖B∗B − I‖ ≤ 4 maxT⊆[n]
E‖(BT )∗BT c‖.
Proof. We first note that ‖B∗B − I‖ = supx∈Sn−1
∣∣‖Bx‖22 − 1
∣∣. We fix x =
(x1, . . . ,xn) ∈ Sn−1 and, expanding as in (5.40), observe that
‖Bx‖22 =
n∑j=1
x2j‖Bj‖2
2 +∑
j,k∈[n], j =k
xjxk〈Bj ,Bk〉.
The first sum equals 1 since ‖Bj‖2 = ‖x‖2 = 1. So by Decoupling Lemma 5.60, arandom subset T of [n] with average cardinality n/2 satisfies
‖Bx‖22 − 1 = 4ET
∑j∈T,k∈T c
xjxk〈Bj ,Bk〉.
Let us denote by ET and EB the expectations with respect to the random set T and therandom matrix B respectively. Using Jensen’s inequality we obtain
EB‖B∗B − I‖ = EB supx∈Sn−1
∣∣‖Bx‖22 − 1
∣∣≤ 4EBET sup
x∈Sn−1
∣∣∣ ∑j∈T,k∈T c
xjxk〈Bj ,Bk〉∣∣∣= 4ET EB‖(BT )∗BT c‖.
The conclusion follows by replacing the expectation by the maximum over T .
Proof of Theorem 5.62. Step 1: Reductions and decoupling. It would be useful tohave an a priori bound on smax(A) = ‖A‖. We can obtain this by transposing A andapplying one of the results of Section 5.4. Indeed, the random n × N matrix A∗ hasindependent rows A∗
i which by our assumption are normalized as ‖A∗i ‖2 = ‖Ai‖2 =
√N .

Non-asymptotic random matrix theory 251
Applying Theorem 5.45 with the roles of n and N switched, we obtain by the triangleinequality that
E‖A‖ = E‖A∗‖ = Esmax(A∗) ≤
√n+C
√N logn ≤ C
√N logn. (5.46)
Observe that n ≤ m since by Lemma 5.20 we have 1N E〈Aj ,Ak〉2 = 1 for j = k.
We use Matrix Decoupling Lemma 5.63 for B = 1√N
A and obtain
E ≤ 4
NmaxT⊆[n]
E‖(AT )∗AT c‖ =4
NmaxT⊆[n]
E‖Γ‖ (5.47)
where Γ = Γ(T ) denotes the decoupled Gram matrix
Γ = (AT )∗AT c =(〈Aj ,Ak〉
)j∈T,k∈T c .
Let us fix T ; our problem then reduces to bounding the expected norm of Γ.Step 2: The rows of the decoupled Gram matrix. For a subset S ⊆ [n], we denote by
EASthe conditional expectation given ASc , i.e. with respect to AS = (Aj)j∈S . Hence
E = EAT c EAT.
Let us condition on AT c . Treating (Ak)k∈T c as fixed vectors we see that, conditionally,the random matrix Γ has independent rows
Γj =(〈Aj ,Ak〉
)k∈T c , j ∈ T.
So we are going to use Theorem 5.48 to bound the norm of Γ. To do this we needestimates on (a) the norms and (b) the second moment matrices of the rows Γj .
(a) Since for j ∈ T , Γj is a random vector valued in RT c
, we estimate its secondmoment matrix by choosing x ∈ RT c
and evaluating the scalar second moment
EAT〈Γj ,x〉2 = EAT
( ∑k∈T c
〈Aj ,Ak〉xk
)2= EAT
⟨Aj ,
∑k∈T c
xkAk
⟩2
=
∥∥∥ ∑k∈T c
xkAk
∥∥∥2= ‖AT cx‖2
2 ≤ ‖AT c‖22‖x‖2
2.
In the third equality we used isotropy of Aj . Taking the maximum over all j ∈ T andx ∈ RT c
, we see that the second moment matrix Σ(Γj) = EATΓj ⊗Γj satisfies
maxj∈T
‖Σ(Γj)‖ ≤ ‖AT c‖2. (5.48)
(b) To evaluate the norms of Γj , j ∈ T , note that ‖Γj‖22 =
∑k∈T c〈Aj ,Ak〉2. This is
easy to bound, because the assumption says that the random variable
M :=1
Nmaxj∈[n]
∑k∈[n],k =j
〈Aj ,Ak〉2 satisfies EM = m.

252 Roman Vershynin
This produces the bound Emaxj∈T ‖Γj‖22 ≤ N · EM = Nm. But at this moment we
need to work conditionally on AT c , so for now we will be satisfied with
EATmaxj∈T
‖Γj‖22 ≤ N ·EAT
M. (5.49)
Step 3: The norm of the decoupled Gram matrix. We bound the norm of the ran-dom T ×T c Gram matrix Γ with (conditionally) independent rows using Theorem 5.48and Remark 5.49. Since by (5.48) we have
∥∥ 1|T |∑
j∈T Σ(Γj)∥∥≤ 1
|T |∑
j∈T ‖Σ(Γj)‖ ≤‖AT c‖2, we obtain using (5.49) that
EAT‖Γ‖ ≤ (EAT
‖Γ‖2)1/2 ≤ ‖AT c‖√
|T |+C√
N ·EAT(M) log |T c|
≤ ‖AT c‖√
n+C√
N ·EAT(M) logn. (5.50)
Let us take expectation of both sides with respect to AT c . The left side becomes thequantity we seek to bound, E‖Γ‖. The right side will contain the term which we canestimate by (5.46):
EAT c ‖AT c‖ = E‖AT c‖ ≤ E‖A‖ ≤ C√
N logn.
The other term that will appear in the expectation of (5.50) is
EAT c
√EAT
(M) ≤√
EAT c EAT(M) ≤
√EM =
√m.
So, taking the expectation in (5.50) and using these bounds, we obtain
E‖Γ‖ = EAT c EAT‖Γ‖ ≤ C
√N logn
√n+C
√Nm logn ≤ 2C
√Nm logn
where we used that n ≤ m. Finally, using this estimate in (5.47) we conclude
E ≤ 8C
√m logn
N.
This establishes the first part of Theorem 5.62. The second part follows by thediagonalization argument as in Step 2 of the proof of Theorem 5.45.
remark 5.64 (Incoherence) A priori control on the incoherence is essential in The-orem 5.62. Consider for instance an N × n random matrix A whose columns areindependent coordinate random vectors in RN . Clearly smax(A)≥maxj ‖Ai‖2 =
√N .
On the other hand, if the matrix is not too tall, n√
N , then A has two identical columnswith high probability, which yields smin(A) = 0.
5.6 Restricted isometries
In this section we consider an application of the non-asymptotic random matrix theoryin compressed sensing. For a thorough introduction to compressed sensing, see theintroductory chapter of this book and [28, 20].

Non-asymptotic random matrix theory 253
In this area, m×n matrices A are considered as measurement devices, taking as inputa signal x ∈ Rn and returning its measurement y = Ax ∈ Rm. One would like to takemeasurements economically, thus keeping m as small as possible, and still to be able torecover the signal x from its measurement y.
The interesting regime for compressed sensing is where we take very few measure-ments, m n. Such matrices A are not one-to-one, so recovery of x from y is notpossible for all signals x. But in practical applications, the amount of “information” con-tained in the signal is often small. Mathematically this is expressed as sparsity of x. In thesimplest case, one assumes that x has few nonzero coordinates, say |supp(x)| ≤ k n.In this case, using any non-degenerate matrix A one can check that x can be recoveredwhenever m > 2k using the optimization problem min|supp(x)| : Ax = y.
This optimization problem is highly non-convex and generally NP-complete. Soinstead one considers a convex relaxation of this problem, min‖x‖1 : Ax = y. Abasic result in compressed sensing, due to Candès and Tao [17, 16], is that for sparsesignals |supp(x)| ≤ k, the convex problem recovers the signal x from its measurement yexactly, provided that the measurement matrix A is quantitatively non-degenerate. Pre-cisely, the non-degeneracy of A means that it satisfies the following restricted isometryproperty with δ2k(A) ≤ 0.1.
Definition (Restricted isometries) An m× n matrix A satisfies the restricted isometryproperty of order k ≥ 1 if there exists δk ≥ 0 such that the inequality
(1− δk)‖x‖22 ≤ ‖Ax‖2
2 ≤ (1+ δk)‖x‖22 (5.51)
holds for all x ∈ Rn with |supp(x)| ≤ k. The smallest number δk = δk(A) is called therestricted isometry constant of A.
In words, A has a restricted isometry property if A acts as an approximate isometryon all sparse vectors. Clearly,
δk(A) = max|T |≤k
‖A∗T AT − IRT ‖ = max
|T |=k‖A∗
T AT − IRT ‖ (5.52)
where the maximum is over all subsets T ⊆ [n] with |T | ≤ k or |T | = k.The concept of restricted isometry can also be expressed via extreme singular values,
which brings us to the topic we studied in the previous sections. A is a restricted isometryif and only if all m×k sub-matrices AT of A (obtained by selecting arbitrary k columnsfrom A) are approximate isometries. Indeed, for every δ ≥ 0, Lemma 5.36 shows thatthe following two inequalities are equivalent up to an absolute constant:
δk(A) ≤ max(δ,δ2); (5.53)
1− δ ≤ smin(AT ) ≤ smax(AT ) ≤ 1+ δ for all |T | ≤ k. (5.54)
More precisely, (5.53) implies (5.54) and (5.54) implies δk(A) ≤ 3max(δ,δ2).
Our goal is thus to find matrices that are good restricted isometries. What good meansis clear from the goals of compressed sensing described above. First, we need to keep
254 Roman Vershynin
the restricted isometry constant δk(A) below some small absolute constant, say 0.1.Most importantly, we would like the number of measurements m to be small, ideallyproportional to the sparsity k n.
This is where non-asymptotic random matrix theory enters. We shall indeed showthat, with high probability, m×n random matrices A are good restricted isometries oforder k with m = O∗(k). Here the O∗ notation hides some logarithmic factors of n.Specifically, in Theorem 5.65 we will show that
m = O(k log(n/k))
for sub-gaussian random matrices A (with independent rows or columns). This is due tothe strong concentration properties of such matrices. A general observation of this kindis Proposition 5.66. It says that if for a given x, a random matrix A (taken from anydistribution) satisfies inequality (5.51) with high probability, then A is a good restrictedisometry.
In Theorem 5.71 we will extend these results to random matrices without concentrationproperties. Using a uniform extension of Rudelson’s inequality, Corollary 5.28, we shallshow that
m = O(k log4 n) (5.55)
for heavy-tailed random matrices A (with independent rows). This includes the importantexample of random Fourier matrices.
5.6.1 Sub-gaussian restricted isometries
In this section we show that m×n sub-gaussian random matrices A are good restrictedisometries. We have in mind either of the following two models, which we analyzed inSections 5.4.1 and 5.5.1 respectively:
Row-independent model: the rows of A are independent sub-gaussian isotropicrandom vectors in Rn;
Column-independent model: the columns Ai of A are independent sub-gaussianisotropic random vectors in Rm with ‖Ai‖2 =
√m a.s.
Recall that these models cover many natural examples, including Gaussian andBernoulli matrices (whose entries are independent standard normal or symmetricBernoulli random variables), general sub-gaussian random matrices (whose entries areindependent sub-gaussian random variables with mean zero and unit variance), “columnspherical” matrices whose columns are independent vectors uniformly distributed on thecentered Euclidean sphere in Rm with radius
√m, “row spherical” matrices whose rows
are independent vectors uniformly distributed on the centered Euclidean sphere in Rd
with radius√
d, etc.
theorem 5.65 (Sub-gaussian restricted isometries) Let A be an m×n sub-gaussianrandom matrix with independent rows or columns, which follows either of the two models

Non-asymptotic random matrix theory 255
above. Then the normalized matrix A = 1√m
A satisfies the following for every sparsitylevel 1 ≤ k ≤ n and every number δ ∈ (0,1):
if m ≥ Cδ−2k log(en/k) then δk(A) ≤ δ
with probability at least 1− 2exp(−cδ2m). Here C = CK , c = cK > 0 depend only onthe sub-gaussian norm K = maxi ‖Ai‖ψ2 of the rows or columns of A.
Proof. Let us check that the conclusion follows from Theorem 5.39 for the row-independent model, and from Theorem 5.58 for the column-independent model. Weshall control the restricted isometry constant using its equivalent description (5.52). Wecan clearly assume that k is a positive integer.
Let us fix a subset T ⊆ [n], |T | = k and consider the m× k random matrix AT . IfA follows the row-independent model, then the rows of AT are orthogonal projectionsof the rows of A onto RT , so they are still independent sub-gaussian isotropic randomvectors in RT . If alternatively, A follows the column-independent model, then triviallythe columns of AT satisfy the same assumptions as the columns of A. In either case,Theorem 5.39 or Theorem 5.58 applies to AT . Hence for every s ≥ 0, with probabilityat least 1− 2exp(−cs2) one has
√m−C0
√k− s ≤ smin(AT ) ≤ smax(AT ) ≤
√m+C0
√k + s. (5.56)
Using Lemma 5.36 for AT = 1√m
AT , we see that (5.56) implies that
‖A∗T AT − IRT ‖ ≤ 3max(δ0, δ
20) where δ0 = C0
√k
m+
s√m
.
Now we take a union bound over all subsets T ⊂ [n], |T | = k. Since there are(nk
)≤
(en/k)k ways to choose T , we conclude that
max|T |=k
‖A∗T AT − IRT ‖ ≤ 3max(δ0, δ
20)
with probability at least 1−(nk
)· 2exp(−cs2) ≥ 1− 2exp
(k log(en/k)− cs2). Then,
once we choose ε > 0 arbitrarily and let s = C1√
k log(en/k) + ε√
m, we concludewith probability at least 1− 2exp(−cε2m) that
δk(A) ≤ 3max(δ0, δ20) where δ0 = C0
√k
m+C1
√k log(en/k)
m+ ε.
Finally, we apply this statement for ε := δ/6. By choosing constant C in the statementof the theorem sufficiently large, we make m large enough so that δ0 ≤ δ/3, which yields3max(δ0, δ
20) ≤ δ. The proof is complete.
The main reason Theorem 5.65 holds is that the random matrix A has a strong con-centration property, i.e. that ‖Ax‖2 ≈ ‖x‖2 with high probability for every fixed sparse

256 Roman Vershynin
vector x. This concentration property alone implies the restricted isometry property,regardless of the specific random matrix model:
proposition 5.66 (Concentration implies restricted isometry, see [10]) Let A be anm×n random matrix, and let k ≥ 1, δ ≥ 0, ε > 0. Assume that for every fixed x ∈ Rn,|supp(x)| ≤ k, the inequality
(1− δ)‖x‖22 ≤ ‖Ax‖2
2 ≤ (1+ δ)‖x‖22
holds with probability at least 1− exp(−εm). Then we have the following:
if m ≥ Cε−1k log(en/k) then δk(A) ≤ 2δ
with probability at least 1− exp(−εm/2). Here C is an absolute constant.
In words, the restricted isometry property can be checked on each individual vectorx with high probability.
Proof. We shall use the expression (5.52) to estimate the restricted isometry constant.We can clearly assume that k is an integer, and focus on the sets T ⊆ [n], |T | = k.By Lemma 5.2, we can find a net NT of the unit sphere Sn−1 ∩ RT with cardinality|NT | ≤ 9k. By Lemma 5.4, we estimate the operator norm as∥∥A∗
T AT − IRT
∥∥≤ 2 maxx∈NT
∣∣⟨(A∗T AT − IRT )x,x
⟩∣∣= 2 maxx∈NT
∣∣‖Ax‖22 − 1
∣∣.Taking the maximum over all subsets T ⊆ [n], |T | = k, we conclude that
δk(A) ≤ 2 max|T |=k
maxx∈NT
∣∣‖Ax‖22 − 1
∣∣.On the other hand, by assumption we have for every x ∈NT that
P∣∣‖Ax‖2
2 − 1∣∣> δ
≤ exp(−εm).
Therefore, taking a union bound over(nk
)≤ (en/k)k choices of the set T and over 9k
elements x ∈NT , we obtain that
Pδk(A) > 2δ ≤(
n
k
)9k exp(−εm) ≤ exp
(k ln(en/k)+k ln9− εm
)≤ exp(−εm/2)
where the last line follows by the assumption on m. The proof is complete.
5.6.2 Heavy-tailed restricted isometries
In this section we show that m×n random matrices A with independent heavy-tailedrows (and uniformly bounded coefficients) are good restricted isometries. This result

Non-asymptotic random matrix theory 257
will be established in Theorem 5.71. As before, we will prove this by controlling theextreme singular values of all m×k sub-matrices AT . For each individual subset T , thiscan be achieved using Theorem 5.41: one has
√m− t
√k ≤ smin(AT ) ≤ smax(AT ) ≤
√m+ t
√k (5.57)
with probability at least 1− 2k · exp(−ct2). Although this optimal probability estimatehas optimal order, it is too weak to allow for a union bound over all
(nk
)= (O(1)n/k)k
choices of the subset T . Indeed, in order that 1−(nk
)2k ·exp(−ct2) > 0 one would need
to take t >√
k log(n/k). So in order to achieve a nontrivial lower bound in (5.57), onewould be forced to take m ≥ k2. This is too many measurements; recall that our hope ism = O∗(k).
This observation suggests that instead of controlling each sub-matrix AT separately,we should learn how to control all AT at once. This is indeed possible with the followinguniform version of Theorem 5.45:
theorem 5.67 (Heavy-tailed rows; uniform) Let A = (aij) be an N ×d matrix (1 <
N ≤ d) whose rows Ai are independent isotropic random vectors in Rd. Let K be anumber such that all entries |aij | ≤K almost surely. Then for every 1 < n≤ d, we have
E max|T |≤n
maxj≤|T |
|sj(AT )−√
N | ≤ Cl√
n
where l = log(n)√
logd√
logN and where C = CK may depend on K only. Themaximum is, as usual, over all subsets T ⊆ [d], |T | ≤ n.
The nonuniform prototype of this result, Theorem 5.45, was based on Rudelson’sinequality, Corollary 5.28. In a very similar way, Theorem 5.67 is based on the followinguniform version of Rudelson’s inequality.
proposition 5.68 (Uniform Rudelson’s inequality [67]) Let x1, . . . ,xN be vectorsin Rd, 1 < N ≤ d, and let K be a number such that all ‖xi‖∞ ≤ K. Let ε1, . . . ,εN beindependent symmetric Bernoulli random variables. Then for every 1 < n ≤ d one has
E max|T |≤n
∥∥∥ N∑i=1
εi(xi)T ⊗ (xi)T
∥∥∥≤ Cl√
n · max|T |≤n
∥∥∥ N∑i=1
(xi)T ⊗ (xi)T
∥∥∥1/2
where l = log(n)√
logd√
logN and where C = CK may depend on K only.
The nonuniform Rudelson’s inequality (Corollary 5.28) was a consequence of a non-commutative Khintchine inequality. Unfortunately, there does not seem to exist a way todeduce Proposition 5.68 from any known result. Instead, this proposition is proved usingDudley’s integral inequality for Gaussian processes and estimates of covering numbersgoing back to Carl, see [67]. It is known however that such usage of Dudley’s inequalityis not optimal (see e.g. [75]). As a result, the logarithmic factors in Proposition 5.68 areprobably not optimal.

258 Roman Vershynin
In contrast to these difficulties with Rudelson’s inequality, proving uniform ver-sions of the other two ingredients of Theorem 5.45 – the deviation Lemma 5.47 andSymmetrization Lemma 5.46 – is straightforward.
lemma 5.69 Let (Zt)t∈T be a stochastic process24 such that all Zt ≥ 0. ThenEsupt∈T |Z2
t − 1| ≥ max(Esupt∈T |Zt − 1|,(Esupt∈T |Zt − 1|)2).
Proof. The argument is entirely parallel to that of Lemma 5.47.
lemma 5.70 (Symmetrization for stochastic processes) Let Xit, 1≤ i≤N , t∈T , berandom vectors valued in some Banach space B, whereT is a finite index set. Assume thatthe random vectors Xi = (Xti)t∈T (valued in the product space BT ) are independent.Let ε1, . . . ,εN be independent symmetric Bernoulli random variables. Then
Esupt∈T
∥∥∥ N∑i=1
(Xit −EXit)
∥∥∥≤ 2Esupt∈T
∥∥∥ N∑i=1
εiXit
∥∥∥.Proof. The conclusion follows from Lemma 5.46 applied to random vectors Xi valuedin the product Banach space BT equipped with the norm |||(Zt)t∈T ||| = supt∈T ‖Zt‖.The reader should also be able to prove the result directly, following the proof ofLemma 5.46.
Proof of Theorem 5.67. Since the random vectors Ai are isotropic in Rd, for every fixedsubset T ⊆ [d] the random vectors (Ai)T are also isotropic in RT , so E(Ai)T ⊗ (Ai)T =
IRT . As in the proof of Theorem 5.45, we are going to control
E := E max|T |≤n
∥∥ 1
NA∗
T AT − IRT
∥∥= E max|T |≤n
∥∥∥ 1
N
N∑i=1
(Ai)T ⊗ (Ai)T − IRT
∥∥∥≤ 2
NE max
|T |≤n
∥∥∥ N∑i=1
εi(Ai)T ⊗ (Ai)T
∥∥∥where we used Symmetrization Lemma 5.70 with independent symmetric Bernoullirandom variables ε1, . . . ,εN . The expectation in the right-hand side is taken both withrespect to the random matrix A and the signs (εi). First taking the expectation withrespect to (εi) (conditionally on A) and afterwards the expectation with respect to A,we obtain by Proposition 5.68 that
E ≤ CK l√
n
NE max
|T |≤n
∥∥∥ N∑i=1
(Ai)T ⊗ (Ai)T
∥∥∥1/2=
CK l√
n√N
E max|T |≤n
∥∥ 1
NA∗
T AT
∥∥1/2
24 A stochastic process (Zt) is simply a collection of random variables on a common probability spaceindexed by elements t of some abstract set T . In our particular application, T will consist of all subsetsT ⊆ [d], |T | ≤ n.

Non-asymptotic random matrix theory 259
By the triangle inequality, Emax|T |≤n
∥∥ 1N A∗
T AT
∥∥≤ E +1. Hence we obtain
E ≤ CK l
√n
N(E +1)1/2
by Hölder’s inequality. Solving this inequality in E we conclude that
E = E max|T |≤n
∥∥ 1
NA∗
T AT − IRT
∥∥≤ max(δ,δ2) where δ = CK l
√2n
N. (5.58)
The proof is completed by a diagonalization argument similar to Step 2 in the proofof Theorem 5.45. One uses there a uniform version of deviation inequality given inLemma 5.69 for stochastic processes indexed by the sets |T | ≤ n. We leave the detailsto the reader.
theorem 5.71 (Heavy-tailed restricted isometries) Let A = (aij) be an m×n matrixwhose rows Ai are independent isotropic random vectors in Rn. Let K be a numbersuch that all entries |aij | ≤ K almost surely. Then the normalized matrix A = 1√
mA
satisfies the following for m ≤ n, for every sparsity level 1 < k ≤ n and every numberδ ∈ (0,1):
if m ≥ Cδ−2k logn log2(k) log(δ−2k logn log2 k) then Eδk(A) ≤ δ. (5.59)
Here C = CK > 0 may depend only on K.
Proof. The result follows from Theorem 5.67, more precisely from its equivalentstatement (5.58). In our notation, it says that
Eδk(A) ≤ max(δ,δ2) where δ = CK l
√k
m= CK
√k logm
mlog(k)
√logn.
The conclusion of the theorem easily follows.
In the interesting sparsity range k ≥ logn and k ≥ δ−2, the condition in Theorem 5.71clearly reduces to
m ≥ Cδ−2k log(n) log3 k.
remark 5.72 (Boundedness requirement) The boundedness assumption on the entriesof A is essential in Theorem 5.71. Indeed, if the rows of A are independent coordinatevectors in Rn, then A necessarily has a zero column (in fact n−m of them). This clearlycontradicts the restricted isometry property.
Example 5.73
1. (Random Fourier measurements): An important example for Theorem 5.41 iswhere A realizes random Fourier measurements. Consider the n×n Discrete FourierTransform (DFT) matrix W with entries
Wω,t = exp(− 2πiωt
n
), ω, t ∈ 0, . . . ,n− 1.

260 Roman Vershynin
Consider a random vector X in Cn which picks a random row of W (with uniformdistribution). It follows from Parseval’s inequality that X is isotropic.25 Thereforethe m× n random matrix A whose rows are independent copies of X satisfies theassumptions of Theorem 5.41 with K = 1. Algebraically, we can view A as a randomrow sub-matrix of the DFT matrix.
In compressed sensing, such a matrix A has a remarkable meaning – it realizes m
random Fourier measurements of a signal x ∈ Rn. Indeed, y = Ax is the DFT of x
evaluated at m random points; in words, y consists of m random frequencies of x.Recall that in compressed sensing, we would like to guarantee that with high proba-bility every sparse signal x ∈ Rn (say, |supp(x)| ≤ k) can be effectively recoveredfrom its m random frequencies y = Ax. Theorem 5.71 together with Candès–Tao’sresult (recalled at the beginning of Section 5.6) imply that an exact recovery is givenby the convex optimization problem min‖x‖1 : Ax = y provided that we observeslightly more frequencies than the sparsity of a signal: m ≥ Cδ−2k log(n) log3 k.
2. (Random sub-matrices of orthogonal matrices): In a similar way, Theorem 5.71applies to a random row sub-matrix A of an arbitrary bounded orthogonal matrixW . Precisely, A may consist of m randomly chosen rows, uniformly and withoutreplacement,26 from an arbitrary n×n matrix W = (wij) such that W ∗W = nI andwith uniformly bounded coefficients, maxij |wij | = O(1). The examples of such W
include the class of Hadamard matrices – orthogonal matrices in which all entriesequal ±1.
5.7 Notes
For Section 5.1We work with two kinds of moment assumptions for random matrices: sub-gaussian andheavy-tailed. These are the two extremes. By the central limit theorem, the sub-gaussiantail decay is the strongest condition one can demand from an isotropic distribution. In con-trast, our heavy-tailed model is completely general – no moment assumptions (except thevariance) are required. It would be interesting to analyze random matrices with indepen-dent rows or columns in the intermediate regime, between sub-gaussian and heavy-tailedmoment assumptions. We hope that for distributions with an appropriate finite moment(say, (2+ ε)th or 4th), the results should be the same as for sub-gaussian distributions,i.e. no logn factors should occur. In particular, tall random matrices (N n) shouldstill be approximate isometries. This indeed holds for sub-exponential distributions [2];see [82] for an attempt to go down to finite moment assumptions.
25 For convenience we have developed the theory over R, while this example is over C. As we noted earlier,all our definitions and results can be carried over to the complex numbers. So in this example we use theobvious complex versions of the notion of isotropy and of Theorem 5.71.
26 Since in the interesting regime very few rows are selected, m n, sampling with or without replacementare formally equivalent. For example, see [67] which deals with the model of sampling withoutreplacement.
Non-asymptotic random matrix theory 261
For Section 5.2The material presented here is well known. The volume argument presented in Lemma 5.2is quite flexible. It easily generalizes to covering numbers of more general metric spaces,including convex bodies in Banach spaces. See [60, Lemma 4.16] and other parts of [60]for various methods to control covering numbers.
For Section 5.2.3The concept of sub-gaussian random variables is due to Kahane [39]. His definition wasbased on the moment generating function (Property 4 in Lemma 5.5), which automati-cally required sub-gaussian random variables to be centered.We found it more convenientto use the equivalent Property 3 instead. The characterization of sub-gaussian randomvariables in terms of tail decay and moment growth in Lemma 5.5 also goes back to [39].
The rotation invariance of sub-gaussian random variables (Lemma 5.9) is an oldobservation [15]. Its consequence, Proposition 5.10, is a general form of Hoeffding’sinequality, which is usually stated for bounded random variables. For more on largedeviation inequalities, see also notes for Section 5.2.4.
The Khintchine inequality is usually stated for the particular case of symmetricBernoulli random variables. It can be extended for 0 < p < 2 using a simple extrapolationargument based on Hölder’s inequality, see [45, Lemma 4.1].
For Section 5.2.4Sub-gaussian and sub-exponential random variables can be studied together in a generalframework. For a given exponent 0 < α <∞, one defines general ψα random variables,those with moment growth (E|X|p)1/p = O(p1/α). Sub-gaussian random variables cor-respond to α = 2 and sub-exponentials to α = 1. The reader is encouraged to extend theresults of Sections 5.2.3 and 5.2.4 to this general class.
Proposition 5.16 is a form of Bernstein’s inequality, which is usually stated for boundedrandom variables in the literature. These forms of Hoeffding’s and Bernstein’s inequal-ities (Propositions 5.10 and 5.16) are partial cases of a large deviation inequality forgeneral ψα norms, which can be found in [72, Corollary 2.10] with a similar proof. Fora thorough introduction to large deviation inequalities for sums of independent randomvariables (and more), see the books [59, 45, 24] and the tutorial [11].
For Section 5.2.5Sub-gaussian distributions in Rn are well studied in geometric functional analysis; see[53] for a link with compressed sensing. General ψα distributions in Rn are discussede.g. in [32].
Isotropic distributions on convex bodies, and more generally isotropic log-concavedistributions, are central to asymptotic convex geometry (see [31, 57]) and computationalgeometry [78]. A completely different way in which isotropic distributions appear inconvex geometry is from John’s decompositions for contact points of convex bodies,see [9, 63, 79]. Such distributions are finitely supported and therefore are usually heavy-tailed.
For an introduction to the concept of frames (Example 5.21), see [41, 19].

262 Roman Vershynin
For Section 5.2.6The non-commutative Khintchine inequality, Theorem 5.26, was first proved by Lust-Piquard [48] with an unspecified constant Bp in place of C
√p. The optimal value of Bp
was computed by Buchholz [13, 14]; see [62, Section 6.5] for a thorough introduction toBuchholz’s argument. For the complementary range 1≤ p≤ 2, a corresponding versionof non-commutative Khintchine inequality was obtained by Lust-Piquard and Pisier[47]. By a duality argument implicitly contained in [47] and independently observed byMarius Junge, this latter inequality also implies the optimal order Bp = O(
√p), see [65]
and [61, Section 9.8].Rudelson’s Corollary 5.28 was initially proved using a majorizing measure technique;
our proof follows Pisier’s argument from [65] based on the non-commutative Khintchineinequality.
For Section 5.3The “Bai–Yin law” (Theorem 5.31) was established for smax(A) by Geman [30] and Yin,Bai, and Krishnaiah [84]. The part for smin(A) is due to Silverstein [70] for Gaussianrandom matrices. Bai andYin [8] gave a unified treatment of both extreme singular valuesfor general distributions. The fourth moment assumption in Bai–Yin’s law is known tobe necessary [7].
Theorem 5.32 and its argument is due to Gordon [35, 36, 37]. Our exposition of thisresult and of Corollary 5.35 follows [21].
Proposition 5.34 is just a tip of an iceberg called concentration of measure phe-nomenon. We do not discuss it here because there are many excellent sources, some ofwhich were mentioned in Section 5.1. Instead we give just one example related to Corol-lary 5.35. For a general random matrix A with independent centered entries bounded by1, one can use Talagrand’s concentration inequality for convex Lipschitz functions onthe cube [73, 74]. Since smax(A) = ‖A‖ is a convex function of A, Talagrand’s concen-tration inequality implies P
|smax(A)−Median(smax(A))| ≥ t
≤ 2e−ct2 . Although
the precise value of the median may be unknown, integration of this inequality showsthat |Esmax(A)−Median(smax(A))| ≤ C.
For the recent developments related to the hard edge problem for almost square andsquare matrices (including Theorem 5.38) see the survey [69].
For Section 5.4Theorem 5.39 on random matrices with sub-gaussian rows, as well as its proof by acovering argument, is a folklore in geometric functional analysis. The use of coveringarguments in a similar context goes back to Milman’s proof of Dvoretzky’s theorem[55]; see e.g. [9] and [60, Chapter 4] for an introduction. In the more narrow context ofextreme singular values of random matrices, this type of argument appears recently e.g.in [2].
The breakthrough work on heavy-tailed isotropic distributions is due to Rudelson [65].He used Corollary 5.28 in the way we described in the proof of Theorem 5.45 to showthat 1
N A∗A is an approximate isometry. Probably Theorem 5.41 can also be deduced
Non-asymptotic random matrix theory 263
by a modification of this argument; however it is simpler to use the non-commutativeBernstein’s inequality.
The symmetrization technique is well known. For a slightly more general two-sidedinequality than Lemma 5.46, see [45, Lemma 6.3].
The problem of estimating covariance matrices described in Section 5.4.3 is a basicproblem in statistics, see e.g. [38]. However, most work in the statistical literature isfocused on the normal distribution or general product distributions (up to linear transfor-mations), which corresponds to studying random matrices with independent entries. Fornon-product distributions, an interesting example is for uniform distributions on con-vex sets [40]. As we mentioned in Example 5.25, such distributions are sub-exponentialbut not necessarily sub-gaussian, so Corollary 5.50 does not apply. Still, the samplesize N = O(n) suffices to estimate the covariance matrix in this case [2]. It is conjec-tured that the same should hold for general distributions with finite (e.g. fourth) momentassumption [82].
Corollary 5.55 on random sub-matrices is a variant of Rudelson’s result from [64]. Thestudy of random sub-matrices was continued in [66]. Random sub-frames were studiedin [80] where a variant of Corollary 5.56 was proved.
For Section 5.5Theorem 5.58 for sub-gaussian columns seems to be new. However, historically theefforts of geometric functional analysts were immediately focused on the more difficultcase of sub-exponential tail decay (given by uniform distributions on convex bodies).An indication to prove results like Theorem 5.58 by decoupling and covering is presentin [12] and is followed in [32, 2].
The normalization condition ‖Aj‖2 =√
N in Theorem 5.58 cannot be dropped but
can be relaxed. Namely, consider the random variable δ := maxi≤n
∣∣‖Aj‖22
N − 1∣∣. Then
the conclusion of Theorem 5.58 holds with (5.36) replaced by
(1− δ)√
N −C√
n− t ≤ smin(A) ≤ smax(A) ≤ (1+ δ)√
N +C√
n+ t.
Theorem 5.62 for heavy-tailed columns also seems to be new. The incoherence param-eter m is meant to prevent collisions of the columns of A in a quantitative way. It isnot clear whether the logarithmic factor is needed in the conclusion of Theorem 5.62,or whether the incoherence parameter alone takes care of the logarithmic factors when-ever they appear. The same question can be raised for all other results for heavy-tailedmatrices in Section 5.4.2 and their applications – can we replace the logarithmic factorsby more sensitive quantities (e.g. the logarithm of the incoherence parameter)?
For Section 5.6For a mathematical introduction to compressed sensing, see the introductory chapter ofthis book and [28, 20].
A version of Theorem 5.65 was proved in [54] for the row-independent model; anextension from sub-gaussian to sub-exponential distributions is given in [3]. A general

264 Roman Vershynin
framework of stochastic processes with sub-exponential tails is discussed in [52]. Forthe column-independent model, Theorem 5.65 seems to be new.
Proposition 5.66 that formalizes a simple approach to restricted isometry propertybased on concentration is taken from [10]. Like Theorem 5.65, it can also be used toshow that Gaussian and Bernoulli random matrices are restricted isometries. Indeed, itis not difficult to check that these matrices satisfy a concentration inequality as requiredin Proposition 5.66 [1].
Section 5.6.2 on heavy-tailed restricted isometries is an exposition of the resultsfrom [67]. Using concentration of measure techniques, one can prove a version ofTheorem 5.71 with high probability 1−n−c log3 k rather than in expectation [62]. Earlier,Candès and Tao [18] proved a similar result for random Fourier matrices, although witha slightly higher exponent in the logarithm for the number of measurements in (5.55),m = O(k log6 n). The survey [62] offers a thorough exposition of the material presentedin Section 5.6.2 and more.
References
[1] D. Achlioptas. Database-friendly random projections: Johnson-Lindenstrauss with binarycoins, in: Special issue on PODS 2001 (Santa Barbara, CA). J Comput Syst Sci, 66:671–687,2003.
[2] R. Adamczak, A. Litvak, A. Pajor, and N. Tomczak-Jaegermann. Quantitative estimates ofthe convergence of the empirical covariance matrix in log-concave ensembles. J Am MathSoc, 23:535–561, 2010.
[3] R.Adamczak,A. Litvak,A. Pajor, and N. Tomczak-Jaegermann. Restricted isometry propertyof matrices with independent columns and neighborly polytopes by random sampling. Const.Approx., to appear, 2010.
[4] R. Ahlswede and A. Winter. Strong converse for identification via quantum channels. IEEETrans. Inform. Theory, 48:569–579, 2002.
[5] G.Anderson,A. Guionnet, and O. Zeitouni. An Introduction to Random Matrices. Cambridge:Cambridge University Press, 2009.
[6] Z. Bai and J. Silverstein. Spectral Analysis of Large Dimensional Random Matrices. Secondedition. New York: Springer, 2010.
[7] Z. Bai, J. Silverstein, and Y. Yin. A note on the largest eigenvalue of a large-dimensionalsample covariance matrix. J Multivariate Anal, 26:166–168, 1988.
[8] Z. Bai and Y. Yin. Limit of the smallest eigenvalue of a large-dimensional sample covariancematrix. Ann Probab, 21:1275–1294, 1993.
[9] K. Ball. An elementary introduction to modern convex geometry. Flavors of Geometry, pp.1–58. Math. Sci. Res. Inst. Publ., 31, Cambridge: Cambridge University Press., 1997.
[10] R. Baraniuk, M. Davenport, R. DeVore, and M. Wakin. A simple proof of the restrictedisometry property for random matrices. Constr. Approx., 28:253–263, 2008.
[11] S. Boucheron, O. Bousquet, and G. Lugosi. Concentration inequalities. AdvancedLectures in Machine Learning, eds. O. Bousquet, U. Luxburg, and G. Rätsch,208–240. Springer, 2004.

Non-asymptotic random matrix theory 265
[12] J. Bourgain. Random points in isotropic convex sets, in: Convex Geometric Analysis, Berke-ley, CA, 1996, pp. 53–58. Math. Sci. Res. Inst. Publ., 34, Cambridge: Cambridge UniversityPress, 1999.
[13] A. Buchholz. Operator Khintchine inequality in non-commutative probability. Math Ann,319:1–16, 2001.
[14] A. Buchholz. Optimal constants in Khintchine type inequalities for fermions, Rademachersand q-Gaussian operators. Bull Pol Acad Sci Math, 53:315–321, 2005.
[15] V. V. Buldygin and Ju. V. Kozachenko. Sub-Gaussian random variables. Ukrainian Math J,32:483–489, 1980.
[16] E. Candès. The restricted isometry property and its implications for compressed sensing.C. R. Acad. Sci. Paris Ser. I, 346:589–592.
[17] E. Candès and T. Tao. Decoding by linear programming. IEEE Trans Inform Theory, 51:4203–4215, 2005.
[18] E. Candès and T. Tao. Near-optimal signal recovery from random projections: universalencoding strategies? IEEE Trans Inform Theory, 52:5406–5425, 2006.
[19] O. Christensen. Frames and Bases. An Introductory Course. Applied and NumericalHarmonic Analysis. Boston, MA: Birkhäuser Boston, Inc., 2008.
[20] Compressive Sensing Resources, http://dsp.rice.edu/cs[21] K. R. Davidson and S. J. Szarek. Local operator theory, random matrices and Banach spaces,
Handbook of the Geometry of Banach Spaces, vol. I, pp. 317–366. Amsterdam: North-Holland, 2001.
[22] V. de la Peña and E. Giné. Decoupling. From Dependence to Independence. RandomlyStopped Processes. U-statistics and Processes. Martingales and Beyond. New York:Springer-Verlag, 1999.
[23] P. Deift and D. Gioev. Random Matrix Theory: Invariant Ensembles and Universality.Courant Lecture Notes in Mathematics, 18. Courant Institute of Mathematical Sciences,New York; Providence, RI: American Mathematical Society, 2009.
[24] A. Dembo and O. Zeitouni. Large Deviations Techniques and Applications. Boston, MA:Jones and Bartlett Publishers, 1993.
[25] P. Drineas, R. Kannan, and M. Mahoney. Fast Monte Carlo algorithms for matrices. I, II III.SIAM J Comput, 36:132–206, 2006.
[26] R. Durrett. Probability: Theory and Examples. Belmont: Duxbury Press, 2005.[27] O. Feldheim and S. Sodin. A universality result for the smallest eigenvalues of certain sample
covariance matrices. Geom Funct Anal, to appear, 2008.[28] M. Fornasier and H. Rauhut. Compressive sensing, in Handbook of Mathematical Methods
in Imaging, eds. O. Scherzer, Springer, to appear, 2010.[29] Z. Füredi and J. Komlós. The eigenvalues of random symmetric matrices. Combinatorica,
1:233–241, 1981.[30] S. Geman. A limit theorem for the norm of random matrices. Ann. Probab., 8:252–261, 1980.[31] A. Giannopoulos. Notes on Isotropic Convex Bodies. Warsaw, 2003.[32] A. Giannopoulos and V. Milman. Concentration property on probability spaces. Adv. Math.,
156:77–106, 2000.[33] A. Giannopoulos and V. Milman. Euclidean structure in finite dimensional normed spaces,
in Handbook of the Geometry of Banach Spaces, vol. I, pp. 707–779. Amsterdam: North-Holland, 2001.

266 Roman Vershynin
[34] G. Golub, M. Mahoney, P. Drineas, and L.-H. Lim. Bridging the gap between numericallinear algebra, theoretical computer science, and data applications. SIAM News, 9: Number8, 2006.
[35] Y. Gordon. On Dvoretzky’s theorem and extensions of Slepian’s lemma, in Israel Seminaron geometrical Aspects of Functional Analysis (1983/84), II. Tel Aviv: Tel Aviv University,1984.
[36] Y. Gordon. Some inequalities for Gaussian processes and applications. Israel J Math, 50:265–289, 1985.
[37] Y. Gordon. Majorization of Gaussian processes and geometric applications. Probab. TheoryRelated Fields, 91:251–267, 1992.
[38] I. Johnstone. On the distribution of the largest eigenvalue in principal components analysis.Ann Statist, 29:295–327, 2001.
[39] J.-P. Kahane. Propriétés locales des fonctions à séries de Fourier aléatoires. Studia Math,19:1–25, 1960.
[40] R. Kannan, L. Lovász, and M. Simonovits. Isoperimetric problems for convex bodies and alocalization lemma. Discrete Comput Geom, 13:541–559, 1995.
[41] J. Kovacevic and A. Chebira. An Introduction to Frames. Foundations and Trends in SignalProcessing. Now Publishers, 2008.
[42] R. Latala. Some estimates of norms of random matrices. Proc Am Math Soc, 133, 1273–1282,2005.
[43] M. Ledoux. The Concentration of Measure Phenomenon. Mathematical Surveys andMonographs, 89. Providence: American Mathematical Society, 2005.
[44] M. Ledoux. Deviation inequalities on largest eigenvalues, in Geometric Aspects of FunctionalAnalysis, pp. 167–219. Lecture Notes in Math., 1910. Berlin: Springer, 2007.
[45] M. Ledoux and M. Talagrand. Probability in Banach Spaces. Berlin: Springer-Verlag, 1991.[46] A. Litvak, A. Pajor, M. Rudelson, and N. Tomczak-Jaegermann. Smallest singular value of
random matrices and geometry of random polytopes. Adv Math, 195:491–523, 2005.[47] F. Lust-Piquard and G. Pisier. Noncommutative Khintchine and Paley inequalities. Ark Mat,
29:241–260, 1991.[48] F. Lust-Piquard. Inégalités de Khintchine dans Cp(1 < p < ∞). C R Acad Sci Paris Sér I
Math, 303:289–292, 1986.[49] J. Matoušek. Lectures on Discrete Geometry. Graduate Texts in Mathematics, 212. New
York: Springer-Verlag, 2002.[50] M. Meckes. Concentration of norms and eigenvalues of random matrices. J Funct Anal,
211:508–524, 2004.[51] M. L. Mehta. Random Matrices. Pure and Applied Mathematics (Amsterdam), 142.
Amsterdam: Elsevier/Academic Press, 2004.[52] S. Mendelson. On weakly bounded empirical processes. Math. Ann., 340:293–314, 2008.[53] S. Mendelson, A. Pajor, and N. Tomczak-Jaegermann. Reconstruction and subgaussian
operators in asymptotic geometric analysis. Geom Funct Anal, 17:1248–1282, 2007.[54] S. Mendelson, A. Pajor, and N. Tomczak-Jaegermann. Uniform uncertainty principle for
Bernoulli and subgaussian ensembles. Constr Approx, 28:277–289, 2008.[55] V. D. Milman. A new proof of A. Dvoretzky’s theorem on cross-sections of convex bodies.
Funkcional Anal i Prilozhen, 5:28–37, 1974.[56] V. Milman and G. Schechtman. Asymptotic Theory of Finite-Dimensional Normed Spaces.
With an appendix by M. Gromov. Lecture Notes in Mathematics, 1200. Berlin: Springer-Verlag, 1986.

Non-asymptotic random matrix theory 267
[57] G. Paouris. Concentration of mass on convex bodies. Geom Funct Anal, 16:1021–1049,2006.
[58] S. Péché and A. Soshnikov. On the lower bound of the spectral norm of symmetric randommatrices with independent entries. Electron. Commun. Probab., 13:280–290, 2008.
[59] V.V. Petrov. Sums of Independent Random Variables. NewYork-Heidelberg: Springer-Verlag,1975.
[60] G. Pisier. The Volume of Convex Bodies and Banach Space Geometry. Cambridge Tracts inMathematics, 94. Cambridge: Cambridge University Press, 1989.
[61] G. Pisier. Introduction to Operator Space Theory. London Mathematical Society LectureNote Series, 294. Cambridge: Cambridge University Press, 2003.
[62] H. Rauhut. Compressive sensing and structured random matrices, in Theoretical Foundationsand Numerical Methods for Sparse Recovery, eds. M. Fornasier, Radon Series Comp ApplMath, vol 9, pp. 1–92. deGruyter, 2010.
[63] M. Rudelson. Contact points of convex bodies. Israel J. Math., 101:93–124, 1997.[64] M. Rudelson. Almost orthogonal submatrices of an orthogonal matrix. Israel J Math,
111:143–155, 1999.[65] M. Rudelson. Random vectors in the isotropic position. J. Funct. Anal., 164:60–72, 1999.[66] M. Rudelson and R. Vershynin. Sampling from large matrices: an approach through geometric
functional analysis. J ACM, 54, Art. 21, 2007.[67] M. Rudelson and R. Vershynin. On sparse reconstruction from Fourier and Gaussian
measurements. Comm Pure Appl Math, 61:1025–1045, 2008.[68] M. Rudelson and R. Vershynin. Smallest singular value of a random rectangular matrix.
Comm. Pure Appl Math, 62:1707–1739, 2009.[69] M. Rudelson and R. Vershynin. Non-asymptotic theory of random matrices: extreme singular
values. Proce Int Congr Math, Hyderabad, India, to appear, 2010.[70] J. Silverstein. The smallest eigenvalue of a large-dimensional Wishart matrix. Ann Probab,
13:1364–1368, 1985.[71] A. Soshnikov. A note on universality of the distribution of the largest eigenvalues in certain
sample covariance matrices. J Statist Phys, 108:1033–1056, 2002.[72] M. Talagrand. The supremum of some canonical processes. Am Math, 116:283–325, 1994.[73] M. Talagrand. Concentration of measure and isoperimetric inequalities in product spaces.
Inst Hautes Études Sci Publ Math, 81:73–205, 1995.[74] M. Talagrand. A new look at independence. Ann. of Probab., 24:1–34, 1996.[75] M. Talagrand. The Generic Chaining. Upper and Lower Bounds of Stochastic Processes.
Springer Monographs in Mathematics. Berlin: Springer-Verlag, 2005.[76] T. Tao and V. Vu. From the Littlewood-Offord problem to the circular law: universality of
the spectral distribution of random matrices. Bull Am Math Soc (NS), 46:377–396, 2009.[77] J. Tropp. User-friendly tail bounds for sums of random matrices, submitted, 2010.[78] S. Vempala. Geometric random walks: a survey, in Combinatorial and Computational Geom-
etry, pp. 577–616. Math Sci Res Inst Publ, 52. Cambridge: Cambridge University Press,2005.
[79] R. Vershynin. John’s decompositions: selecting a large part. Israel J Math, 122:253–277,2001.
[80] R. Vershynin. Frame expansions with erasures: an approach through the non-commutativeoperator theory. Appl Comput Harmon Anal, 18:167–176, 2005.
[81] R. Vershynin. Approximating the moments of marginals of high-dimensional distributions.Ann Probab, to appear, 2010.

268 Roman Vershynin
[82] R. Vershynin. How close is the sample covariance matrix to the actual covariance matrix?.J Theor Probab, to appear, 2010.
[83] V. Vu. Spectral norm of random matrices. Combinatorica, 27:721–736, 2007.[84] Y. Q. Yin, Z. D. Bai, and P. R. Krishnaiah. On the limit of the largest eigenvalue of the
large-dimensional sample covariance matrix. Probab Theory Related Fields, 78:509–521,1998.

6 Adaptive sensing for sparserecoveryJarvis Haupt and Robert Nowak
In recent years, tremendous progress has been made in high-dimensional inference prob-lems by exploiting intrinsic low-dimensional structure. Sparsity is perhaps the simplestmodel for low-dimensional structure. It is based on the assumption that the object ofinterest can be represented as a linear combination of a small number of elementaryfunctions, which are assumed to belong to a larger collection, or dictionary, of possiblefunctions. Sparse recovery is the problem of determining which components are neededin the representation based on measurements of the object. Most theory and methodsfor sparse recovery are based on an assumption of non-adaptive measurements. Thischapter investigates the advantages of sequential measurement schemes that adaptivelyfocus sensing using information gathered throughout the measurement process. In par-ticular, it is shown that adaptive sensing can be significantly more powerful when themeasurements are contaminated with additive noise.
6.1 Introduction
High-dimensional inference problems cannot be accurately solved without enormousamounts of data or prior assumptions about the nature of the object to be inferred. Greatprogress has been made in recent years by exploiting intrinsic low-dimensional structurein high-dimensional objects. Sparsity is perhaps the simplest model for taking advantageof reduced dimensionality. It is based on the assumption that the object of interest canbe represented as a linear combination of a small number of elementary functions. Thespecific functions needed in the representation are assumed to belong to a larger collectionor dictionary of functions, but are otherwise unknown. The sparse recovery problem isto determine which functions are needed in the representation based on measurements ofthe object. This general problem can usually be cast as a problem of identifying a vectorx ∈ Rn from measurements. The vector is assumed to have k n non-zero elements,however the locations of the non-zero elements are unknown.
Most of the existing theory and methods for the sparse recovery problem are based onnon-adaptive measurements. In this chapter we investigate the advantages of sequential
Compressed Sensing: Theory and Applications, ed. Yonina C. Eldar and Gitta Kutyniok. Published byCambridge University Press. © Cambridge University Press 2012.

270 Jarvis Haupt and Robert Nowak
sampling schemes that adapt to x using information gathered throughout the samplingprocess. The distinction between adaptive and non-adaptive measurement can be mademore precise, as follows. Information is obtained from samples or measurements of theform y1(x),y2(x) . . . , where yt are functionals from a space Y representing all possiblemeasurement forms and yt(x) are the values the functionals take for x. We distinguishbetween two types of information:
Non-adaptive information: y1,y2, . . .∈Y are chosen non-adaptively (deterministicallyor randomly) and independently of x.
Adaptive information: y1,y2, . . . ∈ Y are selected sequentially, and the choice of yt+1
may depend on the previously gathered information, y1(x), . . . ,yt(x).
In this chapter we will see that adaptive information can be significantly more pow-erful when the measurements are contaminated with additive noise. In particular, wewill discuss a variety of adaptive measurement procedures that gradually focus on thesubspace, or sparse support set, where x lives, allowing for increasingly precise mea-surements to be obtained. We explore adaptive schemes in the context of two commonscenarios, which are described in some detail below.
6.1.1 Denoising
The classic denoising problem deals with the following. Suppose we observe x in noiseaccording to the non-adaptive measurement model
y = x+ e, (6.1)
where e∈ Rn represents a vector of additive Gaussian white noise; i.e., eji.i.d.∼ N (0,1),
j = 1, . . . ,n, where i.i.d. stands for independent and identically distributed and N (0,1)
denotes the standard Gaussian distribution. It is sufficient to consider unit variance noisesin this model, since other values can be accounted for by an appropriate scaling of theentries of x.
Let x be deterministic and sparse, but otherwise unknown. The goal of the denoisingproblem we consider here is to determine the locations of the non-zero elements in x
from the measurement y. Because the noises are assumed to be i.i.d., the usual strategyis to simply threshold the components of y at a certain level τ , and declare those thatexceed the threshold as detections. This is challenging for the following simple reason.Consider the probability Pr(maxj ej > τ) for some τ > 0. Using a simple bound on theGaussian tail and the union bound, we have
Pr(maxj
ej > τ) ≤ n
2exp
(−τ2
2
)= exp
(−τ2
2+ logn− log2
). (6.2)

Adaptive sensing for sparse recovery 271
This shows that if τ >√
2logn, then the probability of false detections can be controlled.In fact, in the high-dimensional limit [1]
Pr
(lim
n→∞
maxj=1,...,n ej√2logn
= 1
)= 1 (6.3)
and therefore, for large n, we see that false detections cannot be avoided withτ <
√2logn. These basic facts imply that this classic denoising problem cannot be
reliably solved unless the non-zero components of x exceed√
2logn in magnitude. Thisdependence on the problem size n can be viewed as a statistical “curse of dimensionality.”
The classic model is based on non-adaptive measurements. Suppose instead that themeasurements could be performed sequentially, as follows. Assume that each mea-surement yj results from integration over time or averaging of repeated independentobservations. The classic non-adaptive model allocates an equal portion of the full mea-surement budget to each component of x. In the sequential adaptive model, the budgetcan be distributed in a more flexible and adaptive manner. For example, a sequentialsensing method could first measure all of the components using a third of the total bud-get, corresponding to observations of each component plus an additive noise distributedas N (0,3). The measurements are very noisy, but may be sufficiently informative toreliably rule out the presence of non-zero components at a large fraction of the loca-tions. After ruling out many locations, the remaining two thirds of the measurementbudget can be directed at the locations still in question. Now, because there are fewerlocations to consider, the variance associated with the subsequent measurements canbe even smaller than in the classic model. An illustrative example of this process isdepicted in Figure 6.1. We will see in later sections that such sequential measurementmodels can effectively mitigate the curse of dimensionality in high-dimensional sparseinference problems. This permits the recovery of signals having nonzero componentswhose magnitudes grow much more slowly than
√2logn.
6.1.2 Inverse problems
The classic inverse problem deals with the following observation model. Suppose weobserve x in noise according to the non-adaptive measurement model
y = Ax+ e, (6.4)
where A ∈ Rm×n is a known measurement matrix, e ∈ Rn again represents a vector ofindependent Gaussian white noise realizations, and x is assumed to be deterministic andsparse, but otherwise unknown. We will usually assume that the columns of A have unitnorm. This normalization is used so that the SNR is not a function of m, the numberof rows. Note that in the denoising problem we have A = In×n, the identity operator,which also has unit norm columns.
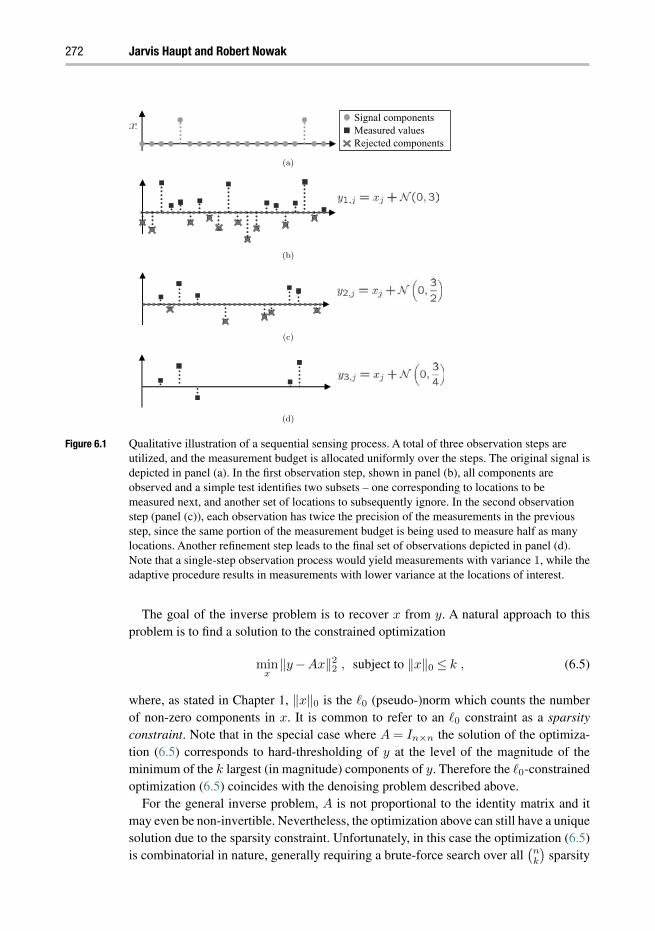
272 Jarvis Haupt and Robert Nowak
(a)
(b)
(c)
(d)
Signal componentsMeasured valuesRejected components
Figure 6.1 Qualitative illustration of a sequential sensing process. A total of three observation steps areutilized, and the measurement budget is allocated uniformly over the steps. The original signal isdepicted in panel (a). In the first observation step, shown in panel (b), all components areobserved and a simple test identifies two subsets – one corresponding to locations to bemeasured next, and another set of locations to subsequently ignore. In the second observationstep (panel (c)), each observation has twice the precision of the measurements in the previousstep, since the same portion of the measurement budget is being used to measure half as manylocations. Another refinement step leads to the final set of observations depicted in panel (d).Note that a single-step observation process would yield measurements with variance 1, while theadaptive procedure results in measurements with lower variance at the locations of interest.
The goal of the inverse problem is to recover x from y. A natural approach to thisproblem is to find a solution to the constrained optimization
minx
‖y−Ax‖22 , subject to ‖x‖0 ≤ k , (6.5)
where, as stated in Chapter 1, ‖x‖0 is the 0 (pseudo-)norm which counts the numberof non-zero components in x. It is common to refer to an 0 constraint as a sparsityconstraint. Note that in the special case where A = In×n the solution of the optimiza-tion (6.5) corresponds to hard-thresholding of y at the level of the magnitude of theminimum of the k largest (in magnitude) components of y. Therefore the 0-constrainedoptimization (6.5) coincides with the denoising problem described above.
For the general inverse problem, A is not proportional to the identity matrix and itmay even be non-invertible. Nevertheless, the optimization above can still have a uniquesolution due to the sparsity constraint. Unfortunately, in this case the optimization (6.5)is combinatorial in nature, generally requiring a brute-force search over all
(nk
)sparsity
Adaptive sensing for sparse recovery 273
patterns. A common alternative is to instead solve a convex relaxation of the form
minx
‖y−Ax‖22 , subject to ‖x‖1 ≤ τ , (6.6)
for some τ > 0. This 1-constrained optimization is relatively easy to solve using convexoptimization techniques. It is well known that the solutions of the optimization (6.6) aresparse, and the smaller τ , the sparser the solution.
If the columns of A are not too correlated with one another and τ is chosen appropri-ately, then the solution to this optimization is close to the solution of the 0-constrainedoptimization. In fact in the absence of noise, perfect recovery of the sparse vector x
is possible. For example, compressed sensing methods often employ an A comprisedof realizations of i.i.d. symmetric random variables. If m (the number of rows) is justslightly larger than k, then every subset of k columns from such an A will be close toorthogonal [2, 3, 4]. This condition suffices to guarantee that any sparse signal with k orfewer non-zero components can be recovered from y,A – see, for example, [5].
When noise is present in the measurements, reliably determining the locations of thenon-zero components in x requires that these components are significantly large relativeto the noise level. For example, if the columns of A are scaled to have unit norm, recentwork [6] suggests that the optimization in (6.6) will succeed (with high probability) onlyif the magnitudes of the non-zero components exceed a fixed constant times
√logn.
In this chapter we will see that this fundamental limitation can again be overcome bysequentially designing the rows of A so that they tend to focus on the relevant componentsas information is gathered.
6.1.3 A Bayesian perspective
The denoising and inverse problems each have a simple Bayesian interpretation whichis a convenient perspective for the development of more general approaches. Recall the0-constrained optimization in (6.5). The Lagrangian formulation of this optimization is
minx
‖y−Ax‖2
2 +λ‖x‖0
, (6.7)
where λ > 0 is the Lagrange multiplier. The optimization can be viewed as a Bayesianprocedure, where the term ‖y−Ax‖2
2 is the negative Gaussian log-likelihood of x, andλ‖x‖0 is the negative log of a prior distribution on the support of x. That is, the massallocated to x with k non-zero elements is uniformly distributed over the
(nk
)possible
sparsity patterns. Minimizing the sum of these two quantities is equivalent to solving forthe Maximum a Posteriori (MAP) estimate.
The 1-constrained optimization also has a Bayesian interpretation. The Lagrangianform of that optimization is
minx
‖y−Ax‖2
2 +λ‖x‖1
. (6.8)
In this case the prior is proportional to exp(−λ‖x‖1), which models components of x
independently with a heavy-tailed (double-exponential, or Laplace) distribution. Both

274 Jarvis Haupt and Robert Nowak
the 0 and 1 priors, in a sense, reflect a belief that the x we are seeking is sparse (orapproximately so) but otherwise unstructured in the sense that all patterns of sparsity areequally probable a priori.
6.1.4 Structured sparsity
The Bayesian perspective also provides a natural framework for more structured mod-els. By modifying the prior (and hence the penalizing term in the optimization), it ispossible to encourage solutions having more structured patterns of sparsity. A very gen-eral information-theoretic approach to this sort of problem was provided in [7], and weadopt that approach in the following examples. Priors can be constructed by assigninga binary code to each possible x. The prior probability of any given x is proportionalto exp(−λK(x)), where λ > 0 is a constant and K(x) is the bit-length of the codeassigned to x. If A is an m× n matrix with entries drawn independently from a sym-metric binary-valued distribution, then the expected mean square error of the estimate
x = argminx∈X
‖y−Ax‖2
2 +λK(x)
(6.9)
selected by optimizing over a set X of candidates (which, for example, could be adiscretized subset of the set of all vectors in Rn with 2 norm bounded by some specifiedvalue), satisfies
E‖x−x∗‖22/n ≤ C min
x∈X
‖x−x∗‖2
2/n+ cK(x)/m
. (6.10)
Here, x∗ is the vector that generated y and C,c > 0 are constants depending on thechoice of λ. The notation E denotes expectation, which here is taken with respect tothe distribution on A and the additive noise in the observation model (6.4). The ‖x‖0
prior/penalty is recovered as a special case in which logn bits are allocated to encodethe location and value of each non-zero element of x (so that K(x) is proportional to‖x‖0 logn). Then the error satisfies the bound
E‖x−x∗‖22/n ≤ C ′‖x∗‖0 logn/m , (6.11)
for some constant C ′ > 0.The Bayesian perspective also allows for more structured models. To illustrate, con-
sider a simple sparse binary signal x∗ (i.e., all non-zero components take the value 1).If we make no assumptions on the sparsity pattern, then the location of each non-zerocomponent can be encoded using logn bits, resulting in a bound of the same form as(6.11). Suppose instead that the sparsity pattern of x can be represented by a binary treewhose vertices correspond to the elements of x. This is a common model for the typicalsparsity patterns of wavelet coefficients, for example see [8]. The tree-structured restric-tion means that a node can be non-zero if and only if its “parent” node is also non-zero.Thus, each possible sparsity pattern corresponds to a particular branch of the full binarytree. There exist simple prefix codes for binary trees, and the codelength for a tree with

Adaptive sensing for sparse recovery 275
k vertices is at most 2k+1 (see, for example, [9]). In other words, we require just over 2
bits per component, rather than logn. Applying the general error bound (6.10) we obtain
E‖x−x∗‖22/n ≤ C ′′‖x∗‖0/m , (6.12)
for some constant C ′′ > 0 which, modulo constants, is a factor of logn better than thebound under the unstructured assumption. Thus, we see that the Bayesian perspectiveprovides a formalism for handling a wider variety of modeling assumptions and derivingperformance bounds. Several authors have explored various other approaches to exploit-ing structure in the patterns of sparsity – see [10, 11, 12, 13], as well as [14] and theexposition in Chapter 4.
Another possibility offered by the Bayesian perspective is to customize the sensingmatrix in order to exploit more informative prior information (other than simple unstruc-tured sparsity) that may be known about x. This has been formulated as a Bayesianexperimental design problem [15, 16]. Roughly speaking, the idea is to identify a goodprior distribution for x and then optimize the choice of the sensing matrix A in order tomaximize the expected information of the measurement. In the next section we discusshow this idea can be taken a step further, to sequential Bayesian experimental designsthat automatically adapt the sensing to the underlying signal in an online fashion.
6.2 Bayesian adaptive sensing
The Bayesian perspective provides a natural framework for sequential adaptive sens-ing, wherein information gleaned from previous measurements is used to automaticallyadjust and focus the sensing. In principle the idea is very simple. Let Q1 denote a proba-bility measure over all m×n matrices having unit Frobenius norm in expectation. Thisnormalization generalizes the column normalization discussed earlier. It still implies thatthe SNR is independent of m, but it also allows for the possibility of distributing the mea-surement budget more flexibly throughout the columns. This will be crucial for adaptivesensing procedures. For example, in many applications the sensing matrices have entriesdrawn i.i.d. from a symmetric distribution (see Chapter 5 for a detailed discussion of ran-dom matrices). Adaptive sensing procedures, including those discussed in later sectionsof this chapter, are often also constructed from entries drawn from symmetric, but notidentical, distributions. By adaptively adjusting the variance of the distributions used togenerate the entries, these sensing matrices can place more or less emphasis on certaincomponents of the signal.
Now consider how we might exploit adaptivity in sparse recovery. Suppose that webegin with a prior probability distribution p(x) for x. Initially collect a set of measure-ments y ∈ Rm according to the sensing model y = Ax + w with A ∼ Q1, where Q1
is a prior probability distribution on m × n sensing matrices. For example, Q1 couldcorrespond to drawing the entries of A independently from a common symmetric distri-bution. A posterior distribution for x can be calculated by combining these data with a

276 Jarvis Haupt and Robert Nowak
(a) (b)
Signal Components Sensing Vector Components
Figure 6.2 Traditional vs. focused sensing. Panel (a) depicts a sensing vector that may be used in atraditional non-adaptive measurement approach. The components of the sensing vector haveuniform amplitudes, implying that an equal amount of “sensing energy” is being allocated to alllocations regardless of the signal being measured. Panel (b) depicts a focused sensing vectorwhere most of the sensing energy is focused on a small subset of the components correspondingto the relevant entries of the signal.
prior probability model for x, using Bayes’ rule. Let p(x|y) denote this posterior distri-bution. It then becomes natural to ask, which sensing actions will provide the most newinformation about x? In other words, we are interested in designing Q2 so that the nextmeasurement using a sensing matrix A∼Q2 maximizes our gain in information about x.For example, if certain locations are less likely (or even completely ruled-out) given theobserved data y, then Q2 should be designed to place little (or zero) probability mass onthe corresponding columns of the sensing matrix. Our goal will be to develop strategiesthat utilize information from previous measurements to effectively “focus” the sensingenergy of subsequent measurements into subspaces corresponding to the true signal ofinterest (and away from locations of less interest). An example depicting the notion offocused sensing is shown in Figure 6.2.
More generally, the goal of the next sensing action should be to reduce the uncertaintyabout x as much as possible. There is a large literature dealing with this problem, usuallyunder the topic of “sequential experiments.” The classical Bayesian perspective is nicelysummarized in the work of DeGroot [17]. He credits Lindley [18] with first proposingthe use of Shannon entropy as a measure of uncertainty to be optimized in the sequentialdesign of experiments. Using the notion of Shannon entropy, the “information-gain”of an experiment can be quantified by the change that the new data produces in theentropy associated with the unknown parameter(s). The optimal design of a number ofsequential experiments can be defined recursively and viewed as a dynamic program-ming problem. Unfortunately, the optimization is intractable in all but the most simplesituations. The usual approach, instead, operates in a greedy fashion, maximizing theinformation-gain at each step in a sequence of experiments. This can be suboptimal, butoften is computationally feasible and effective.
An adaptive sensing procedure of this sort can be devised as follows. Let p(x) denotethe probability distribution of x after the tth measurement step. Imagine that in the

Adaptive sensing for sparse recovery 277
(t + 1)-th step we measure y = Ax + e, where A ∼ Q and Q is a distribution we candesign as we like. Let p(x|y) denote the posterior distribution according to Bayes’ rule.The “information” provided by this measurement is quantified by the Kullback–Leibler(KL) divergence of p(x) from p(x|y) which is given by
EX
[log
p(x|y)
p(x)
], (6.13)
where the expectation is with respect to the distribution of a random variable X ∼p(x|y). Notice that this expression is a function of y, which is undetermined until themeasurement is made. Thus, it is natural to consider the expectation of the KL divergencewith respect to the distribution of y, which depends on the prior p(x), the distribution ofthe noise, and most importantly, on the choice of Q. Let p(y) denote the distribution ofthe random measurement obtained using the observation matrix A ∼ Q. The expectedinformation gain from a measurement based on A is defined to be
EYQEX
[log
p(x|y)
p(x)
], (6.14)
where the outer expectation is with respect to the distribution of a random variableYQ ∼ p(y). This suggests choosing a distribution for the sensing matrix for the nextmeasurement to maximize the expected information gain, that is
Qt+1 = argmaxQ
EYQEX
[log
p(x|y)
p(x)
], (6.15)
where the optimization is over a space of possible distributions on m×n matrices.One useful interpretation of this selection criterion follows by observing that maxi-
mizing the expected information gain is equivalent to minimizing the conditional entropyof the posterior distribution [18]. Indeed, simplifying the above expression we obtain
Qt+1 = argmaxQ
EYQEX
[log
p(x|y)
p(x)
]= argmin
Q−EYQEX logp(x|y)+EYQEX logp(x)
= argminQ
H(X|YQ)−H(X)
= argminQ
H(X|YQ), (6.16)
where H(X) denotes the Shannon entropy and H(X|YQ) the entropy of X conditionalon YQ. Another intuitive interpretation of the information gain criterion follows fromthe fact that
EYQEX
[log
p(x|y)
p(x)
]= EX,YQ
[log
p(x,y)
p(x)p(y)
](6.17)

278 Jarvis Haupt and Robert Nowak
where the right-hand side is just the mutual information between the random variablesX and YQ. Thus, the information gain criterion equivalently suggests that the nextmeasurements should be constructed in a way that maximizes the mutual informationbetween X and YQ.
Now, given this selection of Qt+1, we may draw A∼Qt+1, collect the next measure-ment y = Ax+ e, and use Bayes’ rule to obtain the new posterior. The rationale is thatat each step we are choosing a sensing matrix that maximizes the expected informationgain, or equivalently minimizes the expected entropy of the new posterior distribu-tion. Ideally, this adaptive and sequential approach to sensing will tend to focus on x
so that sensing energy is allocated to the correct subspace, increasing the SNR of themeasurements relative to non-adaptive sensing. The performance could be evaluated,for example, by comparing the result of several adaptive steps to that obtained using asingle non-adaptively chosen A.
The approach outlined above suffers from a few inherent limitations. First, whilemaximizing the expected information gain is a sensible criterion for focusing, the expo-sition makes no guarantees about the performance of such methods. That is, one cannotimmediately conclude that this procedure will lead to an improvement in performance.Second, and perhaps more importantly in practice, selecting the sensing matrix that max-imizes the expected information gain can be computationally prohibitive. In the next fewsections, we discuss several efforts where approximations or clever choices of the priorare employed to alleviate the computational burden of these procedures.
6.2.1 Bayesian inference using a simple generative model
To illustrate the principles behind the implementation of Bayesian sequential experi-mental design, we begin with a discussion of the approach proposed in [19]. Their workemployed a simple signal model in which the signal vector x ∈ Rn was assumed toconsist of only a single nonzero entry. Despite the potential model misspecification, thissimplification enables the derivation of closed-form expressions for model parameterupdate rules. It also leads to a simple and intuitive methodology for the shaping ofprojection vectors in the sequential sampling process.
6.2.1.1 Single component generative modelWe begin by constructing a generative model for this class of signals. This model willallow us to define the problem parameters of interest, and to perform inference on them.First, we define L to be a random variable whose range is the set of indices of thesignal, j = 1,2, . . . ,n. The entries of the probability mass function of L, denoted byqj = Pr(L = j), encapsulate our belief regarding which index corresponds to the truelocation of the single nonzero component. The amplitude of the single nonzero signalcomponent is a function of its location L, and is denoted by α. Further, conditional onthe outcome L = j, we model the amplitude of the nonzero component as a Gaussianrandom variable with location-dependent mean and variance, µj and νj , respectively.

Adaptive sensing for sparse recovery 279
That is, the distribution of α given L = j is given by
p(α|L = j) ∼N (µj ,νj). (6.18)
Thus, our prior on the signal x is given by p(α,L), and is described by thehyperparameters qj ,µj ,νjn
j=1.We will perform inference on the hyperparameters, updating our knowledge of them
using scalar observations collected according to the standard observation model,
yt = Atx+ et, (6.19)
where At is a 1×n vector and the noises et are assumed to be i.i.d. N (0,σ2) for someknown σ > 0. We initialize the hyperparameters of the prior to qj(0) = 1/n, µj(0) = 0,and νj(0) = σ2
0 for some specified σ0, for all j = 1,2, . . . ,n. Now, at time step t ≥ 1,the posterior distribution for the unknown parameters at a particular location j can bewritten as
p(α,L = j|yt,At) = p(α|yt,At,L = j) · qj(t− 1). (6.20)
Employing Bayes’ rule, we can rewrite the first term on the right-hand side to obtain
p(α|yt,At,L = j) ∝ p(yt|At,α,L = j) · p(α|L = j), (6.21)
and thus the posterior distribution for the unknown parameters satisfies
p(α,L = j|yt,At) ∝ p(yt|At,α,L = j) · p(α|L = j) · qj(t− 1). (6.22)
The proportionality notation has been used to suppress the explicit specification of thenormalizing factor. Notice that, by construction, the likelihood function p(yt|At,α,L = j) is conjugate to the prior p(α|L = j), since each is Gaussian. Substitutingin the corresponding density functions, and following some straightforward algebraicmanipulation, we obtain the following update rules for the hyperparameters:
µj(t) =At,jνj(t− 1)yt +µj(t− 1)σ2
A2t,jνj(t− 1)+σ2 , (6.23)
νj(t) =νj(t− 1)σ2
A2t,jνj(t− 1)+σ2 , (6.24)
qj(t) ∝qj(t− 1)√
A2t,jνj(t− 1)+σ2
exp
(−1
2
(yt −At,jµj(t− 1))2
A2t,jνj(t− 1)+σ2
). (6.25)
6.2.1.2 Measurement adaptationNow, as mentioned above, our goal here is twofold. On one hand, we want to esti-mate the parameters corresponding to the location and amplitude of the unknown signalcomponent. On the other hand, we want to devise a strategy for focusing subsequentmeasurements onto the features of interest to boost the performance of our inference
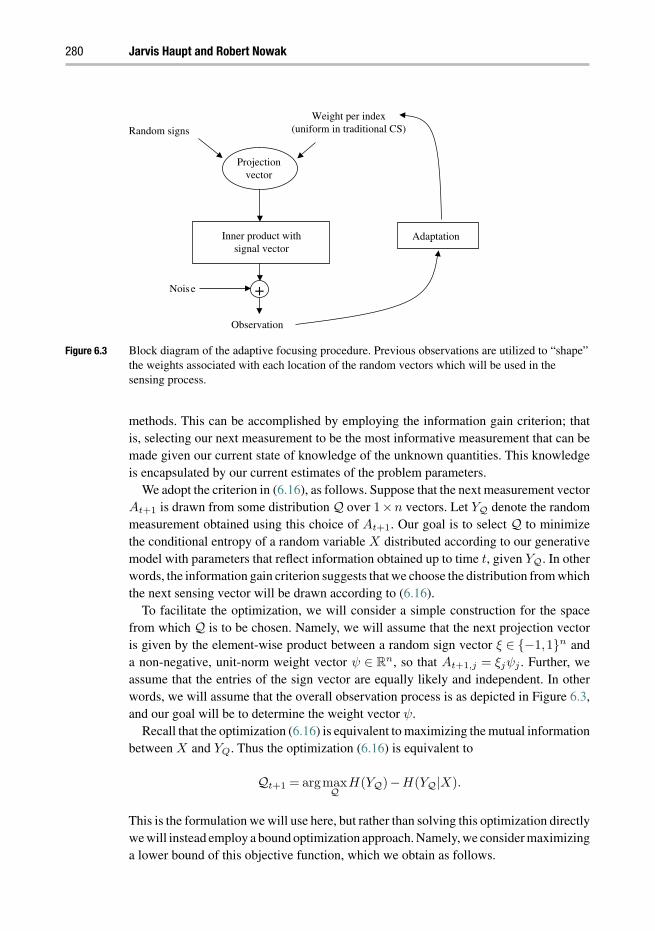
280 Jarvis Haupt and Robert Nowak
Weight per index(uniform in traditional CS)Random signs
Projectionvector
Inner product withsignal vector
+
Observation
Noise
Adaptation
Figure 6.3 Block diagram of the adaptive focusing procedure. Previous observations are utilized to “shape”the weights associated with each location of the random vectors which will be used in thesensing process.
methods. This can be accomplished by employing the information gain criterion; thatis, selecting our next measurement to be the most informative measurement that can bemade given our current state of knowledge of the unknown quantities. This knowledgeis encapsulated by our current estimates of the problem parameters.
We adopt the criterion in (6.16), as follows. Suppose that the next measurement vectorAt+1 is drawn from some distribution Q over 1×n vectors. Let YQ denote the randommeasurement obtained using this choice of At+1. Our goal is to select Q to minimizethe conditional entropy of a random variable X distributed according to our generativemodel with parameters that reflect information obtained up to time t, given YQ. In otherwords, the information gain criterion suggests that we choose the distribution from whichthe next sensing vector will be drawn according to (6.16).
To facilitate the optimization, we will consider a simple construction for the spacefrom which Q is to be chosen. Namely, we will assume that the next projection vectoris given by the element-wise product between a random sign vector ξ ∈ −1,1n anda non-negative, unit-norm weight vector ψ ∈ Rn, so that At+1,j = ξjψj . Further, weassume that the entries of the sign vector are equally likely and independent. In otherwords, we will assume that the overall observation process is as depicted in Figure 6.3,and our goal will be to determine the weight vector ψ.
Recall that the optimization (6.16) is equivalent to maximizing the mutual informationbetween X and YQ. Thus the optimization (6.16) is equivalent to
Qt+1 = argmaxQ
H(YQ)−H(YQ|X).
This is the formulation we will use here, but rather than solving this optimization directlywe will instead employ a bound optimization approach. Namely, we consider maximizinga lower bound of this objective function, which we obtain as follows.
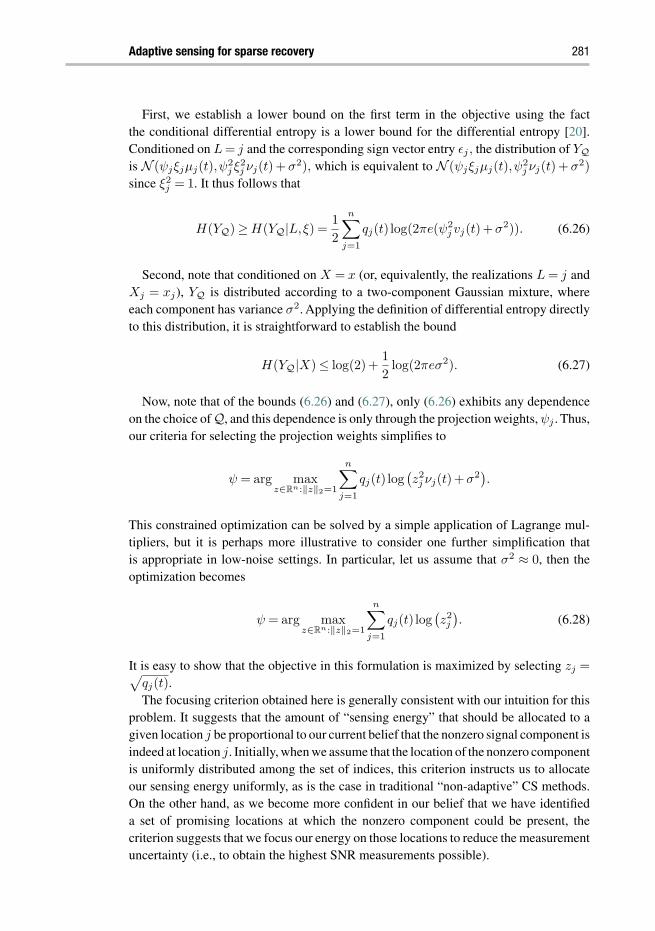
Adaptive sensing for sparse recovery 281
First, we establish a lower bound on the first term in the objective using the factthe conditional differential entropy is a lower bound for the differential entropy [20].Conditioned on L = j and the corresponding sign vector entry εj , the distribution of YQis N (ψjξjµj(t),ψ
2j ξ2
j νj(t) + σ2), which is equivalent to N (ψjξjµj(t),ψ2j νj(t) + σ2)
since ξ2j = 1. It thus follows that
H(YQ) ≥ H(YQ|L,ξ) =1
2
n∑j=1
qj(t) log(2πe(ψ2j vj(t)+σ2)). (6.26)
Second, note that conditioned on X = x (or, equivalently, the realizations L = j andXj = xj), YQ is distributed according to a two-component Gaussian mixture, whereeach component has variance σ2. Applying the definition of differential entropy directlyto this distribution, it is straightforward to establish the bound
H(YQ|X) ≤ log(2)+1
2log(2πeσ2). (6.27)
Now, note that of the bounds (6.26) and (6.27), only (6.26) exhibits any dependenceon the choice of Q, and this dependence is only through the projection weights, ψj . Thus,our criteria for selecting the projection weights simplifies to
ψ = arg maxz∈Rn:‖z‖2=1
n∑j=1
qj(t) log(z2
j νj(t)+σ2).This constrained optimization can be solved by a simple application of Lagrange mul-tipliers, but it is perhaps more illustrative to consider one further simplification thatis appropriate in low-noise settings. In particular, let us assume that σ2 ≈ 0, then theoptimization becomes
ψ = arg maxz∈Rn:‖z‖2=1
n∑j=1
qj(t) log(z2
j
). (6.28)
It is easy to show that the objective in this formulation is maximized by selecting zj =√qj(t).The focusing criterion obtained here is generally consistent with our intuition for this
problem. It suggests that the amount of “sensing energy” that should be allocated to agiven location j be proportional to our current belief that the nonzero signal component isindeed at location j. Initially, when we assume that the location of the nonzero componentis uniformly distributed among the set of indices, this criterion instructs us to allocateour sensing energy uniformly, as is the case in traditional “non-adaptive” CS methods.On the other hand, as we become more confident in our belief that we have identifieda set of promising locations at which the nonzero component could be present, thecriterion suggests that we focus our energy on those locations to reduce the measurementuncertainty (i.e., to obtain the highest SNR measurements possible).

282 Jarvis Haupt and Robert Nowak
The procedure outlined here can be extended, in a straightforward way, to settingswhere the unknown vector x has multiple nonzero entries. The basic idea is to identify thenonzero entries of the signal one-at-a-time, using a sequence of iterations of the proposedprocedure. For each iteration, the procedure is executed as described above until one entryof the posterior distribution for the location parameter exceeds a specified thresholdτ ∈ (0,1). That is, the current iteration of the sequential sensing procedure terminateswhen the posterior likelihood of a true nonzero component at any of the locations becomeslarge, which corresponds to the event that qj(t) > τ for any j ∈ 1,2, . . . ,n, for aspecified τ that we choose to be close to 1.At that point, we conclude that a nonzero signalcomponent is present at the corresponding location. The sequential sensing procedure isthen restarted and the parameters qj ,µj ,νjn
j=1 are reinitialized, except that the initialvalues of qjn
j=1 are set to zero at locations identified as signal components in previousiterations of the procedure, and uniformly distributed over the remaining locations. Theresulting multi-step procedure is akin to an “onion peeling” process.
6.2.2 Bayesian inference using multi-component models
The simple single-component model for the unknown signal x described above is butone of many possible generative models that might be employed in a Bayesian treatmentof the sparse inference problem. Another, perhaps more natural, option is to employ amore sophisticated model that explicitly allows for the signal to have multiple nonzerocomponents.
6.2.2.1 Multi-component generative modelAs discussed above, a widely used sparsity promoting prior is the Laplace distribution,
p(x|λ) =
(λ
2
)n
· exp
−λ
n∑j=1
|xj |
. (6.29)
From an analytical perspective in Bayesian inference, however, this particular choice ofprior on x can lead to difficulties. In particular, under a Gaussian noise assumption, theresulting likelihood function for the observations (which is conditionally Gaussian givenx and the projection vectors) is not conjugate to the Laplace prior, and so closed-formupdate rules cannot be easily obtained.
Instead, here we discuss the method that was examined in [21], which utilizes ahierarchical prior on the signal x, similar to a construction proposed in the context ofsparse Bayesian learning in [22]. As before, we begin by constructing a generative modelfor the signal x. To each xj , j = 1,2, . . . ,n, we associate a parameter ρj > 0. The jointdistribution of the entries of x, conditioned on the parameter vector ρ = (ρ1,ρ2, . . . ,ρn),is given in the form of a product distribution,
p(x|ρ) =
n∏j=1
p(xj |ρj), (6.30)

Adaptive sensing for sparse recovery 283
and we let p(xj |ρj)∼N (0,ρ−1j ). Thus, we may interpret the ρj as precision or “inverse
variance” parameters. In addition, we impose a prior on the entries of ρ, as follows. Forglobal parameters α,β > 0, we set
p(ρ|α,β) =
n∏j=1
p(ρj |α,β), (6.31)
where p(ρj |α,β)∼ Gamma(α,β) is distributed according to a Gamma distribution withparameters α and β. That is,
p(ρj |α,β) =ρα−1
j βα exp(−βρj)
Γ(α), (6.32)
where
Γ(α) =
∫ ∞
0zα−1 exp(−z)dz (6.33)
is the Gamma function. We model the noise as zero-mean Gaussian with unknownvariance, and impose a Gamma prior on the distribution of the noise precision. Thisresults in a hierarchial prior similar to that utilized for the signal vector. Formally, wemodel our observations using the standard matrix-vector formulation,
y = Ax+ e, (6.34)
where y ∈ Rm and A ∈ Rm×n, and we let p(e|ρ0) ∼ N (0,ρ0Im×m), and p(ρ0|γ,δ) ∼Gamma(γ,δ). A graphical summary of the generative signal and observation models isdepicted in Figure 6.4.
Now, the hierarchical model was chosen primarily to facilitate analysis, since theGaussian prior on the signal components is conjugate to the Gaussian (conditional) like-lihood of the observations. Generally speaking, a Gaussian prior itself will not promotesparsity; however, incorporating the effect of the Gamma hyperprior lends some addi-tional insight into the situation here. By marginalizing over the parameters ρ, we can
Figure 6.4 Graphical model associated with the multi-component Bayesian CS model.

284 Jarvis Haupt and Robert Nowak
obtain an expression for the overall prior distribution of the signal components in termsof the parameters α and β,
p(x|α,β) =
n∏j=1
∫ ∞
0p(xj |ρj) · p(ρj |α,β)dρj . (6.35)
The integral(s) can be evaluated directly, giving
p(xj |α,β) =
∫ ∞
0p(xj |ρj) · p(ρj |α,β)dρj
=βαΓ(α+1/2)
(2π)1/2Γ(α)
(β +
x2j
2
)−(α+1/2)
. (6.36)
In other words, the net effect of the prescribed hierarchical prior on the signal coefficientsis that of imposing a Student’s t prior distribution on each signal component. The upshotis that, for certain choices of the parameters α and β, the product distribution can bestrongly peaked about zero, similar (in spirit) to the Laplace distribution – see [22] forfurther discussion.
Given the hyperparameters ρ and ρ0, as well as the observation vector y and cor-responding measurement matrix A, the posterior for x is conditionally a multivariateGaussian distribution with mean µ and covariance matrix Σ. Letting R = diag(ρ), andassuming that the matrix
(ρ0A
T A+R)
is full-rank, we have
Σ =(ρ0A
T A+R)−1
, (6.37)
andµ = ρ0ΣAT y. (6.38)
The goal of the inference procedure, then, is to estimate the hyperparameters ρ and ρ0
from the observed data y. From Bayes’ rule, we have that
p(ρ,ρ0|y) ∝ p(y|ρ,ρ0)p(ρ)p(ρ0). (6.39)
Now, following the derivation in [22], we consider improper priors obtained by setting theparameters α,β,γ, and δ all to zero, and rather than seeking a fully specified posteriorfor the hyperparameters we instead obtain point estimates via a maximum likelihoodprocedure. In particular, the maximum likelihood estimates of ρ and ρ0 are obtained bymaximizing
p(y|ρ,ρ0) = (2π)−m/2∣∣∣∣ 1
ρ0Im×m +AR−1AT
∣∣∣∣−1/2
exp
−1
2yT
(1
ρ0Im×m +AR−1AT
)−1
y
. (6.40)

Adaptive sensing for sparse recovery 285
This yields the following update rules:
ρnewj =
1−ρjΣj,j
µ2j
, (6.41)
ρnew0 =
m−∑n
j=1 (1−ρjΣj,j)
‖y−Aµ‖22
. (6.42)
Overall, the inference procedure alternates between solving for ρ0 and ρ as functions ofµ and Σ using (6.41) and (6.42), and solving for µ and Σ as functions of ρ0 and ρ using(6.37) and (6.38).
6.2.2.2 Measurement adaptationAs in the previous section, we may devise a sequential sensing procedure by first for-mulating a criterion under which the next projection vector can be chosen to be themost informative. Let us denote the distribution of x given the first t measurements byp(x). Suppose that the (t + 1)-th measurement is obtained by projecting onto a vec-tor At+1 ∼ Q, and let p(x|y) denote the posterior. Now, the criterion for selecting thedistribution Qt+1 from which the next measurement vector should be drawn is givenby (6.16). As in the previous example, we will simplify the criterion by first restrictingthe space of distributions over which the objective is to be optimized. In this case, wewill consider a space of degenerate distributions. We assume that each Q correspondsto a distribution that takes a deterministic value Q ∈ Rn with probability one, where‖Q‖2 = 1. The goal of the optimization, then, is to determine the “direction” vector Q.
Recall that by construction, given the hyperparameters ρ0 and ρ the signal x is mul-tivariate Gaussian with mean vector µ and covariance matrix Σ as given in (6.38) and(6.37), respectively. The hierarchical prior(s) imposed on the hyperparameters ρ0 and ρ
make it difficult to evaluate H(X|YQ) directly. Instead, we simplify the problem fur-ther by assuming that x is unconditionally Gaussian (i.e., ρ0 and ρ are deterministicand known). In this case the objective function of the information gain criterion can beevaluated directly, and the criterion for selecting the next measurement vector becomes
At+1 = arg minQ∈Rn,‖Q‖2=1
−1
2log
(1+ ρ0QΣQT
), (6.43)
where Σ and ρ0 reflect the knowledge of the parameters up to time t. From this it is imme-diately obvious that At+1 should be in the direction of the eigenvector corresponding tothe largest eigenvalue of the covariance matrix Σ.
As with the simple single-component signal model case described in the previoussection, the focusing rule obtained here also lends itself to some intuitive explanations.Recall that at a given step of the sequential sensing procedure, Σ encapsulates ourknowledge of both our level of uncertainty about which entries of the unknown signalare relevant as well as our current level of uncertainty about the actual componentvalue. In particular, note that under the zero-mean Gaussian prior assumption on thesignal amplitudes, large values of the diagonal entries of R can be understood to implythe existence of a true nonzero signal component at the corresponding location. Thus,

286 Jarvis Haupt and Robert Nowak
the focusing criterion described above suggests that we focus our sensing energy ontolocations at which we are both fairly certain that a signal component is present (asquantified by large entries of the diagonal matrix R), and fairly uncertain about its actualvalue because of the measurement noise (as quantified by the ρ0A
T A term in (6.37)).Further, the relative contribution of each is determined by the level of the additive noiseor, more precisely, our current estimate of it.
6.2.3 Quantifying performance
The adaptive procedures discussed in the previous sections can indeed provide realizableperformance improvements relative to non-adaptive CS methods. It has been shown, viasimulation, that these adaptive sensing procedures can outperform traditional CS innoisy settings. For example, adaptive methods can provide a reduction in mean squarereconstruction error, relative to non-adaptive CS, in situations where each utilizes thesame total number of observations. Similarly, it has been shown that in some settingsadaptive methods can achieve the same error performance as non-adaptive methodsusing a smaller number of measurements. We refer the reader to [19, 21], as well as[23, 24] for extensive empirical results and more detailed performance comparisons ofthese procedures.
A complete analysis of these adaptive sensing procedures would ideally also includean analytical performance evaluation. Unfortunately, it appears to be very difficult todevise quantitative error bounds, like those known for non-adaptive sensing, for Bayesiansequential methods. Because each sensing matrix depends on the data collected in theprevious steps, the overall process is riddled with complicated dependencies that pre-vent the use of the usual approaches to obtain error bounds based, for example, onconcentration of measure and other tools.
In the next section, we present a recently developed alternative to Bayesian sequentialdesign called distilled sensing (DS). In essence, the DS framework encapsulates thespirit of sequential Bayesian methods, but uses a much simpler strategy for exploitingthe information obtained from one sensing step to the next. The result is a powerful, com-putationally efficient procedure that is also amenable to analysis, allowing us to quantifythe dramatic performance improvements that can be achieved through adaptivity.
6.3 Quasi-Bayesian adaptive sensing
In the previous section, the Bayesian approach to adaptive sensing was discussed, andseveral examples were reviewed to show how this approach might be implemented inpractice. The salient aspect of these techniques, in essence, was the use of informationfrom prior measurements to guide the acquisition of subsequent measurements in aneffort to obtain samples that are most informative. This results in sensing actions thatfocus sensing resources toward locations that are more likely to contain signal com-ponents, and away from locations that likely do not. While this notion is intuitively

Adaptive sensing for sparse recovery 287
pleasing, its implementation introduces statistical dependencies that make an analyticaltreatment of the performance of such methods quite difficult.
In this section we discuss a recently developed adaptive sensing procedure calleddistilled sensing (DS) [25] which is motivated by Bayesian adaptive sensing techniques,but also has the added benefit of being amenable to theoretical performance analysis.The DS procedure is quite simple, consisting of a number of iterations, each of which iscomprised of an observation stage followed by a refinement stage. In each observationstage, measurements are obtained at a set of locations which could potentially correspondto nonzero components. In the corresponding refinement stage, the set of locations atwhich observations were collected in the measurement stage is partitioned into twodisjoint sets – one corresponding to locations at which additional measurements are to beobtained in the next iteration, and a second corresponding to locations to subsequentlyignore. This type of adaptive procedure was the basis for the example in Figure 6.1.The refinement strategy utilized in DS is a sort of “poor-man’s Bayesian” methodologyintended to approximate the focusing behavior achieved by methods that employ theinformation gain criterion. The upshot here is that this simple refinement is still quiteeffective at focusing sensing resources toward locations of interest. In this section weexamine the performance guarantees that can be attained using the DS procedure.
For the purposes of comparison, we begin with a brief discussion of the performancelimits for non-adaptive sampling procedures, expanding on the discussion of the denois-ing problem in Section 6.1.1. We then present and discuss the DS procedure in somedetail, and we provide theoretical guarantees on its performance which quantify thegains that can be achieved via adaptivity. In the last subsection we discuss extensions ofDS to underdetermined compressed sensing observation models, and we provide somepreliminary results on that front.
6.3.1 Denoising using non-adaptive measurements
Consider the general problem of recovering a sparse vector x ∈ Rn from its samples.Let us assume that the observations of x are described by the simple model
y = x+ e, (6.44)
where e ∈ Rn represents a vector of additive perturbations, or “noise.” The signal x isassumed to be sparse, and for the purposes of analysis in this section we will assume thatall the non-zero components of x take the same value µ > 0. Even with this restrictionon the form of x, we will see that non-adaptive sensing methods cannot reliably recoversignals unless the amplitude µ is considerably larger than the noise level. Recall thatthe support of x, denoted by S = S(x) = supp(x), is defined to be the set of all indicesat which the vector x has a nonzero component. The sparsity level ‖x‖0 is simply thecardinality of this set, ‖x‖0 = |S|. To quantify the effect of the additive noise, we willsuppose that the entries of e are i.i.d. N (0,1). Our goal will be to perform supportrecovery (also called model selection), or to obtain an accurate estimate of the supportset of x, using the noisy data y. We denote our support estimate by S = S(y).

288 Jarvis Haupt and Robert Nowak
Any estimation procedure based on noisy data is, of course, subject to error. To assessthe quality of a given support estimate S, we define two metrics to quantify the twodifferent types of errors that can occur in this setting. The first type of error correspondsto the case where we declare that nonzero signal components are present at some locationswhere they are not, and we refer to such mistakes as false discoveries. We quantify thenumber of these errors using the false discovery proportion (FDP), defined here as
FDP(S) :=|S\S||S|
, (6.45)
where the notation S\S denotes the set difference. In words, the FDP of S is the ratio ofthe number of components falsely declared as non-zero to the total number of componentsdeclared non-zero. The second type of error occurs when we decide that a particularlocation does not contain a true nonzero signal component when it actually does. Werefer to these errors as non-discoveries, and we quantify them using the non-discoveryproportion (NDP), defined as
NDP(S) :=|S\S||S| . (6.46)
In words, the NDP of S is the ratio of the number of non-zero components missed tothe number of actual non-zero components. For our purposes, we will consider a testingprocedure to be effective if its errors in these two metrics are suitably small.
In contrast to the Bayesian treatments discussed above, here we will assume that x isfixed, but it is otherwise unknown. Recall that by assumption the nonzero componentsof x are assumed to be non-negative. In this case it is natural to focus on a specific typeof estimator for S, which is obtained by applying a simple, coordinate-wise, one-sidedthresholding test to the outcome of each of the observations. In particular, the supportestimate we will consider here is
S = S(y,τ) = j : yj > τ, (6.47)
where τ > 0 is a specified threshold.To quantify the error performance of this estimator, we examine the behavior of the
resulting FDP and NDP for a sequence of estimation problems indexed by the dimensionparameter n. Namely, for each value of n, we consider the estimation procedure appliedto a signal x ∈ Rn having k = k(n) nonzero entries of amplitude µ = µ(n), observedaccording to (6.44). Analyzing the procedure for increasing values of n is a commonapproach to quantify performance in high-dimensional settings, as a function of thecorresponding problem parameters. To that end we consider letting n tend to infinity toidentify a critical value of the signal amplitude µ below which the estimation procedurefails, and above which it succeeds. The result is stated here as a theorem [26, 25].
theorem 6.1 Assume x has n1−β non-zero components of amplitude µ =√
2r logn
for some β ∈ (0,1) and r > 0. If r > β, there exists a coordinate-wise thresholding

Adaptive sensing for sparse recovery 289
procedure with corresponding threshold value τ(n) that yields an estimator S for which
FDP(S)P→ 0 , NDP(S)
P→ 0 , (6.48)
as n →∞, whereP→ denotes convergence in probability. Moreover, if r < β, then there
does not exist a coordinate-wise thresholding procedure that can guarantee that boththe FDP and NDP tend to 0 as n →∞.
This result can be easily extended to settings where the nonzero entries of x areboth positive and negative, and may also have unequal amplitudes. In those cases, ananalogous support estimation procedure can be devised which applies the thresholdtest to the magnitudes of the observations. Thus, Theorem 6.1 can be understood as aformalization of the general statement made in Section 6.1.1 regarding the denoisingproblem. There it was argued, based on simple Gaussian tail bounds, that the conditionµ≈
√2logn was required in order to reliably identify the locations of the relevant signal
components from noisy entry-wise measurements. The above result was obtained using amore sophisticated analysis, though the behavior with respect to the problem dimensionn is the same. In addition, and perhaps more interestingly, Theorem 6.1 also establishesa converse result – that reliable recovery from non-adaptive measurements is impossibleunless µ increases in proportion to
√logn as n gets large. This result gives us a baseline
with which to compare the performance of adaptive sensing, which is discussed in thefollowing section.
6.3.2 Distilled sensing
We begin our discussion of the distilled sensing procedure by introducing a slight gener-alization of the sampling model (6.44). This will facilitate explanation of the procedureand allow for direct comparison with non-adaptive methods. Suppose that we are ableto collect measurements of the components of x in a sequence of T observation steps,according to the model
yt,j = xj +ρ−1/2t,j et,j , j = 1,2, . . . ,n, t = 1,2, . . . ,T, (6.49)
where et,j are i.i.d. N (0,1) noises, t indexes the observation step, and the ρt,j arenon-negative “precision” parameters that can be chosen to modify the noise varianceassociated with a given observation. In other words, the variance of additive noise asso-ciated with observation yt,j is ρ−1
t,j , so larger values of ρt,j correspond to more preciseobservations. Here, we adopt the convention that setting ρt,j = 0 for some pair (t, j)
means that component j is not observed at step t.This multi-step observation model has natural practical realizations. For example, sup-
pose that observations are obtained by measuring at each location one or more times andaveraging the measurements. Then
∑t,j ρt,j expresses a constraint on the total number of
measurements that can be made. This measurement budget can be distributed uniformlyover the locations (as in non-adaptive sensing), or nonuniformly and adaptively. Alter-natively, suppose that each observation is based on a sensing mechanism that integrates

290 Jarvis Haupt and Robert Nowak
over time to reduce noise. The quantity∑
t,j ρt,j , in this case, corresponds to a constrainton the total observation time. In any case, the model encapsulates an inherent flexibilityin the sampling process, in which sensing resources may be preferentially allocated tolocations of interest. Note that, by dividing through by ρt,j > 0, we arrive at an equiv-
alent observation model, yt,j = ρ1/2t,j xj + et,j , which fits the general linear observation
model utilized in the previous sections. Our analysis would proceed similarly in eithercase; we choose to proceed here using the model as stated in (6.49) because of its naturalinterpretation.
To fix the parameters of the problem, and to facilitate comparison with non-adaptivemethods, we will impose a constraint on the overall measurement budget. In partic-ular, we assume that
∑Tt=1
∑nj=1 ρt,j ≤ B(n). In the case T = 1 and ρ1,j = 1 for
j = 1,2, . . . ,n, which corresponds to the choice B(n) = n, the model (6.49) reducesto the canonical non-adaptive observation model (6.44). For our purposes here we willadopt the same measurement budget constraint, B(n) = n.
With this framework in place, we now turn to the description of the DS procedure.To begin, we initialize by selecting the number of observation steps T that are to beperformed. The total measurement budget B(n) is then divided among the T steps sothat a portion Bt is allocated to the tth step, for t = 1,2, . . . ,T , and
∑Tt=1 Bt ≤ B(n).
The set of indices to be measured in the first step is initialized to be the set of allindices, I1 = 1,2, . . . ,n. Now, the portion of the measurement budget B1 desig-nated for the first step is allocated uniformly over the indices to be measured, resultingin the precision allocation ρ1,j = B1/|I1| for j ∈ I1. Noisy observations are col-lected, with the given precision, for each entry j ∈ I1. The set of observations tobe measured in the next step, I2, is obtained by applying a simple threshold test toeach of the observed values. Specifically, we identify the locations to be measuredin the next step as those corresponding to observations that are strictly greater thanzero, giving I2 = j ∈ I1 : yj > 0. This procedure is repeated for each of the T
measurement steps, where (as stated above) the convention ρt,j = 0 implies that thesignal component at location j is not observed in measurement step t. The output ofthe procedure consists of the final set of locations measured, IT , and the observa-tions collected at those locations yT,j , j ∈ IT . The entire process is summarized asAlgorithm 6.1.
A few aspects of the DS procedure are worth further explanation. First, we commenton the apparent simplicity of the refinement step, which identifies the set of locationsto be measured in the subsequent observation step. This simple criterion encapsulatesthe notion that, given that the nonzero signal components are assumed to have positiveamplitude, we expect that their corresponding noisy observation should be non-negativeas well. Interpreting this from a Bayesian perspective, the hard-thresholding selectionoperation encapsulates the idea that the probability of yt,j > 0 given xj =µ and ρt,j > 0 isapproximately equal to one. In reality, using a standard bound on the tail of the Gaussiandistribution, we have that
Pr(yt,j > 0|ρt,j > 0,xj = µ) ≥ 1− exp
(−ρt,jµ
2
2
), (6.50)

Adaptive sensing for sparse recovery 291
Algorithm 6.1 (Distilled sensing)
Input:Number of observation steps T
Resource allocation sequence BtTt=1 satisfying
∑Tt=1 Bt ≤ B(n)
Initialize:Initial index set I1 = 1,2, . . . ,n
Distillation:For t = 1 to T
Allocate resources: ρt,j =
Bt/|It| j ∈ It
0 j /∈ It
Observe: yt,j = xj +ρ
−1/2t,j et,j , j ∈ It
Refine: It+1 = j ∈ It : yt,j > 0End for
Output:Final index set IT
Distilled observations yT = yT,j : j ∈ IT
suggesting that the quality of this approximation may be very good, depending on theparticular values of the signal amplitude µ and the precision parameter for the givenobservation, ρt,j .
Second, as in the simple testing problem described in Section 6.3.1, the DS procedurecan also be extended in a straightforward way to account for signals with both positiveand negative entries. One possible approach would be to further divide the measurementbudget allocation for each step Bt in half, and then perform the whole DS proceduretwice. For the first pass, the procedure is performed as stated in Algorithm 6.1 withthe goal of identifying positive signal components. For the second pass, replacing therefinement criterion by It+1 = i∈ It : yt,j < 0 would enable the procedure to identifythe locations corresponding to negative signal components.
6.3.2.1 Analysis of distilled sensingThe simple adaptive behavior of DS, relative to a fully Bayesian treatment of the problem,renders the procedure amenable to analysis. As in Section 6.3.1, our objects of interesthere will be sparse vectors x ∈ Rn having n1−β nonzero entries, where β ∈ (0,1) is afixed (and typically unknown) parameter. Recall that our goal is to obtain an estimateS of the signal support S, for which the errors as quantified by the False DiscoveryProportion (6.45) and Non-Discovery Proportion (6.46) are simultaneously controlled.The following theorem shows that the DS procedure results in significant improvements

292 Jarvis Haupt and Robert Nowak
over the comparable non-adaptive testing procedure using the same measurement budget[25]. This is achieved by carefully calibrating the problem parameters, i.e., the numberof observation steps T and the measurement budget allocation BtT
t=1.
theorem 6.2 Assume x has n1−β non-zero components, where β ∈ (0,1) is fixed,and that each nonzero entry has amplitude exceeding µ(n). Sample x using the distilledsensing procedure with
• T = T (n) = max log2 logn!,0+2 measurement steps,• measurement budget allocation BtT
t=1 satisfying∑T
t=1 Bt ≤ n, and for which
• Bt+1/Bt ≥ δ > 1/2, and• B1 = c1n and BT = cT n for some c1, cT ∈ (0,1).
If µ(n) → ∞ as a function of n, then the support set estimator constructed using theoutput of the DS algorithm
SDS := j ∈ IT : yT,j >√
2/cT (6.51)
satisfies
FDP(SDS)P→ 0 , NDP(SDS)
P→ 0, (6.52)
as n →∞.
This result can be compared directly to the result of Theorem 6.1, where it was shownthat the errors associated with the estimator obtained from non-adaptive observationswould converge to zero in probability only in the case µ >
√2β logn. In contrast,
the result of Theorem 6.2 states that the same performance metrics can be met for anestimator obtained from adaptive samples, under the much weaker constraint µ(n) →∞. This includes signals whose nonzero components have amplitude on the order ofµ ∼
√log logn, or µ ∼
√log log log · · · logn, in fact, the result holds if µ(n) is any
arbitrarily slowly growing function of n. If we interpret the ratio between the squaredamplitude of the nonzero signal components and the noise variance as the SNR, the resultin Theorem 6.2 establishes that adaptivity can provide an improvement in effective SNRof up to a factor of logn over comparable non-adaptive methods. This improvement canbe very significant in high-dimensional testing problems where n can be in the hundredsor thousands, or more.
Interpreted another way, the result of Theorem 6.2 suggests that adaptivity can dra-matically mitigate the “curse of dimensionality,” in the sense that the error performancefor DS exhibits much less dependence on the ambient signal dimension than does theerror performance for non-adaptive procedures. This effect is demonstrated in finite-sample regimes by the simulation results in Figure 6.5. Each panel of the figure depictsa scatter plot of the FDP and NDP values resulting from 1000 trials of both the adaptiveDS procedure, and the non-adaptive procedure whose performance was quantified inTheorem 6.1. Each trial used a different (randomly selected) threshold value to form thesupport estimate. Panels (a)–(d) correspond to four different values of n: n = 210, 213,

Adaptive sensing for sparse recovery 293
(a) (b)
(c) (d)
0 0.2 0.4 0.6 0.8 10
0.2
0.4
0.6
0.8
1
FDP
ND
P
n=210
0 0.2 0.4 0.6 0.8 10
0.2
0.4
0.6
0.8
1
FDP
ND
P
n=213
0 0.2 0.4 0.6 0.8 10
0.2
0.4
0.6
0.8
1
FDP
ND
P
n=216
0 0.2 0.4 0.6 0.8 10
0.2
0.4
0.6
0.8
1
FDP
ND
P
n=219
Figure 6.5 The curse of dimensionality and the virtue of adaptivity. Each panel depicts a scatter plot of FDPand NDP values resulting for non-adaptive sensing (•) and the adaptive DS procedure (∗). Notonly does DS outperform the non-adaptive method, it exhibits much less dependence on theambient dimension.
216, and 219, respectively. In all cases, the signals being estimated have 128 nonzeroentries of amplitude µ, and the SNR is fixed by the selection µ2 = 8. For each value of n,the measurement budget allocation parameters Bt were chosen so that Bt+1 = 0.75Bt
for t = 1, . . . ,T − 2, B1 = BT , and∑T
t=1 Bt = n. Comparing the results across panels,we see that the error performance of the non-adaptive procedure degrades significantlyas a function of the ambient dimension, while the error performance of DS is largelyunchanged across 9 orders of magnitude. This demonstrates the effectiveness of DS foracquiring high-precision observations primarily at the signal locations of interest.
The analysis of the DS procedure relies inherently upon two key ideas pertainingto the action of the refinement step(s) at each iteration. First, for any iteration of theprocedure, observations collected at locations where no signal component is present willbe independent samples of a zero-mean Gaussian noise process. Despite the fact thatthe variance of the measured noise will depend on the allocation of sensing resources,the symmetry of the Gaussian distribution ensures that the value obtained for each such
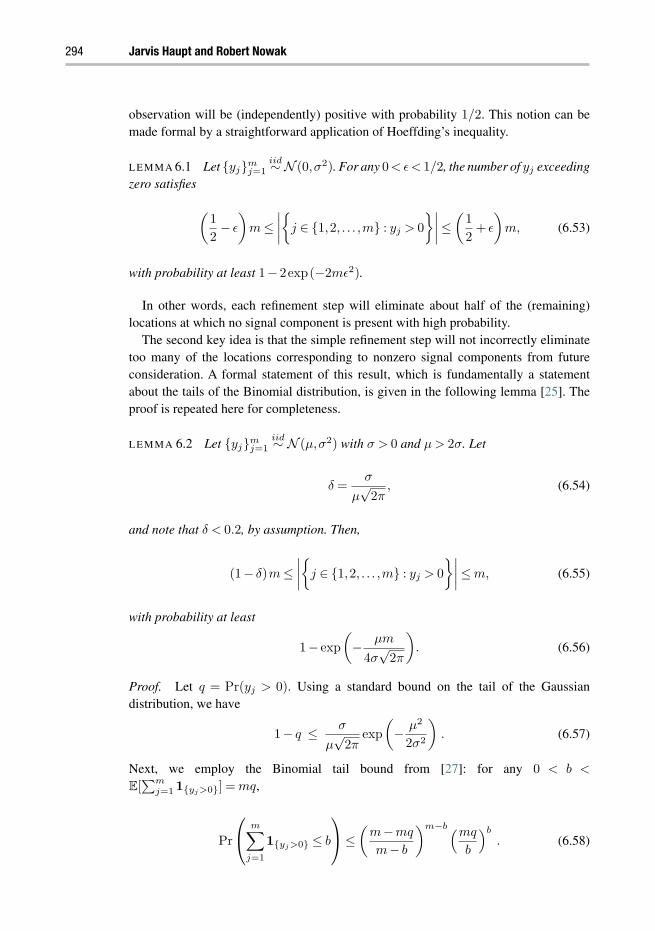
294 Jarvis Haupt and Robert Nowak
observation will be (independently) positive with probability 1/2. This notion can bemade formal by a straightforward application of Hoeffding’s inequality.
lemma 6.1 Let yjmj=1
iid∼ N (0,σ2). For any 0<ε< 1/2, the number of yj exceedingzero satisfies
(1
2− ε
)m ≤
∣∣∣∣j ∈ 1,2, . . . ,m : yj > 0
∣∣∣∣≤(1
2+ ε
)m, (6.53)
with probability at least 1− 2exp(−2mε2).
In other words, each refinement step will eliminate about half of the (remaining)locations at which no signal component is present with high probability.
The second key idea is that the simple refinement step will not incorrectly eliminatetoo many of the locations corresponding to nonzero signal components from futureconsideration. A formal statement of this result, which is fundamentally a statementabout the tails of the Binomial distribution, is given in the following lemma [25]. Theproof is repeated here for completeness.
lemma 6.2 Let yjmj=1
iid∼ N (µ,σ2) with σ > 0 and µ > 2σ. Let
δ =σ
µ√
2π, (6.54)
and note that δ < 0.2, by assumption. Then,
(1− δ)m ≤∣∣∣∣j ∈ 1,2, . . . ,m : yj > 0
∣∣∣∣≤ m, (6.55)
with probability at least
1− exp
(− µm
4σ√
2π
). (6.56)
Proof. Let q = Pr(yj > 0). Using a standard bound on the tail of the Gaussiandistribution, we have
1− q ≤ σ
µ√
2πexp
(− µ2
2σ2
). (6.57)
Next, we employ the Binomial tail bound from [27]: for any 0 < b <
E[∑m
j=11yj>0] = mq,
Pr
m∑j=1
1yj>0 ≤ b
≤(
m−mq
m− b
)m−b(mq
b
)b
. (6.58)

Adaptive sensing for sparse recovery 295
Note that δ > 1−q (or equivalently, 1−δ < q), so we can apply the Binomial tail boundto the sum
∑mj=11yj>0 with b = (1− δ)m to obtain
Pr
m∑j=1
1yj>0 ≤ (1− δ)m
≤(
1− q
δ
)δm(q
1− δ
)(1−δ)m
(6.59)
≤ exp
(−µ2δm
2σ2
)(1
1− δ
)(1−δ)m
. (6.60)
Now, to establish the stated result, it suffices to show that
exp
(−µ2δm
2σ2
)(1
1− δ
)(1−δ)m
≤ exp
(− µm
4σ√
2π
). (6.61)
Taking logarithms and dividing through by δm, the condition to establish becomes
− µ2
2σ2 +
(1− δ
δ
)log
(1
1− δ
)≤− µ
4δσ√
2π
= − µ2
4σ2 , (6.62)
where the last equality follows from the definition of δ. The bound holds provided µ≥ 2σ,since 0 < δ < 1 and (
1− δ
δ
)log
(1
1− δ
)≤ 1 (6.63)
for δ ∈ (0,1).
Overall, the analysis of the DS procedure entails the repeated application of thesetwo lemmas across iterations of the procedure. Note that the result in Lemma 6.1 isindependent of the noise power, while the parameter δ in Lemma 6.2 is a function ofboth the signal amplitude and the observation noise variance. The latter is a function ofhow the sensing resources are allocated to each iteration and how many locations arebeing measured in that step. In other words, statistical dependencies are present acrossiterations with this procedure, as in the case of the Bayesian methods described above.However, unlike in the Bayesian methods, here the dependencies can be tolerated in astraightforward manner by conditioning on the output of the previous iterations of theprocedure.
Rather than presenting the full details of the proof here, we instead provide a shortsketch of the general idea. To clarify the exposition, we will find it useful to fix someadditional notation. First, we let St = |S ∩It| be the number of locations correspondingto nonzero signal components that are to be observed in step t. Similarly, let Nt =
|Sc ∩It| = |It| −St denote the number of remaining locations that are to be measuredin the tth iteration. Let σ1 =
√|I1|/B1 denote the standard deviation of the observation
noise in the first iteration, and let δ1 be the corresponding quantity from Lemma 6.2

296 Jarvis Haupt and Robert Nowak
described in terms of the quantity σ1. Notice that since the quantity |I1| is fixed andknown, the quantities σ1 and δ1 are deterministic.
Employing Lemmas 6.1 and 6.2, we determine that the result of the refinement stepin the first iteration is that for any 0 < ε < 1/2, the bounds (1− δ1)S1 ≤ S2 ≤ S1 and(1/2− ε)N1 ≤N2 ≤ (1/2+ ε)N1 hold simultaneously, except in an event of probabilityno greater than
2exp(−2N1ε2)+ exp
(− µS1
4σ1√
2π
). (6.64)
To evaluate the outcome of the second iteration, we condition on the event that the boundson S2 and N2 stated above hold. In this case, we can obtain bounds on the quantity I2 =
S2 +N2, which in turn imply an upper bound on the variance of the observation noisein the second iteration. Let σ2 denote such a bound, and δ2 its corresponding quantityfrom Lemma 6.2. Following the second iteration step, we have that the bounds (1− δ1)
(1− δ2)S1 ≤ S3 ≤ S1 and (1/2− ε)2N1 ≤ N3 ≤ (1/2+ ε)
2N1 hold simultaneously,
except in an event of probability no greater than
2exp(−2N1ε2)+ exp
(− µS1
4σ1√
2π
)+ (6.65)
2exp(−2(1− ε)N1ε2)+ exp
(−µ(1− δ1)S1
4σ2√
2π
). (6.66)
The analysis proceeds in this fashion, by iterated applications of Lemmas 6.1 and6.2 conditioned on the outcome of all previous refinement steps. The end result is astatement quantifying the probability that the bounds
∏T−1t=1 (1− δt)S1 ≤ ST ≤ S1 and
(1/2− ε)T−1
N1 ≤ Ns ≤ (1/2+ ε)T−1
N1 hold simultaneously following the refine-ment step in the (T −1)-th iteration, prior to the T th observation step. It follows that thefinal testing problem is equivalent in structure to a general testing problem of the formconsidered in Section 6.1.1, but with a different effective observation noise variance.The final portion of the proof of Theorem 6.2 entails a careful balancing between thedesign of the resource allocation strategy, the number of observation steps T , and thespecification of the parameter ε. The goal is to ensure that as n →∞ the stated boundson ST and NT are valid with probability tending to one, the fraction of signal compo-nents missed throughout the refinement process tends to zero, and the effective varianceof the observation noise for the final set of observations is small enough to enable thesuccessful testing of signals with very weak features. The full details can be foundin [25].
6.3.3 Distillation in compressed sensing
While the results above demonstrate that adaptivity in sampling can provide a tremen-dous improvement in effective measurement SNR in certain sparse recovery problems,the benefits of adaptivity are somewhat less clear with respect to the other problemparameters. In particular, the comparison outlined above was made on the basis thateach procedure was afforded the same measurement budget, as quantified by a global

Adaptive sensing for sparse recovery 297
quantity having a natural interpretation in the context of a total sample budget or a totaltime constraint. Another basis for comparison would be the total number of measure-ments collected with each procedure. In the non-adaptive method in Section 6.3.1, a totalof n measurements were collected (one per signal component). In contrast, the numberof measurements obtained via the DS procedure is necessarily larger, since each com-ponent is directly measured at least once, and some components may be measured up toa total of T times – once for each iteration of the procedure. Strictly speaking, the totalnumber of measurements collected during the DS procedure is a random quantity whichdepends implicitly on the outcome of the refinements at each step, which in turn arefunctions of the noisy measurements. However, our high-level intuition regarding thebehavior of the procedure allows us to make some illustrative approximations. Recallthat each refinement step eliminates (on average) about half of the locations at which nosignal component is present. Further, under the sparsity level assumed in our analysis,the signals being observed are vanishingly sparse – that is, the fraction of locations ofx corresponding to non-zero components tends to zero as n → ∞. Thus, for large n,the number of measurements collected in the tth step of the DS procedure is approxi-mately given by n ·2−(t−1), which implies (upon summing over t) that the DS procedurerequires on the order of 2n total measurements.
By this analysis, the SNR benefits of adaptivity come at the expense of a (modest)relative increase in the number of measurements collected. Motivated by this comparison,it is natural to ask whether the distilled sensing approach might also be extended tothe so-called underdetermined observation settings, such as those found in standardcompressed sensing (CS) problems. In addition, and perhaps more importantly, can ananalysis framework similar to that employed for DS be used to obtain performanceguarantees for adaptive CS procedures? We will address these questions here, beginningwith a discussion of how the DS procedure might be applied in CS settings.
At a high level, the primary implementation differences relative to the original DSprocedure result from the change in observation model. Recall that, for ρt,j > 0, theobservation model (6.49) from the previous section could alternatively be written as
yt,j = ρ1/2t,j xj + et,j , j = 1,2, . . . ,n, t = 1,2, . . . ,T, (6.67)
subject to a global constraint on∑
t,j ρt,j . Under this alternative formulation, the overallsampling process can be effectively described using the matrix-vector formulation y =
Ax+e where A is a matrix whose entries are either zero (at times and locations where nomeasurements were obtained) or equal to some particular ρ
1/2t,j . The first point we address
relates to the specification of the sampling or measurement budget. In this setting, wecan interpret our budget of measurement resources in terms of the matrix A, in a naturalway. Recall that in our original formulation, the constraint was imposed on the quantity∑
t,j ρt,j . Under the matrix-vector formulation, this translates directly to a constraint onthe sum of the squared entries of A. Thus, we can generalize the measurement budgetconstraint to the current setting by imposing a condition on the Frobenius norm of A.To account for the possibly random nature of the sensing matrix (as in traditional CS
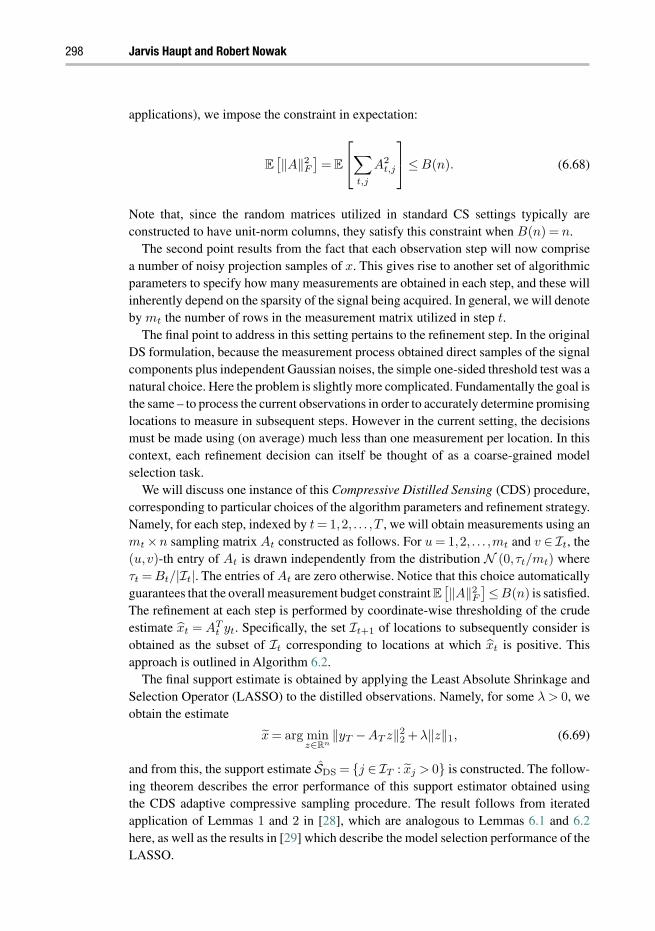
298 Jarvis Haupt and Robert Nowak
applications), we impose the constraint in expectation:
E[‖A‖2
F
]= E
∑t,j
A2t,j
≤ B(n). (6.68)
Note that, since the random matrices utilized in standard CS settings typically areconstructed to have unit-norm columns, they satisfy this constraint when B(n) = n.
The second point results from the fact that each observation step will now comprisea number of noisy projection samples of x. This gives rise to another set of algorithmicparameters to specify how many measurements are obtained in each step, and these willinherently depend on the sparsity of the signal being acquired. In general, we will denoteby mt the number of rows in the measurement matrix utilized in step t.
The final point to address in this setting pertains to the refinement step. In the originalDS formulation, because the measurement process obtained direct samples of the signalcomponents plus independent Gaussian noises, the simple one-sided threshold test was anatural choice. Here the problem is slightly more complicated. Fundamentally the goal isthe same – to process the current observations in order to accurately determine promisinglocations to measure in subsequent steps. However in the current setting, the decisionsmust be made using (on average) much less than one measurement per location. In thiscontext, each refinement decision can itself be thought of as a coarse-grained modelselection task.
We will discuss one instance of this Compressive Distilled Sensing (CDS) procedure,corresponding to particular choices of the algorithm parameters and refinement strategy.Namely, for each step, indexed by t = 1,2, . . . ,T , we will obtain measurements using anmt ×n sampling matrix At constructed as follows. For u = 1,2, . . . ,mt and v ∈ It, the(u,v)-th entry of At is drawn independently from the distribution N (0, τt/mt) whereτt = Bt/|It|. The entries of At are zero otherwise. Notice that this choice automaticallyguarantees that the overall measurement budget constraint E
[‖A‖2
F
]≤B(n) is satisfied.
The refinement at each step is performed by coordinate-wise thresholding of the crudeestimate xt = AT
t yt. Specifically, the set It+1 of locations to subsequently consider isobtained as the subset of It corresponding to locations at which xt is positive. Thisapproach is outlined in Algorithm 6.2.
The final support estimate is obtained by applying the Least Absolute Shrinkage andSelection Operator (LASSO) to the distilled observations. Namely, for some λ > 0, weobtain the estimate
x = arg minz∈Rn
‖yT −AT z‖22 +λ‖z‖1, (6.69)
and from this, the support estimate SDS = j ∈ IT : xj > 0 is constructed. The follow-ing theorem describes the error performance of this support estimator obtained usingthe CDS adaptive compressive sampling procedure. The result follows from iteratedapplication of Lemmas 1 and 2 in [28], which are analogous to Lemmas 6.1 and 6.2here, as well as the results in [29] which describe the model selection performance of theLASSO.
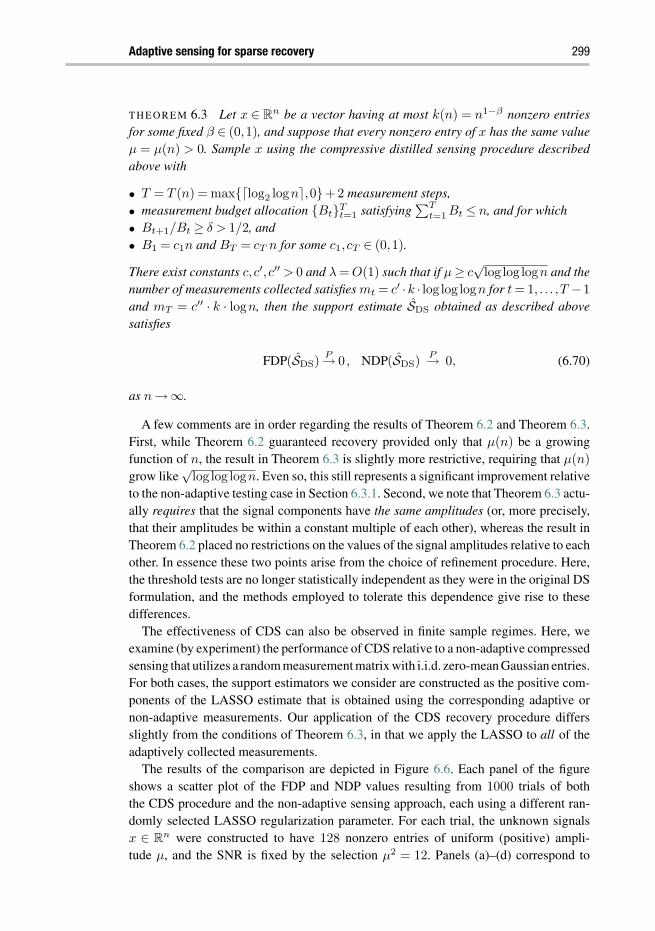
Adaptive sensing for sparse recovery 299
theorem 6.3 Let x ∈ Rn be a vector having at most k(n) = n1−β nonzero entriesfor some fixed β ∈ (0,1), and suppose that every nonzero entry of x has the same valueµ = µ(n) > 0. Sample x using the compressive distilled sensing procedure describedabove with
• T = T (n) = max log2 logn!,0+2 measurement steps,• measurement budget allocation BtT
t=1 satisfying∑T
t=1 Bt ≤ n, and for which• Bt+1/Bt ≥ δ > 1/2, and• B1 = c1n and BT = cT n for some c1, cT ∈ (0,1).
There exist constants c,c′, c′′ > 0 and λ = O(1) such that if µ ≥ c√
log log logn and thenumber of measurements collected satisfies mt = c′ ·k · log log logn for t = 1, . . . ,T −1
and mT = c′′ · k · logn, then the support estimate SDS obtained as described abovesatisfies
FDP(SDS)P→ 0 , NDP(SDS)
P→ 0, (6.70)
as n →∞.
A few comments are in order regarding the results of Theorem 6.2 and Theorem 6.3.First, while Theorem 6.2 guaranteed recovery provided only that µ(n) be a growingfunction of n, the result in Theorem 6.3 is slightly more restrictive, requiring that µ(n)
grow like√
log log logn. Even so, this still represents a significant improvement relativeto the non-adaptive testing case in Section 6.3.1. Second, we note that Theorem 6.3 actu-ally requires that the signal components have the same amplitudes (or, more precisely,that their amplitudes be within a constant multiple of each other), whereas the result inTheorem 6.2 placed no restrictions on the values of the signal amplitudes relative to eachother. In essence these two points arise from the choice of refinement procedure. Here,the threshold tests are no longer statistically independent as they were in the original DSformulation, and the methods employed to tolerate this dependence give rise to thesedifferences.
The effectiveness of CDS can also be observed in finite sample regimes. Here, weexamine (by experiment) the performance of CDS relative to a non-adaptive compressedsensing that utilizes a random measurement matrix with i.i.d. zero-mean Gaussian entries.For both cases, the support estimators we consider are constructed as the positive com-ponents of the LASSO estimate that is obtained using the corresponding adaptive ornon-adaptive measurements. Our application of the CDS recovery procedure differsslightly from the conditions of Theorem 6.3, in that we apply the LASSO to all of theadaptively collected measurements.
The results of the comparison are depicted in Figure 6.6. Each panel of the figureshows a scatter plot of the FDP and NDP values resulting from 1000 trials of boththe CDS procedure and the non-adaptive sensing approach, each using a different ran-domly selected LASSO regularization parameter. For each trial, the unknown signalsx ∈ Rn were constructed to have 128 nonzero entries of uniform (positive) ampli-tude µ, and the SNR is fixed by the selection µ2 = 12. Panels (a)–(d) correspond to
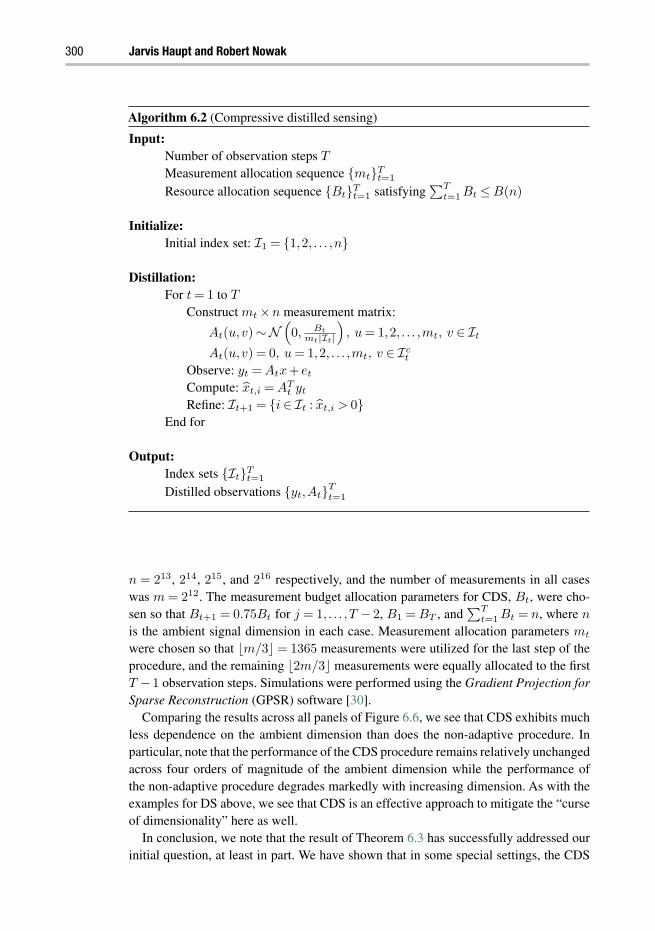
300 Jarvis Haupt and Robert Nowak
Algorithm 6.2 (Compressive distilled sensing)
Input:Number of observation steps T
Measurement allocation sequence mtTt=1
Resource allocation sequence BtTt=1 satisfying
∑Tt=1 Bt ≤ B(n)
Initialize:Initial index set: I1 = 1,2, . . . ,n
Distillation:For t = 1 to T
Construct mt ×n measurement matrix:
At(u,v) ∼N(0, Bt
mt|It|
), u = 1,2, . . . ,mt, v ∈ It
At(u,v) = 0, u = 1,2, . . . ,mt, v ∈ Ict
Observe: yt = Atx+ et
Compute: xt,i = ATt yt
Refine: It+1 = i ∈ It : xt,i > 0End for
Output:Index sets ItT
t=1
Distilled observations yt,AtTt=1
n = 213, 214, 215, and 216 respectively, and the number of measurements in all caseswas m = 212. The measurement budget allocation parameters for CDS, Bt, were cho-sen so that Bt+1 = 0.75Bt for j = 1, . . . ,T − 2, B1 = BT , and
∑Tt=1 Bt = n, where n
is the ambient signal dimension in each case. Measurement allocation parameters mt
were chosen so that m/3 = 1365 measurements were utilized for the last step of theprocedure, and the remaining 2m/3 measurements were equally allocated to the firstT −1 observation steps. Simulations were performed using the Gradient Projection forSparse Reconstruction (GPSR) software [30].
Comparing the results across all panels of Figure 6.6, we see that CDS exhibits muchless dependence on the ambient dimension than does the non-adaptive procedure. Inparticular, note that the performance of the CDS procedure remains relatively unchangedacross four orders of magnitude of the ambient dimension while the performance ofthe non-adaptive procedure degrades markedly with increasing dimension. As with theexamples for DS above, we see that CDS is an effective approach to mitigate the “curseof dimensionality” here as well.
In conclusion, we note that the result of Theorem 6.3 has successfully addressed ourinitial question, at least in part. We have shown that in some special settings, the CDS

Adaptive sensing for sparse recovery 301
0 0.2 0.4 0.6 0.8 10
0.2
0.4
0.6
0.8
1
FDP
ND
P
n=213
(a)
0 0.2 0.4 0.6 0.8 10
0.2
0.4
0.6
0.8
1
FDP
ND
P
n=214
(b)
0 0.2 0.4 0.6 0.8 10
0.2
0.4
0.6
0.8
1
FDP
ND
P
n=215
(c)
0 0.2 0.4 0.6 0.8 10
0.2
0.4
0.6
0.8
1
FDP
ND
P
n=216
(d)
Figure 6.6 Adaptivity in compressed sensing. Each panel depicts a scatter plot of FDP and NDP valuesresulting for non-adaptive CS (•) and the adaptive CDS procedure (∗).
procedure can achieve similar performance to the DS procedure but using many fewertotal measurements. In particular, the total number of measurements required to obtainthe result in Theorem 6.3 is m = O(k · log log logn · log logn + k logn) = O(k logn),while the result of Theorem 6.2 required O(n) total measurements. The discussion in thissection demonstrates that it is possible to obtain the benefits of both adaptive samplingand compressed sensing. This is a significant step toward a full understanding of thebenefits of adaptivity in CS.
6.4 Related work and suggestions for further reading
Adaptive sensing methods for high-dimensional inference problems are becomingincreasingly common in many modern applications of interest, primarily due to the con-tinuing tremendous growth of our acquisition, storage, and computational abilities. Forinstance, multiple testing and denoising procedures are an integral component of manymodern bioinformatics applications (see [31] and the references therein), and sequential

302 Jarvis Haupt and Robert Nowak
acquisition techniques similar in spirit to those discussed here are becoming quite pop-ular in this domain. In particular, two-stage testing approaches in gene association andexpression studies were examined in [32, 33, 34]. Those works described procedureswhere a large number of genes is initially tested to identify a promising subset, which isthen examined more closely in a second stage. Extensions to multi-stage approaches werediscussed in [35]. Two-stage sequential sampling techniques have also been examinedrecently in the signal processing literature. In [36], two-stage target detection procedureswere examined, and a follow-on work examined a Bayesian approach for incorporatingprior information into such two-step detection procedures [37].
The problem of target detection and localization from sequential compressive mea-surements was recently examined in [38]. That work examined a multi-step binarybisection procedure to identify signal components from noisy projection measurements,and provided bounds for its sample complexity. Similar adaptive compressive sens-ing techniques based on binary bisection were examined in [39]. In [40], an adaptivecompressive sampling method for acquiring wavelet-sparse signals was proposed. Lever-aging the inherent tree structure often present in the wavelet decompositions of naturalimages, that work discussed a procedure where the sensing action is guided by the pres-ence (or absence) of significant features at a given scale to determine which coefficientsto acquire at finer scales.
Finally, we note that sequential experimental design continues to be popular in otherfields as well, such as in computer vision and machine learning. We refer the reader to thesurvey article [41] as well as [42, 43] and the references therein for further informationon active vision and active learning.
References
[1] M. R. Leadbetter, G. Lindgren, and H. Rootzen, Extremes and Related Properties of RandomSequences and Processes. Springer-Verlag; 1983.
[2] D. Donoho. Compressed sensing. IEEE Trans Inform Theory, 52(4):1289–1306, 2006.[3] E. Candés and T. Tao. Near optimal signal recovery from random projections: Universal
encoding strategies? IEEE Trans Information Theory, 52(12):5406–5425, 2006.[4] R. Baraniuk, M. Davenport, R. DeVore, and M. Wakin. A simple proof of the restricted
isometry property for random matrices. Construc Approx, 28(3):253–263, 2008.[5] E. Candés. The restricted isometry property and its implications for compressed sensing. C
Re l’Acad Scie Paris, 346:589–592, 2008.[6] E. Candés and Y. Plan. Near-ideal model selection by 1 minimization. Ann Stat,
37(5A):2145–2177, 2009.[7] J. Haupt and R. Nowak. Signal reconstruction from noisy random projections. IEEE Trans
Information Theory, 52(9):4036–4048, 2006.[8] M. Crouse, R. Nowak, and R. Baraniuk. Wavelet-based statistical signal processing using
hidden Markov models. IEEE Trans Sig Proc, 46(4):886–902, 1998.[9] G. Jacobson. Space-efficient static trees and graphs. Proc 30th Ann Symp Found Comp. Sci.
549–554, 1989.[10] J. Huang, T. Zhang, and D. Metaxas. Learning with structured sparsity. In: ICML ’09: Proc
26th Ann Int Conf Machine Learning. New York: ACM, 417–424, 2009.

Adaptive sensing for sparse recovery 303
[11] Y. C. Eldar and M. Mishali. Robust recovery of signals from a structured union of subspaces.IEEE Trans Information Theory, 55(11):5302–5316, 2009.
[12] R. Baraniuk, V. Cevher, M. Duarte, and C. Hedge. Model-based compressive sensing. IEEETrans Information Theory, 56(4):1982–2001, 2010.
[13] Y. C. Eldar, P. Kuppinger, and H. Bolcskei. Block-sparse signals: Uncertainty relations andefficient recovery. IEEE Trans Sig Proc, 58(6):3042–3054, 2010.
[14] M. Mishali and Y. C. Eldar. From theory to practice: Sub-Nyquist sampling of sparsewideband analog signals. IEEE J Sel Topics Sig Proc 4(2):375–391, 2010.
[15] M. Seeger. Bayesian inference and optimal design in the sparse linear model. J MachineLearning Res 9:759–813, 2008.
[16] M. Seeger, H. Nickisch, R. Pohmann, and B. Schölkopf. Optimization of k-Space trajectoriesfor compressed sensing by Bayesian experimental design. Magn Res Med, 63:116–126,2009.
[17] DeGroot, M. Uncertainty, information, and sequential experiments. Ann Math Stat,33(2):404–419, 1962.
[18] D. Lindley. On the measure of the information provided by an experiment. Ann Math Stat,27(4):986–1005, 1956.
[19] R. Castro, J. Haupt, R. Nowak, and G. Raz. Finding needles in noisy haystacks. Proc IEEEInt Conf Acoust, Speech, Sig Proc, Las Vegas, NV, pp. 5133–5136, 2008.
[20] T. Cover and J. Thomas. Elements of Information Theory. 2nd edn. Wiley, 2006.[21] S. Ji, Y. Xue, and L. Carin. Bayesian compressive sensing. IEEE Trans Signal Proc
56(6):2346–2356, 2008.[22] M. Tipping. Sparse Bayesian learning and the relevance vector machine. J Machine Learning
Res, 1:211–244, 2001.[23] M. Seeger. Bayesian inference and optimal design for the sparse linear model. J Machine
Learning Res, 9:759–813, 2008.[24] M. Seeger and H. Nickisch. Compressed sensing and Bayesian experimental design. In Proc
Int Conf Machine Learning. Helsinki, Finland, 2008.[25] J. Haupt, R. Castro, and R. Nowak. Distilled sensing: Adaptive sampling for sparse detection
and estimation. IEEF Trans Inform Theory, 57(9):6222–6235, 2011.[26] D. Donoho and J. Jin. Higher criticism for detecting sparse heterogeneous mixtures. Ann Stat
32(3):962–994, 2004.[27] H. Chernoff. A measure of asymptotic efficiency for tests of a hypothesis based on the sum
of observations. Ann Stat, 23(4):493–507, 1952.[28] J. Haupt, R. Baraniuk, R. Castro, and R. Nowak. Compressive distilled sensing: Sparse
recovery using adaptivity in compressive measurements. Proc 43rd Asilomar Conf Sig, Syst,Computers. Pacific Grove, CA, pp. 1551–1555, 2009.
[29] M. Wainwright. Sharp thresholds for high-dimensional and noisy sparsity pattern recov-ery using 1 constrained quadratic programming (Lasso). IEEE Trans Inform Theory,55(5):2183–2202, 2009.
[30] M. A. T. Figueiredo, R. D. Nowak, and S. J. Wright. Gradient projection for sparsereconstruction. IEEE J Sel Topics Sig Proc, 1(4):586–597, 2007.
[31] S. Dudoit and M. van der Laan. Multiple Testing Procedures with Applications to Genomics.Springer Series in Statistics. Springer, 2008.
[32] H. H. Muller, R. Pahl, and H. Schafer. Including sampling and phenotyping costs into theoptimization of two stage designs for genomewide association studies. Genet Epidemiol,31(8):844–852, 2007.

304 Jarvis Haupt and Robert Nowak
[33] S. Zehetmayer, P. Bauer, and M. Posch. Two-stage designs for experiments with large numberof hypotheses. Bioinformatics, 21(19):3771–3777, 2005.
[34] J. Satagopan and R. Elston. Optimal two-stage genotyping in population-based associationstudies. Genet Epidemiol, 25(2):149–157, 2003.
[35] S. Zehetmayer, P. Bauer, and M. Posch. Optimized multi-stage designs controlling the falsediscovery or the family-wise error rate. Stat Med, 27(21):4145–4160, 2008.
[36] E. Bashan, R. Raich, and A. Hero. Optimal two-stage search for sparse targets using convexcriteria. IEEE Trans Sig Proc, 56(11):5389–5402, 2008.
[37] G. Newstadt, E. Bashan, and A. Hero. Adaptive search for sparse targets with informativepriors. In: Proc. Int Conf Acoust, Speech, Sig Proc. Dallas, TX, 3542–3545, 2010.
[38] M. Iwen and A. Tewfik. Adaptive group testing strategies for target detection and localizationin noisy environments. Submitted. 2010 June.
[39] A. Aldroubi, H. Wang, and K. Zarringhalam. Sequential adaptive compressed sampling viaHuffman codes. Preprint, http://arxiv.org/abs/0810.4916v2, 2009.
[40] S. Deutsch,A.Averbuch, and S. Dekel.Adaptive compressed image sensing based on waveletmodeling and direct sampling. Proc. 8th Int Conf Sampling Theory Appli, Marseille, France,2009.
[41] Various authors. Promising directions in active vision. Int J Computer Vision, 11(2):109–126,1991.
[42] D. Cohn. Neural network exploration using optimal experiment design. Adv NeuralInformation Proc Syst (NIPS), 679–686, 1994.
[43] D. Cohn, Z. Ghahramani, and M. Jordan. Active learning with statistical models. J ArtifIntelligence Res, 4:129–145, 1996.

7 Fundamental thresholds incompressed sensing:a high-dimensional geometryapproachWeiyu Xu and Babak Hassibi
In this chapter, we introduce a unified high-dimensional geometric framework for ana-lyzing the phase transition phenomenon of 1 minimization in compressive sensing. Thisframework connects studying the phase transitions of 1 minimization with computingthe Grassmann angles in high-dimensional convex geometry. We demonstrate the broadapplications of this Grassmann angle framework by giving sharp phase transitions for 1minimization recovery robustness, weighted 1 minimization algorithms, and iterativereweighted 1 minimization algorithms.
7.1 Introduction
Compressive sensing is an area of signal processing which has attracted a lot of recentattention for its broad applications and rich mathematical background [7] [19] andChapter 1. In compressive sensing, we would like to recover an n× 1 real-numberedsignal vector x, but we can only get m < n measurement samples through a linear mixingof x. Namely
y = Ax, (7.1)
where A is an m × n measurement matrix and y is an m × 1 measurement result. Inan ideal model for compressive sensing, x is an n× 1 unknown k-sparse signal vector,which is defined as a vector having only k nonzero elements. This special structure of x
makes recovering x from the compressed measurement y possible.A naive way to decode or solve for the k-sparse x from y is to enumerate the
(nk
)pos-
sible supports of x and then try to see whether there exists such an x satisfying y = Ax.But this is of exponential complexity if k is proportionally growing with n and is notcomputationally feasible. What enables practical compressive sensing is the existence of
Compressed Sensing: Theory and Applications, ed. Yonina C. Eldar and Gitta Kutyniok. Published byCambridge University Press. © Cambridge University Press 2012.

306 Weiyu Xu and Babak Hassibi
efficient decoding algorithms to recover the sparse signal x from the compressed mea-surements y. Arguably the most prominent and powerful decoding approach is the BasisPursuit programming, namely the 1 minimization method [13, 15]. The 1 minimizationmethod solves the following problem
min‖z‖1
subject to y = Az, (7.2)
where ‖z‖1 denotes the 1 norm of z, namely the sum of the absolute values of all theelements in z. This is a convex program which is easy to solve. It has been empiricallyobserved to work very well in producing sparse solutions. Breakthroughs, for exam-ple, [11][15][20], in understanding why 1 minimization successfully promotes sparsityhave emerged in recent years, and have triggered an explosive growth of research incompressive sensing, see Chapter 1.
We should remark that in this chapter we are particularly interested in the parameterregime where k and m grow proportionally with n, as n grows large. In other words,the number of measurements is m = δn, and the number of nonzero elements of x isk = ρδn = ζn, where 0 < ρ < 1 and 0 < δ < 1 are constants independent of n, and δ > ζ.
It has been empirically observed and theoretically shown [15, 20] that the 1 minimiza-tion method often exhibits a “phase transition” phenomenon: when the signal supportsize is below a certain threshold, 1 minimization will recover the signal vector withoverwhelming probability; while when the signal support size is above this threshold,1 minimization will fail to recover the signal vector with high probability. Studyingthis phase transition phenomenon and characterizing the threshold for the support sizek has been a very important and active research branch in the development of com-pressive sensing theories [15, 20] [4] [29, 43, 44] [28, 40, 45, 46][21, 38, 39] [34, 36][16, 17] and Chapter 9. This branch of research gives precise prediction of sparse recov-ery algorithms, brings theoretical rigor to compressive sensing theories, and inspiresnew powerful sparse recovery algorithms.
The first work in the literature that precisely and rigorously characterized thephase transition was [15, 20], through beautifully connecting the projection of high-dimensional convex polytopes and the success of 1 minimization. In [15, 20], Donohoand Tanner formulated a k-neighborly polytope condition on the measurement matrixA for 1 minimization to generate the original sparse signal. As shown in [15], thisk-neighborly polytope A is in fact a necessary and sufficient condition for (7.2) to pro-duce the sparse solution x satisfying (7.1). This geometric insight, together with knownresults on the neighborliness of projected polytopes in the literature of convex geometry[1, 41], has led to sharp bounds on the performance of 1 minimization. In [15], it wasshown that if the matrix A has i.i.d. zero-mean Gaussian entries, then the k-neighborlypolytope condition holds with overwhelming probability if k is sufficiently small. In thelinear scaling setting for m, n, and k discussed in this chapter, the relation between m,n, and k in order for the k-neighborly polytope condition to hold is precisely character-ized and calculated in [15]. In fact, the computed values of ζ for the so-called “weak”

Fundamental thresholds in compressed sensing 307
threshold, obtained for different values of δ through the neighborly polytope conditionin [15], match exactly with the phase transitions obtained by simulation when n is large.
However, the neighborly polytope approach in [15] only addressed the phase transi-tions for ideally sparse signal vectors whose residual elements are exactly zero excludingthe k nonzero components. By comparison, the popular restricted isometry property(RIP) [11][4] and Chapter 1 can also be used to analyze the robustness of 1 minimiza-tion [10], even though the RIP analysis generally produces much looser phase transitionresults than the neighborly polytope condition [4]. Then the question is whether we canhave a unified method of determining precise phase transitions for 1 minimization inbroader applications. More specifically, this method should give us tighter phase tran-sitions for 1 minimization than the RIP condition; but it should also work in derivingphase transitions in more general settings such as:
• phase transitions for recovering approximately sparse signals, instead of only perfectlysparse ones [43];
• phase transitions when the compressed observations are corrupted with noises [42];• phase transitions for weighted 1 minimization, instead of regular 1 minimi-
zation [29];• phase transitions for iterative reweighted 1 algorithms [12][44].
In this chapter, we are interested in presenting a unified high-dimensional geometricframework to analyze the phase transition phenomenon of 1 minimization. As we willsee, in many applications, it turns out that the performance of 1 minimization and itsvariants often depends on the null space “balancedness” properties of the measurementmatrix A, see Chapter 1. This unified high-dimensional geometric analysis frameworkinvestigates the phase transitions for the null space “balancedness” conditions usingthe notion of a Grassmann angle. This framework generalizes the neighborly polytopeapproach in [15, 20] for deriving phase transitions of recovering perfectly sparse sig-nals; however, this Grassmann angle framework can be further used in analyzing theperformance thresholds of 1 minimization for approximately sparse signals, weighted1 minimization algorithms, and iterative reweighted 1 minimization algorithms. In thischapter, we will present the Grassmann angle framework for analyzing the null space“balancedness” properties in detail by focusing on the example of characterizing thethreshold bounds for 1 minimization robustness in recovering approximately sparsesignals. Then we will briefly illustrate the application of this Grassmann angle frame-work in characterizing the phase transitions for weighted 1 minimization and iterativereweighted 1 minimization algorithms. This framework and results of this chapter haveearlier appeared in [43, 29, 44].
Before demonstrating how the Grassmann angle geometric framework can be usedto analyze the null space “balancedness” properties, we will give an overview of themain results, comparisons of this Grassmann angle approach with other approaches inthe literature, the geometrical concepts to be used frequently in this chapter, and also theorganization of this chapter.
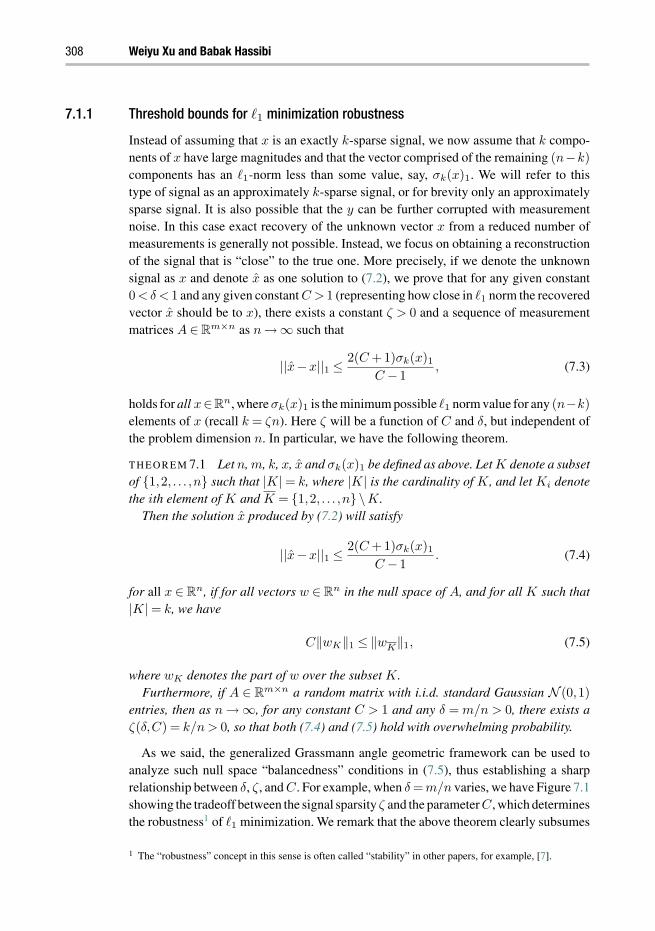
308 Weiyu Xu and Babak Hassibi
7.1.1 Threshold bounds for 1 minimization robustness
Instead of assuming that x is an exactly k-sparse signal, we now assume that k compo-nents of x have large magnitudes and that the vector comprised of the remaining (n−k)
components has an 1-norm less than some value, say, σk(x)1. We will refer to thistype of signal as an approximately k-sparse signal, or for brevity only an approximatelysparse signal. It is also possible that the y can be further corrupted with measurementnoise. In this case exact recovery of the unknown vector x from a reduced number ofmeasurements is generally not possible. Instead, we focus on obtaining a reconstructionof the signal that is “close” to the true one. More precisely, if we denote the unknownsignal as x and denote x as one solution to (7.2), we prove that for any given constant0 < δ < 1 and any given constant C > 1 (representing how close in 1 norm the recoveredvector x should be to x), there exists a constant ζ > 0 and a sequence of measurementmatrices A ∈ Rm×n as n →∞ such that
||x−x||1 ≤ 2(C +1)σk(x)1
C − 1, (7.3)
holds for all x∈Rn, where σk(x)1 is the minimum possible 1 norm value for any (n−k)
elements of x (recall k = ζn). Here ζ will be a function of C and δ, but independent ofthe problem dimension n. In particular, we have the following theorem.
theorem 7.1 Let n, m, k, x, x and σk(x)1 be defined as above. Let K denote a subsetof 1,2, . . . ,n such that |K| = k, where |K| is the cardinality of K, and let Ki denotethe ith element of K and K = 1,2, . . . ,n \K.
Then the solution x produced by (7.2) will satisfy
||x−x||1 ≤ 2(C +1)σk(x)1
C − 1. (7.4)
for all x ∈ Rn, if for all vectors w ∈ Rn in the null space of A, and for all K such that|K| = k, we have
C‖wK‖1 ≤ ‖wK‖1, (7.5)
where wK denotes the part of w over the subset K.Furthermore, if A ∈ Rm×n a random matrix with i.i.d. standard Gaussian N (0,1)
entries, then as n → ∞, for any constant C > 1 and any δ = m/n > 0, there exists aζ(δ,C) = k/n > 0, so that both (7.4) and (7.5) hold with overwhelming probability.
As we said, the generalized Grassmann angle geometric framework can be used toanalyze such null space “balancedness” conditions in (7.5), thus establishing a sharprelationship between δ, ζ, and C. For example, when δ = m/n varies, we have Figure 7.1showing the tradeoff between the signal sparsity ζ and the parameter C, which determinesthe robustness1 of 1 minimization. We remark that the above theorem clearly subsumes
1 The “robustness” concept in this sense is often called “stability” in other papers, for example, [7].

Fundamental thresholds in compressed sensing 309
0.1 0.2 0.3 0.4 0.5 0.6 0.7 0.8 0.9 10
0.02
0.04
0.06
0.08
0.1
0.12
0.14
0.16
m /n
k/n
C=1C=2C=4C=8
Figure 7.1 Tradeoff between signal sparsity and 1 recovery robustness as a function of C (allowableimperfection of the recovered signal is 2(C+1)σk(x)1
C−1 ).
perfect recovery in the perfectly k-sparse setting. For the perfectly k-sparse signal,σk(x)1 = 0, and so from (7.4) we have ‖x − x‖1 = 0 and therefore x = x, when weallow C → 1. This null space characterization is in fact equivalent to the neighborlypolytope characterization from [15] in the perfectly k-sparse case when C = 1.
The Grassmann angle framework can be applied to characterize sparse recovery per-formance when there are observation noises involved and y = Ax + e, where e is anm × 1 additive noise vector with ‖e‖2 ≤ ε. We can still use (7.2) to solve for x. Aslong as A has rank m with its smallest nonzero singular value σm > 0, there alwaysexists an n× 1 vector ∆x such that ‖∆x‖2 ≤ 1
σrε and y = A(x + ∆x). Namely y can
be seen as generated by a perturbation of x. This added perturbation ∆x can then betreated in the same way as xK in analyzing ‖x− x‖1. To further bound ‖x− x‖2, onecan use the almost Euclidean property described in Subsection 7.1.3. For more detailson dealing with observation noises based on the Grassmann angle analysis, please referto [42].
Besides this concept of robustness in 1 norm discussed in Theorem 7.2, there arealso discussions of robustness in general p norms, which will involve other types ofnull space properties. The readers are encouraged to refer to Chapter 1 for an overviewof this topic. A similar formulation of 1 norm robustness recovering an approximatelysparse problem was considered in [14], where the null space characterization for recov-ering approximately sparse signals was analyzed using the RIP condition; however,no explicit values of ζ were given. Through message passing analysis, [16] recently

310 Weiyu Xu and Babak Hassibi
deals with a related but different problem formulation of characterizing the trade-off between signal sparsity and noise sensitivity of the LASSO recovery method. Anoverview of this new message passing analysis approach is presented in Chapter 9 of thisbook.
7.1.2 Weighted and iterative reweighted 1 minimization thresholds
When there is statistical prior information about the signal x, a better decoding methodwould be to solve the weighted 1 minimization programming [29]. The weighted 1minimization solves the following general version of 1 minimization
minAz=y
‖z‖w,1 = minAz=y
n∑i=1
wi|zi|, (7.6)
where the weights wi can be any non-negative real numbers to accommodate priorinformation. For example, if the prior information shows that xi is more likely to bezero or small, then a larger corresponding weight can be applied to suppress its decodingresult to be zero or a small number.
Again, the successful decoding condition for weighted 1 minimization is a weightedversion of the null space “balancedness” condition. It turns out that the null space Grass-mann angle framework can also be readily applied to give sharp sparse recovery thresholdanalysis for weighted 1 minimization algorithms [29], where better phase transitions areshown when prior information is available. When no prior information about the signalis available, this null space Grassmann angle framework can also be used to analyzeiterative reweighted 1 minimization [44], where we can rigorously show for the firsttime that iterative reweighted 1 algorithms, compared with the plain 1 minimizationalgorithms, can increase the phase transition thresholds for interesting types of signals.
7.1.3 Comparisons with other threshold bounds
In this section, we will review other approaches to establishing sparse recovery thresholdbounds for 1 minimization, and compare their strengths and limitations.
Restricted isometry propertyIn [9][11], it was shown that if the matrix A satisfies the now well-known restrictedisometry property (RIP), then any unknown vector x with no more than k = ζn nonzeroelements can be recovered by solving (7.2), where ζ is an absolute constant as a functionof δ, but independent of n, and explicitly bounded in [11]. Please see Chapter 1 for thedefinition of the RIP conditions and its applications. However, it should be noted thatthe RIP condition is only a sufficient condition for 1 minimization to produce a sparsesolution to (7.2). Partially because of this fact, the threshold bounds on ζ obtained bythe RIP condition are not very sharp so far and are often a very small fraction of thebounds on ζ obtained by the neighborly polytope approach or its generalization to theGrassmann angle approach in this chapter.

Fundamental thresholds in compressed sensing 311
One strength of the RIP condition lies in its applicability to a large range of mea-surement matrices. It turns out that for measurement matrices with i.i.d. zero-meanGaussian entries, measurement matrices with i.i.d. Bernoulli entries, or matrices forrandom Fourier measurements, the RIP condition holds with overwhelming probabil-ity [11, 2, 33]. In contrast, the neighborly polytope approach and the Grassmann angleapproach so far only rigorously work for the measurement matrices with i.i.d. Gaus-sian entries, even though the universality of the predicted phase transitions by theseapproaches beyond the Gaussian matrices has been observed [18]. The RIP analysis isalso convenient for bounding the reconstruction error in 2 norm when the observationnoises are present.
Neighborly polytope approachAs discussed earlier, by relating a k-neighborly polytope condition to the success of 1minimization for decoding ideally k-sparse signals, Donoho and Tanner gave the precisephase transitions for decoding ideally sparse signals in [15, 20]. The Grassmann angleapproach in this chapter is a generalization of the neighborly polytope approach in [15,20]. Compared with the neighborly polytope condition which only works for analyzingthe ideally sparse signal vectors, the generalized Grassmann approach is intended to givesharp phase transitions for the null space “balancedness” conditions, which are usefulin a more general setting, for example, in analyzing the robustness of 1 minimization,weighted 1 minimization, and iterative reweighted 1 minimization. Mathematically,in this chapter we need to derive new formulas for the various geometric angles in theGrassmann angle approach. This chapter uses the same computational techniques inestimating the asymptotics of the Grassmann angle as in estimating the asymptotic facecounts in [15].
Spherical section property approachThe threshold bounds on ζ for the null space condition to hold was also analyzed in[28, 40, 45, 46], using the spherical section property of linear subspaces derived fromthe Kashin–Garnaev–Gluskin Inequality [23, 27, 46]. The Kashin–Garnaev–GluskinInequality claims that for a uniformly distributed (n−m)-dimensional subspace, withoverwhelming probability, all vectors w from this subspace will satisfy the sphericalsection property,
‖w‖1 ≥ c1√
m√1+ log(n/m)
‖w‖2, (7.7)
where c1 is a constant independent of the problem dimension. Note that ‖w‖1 ≤√
n‖w‖2
always holds, taking equality only if w is a perfectly balanced vector of constant magni-tude, so it is natural to see that this spherical section property can be used to investigatethe subspace “balancedness” property [45]. This approach extends to general matricessuch as random Gaussian matrices, random Bernoulli matrices, and random Fouriermapping matrices [40], and is applicable to the analysis of sparse recovery robustness[46]. The threshold bounds on ζ given by this approach are sometimes better than thoseobtained from the RIP condition [45], but are generally worse than those obtained by the
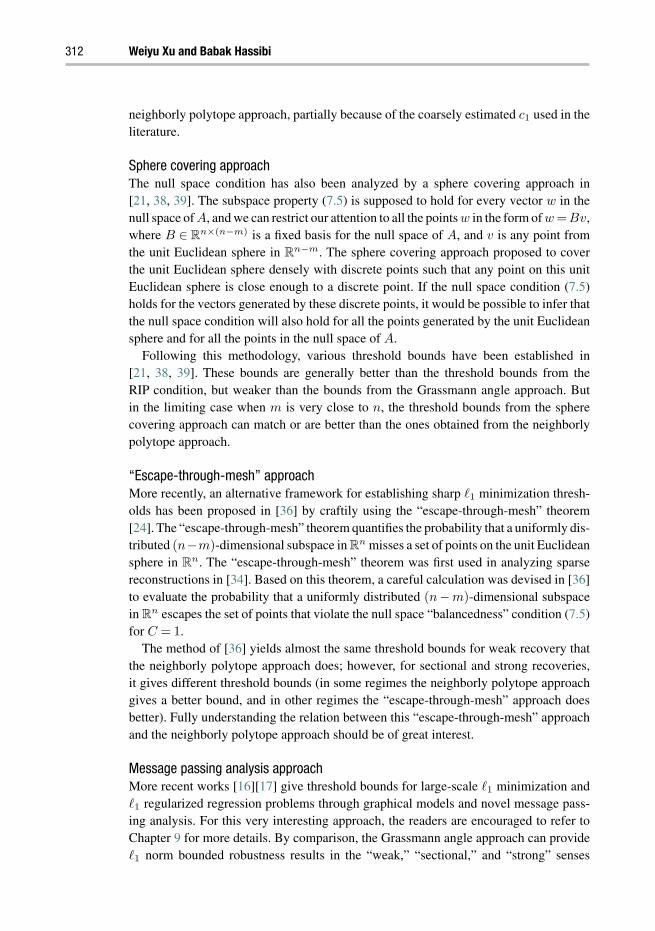
312 Weiyu Xu and Babak Hassibi
neighborly polytope approach, partially because of the coarsely estimated c1 used in theliterature.
Sphere covering approachThe null space condition has also been analyzed by a sphere covering approach in[21, 38, 39]. The subspace property (7.5) is supposed to hold for every vector w in thenull space of A, and we can restrict our attention to all the points w in the form of w =Bv,where B ∈ Rn×(n−m) is a fixed basis for the null space of A, and v is any point fromthe unit Euclidean sphere in Rn−m. The sphere covering approach proposed to coverthe unit Euclidean sphere densely with discrete points such that any point on this unitEuclidean sphere is close enough to a discrete point. If the null space condition (7.5)holds for the vectors generated by these discrete points, it would be possible to infer thatthe null space condition will also hold for all the points generated by the unit Euclideansphere and for all the points in the null space of A.
Following this methodology, various threshold bounds have been established in[21, 38, 39]. These bounds are generally better than the threshold bounds from theRIP condition, but weaker than the bounds from the Grassmann angle approach. Butin the limiting case when m is very close to n, the threshold bounds from the spherecovering approach can match or are better than the ones obtained from the neighborlypolytope approach.
“Escape-through-mesh” approachMore recently, an alternative framework for establishing sharp 1 minimization thresh-olds has been proposed in [36] by craftily using the “escape-through-mesh” theorem[24]. The “escape-through-mesh” theorem quantifies the probability that a uniformly dis-tributed (n−m)-dimensional subspace in Rn misses a set of points on the unit Euclideansphere in Rn. The “escape-through-mesh” theorem was first used in analyzing sparsereconstructions in [34]. Based on this theorem, a careful calculation was devised in [36]to evaluate the probability that a uniformly distributed (n−m)-dimensional subspacein Rn escapes the set of points that violate the null space “balancedness” condition (7.5)for C = 1.
The method of [36] yields almost the same threshold bounds for weak recovery thatthe neighborly polytope approach does; however, for sectional and strong recoveries,it gives different threshold bounds (in some regimes the neighborly polytope approachgives a better bound, and in other regimes the “escape-through-mesh” approach doesbetter). Fully understanding the relation between this “escape-through-mesh” approachand the neighborly polytope approach should be of great interest.
Message passing analysis approachMore recent works [16][17] give threshold bounds for large-scale 1 minimization and1 regularized regression problems through graphical models and novel message pass-ing analysis. For this very interesting approach, the readers are encouraged to refer toChapter 9 for more details. By comparison, the Grassmann angle approach can provide1 norm bounded robustness results in the “weak,” “sectional,” and “strong” senses

Fundamental thresholds in compressed sensing 313
(see Section 7.8), while the message passing analysis is more powerful in providingaverage-case robustness results in terms of mean squared error [17].
7.1.4 Some concepts in high-dimensional geometry
In this part, we will give the explanations of several geometric terminologies often usedin this chapter for the purpose of quick reference.
Grassmann manifoldThe Grassmann manifold Gri(j) refers to the set of i-dimensional subspaces in thej-dimensional Euclidean space Rj . It is known that there exists a unique invariantmeasure µ′ on Gri(j) such that µ′(Gri(j)) = 1.
For more facts on the Grassmann manifold, please see [5].
Polytope, face, vertexA polytope in this chapter refers to the convex hull of a finite number of points in theEuclidean space. Any extreme point of a polytope is a vertex of this polytope. A face ofa polytope is defined as the convex hull of a set of its vertices such that no point in thisconvex hull is an interior point of the polytope. The dimension of a face refers to thedimension of the affine hull of that face. The book [26] offers a nice reference on convexpolytopes.
Cross-polytopeThe n-dimensional cross-polytope is the polytope of the unit 1 ball, namely it is the set
x ∈ Rn | ‖x‖1 = 1.
The n-dimensional cross-polytope has 2n vertices, namely ±e1,±e2, . . .,±en, whereei, 1 ≤ i ≤ n, is the unit vector with its ith coordinate element being 1. Any k extremepoints without opposite pairs at the same coordinate will constitute a (k−1)-dimensionalface of the cross-polytope. So the cross-polytope will have 2k
(nk
)faces of dimension
(k− 1).
Grassmann angleThe Grassmann angle for an n-dimensional cone C under the Grassmann manifoldGri(n), is the measure of the set of i-dimensional subspaces (over Gri(n)) which intersectthe cone C nontrivially (namely at some other point besides the origin). For more detailson the Grassmann angle, internal angle, and external angle, please refer to [25][26][31].
Cone obtained by observing a set B from a set AIn this chapter, when we say “cone obtained by observing B from A,” we mean the conichull of all the vectors in the form of x1 −x2, where x1 ∈ B and x2 ∈ A.
Internal angleAn internal angle β(F1,F2), between two faces F1 and F2 of a polytope or a polyhedralcone, is the fraction of the hypersphere S covered by the cone obtained by observingthe face F2 from the face F1. The internal angle β(F1,F2) is defined to be zero when

314 Weiyu Xu and Babak Hassibi
F1 F2 and is defined to be one if F1 = F2. Note the dimension of the hypersphere S
here matches the dimension of the corresponding cone discussed. Also, the center of thehypersphere is the apex of the corresponding cone. All these defaults also apply to thedefinition of the external angles.
External angleAn external angle γ(F3,F4), between two faces F3 and F4 of a polytope or a polyhedralcone, is the fraction of the hypersphere S covered by the cone of outward normals tothe hyperplanes supporting the face F4 at the face F3. The external angle γ(F3,F4) isdefined to be zero when F3 F4 and is defined to be one if F3 = F4.
7.1.5 Organization
The rest of the chapter is organized as follows. In Section 7.2, we introduce a nullspace characterization for guaranteeing robust signal recovery using 1 minimization.Section 7.3 presents a Grassmann angle-based high-dimensional geometrical frameworkfor analyzing the null space characterization. In Sections 7.4, 7.5, 7.6, and 7.7, analyticalperformance bounds are given for the null space characterization for matrices that arerotationally invariant, such as those constructed from i.i.d. Gaussian entries. Section 7.8shows how the Grassmann angle analytical framework can be extended to analyzing the“weak,” “sectional,” and “strong” notations of robust signal recovery.
In Section 7.9, numerical evaluations of the performance bounds for robust signalrecovery are given. Section 7.10 and 7.11 will introduce the applications of the Grass-mann angle approach to analyzing weighted 1 minimization and iterative reweighted1 minimization algorithms.
Section 7.12 concludes the chapter. In the Appendix, we provide the proofs of relatedlemmas and theorems.
7.2 The null space characterization
In this section we introduce a useful characterization of the matrixA. The characterizationwill establish a necessary and sufficient condition on the matrix A so that the solution of(7.2) approximates the solution of (7.1) such that (7.3) holds. (See [22, 30, 45, 14, 38,39, 28] etc. for variations of this result).
theorem 7.2 Assume that A is a general m×n measurement matrix. Let C > 1 bea positive number. Further, assume that y = Ax and that w is an n×1 vector. Let K bea subset of 1,2, . . . ,n such that |K| = k, where |K| is the cardinality of K and let Ki
denote the ith element of K. Further, let K = 1,2, . . . ,n \K. Then for any x ∈ Rn,for any K such that |K| = k, any solution x produced by (7.2) will satisfy
‖x− x‖1 ≤ 2(C +1)
C − 1‖xK‖1, (7.8)
Fundamental thresholds in compressed sensing 315
if ∀w ∈ Rn such that
Aw = 0
and ∀K such that |K| = k, we have
C‖wK‖1 ≤ ‖wK‖1. (7.9)
Conversely, there exists a measurement matrix A, an x, and corresponding x (x isa minimizer to the programming (7.2)) such that (7.9) is violated for some set K withcardinality k and some vector w from the null space of A, and
‖x− x‖1 > 2(C +1)
C − 1‖xK‖1.
Proof. First, suppose the matrix A has the claimed null space property as in (7.9) andwe want to prove that any solution x satisfies (7.8). Note that the solution x of (7.2)satisfies
‖x‖1 ≤ ‖x‖1,
where x is the original signal. Since Ax = y, it easily follows that w = x− x is in thenull space of A. Therefore we can further write ‖x‖1 ≥ ‖x+w‖1. Using the triangularinequality for the 1 norm we obtain
‖xK‖1 + ‖xK‖1 = ‖x‖1
≥ ‖x‖1 = ‖x+w‖1
≥ ‖xK‖1 −‖wK‖1 + ‖wK‖1 −‖xK‖1
≥ ‖xK‖1 −‖xK‖1 +C − 1
C +1‖w‖1
where the last inequality is from the claimed null space property. Relating the head andtail of the inequality chain above,
2‖xK‖1 ≥ (C − 1)
C +1‖w‖1.
Now we prove the second part of the theorem, namely when (7.9) is violated, thereexist scenarios where the error performance bound (7.8) fails.
Consider a generic m × n matrix A′. For each integer 1 ≤ k ≤ n, let us define thequantity hk as the supremum of ‖wK‖1
‖wK‖1over all such sets K of size |K| ≤ k and over
all nonzero vectors w in the null space of A′. Let k∗ be the biggest k such that hk ≤ 1.Then there must be a nonzero vector w′ in the null space of A and a set K∗ of size k∗,such that
‖w′K∗‖1 = hk∗‖w′
K∗‖1.

316 Weiyu Xu and Babak Hassibi
Now we generate a new measurement matrix A by multiplying the portion A′K∗of the
matrix A′ by hk∗ . Then we will have a vector w in the null space of A satisfying
‖wK∗‖1 = ‖wK∗‖1.
Now we take a signal vector x = (−wK∗ ,0K∗) and claim that x = (0,wK∗) is aminimizer to the programming (7.2). In fact, recognizing the definition of hk∗ , we knowall the vectors w′′ in the null space of the measurement matrix A will satisfy ‖x+w′′‖1 ≥‖x‖1. Let us assume that k∗ ≥ 2 and take K
′′ ⊆ K∗ as the index set corresponding tothe largest (k∗ − i) elements of xK∗ in amplitude, where 1 ≤ i ≤ (k∗ − 1). From the
definition of k∗, it is apparent that C ′ =‖w
K′′ ‖1
‖wK
′′ ‖1> 1 since w is nonzero for any index
in the set K∗. Let us now take C =‖w
K′′ ‖1
‖wK
′′ ‖1+ ε, where ε > 0 is any arbitrarily small
positive number. Thus the condition (7.9) is violated for the vector w, the set K′′
, andthe defined constant C.
Now by inspection, the decoding error is
‖x− x‖1 =2(C ′ +1)
C ′ − 1‖xK′′‖1 >
2(C +1)
C − 1‖xK′′‖1,
violating the error bound (7.8) (for the set K′′
).
DiscussionIt should be noted that if the condition (7.9) is true for all the sets K of cardinality k,then
2‖xK‖1 ≥ (C − 1)
C +1‖x−x‖1
is also true for the set K which corresponds to the k largest (in amplitude) componentsof the vector x. So
2σk(x)1 ≥ (C − 1)
C +1‖x−x‖1
which exactly corresponds to (7.3). It is an interesting result that, for a particular fixedmeasurement matrix A, the violation of (7.9) for some C > 1 does not necessarilyimply that the existence of a vector x and a minimizer solution x to (7.2) such that theperformance guarantee (7.8) is violated. For example, assume n = 2 and the null spaceof the measurement matrix A is a one-dimensional subspace and has the vector (1,100)
as its basis. Then the null space of the matrix A violates (7.9) with C = 101 and the setK = 1. But a careful examination shows that the biggest possible ‖x−x‖1
‖xK‖1(‖xK‖1 = 0)
is equal to 100+1100 = 101
100 , achieved by such an x as (−1,−1). In fact, all those vectors
x = (a,b) with b = 0 will achieve ‖x−x‖1‖xK‖1
= 101100 . However, (7.8) has 2(C+1)
C−1 = 204100 . This
suggests that for a specific measurement matrix A, the tightest error bound for ‖x−x‖1‖xK‖1
should involve the detailed structure of the null space of A. But for general measurementmatrices A, as suggested by Theorem 7.2, the condition (7.9) is a necessary and sufficientcondition to offer the performance guarantee (7.8).
Fundamental thresholds in compressed sensing 317
Analyzing the null space condition: the Gaussian ensembleIn the remaining part of this chapter, for a given value δ = m/n and any value C ≥ 1, wewill devote our efforts to determining the value of feasible ζ = ρδ = k/n for which thereexists a sequence of A such that the null space condition (7.9) is satisfied for all the setsK of size k when n goes to infinity and m/n = δ. For a specific A, it is very hard to checkwhether the condition (7.9) is satisfied or not. Instead, we consider randomly choosingA from the Gaussian ensemble, namely A has i.i.d. N (0,1) entries, and analyze for whatζ, the condition (7.9) for its null space is satisfied with overwhelming probability as n
goes to infinity. This Gaussian matrix ensemble is widely used in compressive sensingresearch, see for example, Chapters 1 and 9.
The following lemma gives a characterization of the resulting null space of A, whichis a fairly well-known result [8][32].
lemma 7.1 Let A ∈ Rm×n be a random matrix with i.i.d. N (0,1) entries. Then thefollowing statements hold:
• The distribution of A is right-rotationally invariant: for any Θ satisfying ΘΘ∗ =
Θ∗Θ = I , PA(A) = PA(AΘ).• There exists a basis Z of the null space of A, such that the distribution of Z is
left-rotationally invariant: for any Θ satisfying ΘΘ∗ =Θ∗Θ= I , PZ(Z)=PZ(Θ∗Z).• It is always possible to choose a basis Z for the null space such that Z has i.i.d.
N (0,1) entries.
In view of Theorem 7.2 and Lemma 7.1 what matters is that the null space of A berotationally invariant. Sampling from this rotationally invariant distribution is equivalentto uniformly sampling a random (n − m)-dimensional subspace from the Grassmannmanifold Gr(n−m)(n). For any such A and ideally sparse signals, the sharp bounds of[15] apply. However, we shall see that the neighborly polytope condition for ideallysparse signals does not readily apply to the proposed null space condition analysis forapproximately sparse signals, since the null space condition cannot be transformed tothe k-neighborly property in a single high-dimensional polytope [15]. Instead, in thischapter, we shall give a unified Grassmann angle framework to directly analyze theproposed null space property.
7.3 The Grassmann angle framework for the null space characterization
In this section we detail the Grassmann angle-based framework for analyzing the boundson ζ = k/n such that (7.9) holds for every vector in the null space, which we denote byZ. Put more precisely, given a certain constant C > 1 (or C ≥ 1), which correspondsto a certain level of recovery accuracy for the approximately sparse signals, we areinterested in what scaling k/n we can achieve while satisfying the following conditionon Z (|K| = k):
∀w ∈ Z,∀K ⊆ 1,2, . . .,n,C‖wK‖1 ≤ ‖wK‖1. (7.10)

318 Weiyu Xu and Babak Hassibi
From the definition of the condition (7.10), there is a tradeoff between the largest sparsitylevel k and the parameter C. As C grows, clearly the largest k satisfying (7.10) willlikely decrease, and, at the same time, 1 minimization will be more robust in terms ofthe residual norm ‖xK‖1. The key in our derivation is the following lemma:
lemma 7.2 For a certain subset K ⊆ 1,2, . . .,n with |K| = k, the event that thenull space Z satisfies
C‖wK‖1 ≤ ‖wK‖1,∀w ∈ Z
is equivalent to the event that ∀x supported on the k-set K (or supported on a subsetof K):
‖xK +wK‖1 + ‖wK
C‖1 ≥ ‖xK‖1,∀w ∈ Z. (7.11)
Proof. First, let us assume that C‖wK‖1 ≤ ‖wK‖1,∀w ∈ Z. Using the triangularinequality, we obtain
‖xK +wK‖1 + ‖wK
C‖1
≥ ‖xK‖1 −‖wK‖1 + ‖wK
C‖1
≥ ‖xK‖1
thus proving the forward part of this lemma. Now let us assume instead that ∃w ∈ Z,such that C‖wK‖1 > ‖wK‖1. Then we can construct a vector x supported on the set K
(or a subset of K), with xK = −wK . Then we have
‖xK +wK‖1 + ‖wK
C‖1
= 0+ ‖wK
C‖1
< ‖xK‖1,
proving the converse part of this lemma.
Now let us consider the probability that condition (7.10) holds for the sparsity |K|= k
if we uniformly sample a random (n−m)-dimensional subspace Z from the Grassmannmanifold Gr(n−m)(n). Based on Lemma 7.2, we can equivalently consider the comple-mentary probability P that there exists a subset K ⊆ 1,2, . . .,n with |K| = k, and avector x ∈ Rn supported on the set K (or a subset of K) failing the condition (7.11).With the linearity of the subspace Z in mind, to obtain P , we can restrict our attentionto those vectors x from the cross-polytope (the unit 1 ball) x ∈ Rn | ‖x‖1 = 1 thatare only supported on the set K (or a subset of K).
First, we upper bound the probability P by a union bound over all the possible supportsets K ⊆1,2, . . .,n and all the sign patterns of the k-sparse vector x. Since the k-sparse
Fundamental thresholds in compressed sensing 319
vector x has(nk
)possible support sets of cardinality k and 2k possible sign patterns
(non-negative or non-positive), we have
P ≤(
n
k
)× 2k ×PK,−, (7.12)
where PK,− is the probability that for a specific support set K, there exists a k-sparsevector x of a specific sign pattern which fails the condition (7.11). By symmetry, withoutloss of generality, we assume the signs of the elements of x to be nonpositive.
So now let us focus on deriving the probability PK,−. Since x is a nonpositive k-sparse vector supported on the set K (or a subset of K) and can be restricted to thecross-polytope x ∈ Rn | ‖x‖1 = 1, x is also on a (k − 1)-dimensional face, denotedby F , of the skewed cross-polytope (weighted 1 ball) SP:
SP = y ∈ Rn | ‖yK‖1 + ‖yK
C‖1 ≤ 1. (7.13)
Then PK,− is the probability that there exists an x ∈ F , and there exists a w ∈ Z
(w = 0) such that
‖xK +wK‖1 + ‖wK
C‖1 ≤ ‖xK‖1 = 1. (7.14)
We first focus on studying a specific single point x ∈ F , without loss of generality,assumed to be in the relative interior of this (k−1)-dimensional face F . For this singleparticular x on F , the probability, denoted by P ′
x, that ∃w ∈ Z (w = 0) such that (7.14)holds is essentially the probability that a uniformly chosen (n−m)-dimensional subspaceZ shifted by the point x, namely (Z +x), intersects the skewed cross-polytope
SP = y ∈ Rn | ‖yK‖1 + ‖yK
C‖1 ≤ 1 (7.15)
nontrivially, namely, at some other point besides x.From the linear property of the subspace Z, the event that (Z + x) intersects the
skewed cross-polytope SP is equivalent to the event that Z intersects nontrivially withthe cone SP-Cone(x) obtained by observing the skewed polytope SP from the point x.(Namely, SP-Cone(x) is the conic hull of the point set (SP− x) and SP-Cone(x) hasthe origin of the coordinate system as its apex.) However, as noticed in the geometry ofconvex polytopes [25][26], the SP-Cone(x) is identical for any x lying in the relativeinterior of the face F . This means that the probability PK,− is equal to P ′
x, regardlessof the fact that x is only a single point in the relative interior of the face F . (The acutereader may have noticed some singularities here because x∈F may not be in the relativeinterior of F , but it turns out that the SP-Cone(x) is then only a subset of the cone weget when x is in the relative interior of F . So we do not lose anything if we restrict x tobe in the relative interior of the face F .) In summary, we have
PK,− = P ′x.

320 Weiyu Xu and Babak Hassibi
Now we only need to determine P ′x. From its definition, P ′
x is exactly the com-plementary Grassmann angle [25] for the face F with respect to the polytope SPunder the Grassmann manifold Gr(n−m)(n): the probability of a uniformly distributed(n−m)-dimensional subspaceZ from the Grassmann manifold Gr(n−m)(n) intersectingnontrivially with the cone SP-Cone(x) formed by observing the skewed cross-polytopeSP from the relative interior point x ∈ F .
Building on the works by L. A. Santalö [35] and P. McMullen [31] etc. in high-dimensional integral geometry and convex polytopes, the complementary Grassmannangle for the (k − 1)-dimensional face F can be explicitly expressed as the sum ofproducts of internal angles and external angles [26]:
2×∑s≥0
∑G∈m+1+2s(SP)
β(F,G)γ(G,SP), (7.16)
where s is any non-negative integer, G is any (m + 1 + 2s)-dimensional face of theskewed cross-polytope (#m+1+2s(SP) is the set of all such faces), β(·, ·) stands for theinternal angle, and γ(·, ·) stands for the external angle.
The internal angles and external angles are basically defined as follows [26][31]:
• An internal angle β(F1,F2) is the fraction of the hypersphere S covered by the coneobtained by observing the face F2 from the face F1.2 The internal angle β(F1,F2) isdefined to be zero when F1 F2 and is defined to be one if F1 = F2.
• An external angle γ(F3,F4) is the fraction of the hypersphere S covered by the coneof outward normals to the hyperplanes supporting the face F4 at the face F3. Theexternal angle γ(F3,F4) is defined to be zero when F3 F4 and is defined to be oneif F3 = F4.
Let us take for example the 2-dimensional skewed cross-polytope
SP = (y1,y2) ∈ R2| ‖y2‖1 + ‖y1
C‖1 ≤ 1
(namely the diamond) in Figure 7.2, where n = 2, (n − m) = 1 and k = 1. Then thepoint x = (0,−1) is a 0-dimensional face (namely a vertex) of the skewed polytope SP.Now from their definitions, the internal angle β(x,SP) = β/2π and the external angleγ(x,SP) = γ/2π, γ(SP,SP) = 1. The complementary Grassmann angle for the vertex x
with respect to the polytope SP is the probability that a uniformly sampled 1-dimensionalsubspace (namely a line, we denote it by Z) shifted by x intersects nontrivially with SP=
(y1,y2) ∈ R2| ‖y2‖1 + ‖y1C ‖1 ≤ 1 (or equivalently the probability that Z intersects
nontrivially with the cone obtained by observing SP from the point x). It is obvious thatthis probability is β/π. The readers can also verify the correctness of the formula (7.16)very easily for this toy example.
2 Note the dimension of the hypersphere S here matches the dimension of the corresponding cone discussed.Also, the center of the hypersphere is the apex of the corresponding cone. All these defaults also apply tothe definition of the external angles.
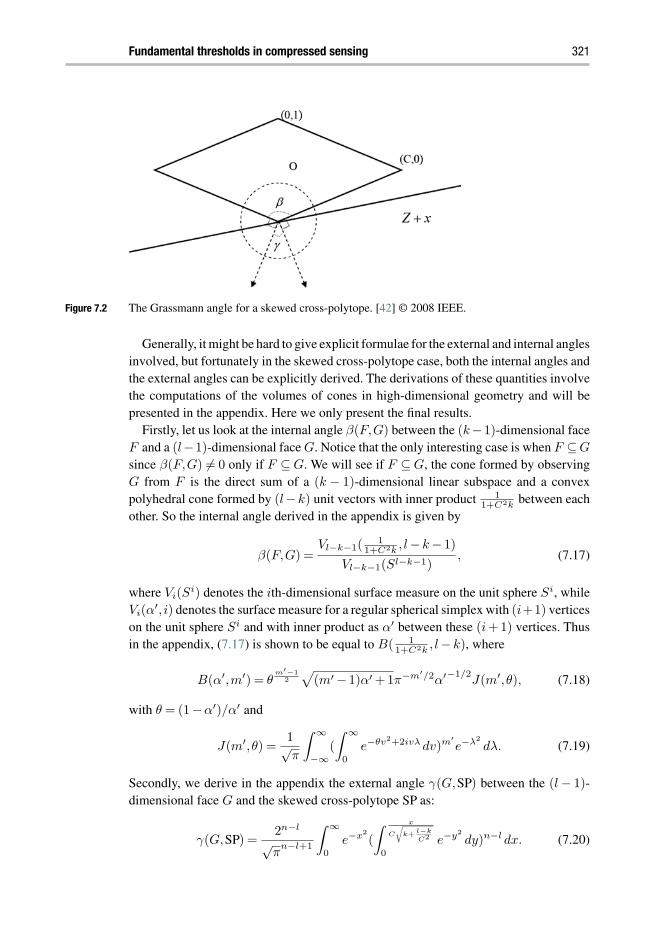
Fundamental thresholds in compressed sensing 321
Figure 7.2 The Grassmann angle for a skewed cross-polytope. [42] © 2008 IEEE.
Generally, it might be hard to give explicit formulae for the external and internal anglesinvolved, but fortunately in the skewed cross-polytope case, both the internal angles andthe external angles can be explicitly derived. The derivations of these quantities involvethe computations of the volumes of cones in high-dimensional geometry and will bepresented in the appendix. Here we only present the final results.
Firstly, let us look at the internal angle β(F,G) between the (k−1)-dimensional faceF and a (l−1)-dimensional face G. Notice that the only interesting case is when F ⊆G
since β(F,G) = 0 only if F ⊆ G. We will see if F ⊆ G, the cone formed by observingG from F is the direct sum of a (k − 1)-dimensional linear subspace and a convexpolyhedral cone formed by (l−k) unit vectors with inner product 1
1+C2k between eachother. So the internal angle derived in the appendix is given by
β(F,G) =Vl−k−1(
11+C2k , l−k− 1)
Vl−k−1(Sl−k−1), (7.17)
where Vi(Si) denotes the ith-dimensional surface measure on the unit sphere Si, while
Vi(α′, i) denotes the surface measure for a regular spherical simplex with (i+1) vertices
on the unit sphere Si and with inner product as α′ between these (i+1) vertices. Thusin the appendix, (7.17) is shown to be equal to B( 1
1+C2k , l−k), where
B(α′,m′) = θm′−1
2√
(m′ − 1)α′ +1π−m′/2α′−1/2J(m′,θ), (7.18)
with θ = (1−α′)/α′ and
J(m′,θ) =1√π
∫ ∞
−∞(
∫ ∞
0e−θv2+2ivλ dv)m′
e−λ2dλ. (7.19)
Secondly, we derive in the appendix the external angle γ(G,SP) between the (l − 1)-dimensional face G and the skewed cross-polytope SP as:
γ(G,SP) =2n−l
√π
n−l+1
∫ ∞
0e−x2
(
∫ x
C
√k+ l−k
C2
0e−y2
dy)n−l dx. (7.20)
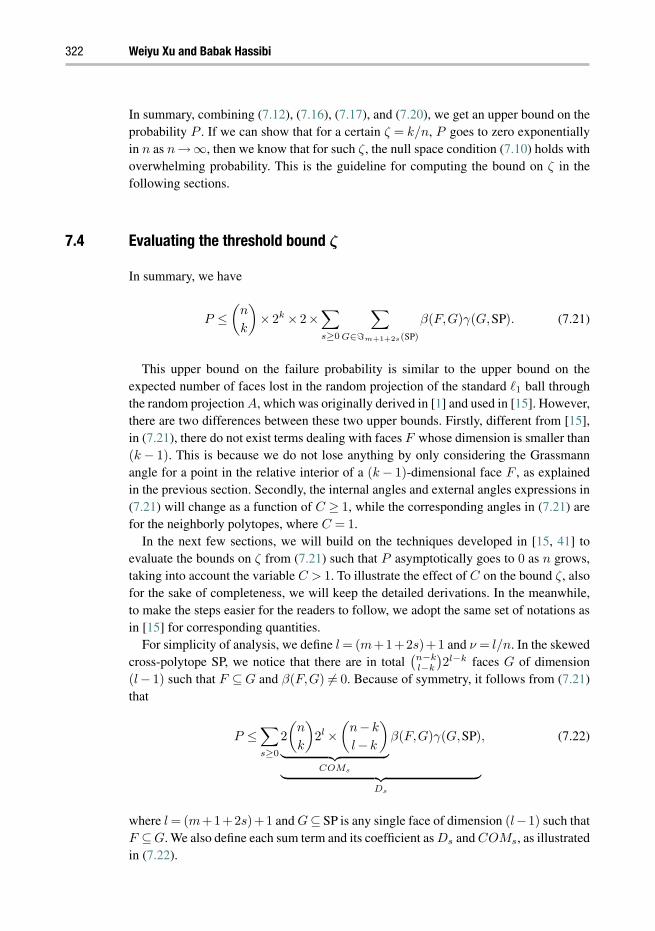
322 Weiyu Xu and Babak Hassibi
In summary, combining (7.12), (7.16), (7.17), and (7.20), we get an upper bound on theprobability P . If we can show that for a certain ζ = k/n, P goes to zero exponentiallyin n as n→∞, then we know that for such ζ, the null space condition (7.10) holds withoverwhelming probability. This is the guideline for computing the bound on ζ in thefollowing sections.
7.4 Evaluating the threshold bound ζ
In summary, we have
P ≤(
n
k
)× 2k × 2×
∑s≥0
∑G∈m+1+2s(SP)
β(F,G)γ(G,SP). (7.21)
This upper bound on the failure probability is similar to the upper bound on theexpected number of faces lost in the random projection of the standard 1 ball throughthe random projection A, which was originally derived in [1] and used in [15]. However,there are two differences between these two upper bounds. Firstly, different from [15],in (7.21), there do not exist terms dealing with faces F whose dimension is smaller than(k − 1). This is because we do not lose anything by only considering the Grassmannangle for a point in the relative interior of a (k − 1)-dimensional face F , as explainedin the previous section. Secondly, the internal angles and external angles expressions in(7.21) will change as a function of C ≥ 1, while the corresponding angles in (7.21) arefor the neighborly polytopes, where C = 1.
In the next few sections, we will build on the techniques developed in [15, 41] toevaluate the bounds on ζ from (7.21) such that P asymptotically goes to 0 as n grows,taking into account the variable C > 1. To illustrate the effect of C on the bound ζ, alsofor the sake of completeness, we will keep the detailed derivations. In the meanwhile,to make the steps easier for the readers to follow, we adopt the same set of notations asin [15] for corresponding quantities.
For simplicity of analysis, we define l = (m+1+2s)+1 and ν = l/n. In the skewedcross-polytope SP, we notice that there are in total
(n−kl−k
)2l−k faces G of dimension
(l− 1) such that F ⊆ G and β(F,G) = 0. Because of symmetry, it follows from (7.21)that
P ≤∑s≥0
2
(n
k
)2l ×
(n−k
l−k
)︸ ︷︷ ︸
COMs
β(F,G)γ(G,SP)
︸ ︷︷ ︸Ds
, (7.22)
where l = (m+1+2s)+1 and G⊆ SP is any single face of dimension (l−1) such thatF ⊆G. We also define each sum term and its coefficient as Ds and COMs, as illustratedin (7.22).

Fundamental thresholds in compressed sensing 323
In order for the upper bound on P in (7.22) to decrease to 0 as n →∞, one sufficientcondition is that every sum term Ds in (7.22) goes to 0 exponentially fast in n. Since
n−1 log(Ds) = n−1 log(COMs)+n−1 log(γ(G,SP))+n−1 log(β(F,G)),
if we want the natural logarithm n−1 log(Ds) to be negative, n−1 log(COMs), whichis non-negative, needs to be overwhelmed by the sum of the logarithms, which arenon-positive, for internal angles and external angles.
For fixed ρ, δ, and C, it turns out that there exists a decay exponent ψext(ν;ρ,δ,C),as a function of ν = l/n, at which rate γ(G,SP) decays exponentially. Namely for eachε > 0, we have
n−1 log(γ(G,SP)) ≤−ψext(ν;ρ,δ,C)+ ε,
uniformly in l ≥ δn, n ≥ n0(ρ,δ,ε,C), where n0(ρ,δ,ε,C) is a large enough naturalnumber depending only on ρ, δ, ε, and C. This exponent ψext(ν;ρ,δ,C) is explicitlyspecified in Section 7.6.
Similarly for fixed ρ, δ, and C, the internal angle β(F,G) decays at a rateψint(ν;ρ,δ,C), which is defined in Section 7.5. Namely, for any ε > 0, we will have thescaling
n−1 log(β(F,G)) = −ψint(ν;ρ,δ,C)+ ε,
uniformly over l ≥ δn and n ≥ n0(ρ,δ,ε,C), where n0(ρ,δ,ε,C) is a large enoughnatural number.
For the coefficient term COMs in (7.21), after some algebra, we know that for anyε > 0,
n−1 log(COMs) = ν log(2)+H(ρδ)+H(ν −ρδ
1−ρδ)(1−ρδ)︸ ︷︷ ︸
combinatorial growth exponent ψcom(ν;ρ,δ)
+ε, (7.23)
uniformly when l ≥ δn and n > n0(ρ,δ,ε) (where n0(ρ,δ,ε) is some big enough naturalnumber), and H(p) = p log(1/p) + (1 − p) log(1/(1− p)). In getting (7.23), we usedthe well-known fact that 1
n log((
npn
)) approaches H(p) arbitrarily close as n grows to
infinity [15].In summary, if we define the net exponent ψnet(ν;ρ,δ,C) = ψcom(ν;ρ,δ) −
ψint(ν;ρ,δ,C)−ψext(ν;ρ,δ,C), then for an arbitrary C ≥ 1, for any fixed choice of ρ,δ, ε > 0, and for large enough n,
n−1 log(Ds) ≤ ψnet(ν;ρ,δ,C)+3ε, (7.24)
holds uniformly over the sum parameter s in (7.16).Now we are ready to define the threshold bound ρN (δ,C) such that whenever ρ <
ρN (δ,C), the probability P in (7.21) will be decaying to 0 exponentially fast as n grows.
definition 7.1 For any δ ∈ (0,1], and any C ≥ 1, we define the critical thresholdρN (δ,C) as the supremum of ρ ∈ [0,1] such that for any ν ∈ [δ,1],
ψnet(ν;ρ,δ,C) < 0.

324 Weiyu Xu and Babak Hassibi
Now it is time to describe how to calculate the exponents ψint and ψext for the internalangles and external angles respectively. When the parameters ρ, δ, and C are clear fromthe context, we will omit them from the notations for the combinatorial, internal, andexternal exponents.
7.5 Computing the internal angle exponent
In this section, we first state how the internal angle exponent ψint(ν;ρ,δ,C) is computedand then justify this computation.
For each ν, we take the function
ξγ′(y) =1−γ′
γ′ y2/2+Λ∗(y), (7.25)
where
γ′ =ρδ
C2−1C2 ρδ + ν
C2
,
and Λ∗(·) is the dual large deviation rate function given by
Λ∗(y) = maxs
sy−Λ(s).
Here Λ(s) is the cumulant generating function
Λ(s) = log(E(exp(sY )) =s2
2+ log(2Φ(s)),
for a standard half-normal random variable Y , where Φ is the cumulative distributionfunction of a standard Gaussian random variable N (0,1). Note that a standard half-normal random variable Y ∼HN(0,1) is the absolute value |X| of a standard Gaussianrandom variable X ∼N (0,1).
Since the dual large deviation rate function Λ∗(·) is a convex function that takes itsminimum at E(Y ) =
√2/π, so ξγ′(y) is also a convex function that takes its minimum
in the interval (0,√
2/π). Let us denote the minimizer of ξγ′(y) as yγ′ . Then for anyC ≥ 1, the internal angle exponent can be computed as
ψint(ν;ρ,δ,C) = (ξγ′(yγ′)+ log(2))(ν −ρδ). (7.26)
Next, we will show (7.26) is indeed the internal angle decay exponent for an arbitraryC ≥ 1; namely we will prove the following lemma in the same spirit as Lemma 6.1from [15]:
lemma 7.3 For k = ρδn, any ε > 0, and any C ≥ 1, when n > n0(ρ,δ,ε,C), wheren0(ρ,δ,ε,C) is a large enough number,
n−1 log(β(F,G)) ≤−ψint(l/n;ρ,δ,C)+ ε,
uniformly for any l ≥ δn.

Fundamental thresholds in compressed sensing 325
In fact, using the formula for the internal angle derived in the appendix, we know that
−n−1 log(β(F,G)) = −n−1 log(B(1
1+C2k, l−k)), (7.27)
where
B(α′,m′) = θm′−1
2√
(m′ − 1)α′ +1π−m′/2α′−1/2J(m′,θ), (7.28)
with θ = (1−α′)/α′ and
J(m′,θ) =1√π
∫ ∞
−∞(
∫ ∞
0e−θv2+2ivλ dv)m′
e−λ2dλ. (7.29)
To evaluate (7.27), we need to evaluate the complex integral in J(m′,θ′). A saddlepoint method based on contour integration was sketched for similar integral expressionsin [41]. A probabilistic method using large deviation theory for evaluating similar inte-grals was developed in [15]. Both of these two methods can be applied in our case and ofcourse they will produce the same final results. We will follow the probabilistic methodin this chapter. The basic idea is to see the integral in J(m′,θ′) as the convolution of(m′ +1) probability densities being expressed in the Fourier domain.
lemma 7.4 [15] Let θ = (1−α′)/α′. Let T be a random variable with the N(0, 12 )
distribution, and let Wm′ be a sum of m′ i.i.d. half normals Ui ∼ HN(0, 12θ ). Let T
and Wm′ be stochastically independent, and let gT+Wm′ denote the probability densityfunction of the random variable T +Wm′ . Then3
B(α′,m′) =
√α′(m′ − 1)+1
1−α′ · 2−m′ ·√
π · gT+Wm′ (0). (7.30)
Here we apply this lemma to α′ = 1C2k+1 for general C ≥ 1.Applying this probabilistic
interpretation and large deviation techniques, it is evaluated as in [15] that
gT+Wm′ (0) ≤ 2√π·(∫ µm′
0ve−v2−m′Λ∗(
√2θ
m′ v) dv + e−µ2m′
), (7.31)
where Λ∗ is the rate function for the standard half-normal random variable HN(0,1)
and µm′ is the expectation of Wm′ . In fact, the second term in the sum is negligiblebecause it decays at a greater speed than the first term as the dimension m′ grows (to seethis, note that −v2 −m′Λ∗(
√2θ
m′ v) is a concave function achieving its maximum when
v < µm′ ; and −v2 −m′Λ∗(√
2θm′ v) is equal to −µ2
m′ when v = µm′ . Laplace’s methodsdiscussed below then show the integral in the first term indeed decays at a slower speedthan e−µ2
m′). And after taking y =√
2θm′ v, we have an upper bound for the first term:
2√π· m′2
2θ·∫ √
2/π
0ye−m′( m′
2θ )y2−m′Λ∗(y) dy. (7.32)
3 In [15], the term 2−m′was 21−m′
, but we believe that 2−m′is the right term.

326 Weiyu Xu and Babak Hassibi
As we know, m′ in the exponent of (7.32) is defined as (l − k). Now we notice thatthe function ξγ′ in (7.25) appears in the exponent of (7.32), with γ′ = θ
m′+θ . Since
θ = 1−α′α′ = C2k, we have
γ′ =θ
m′ + θ=
C2k
(C2 − 1)k + l.
Since k scales as ρδn and l scales as νn, we further have
γ′ =k
lC2 + C2−1
C2 k=
ρδC2−1
C2 ρδ + νC2
,
which is apparently consistent with our previous definition of γ′ in (7.25).Recall ξγ′(y) defined in (7.25), then standard Laplace’s method will give the upper
boundgT+Wm′ (0) ≤ e−m′ξγ′ (yγ′ )Rm′(γ′),
where m′−1 supγ′∈[η,1] log(Rm′(γ′)) = o(1) as m′ →∞ for any η > 0.Plugging this upper bound back into (7.30) and recalling m′ = (ν − ρδ)n, for any
ε > 0, with large enough n,
n−1 log(β(F,G)) ≤ (−ξγ′(yγ′)− log(2))(ν −ρδ)+ ε,
holds uniformly over l ≥ νn, generalizing the C = 1 case in [15].For any C ≥ 1, as shown in [15], ξγ′(yγ′) scales like
1
2log(
1−γ′
γ′ ), as γ′ → 0. (7.33)
Because γ′ = ρδC2−1
C2 ρδ+ νC2
, for any ν ∈ [δ,1], if we take ρ small enough, γ′ can become
arbitrarily small. The asymptotic (7.33) means that as ρ → 0,
ψint(ν;ρ,δ,C) ≥ (1
2· log(
1−γ′
γ′ )(1− η)+ log(2))(ν −ρδ). (7.34)
This generalizes the C =1 case in [15]. Notice as C increases, the internal angle exponentasymptotic (7.34) decreases.
7.6 Computing the external angle exponent
Closely following [15], let X be a half-normal HN(0,1/2) random variable, namelya random variable X = |Z| where Z ∼ N (0,1/2). For ν ∈ (0,1], define xν as thesolution of
2xG(x)
g(x)=
1− ν
ν′ , (7.35)

Fundamental thresholds in compressed sensing 327
where ν′ = (C2 −1)ρδ +ν, G(x) is the cumulative distribution function of X and thusG(x) is the error function
G(x) =2√π
∫ x
0e−y2
dy, (7.36)
and g(x) = 2√π
exp(−x2) for x ≥ 0 is the density function for X .Keeping in mind the dependence of xν on C ≥ 1, we define
ψext(ν;ρ,δ,C) = −(1− ν) log(G(xν))+ ν′x2ν .
When C = 1, we have the asymptotic from [15]
ψext(ν;ρ,δ,1) ∼ ν log(1
ν)− 1
2ν log(log(
1
ν))+ o(ν),ν → 0. (7.37)
We now set out to prove that the defined external angle exponent is indeed the rightexponent. We first give the explicit formula for the external angle formula as a functionof the parameter C ≥ 1 in the appendix. Extracting the exponent from the externalangle formula follows [15] and includes the necessary changes to take into account theparameter C ≥ 1. The justification is summarized in this following lemma:
lemma 7.5 For any C ≥ 1, ρ = k/n, and δ = m/n, then for any fixed ε1 > 0,
n−1 log(γ(G,SP)) < −ψext(l
n;ρ,δ,C)+ ε1, (7.38)
uniformly in l ≥ δn, when n is large enough.
Proof. In the appendix, we derived the explicit integral formula for the external angle:
γ(G,SP) =2n−l
√π
n−l+1
∫ ∞
0e−x2
(
∫ x
C
√k+ l−k
C2
0e−y2
dy)n−l dx. (7.39)
After changing integral variables, we have
γ(G,SP) =
√(C2 − 1)k + l
π(7.40)∫ ∞
0e−((C2−1)k+l)x2
(2√π
∫ x
0e−y2
dy)n−l dx.
Let ν = l/n, ν′ = (C2 − 1)ρδ + ν then the integral formula can be written as√nν′
π
∫ ∞
0e−nν′x2+n(1−ν) log(G(x)) dx, (7.41)

328 Weiyu Xu and Babak Hassibi
where G is the error function from (7.36). To look at the asymptotic behavior of (7.41),following the same methodology as in [15], we first define
fρ,δ,ν,n(y) = e−nψρ,δ,ν(y) ·√
nν′
π(7.42)
with
ψρ,δ,ν(y) = ν′y2 − (1− ν) log(G(y)).
Applying Laplace’s method to ψρ,δ,ν gives Lemma 7.6, which is in the spirit of Lemma5.2 in [15], and we omit its proof in this chapter.
lemma 7.6 For C ≥ 1 and ν ∈ (0,1), let xν denote the minimizer of ψρ,δ,ν . Then∫ ∞
0fρ,δ,ν,n(x)dx ≤ e−nψρ,δ,ν(xν)(1+Rn(ν)),
where for δ,η > 0,
supν∈[δ,1−η]
Rn(ν) = o(1) as n →∞,
and xν is exactly the same xν defined earlier in (7.35).
Recall that the defined exponent ψext is given by
ψext(ν;ρ,δ,C) = ψρ,δ,ν(xν). (7.43)
From the definition of ψρ,δ,ν(xν) and (7.43), it is not hard to see that as ν → 1, xν → 0
and ψext(ν;ρ,δ,C) → 0. So from (7.43) and Lemma 7.6,
n−1 log(γ(G,SP)) < −ψext(l/n;ρ,δ,C)+ ε1,
uniformly in l ≥ δn, when n is large enough.
7.7 Existence and scaling of ρN (δ,C)
Recall that in determining ρN (δ,C), ψcom is the exponent which must be overwhelmedby the other two exponents ψint +ψnet. The asymptotic relations (7.37) and (7.33) allowus to see the following key facts about ρN (δ,C), the proofs of which are given in theappendix.
lemma 7.7 For any δ > 0 and any C > 1, we have
ρN (δ,C) > 0, δ ∈ (0,1). (7.44)
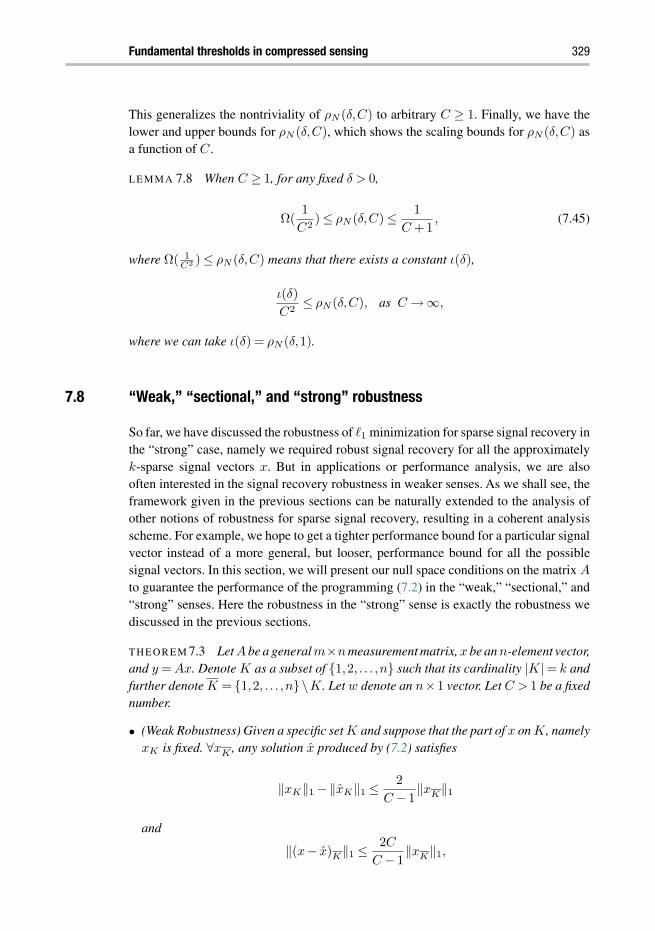
Fundamental thresholds in compressed sensing 329
This generalizes the nontriviality of ρN (δ,C) to arbitrary C ≥ 1. Finally, we have thelower and upper bounds for ρN (δ,C), which shows the scaling bounds for ρN (δ,C) asa function of C.
lemma 7.8 When C ≥ 1, for any fixed δ > 0,
Ω(1
C2 ) ≤ ρN (δ,C) ≤ 1
C +1, (7.45)
where Ω( 1C2 ) ≤ ρN (δ,C) means that there exists a constant ι(δ),
ι(δ)
C2 ≤ ρN (δ,C), as C →∞,
where we can take ι(δ) = ρN (δ,1).
7.8 “Weak,” “sectional,” and “strong” robustness
So far, we have discussed the robustness of 1 minimization for sparse signal recovery inthe “strong” case, namely we required robust signal recovery for all the approximatelyk-sparse signal vectors x. But in applications or performance analysis, we are alsooften interested in the signal recovery robustness in weaker senses. As we shall see, theframework given in the previous sections can be naturally extended to the analysis ofother notions of robustness for sparse signal recovery, resulting in a coherent analysisscheme. For example, we hope to get a tighter performance bound for a particular signalvector instead of a more general, but looser, performance bound for all the possiblesignal vectors. In this section, we will present our null space conditions on the matrix A
to guarantee the performance of the programming (7.2) in the “weak,” “sectional,” and“strong” senses. Here the robustness in the “strong” sense is exactly the robustness wediscussed in the previous sections.
theorem 7.3 Let A be a general m×n measurement matrix, x be an n-element vector,and y = Ax. Denote K as a subset of 1,2, . . . ,n such that its cardinality |K| = k andfurther denote K = 1,2, . . . ,n\K. Let w denote an n×1 vector. Let C > 1 be a fixednumber.
• (Weak Robustness) Given a specific set K and suppose that the part of x on K, namelyxK is fixed. ∀xK , any solution x produced by (7.2) satisfies
‖xK‖1 −‖xK‖1 ≤ 2
C − 1‖xK‖1
and
‖(x− x)K‖1 ≤ 2C
C − 1‖xK‖1,

330 Weiyu Xu and Babak Hassibi
if and only if ∀w ∈ Rn such that Aw = 0, we have
‖xK +wK‖1 + ‖wK
C‖1 ≥ ‖xK‖1; (7.46)
• (Sectional Robustness) Given a specific set K ⊆ 1,2, . . . ,n. Then ∀x ∈ Rn, anysolution x produced by (7.2) will satisfy
‖x− x‖1 ≤ 2(C +1)
C − 1‖xK‖1,
if and only if ∀x′ ∈ Rn, ∀w ∈ Rn such that Aw = 0,
‖x′K +wK‖1 + ‖wK
C‖1 ≥ ‖x′
K‖1; (7.47)
• (Strong Robustness) If for all possible K ⊆ 1,2, . . . ,n, and for all x ∈ Rn, anysolution x produced by (7.2) satisfies
‖x− x‖1 ≤ 2(C +1)
C − 1‖xK‖1,
if and only if ∀K ⊆ 1,2, . . . ,n,∀x′ ∈ Rn, ∀w ∈ Rn such that Aw = 0,
‖x′K +wK‖1 + ‖wK
C‖1 ≥ ‖x′
K‖1. (7.48)
Proof. We will first show the sufficiency of the null space conditions for the variousdefinitions of robustness. Let us begin with the “weak” robustness part. Let w = x−x
and we must have Aw = A(x−x) = 0. From the triangular inequality for 1 norm andthe fact that ‖x‖1 ≥ ‖x+w‖1, we have
‖xK‖1 −‖xK +wK‖1
≥ ‖wK +xK‖1 −‖xK‖1
≥ ‖wK‖1 − 2‖xK‖1.
But the condition (7.46) guarantees that
‖wK‖1 ≥ C(‖xK‖1 −‖xK +wK‖1),
so we have
‖wK‖1 ≤ 2C
C − 1‖xK‖1,
and
‖xK‖1 −‖xK‖1 ≤ 2
C − 1‖xK‖1.

Fundamental thresholds in compressed sensing 331
For the “sectional” robustness, again, we let w = x−x. Then there must exist an x′ ∈Rn
such that‖x′
K +wK‖1 = ‖x′K‖1 −‖wK‖1.
Following the condition (7.47), we have
‖wK‖1 ≤ ‖wK
C‖1.
Since‖x‖1 ≥ ‖x+w‖1,
following the proof of Theorem 7.2, we have
‖x− x‖1 ≤ 2(C +1)
C − 1‖xK‖1.
The sufficiency of the condition (7.48) for strong robustness also follows.Necessity: Since in the proof of the sufficiency, equalities can be achieved in the tri-
angular equalities, the conditions (7.46), (7.47), and (7.48) are also necessary conditionsfor the respective robustness to hold for every x (otherwise, for certain x’s, there willbe x′ = x + w with ‖x′‖1 < ‖x‖1 which violates the respective robustness definitions.Also, such x′ can be the solution to (7.2)). The detailed arguments will similarly followthe proof of the second part of Theorem 7.2.
The conditions for “weak,” “sectional,” and “strong” robustness seem to be verysimilar, and yet there are key differences. The “weak” robustness condition is for x witha specific xK on a specific subset K, the “sectional” robustness condition is for x witharbitrary value xK on a specific subset K, and the “strong” robustness condition is forx’s with arbitrary value xK on all possible subsets. Basically, the “weak” robustnesscondition (7.46) guarantees that the 1 norm of xK is not too far away from the 1 normof xK and the error vector wK scales linearly in 1 norm as a function of ‖xK‖1. Noticethat if we define
κ = maxAw=0,w =0
‖wK‖1
‖wK‖1,
then
‖x− x‖1 ≤ 2C(1+κ)
C − 1‖xK‖1.
That means, if κ is not ∞ for a measurement matrix A, ‖x− x‖1 also approaches 0 when‖xK‖1 approaches 0. Indeed, it is not hard to see that, for a given matrix A, κ < ∞ aslong as the rank of matrix AK is equal to |K|= k, which is generally satisfied for k < m.
While the “weak” robustness condition is only for one specific signal x, the “sectional”robustness condition instead guarantees that given any approximately k-sparse signalmainly supported on the subset K, the 1 minimization gives a solution x close to theoriginal signal by satisfying (7.3). When we measure an approximately k-sparse signalx (the support of the k largest-magnitude components is fixed though unknown to thedecoder) using a randomly generated measurement matrix A, the “sectional” robustness
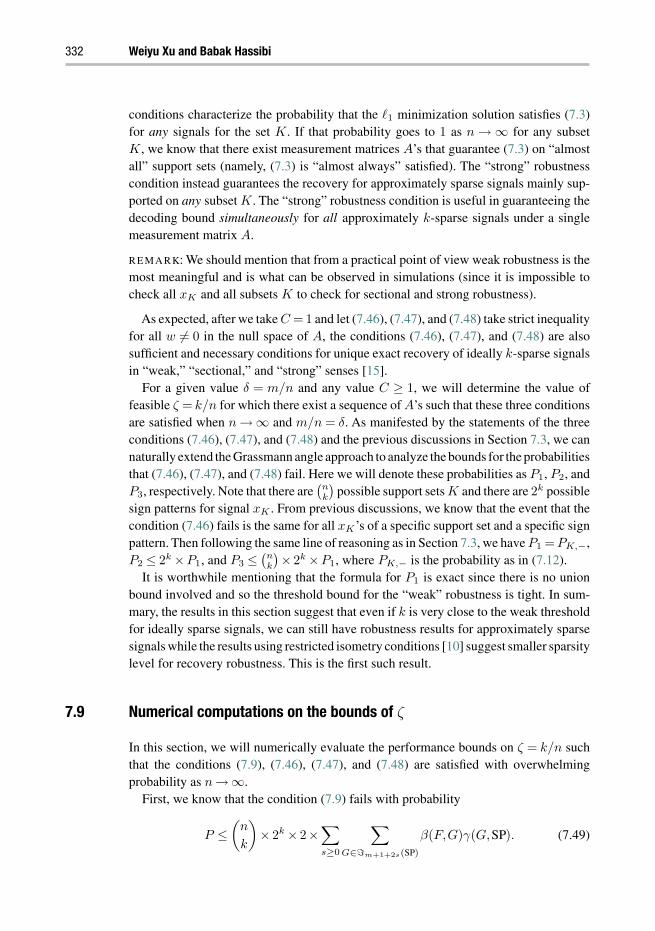
332 Weiyu Xu and Babak Hassibi
conditions characterize the probability that the 1 minimization solution satisfies (7.3)for any signals for the set K. If that probability goes to 1 as n → ∞ for any subsetK, we know that there exist measurement matrices A’s that guarantee (7.3) on “almostall” support sets (namely, (7.3) is “almost always” satisfied). The “strong” robustnesscondition instead guarantees the recovery for approximately sparse signals mainly sup-ported on any subset K. The “strong” robustness condition is useful in guaranteeing thedecoding bound simultaneously for all approximately k-sparse signals under a singlemeasurement matrix A.
remark: We should mention that from a practical point of view weak robustness is themost meaningful and is what can be observed in simulations (since it is impossible tocheck all xK and all subsets K to check for sectional and strong robustness).
As expected, after we take C = 1 and let (7.46), (7.47), and (7.48) take strict inequalityfor all w = 0 in the null space of A, the conditions (7.46), (7.47), and (7.48) are alsosufficient and necessary conditions for unique exact recovery of ideally k-sparse signalsin “weak,” “sectional,” and “strong” senses [15].
For a given value δ = m/n and any value C ≥ 1, we will determine the value offeasible ζ = k/n for which there exist a sequence of A’s such that these three conditionsare satisfied when n → ∞ and m/n = δ. As manifested by the statements of the threeconditions (7.46), (7.47), and (7.48) and the previous discussions in Section 7.3, we cannaturally extend the Grassmann angle approach to analyze the bounds for the probabilitiesthat (7.46), (7.47), and (7.48) fail. Here we will denote these probabilities as P1, P2, andP3, respectively. Note that there are
(nk
)possible support sets K and there are 2k possible
sign patterns for signal xK . From previous discussions, we know that the event that thecondition (7.46) fails is the same for all xK’s of a specific support set and a specific signpattern. Then following the same line of reasoning as in Section 7.3, we have P1 = PK,−,P2 ≤ 2k ×P1, and P3 ≤
(nk
)× 2k ×P1, where PK,− is the probability as in (7.12).
It is worthwhile mentioning that the formula for P1 is exact since there is no unionbound involved and so the threshold bound for the “weak” robustness is tight. In sum-mary, the results in this section suggest that even if k is very close to the weak thresholdfor ideally sparse signals, we can still have robustness results for approximately sparsesignals while the results using restricted isometry conditions [10] suggest smaller sparsitylevel for recovery robustness. This is the first such result.
7.9 Numerical computations on the bounds of ζ
In this section, we will numerically evaluate the performance bounds on ζ = k/n suchthat the conditions (7.9), (7.46), (7.47), and (7.48) are satisfied with overwhelmingprobability as n →∞.
First, we know that the condition (7.9) fails with probability
P ≤(
n
k
)× 2k × 2×
∑s≥0
∑G∈m+1+2s(SP)
β(F,G)γ(G,SP). (7.49)

Fundamental thresholds in compressed sensing 333
0 2 4 6 8 10 12 14 16 18 200
0.01
0.02
0.03
0.04
0.05
0.06
C
k/n
Figure 7.3 Allowable sparsity as a function of C (allowable imperfection of the recovered signal is2(C+1)σk(x)1
C−1 ).
Recall that we assume m/n = δ, l = (m+1+2s)+1 and ν = l/n. In order to makeP overwhelmingly converge to zero as n→∞, following the discussions in Section 7.4,one sufficient condition is to make sure that the exponent for the combinatorial factors
ψcom = limn→∞
log((nk
)2k2
(n−kl−k
)2l−k)
n(7.50)
and the negative exponent for the angle factors
ψangle = − limn→∞
log(β(F,G)γ(G,SP))
n(7.51)
satisfy ψcom −ψangle < 0 uniformly over ν ∈ [δ,1).Following [15] we take m = 0.5555n. By analyzing the decaying exponents of the
external angles and internal angles through the Laplace methods as in Section 7.6, and7.5, we can compute the numerical results as shown in Figure 7.3, Figure 7.5, and Figure7.6. In Figure 7.3, we show the largest sparsity level ζ = k/n (as a function of C) whichmakes the failure probability of the condition (7.11) approach zero asymptotically asn→∞.As we can see, when C =1, we get the same bound ζ =0.095×0.5555≈ 0.0528
as obtained for the “weak” threshold for the ideally sparse signals in [15]. As expected,as C grows, the 1 minimization requires a smaller sparsity level ζ to achieve highersignal recovery accuracy.
In Figure 7.4(a), we show the exponents ψcom, ψint, ψext under the parameters C = 2,δ = 0.5555 and ζ = 0.0265. For the same set of parameters, in Figure 7.4(b), we comparethe exponents ψcom and ψangle: the solid curve denotes ψangle and the dashed curvedenotes ψcom. It shows that, under ζ = 0.0265, ψcom − ψangle < 0 uniformly overδ ≤ ν ≤ 1. Indeed, ζ = 0.0265 is the bound shown in Figure 7.3 for C = 2. In Figure7.5, for the parameter δ = 0.5555, we give the bounds ζ as a function of C for satisfying
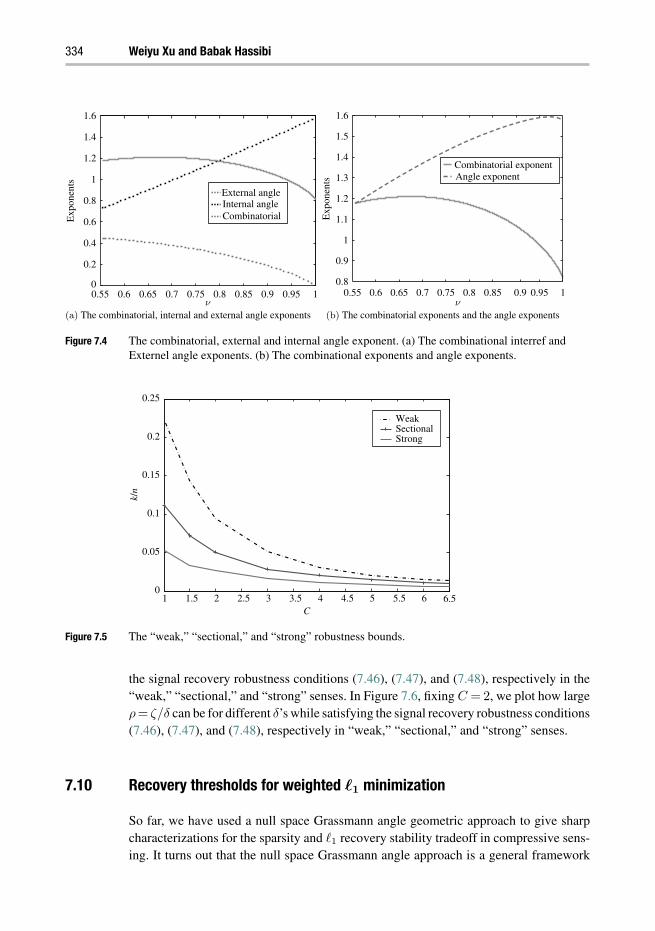
334 Weiyu Xu and Babak Hassibi
0.55
(a) The combinatorial, internal and external angle exponents (b) The combinatorial exponents and the angle exponents
0.6 0.65 0.7 0.75 0.8 0.85 0.9 0.95 10
0.2
0.4
0.6
0.8
1
1.2
1.4
1.6
Exp
onen
ts
Exp
onen
ts
External angleInternal angleCombinatorial
ν0.55 0.6 0.65 0.7 0.75 0.8 0.85 0.9 0.95 1
ν
0.8
0.9
1
1.1
1.2
1.3
1.4
1.5
1.6
Combinatorial exponentAngle exponent
Figure 7.4 The combinatorial, external and internal angle exponent. (a) The combinational interref andExternel angle exponents. (b) The combinational exponents and angle exponents.
1 1.5 2 2.5 3 3.5 4 4.5 5 5.5 6 6.50
0.05
0.1
0.15
0.2
0.25
C
k/n
WeakSectionalStrong
Figure 7.5 The “weak,” “sectional,” and “strong” robustness bounds.
the signal recovery robustness conditions (7.46), (7.47), and (7.48), respectively in the“weak,” “sectional,” and “strong” senses. In Figure 7.6, fixing C = 2, we plot how largeρ= ζ/δ can be for different δ’s while satisfying the signal recovery robustness conditions(7.46), (7.47), and (7.48), respectively in “weak,” “sectional,” and “strong” senses.
7.10 Recovery thresholds for weighted 1 minimization
So far, we have used a null space Grassmann angle geometric approach to give sharpcharacterizations for the sparsity and 1 recovery stability tradeoff in compressive sens-ing. It turns out that the null space Grassmann angle approach is a general framework

Fundamental thresholds in compressed sensing 335
0.1 0.2 0.3 0.4 0.5 0.6 0.7 0.8 0.9 10
0.1
0.2
0.3
0.4
0.5
0.6
0.7
0.8
WeakSectionalStrong
δ
ρ
Figure 7.6 The “weak,” “sectional,” and “strong” robustness bounds.
which can be used to give sharp performance bounds for other sparse recovery algo-rithms, for example, weighted 1 minimization algorithms and iterative reweighted 1algorithms. In these applications, the success of these algorithms can also be reduced tothe event that the null space of the measurement matrix intersects trivially with differentpolyhedral cones. So similarly for these applications, we will be able to characterizethe sharp sparsity transition thresholds and in turn, these threshold results will help usoptimize the configurations of the weighted algorithms.
The conventional approach to compressive sensing assumes no prior information onthe unknown signal vector other than the fact that it is sufficiently sparse over a particularbasis. In many applications, however, additional prior information is available, such as innatural images, medical imaging, and in DNA microarrays. How to exploit the structureinformation in the sparse signals has led to the development of structured sparse modelsin recent years, see Chapter 1. In the DNA microarrays applications, for instance, signalsare often block sparse, i.e., the signal is more likely to be nonzero in certain blocks ratherthan in others [37]. Even when no prior information is available, the preprocessing phasesof some sparse recovery algorithms feed “prior” information on the sparse signal (e.g.,its sparsity pattern) to the inner-loops of these sparse recovery algorithms [12, 29].
In [29] we consider a particular model for the sparse signal where the entries ofthe unknown vector fall into a number u of classes, with each class having a specificfraction of nonzero entries. The standard compressed sensing model is therefore a specialcase where there is only one class. We will focus on the case where the entries of theunknown signal fall into a fixed number u of categories; in the ith set Ki with cardinalityni, the fraction of nonzero entries is pi. This model is rich enough to capture many ofthe salient features regarding prior information. We refer to the signals generated basedon this model as nonuniform sparse signals. For completeness, we present a generaldefinition.

336 Weiyu Xu and Babak Hassibi
0 100 200 300 400 500 600 700 800 900 1000−4
−3
−2
−1
0
1
2
3
4
K1 K2
Figure 7.7 Illustration of a nonuniform sparse signal. [29] © 2009 IEEE.
definition 7.2 Let K = K1,K2, . . .,Ku be a partition of 1,2, . . . ,n, i.e. (Ki ∩Kj = ∅ for i = j, and
⋃ui=1 Ki = 1,2, . . .,n), and P = p1,p2, . . . ,pu be a set of
positive numbers in [0,1]. An n×1 vector x = (x1,x2, · · · ,xn)T is said to be a randomnonuniform sparse vector with sparsity fraction pi over the set Ki for 1 ≤ i ≤ u, if x isgenerated from the following random procedure:
• Over each set Ki, 1 ≤ i ≤ u, the set of nonzero entries of x is a random subset ofsize pi|Ki|. In other words, a fraction pi of the entries are nonzero in Ki. pi is calledthe sparsity fraction over Ki. The values of the nonzero entries of x can be arbitrarynonzero real numbers.
In Figure 7.7, a sample nonuniform sparse signal with Gaussian distribution fornonzero entries is plotted. The number of sets is considered to be u = 2 and both classeshave the same size n/2, with n = 1000. The sparsity fraction for the first class K1 isp1 = 0.3, and for the second class K2 is p2 = 0.05.
To accommodate the prior information, one can simply think of modifying 1minimization to a weighted 1 minimization as follows:
minAz=y
‖z‖w,1 = minAz=y
n∑i=1
wi|zi|. (7.52)
The index w on the norm is an indication of the n × 1 non-negative weight vector.Naturally, if we want to suppress the ith entry to be zero in the decoding result, wewould like to assign a bigger value to wi. To boost the performance of sparse recovery,it may benefit to give bigger weights to the blocks where there are more zero elements.For example, in Figure 7.7, we can assign weight W1 = 1 to the first block K1 and assignanother weight W2 > 1 to the sparser block K2.
Now the question is, what are the optimal sets of weights for weighted 1 minimization(7.52) to minimize the number of measurements (or the threshold on the number of
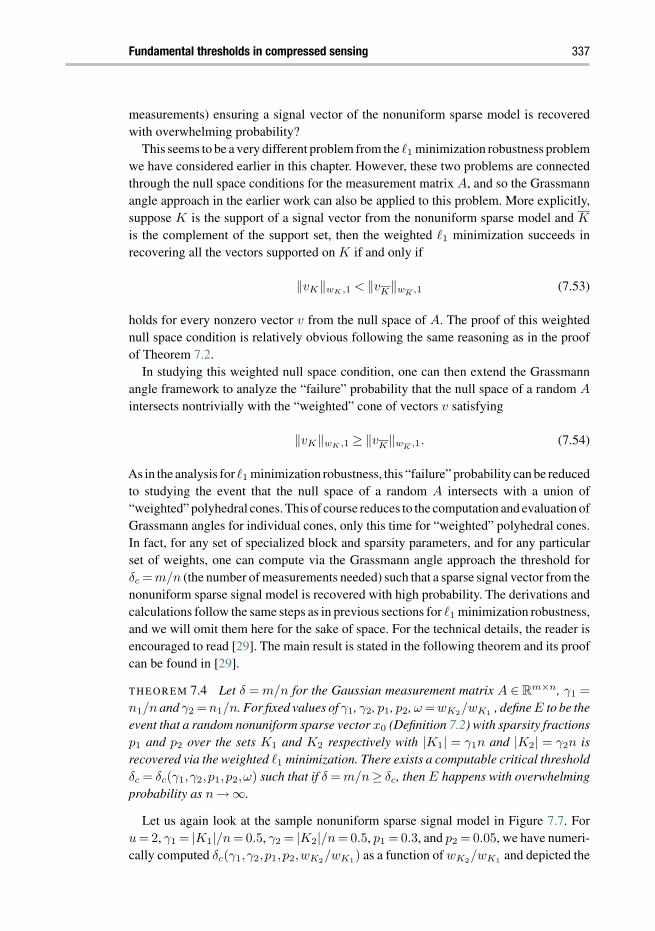
Fundamental thresholds in compressed sensing 337
measurements) ensuring a signal vector of the nonuniform sparse model is recoveredwith overwhelming probability?
This seems to be a very different problem from the 1 minimization robustness problemwe have considered earlier in this chapter. However, these two problems are connectedthrough the null space conditions for the measurement matrix A, and so the Grassmannangle approach in the earlier work can also be applied to this problem. More explicitly,suppose K is the support of a signal vector from the nonuniform sparse model and K
is the complement of the support set, then the weighted 1 minimization succeeds inrecovering all the vectors supported on K if and only if
‖vK‖wK ,1 < ‖vK‖wK ,1 (7.53)
holds for every nonzero vector v from the null space of A. The proof of this weightednull space condition is relatively obvious following the same reasoning as in the proofof Theorem 7.2.
In studying this weighted null space condition, one can then extend the Grassmannangle framework to analyze the “failure” probability that the null space of a random A
intersects nontrivially with the “weighted” cone of vectors v satisfying
‖vK‖wK ,1 ≥ ‖vK‖wK ,1. (7.54)
As in the analysis for 1 minimization robustness, this “failure” probability can be reducedto studying the event that the null space of a random A intersects with a union of“weighted” polyhedral cones. This of course reduces to the computation and evaluation ofGrassmann angles for individual cones, only this time for “weighted” polyhedral cones.In fact, for any set of specialized block and sparsity parameters, and for any particularset of weights, one can compute via the Grassmann angle approach the threshold forδc =m/n (the number of measurements needed) such that a sparse signal vector from thenonuniform sparse signal model is recovered with high probability. The derivations andcalculations follow the same steps as in previous sections for 1 minimization robustness,and we will omit them here for the sake of space. For the technical details, the reader isencouraged to read [29]. The main result is stated in the following theorem and its proofcan be found in [29].
theorem 7.4 Let δ = m/n for the Gaussian measurement matrix A ∈ Rm×n, γ1 =
n1/n and γ2 =n1/n. For fixed values of γ1, γ2, p1, p2, ω =wK2/wK1 , define E to be theevent that a random nonuniform sparse vector x0 (Definition 7.2) with sparsity fractionsp1 and p2 over the sets K1 and K2 respectively with |K1| = γ1n and |K2| = γ2n isrecovered via the weighted 1 minimization. There exists a computable critical thresholdδc = δc(γ1,γ2,p1,p2,ω) such that if δ = m/n≥ δc, then E happens with overwhelmingprobability as n →∞.
Let us again look at the sample nonuniform sparse signal model in Figure 7.7. Foru = 2, γ1 = |K1|/n = 0.5, γ2 = |K2|/n = 0.5, p1 = 0.3, and p2 = 0.05, we have numeri-cally computed δc(γ1,γ2,p1,p2,wK2/wK1) as a function of wK2/wK1 and depicted the

338 Weiyu Xu and Babak Hassibi
0 1 2 3 4 5 6 7 80.45
0.5
0.55
0.6
0.65
0.7
0.75
0.8
ω(a) p1= 0.3, p2= 0.05.
0 1 2 3 4 5 6 7 80.6
0.65
0.7
0.75
0.8
0.85
0.9
ω
δ cδ c
(b) p1= 0.65, p2= 0,1.
Figure 7.8 δc as a function of ω = wK2/wK1 for γ1 = γ2 = 0.5. [29] © 2009 IEEE.
resulting curve in Figure 7.8(a). This suggests that wK2/wK1 ≈ 2.5 is the optimal ratiothat one can choose. The value of δc for another choice of p1,p2 is shown in Figure 7.8(b).
7.11 Approximate support recovery and iterative reweighted 1
Despite its simplicity and extensive research on other polynomial-complexity sparserecovery algorithms, when no prior information is available, regular 1 minimizationstill has the best theoretically established sparse recovery threshold performance fordecoding general sparse signal vectors. However, using the Grassmann angle analysis,even when no prior information is available, we are able to show for the first timethat a class of (iterative) reweighted 1 minimization algorithms have strictly higherrecovery thresholds on recoverable sparsity levels than regular 1 minimization, forcertain classes of signal vectors whose nonzero elements have fast decaying amplitudes.The technical details of this claim are not presented here due to space limitations, and amore comprehensive study on this can be found in [44].
The reweighted 1 recovery algorithm proposed in [44] is composed of two steps. Inthe first step a standard 1 minimization is used to decode the signal. Note that when thenumber of nonzero elements is above the recovery threshold, 1 minimization generallywill not give the original sparse signal. Based on 1 minimization output, a set of entrieswhere the nonzero elements are more likely to reside (the so-called approximate support)are identified. The elements of the unknown signal are thus divided into two classes: oneis the approximate support with a relatively higher density of nonzero entries, and theother one is the complement of the approximate support, which has a smaller densityof nonzero entries. This corresponds to a nonuniform sparse model in the previoussection. The second step of reweighted 1 recovery is then to perform a weighted 1minimization (see the previous section) where elements outside the approximate supportset are penalized with a weight larger than 1.

Fundamental thresholds in compressed sensing 339
The algorithm is then given as follows, where k is the number of nonzero elementsand ω is a weighting parameter which can be adjusted.
Algorithm 7.1
1. Solve the 1 minimization problem:
x = argmin‖z‖1 subject to Az = Ax. (7.55)
2. Obtain an approximation for the support set of x: find the index set L ⊂ 1,2, . . .,nwhich corresponds to the largest k elements of x in magnitude.
3. Solve the following weighted 1 minimization problem and declare the solution asoutput:
x∗ = argmin‖zL‖1 +ω‖zL‖1 subject to Az = Ax. (7.56)
For a given number of measurements, if the support size of x, namely k = |K|, isslightly larger than the sparsity threshold of 1 minimization, then the robustness of1 minimization, as analyzed via the Grassmann angle approach in this chapter, helpsfind a lower bound for |L∩K|
|L| , i.e. the density of nonzero elements of x over the set L.With the help of this type of “prior” information about the support of x, the weighted 1algorithm, as analyzed via the Grassmann angle approach in the previous section, can beshown to guarantee a full recovery of the original sparse vector even though the numberof its nonzero elements is beyond the 1 minimization recovery threshold, and, at thebeginning, we do not have prior support information.
It should be noted that, at the cost of not having any prior information at the beginningof this algorithm, the sparse recovery threshold improvement is not universal over alltypes of signals. For example, if the nonzero elements of the signal are of a constantamplitude, the support estimate in the first step can be very misleading [12] and leads tobad recovery performance in the second step.
Other variations of reweighted 1 minimization are given in the literature. For examplethe algorithm in [12] assigns a different weight to each single entry based on the inverseof the absolute value of its decoding result in regular 1 minimization, x. In some sense,the theoretical results in [44], via the Grassmann angle analysis, explain the thresholdimprovements observed empirically in [12].
7.12 Conclusion
In this chapter we analyzed a null space characterization of the measurement matrixto guarantee a specific performance for 1-norm optimization for approximately sparse

340 Weiyu Xu and Babak Hassibi
signals. Using high-dimensional geometry tools, we give a unified null space Grass-mann angle-based analytical framework for compressive sensing. This new frameworkgives sharp quantitative tradeoffs between the signal sparsity parameter and the recoveryaccuracy of the 1 optimization for general signals or approximately sparse signals. Asexpected, the neighborly polytopes result of [15] for ideally sparse signals can be viewedas a special case on this tradeoff curve. It can therefore be of practical use in applicationswhere the underlying signal is not ideally sparse and where we are interested in the qual-ity of the recovered signal. For example, using the results and their extensions in thischapter and [15], we are able to give a precise sparsity threshold analysis for weighted1 minimization when prior information about the signal vector is available [29]. In[44], using the robustness result from this chapter, we are able to show that a two-stepweighted 1 minimization algorithm can provably improve over the sparsity thresholdof 1 minimization for interesting classes of signals, even when prior information is notavailable.
In essence, this work investigates the fundamental “balancedness” property of linearsubspaces, and may be of independent mathematical interest. In future work, it willbe interesting to obtain more accurate analysis for compressive sensing under noisymeasurements than presented in the current chapter.
7.13 Appendix
7.13.1 Derivation of the internal angles
lemma 7.9 Suppose that F is a (k−1)-dimensional face of the skewed cross-polytope
SP = y ∈ Rn | ‖yK‖1 + ‖yK
C‖1 ≤ 1
supported on the subset K with |K| = k. Then the internal angle β(F,G) between the(k−1)-dimensional face F and a (l−1)-dimensional face G (F ⊆G, G =SP) is given by
β(F,G) =Vl−k−1(
11+C2k , l−k− 1)
Vl−k−1(Sl−k−1), (7.57)
where Vi(Si) denotes the ith dimensional surface measure on the unit sphere Si, while
Vi(α′, i) denotes the surface measure for a regular spherical simplex with (i+1) vertices
on the unit sphere Si and with inner product as α′ between these (i + 1) vertices.Equation (7.57) is equal to B( 1
1+C2k , l−k), where
B(α′,m′) = θm′−1
2√
(m′ − 1)α′ +1π−m′/2α′−1/2J(m′,θ) (7.58)
with θ = (1−α′)/α′ and
J(m′,θ) =1√π
∫ ∞
−∞(
∫ ∞
0e−θv2+2ivλ dv)m′
e−λ2dλ. (7.59)

Fundamental thresholds in compressed sensing 341
Proof. Without loss of generality, assume that F is a (k− 1)-dimensional face with k
vertices as ep,1≤ p≤ k, where ep is the n-dimensional standard unit vector with the pthelement as “1”; and also assume that the (l− 1)-dimensional face G be the convex hullof the l vertices: ep,1 ≤ p ≤ k and Cep,(k +1) ≤ p ≤ l. Then the cone ConF,G formedby observing the (l− 1)-dimensional face G of the skewed cross-polytope SP from aninterior point xF of the face F is the positive cone of the vectors:
Cej − ei, for all j ∈ J\K, i ∈ K, (7.60)
and also the vectors
ei1 − ei2 , for all i1 ∈ K, i2 ∈ K, (7.61)
where J = 1,2, . . ., l is the support set for the face G.So the cone ConF,G is the direct sum of the linear hull LF = linF −xF formed by
the vectors in (7.61) and the cone ConF ⊥,G = ConF,G
⋂L⊥
F , where L⊥F is the orthogonal
complement to the linear subspace LF . Then ConF ⊥,G has the same spherical volumeas ConF,G.
Now let us analyze the structure of ConF ⊥,G. We notice that the vector
e0 =
k∑p=1
ep
is in the linear space L⊥F and is also the only such vector (up to linear scaling) supported
on K. Thus a vector x in the positive cone ConF ⊥,G must take the form
−k∑
i=1
bi × ei +
l∑i=k+1
bi × ei, (7.62)
where bi,1 ≤ i ≤ l are non-negative real numbers and
C
k∑i=1
bi =
l∑i=k+1
bi,
b1 = b2 = · · · = bk.
That is to say, the (l−k)-dimensional ConF ⊥,G is the positive cone of (l−k) vectorsa1,a2, . . .,al−k, where
ai = C × ek+i −k∑
p=1
ep/k, 1 ≤ i ≤ (l−k).
The normalized inner products between any two of these (l−k) vectors is
< ai,aj >
‖ai‖‖aj‖ =k× 1
k2
C2 +k× 1k2
=1
1+kC2 .

342 Weiyu Xu and Babak Hassibi
(In fact, ai’s are also the vectors obtained by observing the vertices ek+1, . . . ,el fromEc =
∑kp=1 ep/k, the epicenter of the face F .)
We have so far reduced the computation of the internal angle to evaluating (7.57), therelative spherical volume of the cone ConF ⊥,G with respect to the sphere surface Sl−k−1.This was computed as given in this lemma [41, 6] for the positive cones of vectorswith equal inner products by using a transformation of variables and the well-knownformula
Vi−1(Si−1) =
iπi2
Γ( i2 +1)
,
where Γ(·) is the usual Gamma function.
7.13.2 Derivation of the external angles
lemma 7.10 Suppose that F is a (k−1)-dimensional face of the skewed cross-polytope
SP = y ∈ Rn | ‖yK‖1 + ‖yK
C‖1 ≤ 1
supported on a subset K with |K| = k. Then the external angle γ(G,SP) between a(l− 1)-dimensional face G (F ⊆ G) and the skewed cross-polytope SP is given by
γ(G,SP) =2n−l
√π
n−l+1
∫ ∞
0e−x2
(
∫ x
C
√k+ l−k
C2
0e−y2
dy)n−l dx. (7.63)
Proof. We take the same proof technique of transforming external angle calculationinto the integral of Gaussian distribution over the outward normal cone [3]. Without lossof generality, we assume K = 1, . . . ,k. Since the (l − 1)-dimensional face G is theconvex hull of k regular vertices with length 1 and (l−k) vertices of length C, withoutof loss of generality, again we have the (l− 1)-dimensional face
G = conve1, . . .,ek,C × ek+1, . . .,C × el
of the skewed cross-polytope SP. Since there are 2n−l facets containing the face G, the2n−l outward normal vectors of the supporting hyperplanes of the facets containing G
are given by
k∑
p=1
ep +
n∑p=l+1
jpep/C +
l∑p=k+1
ep/C,jp ∈ −1,1.
The outward normal cone c(G,SP) at the face G is the positive hull of these normalvectors. We also have∫
c(G,SP)e−‖x‖2
dx = γ(G,SP )Vn−l(Sn−l)
×∫ ∞
0e−r2
rn−l dx = γ(G,SP).π(n−l+1)/2, (7.64)

Fundamental thresholds in compressed sensing 343
where Vn−l(Sn−l) is the spherical volume of the (n− l)-dimensional sphere Sn−l.
Suppose a vector in the cone c(G,SP) takes value t at index i = 1, then that vectorcan take any value in the interval [−t/C,t/C] at those indices (l + 1) ≤ i ≤ n (due tothe negative and positive signs of the outward normal vectors at those indices) and thatvector must take the value t/C at the indices (k+1)≤ i≤ l. So we only need (n− l+1)
free variables in describing the outward normal cone c(G,SP), and we define a set U as
x ∈ Rn−l+1 | xn−l+1 ≥ 0, |xp| ≤xn−l+1
C,1 ≤ p ≤ (n− l).
So we further define a one-one mapping from the describing variables to the conec(G,SP) f(x1, . . . ,xn−l+1) : U → c(G,SP)
f(x1, . . . ,xn−l+1) =
n∑p=l+1
xp−lep +
l∑p=k+1
xn−l+1
Cep +
k∑p=1
xn−l+1 × ep.
Then we can evaluate∫c(G,SP)
e−‖x′‖2dx′
=
√k +
l−k
C2
∫U
e−‖f(x)‖2dx
=
√k +
l−k
C2
∫ ∞
0
∫ xn−l+1C
− xn−l+1C
· · ·∫ xn−l+1
C
− xn−l+1C
e−x21−···−x2
n−l−(k+ l−k
C2 )x2n−l+1 dx1 · · · dxn−l+1
=
√k +
l−k
C2
∫ ∞
0e−(k+ l−k
C2 )x2×(∫ x
C
− xC
e−y2dy
)n−l
dx
= 2n−l
∫ ∞
0e−x2
(∫ x
C
√k+ l−k
C2
0e−y2
dy
)n−l
dx,
where√
k + l−kC2 is due to the change of integral variables. We obtain the conclusion of
this lemma by combining this integral result with (7.64).
7.13.3 Proof of Lemma 7.7
Proof. Consider any fixed δ > 0. First, we consider the internal angle exponent ψint,where we define γ′ = ρδ
C2−1C2 ρδ+ ν
C2
. Then for this fixed δ,
1−γ′
γ′ ≥C2−1
C2 ρδ + δC2
ρδ− 1
uniformly over ν ∈ [δ,1].

344 Weiyu Xu and Babak Hassibi
Now if we take ρ small enough,C2−1
C2 ρδ+ δC2
ρδ can be arbitrarily large. By the asymptoticexpression (7.34), this leads to large enough internal decay exponent ψint. At the sametime, the external angle exponent ψext is lower-bounded by zero and the combinatorialexponent is upper-bounded by some finite number. Then if ρ is small enough, we willget the net exponent ψnet to be negative uniformly over the range ν ∈ [δ,1].
7.13.4 Proof of Lemma 7.8
Proof. Suppose instead that ρN (δ,C) > 1C+1 . Then for every vector w from the null
space of the measurement matrix A, any ρN (δ,C) fraction of the n components in w takeno more than 1
C+1 fraction of ‖w‖1. But this cannot be true if we consider the ρN (δ,C)
fraction of w with the largest magnitudes.Now we only need to prove the lower bound for ρN (δ,C); in fact, we argue that
ρN (δ,C) ≥ ρN (δ,C = 1)
C2 .
We know from Lemma 7.7 that ρN (δ,C) > 0 for any C ≥ 1. Denote ψnet(C),ψcom(ν;ρ,δ,C), ψint(ν;ρ,δ,C), and ψext(ν;ρ,δ,C) as the respective exponents fora certain C. Because ρN (δ,C = 1) > 0, for any ρ = ρN (δ,C = 1)− ε, where ε > 0 isan arbitrarily small number, the net exponent ψnet(C = 1) is negative uniformly overν ∈ [δ,1].
By examining the formula (7.20) for the external angle γ(G,SP), where G is a(l − 1)-dimensional face of the skewed cross-polytope SP, we have γ(G,SP) is adecreasing function in both k and C for a fixed l. So γ(G,SP) is upper-bounded by
2n−l
√π
n−l+1
∫ ∞
0e−x2
(
∫ x√l
0e−y2
dy)n−l dx, (7.65)
namely the expression for the external angle when C = 1. Then for any C > 1 and anyk, ψext(ν;ρ,δ,C) is lower-bounded by ψext(ν;ρ,δ,C = 1).
Now let us check ψint(ν;ρ,δ,C) by using the formula (7.26). With
γ′ =ρδ
C2−1C2 ρδ + ν
C2
,
we have
1−γ′
γ′ = − 1
C2 +ν
C2ρδ. (7.66)
Then for any fixed δ > 0, if we take ρ =ρN (δ,C=1)−ε
C2 , where ε is an arbitrarily small
positive number, then for any ν ≥ δ, 1−γ′
γ′ is an increasing function in C. So, followingeasily from its definition, ξγ′(yγ′) is an increasing function in C. This further impliesthat ψint(ν;ρ,δ) is an increasing function in C if we take ρ =
ρN (δ,C=1)−εC2 , for any
ν ≥ δ.

Fundamental thresholds in compressed sensing 345
Also, for any fixed ν and δ, it is not hard to show that ψcom(ν;ρ,δ,C) is a decreasingfunction in C if ρ =
ρN (δ,C=1)C2 . This is because in (7.16),(
n
k
)(n−k
l−k
)=
(n
l
)(l
k
).
Thus for any C > 1, if ρ =ρN (δ,C=1)−ε
C2 , the net exponent ψnet(C) is also negativeuniformly over ν ∈ [δ,1]. Since the parameter ε can be arbitrarily small, our claim andLemma 7.8 then follow.
Acknowledgement
This work was supported in part by the National Science Foundation under grant no.CCF-0729203, by the David and Lucille Packard Foundation, and by Caltech’s LeeCenter for Advanced Networking.
References
[1] F. Affentranger and R. Schneider. Random projections of regular simplices. Discrete ComputGeom, 7(3):219–226, 1992.
[2] R. Baraniuk, M. Davenport, R. DeVore, and M. Wakin. A simple proof of the restrictedisometry property for random matrices. Construc Approx, 28(3):253–263, 2008.
[3] U. Betke and M. Henk. Intrinsic volumes and lattice points of crosspolytopes. Monat fürMath, 115(1-2):27–33, 1993.
[4] J. Blanchard, C. Cartis, and J. Tanner. Compressed sensing: How sharp is the restrictedisometry property? 2009. www.maths.ed.ac.uk/ tanner/.
[5] W. M. Boothby. An Introduction to Differential Manifolds and Riemannian Geometry.Springer-Verlag, 1986. 2nd edn. San Diego, CA: Academic Press.
[6] K. Böröczky and M. Henk. Random projections of regular polytopes. Arch Math (Basel),73(6):465–473, 1999.
[7] E. J. Candès. Compressive sampling. In Int Congr Math. Vol. III: 1433–1452. Eur. Math.Soc., Zürich, 2006.
[8] E. J. Candès and P. Randall. Highly robust error correction by convex programming. IEEETrans Inform Theory, 54:2829–2840, 2008.
[9] E. J. Candès, J. Romberg, and T. Tao. Robust uncertainty principles: exact signal recon-struction from highly incomplete frequency information. IEEE Trans Inform Theory,52(2):489–509, 2006.
[10] E. J. Candès, J. Romberg, and T. Tao. Stable signal recovery from incomplete and inaccuratemeasurements. Commun Pure Appl Math, 59:1208–1223, 2006.
[11] E. J. Candès and T. Tao. Decoding by linear programming. IEEE Trans Inform Theory,51(12):4203–4215, 2005.
[12] E. J. Candès, M. P. Wakin, and S. P. Boyd. Enhancing sparsity by reweighted 1 minimization.J Fourier Anal Appl, 14(5):877–905, 2008.
[13] J. F. Claerbout and F. Muir. Robust modeling with erratic data. Geophysics, 38(5):826–844,1973.
346 Weiyu Xu and Babak Hassibi
[14] A. Cohen, W. Dahmen, and R. DeVore. Compressed sensing and best k-term approximation.J Am Math Soc, 22:211–231, 2008.
[15] D. Donoho. High-dimensional centrally symmetric polytopes with neighborliness propor-tional to dimension. Discrete Comput Geom, 35(4):617–652, 2006.
[16] D. Donoho, A. Maleki, and A. Montanari. The noise-sensitivity phase transition incompressed sensing. arXiv:1004.1218, 2010.
[17] D. Donoho, A. Maleki, and A. Montanari. Message passing algorithms for compressedsensing. In Proc Nat Acad Sci (PNAS), November 2009.
[18] D. Donoho and J. Tanner. Observed universality of phase transitions in high-dimensionalgeometry. Phil Trans Roy Soc A, 367:4273–4293, 2009.
[19] D. L. Donoho. Compressed sensing. IEEE Trans Inform Theory, 52(4): 1289–1306, 2006.[20] D. L. Donoho and J. Tanner. Neighborliness of randomly projected simplices in high
dimensions. Proc Nat Acad Sci USA, 102(27):9452–9457, 2005.[21] C. Dwork, F. McSherry, and K. Talwar. The price of privacy and the limits of lp decoding.
Proc 39th Ann ACM Symp Theory of Comput (STOC), 2007.[22] A. Feuer and A. Nemirovski. On sparse representation in pairs of bases. IEEE Trans
Information Theory, 49(6):1579–1581, 2003.[23] A. Garnaev and E. Gluskin. The widths of a Euclidean ball. Dokl Acad Nauk USSR, 1048–
1052, 1984.[24] Y. Gordon. On Milman’s inequality and random subspaces which escape through a mesh in
Rn. Geome Asp Funct Anal, 84–106, 1987.[25] B. Grünbaum. Grassmann angles of convex polytopes. Acta Math, 121:293–302, 1968.[26] B. Grünbaum. Convex polytopes, Graduate Texts in Mathematics, vol 221. Springer-Verlag,
New York, 2nd edn., 2003. Prepared and with a preface by Volker Kaibel, Victor Klee, andGünter M. Ziegler.
[27] B. Kashin. The widths of certain finite dimensional sets and classes of smooth functions.Izvestia, 41:334–351, 1977.
[28] B. S. Kashin and V. N. Temlyakov. A remark on compressed sensing. Math Notes, 82(5):748–755, November 2007.
[29] M. A. Khajehnejad, W. Xu, A. S. Avestimehr, and B. Hassibi. Weighted 1 minimization forsparse recovery with prior information. In Proc Int Symp Inform Theory, 2009.
[30] N. Linial and I. Novik. How neighborly can a centrally symmetric polytope be? DiscreteComput Geom, 36(6):273–281, 2006.
[31] P. McMullen. Non-linear angle-sum relations for polyhedral cones and polytopes. Math ProcCamb Phil Soc, 78(2):247–261, 1975.
[32] M. L. Mehta. Random Matrices. Amsterdam: Academic Press, 2004.[33] M. Rudelson and R. Vershynin. Geometric approach to error correcting codes and recon-
struction of signals. Int Math Res Notices, 64:4019–4041, 2005.[34] M. Rudelson and R. Vershynin. On sparse reconstruction from Fourier and Gaussian
measurements. Commun Pure and Appl Math, 61, 2007.[35] L. A. Santaló. Geometría integral enespacios de curvatura constante. Rep. Argentina Publ.
Com. Nac. Energí Atómica, Ser. Mat 1, No.1, 1952.[36] M. Stojnic. Various thresholds for 1-optimization in compressed sensing. 2009. Preprint
available at http://arxiv.org/abs/0907.3666.[37] M. Stojnic, F. Parvaresh, and B. Hassibi. On the reconstruction of block-sparse signals with
an optimal number of measurements. IEEE Trans Signal Proc, 57(8):3075–3085, 2009.

Fundamental thresholds in compressed sensing 347
[38] M. Stojnic, W. Xu, and B. Hassibi. Compressed sensing – probabilistic analysis of a null-spacecharacterization. Proc IEEE Int Conf Acoust, Speech, Signal Proc (ICASSP), 2008.
[39] M. Stojnic, W. Xu, and B. Hassibi. Compressed sensing of approximately sparse signals.IEEE Int Symp Inform Theory, 2008.
[40] S. Vavasis. Derivation of compressive sensing theorems for the spherical section property.University of Waterloo, CO 769 lecture notes, 2009.
[41] A. M. Vershik and P. V. Sporyshev. Asymptotic behavior of the number of faces of randompolyhedra and the neighborliness problem. Sel Math Soviet, 11(2):181–201, 1992.
[42] W. Xu and B. Hassibi. Compressed sensing over the Grassmann manifold:Aunified geometricframework. Accepted to IEEE Trans Inform Theory.
[43] W. Xu and B. Hassibi. Compressed sensing over the Grassmann manifold:Aunified analyticalframework. Proc 46th Ann Allerton Conf Commun, Control Comput, 2008.
[44] W. Xu, A. Khajehnejad, S. Avestimehr, and B. Hassibi. Breaking through the thresholds: ananalysis for iterative reweighted 1 minimization via the Grassmann angle framework. ProcInt Conf Acoust, Speech, Signal Proc (ICASSP), 2010.
[45] Y. Zhang. When is missing data recoverable? 2006. Available online at www.caam.rice.edu/∼zhang/reports/index.html.
[46] Y. Zhang. Theory of compressive sensing via 1-minimization: a non-RIP analysis andextensions. 2008. Available online at www.caam.rice.edu/∼zhang/reports/index.html.

8 Greedy algorithms forcompressed sensingThomas Blumensath, Michael E. Davies, and Gabriel Rilling
Compressed sensing (CS) is often synonymous with 1-based optimization. However,when choosing an algorithm for a particular application, there is a range of differ-ent properties that have to be considered and weighed against each other. Importantalgorithm properties, such as speed and storage requirements, ease of implementation,flexibility, and recovery performance have to be compared. In this chapter we willtherefore present a range of alternative algorithms that can be used to solve the CSrecovery problem and which outperform convex optimization-based methods in someof these areas. These methods therefore add important versatility to any CS recoverytoolbox.
8.1 Greed, a flexible alternative to convexification
The thread that binds all of the approaches of this chapter is their “greediness.” Inthis context, the moniker “greedy” implies strategies that, at each step, make a “hard”decision usually based upon some locally optimal optimization criterion. Recall the noisyCS recovery problem,1
y = Ax+ e, (8.1)
where, for a given y ∈Rm, we want to recover an approximately k-sparse vector x∈Rn
under the assumption that the error e∈ Rm is bounded and that the measurement matrixA satisfies the restricted isometry property (RIP)
(1− δ2k)‖x‖22 ≤ ‖Ax‖2
2 ≤ (1+ δ2k)‖x‖22, (8.2)
for all 2k-sparse vectors x and for some 0 ≤ δ2k < 1.In this chapter, we consider two broad categories of greedy methods to recover x. The
first set of strategies, which we jointly call “greedy pursuits” and discuss in Section 8.2,
1 We restrict our discussion here primarily to real vectors, though all ideas discussed here extend triviallyalso to vectors with elements in C.
Compressed Sensing: Theory and Applications, ed. Yonina C. Eldar and Gitta Kutyniok. Published byCambridge University Press. © Cambridge University Press 2012.
Greedy algorithms for compressed sensing 349
can be defined as a set of methods that iteratively build up an estimate x. Starting witha zero vector, these methods estimate a set of nonzero components of x by iterativelyadding new components that are deemed nonzero. This greedy selection is alternatedwith an estimation step in which the values for the nonzero components are optimized.These methods can often lead to very fast algorithms that are applicable to very largedata-sets, however, theoretical performance guarantees are typically weaker than thoseof some other methods.
The second set of routines alternates both element selection as well as element pruningsteps. Due to their ability to remove nonzero elements, these will be called “Threshold-ing” algorithms and will be discussed in Section 8.3. These methods are often very easy toimplement and can be relatively fast. They have theoretical performance guarantees thatrival those guarantees derived for convex optimization-based approaches as discussed inChapter 1. Furthermore, as discussed in more detail in Section 8.4, not only can they beused to recover sparse signals, but are easily adapted to take account of many additionalsignal structures and are even applicable to recovery problems where non-sparse signalmodels are used.
8.2 Greedy pursuits
In this section a class of algorithms collectively called greedy pursuits will be discussed.The term “pursuits” dates back to 1974 [1] when the concept of projection pursuit wasintroduced. The technique projected the data in a given direction and tested for deviationfrom Gaussianity and it was this idea of projecting data onto different directions thatwas taken up by Mallat and Zhang [2] and used for signal approximation.
There is now a large and growing family of greedy pursuit techniques for signal approx-imation with a long and multi-rooted history. Similar ideas have appeared independentlyin different disciplines. For example, the notions of: forward stepwise regression in statis-tics [3]; the pure greedy algorithm in nonlinear approximation [4]; Matching Pursuit insignal processing [2]; and the CLEAN algorithm in radio astronomy [5] are all closelyrelated yet discovered independently.
Here we will concentrate on a handful of greedy pursuit algorithms, briefly highlight-ing interesting variations.
8.2.1 General framework
Let us introduce greedy pursuits as a family of algorithms that share the following twofundamental steps: element selection and coefficient update. These methods are usuallyinitialized with a zero estimate, x[0] = 0. With this initialization, the initial residual erroris r[0] = y −Ax[0] = y and the support set (i.e. the indices of the nonzero elements) ofthe first estimate x[0] is T = ∅. Each iteration then updates these quantities by addingadditional elements (columns from A) to the support set T and by updating the signalestimate x, thereby decreasing the residual observation error r. This is done, with minorvariations, as outlined in Algorithm 8.1.

350 T. Blumensath, M. E. Davies, and G. Rilling
Algorithm 8.1 General greedy pursuit frameworkInput: y, A, and k
for i = 1; i := i+1 till stopping criterion is met doCalculate g[i] = AT r[i] and select elements (columns from A) based on themagnitude of the elements of g[i]
Calculate a revised estimate for x[i] (and hence y[i]) by decreasing the cost function
F (x[i]) = ‖y−Ax[i]‖22 (8.3)
end forOutput: r[i] and x[i]
Algorithm 8.2 Matching Pursuit (MP)Input: y, A, and k
r[0] = y, x[0] = 0for i = 1; i := i+1 till stopping criterion is met do
g[i] = AT r[i−1]
j[i] = argmaxj |g[i]j |/‖Aj‖2
x[i]j[i] = x
[i−1]j[i] + g
[i]j[i]/‖Aj[i]‖2
2
r[i] = r[i−1] −Aj[i]g[i]j[i]/‖Aj[i]‖2
2end forOutput: r[i] and x[i]
Matching PursuitOne of the simplest pursuit algorithms is Matching Pursuit (MP) [2] (known as thePure Greedy Algorithm in approximation theory [4]) summarized in Algorithm 8.2.The approximation is incremental, selecting one column from A at a time and, at eachiteration, only the coefficient associated with the selected column is updated.
At each iteration, the update x[i]j[i] = x
[i−1]j[i] +g
[i]j[i]/‖Aj[i]‖2
2 minimizes the approxima-
tion cost ‖y −Ax[i]‖22 with respect to the selected coefficient. Here and throughout the
chapter Aj is the jth column of the matrix A. Note that MP will generally repeatedlyselect the same columns from A in order to further refine the approximation. However,it is known that ‖r[i]‖ converges linearly to zero whenever the columns of A span Rm
[2]. MP will therefore stop in a finite number of iterations if the norm of r[i] is used todefine a stopping criterion for the algorithm.
MP requires repeated evaluation of matrix multiplications involving AT which dom-inate the computational complexity. Therefore MP is generally proposed for use withmatrices A that admit a fast implementation, often based on the fast Fourier transform(FFT). Extremely fast implementations of MP are now available for problems where A
has columns with restricted support [6].

Greedy algorithms for compressed sensing 351
Algorithm 8.3 Orthogonal Matching Pursuit (OMP)Input: y, A, and k
Initialize: r[0] = y, x[0] = 0,T [0] = ∅for i = 1; i := i+1 till stopping criterion is met do
g[i] = AT r[i−1]
j[i] = argmaxj |g[i]j |/‖Aj‖2
T [i] = T [i−1] ∪ j[i]
x[i]
r[i] = y−Ax[i]
end forOutput: r[i] and x[i]
Orthogonal Matching PursuitA more sophisticated strategy is implemented in Orthogonal Matching Pursuit (OMP)[7, 8] (known as the Orthogonal GreedyAlgorithm in approximation theory [4]). In OMPthe approximation for x is updated in each iteration by projecting y orthogonally ontothe columns of A associated with the current support set T [i]. OMP therefore minimizes‖y − Ax‖2 over all x with support T [i]. The full algorithm is listed in Algorithm 8.3where † in step 7 represents the pseudo-inverse operator. Note that in contrast to MP theminimization is performed with respect to all of the currently selected coefficients:
x[i]T [i] = argmin
xT [i]
‖y−AT [i] xT [i]‖22. (8.4)
Unlike MP, OMP never re-selects an element and the residual at any iteration is alwaysorthogonal to all currently selected elements.
Although for general dictionaries, as with MP, the computational cost of OMP isdominated by the matrix-vector products, when fast transforms are used the orthogonal-ization step is usually the bottleneck. Various techniques for solving the least-squaresproblem have been proposed including QR factorization [8], Cholesky factorization [9],or iterative techniques such as conjugate gradient methods. While OMP is more compu-tationally complex than MP it generally enjoys superior performance, particularly in thecontext of CS. A detailed comparison of computation and storage costs will be given inSection 8.2.4.
There are two main problems with applying OMP to large-scale data. First, the com-putation and storage costs of a single iteration of OMP are quite high for large-scaleproblems and second, the selection of one atom at a time means that exactly k iterationsare needed to approximate y with k atoms of A. When k is large this can be impracticallyslow. Some of the variations discussed below were proposed to specifically address theseissues.

352 T. Blumensath, M. E. Davies, and G. Rilling
8.2.2 Variations in coefficient updates
Although both MP and OMP have identical selection strategies and update their coeffi-cients by minimizing the squared error criterion, ‖y −Ax[i]‖2
2, the form of the updateis substantially different. OMP minimizes over the coefficients for all selected elementsat iteration i while in MP the minimization only involves the coefficient of the mostrecently selected element. These are, however, only two possibilities and it is interestingto consider what other updates can be used. For example, a relaxed form of MP has beenconsidered where a damping factor is included [10].2
A framework for pursuits with different directional updates was presented in [11].Consider at the ith iteration updating the selected coefficients x
[i−1]T [i] along some other,
yet to be defined, direction d[i]T [i] .
x[i]T [i] = x
[i−1]T [i] +a[i]d
[i]T [i] . (8.5)
The step size a[i] can be explicitly chosen to minimize the same quadratic cost as before.
a[i] =〈r[i], c[i]〉‖c[i]‖2
2, (8.6)
where c[i] = AT [i]d[i]T [i] . If we use such an update along with the standard MP/OMP
selection criterion then this directional pursuit is a member of the family of generalMatching Pursuit algorithms as defined in [12] and shares the same necessary andsufficient conditions for (worst case) exact recovery as OMP [13].
Note also that both MP and OMP naturally fit in this framework with update directions:δj[i] and A†
T [i]gT [i] respectively.The directional pursuit family of algorithms is summarized in Algorithm 8.4. The
aim of introducing directional updates is to produce an approximation to the orthogonalprojection with a reduced computation cost. Here we will focus on gradient-based updatestrategies [11].3
Gradient PursuitsA natural choice for the update direction is the negative gradient of the cost function‖y−AT [i] xT [i]‖2
2, i.e.
d[i]T [i] := g
[i]T [i] = AT
T [i](y−AT [i] x[i−1]T [i] ). (8.7)
Fortunately we already have this as a by-product of the selection process. We simplyrestrict the vector g[i] (which has already been calculated) to the elements T [i]. Using(8.7) as the directional update results in the most basic form of directional pursuit whichwe call Gradient Pursuit (GP) [11].
2 A similar idea is used in the CLEAN algorithm to remove the effects of the point spread function inastronomical imaging [5].
3 Another instance of directional pursuit is presented in [14] and uses local directional updates to exploit thelocalized structure present in certain dictionaries.

Greedy algorithms for compressed sensing 353
Algorithm 8.4 Directional PursuitInput: y, A, and k
Initialize: r[0] = y, x[0] = 0,T [0] = ∅for i = 1; i := i+1 till stopping criterion is met do
g[i] = AT r[i−1]
j[i] = argmaxj |g[i]j |/‖Aj‖2
T [i] = T [i−1] ∪ j[i]
calculate update direction d[i]T [i] ; c[i] = AT [i]d
[i]T [i] and a[i] =
〈r[i],c[i]〉‖c[i]‖2
2
x[i]T [i] := x
[i−1]T [i] +a[i]d
[i]T [i]
r[i] = r[i−1] −a[i]c[i]
end forOutput: r[i] and x[i]
The increase in computational complexity over MP is small and when the submatricesof A are well conditioned (i.e. A has a good restricted isometry property) then minimizingalong the gradient direction can provide a good approximation to solving the full least-squares problem.
Specifically, suppose that A has a small restricted isometry constant δk then we canbound the condition number κ of the Gram matrix restricted to T [i], G[i] = AT
T [i]AT [i]
by
κ(G[i]) ≤(
1+ δk
1− δk
)(8.8)
for all T [i], |T [i]| ≤ k. A worst case analysis of the gradient line search [15] then showsthat for small δk the gradient update achieves most of the minimization:
F (x[i]T [i])−F (x∗
T [i])
F (x[i−1]T [i] )−F (x∗
T [i])≤(
κ− 1
κ+1
)2
≤ δ2k
(8.9)
where x∗T [i] denotes the least-squares solution of F (xT [i]) = ‖y −AxT [i]‖2
2. Hence forsmall δk the convergence, even of a single gradient iteration, is good.
Conjugate gradientsAn alternative gradient-based update, popular in solving quadratic optimization problemsis the conjugate gradient. The conjugate gradient method uses successive line minimiza-tions along directions that are G-conjugate where a set of vectors d[1],d[2], . . . ,d[i] isdefined as G-conjugate if 〈d[i],Gd[j]〉= 0 for all i = j, see [16, Section 10.2]. The magicof the conjugate gradient method is that if we start with d[1] =−g[1], the current negativegradient, then after line minimization a new conjugate direction can be calculated by:
d[i+1] = g[i+1] +β[i]d[i] (8.10)

354 T. Blumensath, M. E. Davies, and G. Rilling
where β[i] = 〈g[i+1],Gd[i]〉/〈d[i],Gd[i]〉 to ensure that 〈d[i+1],Gd[i]〉 = 0. Note that thisguarantees that d[i+1] is conjugate to all previous search directions even though β[i]
explicitly forces conjugacy only with respect to d[i].The same principle can also be applied to the pursuit optimization at any given iteration
with G[i] = ATT [i]AT [i] and this has indeed been advocated as an efficient method of
orthogonalization [17]. However this ignores the work done in the previous iterations. In[11] a conjugate gradient method that spans across the pursuit iterations was investigated.This enables the pursuit cost function (8.3) to be fully minimized using a single updatedirection and without the need for a direct calculation of the pseudo-inverse A†
T [i] .However, unlike the classical conjugate gradient method each new direction must beselected to be explicitly conjugate to all previous directions. This is a consequence of thechange in dimensionality of the solution space at each iteration. The resulting algorithmhas a similar structure to the QR factorization implementation of OMP and a similarcomputational cost.
In principle one can implement a conjugate direction pursuit that enforces conjugacywith as many previous update directions as one wants, thus providing a family of pur-suit algorithms that interpolate between the conjugate gradient implementation of OMP(conjugate to all directions) and GP (conjugate to no previous directions).
For the remainder of this section we will concentrate on the specific case where weenforce conjugacy with only the last preceding direction. We call this Conjugate GradientPursuit (CGP) [11].
Following (8.10) at the ith iteration we can select the update direction
d[i]T [i] = g
[i]T [i] +β[i]d
[i−1]T [i] , (8.11)
where we can calculate β[i] as follows.
β[i] =
⟨(AT [i−1]d
[i−1]T [i−1]),(AT [i]g
[i]T [i])
⟩‖AT [i−1]d
[i−1]T [i−1]‖2
2
(8.12)
=
⟨c[i],AT [i]g
[i]T [i]
⟩‖c[i]‖2
2(8.13)
where c[i] = AT [i−1]d[i−1]T [i−1] as before. This suggests that CGP will require the additional
matrix-vector product AT [i]g[i]T [i] in comparison to GP. However, calculating AT [i]g
[i]T [i]
allows us to evaluate c[i+1] without additional matrix vector products through thefollowing recursion [18]
c[i+1] = AT [i]d[i]T [i]
= AT [i]
(g[i]T [i] +β[i]d
[i−1]T [i]
)= AT [i]g
[i]T [i] +β[i]c[i].
(8.14)

Greedy algorithms for compressed sensing 355
Therefore CGP has exactly the same order of computational cost as GP. Furthermore,using arguments from [19] it is possible to show that the CGP update will always be atleast as good as the GP update in terms of reducing the cost function (8.3) [18], makingCGP the preferred option.
8.2.3 Variations in element selection
The second problem with MP/OMP type strategies is the need to perform at least as manyiterations as there are atoms to be selected. This does not scale for large dimensions: i.e.where the number of elements to be selected is large (but still small with respect to thesize of A). In order to speed up pursuit algorithms it is thus necessary to select multipleelements at a time. This idea, first proposed in [17] is termed stagewise selection.
In MP/OMP, the selection step chooses the element that is maximally correlated withthe residual: j[i] = argmaxj |g
[i]j |/‖Aj‖2. A very natural stagewise strategy is to replace
the maximum by a threshold criterion.Let λ[i] define the threshold at iteration i. Then the stagewise selection becomes:
T [i] = T [i−1] ∪j : |g[i]j |/‖Aj‖2 ≥ λ[i]. (8.15)
Various choices for λ[i] are possible. For example (8.15) includes simple (non-iterative)thresholding [20]. While this is by far the most computationally simple procedure ithas limited recovery guarantees – see Schnass and Vandergheynst [20]. We thereforeconcentrate on iterative thresholding strategies.4 In particular we will focus on twoproposed schemes: Stagewise Orthogonal Matching Pursuit (StOMP) in which λ[i] isa function of the residual r[i−1] [17] and Stagewise Weak Gradient Pursuit (StWGP)where λ[i] is a function of the correlations with the residual g[i] [18].
StOMPIn [17] StOMP was proposed with the aim of providing good reconstruction performancefor CS applications while keeping computational costs low enough for application tolarge-scale problems. The threshold strategy is:
λ[i]stomp = t[i]‖r[i−1]‖2/
√m, (8.16)
where the authors give the guidance that a good choice of t[i] will usually take a value:2 ≤ t[i] ≤ 3. Specific formulae for t[i] are derived in the appendix of [17] for the caseof Bernoulli distributed sparse coefficients and A generated from a uniform sphericalensemble.5 Theoretical performance guarantees for this method when applied to more
4 Note that the thresholding methods discussed here differ from methods such as Iterative HardThresholding [21], CoSaMP [22], and Subspace Pursuit [23]. Such algorithms do not simply usethresholding to augment the support set. They also use it to prune out previously selected elements. Thesealgorithms and their impressive theoretical guarantees will be discussed in detail in Section 8.3.
5 Two thresholds are derived based upon classical detection criteria: constant false alarm rates and constantfalse discovery rates.

356 T. Blumensath, M. E. Davies, and G. Rilling
general matrices A and more general coefficient values are not available. Furthermorefrom a practical point of view, the selection of the parameter t appears critical for goodperformance.
A specific problem that can occur is that the algorithm terminates prematurely whenall inner products fall below the threshold. Indeed in the range of experiments presentedin [18] StOMP gave mixed results.
Stagewise weak element selectionThe selection strategy in StOMP is difficult to generalize beyond specific scenarios.Blumensath and Davies [18] therefore proposed an alternative selection strategy thatcan be more tightly linked to general MP/OMP recovery results based upon a weakselection strategy.
Weak selection was originally introduced in [2] to deal with the issue of infinite-dimensional dictionaries where only a finite number of inner products can be evaluated.Weak selection allows the selection of a single element Aj[i] whose correlation with theresidual is close to maximum:
|g[i]j[i] |
‖Aj[i]‖2≥ αmax
j
|g[i]j |
‖Aj‖2. (8.17)
A nice property of weak orthogonal matching pursuit (WOMP) is that it inherits aweakened version of the recovery properties of MP/OMP [13].
Instead of selecting a single element the stagewise weak selection chooses all elementswhose correlation is close to the maximum. That is we set the threshold in (8.16) as:
λ[i]weak = αmax
j
|g[i]j |
‖Aj‖2.
In practice, variations in selection strategy are complementary to variations in direc-tional updates. In [18] the combination of CGP and the stagewise weak selection isadvocated as it has good theoretical properties as well as good empirical performance.The combination is called Stagewise Weak Conjugate Gradient Pursuit (StWGP).
ROMPAnother alternative multi-element selection strategy that has been proposed is the Reg-ularized OMP (ROMP) [24], [22] which groups the inner products gi into sets Jk suchthat the elements in each set have a similar magnitude, i.e. they satisfy
|gi|‖Ai‖2
≤ 1
r
|gj |‖Aj‖2
, for all i, j ∈ Jk.
ROMP then selects the set Jk for which∑
j∈Jk(|gj |/‖Aj‖2)
2 is largest.For the ROMP selection strategy proposed in [24] and [22], r was assumed to be 0.5.
In this case, the algorithm was shown to have uniform performance guarantees closer tothose of 1-based methods than exist for OMP and its derivatives.

Greedy algorithms for compressed sensing 357
ROMP has played an important historical role in the research on greedy algorithms,being the first to enjoy such “good” uniform recovery guarantees. However the constantsin the theoretical guarantees are significantly larger than those for 1 minimization andROMP has been quickly superseded by the thresholding techniques that we will discussin Section 8.3. This, combined with the fact that empirically ROMP is not competitivewith other pursuit algorithms [18] means that it is generally not considered as a goodpractical algorithm for CS.
ORMPA different variant in element selection that is worth mentioning occurs in Order Recur-sive Matching Pursuit (ORMP). Unlike the stagewise selection, where the aim is toreduce the computational complexity, the aim of ORMP is to improve the approximationperformance over OMP.
ORMP has gone by many names such as Stepwise Projection in the approximationtheory literature [10] and Orthogonal Least Squares in neural networks [25], amongstothers. Furthermore, historically there has also been much confusion between ORMPand OMP – for further discussion on the history see Blumensath [26].
Although OMP selects the element most correlated to the current residual at eachiteration this does not guarantee the largest reduction in error after orthogonalization.This is because it does not account for the correlation between the elements underconsideration with those we have already selected.
ORMP rectifies this deficiency. The ORMP selection step chooses the element thatwill most decrease the residual in the subsequent coefficient update (using orthogonalprojection). This can be written as a joint selection and update step as
j[i] = argminj
minx
T [i−1] ,xj‖y−AT [i−1] xT [i−1] −Aj xj‖2
2. (8.18)
To calculate this it is possible to exploit the orthogonality between r[i−1] and the selecteddictionary elements AT [i−1] . Let us define the orthogonal projection operator P⊥
T [i] :=
(I−AT [i]A†T [i]). The ORMP selection can then be written as:
j[i] = argmaxj
|ATj r[i−1]|
‖P⊥T [i−1]Aj‖2
. (8.19)
That is, ORMP selects the element whose normalized projection orthogonal tospan(AT [i−1]) is best correlated to r[i−1].
While ORMP has a theoretical advantage over OMP it comes at a computational cost.An efficient implementation of ORMP can use a QR factorization similar to that ofOMP [25], but there is the additional burden of projecting the elements Aj , j ∈ T [i−1],orthogonal to AT [i−1] .
Moreover, for CS applications, if the dictionary has been judiciously designed toa small RIP constant, the benefits of the orthogonal projection may be small. Indeedempirical studies suggest that ORMP does not perform significantly better than OMP.

358 T. Blumensath, M. E. Davies, and G. Rilling
Table 8.1. Comparison of pursuit methods in terms of computational cost (flops) periteration and storage requirements (number of floating point numbers) where k refers to thesize of the support set in the current iteration i and A is the computational cost of applyingor storing the transform A or AT . For StOMP (CG), ν is the number of conjugate gradientsteps used per iteration, which in the worst case is equal to the number of elementsselected.
Algorithm Computation cost Storage cost
MP m+A+n A+m+2k +nOMP (QR) 2mk +m+A+n 2(m+1)k +0.5k(k +1)+A+nOMP (Chol) 3A+3k2 +2m+n 0.5k(i+1)+A+m+2k +nGP 2A+k +3m+n 2m+A+2k +nCGP 2A+k +3m+n 2m+A+2k +nStWGP 2A+k +3m+2n 2m+A+2k +nStOMP (CG) (ν +2)A+k +3m+n 2m+A+2k +nORMP 2m(n−k)+3m+A+n 2(m+1)k +0.5k(k +1)+nm+n
8.2.4 Computational considerations
The computational requirements of each of the pursuit algorithms depend on the specificimplementation details, the structure of the sensing matrix A, and the number of iterationsused. Due to the variability of the computation and storage costs of A (from O(n log(m))
for an FFT-type operation to O(nm) for unstructured matrices) we explicitly countthe number of matrix-vector products Ax and AT y without specifying an associatednumber of flops. Note that even with fast transforms the matrix-vector product generallydominates the computational cost, so this quantity is very important. A summary of theoverall computational and storage costs per iteration for each of the pursuit algorithmsis presented in Table 8.1.
8.2.5 Performance guarantees
One of the cornerstones of CS is the theoretical recovery guarantee that it provides forcertain algorithms. Unfortunately, although empirically greedy pursuit algorithms oftenappear competitive with 1 minimization, a key weakness in these algorithms lies in thestrength of their theoretical recovery results. Indeed it was shown in [27, 28] that forcertain random matrices A, when m∼ k log(n) then with high probability there exists ak-sparse vector x for which OMP will fail to select a correct element at the first iteration.That is: if we use OMP to recover k elements, then such matrices do not provide uniformrecovery of all k-sparse vectors in this regime. As all the pursuit algorithms discussedin this section will also select the same element as OMP in the first step, this weaknessis universal to all greedy pursuit algorithms.
A possible criticism of such an analysis lies in the definition of recovery used: namelyOMP must only select correct elements from A. This precludes the possibility that thealgorithm makes some mistakes but that these can be rectified by selecting more than k

Greedy algorithms for compressed sensing 359
elements6 (if the columns of A are in general position any exact solution Ax = y foundthat contains less than m elements will provide a correct recovery [27]). Whilst it hasbeen suspected that uniform recovery is also not possible in this scenario [27, 28], thisremains an active topic of current research.
So when do greedy pursuit algorithms provide uniform sparse recovery? The originalworst case analysis of OMP was presented in [13] and most of these results carry overto general weak MP algorithms (i.e. MP, GP, CGP, StWGP) with minor modifications.In the context of CS the following approximation result on ‖x[i] −x‖2 was derived forStWGP or any weak gradient pursuit [18] in terms of the Restricted Isometry Propertyfor A (a similar result was derived independently for OMP in [29]).
theorem 8.1 (Uniform recovery for (stagewise) weak gradient pursuits) For any x,let y = Ax + e and stop the algorithm before it selects more than k nonzero elements.Let the last iteration be iteration i and let x[i] be the estimation of x calculated at thisiteration. If
δk+1 <α√
k +α, (8.20)
then there exists a constant C (depending on α and δ2k), such that
‖x[i] −x‖2 ≤ C
(‖(x−xk)‖2 +
‖(x−xk)‖1√k
+ ‖e‖2
), (8.21)
where xk is the best k-term approximation to x.
The bound on the error ε is optimal up to a constant and is of the same form as thatfor 1 minimization discussed in Chapter 1 [30]. However here we require that k0.5δ2k
is small, which translates into the requirement m≥O(k2 log(n/k)), which is similar toother OMP recovery results [13].
Although pursuit algorithms do not enjoy a uniform recovery property when m =
O(k log(n/k)), we typically observe recovery behavior for greedy algorithms similar to1 minimization. This suggests that the worst case bound in Theorem 8.1 is not necessarilyindicative of typical algorithm performance. In order to understand the typical behaviorof OMP and its relatives we can examine the typical (nonuniform) recovery behaviorfor random dictionaries. Specifically suppose we are given an arbitrary k-sparse vectorx and we then draw A at random from a suitable random set. Under what conditionswill OMP recover x with high probability? Note that A is only being asked to recovera specific x not all k-sparse vectors. This question was first investigated in [31] whereit was shown that successful recovery of sparse vectors using OMP can be done withm =O(k log(n)) measurements. Specifically, Tropp and Gilbert [31] give the followingresult:
theorem 8.2 ([31] OMP with random measurements) Suppose that x is an arbitraryk-sparse signal in Rn and draw a random m × n matrix A with i.i.d. Gaussian or
6 Allowing a small number of mistakes in support selection appears to significantly improve the sparserecovery performance for OMP in practice.
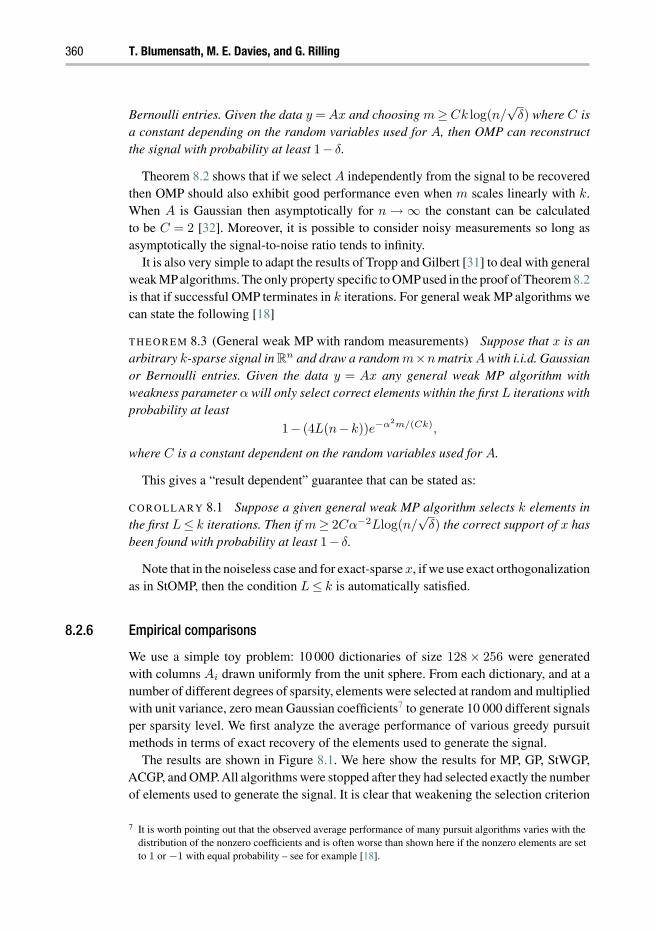
360 T. Blumensath, M. E. Davies, and G. Rilling
Bernoulli entries. Given the data y = Ax and choosing m ≥ Ck log(n/√
δ) where C isa constant depending on the random variables used for A, then OMP can reconstructthe signal with probability at least 1− δ.
Theorem 8.2 shows that if we select A independently from the signal to be recoveredthen OMP should also exhibit good performance even when m scales linearly with k.When A is Gaussian then asymptotically for n → ∞ the constant can be calculatedto be C = 2 [32]. Moreover, it is possible to consider noisy measurements so long asasymptotically the signal-to-noise ratio tends to infinity.
It is also very simple to adapt the results of Tropp and Gilbert [31] to deal with generalweak MPalgorithms. The only property specific to OMPused in the proof of Theorem 8.2is that if successful OMP terminates in k iterations. For general weak MP algorithms wecan state the following [18]
theorem 8.3 (General weak MP with random measurements) Suppose that x is anarbitrary k-sparse signal in Rn and draw a random m×n matrix A with i.i.d. Gaussianor Bernoulli entries. Given the data y = Ax any general weak MP algorithm withweakness parameter α will only select correct elements within the first L iterations withprobability at least
1− (4L(n−k))e−α2m/(Ck),
where C is a constant dependent on the random variables used for A.
This gives a “result dependent” guarantee that can be stated as:
corollary 8.1 Suppose a given general weak MP algorithm selects k elements inthe first L ≤ k iterations. Then if m ≥ 2Cα−2Llog(n/
√δ) the correct support of x has
been found with probability at least 1− δ.
Note that in the noiseless case and for exact-sparse x, if we use exact orthogonalizationas in StOMP, then the condition L ≤ k is automatically satisfied.
8.2.6 Empirical comparisons
We use a simple toy problem: 10 000 dictionaries of size 128 × 256 were generatedwith columns Ai drawn uniformly from the unit sphere. From each dictionary, and at anumber of different degrees of sparsity, elements were selected at random and multipliedwith unit variance, zero mean Gaussian coefficients7 to generate 10 000 different signalsper sparsity level. We first analyze the average performance of various greedy pursuitmethods in terms of exact recovery of the elements used to generate the signal.
The results are shown in Figure 8.1. We here show the results for MP, GP, StWGP,ACGP, and OMP. All algorithms were stopped after they had selected exactly the numberof elements used to generate the signal. It is clear that weakening the selection criterion
7 It is worth pointing out that the observed average performance of many pursuit algorithms varies with thedistribution of the nonzero coefficients and is often worse than shown here if the nonzero elements are setto 1 or −1 with equal probability – see for example [18].

Greedy algorithms for compressed sensing 361
0 0.1 0.2 0.3 0.4 0.5 0.60
0.1
0.2
0.3
0.4
0.5
0.6
0.7
0.8
0.9
1
Ratio of nonzero elements to signal dimension
Rat
io o
f ex
actly
rec
over
ed e
lem
ents
GPMPOMPStWGP
Figure 8.1 Comparison between MP (dotted), OMP (dashed), GP (dash-dotted), and StWGP (solid) interms of exactly recovering the original coefficients. The ordinate shows the fraction of runs inwhich the algorithms exactly recovered the index set T used to generate the data while theabscissa shows the ratio of the size of T to the dimension of x. Results averaged over 10 000runs. The solid lines correspond to (from left to right): α = 0.7,0.75,0.8,0.85,0.9,0.95, and 1.0(CGP). Adapted from [33], ©[2008] IEEE.
3.5
3
2.5
2
1.5
1
0.5
00 0.1 0.2 0.3
Ratio of nonzero elements
Ave
rage
com
puta
tion
time
0.4 0.5
Figure 8.2 Comparison of the computation time for StWGP with the different values of α as in Figure 8.1.The curves correspond to (going from top to bottom): α = 1.0,0.95,0.9,0.85,0.8,0.75, and 0.7.Adapted from [33], ©[2008] IEEE.

362 T. Blumensath, M. E. Davies, and G. Rilling
reduces (in a controlled manner) the recovery performance. The advantage of this is areduction in computational cost. This is shown in Figure 8.2. Here the curves correspondto (going from top to bottom): α = 1.0,0.95,0.9,0.85,0.8,0.75, and 0.7. The top curveindicates that the computational cost for ACGP (StWGP with α = 1.0) grows linearlywith the number of nonzero coefficients. In contrast for α < 1.0 the computational costgrows much more slowly. It should be noted here that these figures do not fully capturethe performance of StWGP since the dictionaries used do not have a fast implementation.However they do provide a fair relative comparison between different values of α.
8.3 Thresholding type algorithms
As shown above, greedy pursuits are easy to implement and use and can be extremelyfast. However, they do not have recovery guarantees as strong as methods based onconvex relaxation. The methods discussed in this section bridge this gap. They are fairlyeasy to implement and can be extremely fast but also show the strong performanceguarantees available with methods based on convex relaxation. These methods thereforeoffer a powerful set of tools for CS applications. Furthermore, as discussed in detail inSection 8.4, these methods can easily be adapted to more general low-dimensional signalmodels.
We here concentrate on three algorithms, the Iterative Hard Thresholding (IHT)algorithm [21], the Compressive Sampling Matching Pursuit (CoSaMP) [34], and theSubspace Pursuit (SP) [23], though methods based on similar ideas have been suggestedin [35], [36], [37], and [38].
8.3.1 Iterative Hard Thresholding
Motivated by the developments of Kingsbury and Reeves [35], the IHT algorithm wasintroduced independently in [21] and [36].
IHT is a greedy algorithm that iteratively solves a local approximation to the CSrecovery problem
minx
‖y−Ax‖22 subject to ‖x‖0 ≤ k. (8.22)
The local approximation to this non-convex problem can be derived based on the opti-mization transfer framework of [39]. Instead of optimizing equation (8.22) directly, asurrogate objective function is introduced
CSk (x,z) = µ‖y−Ax‖2
2 −µ‖Ax−Az‖22 + ‖x− z‖2
2. (8.23)
The advantage of this cost function is that we can write (8.23) as
CSk (x,z) ∝
∑j
[x2j − 2xj(zj +µAT
j y−ATj Az)], (8.24)
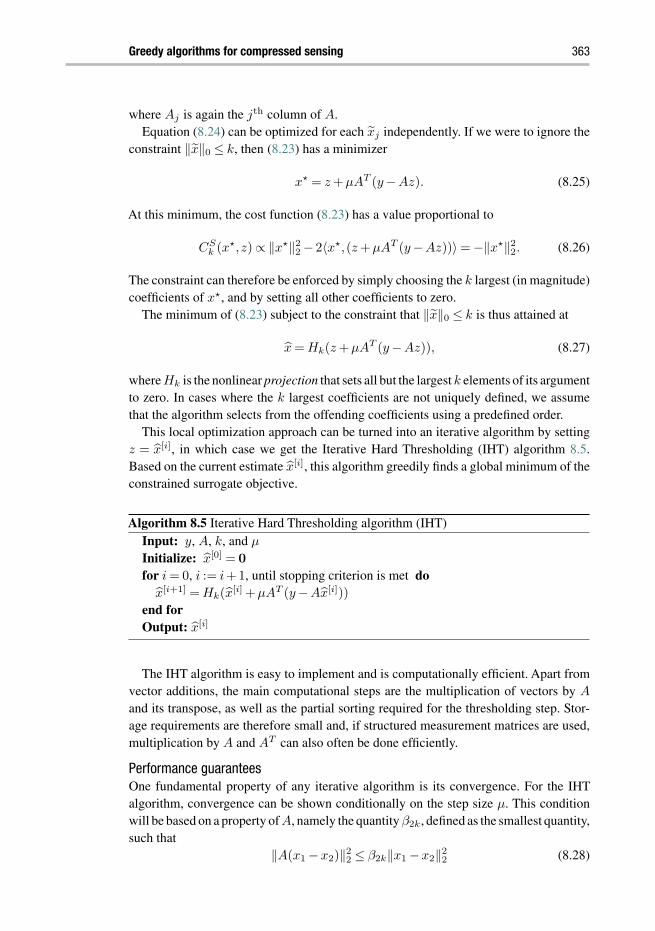
Greedy algorithms for compressed sensing 363
where Aj is again the jth column of A.Equation (8.24) can be optimized for each xj independently. If we were to ignore the
constraint ‖x‖0 ≤ k, then (8.23) has a minimizer
x = z +µAT (y−Az). (8.25)
At this minimum, the cost function (8.23) has a value proportional to
CSk (x,z) ∝ ‖x‖2
2 − 2〈x,(z +µAT (y−Az))〉 = −‖x‖22. (8.26)
The constraint can therefore be enforced by simply choosing the k largest (in magnitude)coefficients of x, and by setting all other coefficients to zero.
The minimum of (8.23) subject to the constraint that ‖x‖0 ≤ k is thus attained at
x = Hk(z +µAT (y−Az)), (8.27)
where Hk is the nonlinear projection that sets all but the largest k elements of its argumentto zero. In cases where the k largest coefficients are not uniquely defined, we assumethat the algorithm selects from the offending coefficients using a predefined order.
This local optimization approach can be turned into an iterative algorithm by settingz = x[i], in which case we get the Iterative Hard Thresholding (IHT) algorithm 8.5.Based on the current estimate x[i], this algorithm greedily finds a global minimum of theconstrained surrogate objective.
Algorithm 8.5 Iterative Hard Thresholding algorithm (IHT)Input: y, A, k, and µ
Initialize: x[0] = 0for i = 0, i := i+1, until stopping criterion is met do
x[i+1] = Hk(x[i] +µAT (y−Ax[i]))
end forOutput: x[i]
The IHT algorithm is easy to implement and is computationally efficient. Apart fromvector additions, the main computational steps are the multiplication of vectors by A
and its transpose, as well as the partial sorting required for the thresholding step. Stor-age requirements are therefore small and, if structured measurement matrices are used,multiplication by A and AT can also often be done efficiently.
Performance guaranteesOne fundamental property of any iterative algorithm is its convergence. For the IHTalgorithm, convergence can be shown conditionally on the step size µ. This conditionwill be based on a property of A, namely the quantity β2k, defined as the smallest quantity,such that
‖A(x1 −x2)‖22 ≤ β2k‖x1 −x2‖2
2 (8.28)

364 T. Blumensath, M. E. Davies, and G. Rilling
holds for all k-sparse vectors x1 and x2. It is clear that β2k ≤ (1+ δ2k) ≤ ‖A‖22, where
δ2k is the symmetric RIP constant as defined in (8.2).The main convergence result, derived by Blumensath and Davies [21], can be stated
as follows.
theorem 8.4 If β2k < µ−1, k ≤ m and assume A is of full rank, then the sequencex[i]i defined by the IHT algorithm converges to a local minimum of (8.22).
Whilst convergence is clearly desirable, in CS an even more important property ofany algorithm is its ability to recover sparse or nearly sparse signals, that is, the abilityof a method to calculate and estimate x of x that is close to x. One of the fundamentalproperties of the IHT algorithm is that it possesses this property with a near optimal errorguarantee whenever the RIP holds. Indeed, its performance in this respect is similar tothe performance of convex optimization-based approaches discussed in Chapter 1.
As the restricted isometry property introduced in (8.2) is sensitive to a re-scaling ofthe matrix A, we will here state the main result based on the non-symmetric RIP
α2k‖x1 −x2‖22 ≤ ‖A(x1 −x2)‖2
2 ≤ β2k‖x1 −x2‖22, (8.29)
for all k-sparse x1 and x2. Note that we are primarily interested in how A acts on thedifference between two k-sparse vectors, hence the particular form of the RIP used here.8
The first recovery result of the IHT algorithm was derived in [40], with later refine-ments based on the work by Meka et al. [41] and Garg and Khandekar [42] as firstreported in [43]. A somewhat more careful argument which can be found in Subsection8.3.4 gives the following performance guarantee.
theorem 8.5 For arbitrary x, given y = Ax+e where A satisfies the non-symmetricRIP with β2k ≤ µ−1 < 1.5α2k, after
i =
⌈2
log(‖e‖2/‖xk‖2)
log(2/(µα2k)− 2)
⌉(8.30)
iterations, the IHT algorithm calculates a solution x[i] satisfying
‖x− x[i]‖2 ≤ (1+ c√
β2k)‖x−xk‖2 + c√
β2k‖x−xk‖1√
k+ c‖e‖2, (8.31)
where c ≤√
43α2k−2µ +1.
Similarly, if sα2k ≤ µ−1 ≤ β2k holds for some s < 65 and if β2k
α2k<
3+ 6s
8 , then the same
bound holds with c ≤√
4+16s−16 β2kα2k
(3+6s)α2k−8β2k+1 and i =
2log(‖e‖2/‖xk‖2)
log
4
β2kα2k
−2(1+s)
1+4s−4β2kα2k
.
8 In this form, the RIP can also be understood as a bi-Lipschitz condition, where√
β2k is the Lipschitzconstant of the map A acting on the set of all k-sparse signals, whilst 1/
√α2k is the Lipschitz constant of
its inverse. Our version of the RIP can be easily translated into the symmetric RIP using α2k ≥ (1− δ2k)and β2k ≤ (1+ δ2k).
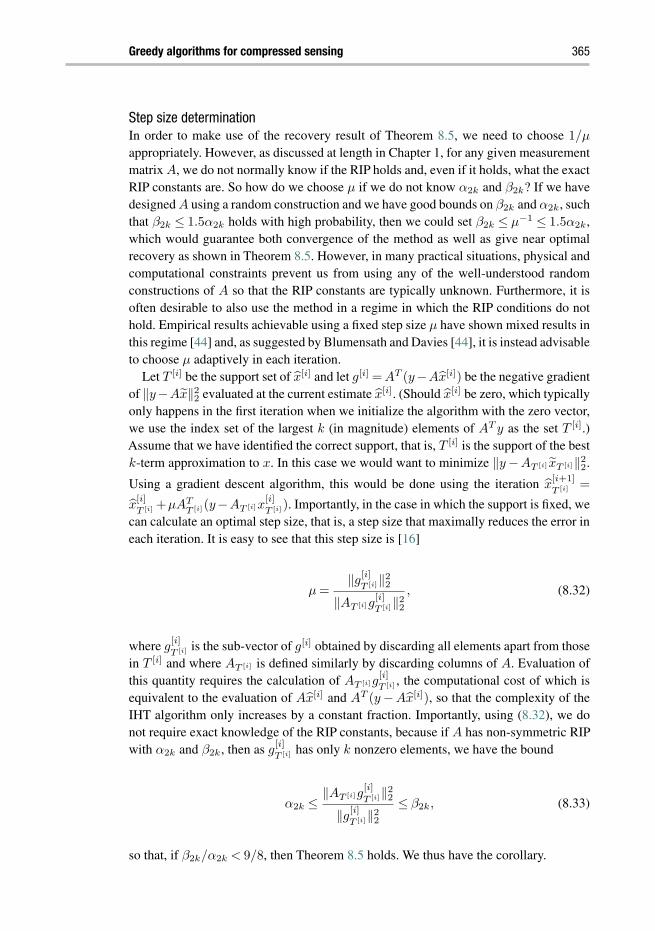
Greedy algorithms for compressed sensing 365
Step size determinationIn order to make use of the recovery result of Theorem 8.5, we need to choose 1/µ
appropriately. However, as discussed at length in Chapter 1, for any given measurementmatrix A, we do not normally know if the RIP holds and, even if it holds, what the exactRIP constants are. So how do we choose µ if we do not know α2k and β2k? If we havedesigned A using a random construction and we have good bounds on β2k and α2k, suchthat β2k ≤ 1.5α2k holds with high probability, then we could set β2k ≤ µ−1 ≤ 1.5α2k,which would guarantee both convergence of the method as well as give near optimalrecovery as shown in Theorem 8.5. However, in many practical situations, physical andcomputational constraints prevent us from using any of the well-understood randomconstructions of A so that the RIP constants are typically unknown. Furthermore, it isoften desirable to also use the method in a regime in which the RIP conditions do nothold. Empirical results achievable using a fixed step size µ have shown mixed results inthis regime [44] and, as suggested by Blumensath and Davies [44], it is instead advisableto choose µ adaptively in each iteration.
Let T [i] be the support set of x[i] and let g[i] = AT (y−Ax[i]) be the negative gradientof ‖y−Ax‖2
2 evaluated at the current estimate x[i]. (Should x[i] be zero, which typicallyonly happens in the first iteration when we initialize the algorithm with the zero vector,we use the index set of the largest k (in magnitude) elements of AT y as the set T [i].)Assume that we have identified the correct support, that is, T [i] is the support of the bestk-term approximation to x. In this case we would want to minimize ‖y −AT [i] xT [i]‖2
2.
Using a gradient descent algorithm, this would be done using the iteration x[i+1]T [i] =
x[i]T [i] +µAT
T [i](y−AT [i]x[i]T [i]). Importantly, in the case in which the support is fixed, we
can calculate an optimal step size, that is, a step size that maximally reduces the error ineach iteration. It is easy to see that this step size is [16]
µ =‖g[i]
T [i]‖22
‖AT [i]g[i]T [i]‖2
2
, (8.32)
where g[i]T [i] is the sub-vector of g[i] obtained by discarding all elements apart from those
in T [i] and where AT [i] is defined similarly by discarding columns of A. Evaluation ofthis quantity requires the calculation of AT [i]g
[i]T [i] , the computational cost of which is
equivalent to the evaluation of Ax[i] and AT (y −Ax[i]), so that the complexity of theIHT algorithm only increases by a constant fraction. Importantly, using (8.32), we donot require exact knowledge of the RIP constants, because if A has non-symmetric RIPwith α2k and β2k, then as g
[i]T [i] has only k nonzero elements, we have the bound
α2k ≤‖AT [i]g
[i]T [i]‖2
2
‖g[i]T [i]‖2
2
≤ β2k, (8.33)
so that, if β2k/α2k < 9/8, then Theorem 8.5 holds. We thus have the corollary.

366 T. Blumensath, M. E. Davies, and G. Rilling
corollary 8.2 Given y = Ax + e. If A satisfies the non-symmetric RIP withβ2k/α2k < 9/8, then, after
i =
2log(‖e‖2/‖xk‖2)
log
(4 β2k
α2k−4
5−4 β2kα2k
) (8.34)
iterations, the algorithm defined by the iteration
x[i+1] = Hk
(x[i] +
‖g[i]T [i]‖2
2
‖AT [i]g[i]T [i]‖2
2
AT (y−Ax[i])
)(8.35)
calculates a solution x[i] satisfying
‖x− x[i]‖2 ≤ (1+ c√
β2k)‖y−xk‖2 + c√
β2k‖x−xk‖1√
k+ c‖e‖2, (8.36)
where c ≤√
20−16 β2kα2k
9α2k−8β2k+1.
There remains however a further problem. We cannot typically guarantee that ourmeasurement system satisfies the required bound on the RIP constants. We thus needto ensure that the algorithm will be robust also in the case in which the condition ofthe theorem fails. Whilst we can no longer guarantee that we will be able to recover x
with high accuracy, we can at least ensure that the algorithm will converge if the RIPcondition fails. In order to do this, we need to monitor convergence and will use a linesearch approach to guarantee stability of the method.
In the case in which the support of x[i+1] is the same as that of x[i], our choice ofthe step size ensures that we are guaranteed to have a maximal reduction in the costfunction, which in turn ensures stability of the method. However, if the support of x[i+1]
differs from the support of x[i], the optimality of µ is no longer guaranteed. In this case,a sufficient condition that guarantees convergence is [44]
µ ≤ (1− c)‖x[i+1] − x[i]‖2
2
‖A(x[i+1] − x[i])‖22
(8.37)
for any small fixed constant c.Hence, if our first proposal x[i+1] has a different support, we need to check whether µ
satisfies the above convergence condition. If the condition holds, then we keep the newupdate and set x[i+1] = x[i+1]. Otherwise we need to shrink the step size µ. The simplestway to do this is to set µ ← µ/(κ(1− c)), for some constant κ > 1/(1− c). With thisnew step size, a new proposal x[i+1] is calculated. This procedure is terminated whencondition (8.37) is satisfied or if the support of x[i+1] is the same as that of x[i], in whichcase we accept the latest proposal and continue with the next iteration.9
9 Note that it can be shown that the algorithm will accept a new step size after a finite number of such tries.

Greedy algorithms for compressed sensing 367
Using this automatic step-size reduction, it can be shown that the algorithm, which issummarized as Algorithm 8.6, will converge to a fixed point [44].
theorem 8.6 If rank(A) = m and rank(AT ) = k for all T such that |T |= k, then thenormalized IHT algorithm converges to a local minimum of the optimization problem(8.22).
Algorithm 8.6 Normalized Iterative Hard Thresholding algorithm (IHT)Input: y, A, and k
Initialize: x[0] = 0, T [0] =supp(Hk(AT y))
for i = 0, i := i+1, until stopping criterion is met dog[i] = AT (y−Ax[i])
µ[i] =‖g
[i]
T [i]‖22
‖AT [i]g
[i]
T [i]‖22
x[i+1] = Hk(x[i] +µ[i]g[i])
T [i+1] =supp(˜x[i+1])
if T [i+1] = T [i] thenx[i+1] = x[i+1]
else if T [i+1] = T [i] then
if µ[i] ≤ (1− c)‖x[i+1]−x[i]‖2
2‖A(x[i+1]−x[i])‖2
2then
x[i+1] = x[i+1]
else if µ[i] > (1− c)‖x[i+1]−x[i]‖2
2‖A(x[i+1]−x[i])‖2
2then
repeatµ[i] ← µ[i]/(κ(1− c))
x[i+1] = Hk(x[i] +µ[i]g[i])
until µ[i] ≤ (1− c)‖x[i+1]−x[i]‖2
2‖A(x[i+1]−x[i])‖2
2
T [i+1] =supp(x[i+1])
x[i+1] = x[i+1]
end ifend if
end forOutput: r[i] and x[i]
8.3.2 Compressive Sampling Matching Pursuit and Subspace Pursuit
The Compressive Sampling Matching Pursuit (CoSaMP ) algorithm by Needell andTropp [34] and the Subspace Pursuit (SP) algorithm by Dai and Milenkovic [23] arevery similar and share many of their properties. We will therefore treat both methodsjointly.

368 T. Blumensath, M. E. Davies, and G. Rilling
General frameworkBoth CoSaMP and SP keep track of an active set T of nonzero elements and both add aswell as remove elements in each iteration. At the beginning of each iteration, a k-sparseestimate x[i] is used to calculate a residual error y −Ax[i], whose inner products withthe column vectors of A are calculated. The indexes of those columns of A with thek (or 2k) largest inner products are then selected and added to the support set of x[i]
to get a larger set T [i+0.5]. An intermediate estimate x[i+0.5] is then calculated as theleast-squares solution argminx
T [i+0.5]‖y −Ax
[i+0.5]T [i+0.5]‖2. The largest k elements of this
intermediate estimate are now found and used as the new support set T [i+1]. The methodsdiffer in the last step, the CoSaMP algorithm takes as a new estimate the intermediateestimate x[i+0.5] restricted to the new smaller support set T [i+1], whilst SP solves asecond least-squares problem restricted to this reduced support.
CoSaMPThe CoSaMP algorithm, which was introduced and analyzed by Needell and Tropp [34],is summarized in Algorithm 8.7.
Algorithm 8.7 Compressive Sampling Matching Pursuit (CoSaMP)Input: y, A, and k
Initialize: T [0] =supp(Hk(AT y)), x[0] = 0
for i = 0, i := i+1, until stopping criterion is met dog[i] = AT (y−Ax[i])
T [i+0.5] = T [i]⋃supp(g[i]2k)
x[i+0.5]T [i+0.5] = A†
T [i+0.5]y, x[i+0.5]
T [i+0.5]= 0
T [i+1] = supp(x[i+0.5]k )
x[i+1]T [i+1] = x
[i+0.5]T [i+1] , x
[i+1]
T [i+1]= 0
end forOutput: r[i] and x[i]
Instead of calculating A†T [i+0.5]y exactly in each iteration, which can be computa-
tionally demanding, a faster approximate implementation of the CoSaMP algorithmwas also proposed in [34]. This fast version replaces the exact least-squares estimatex
[i+0.5]T [i+0.5] = A†
T [i+0.5]y with three iterations of a gradient descent or a conjugate gradientsolver. Importantly, this modified algorithm still retains the same theoretical guaranteegiven in Theorem 8.7 below, though the empirical performance tends to deteriorate asshown in the simulations in Subsection 8.3.3.
Needell and Tropp [34] suggested different strategies to stop the CoSaMP algorithm.If the RIP holds, then the size of the error y−Ax[i] can be used to bound the error x− x[i],which in turn can be used to stop the algorithm. However, in practice, if it is unknown ifthe RIP holds, then this relationship is not guaranteed. In this case, an alternative wouldbe to stop the iterations as soon as ‖x[i]−x[i+1]‖2 is small or whenever the approximationerror ‖y−Ax[i]‖2 < ‖y−Ax[i+1]‖2 increases. Whilst the first of these methods does not

Greedy algorithms for compressed sensing 369
guarantee the convergence of the method, the second approach is guaranteed to preventinstability, however, it is also somewhat too strict in the case in which the RIP holds.
SPThe SP algorithm, developed and analyzed by Dai and Milenkovic [23], is very similarto CoSaMP as shown in Algorithm 8.8.
Algorithm 8.8 Subspace Pursuit (SP)Input: y, A, and k
Initialize: T [0] =supp(Hk(AT y)), x[0] = A†T [0]y
for i = 0, i := i+1, until ‖y−Ax[i+1]‖2 ≥ ‖y−Ax[i]‖2 dog[i] = AT (y−Ax[i])
T [i+0.5] = T [i]⋃supp(g[i]k )
x[i+0.5]T [i+0.5] = A†
T [i+0.5]y, x[i+0.5]
T [i+0.5]= 0
T [i+1] = supp(x[i+0.5]k )
x[i+1] = A†T+1y
end forOutput: r[i] and x[i]
Here the same stopping rule based on the difference ‖y −Ax[i]‖2 −‖y −Ax[i+1]‖2
has been proposed by Dai and Milenkovic [23]. This guarantees that the method remainsstable, even in a regime in which the RIP condition fails.
The main difference between the two approaches is the size of the set added to T [i]
in each iteration as well as the additional least-squares solution required in the SP.Furthermore, the possibility of replacing the least-squares solution in CoSaMP withthree gradient-based updates means that it can be implemented much more efficientlythan SP.
Performance guaranteesJust as the IHT algorithm, both CoSaMP as well as SP offer near optimal performanceguarantees under conditions on the RIP. The CoSaMP algorithm was the first greedymethod to be shown to possess similar performance guarantees to 1-based methods[34]. The proof of the result uses similar ideas to those used in Subsection 8.3.4 to proveIHT performance, though as the CoSaMP algorithm involves significantly more stepsthan the IHT algorithm, the performance proof is also significantly longer and is thereforeomitted here.
theorem 8.7 ([34]) For any x, given y = Ax + e where A satisfies the RIP with
0.9 ≤ ‖Ax1−Ax2‖22
‖x1−x2‖22
≤ 1.1 for all 2k-sparse vectors x1 and x2, after
i = log(‖xk‖2/‖e‖2)log2! (8.38)

370 T. Blumensath, M. E. Davies, and G. Rilling
iterations, the CoSaMP algorithm calculates a solution x[i] satisfying
‖x− x[i]‖2 ≤ 21
(‖y−xk‖2 +
‖x−xk‖1√k
+ ‖e‖2
). (8.39)
For SP, Dai and Milenkovic [23], using a similar approach, derived analogous results.
theorem 8.8 ([23]) For any x, given y = Ax+ e where A satisfies, for all k-sparse
vectors x1 and all 2k-sparse vectors x2, the RIP with 0.927 ≤ ‖Ax1−Ax2‖22
‖x1−x2‖22
≤ 1.083,
then SP calculates a solution x satisfying
‖x− x‖2 ≤ 1.18
(‖y−xk‖2 +
‖x−xk‖1√k
+ ‖e‖2
). (8.40)
8.3.3 Empirical comparison
To highlight the performance of the different approaches discussed in this section, werepeated the experiment of Subsection 8.2.6, comparing the normalized IHT algorithm,the CoSaMP algorithm, and an 1-based approach (minimize ‖x‖1 such that y = Ax).Here, the two different implementations of CoSaMP have been used (CoSaMP perfor-mance with exact least-squares solver is shown in Figure 8.3 with dash-dotted lines andCoSaMP performance with a fixed number of conjugate gradient steps is shown withdotted lines, from left to right, using 3, 6, and 9 conjugate gradient steps within eachiteration).
The normalized IHT algorithm performs well in this average case analysis, even ina regime when simple bounds on the RIP constants indicate that the RIP condition ofthe theorem is violated. Here, the normalized IHT algorithm outperforms CoSaMP withexact least-squares solver and performs nearly as well as the 1-based approach. Thoughit should be noted that, as reported by Blumensath and Davies [44], if the nonzeroentries of x all have equal magnitude, then CoSaMP with exact least-squares solverslightly outperforms the normalized IHT algorithm.
Figure 8.4 shows the computation times for the experiment reported in Figure 8.3 inthe region where the algorithms perform well.10 The speed advantage of the normalizedIHT algorithm is clearly evident.
8.3.4 Recovery proof
Proof of Theorem 8.5. To prove the recovery bound for IHT, the estimation error normis split into two parts using the triangle inequality
‖x− x[i+1]‖2 ≤ ‖xk − x[i+1]‖2 + ‖xk −x‖2. (8.41)
10 To solve the 1 optimization problem, we here used the spgl1 [45] algorithm (available onwww.cs.ubc.ca/labs/scl/spgl1/).

Greedy algorithms for compressed sensing 371
1
0.8
0.6
0.4
0.2
00 0.1 0.2 0.3
Sparsity k/m
Prob
abili
ty o
f ex
act r
ecov
ery
0.4
CoSaMP (pseudo inverse)CoSaMP (9, 6, 3 CG steps)1IHT
0.5
Figure 8.3 Percentage of instances in which the algorithms could identify exactly which of the elements inx were non-zero. The non-zero elements in x were i.i.d. normal distributed. Results are shownfor normalized IHT (solid), 1 solution (dashed), CoSaMP implemented using thepseudo-inverse (dash-dotted), and CoSaMP using (from left to right) 3, 6, or 9 conjugate gradientiterations (dotted). Adapted from [44] ©[2010] IEEE.
0.07
CoSaMP (pseudo inverse)CosaMP (9, 6, 3 CG steps)1IHT
Com
puta
tion
time
0.06
0.05
0.04
0.03
0.02
0.01
00 0.05 0.1 0.15
Sparsity k/m0.2 0.25 0.3
Figure 8.4 Computation time for normalized IHT (solid), 1 solution (dashed), CoSaMP using thepseudo-inverse (dash-dotted), and CoSaMP using (from top to bottom) 9, 6, or 3 conjugategradient iterations (dotted). Adapted from [44] ©[2010] IEEE.
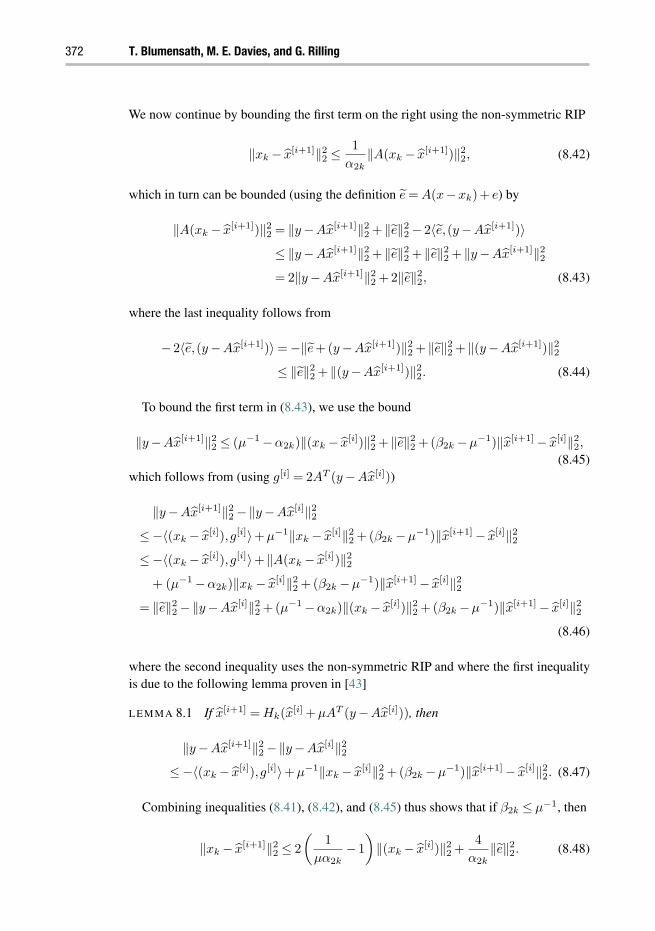
372 T. Blumensath, M. E. Davies, and G. Rilling
We now continue by bounding the first term on the right using the non-symmetric RIP
‖xk − x[i+1]‖22 ≤ 1
α2k‖A(xk − x[i+1])‖2
2, (8.42)
which in turn can be bounded (using the definition e = A(x−xk)+ e) by
‖A(xk − x[i+1])‖22 = ‖y−Ax[i+1]‖2
2 + ‖e‖22 − 2〈e,(y−Ax[i+1])〉
≤ ‖y−Ax[i+1]‖22 + ‖e‖2
2 + ‖e‖22 + ‖y−Ax[i+1]‖2
2
= 2‖y−Ax[i+1]‖22 +2‖e‖2
2, (8.43)
where the last inequality follows from
− 2〈e,(y−Ax[i+1])〉 = −‖e+(y−Ax[i+1])‖22 + ‖e‖2
2 + ‖(y−Ax[i+1])‖22
≤ ‖e‖22 + ‖(y−Ax[i+1])‖2
2. (8.44)
To bound the first term in (8.43), we use the bound
‖y−Ax[i+1]‖22 ≤ (µ−1 −α2k)‖(xk − x[i])‖2
2 + ‖e‖22 +(β2k −µ−1)‖x[i+1] − x[i]‖2
2,
(8.45)which follows from (using g[i] = 2AT (y−Ax[i]))
‖y−Ax[i+1]‖22 −‖y−Ax[i]‖2
2
≤−〈(xk − x[i]),g[i]〉+µ−1‖xk − x[i]‖22 +(β2k −µ−1)‖x[i+1] − x[i]‖2
2
≤−〈(xk − x[i]),g[i]〉+ ‖A(xk − x[i])‖22
+ (µ−1 −α2k)‖xk − x[i]‖22 +(β2k −µ−1)‖x[i+1] − x[i]‖2
2
= ‖e‖22 −‖y−Ax[i]‖2
2 +(µ−1 −α2k)‖(xk − x[i])‖22 +(β2k −µ−1)‖x[i+1] − x[i]‖2
2
(8.46)
where the second inequality uses the non-symmetric RIP and where the first inequalityis due to the following lemma proven in [43]
lemma 8.1 If x[i+1] = Hk(x[i] +µAT (y−Ax[i])), then
‖y−Ax[i+1]‖22 −‖y−Ax[i]‖2
2
≤−〈(xk − x[i]),g[i]〉+µ−1‖xk − x[i]‖22 +(β2k −µ−1)‖x[i+1] − x[i]‖2
2. (8.47)
Combining inequalities (8.41), (8.42), and (8.45) thus shows that if β2k ≤ µ−1, then
‖xk − x[i+1]‖22 ≤ 2
(1
µα2k− 1
)‖(xk − x[i])‖2
2 +4
α2k‖e‖2
2. (8.48)

Greedy algorithms for compressed sensing 373
Therefore, the condition 2( 1µα2k
− 1) < 1 implies that
‖xk −x[i]‖22 ≤
(2
(1
µα2k− 1
))i
‖xk‖22 + c‖e‖2
2, (8.49)
where c ≤ 43α2k−2µ−1 . The theorem then follows from the bound
‖x−x[i]‖2 ≤
√(2
µα2k− 2
)i
‖xk‖22 + c‖e‖2
2 + ‖xk −x‖2
≤(
2
µα2k− 2
)i/2
‖xk‖2 + c0.5‖e‖2 + ‖xk −x‖2. (8.50)
Thus after i =⌈2
log(‖e‖2/‖xk‖2)log(2/(µα2k)−2)
⌉iterations we have
‖x−x[i]‖2 ≤ (c0.5 +1)‖e‖2 + ‖xk −x‖2. (8.51)
Alternatively, if β2k > µ−1, then
‖xk − x[i+1]‖22 ≤ 2
(1
µα2k− 1
)‖(xk − x[i])‖2
2 +2
α2k(β2k −µ−1)‖x[i+1] − x[i]‖2
2
+4
α2k‖e‖2
2
≤ 2
(1
µα2k− 1
)‖(xk − x[i])‖2
2 +4
α2k(β2k −µ−1)‖xk − x[i]‖2
2
+4
α2k(β2k −µ−1)‖xk − x[i+1]‖2
2 +4
α2k‖e‖2
2, (8.52)
so that
‖xk − x[i+1]‖22 ≤
4 β2k
α2k− 2
µα2k− 2
1− 4 β2k
α2k+ 4
µα2k
‖(xk − x[i])‖22 +
4
α2k‖e‖2
2. (8.53)
The second part of the theorem follows from this using the same reasoning used to derivethe first part from (8.48). Finally, ‖e‖2 is bounded by
lemma 8.2 (Needell and Tropp, lemma 6.1 in [34]) If A satisfies the RIP of order 2k,then
‖e‖2 ≤√
β2k‖y−xk‖2 +√
β2k‖x−xk‖1√
k+ ‖e‖2. (8.54)
8.4 Generalizations of greedy algorithms to structured models
Apart from their ease of implementation and computational advantages, greedy algo-rithms have another very important feature that distinguishes them from methods based

374 T. Blumensath, M. E. Davies, and G. Rilling
on convex relaxation. They are easily adapted to more complex signal models that gobeyond sparsity. For example, wavelet representations of natural images are known toexhibit tree-structures, so that it is natural in CS imaging, to not only look for sparsewavelet representations, but to further restrict the search to sparse and tree-structuredrepresentations. The set of all tree-structured sparse signals is much smaller than theset of all sparse signals, thus this additional information should allow us to reconstructimages using far fewer measurements.
For many structured sparse problems such as the tree sparse recovery problem, convexoptimization approaches are difficult to design. It is indeed not clear what the correctconvex cost function should be or even if there exist convex cost functions that offer betterperformance than standard 1-methods not exploiting the structure. Greedy algorithms,on the other hand, can often be adapted much more easily to incorporate and exploitadditional structures. How this is done and what the benefits of such an approach can bewill be the topic of this section.
8.4.1 The union of subspaces model
Most structures that have been used in applications of CS can be based on union ofsubspaces (UoS) models and we here concentrate on this important class. However,some of the ideas developed here for UoS models can also be derived for other low-dimensional signal models (including for example manifold models as discussed inChapter 1) [43]. UoS models were first studied by Lu and Do [46] with additionaltheoretical developments presented by Blumensath and Davies [47]. Explicit recoveryresults and practical algorithms for block-sparse signal models were first derived in[48] whilst results for structured sparse models, were derived by Baraniuk et al. [49].Blumensath [43] derived recovery results for an IHT-type algorithm adapted to the mostgeneral UoS setting.
The modelIn the sparse signal model, the signal is assumed to live in, or close to, the union of severalk-dimensional subspaces, where each of these subspaces is one of the k-dimensionalcanonical subspaces generated by k canonical vectors of the signal space Rn. The UoSmodel generalizes this notion.
Chapter 1 already stated several examples of UoS models. We here give a definitionin a quite general setting. Assume x lives in a Hilbert space H (with norm ‖ · ‖H) and,furthermore, assume that x lies in, or close to, a union of linear subspaces U ⊂ H,defined as
U =⋃j∈I
Sj , (8.55)
where the Sj ⊂ H are arbitrary closed subspaces of H. In the most general setting, Hcan be an infinite-dimensional Hilbert space and U might possibly be an uncountablyinfinite union of infinite-dimensional subspaces. In many practical situations, however,the subspaces Sj have finite dimension and their number is also finite (in which case wewrite their number as L := |I|). In UoS models with finite-dimensional subspaces, the

Greedy algorithms for compressed sensing 375
largest dimension of the subspaces plays the same role as the sparsity in standard CS.We therefore use a similar notation and define k := supdimSj .
An important subset of UoS models are structured sparse signals. These are signals thatare k-sparse, but whose support is further restricted. These models were introduced byBaraniuk et al. [49], where they were called “model sparse.” The key difference betweensparse and structured sparse signal models is that the number of included sparse subspacesin the structured case can be (and should be to see any benefit) much smaller than thetotal number of k-sparse subspaces. Intuitively this means that it should be easier toidentify the subspace where the signal lives. This in turn suggests that the signal can berecovered from fewer measurements. Important examples of structured sparse modelsinclude tree-sparse models and block-sparse models which will be discussed in moredetail below.
Examples of UoS modelsWe now describe a selection of important UoS models that have been considered for CS.As pointed out above, the standard sparse model, where x is assumed to have no morethan k nonzero elements, is a canonical UoS model.
Another UoS model is defined by signals that are sparse in a dictionary Φ. A dictio-nary in Rn is a matrix Φ ∈ Rn×d, whose column vectors φj , j ∈ 1, . . . ,d span Rn.Given a dictionary Φ (which may be a basis when d = n), the subspaces spanned by allcombinations of k columns of Φ constitute a UoS model. In other words, for each x insuch a model, there is a k-sparse vector c, such that x = Φc. If Φ is a basis, then thenumber of such subspaces is
(nk
), whilst if Φ is an overcomplete dictionary (i.e. d > n),
then the number of k-sparse subspaces is at most(
dk
).
Block-sparse signals form another UoS model in Rn and are an important exampleof structured sparse models. In the block-sparse model, x is partitioned into blocks. LetBj ⊂ 1, . . . ,n, j ∈ 1, . . . ,J be the set of indices in block j. A signal that is k-blocksparse is then defined as any x whose support is contained in no more than k differentsets Bj , that is
supp(x) ⊂⋃
j∈J :J ⊂1,2,...,J, |J |≤k
Bj . (8.56)
Typically, it is assumed that the Bj’s are non-overlapping (Bj ∩Bl = ∅ if j = l).Other structured sparse models are so called tree-sparse models, in which the nonzero
coefficients of x have an underlying tree structure. This type of model typically arises inwavelet decompositions of images [50, 51, 52] and is exploited in state-of-the-art imagecompression methods [53, 54]. An important special case of tree-sparse models, whichare typically used to model wavelet coefficients, are rooted-tree-sparse models, wherethe sparse subtrees have to contain the root of the wavelet tree.
Alternatively, instead of assuming that x is structured sparse, we can also define aUoS model in which x = Φc, where Φ is again a dictionary and where c is block-or tree-sparse. Note that, as noted by Eldar and Mishali [55], all finite-dimensionalUoS models can be written in the form x = Φc, where c is block-sparse for some Φ.Unfortunately, reformulating a UoS problem as a block-sparse problem is not always
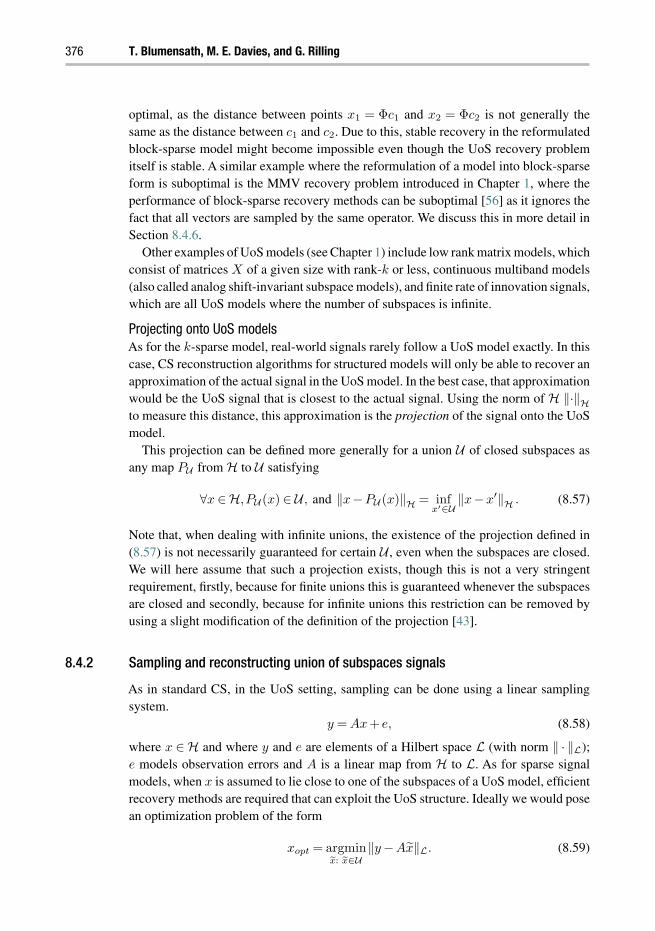
376 T. Blumensath, M. E. Davies, and G. Rilling
optimal, as the distance between points x1 = Φc1 and x2 = Φc2 is not generally thesame as the distance between c1 and c2. Due to this, stable recovery in the reformulatedblock-sparse model might become impossible even though the UoS recovery problemitself is stable. A similar example where the reformulation of a model into block-sparseform is suboptimal is the MMV recovery problem introduced in Chapter 1, where theperformance of block-sparse recovery methods can be suboptimal [56] as it ignores thefact that all vectors are sampled by the same operator. We discuss this in more detail inSection 8.4.6.
Other examples of UoS models (see Chapter 1) include low rank matrix models, whichconsist of matrices X of a given size with rank-k or less, continuous multiband models(also called analog shift-invariant subspace models), and finite rate of innovation signals,which are all UoS models where the number of subspaces is infinite.
Projecting onto UoS modelsAs for the k-sparse model, real-world signals rarely follow a UoS model exactly. In thiscase, CS reconstruction algorithms for structured models will only be able to recover anapproximation of the actual signal in the UoS model. In the best case, that approximationwould be the UoS signal that is closest to the actual signal. Using the norm of H ‖·‖Hto measure this distance, this approximation is the projection of the signal onto the UoSmodel.
This projection can be defined more generally for a union U of closed subspaces asany map PU from H to U satisfying
∀x ∈H,PU (x) ∈ U , and ‖x−PU (x)‖H = infx′∈U
‖x−x′‖H . (8.57)
Note that, when dealing with infinite unions, the existence of the projection defined in(8.57) is not necessarily guaranteed for certain U , even when the subspaces are closed.We will here assume that such a projection exists, though this is not a very stringentrequirement, firstly, because for finite unions this is guaranteed whenever the subspacesare closed and secondly, because for infinite unions this restriction can be removed byusing a slight modification of the definition of the projection [43].
8.4.2 Sampling and reconstructing union of subspaces signals
As in standard CS, in the UoS setting, sampling can be done using a linear samplingsystem.
y = Ax+ e, (8.58)
where x ∈ H and where y and e are elements of a Hilbert space L (with norm ‖ · ‖L);e models observation errors and A is a linear map from H to L. As for sparse signalmodels, when x is assumed to lie close to one of the subspaces of a UoS model, efficientrecovery methods are required that can exploit the UoS structure. Ideally we would posean optimization problem of the form
xopt = argminx: x∈U
‖y−Ax‖L. (8.59)

Greedy algorithms for compressed sensing 377
However, even if the above minimizer exists, as in standard sparse CS, this problemcan only be solved explicitly for the simplest of UoS models. Instead, one has to turn toapproximations to this problem and again two approaches can be distinguished, methodsbased on convex optimization and greedy algorithms. For certain structured sparse mod-els, such as block-sparse models, convex optimization methods have been derived (seefor example [55]). Our focus is however on greedy algorithms which have the advantagethat they are applicable to all UoS models, as long as we can efficiently calculate theprojection (8.57).
Extensions of greedy pursuit-type algorithms to tree models have been proposed byLa and Do [57] and Duarte et al. [58]. While these extensions seem to perform wellin practice, there are unfortunately no strong theoretical guarantees supporting them.Thresholding-type algorithms on the other hand are more widely applicable and havebeen easier to approach from a theoretical point of view. In particular, the greedy thresh-olding algorithms presented in Section 8.3 can be easily modified to take into accountmore general models. The key observation is that these algorithms handle the sparsesignal model by projecting at each iteration on the set of k-sparse (or 2k-sparse) signalsso that for UoS models, all one has to do is to replace this thresholding operation withthe projection (8.57). This idea was first introduced by Baraniuk et al. [49] for the usewith structured sparse models and later by Blumensath [43] for general UoS models.This extension of the IHT algorithm to UoS models was called the Projected LandweberAlgorithm (PLA) by Blumensath [43] and is summarized in Algorithm 8.9. The only dif-ference to Algorithm 8.5 is that we have replaced the hard thresholding operator Hk bythe UoS model projector PU . Note that the PLA could use a similar strategy to determineµ adaptively as has been suggested for the IHT method.
Algorithm 8.9 Projected Landweber Algorithm (PLA)Input: y, A, and µ
Initialize: x[0] = 0
for i = 0, i := i+1, until stopping criterion is met dox[i+1] = PU (x[i] +µA∗(y−Ax[i])), where A∗ is the adjoint of A
end forOutput: x[i]
The PLA extends the IHT algorithm to general UoS methods. For structured sparsemodels, a similar approach can also be used to extend the CoSaMP (or Subspace Pur-suit) algorithms. Algorithm 8.10 describes a modified version of the standard CoSaMPalgorithm applicable to structured sparse models. For these models, the only requiredmodification is the replacement of the hard thresholding step by the UoS projection(8.57).
Examples of UoS projection operatorsUnlike the standard IHT and CoSaMP algorithms, the complexity of algorithms basedon the projection onto more complicated UoS models is often not dominated by the
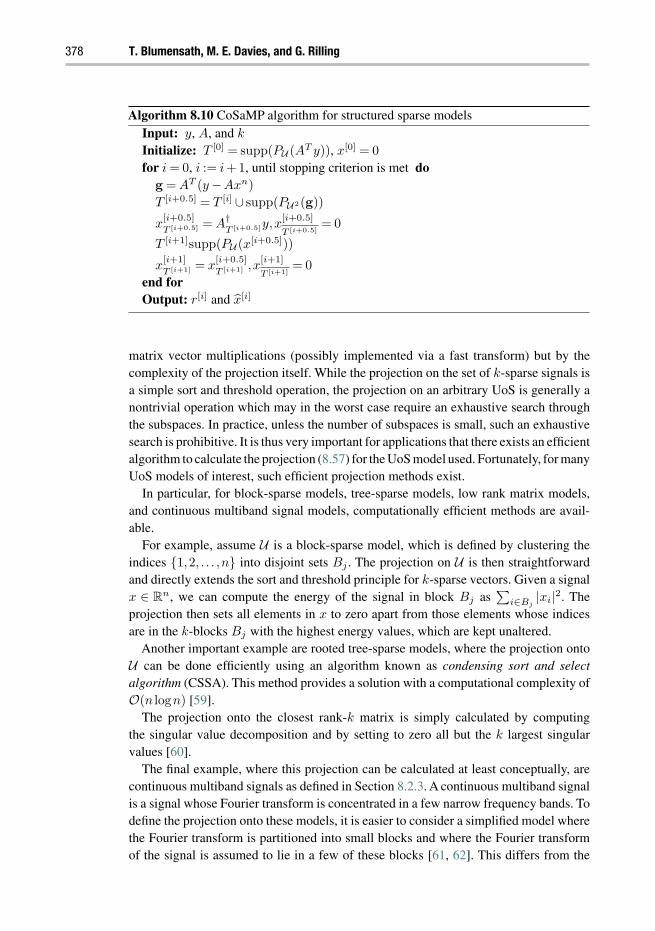
378 T. Blumensath, M. E. Davies, and G. Rilling
Algorithm 8.10 CoSaMP algorithm for structured sparse modelsInput: y, A, and k
Initialize: T [0] = supp(PU (AT y)), x[0] = 0
for i = 0, i := i+1, until stopping criterion is met dog = AT (y−Axn)
T [i+0.5] = T [i] ∪ supp(PU2(g))
x[i+0.5]T [i+0.5] = A†
T [i+0.5]y,x[i+0.5]
T [i+0.5]= 0
T [i+1]supp(PU (x[i+0.5]))
x[i+1]T [i+1] = x
[i+0.5]T [i+1] ,x
[i+1]
T [i+1]= 0
end forOutput: r[i] and x[i]
matrix vector multiplications (possibly implemented via a fast transform) but by thecomplexity of the projection itself. While the projection on the set of k-sparse signals isa simple sort and threshold operation, the projection on an arbitrary UoS is generally anontrivial operation which may in the worst case require an exhaustive search throughthe subspaces. In practice, unless the number of subspaces is small, such an exhaustivesearch is prohibitive. It is thus very important for applications that there exists an efficientalgorithm to calculate the projection (8.57) for the UoS model used. Fortunately, for manyUoS models of interest, such efficient projection methods exist.
In particular, for block-sparse models, tree-sparse models, low rank matrix models,and continuous multiband signal models, computationally efficient methods are avail-able.
For example, assume U is a block-sparse model, which is defined by clustering theindices 1,2, . . . ,n into disjoint sets Bj . The projection on U is then straightforwardand directly extends the sort and threshold principle for k-sparse vectors. Given a signalx ∈ Rn, we can compute the energy of the signal in block Bj as
∑i∈Bj
|xi|2. Theprojection then sets all elements in x to zero apart from those elements whose indicesare in the k-blocks Bj with the highest energy values, which are kept unaltered.
Another important example are rooted tree-sparse models, where the projection ontoU can be done efficiently using an algorithm known as condensing sort and selectalgorithm (CSSA). This method provides a solution with a computational complexity ofO(n logn) [59].
The projection onto the closest rank-k matrix is simply calculated by computingthe singular value decomposition and by setting to zero all but the k largest singularvalues [60].
The final example, where this projection can be calculated at least conceptually, arecontinuous multiband signals as defined in Section 8.2.3. A continuous multiband signalis a signal whose Fourier transform is concentrated in a few narrow frequency bands. Todefine the projection onto these models, it is easier to consider a simplified model wherethe Fourier transform is partitioned into small blocks and where the Fourier transformof the signal is assumed to lie in a few of these blocks [61, 62]. This differs from the

Greedy algorithms for compressed sensing 379
original model in which the location of the nonzero frequency bands is not constrainedto lie in pre-defined blocks but can be arbitrary.11 Importantly, for this simplified model,the projection operator is essentially the same as that for a block-sparse model: computethe energy within each block (by integrating the squared Fourier transform over eachfrequency band) and only keep the k-blocks with the largest energies.
For other UoS models such as signal models where the signal is sparse in a dictionary,calculating the projection (8.57) is much more difficult. For example, if the UoS containsall x∈ Rn which can be written as x = Φc, where c∈ Rd is a k-sparse vector and whereΦ ∈ Rn×d with d > n, then solving the projection onto UoS is a computational problemthat is as difficult as solving a standard sparse CS problem, which is computationallydemanding even if the dictionary Φ itself satisfies the RIP condition. However, in thiscase, one might also be able to show that the product AΦ satisfies the RIP condition [63],in which case it might be better to directly try to solve the problem
minc: ‖c‖0≤k
‖y−AΦc‖22. (8.60)
8.4.3 Performance guarantees
Replacing the hard thresholding steps by more general projections is conceptually trivial,however, it is not clear if the modified algorithms are able to recover UoS signals andunder which conditions this might be possible.As for sparse signals, the first requirementwe need for a sampling operator A to be able to sample signals that exactly follow a UoSmodel, is that A should be one to one so that the samples uniquely define a UoS signal
∀x1,x2 ∈ U ,Ax1 = Ax2 =⇒ x1 = x2.
When L= Rm and if U is the union of countably many subspaces of dimension k <∞or less, then the set of linear maps A that are one to one for signals in U is dense in theset of all linear maps from H to Rm [46] as soon as m≥ k2, with k2 = k+k1, where k1
is the dimension of the second largest subspace in U . Moreover, if L= Rm and H = Rn
and if U is a finite union, then almost all linear maps are one to one if m ≥ k2, whilst ifwe additionally assume a smooth measure on each of the subspaces of U , then almostall linear maps are one to one for almost all elements in U whenever m ≥ k [47].
More generally, a good sampling strategy also needs to be robust to measurementinaccuracies. As for the sparse signal model, this can be quantified by a property similarto the RIP, which we refer to as U-RIP [47] and which we here defined quite generallyfor arbitrary subsets U ⊂ H. This property is referred to as “model-based RIP” in [49]and is very closely related to the stable sampling condition of Lu and Do [46].
11 In practice, many recovery algorithms consider such a simplified model as a signal following the generalcontinuous multiband signal model with arbitrary band locations which can always be described with thesimplified model at the cost of a doubling of the number of active bands.

380 T. Blumensath, M. E. Davies, and G. Rilling
definition 8.1 For any matrix A and any subset U ⊂ H, we can define the U-restricted isometry constants αU (A) and βU (A) as the tightest constants such that
αU (A) ≤ ‖Ax‖2L
‖x‖2H
≤ βU (A) (8.61)
holds for all x ∈ U .
If we define U2 = x = x1 +x2 : x1,x2 ∈ U, then αU2(A) and βU2(A) characterizethe sampling strategy defined by A for signals in U . In particular, the sampling operationA is one to one for signals x ∈ U if and only if αU2(A) > 0. Also, the interpretation ofαU2(A) and βU2(A) in terms of Lipschitz constants of the map x $→ Ax for x ∈ U (andits inverse) mentioned in Section 8.3.1 is still valid in this more general setting.
Similarly to the k-sparse case for which the recovery guarantees require 2k-RIP, 3k-RIP, etc., some theoretical guarantees will require the U2-RIP, U3-RIP, etc. The enlargedUoSs Up can be defined as Minkowski sums of the UoS defining the signal model andgeneralize the previous definition of U2. Given a UoS model U , we thus define for p > 0
Up =
x =
p∑j=1
x(j),x(j) ∈ U
. (8.62)
PLA recovery resultThe PLA enjoys the following theoretical result which generalizes the result ofTheorem 8.5 [43].
theorem 8.9 For arbitrary x ∈ H, given y = Ax + e where A satisfies the U2-RIPwith βU2(A)/αU2(A) < 1.5, then given some arbitrary δ > 0 and a step size µ satisfyingβU2(A) ≤ 1/µ < 1.5αU2(A), after
i =
2log(δ ‖e‖L
‖PU (x)‖H)
log(2/(µα)− 2)
(8.63)
iterations, the PLA calculates a solution x satisfying
‖x− x‖H ≤(√
c+ δ)‖e‖L + ‖PU (x)−x‖H (8.64)
where c ≤ 43αU2 (A)−2µ and e = A(x−PU (x))+ e.
It is important to stress that, for UoS models, the above result is near optimal, that is,even if we were able to solve the problem (8.59) exactly, the estimate xopt would havea worst case error bound that also depends linearly on ‖e‖L + ‖PU (x)−x‖H [43].

Greedy algorithms for compressed sensing 381
Improved bounds for structured sparse modelsIn the k-sparse signal case in Rn, if A satisfies the condition on the RIP of order 2k, thenthe size of the error ‖e‖2 = ‖e+A(x−xk)‖2 can be bounded by (see Lemma 8.2)
‖e‖2 ≤√
β2k‖y−xk‖2 +√
β2k‖x−xk‖1√
k+ ‖e‖2. (8.65)
Whilst in the worst case, ‖e+A(x−xk)‖22 = ‖e‖2
2 +‖A‖22,2‖(x−xk)‖2
2, if we assumethat the ordered coefficients of x decay rapidly, i.e. that ‖x− xk‖1 is small, and if A
satisfies the RIP condition, then Lemma 8.2 gives a much less pessimistic error bound. Inorder to derive a similar improved bound for UoS models, we similarly need to imposeadditional constraints. Unfortunately, no general conditions and bounds are available forthe most general UoS model, however, for structured sparse models, conditions havebeen proposed by Baraniuk et al. [49] which allow similar tighter bounds to be derived.
The first condition to be imposed is the nested approximation property (NAP). Thisproperty requires structured sparse models to have a nesting property, which requires thatthe structured sparse model has to be defined for arbitrary k ∈1, . . . ,n, so that we havea family of UoS models Uk, with one model for each k. When talking about these models,we will write U (without subscript) to refer to the whole family of models. To have thenesting property, the models Uk of a family U have to generate nested approximations.
definition 8.2 A family of models Uk, k ∈1,2, . . . ,n has the nested approximationproperty if
∀k < k′,∀x ∈ Rn,supp(PUk(x)) ⊂ supp(PUk′ (x)). (8.66)
In terms of UoS, this means that one of the k-sparse subspaces containing PUk(x)
must be included in at least one of the k′-sparse subspaces containing PUk′ (x).Given a family of models with the NAP, we will also need to consider the residual
subspaces of size k.
definition 8.3 For a given family U of UoS models, the residual subspaces of sizek are defined as
Rj,k = x ∈ Rn : ∃x′ ∈ Rn,x = PUjk(x′)−PU(j−1)k
(x′), (8.67)
for j ∈ 1, . . . , n/k!.
The residual subspaces allow us to partition the support of any signal x∈ Rn into setsno larger than k. Indeed, x can be written as x =
∑n/kj=1 xTj
with xTj∈Rj,k.
This machinery allows us to define a notion similar to that of compressible signalsdiscussed in Chapter 1. In analogy with p-compressible signals which are characterizedby the decay of σk(x)p = ‖x − xk‖p as k increases, these so-called U compressiblesignals are characterized by a fast decay of ‖PUk
(x)−x‖2, which implies a fast decayof the energies of the xTj
with increasing j.

382 T. Blumensath, M. E. Davies, and G. Rilling
definition 8.4 Given a family of structured sparse UoS models Ukk∈1,...,n, asignal x ∈ Rn is s-model-compressible if
∀k ∈ 1, . . . ,n,‖x−PUkx‖2 ≤ ck−1/s, (8.68)
for some c < ∞. Moreover, the smallest value of c for which (8.68) holds for x and s
will be referred to as s-model-compressibility constant cs(x).
An s-compressible signal in a structured sparse model that satisfies the NAP is char-acterized by a fast decay of its coefficients in the successive residual subspaces Rj,k forincreasing j. When sampling such a signal, the sensing matrix A may amplify some ofthe residual components xTj
∈ Rj,k of x more than others. Intuitively, as long as thisamplification is compensated by the decay of the energies of the xTj
, the signal can stillbe efficiently sampled by A. This behavior is controlled by a second property called therestricted amplification property (RaMP), which controls how much the sensing matrixcan amplify the xTj
.
definition 8.5 Given a scalable model U satisfying the nested approximationproperty, a matrix A has the (εk, r)-restricted amplification property for the residualsubspaces Rj,k of U if
∀j ∈ 1, . . . , n/k! ,∀x ∈Rj,k ‖Ax‖22 ≤ (1+ εk)j2r ‖x‖2
2). (8.69)
Note that for standard sparse models, the RIP automatically gives a RAmP for thenested sparse subspaces, so that no additional property is required for CS with thestandard sparse signal model. Importantly, s-compressible NAP sparse models sampledwith a map A that satisfy the (εk,s − 1)-RAmP, satisfy a lemma that is analogous toLemma 8.2 of the standard sparse model [49].
lemma 8.3 Any s-model-compressible signal x sampled with a matrix A with (εk,s−1)-RAmP satisfies
‖A(x−PUk(x))‖2 ≤
√1+ εkk−scs(x) log
⌈n
k
⌉. (8.70)
Through control provided by the additional assumptions, Lemma 8.3 provides a tighterbound on ‖e‖2 in Theorem 8.9. This leads directly to an improved theoretical guaranteefor PLA recovery of s-model-compressible signals measured with a system that satisfiesthe RAmP of the lemma. With the tighter bound on ‖A(x−PUk
(x))‖2, the PLA is thusguaranteed to achieve a better reconstruction in this more constrained setting.
A similar recovery guarantee has also been proved for the model-based CoSaMPalgorithm [49].
theorem 8.10 Given y = Ax + e, where A has U4k -RIP constants satisfying12
βU4k/αU4
k≤ 1.22, and verifies the (εk,s − 1)-RAmP, then after i iterations the signal
12 The result in [49] is actually based on a symmetric U4k -RIP while an asymmetric version is considered
here. In the symmetric U4k -RIP, the constants αU4
kand βU4
kare replaced by 1− δU4
kand 1+ δU4
k

Greedy algorithms for compressed sensing 383
estimate x satisfies
‖x− x‖2 ≤ 2−i ‖x‖2 +35(‖e‖2 + cs(x)k−s
(1+ log
⌈n
k
⌉)), (8.71)
where cs(x) is the s-model-compressibility constant of x defined in Definition 8.4.
8.4.4 When do the recovery conditions hold?
The strong recovery bounds for UoS as well as for s-model-compressible signals stated inthe previous section require A to satisfy the U2-RIP as well as the U4
k -RIP and (εk,s−1)-RAmP conditions respectively. What sampling systems satisfy these conditions? Howdo we design these systems and how do we check if a system satisfies these conditions?As with standard RIP, checking a linear map A for these conditions is computationallyinfeasible, however, it is again possible to show that certain random constructions ofsampling systems will satisfy the appropriate conditions with high probability.
A sufficient condition for the existence of matrices with given U-RIPConsidering a finite union of L finite-dimensional subspaces U , each of dimension lessthan k, it has been shown [47] that i.i.d. sub-gaussian m× n matrices will satisfy theU-RIP with overwhelming probability as soon as the number of measurements is largeenough.
More precisely, for any t > 0 and 0 < δ < 1, then i.i.d. sub-gaussian random matricesA ∈ Rm×n with
m ≥ 1
c(δ/6)
(2log(L)+2k log
(36
δ
)+ t
)(8.72)
have U-RIP constants αU (A) ≥ 1 − δ and βU (A) ≤ 1 + δ with probability at least1− e−t. The value of c(δ) in (8.72) depends on the specific sub-gaussian distributionof the values in A. For i.i.d. Gaussian and Bernoulli ±1/
√n matrices, c(δ) is given by
c(δ) = δ2/4− δ3/6.In the traditional CS setting, the number of k-sparse subspaces is given by L =
(nk
)≈
(ne/k)k and the above sufficient condition boils down to the standard CS requirement ofO(k log(n/k)) measurements. In structured sparse models U with sparsity k, the numberof subspaces L can be significantly smaller than in the traditional CS case. This suggeststhat acceptable U-RIP constants can be obtained for matrices with fewer rows, which inturn implies that signals may be recovered from fewer measurements. It is also worthnoticing that the required number of measurements (8.72) does not directly depend onthe dimension of the ambient space n unlike in the traditional CS setting.
For the theoretical guarantees presented above, the sensing matrix A will need to verifythe U2-RIP, U3-RIP, or U4-RIP. These unions contain more subspaces than U ,
(Lp
)for Up
which scales as Lp for small p. Therefore, for a UoS model U with L <(nk
)subspaces,
the difference in the number of subspaces in Up and the related number of subspaces in
respectively. In terms of the symmetric U4k -RIP, the condition in [49] is δU4
k≤ 0.1 (for some
appropriately rescaled A), which is guaranteed to hold true when βU4k/αU4
k≤ 1.22.

384 T. Blumensath, M. E. Davies, and G. Rilling
a pk-sparse model (≈Lp −(nk
)p) is thus significantly larger than the difference between
the original models L−(nk
).
Whilst the above result covers all finite unions of finite-dimensional subspaces, similarresults can also be derived for other UoS models where infinitely many and/or infinite-dimensional subspaces are considered [43]. For example, Recht et al. [64] have shownthat randomly constructed linear maps satisfy U2-RIP on all rank-k matrices.
theorem 8.11 Let A∈Rm×n1n2 be a matrix with appropriately scaled i.i.d. Gaussianentries. Define the linear map PX1 = Ax1 where x1 is the vectorized version of matrixX1, then with probability 1− e−c1m,
(1− δ)‖X1 −X2‖F ≤ ‖P (X1 −X2)‖2 ≤ (1+ δ)‖X1 −X2‖F (8.73)
for all rank-k matrices X1 ∈ Rn1×n2 and X2 ∈ Rn1×n2 , whenever m ≥ c0k(n1 +
n2) log(n1n2), where c1 and c0 are constants depending on δ only.
As shown by Mishali and Eldar [62] and Blumensath [43], similar results also holdfor the sampling strategy proposed in [62] for the analog shift-invariant subspace model.Here a real-valued time series x(t) whose Fourier transform X (f) has limited band-width Bn is mapped into a real-valued time series y(t) with bandwidth Bm and Fouriertransform Y(f). This mapping is done by partitioning the maximal support of X (f) inton equal size blocks X (Sj) and the maximal support of Y(f) into m blocks of the samesize Y(Si). The map is then defined by an m×n matrix A as
Y(Si) =
n∑j=1
[A]i,jX (Sj). (8.74)
theorem 8.12 Let U ⊂L2C([0, Bn]) be the subset of the set of square integrable real-
valued functions whose Fourier transform has positive support S ⊂ [0, Bn], where S isthe union of no more than k intervals of width no more than Bk. If the matrix A∈Rm×n
satisfies the RIP as a map from the set of all 2k-sparse vectors in Rn into Rm, withconstants α2k and β2k, then the map defined by Equation (8.74) satisfies the U2-RIPwith constants α2k and β2k.
A sufficient condition for the existence of matrices with given RAmP constantsSimilarly to the sufficient condition for matrices to have a given U-RIP, one can showthat sub-gaussian matrices with a large enough number of rows also satisfy the RAmPwith overwhelming probability.
Given a family of models U satisfying the nested approximation property, a matrixA∈Rm×n with i.i.d. sub-gaussian entries has the (εk, r)-RAmP with probability 1−e−t
as soon as
m ≥ maxj∈1,...,n/k
1(jr
√1+ εk − 1
)2 (2k +4logRjn
k+2t
), (8.75)
where Rj is the number of k-sparse subspaces contained in Rj,k. As for the U-RIP, onecan show that for the k-sparse model, Rj =
(nk
)and the requirement on m to verify

Greedy algorithms for compressed sensing 385
the RAmP is of the order of k log(n/k) as for the RIP. For a structured sparse modelsatisfying the NAP, Rj is smaller than
(nk
)which allows one to relax the constraint on
the number of measurements m.To demonstrate the importance of this result, it is worth considering rooted-tree-
sparse models. Importantly, there are significantly fewer subspaces in these models thanare found in unconstrained sparse models. For these models, it is therefore possible toshow [49] that, for certain randomly constructed matrices, both the U-RIP as well as the(εk, r)-RAmP hold with high probability whenever
m = O(k). (8.76)
The number of observations required to sample rooted-tree-compressible signals is thussignificantly lower than m = O(k log(n/k)), which would be the number of samplesrequired if we were to assume sparsity alone.
8.4.5 Empirical comparison
To demonstrate how exploiting additional structure can improve the recovery perfor-mance of greedy algorithms, we consider the application of the IHT algorithm andthe PLA to signals with a rooted-sparse-tree structure. Tree supports were generatedaccording to a uniform distribution on a k-sparse tree and the nonzero coefficients werei.i.d. normal distributed. As in the simulations presented in Section 8.2.6, m = 128,n = 256 and for each value of k/m, 1000 measurement matrices A were generated withcolumns drawn independently and uniformly from the unit sphere. As can be observedin Figure 8.5, the tree-based PLA significantly outperforms the standard IHT algorithmand achieves perfect reconstruction up to k/m ≈ 0.35.
8.4.6 Rank structure in the MMV problem
We end this section by briefly discussing an additional rank structure that can be exploitedin the Multiple Measurement Vector (MMV) sparse recovery problem (here we will onlydiscuss the noiseless MMV case).
Recall from Chapter 1, that in the MMV problem we observe multiple sparse signals,xii=1:l, xi ∈ Rn, through a common sensing matrix A giving multiple observationvectors yii=1:l, yi ∈ Rm. In addition we assume that the sparse signals, xi, share thesame underlying support. As always the goal is to recover the unknown signals xi fromthe observed data. To this end we can write the equivalent 0-based optimization as:
X = argminX
|supp(X)| s.t. AX = Y, (8.77)
where X = xii=1:l, Y = yii=1:l, and supp(X) :=⋃
i supp(xi) is the row supportof X . This problem is one of the earliest forms of structured sparse approximation to beconsidered and as we will see has strong links with the field of array signal processing.

386 T. Blumensath, M. E. Davies, and G. Rilling
1
0.8
Prob
abili
ty o
f su
ppor
t rec
over
y
0.6
0.4
0.2
00 0.2
Sparsity k/m0.4 0.6
IHTPLA
Figure 8.5 Probability of finding the correct tree-support using IHT (dashed) and tree-based PLA (solid) onsignals with a tree structured support. The nonzero elements in x are i.i.d. normal distributed andthe tree-supports are generated according to a uniform distribution on the trees of size k.
Exact recoveryWhen rank(X) = 1 the MMV problem reduces to the single measurement vector (SMV)problem as no additional information can be leveraged. However, when rank(X) > 1 themultiple signals do provide additional information that can aid recovery. Geometrically,we are now observing subspaces of data rather than simply vectors.
For the SMV problem it is well known (see Chapter 1) that a necessary and sufficientcondition for the measurements y = Ax to uniquely determine each k-sparse vector x isgiven by k < spark(A)/2 where the spark denotes the smallest number of columns ofA that are linearly dependent. In contrast, in the MMV problem it can be shown that thek-joint sparse solution to AX = Y is unique if and only if [65, 56]:
|supp(X)| < spark(A)− 1+ rank(Y )
2(8.78)
(or equivalently replacing rank(Y ) with rank(X) [56]). This indicates that, at least whentackling (8.77), the problem becomes easier as the rank of X increases. Indeed, in thebest-case scenario, when X and Y have maximal rank, rank(X) = rank(Y ) = k, andspark(A) > k+1, only k+1 measurements per signal are needed to ensure uniqueness.
Popular approaches to MMVDespite the fact that the rank of the observation matrix Y can be exploited to improverecovery performance, to date most popular techniques have ignored this fact. Indeedmost of the approaches advocated for solving the MMV problem are simple extensionsof single measurement vector algorithms that typically replace a vector norm ‖x‖p in
Greedy algorithms for compressed sensing 387
the SMV problem with a matrix norm of the form:
‖X‖p,q :=
(∑i
‖Xi,:‖qp
)1/q
. (8.79)
For example, convex optimization approaches [65, 66] would minimize ‖X‖1,q for some1 ≤ q ≤ ∞. While MMV greedy pursuit algorithms, such as Simultaneous OrthogonalMatching Pursuit (SOMP) [67, 65, 68], would replace the maximum correlation selectionby a selection involving ‖AT X‖q,∞ for some q ≥ 1. Unfortunately norms of type (8.79)do not ‘see’ the rank information of the matrix and it can be shown that the worstcase performance of MMV algorithms based upon these mixed norms are essentiallyequivalent to the worst case bounds of the associated SMV problem [56]. In [56] suchalgorithms are called rank blind.
MUSICAnother surprise in the MMV scenario is that although most popular algorithms are rankblind, when rank(Y ) = k the computational complexity of the recovery problem ceasesto be NP-hard and the problem can be solved using an exhaustive search procedurewith complexity that scales polynomially with the dimension of the coefficient space.The approach is to apply the MUSIC (MUltiple SIgnal Classification) algorithm [69]popular in array signal processing. Its first appearance as an algorithm for solving a moreabstract MMV problem was by Feng and Bresler [70, 71] in the context of multiband(compressive) sampling.
Let us briefly describe the procedure. Since rank(Y ) = k it follows that range(Y ) =
range(AΩ), Ω = supp(X). We can therefore consider each column of A individually.Each Aj , j ∈ Ω, must lie within the range of Y . Furthermore, assuming uniqueness,these will be the only columns contained in range(Y ). We therefore form an orthnormalbasis for the range of Y , U = orth(Y ) using for example an eigenvalue or singular valuedecomposition and identify the support of X by:
‖ATj U‖2
‖Aj‖= 1, if and only if j ∈ Ω. (8.80)
Then X can be recovered through X = A†ΩY . Note that MUSIC can also efficiently deal
with noise through appropriate eigenvalue thresholding [69].
Rank aware pursuitsWhile MUSIC provides guaranteed recovery for the MMV problem in the maximal rankcase there are no performance guarantees if rank(X) < k and empirically MUSIC doesnot perform well in this scenario. This motivated a number of researchers [56, 72, 73]to investigate the possibility of an algorithm that in some way interpolates between aclassical greedy algorithm for the SMV problem and MUSIC when rank(X) = k.
One possible solution that was proposed in [72, 73] for various greedy algorithms is toadopt a hybrid approach and apply one of a variety of greedy algorithms to select the firsti = k − rank(Y ) elements. The remaining components can then be found by applying

388 T. Blumensath, M. E. Davies, and G. Rilling
MUSIC to an augmented data matrix [Y,A[i]T ] which, under identifiability assumptions,
will span the range of AΩ. A drawback of such techniques is that they require priorknowledge of the signal’s sparsity, k in order to know when to apply MUSIC.
Amore direct solution can be achieved by careful modification of the ORMP algorithm[56] to make it rank aware, the key ingredient of which is a modified selection step.
Suppose that at the start of the ith iteration we have a selected support set T [i−1]. Anew column Aj is then chosen based upon the following selection rule:
j[i] = argmaxj
‖ATj U [i−1]‖2
‖P⊥T [i−1]Aj‖2
. (8.81)
In comparison with Equation (8.19) we have simply replaced the inner product ATj r[i−1]
by the inner product ATj U [i−1]. Therefore the right-hand side of (8.81) measures the
distance of the normalized vector P⊥T [i−1]Aj/‖P⊥
T [i−1]Aj‖ from the subspace spannedby U [i−1] thereby accounting for the subspace geometry of U [i−1]. The full description ofthe Rank Aware ORMP algorithm is summarized in Algorithm 8.11. As with the originalORMP efficient implementations are possible based around QR factorization.
Algorithm 8.11 Rank Aware Order Recursive Matching Pursuit (RA-ORMP)Input: Y , A
Initialize R[0] = Y,X [0] = 0,T [0] = ∅for i = 1; i := i+1 until stopping criterion is met do
Calculate orthonormal basis for residual: U [i−1] = orth(R[i−1])
j[i] = argmaxj ∈T [i−1] ‖ATj U [i−1]‖2/‖P⊥
T [i−1]Aj‖2
T [i] = T [i−1] ∪ j[i]
X[i]T [i],: = A†
T [i]Y
R[i] = Y −AX [i]
end for
Note that it is crucial to use the ORMPnormalized column vectors in order to guaranteerepeated correct selection in the maximal rank case. When a similar selection strategy isemployed in an MMV OMP algorithm there is a rank degeneration effect – the rank of theresidual matrix decreases with each correct selection while the sparsity level typicallyremains at k. This means the algorithm can and does result in incorrect selections. Forfurther details see [56]. In contrast, like MUSIC, RA-ORMP is guaranteed to correctlyidentify X when rank(X) = k and the identifiability conditions are satisfied [56].
The improvements in performance obtainable by the correct use of rank informationare illustrated in Figure 8.6. In these simulations dictionaries of size 32×256 were gener-ated with columns Aj drawn uniformly from a unit sphere. The number of measurementvectors was varied between 1 and 32 while the nonzero elements of X were also inde-pendently drawn from a unit variance Gaussian distribution. Note that this implies thatrank(X) = rank(Y ) = minl,k with probability one.

Greedy algorithms for compressed sensing 389
1I1,2 SOMP RA-ORMP
0.8
0.6
0.4
0.2
00 10
Prob
abili
ty o
fsu
ppor
t rec
over
y
Sparsity k Sparsity k Sparsity k20
(a) (b) (c)
30 0
1
0.8
0.6
0.4
0.2
0
1
0.8
0.6
0.4
0.2
010 20 30 0 10 20 30
Figure 8.6 The empirical probability of recovery for mixed 1,2 minimization (a), SOMP (b), andRA-ORMP (c) as a function of sparsity level k. The curves in each plot relate to l = 1,2,4,16,and 32 (from left to right). Note that the right-most curve (l = 32) for RA-ORMP is not visible asperfect recovery is achieved for all values of k shown.
The plots indicate that recovery with 1,2 minimization and SOMP exhibits improvedperformance when multiple measurement vectors are present, but they do however notapproach MUSIC-like performance as the rank of X increases. In contrast, RA-ORMPis able to achieve OMP-like performance in the SMV scenario (l = 1) and exhibitsimproved recovery with increasing rank, with guaranteed recovery in the maximal rankcase.
8.5 Conclusions
As stressed repeatedly throughout this chapter, greedy methods offer powerfulapproaches for CS signal recovery. Greedy pursuit algorithms, which were discussedin Section 8.2, can be much faster than 1-based methods and are often applicable tovery large sparse recovery problems. Iterative thresholding approaches, which were dis-cussed in Section 8.3, offer another fast alternative, which in addition, share the nearoptimal recovery guarantees offered by 1-based approaches. Furthermore, as discussedat length in Section 8.4, these methods are easily adapted to much more general signalmodels.
Whilst we have here looked particularly at the class of UoS models, it is again worthpointing out that similar results hold for much broader classes of low-dimensional signalmodels [43]. Furthermore, these methods can also be adapted to a setting where theobservation model is nonlinear [74], that is, where y = A(x) + e, with A a nonlinearmap. The Projected Landweber Algorithm then becomes
x[i+1] = PU
(x[i] − µ
2∇(x[i])
), (8.82)
where ∇(x[i]) is the (generalized) gradient of the error ‖y−Ax‖2L evaluated at x[i]. Note
that this formulation allows more general cost functions ‖y−Ax‖2L (not necessarily only
390 T. Blumensath, M. E. Davies, and G. Rilling
Hilbert space norms). Importantly, Blumensath [74] recently derived the first theoreticalrecovery guarantees that generalize CS theory also to this nonlinear setting.
Greedy methods are thus powerful tools for CS recovery problems. They are fast andversatile and applicable far beyond the standard sparse setting traditionally consideredin CS. These methods therefore remain at the forefront of active CS research and provideimportant tools for a wide range of CS applications.
Acknowledgement
This work was supported in part by the UK’s Engineering and Physical Science ResearchCouncil grant EP/F039697/1, by the European Commission through the SMALL projectunder FET-Open, grant number 225913 and a Research Fellowship from the School ofMathematics at the University of Southampton.
References
[1] J. H. Friedman and J. W. Tukey. A projection pursuit algorithm for exploratory data analysis.IEEE Trans Comput, 23(9):881–890, 1974.
[2] S. Mallat and Z. Zhang. Matching pursuits with time-frequency dictionaries. IEEE Trans Sig-nal Proc, 41(12):3397–3415, 1993. Available from: citeseer.nj.nec.com/mallat93matching.html.
[3] A. Miller. Subset Selection in Regression. 2nd edn. Chapman and Hall; 2002.[4] R. A. DeVore and V. N. Temlyakov. Some remarks on greedy algorithms. Adv Comput Math,
5:173–187, 1996.[5] J. Hogbom. Aperture synthesis with a non-regular distribution of interferometer baselines.
Astrophys J Suppl Ser, 15:417–426, 1974.[6] S. Krstulovic and R. Gribonval. MPTK: Matching pursuit made tractable. Proc of Int Conf
Acoust, Speech, Signal Proc, Vol. 3. Toulouse, France; 2006. pp. III–496–III–499.[7] Y. C. Pati, R. Rezaifar, and P. S. Krishnaprasad. Orthogonal matching pursuit: recursive
function approximation with applications to wavelet decomposition. Rec 27th Asilomar ConfSign, Syst Comput, 1993.
[8] S. Mallat, G. Davis, and Z. Zhang. Adaptive time-frequency decompositions. SPIE J OptEng, 33(7):2183–2191, 1994.
[9] S. F. Cotter, J. Adler, B. D. Rao, and K. Kreutz-Delgado. Forward sequential algorithms forbest basis selection. In: IEE Proc Vision, Image Signal Proc, 235–244, 1999.
[10] A. R. Barron, A. Cohen, R. A. DeVore, and W. Dahmen. Approximation and learning bygreedy algorithms. Ann Stati, 2008;36(1):64–94.
[11] T. Blumensath and M. Davies. Gradient pursuits. IEEE Trans Sign Proc, 56(6):2370–2382,2008.
[12] R. Gribonval and P. Vandergheynst. On the exponential convergence of Matching Pursuitsin Quasi-Incoherent Dictionaries. IEEE Trans Inform Theory, 52(1):255–261, 2006.
[13] J. A. Tropp. Greed is good: algorithmic results for Sparse Approximation. IEEE Trans InformTheory, 2004;50(10):2231–2242, 2004.
[14] B. Mailhe, R. Gribonval, F. Bimbot, and P. Vandergheynst. A low complexity Orthog-onal Matching Pursuit for sparse signal approximation with shift-invariant dictionaries.
Greedy algorithms for compressed sensing 391
Proc IEEE Int Conf Acoust, Speech, Signal Proc, Washington, DC, USA, pp. 3445–3448,2009.
[15] J. R. Shewchuk. An introduction to the conjugate gradient method without the agonizingpain. School of Computer Science, Carnegie Mellon University, 1994.
[16] G. H. Golub and F. Van Loan. Matrix Computations. 3rd edn. Johns Hopkins UniversityPress, 1996.
[17] D. L. Donoho, I. Drori, Y. Tsaig, and J. L. Starck. Sparse solution of underdetermined linearequations by stagewise orthogonal matching pursuit. Stanford University, 2006.
[18] T. Blumensath and M. Davies. Stagewise weak gradient pursuits. IEEE Trans Sig Proc,57(11):4333–4346, 2009.
[19] H. Crowder and P. Wolfe. Linear convergence of the Conjugate Gradient Method. NumerComput, 16(4):431–433, 1972.
[20] K. Schnass and P. Vandergheynst. Average performance analysis for thresholding. IEEE SigProc Letters, 14(11):431–433, 2007.
[21] T. Blumensath and M. Davies. Iterative thresholding for sparse approximations. J FourierAnal Appl, 14(5):629–654, 2008.
[22] D. Needell and R. Vershynin. Signal recovery from incomplete and inaccurate measurementsvia regularized orthogonal matching pursuit. IEEE J Sel Topics Sig Proc, 4(2):310–316,2010.
[23] W. Dai and O. Milenkovic. Subspace pursuit for compressive sensing signal reconstruction.IEEE Trans Inform Theory, 55(5):2230–2249, 2009.
[24] D. Needell and R. Vershynin. Uniform uncertainty principle and signal recovery viaregularized Orthogonal Matching Pursuit. Found Comput Math, 9(3):317–334, 2008.
[25] S. Chen, S. A. Billings, and W. Luo. Orthogonal least-squares methods and their applicationto non-linear system identification. Int J Control, 50(5):1873–1896, 1989.
[26] T. Blumensath and M. Davies. On the difference between Orthogonal Matching Pursuitand Orthogonal Least Squares; 2007. Unpublished manuscript, available at: http://eprints.soton.ac.uk/142469/. Available from: www.see.ed.ac.uk/∼tblumens/publications.html.
[27] D. L. Donoho. For most large underdetermined systems of linear equations the minimal1-norm solution is also the sparsest solution. Commun Pure Appl Math, 59(6):797–829,2006.
[28] H. Rauhut. On the impossibility of uniform sparse reconstruction using greedy methods.Sampling Theory Signal Image Proc, 7(2):197–215, 2008.
[29] M. A. Davenport and M. B. Wakin. Analysis of orthogonal matching pursuit using therestricted isometry property. IEEE Trans Inform Theory, 56(9):4395–4401, 2009.
[30] E. Candès. The restricted isometry property and its implications for compressed sensing. CR Acad Sci, Paris, Serie I, 346:589–592, 2008.
[31] J. A. Tropp and A. C. Gilbert. Signal recovery from partial information via OrthogonalMatching Pursuit. IEEE Trans Inform Theory, 53(12):4655–4666, 2006.
[32] A. K. Fletcher, S. Rangan, and V. K. Goyal. Necessary and sufficient conditions for sparsitypattern recovery. IEEE Trans Inform Theory, 55(12):5758–5772, 2009.
[33] M. E. Davies and T. Blumensath. Faster and greedier: algorithms for sparse reconstructionof large datasets. In: 3rd Int Symp Commun, Control Signal Proc, pp. 774–779, 2008.
[34] D. Needell and J. A. Tropp. CoSaMP: iterative signal recovery from incomplete andinaccurate samples. Appl Comput Harmonic Anal, 26(3):301–321, 2008.
[35] N. G. Kingsbury andT. H. Reeves. Iterative image coding with overcomplete complex wavelettransforms. Proc Conf Visual Commun Image Proc, 2003.

392 T. Blumensath, M. E. Davies, and G. Rilling
[36] J. Portilla. Image restoration through l0 analysis-based sparse optimization in tight frames.Proc IEEE Int Conf Image Proc, 2009.
[37] A. Cohen, W. Dahmen, and R. DeVore. Instance optimal decoding by thresholding in com-pressed sensing. Proc 8th Int Conf Harmonic Anal Partial Differential Equations. Madrid,Spain, pp. 1–28, 2008.
[38] R. Berind and P. Indyk. Sequential Sparse Matching Pursuit. In: Allerton’09 Proc 47th AnnAllerton Conf Commun, Control, Comput, 2009.
[39] K. Lange, D. R. Hunter, and I. Yang. Optimization transfer using surrogate objectivefunctions. J Comput Graphical Stat, 9:1–20, 2006.
[40] T. Blumensath and M. Davies. Iterative hard thresholding for compressed sensing. ApplComput Harmonic Anal, 27(3):265–274, 2009.
[41] R. Meka, P. Jain, and I. S. Dhillon. Guaranteed rank minimization via singular valueprojection. arXiv:09095457v3, 2009.
[42] R. Garg and R. Khandekar. Gradient Descent with Sparsification: an iterative algorithm forsparse recovery with restricted isometry property. Proc Int Conf Machine Learning, Montreal,Canada; 2009.
[43] T. Blumensath. Sampling and reconstructing signals from a union of linear subspaces.Submitted to IEEE Trans Inform Theory, 2010.
[44] T. Blumensath and M. Davies. Normalised iterative hard thresholding; guaranteed stabilityand performance. IEEE J Sel Topics Sig Proc, 4(2):298–309, 2010.
[45] E. van den Berg and M. P. Friedlander. Probing the Pareto frontier for basis pursuit solutions.SIAM J Sci Comput, 31(2):890–912, 2008.
[46] Y. Lu and M. Do. A theory for sampling signals from a union of subspaces. IEEE TransSignal Proc, 56(6):2334–2345, 2008.
[47] T. Blumensath and M. E. Davies. Sampling theorems for signals from the union of finite-dimensional linear subspaces. IEEE Trans Inform Theory, 55(4):1872–1882, 2009.
[48] Y. C. Eldar, P. Kuppinger, and H. Bolcskei. Block-sparse signals: uncertainty relations andefficient recovery. IEEE Trans Signal Proc, 58(6):3042–3054, 2010.
[49] R. G. Baraniuk, V. Cevher, M. F. Duarte, and C. Hegde. Model-based compressive sensing.IEEE Trans Inform Theory, 56(4):1982–2001, 2010.
[50] M. Crouse, R. Nowak, and R. Baraniuk. Wavelet-based statistical signal processing usinghidden Markov models. IEEE Trans Sig Proc, 46(4):886–902, 1997.
[51] J. K. Romberg, H. Choi, and R. G. Baraniuk. Bayesian tree-structured image modelingusing wavelet-domain hidden Markov models. IEEE Trans Image Proc, 10(7):1056–1068,2001.
[52] J. Portilla, V. Strela, M. Wainwright, and E. P. Simoncelli. Image denoising using scalemixtures of Gaussians in the wavelet domain. IEEE Trans Image Proc, 12(11):1338–1351,2003.
[53] J. M. Shapiro. Embedded image coding using zerotrees of wavelet coefficients. IEEE TransSignal Proc, 41(12):3445–3462, 1993.
[54] A. Cohen, W. Dahmen, I. Daubechies, and R. Devore. Tree approximation and optimalencoding. J Appl Comp Harmonic Anal, 11:192–226, 2000.
[55] Y. Eldar and M. Mishali. Robust recovery of signals from a structured union of subspaces.IEEE Trans Inform Theory, 55(11):5302–5316, 2009.
[56] M. E. Davies and Y. C. Eldar. Rank awareness in joint sparse recovery. arXiv:10044529v1.2010.

Greedy algorithms for compressed sensing 393
[57] C. La and M. Do. Signal reconstruction using sparse tree representations. Proc SPIE ConfWavelet Appl Signal Image Proc XI. San Diego, California, 2005.
[58] M. F. Duarte, M. B. Wakin, and R. G. Baraniuk. Fast reconstruction of piecewise smooth sig-nals from random projections. Proc Workshop Sig Proc Adapt Sparse Struct Repres, Rennes,France; 2005.
[59] R. G. Baraniuk. Optimal tree approximation with wavelets. Wavelet Applications in Signaland Image Processing VII, vol 3813, pp. 196–207, 1999.
[60] D. Goldfarb and S. Ma. Convergence of fixed point continuation algorithms for matrix rankminimization. arXiv:09063499v3. 2010.
[61] M. Mishali andY. C. Eldar. From theory to practice: sub-Nyquist sampling of sparse widebandanalog signals. IEEE J Sel Topics Sig Proc, 4(2):375–391, 2010.
[62] M. Mishali and Y. C. Eldar. Blind multi-band signal reconstruction: compressed sensing foranalog signals. IEEE Trans Sig Proc, 57(3):993–1009, 2009.
[63] H. Rauhut, K. Schnass, and P. Vandergheynst. Compressed sensing and redundant dictionar-ies. IEEE Trans Inform Theory, 54(5):2210–2219, 2008.
[64] B. Recht, M. Fazel, and P. A. Parrilo. Guaranteed minimum-rank solution of linear matrixequations via nuclear norm minimization. To appear in SIAM Rev. 2010.
[65] J. Chen and X. Huo. Theoretical results on sparse representations of multiple-measurementvectors. IEEE Trans Sig Proc, 54(12):4634–4643, 2006.
[66] J. A. Tropp. Algorithms for simultaneous sparse approximation. Part II: Convex relaxation.Sig Proc, 86(3):589–602, 2006.
[67] S. F. Cotter, B. D. Rao, K. Engan, and K. Delgado. Sparse solutions to linear inverse problemswith multiple measurement vectors. IEEE Trans Sig Proc, 53(7):2477–2488, 2005.
[68] J. A. Tropp. Algorithms for simultaneous sparse approximation. Part II: Convex relaxation.Sig Proc, 86:589–602, 2006.
[69] R. O. Schmidt. Multiple emitter location and signal parameter estimation. Proc RADCSpectral Estimation Workshop, 243–258, 1979.
[70] P. Feng. Universal minimum-rate sampling and spectrum-blind reconstruction for multibandsignals. University of Illinois; 1998.
[71] P. Feng and Y. Bresler. Spectrum-blind minimum-rate sampling and reconstruction ofmultiband signals. Proc IEEE Int Conf Acoust, Speech, Signal Proc, 1688–1691, 1996.
[72] K. Lee and Y. Bresler. iMUSIC: iterative MUSIC Algorithm for joint sparse recovery withany rank. 2010;Arxiv preprint: arXiv:1004.3071v1.
[73] J. M. Kim, O. K. Lee, and J. C. Ye. Compressive MUSIC: a missing link between compressivesensing and array signal processing;Arxiv preprint, arXiv:1004.4398v1.
[74] T. Blumensath. Compressed sensing with nonlinear observations. Preprint, available at:http://eprintssotonacuk/164753. 2010.

9 Graphical models concepts incompressed sensingAndrea Montanari
This chapter surveys recent work in applying ideas from graphical models and messagepassing algorithms to solve large-scale regularized regression problems. In particular,the focus is on compressed sensing reconstruction via 1 penalized least-squares (knownas LASSO or BPDN). We discuss how to derive fast approximate message passingalgorithms to solve this problem. Surprisingly, the analysis of such algorithms allowsone to prove exact high-dimensional limit results for the LASSO risk.
9.1 Introduction
The problem of reconstructing a high-dimensional vector x ∈ Rn from a collection ofobservations y ∈ Rm arises in a number of contexts, ranging from statistical learningto signal processing. It is often assumed that the measurement process is approximatelylinear, i.e. that
y = Ax+w, (9.1)
where A ∈ Rm×n is a known measurement matrix, and w is a noise vector.The graphical models approach to such a reconstruction problem postulates a joint
probability distribution on (x,y) which takes, without loss of generality, the form
p(dx, dy) = p(dy|x)p(dx) . (9.2)
The conditional distribution p(dy|x) models the noise process, while the prior p(dx)
encodes information on the vector x. In particular, within compressed sensing, it candescribe its sparsity properties. Within a graphical models approach, either of thesedistributions (or both) factorizes according to a specific graph structure. The resultingposterior distribution p(dx|y) is used for inferring x given y.
Compressed Sensing: Theory and Applications, ed. Yonina C. Eldar and Gitta Kutyniok. Published byCambridge University Press. © Cambridge University Press 2012.
Graphical models concepts in compressed sensing 395
There are many reasons to be skeptical about the idea that the joint probability distri-bution p(dx, dy) can be determined, and used for reconstructing x. To name one suchreason for skepticism, any finite sample will allow one to determine the prior distribu-tion of x, p(dx) only within limited accuracy. A reconstruction algorithm based on theposterior distribution p(dx|y) might be sensitive with respect to changes in the priorthus leading to systematic errors.
One might be tempted to drop the whole approach as a consequence. We argue thatsticking to this point of view is instead fruitful for several reasons:
1. Algorithmic. Several existing reconstruction methods are in fact M-estimators, i.e.they are defined by minimizing an appropriate cost function CA,y(x) over x ∈ Rn
[80]. Such estimators can be derived as Bayesian estimators (e.g. maximum aposteriori probability) for specific forms of p(dx) and p(dy|x) (for instance byletting p(dx|y) ∝ exp−CA,y(x))dx ). The connection is useful both in interpret-ing/comparing different methods, and in adapting known algorithms for Bayesestimation.Aclassical example of this cross-fertilization is the paper [33]. This reviewdiscusses several other examples that build on graphical models inference algorithms.
2. Minimax. When the prior p(dx) or the noise distributions, and therefore the condi-tional distribution p(dy|x), “exist” but are unknown, it is reasonable to assume thatthey belong to specific structure classes. By this term we refer generically to a classof probability distributions characterized by a specific property. For instance, withincompressed sensing one often assumes that x has at most k nonzero entries. One canthen take p(dx) to be a distribution supported on k-sparse vectors x ∈ Rn. If Fn,k
denotes the class of such distributions, the minimax approach strives to achieve thebest uniform guarantee over Fn,k. In other words, the minimax estimator achievesthe smallest expected error (e.g. mean square error) for the “worst” distribution inFn,k.
It is a remarkable fact in statistical decision theory [52] (which follows from a gen-eralization of Von Neumann minimax theorem) that the minimax estimator coincideswith the Bayes estimator for a specific (worst case) prior p ∈Fn,k. In one dimensionconsiderable information is available about the worst case distribution and asymptot-ically optimal estimators (see Section 9.3). The methods developed here allow oneto develop similar insights in high-dimension.
3. Modeling. In some applications it is possible to construct fairly accurate models bothof the prior distribution p(dx) and of the measurement process p(dy|x). This is thecase for instance in some communications problems, whereby x is the signal producedby a transmitter (and generated uniformly at random according to a known codebook),and w is the noise produced by a well-defined physical process (e.g. thermal noise inthe receiver circuitry). A discussion of some families of practically interesting priorsp(dx) can be found in [11].
Further, the question of modeling the prior in compressed sensing is discussed from thepoint of view of Bayesian theory in [43].
The rest of this chapter is organized as follows. Section 9.2 describes a graphical modelnaturally associated to the compressed sensing reconstruction problem. Section 9.3

396 Andrea Montanari
provides important background on the one-dimensional case. Section 9.4 describes astandard message passing algorithm – the min-sum algorithm – and how it can be sim-plified to solve the LASSO optimization problem. The algorithm is further simplifiedin Section 9.5 yielding the AMP algorithm. The analysis of this algorithm is outlinedin Section 9.6. As a consequence of this analysis, it is possible to compute exact high-dimensional limits for the behavior of the LASSO estimator. Finally in Section 9.7 wediscuss a few examples of how the approach developed here can be used to addressreconstruction problems in which a richer structural information is available.
9.1.1 Some useful notation
Throughout this review, probability measures over the real line R or the Euclidean spaceRK play a special role. It is therefore useful to be careful about the probability-theorynotation. The less careful reader who prefers to pass directly to the “action” is invited toskip these remarks at a first reading.
We will use the notation p or p(dx) to indicate probability measures (eventually withsubscripts). Notice that, in the last form, the dx is only a reminder of which variable isdistributed with measure p. (Of course one is tempted to think of dx as an infinitesimalinterval but this intuition is accurate only if p admits a density.)
A special measure (positive, but not normalized and hence not a probability measure)is the Lebesgue measure for which we reserve the special notation dx (something likeµ(dx) would be more consistent but, in our opinion, less readable). This convention isparticularly convenient for expressing in formulae statements of the form “padmits a den-sity f with respect to Lebesgue measure dx, with f : x $→ f(x)≡ exp(−x2/(2a))/
√2πa
a Borel function,” which we write simply
p(dx) =1√2πa
e−x2/2a dx. (9.3)
It is well known that expectations are defined as integrals with respect to the probabilitymeasure which we denote as
Epf =
∫R
f(x)p(dx) , (9.4)
sometimes omitting the subscript p in Ep and R in∫
R. Unless specified otherwise, we
do not assume such probability measures to have a density with respect to Lebesguemeasure. The probability measure p is a set function defined on the Borel σ-algebra,see e.g. [7, 82]. Hence it makes sense to write p((−1,3]) (the probability of the interval(−1,3] under measure p) or p(0) (the probability of the point 0). Equally valid wouldbe expressions such as dx((−1,3]) (the Lebesgue measure of (−1,3]) or p(dx)((−1,3])
(the probability of the interval (−1,3] under measure p) but we avoid them as somewhatclumsy.
Graphical models concepts in compressed sensing 397
A (joint) probability measure over x ∈ RK and y ∈ RL will be denoted by p(dx,dy)
(this is just a probability measure over RK ×RL = RK+L). The corresponding condi-tional probability measure of y given x is denoted by p(dx|y) (for a rigorous definitionwe refer to [7, 82]).
Finally, we will not make use of cumulative distribution functions – commonly calleddistribution functions in probability theory – and instead use “probability distribution”interchangeably with “probability measure.”
Some fairly standard discrete mathematics notation will also be useful. The set of firstK integers is to be denoted by [K] = 1, . . . ,K. Order of growth of various functionswill be characterized by the standard “big-O” notation. Recall in particular that, forM →∞, one writes f(M) = O(g(M)) if f(M) ≤ C g(M) for some finite constant C,f(M) = Ω(g(M)) if f(M)≥ g(M)/C, and f(M) = Θ(g(M)) if g(M)/C ≤ f(M)≤Cg(M). Further f(M) = o(g(M)) if f(M)/g(M) → 0. Analogous notations are usedwhen the argument of f and g go to 0.
9.2 The basic model and its graph structure
Specifying the conditional distribution of y given x is equivalent to specifying the distri-bution of the noise vector w. In most of this chapter we shall take p(w) to be a Gaussiandistribution of mean 0 and variance β−1I, whence
pβ(dy|x) =( β
2π
)n/2exp
− β
2‖y−Ax‖2
2
dy . (9.5)
The simplest choice for the prior consists in taking p(dx) to be a product distribution withidentical factors p(dx) = p(dx1)×·· ·× p(dxn). We thus obtain the joint distribution
pβ(dx, dy) =( β
2π
)n/2exp
− β
2‖y−Ax‖2
2
dy
n∏i=1
p(dxi) . (9.6)
It is clear at the outset that generalizations of this basic model can be easily defined, insuch a way to incorporate further information on the vector x or on the measurementprocess. As an example, consider the case of block-sparse signals: The index set [n] ispartitioned into blocks B(1), B(2), …B() of equal length n/, and only a small fractionof the blocks is non-vanishing. This situation can be captured by assuming that the priorp(dx) factors over blocks. One thus obtains the joint distribution
pβ(dx, dy) =( β
2π
)n/2exp
− β
2‖y−Ax‖2
2
dy
∏j=1
p(dxB(j)) , (9.7)
where xB(j) ≡ (xi : i ∈ B(j)) ∈ Rn/. Other examples of structured priors will bediscussed in Section 9.7.

398 Andrea Montanari
The posterior distribution of x given observations y admits an explicit expression, thatcan be derived from Eq. (9.6):
pβ(dx|y) =1
Z(y)exp
− β
2‖y−Ax‖2
2
n∏i=1
p(dxi) , (9.8)
where Z(y)= (2π/β)n/2p(y) ensures the normalization∫
p(dx|y)=1. Let us stress thatwhile this expression is explicit, computing expectations or marginals of this distributionis a hard computational task.
Finally, the square residuals ‖y−Ax‖22 decompose in a sum of m terms yielding
pβ(dx|y) =1
Z(y)
m∏a=1
exp− β
2
(ya −AT
a x)2 n∏
i=1
p(dxi) , (9.9)
where Aa is the ath row of the matrix a. This factorized structure is convenientlydescribed by a factor graph, i.e. a bipartite graph including a “variable node” i ∈ [n]
for each variable xi, and a “factor node” a ∈ [m] for each term ψa(x) = exp−β(ya −AT
a x)2/2. Variable i and factor a are connected by an edge if and only if ψa(x) dependsnontrivially on xi, i.e. if Aai = 0. One such factor graph is reproduced in Figure 9.1.
An estimate of the signal can be extracted from the posterior distribution (9.9) invarious ways. One possibility is to use conditional expectation
xβ(y;p) ≡∫
Rn
x pβ(dx|y) . (9.10)
Classically, this estimator is justified by the fact that it achieves the minimal meansquare error provided the pβ(dx,dy) is the actual joint distribution of (x,y). In thepresent context we will not assume that the “postulated” prior pβ(dx) coincides with theactual distribution of x, and hence xβ(y;p) is not necessarily optimal (with respect to
1 i n
1 a m
Figure 9.1 Factor graph associated to the probability distribution (9.9). Empty circles correspond tovariables xi, i ∈ [n] and squares correspond to measurements ya, a ∈ [m].

Graphical models concepts in compressed sensing 399
mean square error). The best justification for xβ(y;p) is that a broad class of estimatorscan be written in the form (9.10).
An important problem with the estimator (9.10) is that it is in general hard to compute.In order to obtain a tractable proxy, we assume that p(dxi) = pβ,h(dxi) = cfβ,h(xi)dxi
for fβ,h(xi) = e−βh(xi) an un-normalized probability density function. As β get large,the integral in Eq. (9.10) becomes dominated by the vector x with the highest posteriorprobability pβ . One can then replace the integral in dx with a maximization over x anddefine
x(y;h) ≡ argminz∈RnCA,y(z;h) , (9.11)
CA,y(z;h) ≡ 1
2‖y−Az‖2
2 +
n∑i=1
h(zi) ,
where we assumed for simplicity that CA,y(z;h) has a unique minimum.According to the above discussion, the estimator x(y;h) can be thought of as the
β → ∞ limit of the general estimator (9.10). Indeed, it is easy to check that, providedxi $→ h(xi) is upper semicontinuous, we have
limβ→∞
xβ(y;pβ,h) = x(y;h) .
In other words, the posterior mean converges to the mode of the posterior in this limit.Further, x(y;h) takes the familiar form of a regression estimator with separable regu-larization. If h( ·) is convex, the computation of x is tractable. Important special casesinclude h(xi) = λx2
i , which corresponds to ridge regression [39], and h(xi) = λ|xi|which corresponds to the LASSO [77] or basis pursuit denoising (BPDN) [10]. Due tothe special role it plays in compressed sensing, we will devote special attention to thelatter case, that we rewrite explicitly below with a slight abuse of notation
x(y) ≡ argminz∈RnCA,y(z) , (9.12)
CA,y(z) ≡ 1
2‖y−Az‖2
2 +λ‖z‖1 .
9.3 Revisiting the scalar case
Before proceeding further, it is convenient to pause for a moment and consider the specialcase of a single measurement of a scalar quantity, i.e. the case m = n = 1. We thereforehave
y = x+w, (9.13)
and want to estimate x from y. Despite the apparent simplicity, there exists a copiousliterature on this problem with many open problems [24, 23, 22, 41]. Here we only wantto clarify a few points that will come up again in what follows.

400 Andrea Montanari
In order to compare various estimators we will assume that (x,y) are indeed randomvariables with some underlying probability distribution p0(dx,dy) = p0(dx)p0(dy|x).It is important to stress that this distribution is conceptually distinct from the one usedin inference, cf. Eq. (9.10). In particular we cannot assume to know the actual priordistribution of x, at least not exactly, and hence p(dx) and p0(dx) do not coincide. The“actual” prior p0 is the distribution of the vector to be inferred, while the “postulated”prior p is a device used for designing inference algorithms.
For the sake of simplicity we also consider Gaussian noise w ∼ N(0,σ2) with knownnoise level σ2. Various estimators will be compared with respect to the resulting meansquare error
MSE = E|x(y)−x|2 =
∫R×R
|x(y)−x|2 p0(dx,dy) .
We can distinguish two cases:
I. The signal distribution p0(x) is known as well. This can be regarded as an “oracle”setting. To make contact with compressed sensing, we consider distributions thatgenerate sparse signals, i.e. that put mass at least 1−ε on x=0. In formulae p0(0)≥1− ε.
II. The signal distribution is unknown but it is known that it is “sparse,” namely that itbelongs to the class
Fε ≡
p0 : p0(0) ≥ 1− ε
. (9.14)
The minimum mean square error, is the minimum MSE achievable by any estimatorx : R → R:
MMSE(σ2;p0) = infx:R→R
E|x(y)−x|2 .
It is well known that the infimum is achieved by the conditional expectation
x MMSE(y) =
∫R
x p0(dx|y) .
However, this estimator assumes that we are in situation I above, i.e. that the prior p0 isknown.
In Figure 9.2 we plot the resulting MSE for a three-point distribution,
p0 =ε
2δ+1 +(1− ε)δ0 +
ε
2δ−1 . (9.15)
The MMSE is non-decreasing in σ2 by construction, converges to 0 in the noiseless limitσ → 0 (indeed the simple rule x(y) = y achieves MSE equal to σ2) and to ε in the largenoise limit σ →∞ (MSE equal to ε is achieved by x = 0).
In the more realistic situation II, we do not know the prior p0. A principled way todeal with this ignorance would be to minimize the MSE for the worst case distribution
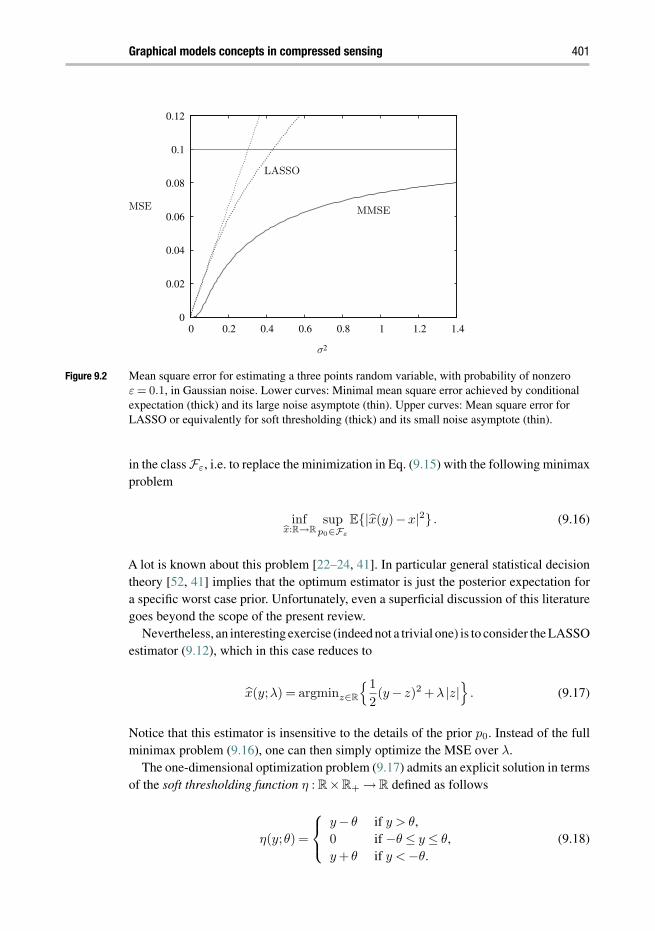
Graphical models concepts in compressed sensing 401
0
0.02
0.04
0.06
0.08
0.1
0.12
0 0.2 0.4 0.6 0.8 1 1.2 1.4
σ2
MSE
LASSO
MMSE
Figure 9.2 Mean square error for estimating a three points random variable, with probability of nonzeroε = 0.1, in Gaussian noise. Lower curves: Minimal mean square error achieved by conditionalexpectation (thick) and its large noise asymptote (thin). Upper curves: Mean square error forLASSO or equivalently for soft thresholding (thick) and its small noise asymptote (thin).
in the class Fε, i.e. to replace the minimization in Eq. (9.15) with the following minimaxproblem
infx:R→R
supp0∈Fε
E|x(y)−x|2 . (9.16)
A lot is known about this problem [22–24, 41]. In particular general statistical decisiontheory [52, 41] implies that the optimum estimator is just the posterior expectation fora specific worst case prior. Unfortunately, even a superficial discussion of this literaturegoes beyond the scope of the present review.
Nevertheless, an interesting exercise (indeed not a trivial one) is to consider the LASSOestimator (9.12), which in this case reduces to
x(y;λ) = argminz∈R
1
2(y− z)2 +λ |z|
. (9.17)
Notice that this estimator is insensitive to the details of the prior p0. Instead of the fullminimax problem (9.16), one can then simply optimize the MSE over λ.
The one-dimensional optimization problem (9.17) admits an explicit solution in termsof the soft thresholding function η : R×R+ → R defined as follows
η(y;θ) =
y− θ if y > θ,0 if −θ ≤ y ≤ θ,y + θ if y < −θ.
(9.18)
402 Andrea Montanari
The threshold value θ has to be chosen equal to the regularization parameter λ yieldingthe simple solution
x(y;λ) = η(y;θ) , for λ = θ . (9.19)
(We emphasize the identity of λ and θ in the scalar case, because it breaks down in thevector case.)
How should the parameter θ (or equivalently λ) be fixed? The rule is conceptuallysimple: θ should minimize the maximal mean square error for the class Fε. Remarkablythis complex saddle point problem can be solved rather explicitly. The key remark isthat the worst case distribution over the class Fε can be identified and takes the formp# = (ε/2)δ+∞ +(1− ε)δ0 +(ε/2)δ−∞ [23, 22, 41].
Let us outline how the solution follows from this key fact. First of all, it makessense to scale λ as the noise standard deviation, because the estimator is supposed tofilter out the noise. We then let θ = ασ. In Figure 9.2 we plot the resulting MSE whenθ = ασ, with α≈ 1.1402. We denote the LASSO/soft thresholding mean square error bymse(σ2;p0,α) when the noise variance is σ2, x ∼ p0, and the regularization parameteris λ = θ = ασ. The worst case mean square error is given by supp0∈Fε
mse(σ2;p0,α).Since the class Fε is invariant by rescaling, this worst case MSE must be proportionalto the only scale in the problem, i.e. σ2. We get
supp0∈Fε
mse(σ2;p0,α) = M(ε,α)σ2 . (9.20)
The function M can be computed explicitly by evaluating the mean square error onthe worst case distribution p# [23, 22, 41]. A straightforward calculation (see also [26,Supplementary Information], and [28]) yields
M(ε,α) = ε(1+α2)+ (1− ε)[2(1+α2)Φ(−α)− 2αφ(α)] (9.21)
where φ(z) = e−z2/2/√
2π is the Gaussian density and Φ(z) =∫ z
−∞ φ(u)du is theGaussian distribution. It is also not hard to show that M(ε,α) is the slope of the softthresholding MSE at σ2 = 0 in a plot like the one in Figure 9.2.
Minimizing the above expression over α, we obtain the soft thresholding minimaxrisk, and the corresponding optimal threshold value
M#(ε) ≡ minα∈R+
M(ε,α) , α#(ε) ≡ arg minα∈R+
M(ε,α) . (9.22)
The functions M#(ε) and α#(ε) are plotted in Figure 9.3. For comparison we alsoplot the analogous functions when the class Fε is replaced by Fε(a) = p0 ∈ Fε :∫
x2 p0(dx) ≤ a2 of sparse random variables with bounded second moment. Ofparticular interest is the behavior of these curves in the very sparse limit ε → 0,
α#(ε) =√
2log(1/ε)1+ o(1)
. (9.23)

Graphical models concepts in compressed sensing 403
0
0.2
0.4
0.6
0.8
1
0 0.2 0.4 0.6 0.8 1
0.5
1
1.5
2
0
1
2
3
4
5
0 0.2 0.4 0.6 0.8 1
0.5
11.5
ε ε
M#(ε ) α#(ε)
(a) (b)
Figure 9.3 (a) (Continuous line): minimax mean square error under soft thresholding for estimation ofε-sparse random variable in Gaussian noise. Dotted lines correspond to signals of boundedsecond moment (labels on the curves refer to the maximum allowed value of [
∫x2 p0(dx)]1/2).
(b) (Continuous line): optimal threshold level for the same estimation problem. Dotted linesagain refer to the case of bounded second moment.
–2
–1.5
–1
–0.5
0
0.5
1
1.5
2
–2 –1.5 –1 –0.5 0 0.5 1 1.5 2y
x(y)
Figure 9.4 Continuous line: The MMSE estimator for the three-point distribution (9.15) with ε = 0.1, whenthe noise has standard deviation σ = 0.3. Dotted line: the minimax soft threshold estimator forthe same setting. The corresponding mean square errors are plotted in Figure 9.2.
Getting back to Figure 9.2, the reader will notice that there is a significant gap betweenthe minimal MSE and the MSE achieved by soft thresholding. This is the price paid byusing an estimator that is uniformly good over the class Fε instead of one that is tailoredfor the distribution p0 at hand. Figure 9.4 compares the two estimators for σ = 0.3.One might wonder whether all this price has to be paid, i.e. whether we can reducethe gap by using a more complex function instead of the soft threshold η(y;θ). Theanswer is both yes and no. On one hand, there exist provably superior – in minimaxsense – estimators over Fε. Such estimators are of course more complex than simple

404 Andrea Montanari
soft thresholding. On the other hand, better estimators have the same minimax riskM#(ε) = (2log(1/ε))−1
1+o(1)
in the very sparse limit, i.e. they improve only the
o(1) term as ε → 0 [23, 22, 41].
9.4 Inference via message passing
The task of extending the theory of the previous section to the vector case (9.1) mightappear daunting. It turns out that such extension is instead possible in specific high-dimensional limits. The key step consists in introducing an appropriate message passingalgorithm to solve the optimization problem (9.12) and then analyzing its behavior.
9.4.1 The min-sum algorithm
We start by considering the min-sum algorithm. Min-sum is a popular optimizationalgorithm for graph-structured cost functions (see for instance [65, 42, 58, 61] andreferences therein). In order to introduce the algorithm, we consider a general costfunction over x = (x1, . . . ,xn), that decomposes according to a factor graph such as theone shown in Figure 9.1:
C(x) =∑a∈F
Ca(x∂a)+∑i∈V
Ci(xi) . (9.24)
Here F is the set of m factor nodes (squares in Figure 9.1) and V is the set of n
variable nodes (circles in the same figure). Further ∂a is the set of neighbors of nodea and x∂a = (xi : i ∈ ∂a). The min-sum algorithm is an iterative algorithm of thebelief-propagation type. Its basic variables are messages: a message is associated toeach directed edge in the underlying factor graph. In the present case, messages arefunctions on the optimization variables, and we will denote them as J t
i→a(xi) (fromvariable to factor), J t
a→i(xi) (from factor to variable), with t indicating the iteration
i j k
a b c
Ji→a
xi→a
Jc→k
rc→k
Figure 9.5 A portion of the factor graph from Figure 9.1 with notation for messages.

Graphical models concepts in compressed sensing 405
number. Figure 9.5 describes the association of messages to directed edges in the factorgraph. Messages are meaningful up to an additive constant, and therefore we will usethe special symbol ∼= to denote identity up to an additive constant independent of theargument xi. At the t-th iteration they are updated as follows1
J t+1i→a(xi) ∼= Ci(xi)+
∑b∈∂i\a
J tb→i(xi) , (9.25)
J ta→i(xi) ∼= min
x∂a\i
Ca(x∂a)+
∑j∈∂a\i
J tj→a(xj)
. (9.26)
Eventually, the optimum is approximated by
xt+1i = arg min
xi∈R
J t+1i (xi) , (9.27)
J t+1i (xi) ∼= Ci(xi)+
∑b∈∂i
J tb→i(xi). (9.28)
There exists a vast literature justifying the use of algorithms of this type, applying themon concrete problems, and developing modifications of the basic iteration with betterproperties [65, 42, 58, 61, 83, 44]. Here we limit ourselves to recalling that the iteration(9.25), (9.26) can be regarded as a dynamic programming iteration that computes theminimum cost when the underlying graph is a tree. Its application to loopy graphs (i.e.graphs with closed loops) is not generally guaranteed to converge.
At this point we notice that the LASSO cost function Eq. (9.12) can be decomposedas in Eq. (9.24),
CA,y(x) ≡ 1
2
∑a∈F
(ya −ATa x)2 +λ
∑i∈V
|xi| . (9.29)
The min-sum updates read
J t+1i→a(xi) ∼= λ|xi|+
∑b∈∂i\a
J tb→i(xi) , (9.30)
J ta→i(xi) ∼= min
x∂a\i
1
2(ya −AT
a x)2 +∑
j∈∂a\i
J tj→a(xj)
. (9.31)
9.4.2 Simplifying min-sum by quadratic approximation
Unfortunately, an exact implementation of the min-sum iteration appears extremelydifficult because it requires to keep track of 2mn messages, each being a function on the
1 The reader will notice that for a dense matrix A, ∂i = [n] and ∂a = [m]. We will nevertheless stick to themore general notation, since it is somewhat more transparent.
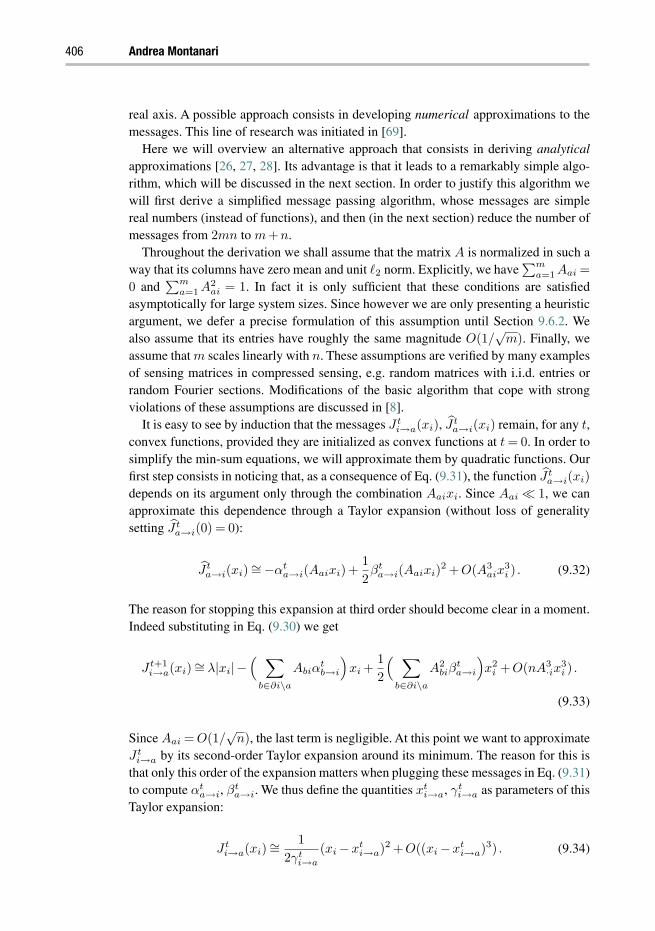
406 Andrea Montanari
real axis. A possible approach consists in developing numerical approximations to themessages. This line of research was initiated in [69].
Here we will overview an alternative approach that consists in deriving analyticalapproximations [26, 27, 28]. Its advantage is that it leads to a remarkably simple algo-rithm, which will be discussed in the next section. In order to justify this algorithm wewill first derive a simplified message passing algorithm, whose messages are simplereal numbers (instead of functions), and then (in the next section) reduce the number ofmessages from 2mn to m+n.
Throughout the derivation we shall assume that the matrix A is normalized in such away that its columns have zero mean and unit 2 norm. Explicitly, we have
∑ma=1 Aai =
0 and∑m
a=1 A2ai = 1. In fact it is only sufficient that these conditions are satisfied
asymptotically for large system sizes. Since however we are only presenting a heuristicargument, we defer a precise formulation of this assumption until Section 9.6.2. Wealso assume that its entries have roughly the same magnitude O(1/
√m). Finally, we
assume that m scales linearly with n. These assumptions are verified by many examplesof sensing matrices in compressed sensing, e.g. random matrices with i.i.d. entries orrandom Fourier sections. Modifications of the basic algorithm that cope with strongviolations of these assumptions are discussed in [8].
It is easy to see by induction that the messages J ti→a(xi), J t
a→i(xi) remain, for any t,convex functions, provided they are initialized as convex functions at t = 0. In order tosimplify the min-sum equations, we will approximate them by quadratic functions. Ourfirst step consists in noticing that, as a consequence of Eq. (9.31), the function J t
a→i(xi)
depends on its argument only through the combination Aaixi. Since Aai 1, we canapproximate this dependence through a Taylor expansion (without loss of generalitysetting J t
a→i(0) = 0):
J ta→i(xi) ∼= −αt
a→i(Aaixi)+1
2βt
a→i(Aaixi)2 +O(A3
aix3i ) . (9.32)
The reason for stopping this expansion at third order should become clear in a moment.Indeed substituting in Eq. (9.30) we get
J t+1i→a(xi) ∼= λ|xi|−
( ∑b∈∂i\a
Abiαtb→i
)xi +
1
2
( ∑b∈∂i\a
A2biβ
ta→i
)x2
i +O(nA3·ix
3i ) .
(9.33)
Since Aai = O(1/√
n), the last term is negligible. At this point we want to approximateJ t
i→a by its second-order Taylor expansion around its minimum. The reason for this isthat only this order of the expansion matters when plugging these messages in Eq. (9.31)to compute αt
a→i, βta→i. We thus define the quantities xt
i→a, γti→a as parameters of this
Taylor expansion:
J ti→a(xi) ∼=
1
2γti→a
(xi −xti→a)2 +O((xi −xt
i→a)3) . (9.34)

Graphical models concepts in compressed sensing 407
Here we include also the case in which the minimum of J ti→a(xi) is achieved at xi = 0
(and hence the function is not differentiable at its minimum) by letting γti→a = 0 in
that case. Comparing Eqs. (9.33) and (9.34), and recalling the definition of η( · ; ·), cf.Eq. (9.18), we get
xt+1i→a = η(a1;a2) , γt+1
i→a = η′(a1;a2) , (9.35)
where η′( · ; ·) denotes the derivative of η with respect to its first argument and we defined
a1 ≡∑
b∈∂i\a Abiαtb→i∑
b∈∂i\a A2biβ
tb→i
, a2 ≡ λ∑b∈∂i\a A2
biβtb→i
. (9.36)
Finally, by plugging the parameterization (9.34) in Eq. (9.31) and comparing withEq. (9.32), we can compute the parameters αt
a→i, βta→i. A long but straightforward
calculation yields
αta→i =
1
1+∑
j∈∂a\i A2ajγ
tj→a
ya −
∑j∈∂a\i
Aajxtj→a
, (9.37)
βta→i =
1
1+∑
j∈∂a\i A2ajγ
tj→a
. (9.38)
Equations (9.35) to (9.38) define a message passing algorithm that is considerablysimpler than the original min-sum algorithm: each message consists of a pair of realnumbers, namely (xt
i→a,γti→a) for variable-to-factor messages and (αa→i,βa→i) for
factor-to-variable messages. In the next section we will simplify it further and constructan algorithm (AMP) with several interesting properties. Let us pause a moment to maketwo observations:
1. The soft-thresholding operator that played an important role in the scalar case, cf.Eq. (9.3), reappeared in Eq. (9.35). Notice however that the threshold value thatfollows as a consequence of our derivation is not the naive one, namely equal to theregularization parameter λ, but rather a rescaled one.
2. Our derivation leveraged on the assumption that the matrix entries Aai are all of thesame order, namely O(1/
√m). It would be interesting to repeat the above derivation
under different assumptions on the sensing matrix.
9.5 Approximate message passing
The algorithm derived above is still complex in that its memory requirements scaleproportionally to the product of the number of dimensions of the signal and the numberof measurements. Further, its computational complexity per iteration scales quadraticallyas well. In this section we will introduce a simpler algorithm, and subsequently discussits derivation from the one in the previous section.
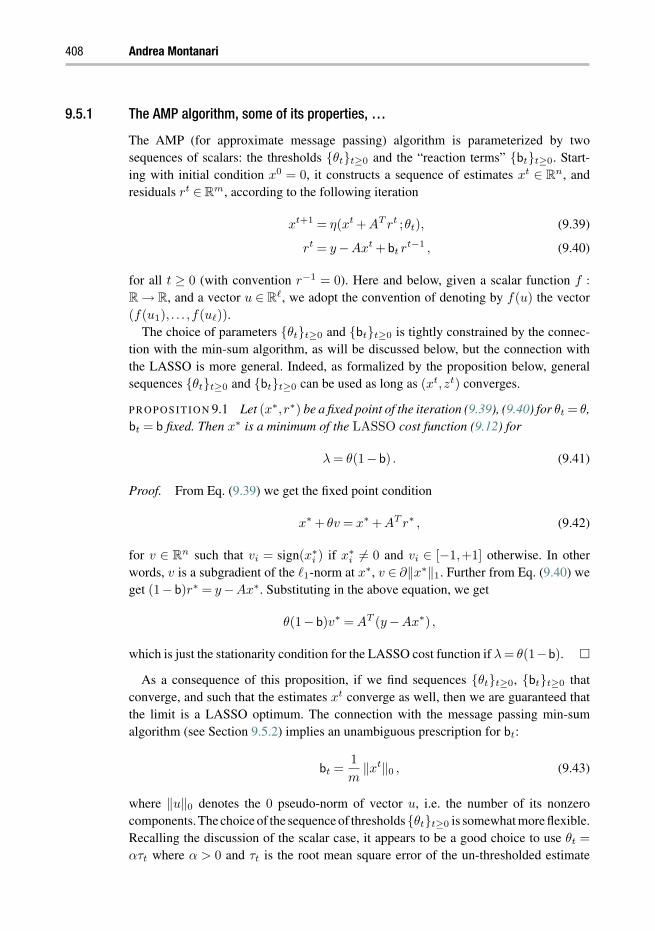
408 Andrea Montanari
9.5.1 The AMP algorithm, some of its properties, …
The AMP (for approximate message passing) algorithm is parameterized by twosequences of scalars: the thresholds θtt≥0 and the “reaction terms” btt≥0. Start-ing with initial condition x0 = 0, it constructs a sequence of estimates xt ∈ Rn, andresiduals rt ∈ Rm, according to the following iteration
xt+1 = η(xt +AT rt ;θt), (9.39)
rt = y−Axt +bt rt−1 , (9.40)
for all t ≥ 0 (with convention r−1 = 0). Here and below, given a scalar function f :
R → R, and a vector u ∈ R, we adopt the convention of denoting by f(u) the vector(f(u1), . . . ,f(u)).
The choice of parameters θtt≥0 and btt≥0 is tightly constrained by the connec-tion with the min-sum algorithm, as will be discussed below, but the connection withthe LASSO is more general. Indeed, as formalized by the proposition below, generalsequences θtt≥0 and btt≥0 can be used as long as (xt,zt) converges.
proposition 9.1 Let (x∗, r∗) be a fixed point of the iteration (9.39), (9.40) for θt = θ,bt = b fixed. Then x∗ is a minimum of the LASSO cost function (9.12) for
λ = θ(1−b) . (9.41)
Proof. From Eq. (9.39) we get the fixed point condition
x∗ + θv = x∗ +AT r∗ , (9.42)
for v ∈ Rn such that vi = sign(x∗i ) if x∗
i = 0 and vi ∈ [−1,+1] otherwise. In otherwords, v is a subgradient of the 1-norm at x∗, v ∈ ∂‖x∗‖1. Further from Eq. (9.40) weget (1−b)r∗ = y−Ax∗. Substituting in the above equation, we get
θ(1−b)v∗ = AT (y−Ax∗) ,
which is just the stationarity condition for the LASSO cost function if λ = θ(1−b).
As a consequence of this proposition, if we find sequences θtt≥0, btt≥0 thatconverge, and such that the estimates xt converge as well, then we are guaranteed thatthe limit is a LASSO optimum. The connection with the message passing min-sumalgorithm (see Section 9.5.2) implies an unambiguous prescription for bt:
bt =1
m‖xt‖0 , (9.43)
where ‖u‖0 denotes the 0 pseudo-norm of vector u, i.e. the number of its nonzerocomponents.The choice of the sequence of thresholdsθtt≥0 is somewhat more flexible.Recalling the discussion of the scalar case, it appears to be a good choice to use θt =
ατt where α > 0 and τt is the root mean square error of the un-thresholded estimate

Graphical models concepts in compressed sensing 409
(xt + AT rt). It can be shown that the latter is (in a high-dimensional setting) wellapproximated by (‖rt‖2
2/m)1/2. We thus obtain the prescription
θt = ατt , τ2t =
1
m‖rt‖2
2 . (9.44)
Alternative estimators can be used instead of τt as defined above. For instance, themedian of |rt
i |i∈[m], can be used to define the alternative estimator:
τ2t =
1
Φ−1(3/4)|rt|(m/2) , (9.45)
where |u|() is the th largest magnitude among the entries of a vector u, and Φ−1(3/4)≈0.6745 denotes the median of the absolute values of a Gaussian random variable.
By Proposition 9.1, if the iteration converges to (x, r), then this is a minimum of theLASSO cost function, with regularization parameter
λ = α‖r‖2√
m
(1− ‖x‖0
m
)(9.46)
(in case the threshold is chosen as per Eq. (9.44)). While the relation between α and λ isnot fully explicit (it requires to find the optimum x), in practice α is as useful as λ: bothplay the role of knobs that adjust the level of sparsity of the solution we are seeking.
We conclude by noting that the AMP algorithm (9.39), (9.40) is quite close to iterativesoft thresholding (IST), a well-known algorithm for the same problem that proceeds by
xt+1 = η(xt +AT rt ;θt) , (9.47)
rt = y−Axt . (9.48)
The only (but important) difference lies in the introduction of the term btrt−1 in the
second equation, cf. Eq. (9.40). This can be regarded as a momentum term with a veryspecific prescription on its size, cf. Eq. (9.43). A similar term – with motivations analo-gous to the one presented below – is popular under the name of ‘Onsager term’ instatistical physics [64, 76, 60].
9.5.2 … and its derivation
In this section we present a heuristic derivation of theAMP iteration in Eqs. (9.39), (9.40)starting from the standard message passing formulation given by Eqs. (9.35) to (9.38).Our objective is to develop an intuitive understanding of the AMP iteration, as well asof the prescription (9.43). Throughout our argument, we treat m as scaling linearly withn. A full justification of the derivation presented here is beyond the scope of this review:the actual rigorous analysis of the AMP algorithm goes through an indirect and verytechnical mathematical proof [9].
We start by noticing that the sums∑
j∈∂a\i A2ajγ
tj→a and
∑b∈∂i\a A2
biβtb→i are sums
of Θ(n) terms, each of order 1/n (because A2ai = O(1/n)). Notice that the terms in these
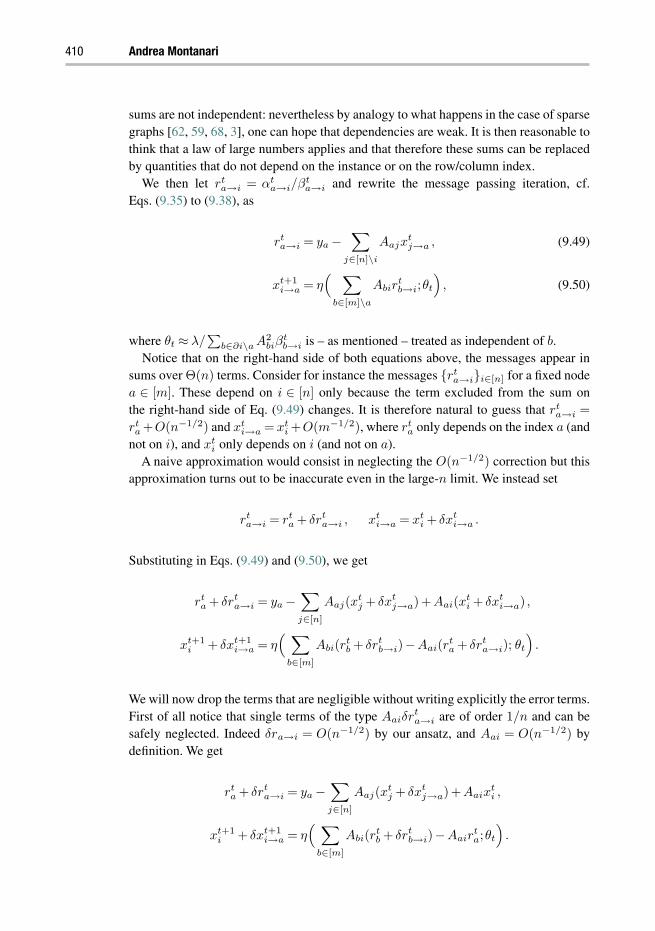
410 Andrea Montanari
sums are not independent: nevertheless by analogy to what happens in the case of sparsegraphs [62, 59, 68, 3], one can hope that dependencies are weak. It is then reasonable tothink that a law of large numbers applies and that therefore these sums can be replacedby quantities that do not depend on the instance or on the row/column index.
We then let rta→i = αt
a→i/βta→i and rewrite the message passing iteration, cf.
Eqs. (9.35) to (9.38), as
rta→i = ya −
∑j∈[n]\i
Aajxtj→a , (9.49)
xt+1i→a = η
( ∑b∈[m]\a
Abirtb→i;θt
), (9.50)
where θt ≈ λ/∑
b∈∂i\a A2biβ
tb→i is – as mentioned – treated as independent of b.
Notice that on the right-hand side of both equations above, the messages appear insums over Θ(n) terms. Consider for instance the messages rt
a→ii∈[n] for a fixed nodea ∈ [m]. These depend on i ∈ [n] only because the term excluded from the sum onthe right-hand side of Eq. (9.49) changes. It is therefore natural to guess that rt
a→i =
rta +O(n−1/2) and xt
i→a = xti +O(m−1/2), where rt
a only depends on the index a (andnot on i), and xt
i only depends on i (and not on a).A naive approximation would consist in neglecting the O(n−1/2) correction but this
approximation turns out to be inaccurate even in the large-n limit. We instead set
rta→i = rt
a + δrta→i , xt
i→a = xti + δxt
i→a .
Substituting in Eqs. (9.49) and (9.50), we get
rta + δrt
a→i = ya −∑j∈[n]
Aaj(xtj + δxt
j→a)+Aai(xti + δxt
i→a) ,
xt+1i + δxt+1
i→a = η( ∑
b∈[m]
Abi(rtb + δrt
b→i)−Aai(rta + δrt
a→i); θt
).
We will now drop the terms that are negligible without writing explicitly the error terms.First of all notice that single terms of the type Aaiδr
ta→i are of order 1/n and can be
safely neglected. Indeed δra→i = O(n−1/2) by our ansatz, and Aai = O(n−1/2) bydefinition. We get
rta + δrt
a→i = ya −∑j∈[n]
Aaj(xtj + δxt
j→a)+Aaixti ,
xt+1i + δxt+1
i→a = η( ∑
b∈[m]
Abi(rtb + δrt
b→i)−Aairta;θt
).

Graphical models concepts in compressed sensing 411
We next expand the second equation to linear order in δxti→a and δrt
a→i:
rta + δrt
a→i = ya −∑j∈[n]
Aaj(xtj + δxt
j→a)+Aaixti ,
xt+1i + δxt+1
i→a = η( ∑
b∈[m]
Abi(rtb + δrt
b→i);θt
)− η′
( ∑b∈[m]
Abi(rtb + δrt
b→i);θt
)Aair
ta .
The careful reader might be puzzled by the fact that the soft thresholding functionu $→ η(u;θ) is non-differentiable at u∈+θ,−θ. However, the rigorous analysis carriedout in [9] through a different (and more technical) method reveals that almost-everywheredifferentiability is sufficient here.
Notice that the last term on the right-hand side of the first equation above is the onlyone dependent on i, and we can therefore identify this term with δrt
a→i. We obtain thedecomposition
rta = ya −
∑j∈[n]
Aaj(xtj + δxt
j→a) , (9.51)
δrta→i = Aaix
ti . (9.52)
Analogously for the second equation we get
xt+1i = η
( ∑b∈[m]
Abi(rtb + δrt
b→i);θt
), (9.53)
δxt+1i→a = −η′
( ∑b∈[m]
Abi(rtb + δrt
b→i);θt
)Aair
ta . (9.54)
Substituting Eq. (9.52) in Eq. (9.53) to eliminate δrtb→i we get
xt+1i = η
( ∑b∈[m]
Abirtb +
∑b∈[m]
A2bix
ti;θt
), (9.55)
and using the normalization of A, we get∑
b∈[m] A2bi → 1, whence
xt+1 = η(xt +AT rt;θt) . (9.56)
Analogously substituting Eq. (9.54) in (9.51), we get
zta = ya −
∑j∈[n]
Aajxtj +
∑j∈[n]
A2ajη
′(xt−1j +(AT rt−1)j ;θt−1)r
t−1a . (9.57)
Again, using the law of large numbers and the normalization of A, we get∑j∈[n]
A2ajη
′(xt−1j +(AT rt−1)j ;θt−1) ≈
1
m
∑j∈[n]
η′(xt−1j +(AT rt−1)j ;θt−1) =
1
m‖xt‖0,
(9.58)

412 Andrea Montanari
whence substituting in (9.57), we obtain Eq. (9.40), with the prescription (9.43) for theOnsager term. This finishes our derivation.
9.6 High-dimensional analysis
The AMP algorithm enjoys several unique properties. In particular it admits an asymp-totically exact analysis along sequences of instances of diverging size. This is quiteremarkable, since all analyses available for other algorithms that solve the LASSO holdonly “up to undetermined constants.”
In particular in the large system limit (and with the exception of a “phase transition”line), AMP can be shown to converge exponentially fast to the LASSO optimum. Hencethe analysis of AMP yields asymptotically exact predictions on the behavior of theLASSO, including in particular the asymptotic mean square error per variable.
9.6.1 Some numerical experiments with AMP
How is it possible that an asymptotically exact analysis of AMP can be carried out?Figure 9.6 illustrates the key point. It shows the distribution of un-thresholded estimates(xt + AT rt)i for coordinates i such that the original signal had value xi = +1. Theseestimates were obtained using the AMP algorithm (9.39), (9.40) with choice (9.43) of bt
(a) and the iterative soft thresholding algorithm (9.47), (9.48) (b). The same instances(i.e. the same matrices A and measurement vectors y) were used in the two cases, but theresulting distributions are dramatically different. In the case of AMP, the distribution is
0
0.2
0.4
0.6
0.8
1
1.2
(a) (b)
–1 –0.5 0 0.5 1 1.5 2 2.5 3 0
0.2
0.4
0.6
0.8
1
1.2
–1 –0.5 0 0.5 1 1.5 2 2.5 3
(xt + AT rt)i(xt + AT rt)i
Figure 9.6 Distributions of un-thresholded estimates for AMP (a) and IST (b), after t = 10 iterations. Thesedata were obtained using sensing matrices with m = 2000, n = 4000 and i.i.d. entries uniform in+1/
√m,−1/
√m. The signal x contained 500 nonzero entries uniform in +1,−1. A total
of 40 instances was used to build the histograms. Dotted lines are Gaussian fits and vertical linesrepresent the fitted mean.

Graphical models concepts in compressed sensing 413
close to Gaussian, with mean on the correct value, xi =+1. For iterative soft thresholdingthe estimates do not have the correct mean and are not Gaussian.
This phenomenon appears here as an empirical observation, valid for a specific iter-ation number t, and specific dimensions m,n. In the next section we will explain thatit can be proved rigorously in the limit of a large number of dimensions, for all valuesof iteration number t. Namely, as m,n → ∞ at t fixed, the empirical distribution of(xt +AT rt)i −xii∈[n] converges to a Gaussian distribution, when xt and rt are com-puted using AMP. The variance of this distribution depends on t, and its evolution witht can be computed exactly. Vice versa, for iterative soft thresholding, the distribution ofthe same quantities remains non-gaussian.
This dramatic difference remains true for any t, even when AMP and IST converge tothe same minimum. Indeed even at the fixed point, the resulting residual rt is differentin the two algorithms, as a consequence of the introduction of the Onsager term.
More importantly, the two algorithms differ dramatically in the rate of convergence.One can interpret the vector (xt +AT rt)−x as “effective noise” after t iterations. BothAMP and IST “denoise” the vector (xt + AT rt) using the soft thresholding operator.As discussed in Section 9.3, the soft thresholding operator is essentially optimal fordenoising in Gaussian noise. This suggests that AMP should have superior performances(in the sense of faster convergence to the LASSO minimum) with respect to simple IST.
Figure 9.7 presents the results of a small experiment confirming this expectation. Mea-surement matrices A with dimensions m = 1600, n = 8000, were generated randomlywith i.i.d. entries Aai ∈ +1/
√m,−1/
√m uniformly at random. We consider here
the problem of reconstructing a signal x with entries xi ∈ +1,0,−1 from noiselessmeasurements y = Ax, for different levels of sparsity. Thresholds were set according to
0
0.01
0.02
0.03
0.04
0 20 40 60
(a) (b)
80 100 0
0.01
0.02
0.03
0.04
0 200 400 600 800 1000
Iterations Iterations
MSE MSE
Figure 9.7 Evolution of the mean square error as a function of the number of iterations for AMP (a) anditerative soft thresholding (b), for random measurement matrices A, with i.i.d. entriesAai ∈ +1/
√m,−1/
√m uniformly. Notice the different scales used for the horizontal axis!
Here n = 8000, m = 1600. Different curves depend on different levels of sparsity. The numberof nonzero entries of the signal x is, for the various curves, ‖x‖0 = 160, 240, 320, 360 (frombottom to top).

414 Andrea Montanari
the prescription (9.44) with α = 1.41 for AMP (the asymptotic theory of [26] yields theprescription α ≈ 1.40814) and α = 1.8 for IST (optimized empirically). For the latteralgorithm, the matrix A was rescaled in order to get an operator norm ‖A‖2 = 0.95.
Convergence to the original signal x is slower and slower as this becomes less andless sparse.2 Overall, AMP appears to be at least 10 times faster even on the sparsestvectors (lowest curves in the figure).
9.6.2 State evolution
State evolution describes the asymptotic limit of theAMPestimates as m,n→∞, for anyfixed t. The word “evolution” refers to the fact that one obtains an “effective” evolutionwith t. The word “state” refers to the fact that the algorithm behavior is captured in thislimit by a single parameter (a state) τt ∈ R.
We will consider sequences of instances of increasing sizes, along which the AMPalgorithm behavior admits a nontrivial limit.An instance is completely determined by themeasurement matrix A, the signal x, and the noise vector w, the vector of measurementsy being given by y = Ax + w, cf. Eq. (9.1). While rigorous results have been provedso far only in the case in which the sensing matrices A have i.i.d. Gaussian entries, it isnevertheless useful to collect a few basic properties that the sequence needs to satisfy inorder for state evolution to hold.
definition 9.1 The sequence of instances x(n),w(n),A(n)n∈N indexed by n issaid to be a converging sequence if x(n) ∈ Rn, w(n) ∈ Rm, A(n) ∈ Rm×n with m =
m(n) is such that m/n → δ ∈ (0,∞), and in addition the following conditions hold:
(a) The empirical distribution of the entries of x(n) converges weakly to a probabil-ity measure p0 on R with bounded second moment. Further n−1∑n
i=1 xi(n)2 →Ep0X2
0.(b) The empirical distribution of the entries of w(n) converges weakly to a probability
measure pW on R with bounded second moment. Further m−1∑mi=1 wi(n)2 →
EpWW 2 ≡ σ2.
(c) If ei1≤i≤n, ei ∈ Rn denotes the canonical basis, then limn→∞ maxi∈[n] ‖A(n)
ei‖2 = 1 and limn→∞ mini∈[n] ‖A(n)ei‖2 = 1.
As mentioned above, rigorous results have been proved only for a subclass of con-verging sequences, namely under the assumption that the matrices A(n) have i.i.d.Gaussian entries. Notice that such matrices satisfy condition (c) by elementary tailbounds on χ-square random variables. The same condition is satisfied by matrices withi.i.d. sub-gaussian entries thanks to concentration inequalities [53].
On the other hand, numerical simulations show that the same limit behavior shouldapply within a much broader domain, including for instance random matrices with i.i.d.entries under an appropriate moment condition. This universality phenomenon is well-known in random matrix theory whereby asymptotic results initially established for
2 Indeed basis pursuit (i.e. reconstruction via 1 minimization) fails with high probability if‖x‖0/m 0.243574, see [29] and Section 9.6.6.

Graphical models concepts in compressed sensing 415
Gaussian matrices were subsequently proved for broader classes of matrices. Rigorousevidence in this direction is presented in [46]. This paper shows that the normalizedcost minx∈Rn CA(n),y(n)(x)/n has a limit for n→∞, which is universal with respect torandom matrices A with i.i.d. entries. (More precisely, it is universal provided EAij=
0, EA2ij = 1/m and EA6
ij ≤ C/m3 for some n-independent constant C.)For a converging sequence of instances x(n),w(n),A(n)n∈N, and an arbitrary
sequence of thresholds θtt≥0 (independent of n), the AMP iteration (9.39), (9.40)admits a high-dimensional limit which can be characterized exactly, provided Eq. (9.43)is used for fixing the Onsager term. This limit is given in terms of the trajectory of asimple one-dimensional iteration termed state evolution which we will describe next.
Define the sequence τ2t t≥0 by setting τ2
0 = σ2 +EX20/δ (for X0 ∼ p0 and σ2 ≡
EW 2, W ∼ pW ) and letting, for all t ≥ 0:
τ2t+1 = F(τ2
t ,θt) , (9.59)
F(τ2,θ) ≡ σ2 +1
δE [η(X0 + τZ;θ)−X0]
2 , (9.60)
where Z ∼ N(0,1) is independent of X0 ∼ p0. Notice that the function F dependsimplicitly on the law p0. Further, the state evolution τ2
t t≥0 depends on the specificconverging sequence through the law p0, and the second moment of the noise EpW
W 2,cf. Definition 9.1.
We say a function ψ : Rk →R is pseudo-Lipschitz if there exists a constant L > 0 suchthat for all x,y ∈ Rk: |ψ(x)−ψ(y)| ≤ L(1+ ‖x‖2 + ‖y‖2)‖x− y‖2. (This is a specialcase of the definition used in [9] where such a function is called pseudo-Lipschitz oforder 2.)
The following theorem was conjectured in [26], and proved in [9]. It shows that thebehavior of AMP can be tracked by the above state evolution recursion.
theorem 9.1 ([9]) Let x(n),w(n),A(n)n∈N be a converging sequence of instanceswith the entries of A(n) i.i.d. normal with mean 0 and variance 1/m, while the signalsx(n) and noise vectors w(n) satisfy the hypotheses of Definition 9.1. Let ψ1 : R → R,ψ2 : R × R → R be pseudo-Lipschitz functions. Finally, let xtt≥0, rtt≥0 be thesequences of estimates and residuals produced by AMP, cf. Eqs. (9.39), (9.40). Then,almost surely
limn→∞
1
m
m∑a=1
ψ1(rta
)= E
ψ1(τtZ
), (9.61)
limn→∞
1
n
n∑i=1
ψ2(xt+1
i ,xi
)= E
ψ2(η(X0 + τtZ;θt),X0
), (9.62)
where Z ∼ N(0,1) is independent of X0 ∼ p0.
It is worth pausing for a few remarks.

416 Andrea Montanari
remark 9.1 Theorem 9.1 holds for any choice of the sequence of thresholds θtt≥0.It does not require – for instance – that the latter converge. Indeed [9] proves a moregeneral result that holds for a broad class of approximate message passing algorithms.The more general theorem establishes the validity of state evolution in this broad context.
For instance, the soft thresholding functions η( · ;θt) can be replaced by a genericsequence of Lipschitz continuous functions, provided the coefficients bt in Eq. (9.40)are suitably modified.
remark 9.2 This theorem does not require the vectors x(n) to be sparse. The use ofother functions instead of the soft thresholding functions η( · ;θt) in the algorithm canbe useful for estimating such non-sparse vectors.
Alternative nonlinearities, can also be useful when additional information on theentries of x(n) is available.
remark 9.3 While the theorem requires the matrices A(n) to be random, neither thesignal x(n) nor the noise vectors w(n) need to be random. They are generic deterministicsequences of vectors under the conditions of Definition 9.1.
The fundamental reason for this universality is that the matrix A is both row andcolumn exchangeable. Row exchangeability guarantees universality with respect to thesignals x(n), while column exchangeability guarantees universality with respect to thenoise w(n). To see why, observe that, by row exchangeability (for instance), x(n) canbe replaced by the random vector obtained by randomly permuting its entries. Now, thedistribution of such a random vector is very close (in appropriate sense) to the one of arandom vector with i.i.d. entries whose distribution matches the empirical distributionof x(n).
Theorem 9.1 strongly supports both the use of soft thresholding, and the choice of thethreshold level in Eq. (9.44) or (9.45). Indeed Eq. (9.61) states that the components of rt
are approximately i.i.d. N(0, τ2t ), and hence both definitions of τt in Eq. (9.44) or (9.45)
provide consistent estimators of τt. Further, Eq. (9.61) implies that the components ofthe deviation (xt +AT rt −x) are also approximately i.i.d. N(0, τ2
t ). In other words, theestimate (xt +AT rt) is equal to the actual signal plus noise of variance τ2
t , as illustratedin Figure 9.6. According to our discussion of scalar estimation in Section 9.3, the correctway of reducing the noise is to apply soft thresholding with threshold level ατt.
The choice θt = ατt with α fixed has another important advantage. In this case, thesequence τtt≥0 is determined by the one-dimensional recursion
τ2t+1 = F(τ2
t ,ατt) . (9.63)
The function τ2 $→ F(τ2,ατ) depends on the distribution of X0 as well as on the otherparameters of the problem. An example is plotted in Figure 9.8. It turns out that thebehavior shown here is generic: the function is always non-decreasing and concave.This remark allows one to easily prove the following.

Graphical models concepts in compressed sensing 417
0 0.2 0.4 0.6 0.8 10
0.1
0.2
0.3
0.4
0.5
0.6
0.7
0.8
0.9
1
τ*2
τ 2
F(τ
2 ,ατ)
α=2
Figure 9.8 Mapping τ2 → F(τ2,ατ) for α = 2, δ = 0.64, σ2 = 0.2, p0(+1) = p0(−1) = 0.064 andp0(0) = 0.872.
proposition 9.2 (28) Let αmin = αmin(δ) be the unique non-negative solution ofthe equation
(1+α2)Φ(−α)−αφ(α) =δ
2, (9.64)
with φ(z) ≡ e−z2/2/√
2π the standard Gaussian density and Φ(z) ≡∫ z
−∞ φ(x)dx.For any σ2 > 0, α > αmin(δ), the fixed point equation τ2 = F(τ2,ατ) admits a unique
solution. Denoting by τ∗ = τ∗(α) this solution, we have limt→∞ τt = τ∗(α).
It can also be shown that, under the choice θt = ατt, convergence is exponentiallyfast unless the problem parameters take some “exceptional” values (namely on the phasetransition boundary discussed below).
9.6.3 The risk of the LASSO
State evolution provides a scaling limit of the AMP dynamics in the high-dimensionalsetting. By showing that AMP converges to the LASSO estimator, one can transfer thisinformation to a scaling limit result of the LASSO estimator itself.
Before stating the limit, we have to describe a calibration mapping between theAMP parameter α (that defines the sequence of thresholds θtt≥0) and the LASSOregularization parameter λ. The connection was first introduced in [28].

418 Andrea Montanari
We define the function α $→ λ(α) on (αmin(δ),∞), by
λ(α) ≡ ατ∗
[1− 1
δP|X0 + τ∗Z| ≥ ατ∗
], (9.65)
where τ∗ = τ∗(α) is the state evolution fixed point defined as per Proposition 9.2. Noticethat this relation corresponds to the scaling limit of the general relation (9.41), pro-vided we assume that the solution of the LASSO optimization problem (9.12) is indeeddescribed by the fixed point of state evolution (equivalently, by its t → ∞ limit). Thisfollows by noting that θt → ατ∗ and that ‖x‖0/n → Eη′(X0 + τ∗Z;ατ∗). While thisis just an interpretation of the definition (9.65), the result presented next implies that theinterpretation is indeed correct.
In the following we will need to invert the function α $→ λ(α). We thus define α :
(0,∞) → (αmin,∞) in such a way that
α(λ) ∈
a ∈ (αmin,∞) : λ(a) = λ
.
The fact that the right-hand side is non-empty, and therefore the function λ $→ α(λ) iswell defined, is part of the main result of this section.
theorem 9.2 Let x(n),w(n),A(n)n∈N be a converging sequence of instances withthe entries of A(n) i.i.d. normal with mean 0 and variance 1/m. Denote by x(λ) theLASSO estimator for instance (x(n),w(n),A(n)), with σ2,λ> 0, and let ψ :R×R→Rbe a pseudo-Lipschitz function. Then, almost surely
limn→∞
1
n
n∑i=1
ψ(xi,xi
)= E
ψ(η(X0 + τ∗Z;θ∗),X0
), (9.66)
where Z ∼ N(0,1) is independent of X0 ∼ p0, τ∗ = τ∗(α(λ)) and θ∗ = α(λ)τ∗(α(λ)).Further, the function λ $→ α(λ) is well defined and unique on (0,∞).
The assumption of a converging problem sequence is important for the result to hold,while the hypothesis of Gaussian measurement matrices A(n) is necessary for the prooftechnique to be applicable. On the other hand, the restrictionsλ,σ2 > 0, and PX0 =0>
0 (whence τ∗ = 0 using Eq. (9.65)) are made in order to avoid technical complicationsdue to degenerate cases. Such cases can be resolved by continuity arguments.
Let us emphasize that some of the remarks made in the case of state evolution, cf.Theorem 9.1, hold for the last theorem as well. More precisely:
remark 9.4 Theorem 9.2 does not require either the signal x(n) or the noise vec-tors w(n) to be random. They are generic deterministic sequences of vectors under theconditions of Definition 9.1.
In particular, it does not require the vectors x(n) to be sparse. Lack of sparsity willreflect in a large risk as computed through the mean square error computed throughEq. (9.66).

Graphical models concepts in compressed sensing 419
On the other hand, when restricting x(n) to be k-sparse for k = nε (i.e. to be in theclass Fn,k), one can derive asymptotically exact estimates for the minimax risk over thisclass. This will be further discussed in Section 9.6.6.
remark 9.5 As a special case, for noiseless measurements σ = 0, and as λ → 0, theabove formulae describe the asymptotic risk (e.g. mean square error) for the basis pursuitestimator, minimize ‖x‖ subject to y = Ax. For sparse signals x(n) ∈ Fn,k, k = nρδ,the risk vanishes below a certain phase transition line ρ < ρc(δ): this point is furtherdiscussed in Section 9.6.6.
Let us now discuss some limitations of this result. Theorem 9.2 assumes that the entriesof matrix A are i.i.d. Gaussians. Further, our result is asymptotic, and one might wonderhow accurate it is for instances of moderate dimensions.
Numerical simulations were carried out in [28, 4] and suggest that the result is universalover a broader class of matrices and that it is relevant already for n of the order of afew hundreds. As an illustration, we present in Figures 9.9 and 9.10 the outcome ofsuch simulations for two types of random matrices. Simulations with real data can befound in [4]. We generated the signal vector randomly with entries in +1,0,−1 andP(x0,i = +1) = P(x0,i =−1) = 0.064. The noise vector w was generated by using i.i.d.N(0,0.2) entries.
0 0.5 1 1.5 2 2.50
0.1
0.2
0.3
0.4
0.5
λ
MSE
n = 200n = 500n = 1000n = 2000Prediction
Figure 9.9 MSE as a function of the regularization parameter λ compared to the asymptotic prediction forδ = 0.64 and σ2 = 0.2. Here the measurement matrix A has i.i.d. N(0,1/m) entries. Each pointin this plot is generated by finding the LASSO predictor x using a measurement vectory = Ax+w for an independent signal vector x, an independent noise vector w, and anindependent matrix A.

420 Andrea Montanari
0 0.5 1 1.5 2 2.50
0.1
0.2
0.3
0.4
0.5
λ
MSE
n = 200n = 500n = 1000n = 2000Prediction
Figure 9.10 As in Figure 9.9, but the measurement matrix A has i.i.d. entries that are equal to ±1/√
m withequal probabilities.
We solved the LASSO problem (9.12) and computed estimator x using CVX, a packagefor specifying and solving convex programs [34] and OWLQN, a package for solvinglarge-scale versions of LASSO [1]. We used several values of λ between 0 and 2 and nequal to 200, 500, 1000, and 2000. The aspect ratio of matrices was fixed in all casesto δ = 0.64. For each case, the point (λ,MSE) was plotted and the results are shown inthe figures. Continuous lines correspond to the asymptotic prediction by Theorem 9.2for ψ(a,b) = (a− b)2, namely
limn→∞
1
n‖x−x‖2
2 = E[
η(X0 + τ∗Z;θ∗)−X0]2
= δ(τ2∗ −σ2) .
The agreement is remarkably good already for n,m of the order of a few hundreds, anddeviations are consistent with statistical fluctuations.
The two figures correspond to different entries distributions: (i) Random Gaussianmatrices with aspect ratio δ and i.i.d. N(0,1/m) entries (as in Theorem 9.2); (ii) Random±1 matrices with aspect ratio δ. Each entry is independently equal to +1/
√m or−1/
√m
with equal probability. The resulting MSE curves are hardly distinguishable. Furtherevidence towards universality will be discussed in Section 9.6.7.
Notice that the asymptotic prediction has a minimum as a function of λ. The locationof this minimum can be used to select the regularization parameter.

Graphical models concepts in compressed sensing 421
9.6.4 A decoupling principle
There exists a suggestive interpretation of the state evolution result in Theorem 9.1, aswell as of the scaling limit of the LASSO established in Theorem 9.2: The estimationproblem in the vector model y = Ax + w reduces – asymptotically – to n uncoupledscalar estimation problems yi = xi + wi. However the noise variance is increased fromσ2 to τ2
t (or τ∗2 in the case of the LASSO), due to “interference” between the original
coordinates:
y = Ax+w ⇔
y1 = x1 + w1
y2 = x2 + w2...yn = xn + wn
. (9.67)
An analogous phenomenon is well known in statistical physics and probability theory andtakes sometimes the name of “correlation decay” [81, 36, 58]. In the context of CDMAsystem analysis via replica method, the same phenomenon was also called “decouplingprinciple” [75, 38].
Notice that the AMP algorithm gives a precise realization of this decoupling principle,since for each i∈ [n], and for each number of iterations t, it produces an estimate, namely(xt + AT rt)i that can be considered a realization of the observation yi above. IndeedTheorem 9.1 (see also discussion below the theorem) states that (xt +AT rt)i = xi + wi
with wi asymptotically Gaussian with mean 0 and variance τ2t .
The fact that observations of distinct coordinates are asymptotically decoupled isstated precisely below.
corollary 9.1 (Decoupling principle, [9]) Under the assumption of Theorem 9.1,fix ≥ 2, let ψ : R2 → R be any Lipschitz function, and denote by E expectation withrespect to a uniformly random subset of distinct indices J(1), . . . ,J() ∈ [n].
Further, for some fixed t > 0, let yt = xt +AT rt ∈ Rn. Then, almost surely
limn→∞
Eψ(ytJ(1), . . . , y
tJ(),xJ(1), . . . ,xJ())
= Eψ(X0,1 + τtZ1, . . . ,X0, + τtZ,X0,1, . . . ,X0,
),
for X0,i ∼ p0 and Zi ∼ N(0,1), i = 1, . . . , mutually independent.
9.6.5 A heuristic derivation of state evolution
The state evolution recursion has a simple heuristic description that is useful to presenthere since it clarifies the difficulties involved in the proof. In particular, this descriptionbrings up the key role played by the “Onsager term” appearing in Eq. (9.40) [26].
Consider again the recursion (9.39), (9.40) but introduce the following three modi-fications: (i) Replace the random matrix A with a new independent copy A(t) at eachiteration t; (ii) correspondingly replace the observation vector y with yt = A(t)x+w;

422 Andrea Montanari
(iii) eliminate the last term in the update equation for rt. We thus get the followingdynamics:
xt+1 = η(A(t)T rt +xt;θt) , (9.68)
rt = yt −A(t)xt , (9.69)
where A(0),A(1),A(2), . . . are i.i.d. matrices of dimensions m× n with i.i.d. entriesAij(t) ∼ N(0,1/m). (Notice that, unlike in the rest of the chapter, we use here theargument of A to denote the iteration number, and not the matrix dimensions.)
This recursion is most conveniently written by eliminating rt:
xt+1 = η(A(t)T yt +(I−A(t)T A(t))xt;θt
),
= η(x+A(t)T w +B(t)(xt −x);θt
), (9.70)
where we defined B(t) = I−A(t)T A(t) ∈ Rn×n. Let us stress that this recursion doesnot correspond to any concrete algorithm, since the matrix A changes from iteration toiteration. It is nevertheless useful for developing intuition.
Using the central limit theorem, it is easy to show that each entry of B(t) isapproximately normal, with zero mean and variance 1/m. Further, distinct entries areapproximately pairwise independent. Therefore, if we let τ2
t = limn→∞ ‖xt − x‖22/n,
we obtain that B(t)(xt −x) converges to a vector with i.i.d. normal entries with 0 meanand variance nτ2
t /m = τ2t /δ. Notice that this is true because A(t) is independent of
A(s)1≤s≤t−1 and, in particular, of (xt −x).Conditional on w, A(t)T w is a vector of i.i.d. normal entries with mean 0 and variance
(1/m)‖w‖22 which converges by assumption to σ2. A slightly longer exercise shows that
these entries are approximately independent from the ones of B(t)(xt − x0). Summa-rizing, each entry of the vector in the argument of η in Eq. (9.70) converges to X0 +τtZ
with Z ∼ N(0,1) independent of X0, and
τ2t = σ2 +
1
δτ2t , (9.71)
τ2t = lim
n→∞
1
n‖xt −x‖2
2 .
On the other hand, by Eq. (9.70), each entry of xt+1−x converges to η(X0 +τt Z;θt)−X0, and therefore
τ2t+1 = lim
n→∞
1
n‖xt+1 −x‖2
2 = E[η(X0 + τt Z;θt)−X0]
2 . (9.72)
Using together Eq. (9.71) and (9.72) we finally obtain the state evolution recursion,Eq. (9.59).
We conclude that state evolution would hold if the matrix A was drawn independentlyfrom the same Gaussian distribution at each iteration. In the case of interest, A doesnot change across iterations, and the above argument falls apart because xt and A are

Graphical models concepts in compressed sensing 423
dependent. This dependency is non-negligible even in the large system limit n → ∞.This point can be clarified by considering the IST algorithm given by Eqs. (9.47), (9.48).Numerical studies of iterative soft thresholding [57, 26] show that its behavior is dra-matically different from that of AMP and in particular state evolution does not hold forIST, even in the large system limit.
This is not a surprise: the correlations between A and xt simply cannot be neglected.On the other hand, adding the Onsager term leads to an asymptotic cancelation of thesecorrelations. As a consequence, state evolution holds for the AMP iteration.
9.6.6 The noise sensitivity phase transition
The formalism developed so far allows one to extend the minimax analysis carried outin the scalar case in Section 9.3 to the vector estimation problem [28]. We define theLASSO mean square error per coordinate when the empirical distribution of the signalconverges to p0, as
MSE(σ2;p0,λ) = limn→∞
1
nE‖x(λ)−x‖2
2
, (9.73)
where the limit is taken along a converging sequence. This quantity can be computedusing Theorem 9.2 for any specific distribution p0.
We consider again the sparsity class Fε with ε = ρδ. Hence ρ = ‖x‖0/m measuresthe number of nonzero coordinates per measurement. Taking the worst case MSE overthis class, and then the minimum over the regularization parameter λ, we get a resultthat depends on ρ, δ, as well as on the noise level σ2. The dependence on σ2 must belinear because the class Fρδ is scale invariant, and we obtain therefore
infλ
supp0∈Fρδ
MSE(σ2;p0,λ) = M∗(δ,ρ)σ2 , (9.74)
for some function (δ,ρ) $→ M∗(δ,ρ). We call this the LASSO minimax risk. It can beinterpreted as the sensitivity (in terms of mean square error) of the LASSO estimator tonoise in the measurements.
It is clear that the prediction for MSE(σ2;p0,λ) provided by Theorem 9.2 can beused to characterize the LASSO minimax risk. What is remarkable is that the resultingformula is so simple.
theorem 9.3 [28] Assume the hypotheses of Theorem 9.2, and recall that M#(ε)
denotes the soft thresholding minimax risk over the class Fε cf. Eqs. (9.20), (9.22).Further let ρc(δ) be the unique solution of ρ = M#(ρδ).
Then for any ρ < ρc(δ) the LASSO minimax risk is bounded and given by
M∗(δ,ρ) =M#(ρδ)
1−M#(ρδ)/δ. (9.75)
Vice versa, for any ρ ≥ ρc(δ), we have M∗(δ,ρ) = ∞.

424 Andrea Montanari
0
0.2
0.4
0.6
0.8
1
0 0.2 0.4 0.6 0.8 10.0625
0.125 0.250.5
1
2
4
8
δ
ρ
Figure 9.11 Noise sensitivity phase transition in the plane (δ,ρ) (here δ = m/n is the undersampling ratioand ρ = ‖x‖0/m is the number of nonzero coefficients per measurement). Continuous line: Thephase transition boundary ρ = ρc(δ). Dotted lines: Level curves for the LASSO minimaxM∗(δ,ρ). Notice that M∗(δ,ρ) ↑ ∞ as ρ ↑ ρc(δ).
Figure 9.11 shows the location of the noise sensitivity boundary ρc(δ) as well as thelevel lines of M∗(δ,ρ) for ρ < ρc(δ). Above ρc(δ) the LASSO MSE is not uniformlybounded in terms of the measurement noise σ2. Other estimators (for instance one stepof soft thresholding) can offer better stability guarantees in this region.
One remarkable fact is that the phase boundary ρ = ρc(δ) coincides with the phasetransition for 0− 1 equivalence derived earlier by Donoho [29] on the basis of randompolytope geometry results by Affentranger–Schneider [2]. The same phase transitionwas further studied in a series of papers by Donoho, Tanner, and coworkers [30, 31], inconnection with the noiseless estimation problem. For ρ < ρc estimating x by 1-normminimization returns the correct signal with high probability (over the choice of therandom matrix A). For ρ > ρc(δ), 1 minimization fails.
Here this phase transition is derived from a completely different perspective as aspecial case of a stronger result. We indeed use a new method – the state evolutionanalysis of the AMP algorithm – which offers quantitative information about the noisycase as well, namely it allows one to compute the value of M∗(δ,ρ) for ρ < ρc(δ). Withinthe present approach, the line ρc(δ) admits a very simple expression. In parametric form,it is given by
δ =2φ(α)
α+2(φ(α)−αΦ(−α)), (9.76)
ρ = 1− αΦ(−α)
φ(α), (9.77)

Graphical models concepts in compressed sensing 425
where φ and Φ are the Gaussian density and Gaussian distribution function, and α ∈[0,∞) is the parameter. Indeed α has a simple and practically important interpretationas well. Recall that the AMP algorithm uses a sequence of thresholds θt = ατt, cf.Eqs. (9.44) and (9.45). How should the parameter α be fixed? A very simple prescriptionis obtained in the noiseless case. In order to achieve exact reconstruction for all ρ < ρc(δ)
for a given undersampling ratio δ, α should be such that (δ,ρc(δ)) = (δ(α),ρ(α)) withfunctions α $→ δ(α), α $→ ρ(α) defined as in Eqs. (9.76), (9.77). In other words, thisparametric expression yields each point of the phase boundary as a function of thethreshold parameter used to achieve it via AMP.
9.6.7 On universality
The main results presented in this section, namely Theorems 9.1, 9.2, and 9.3, are provedfor measurement matrices with i.i.d. Gaussian entries. As stressed above, it is expectedthat the same results hold for a much broader class of matrices. In particular, they shouldextend to matrices with i.i.d. or weakly correlated entries. For the sake of clarity, it isuseful to put forward a formal conjecture, that generalizes Theorem 9.2.
conjecture 9.1 Let x(n),w(n),A(n)n∈N be a converging sequence of instanceswith the entries of A(n) i.i.d. with mean EAij= 0, variance EA2
ij= 1/m and suchthat EA6
ij≤C/m for some fixed constant C. Denote by x(λ) the LASSO estimator forinstance (x(n),w(n),A(n)), with σ2,λ> 0, and let ψ : R×R→R be a pseudo-Lipschitzfunction. Then, almost surely
limn→∞
1
n
n∑i=1
ψ(xi,xi
)= E
ψ(η(X0 + τ∗Z;θ∗),X0
), (9.78)
where Z ∼ N(0,1) is independent of X0 ∼ p0, τ∗ = τ∗(α(λ)) and θ∗ = α(λ)τ∗(α(λ))
are given by the same formulae holding for Gaussian matrices, cf. Section 9.6.3.
The conditions formulated in this conjecture are motivated by the universality resultin [46], that provides partial evidence towards this claim. Simulations (see for instanceFigure 9.10 and [4]) strongly support this claim.
While proving Conjecture 9.1 is an outstanding mathematical challenge, many mea-surement models of interest do not fit the i.i.d. model. Does the theory developed in thissection say anything about such measurements? Systematic numerical simulations [28,4] reveal that, even for highly structured matrices, the same formula (9.78) is surprisinglyclose to the actual empirical performances.
As an example, Figure 9.12 presents the empirical mean square error for a partialFourier measurement matrix A, as a function of the regularization parameter λ. Thematrix is obtained by subsampling the rows of the N ×N Fourier matrix F , with entriesFij = e2πij
√−1. More precisely we sample n/2 rows of F with replacement, construct
two rows of A by taking real and imaginary parts, and normalize the columns of theresulting matrix.

426 Andrea Montanari
0 0.5 1 1.5 2 2.50.01
0.02
0.03
0.04
0.05
0.06
0.07
0.08
0.09
0.1
0.11
λ
MSE
δ = 0.2, σ 2= 0.2, ρ = 0.2
n500n1000n2000Prediction
Figure 9.12 Mean square error as a function of the regularization parameter λ for a partial Fourier matrix(see text). The noise variance is σ2 = 0.2, the undersampling factor δ = 0.2, and the sparsityratio ρ = 0.2. Data points are obtained by averaging over 20 realizations, and error bars are 95%confidence intervals. The continuous line is the prediction of Theorem 9.2.
0 0.5 1 1.5 2 2.50.01
0.02
0.03
0.04
0.05
0.06
0.07
0.08
0.09
0.1
0.11
λ
MSE
δ = 0.2, σ 2 = 0.2, ρ = 0.2
n500n1000n2000Prediction
Figure 9.13 As in Figure 9.12, but for a measurement matrix A which models the analog-to-digital converterof [78].

Graphical models concepts in compressed sensing 427
Figure 9.13 presents analogous results for the random demodulator matrix which is atthe core of the analog-to-digital converter (ADC) of [78]. Schematically, this is obtainedby normalizing the columns of A=HDF , with F a Fourier matrix, D a random diagonalmatrix with Dii ∈ +1,−1 uniformly at random, and H an “accumulator”:
H =
1111
1111
· · ·1111
.
Both these examples show good agreement between the asymptotic prediction pro-vided by Theorem 9.2 and the empirical mean square error. Such an agreement issurprising given that in both cases the measurement matrix is generated with a smallamount of randomness, compared to a Gaussian matrix. For instance, the ADC matrixonly requires n random bits. Although statistically significant discrepancies can beobserved (cf. for instance Figure 9.13), the present approach provides quantitative pre-dictions of great interest for design purposes. For a more systematic investigation, werefer to [4].
9.6.8 Comparison with other analysis approaches
The analysis presented here is significantly different from more standard approaches. Wederived an exact characterization for the high-dimensional limit of the LASSO estimationproblem under the assumption of converging sequences of random sensing matrices.
Alternative approaches assume an appropriate “isometry,” or “incoherence” conditionto hold for A. Under this condition upper bounds are proved for the mean square error.For instance Candès, Romberg, and Tao [19] prove that the mean square error is boundedby Cσ2 for some constant C. Work by Candès and Tao [21] on the analogous Dantzigselector, upper bounds the mean square error by Cσ2(k/n) logn, with k the number ofnonzero entries of the signal x.
These types of results are very robust but present two limitations: (i) they do notallow one to distinguish reconstruction methods that differ by a constant factor (e.g. twodifferent values of λ); (ii) the restricted isometry condition (or analogous ones) is quiterestrictive. For instance, it holds for random matrices only under very strong sparsityassumptions. These restrictions are intrinsic to the worst-case point of view developedin [19, 21].
Guarantees have been proved for correct support recovery in [85], under an incoher-ence assumption on A. While support recovery is an interesting conceptualization forsome applications (e.g. model selection), the metric considered in the present chapter(mean square error) provides complementary information and is quite standard in manydifferent fields.
Close to the spirit of the treatment presented here, [67] derived expressions for themean square error under the same model considered here. Similar results were presentedrecently in [50, 35]. These papers argue that a sharp asymptotic characterization of the
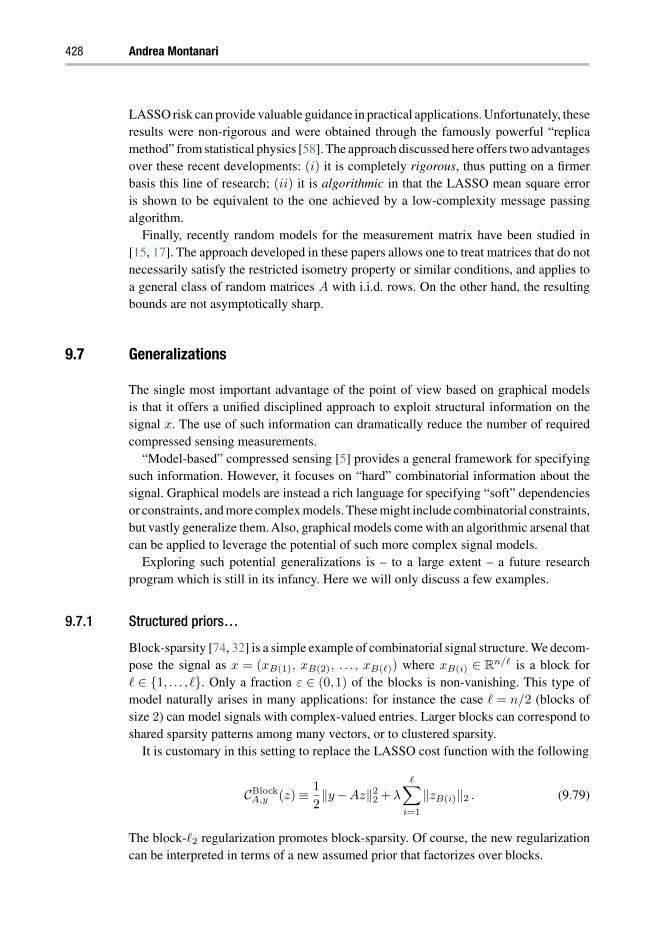
428 Andrea Montanari
LASSO risk can provide valuable guidance in practical applications. Unfortunately, theseresults were non-rigorous and were obtained through the famously powerful “replicamethod” from statistical physics [58]. The approach discussed here offers two advantagesover these recent developments: (i) it is completely rigorous, thus putting on a firmerbasis this line of research; (ii) it is algorithmic in that the LASSO mean square erroris shown to be equivalent to the one achieved by a low-complexity message passingalgorithm.
Finally, recently random models for the measurement matrix have been studied in[15, 17]. The approach developed in these papers allows one to treat matrices that do notnecessarily satisfy the restricted isometry property or similar conditions, and applies toa general class of random matrices A with i.i.d. rows. On the other hand, the resultingbounds are not asymptotically sharp.
9.7 Generalizations
The single most important advantage of the point of view based on graphical modelsis that it offers a unified disciplined approach to exploit structural information on thesignal x. The use of such information can dramatically reduce the number of requiredcompressed sensing measurements.
“Model-based” compressed sensing [5] provides a general framework for specifyingsuch information. However, it focuses on “hard” combinatorial information about thesignal. Graphical models are instead a rich language for specifying “soft” dependenciesor constraints, and more complex models. These might include combinatorial constraints,but vastly generalize them. Also, graphical models come with an algorithmic arsenal thatcan be applied to leverage the potential of such more complex signal models.
Exploring such potential generalizations is – to a large extent – a future researchprogram which is still in its infancy. Here we will only discuss a few examples.
9.7.1 Structured priors…
Block-sparsity [74, 32] is a simple example of combinatorial signal structure. We decom-pose the signal as x = (xB(1), xB(2), . . . , xB()) where xB(i) ∈ Rn/ is a block for ∈ 1, . . . , . Only a fraction ε ∈ (0,1) of the blocks is non-vanishing. This type ofmodel naturally arises in many applications: for instance the case = n/2 (blocks ofsize 2) can model signals with complex-valued entries. Larger blocks can correspond toshared sparsity patterns among many vectors, or to clustered sparsity.
It is customary in this setting to replace the LASSO cost function with the following
CBlockA,y (z) ≡ 1
2‖y−Az‖2
2 +λ
∑i=1
‖zB(i)‖2 . (9.79)
The block-2 regularization promotes block-sparsity. Of course, the new regularizationcan be interpreted in terms of a new assumed prior that factorizes over blocks.
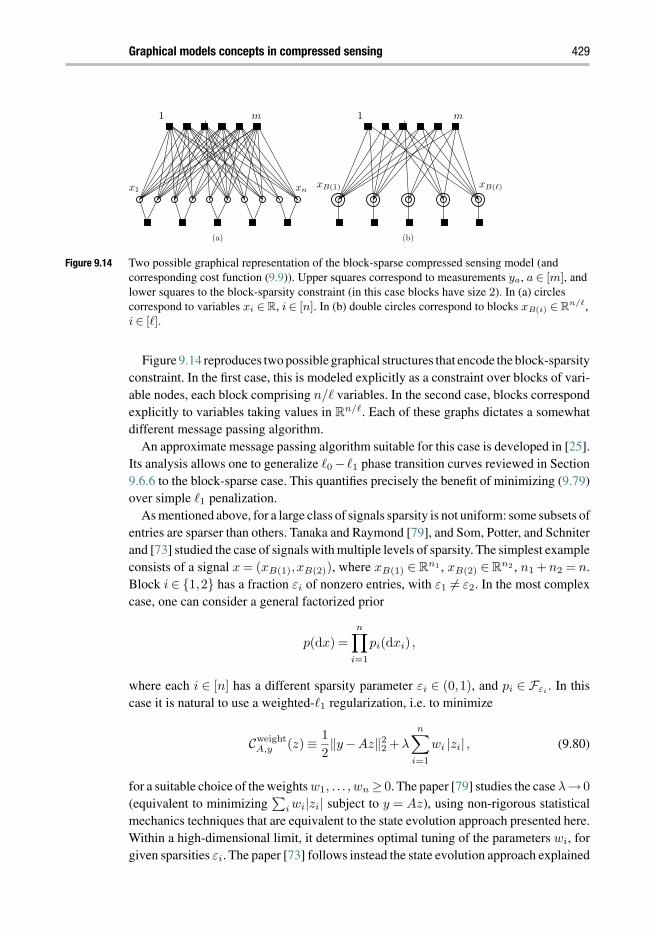
Graphical models concepts in compressed sensing 429
x1 xnxB(1) xB( )
1 m1
(a) (b)
m
Figure 9.14 Two possible graphical representation of the block-sparse compressed sensing model (andcorresponding cost function (9.9)). Upper squares correspond to measurements ya, a ∈ [m], andlower squares to the block-sparsity constraint (in this case blocks have size 2). In (a) circlescorrespond to variables xi ∈ R, i ∈ [n]. In (b) double circles correspond to blocks xB(i) ∈ R
n/,i ∈ [].
Figure 9.14 reproduces two possible graphical structures that encode the block-sparsityconstraint. In the first case, this is modeled explicitly as a constraint over blocks of vari-able nodes, each block comprising n/ variables. In the second case, blocks correspondexplicitly to variables taking values in Rn/. Each of these graphs dictates a somewhatdifferent message passing algorithm.
An approximate message passing algorithm suitable for this case is developed in [25].Its analysis allows one to generalize 0 − 1 phase transition curves reviewed in Section9.6.6 to the block-sparse case. This quantifies precisely the benefit of minimizing (9.79)over simple 1 penalization.
As mentioned above, for a large class of signals sparsity is not uniform: some subsets ofentries are sparser than others. Tanaka and Raymond [79], and Som, Potter, and Schniterand [73] studied the case of signals with multiple levels of sparsity. The simplest exampleconsists of a signal x = (xB(1),xB(2)), where xB(1) ∈ Rn1 , xB(2) ∈ Rn2 , n1 +n2 = n.Block i ∈ 1,2 has a fraction εi of nonzero entries, with ε1 = ε2. In the most complexcase, one can consider a general factorized prior
p(dx) =
n∏i=1
pi(dxi) ,
where each i ∈ [n] has a different sparsity parameter εi ∈ (0,1), and pi ∈ Fεi. In this
case it is natural to use a weighted-1 regularization, i.e. to minimize
CweightA,y (z) ≡ 1
2‖y−Az‖2
2 +λ
n∑i=1
wi |zi| , (9.80)
for a suitable choice of the weights w1, . . . , wn ≥ 0. The paper [79] studies the case λ→ 0
(equivalent to minimizing∑
i wi|zi| subject to y = Az), using non-rigorous statisticalmechanics techniques that are equivalent to the state evolution approach presented here.Within a high-dimensional limit, it determines optimal tuning of the parameters wi, forgiven sparsities εi. The paper [73] follows instead the state evolution approach explained

430 Andrea Montanari
in the present chapter. The authors develop a suitable AMP iteration and compute theoptimal thresholds to be used by the algorithm. These are in correspondence with theoptimal weights wi mentioned above, and can be also interpreted within the minimaxframework developed in the previous pages.
The graphical model framework is particularly convenient for exploiting prior infor-mation that is probabilistic in nature, see in particular [12, 13]. A prototypical examplewas studied by Schniter [71] who considered the case in which the signal x is generatedby a Hidden Markov Model (HMM). As for the block-sparse model, this can be used tomodel signals in which the nonzero coefficients are clustered, although in this case onecan accommodate greater stochastic variability of the cluster sizes.
In the simple case studied in detail in [71], the underlying Markov chain has two statesindexed by si ∈ 0,1, and
p(dx) =∑
s1,...,sn
n∏i=1
p(dxi|si) ·n−1∏i=1
p(si+1|si) · p1(s1)
, (9.81)
where p( · |0) and p( · |1) belong to two different sparsity classes Fε0 , Fε1 . For instanceone can consider the case in which ε0 = 0 and ε1 = 1, i.e. the support of x coincideswith the subset of coordinates such that si = 1.
Figure 9.15 reproduces the graphical structure associated with this type of model. Thiscan be partitioned in two components: a bipartite graph corresponding to the compressedsensing measurements (upper part in Figure 9.15) and a chain graph corresponding tothe Hidden Markov Model structure of the prior (lower part in Figure 9.15).
Reconstruction was performed in [71] using a suitable generalization ofAMP. Roughlyspeaking, inference is performed in the upper half of the graph usingAMPand in the lower
x1 xn
s1 sn
1 m
Figure 9.15 Graphical model for compressed sensing of signals with clustered support. The support structureis described by a Hidden Markov Model comprising the lower factor nodes (filled squares) andvariable nodes (empty circles). Upper variable nodes correspond to the signal entries xi, i ∈ [n],and upper factor nodes to the measurements ya, a ∈ [m].

Graphical models concepts in compressed sensing 431
x1 xn
1 m
Figure 9.16 Graphical model for compressed sensing of signals with tree-structured prior. The supportstructure is a tree graphical model, comprising factor nodes and variable nodes in the lower partof the graph. Upper variable nodes correspond to the signal entries xi, i ∈ [n], and upper factornodes to the measurements ya, a ∈ [m].
part using the standard forward-backward algorithm. Information is exchanged acrossthe two components in a way that is very similar to what happens in turbo codes [68].
The example of HMM priors clarifies the usefulness of the graphical model structurein eliciting tractable substructures in the probabilistic model and hence leading to naturaliterative algorithms. For an HMM prior, inference can be performed efficiently becausethe underlying graph is a simple chain.
A broader class of priors for which inference is tractable is provided by Markov-treedistributions [72]. These are graphical models that factor according to a tree graph (i.e. agraph without loops). Acartoon of the resulting compressed sensing model is reproducedin Figure 9.16.
The case of tree-structured priors is particularly relevant in imaging applications.Wavelet coefficients of natural images are sparse (an important motivating remark forcompressed sensing) and nonzero entries tend to be localized along edges in the image.Asa consequence, they cluster in subtrees of the tree of wavelet coefficients. A Markov-treeprior can capture well this structure.
Again, reconstruction is performed exactly on the tree-structured prior (this can bedone efficiently using belief propagation), while AMP is used to do inference over thecompressed sensing measurements (the upper part of Figure 9.16).
9.7.2 Sparse sensing matrices
Throughout this review we focused for simplicity on dense measurement matrices A.Several of the mathematical results presented in the previous sections do indeed hold

432 Andrea Montanari
x1 xn
1 m
Figure 9.17 Sparse sensing graph arising in a networking application. Each network flow (empty circlesbelow) hashes into k = 2 counters (filled squares).
for dense matrices with i.i.d. components. Graphical models ideas are on the other handparticularly useful for sparse measurements.
Sparse sensing matrices present several advantages, most remarkably lower measure-ment and reconstruction complexities [6]. While sparse constructions are not suitablefor all applications, they appear a promising solution for networking applications, mostnotably in network traffic monitoring [14, 56].
In an over-simplified example, one would like to monitor the sizes of n packet flowsat a router. It is a recurring empirical observation that most of the flows consist of a fewpackets, while most of the traffic is accounted for by a few flows. Denoting by x1, x2,…, xn the flow sizes (as measured, for instance, by the number of packets belonging tothe flow), it is desirable to maintain a small sketch of the vector x = (x1, . . . ,xn).
Figure 9.17 describes a simple approach: flow i hashes into a small number – say k –of memory spaces, ∂i = a1(i), . . . ,ak(i) ⊆ [m]. Each time a new packet arrives forflow i, the counters in ∂i are incremented. If we let y = (y1, . . . ,ym) be the contents ofthe counters, we have
y = Ax, (9.82)
where x ≥ 0 and A is a matrix with i.i.d. columns with k entries per column equal to 1
and all the other entries equal to 0. While this simple scheme requires unpractically deepcounters (the entries of y can be large), [56] showed how to overcome this problem byusing a multi-layer graph.
Numerous algorithms have been developed for compressed sensing reconstructionwith sparse measurement matrices [14, 84, 6, 40]. Most of these algorithms are based ongreedy methods, which are essentially of message passing type. Graphical models ideascan be used to construct such algorithms in a very natural way. For instance, the algorithmof [56] (see also [54, 55, 20] for further analysis of the same algorithm) is closely relatedto the ideas presented in the rest of this chapter. It uses messages xt
i→a (from variablenodes to function nodes) and rt
a→i (from function nodes to variable nodes). These are

Graphical models concepts in compressed sensing 433
updated according to
rta→i = ya −
∑j∈∂a\i
xtj→a , (9.83)
xt+1i→a =
min
rtb→i : b ∈ ∂i \a
at even iterations t,
maxrtb→i : b ∈ ∂i \a
at odd iterations t,
(9.84)
where ∂a denotes the set of neighbors of node a in the factor graph. These updates arevery similar to Eqs. (9.49), (9.50) introduced earlier in our derivation of AMP.
9.7.3 Matrix completion
“Matrix completion” is the task of inferring an (approximately) low rank matrix fromobservations on a small subset of its entries. This problem has attracted considerableinterest over the last two years due to its relevance in a number of applied domains(collaborative filtering, positioning, computer vision, etc.).
Significant progress has been achieved on the theoretical side. The reconstructionquestion has been addressed in analogy with compressed sensing in [18, 16, 37, 63],while an alternative approach based on greedy methods was developed in [48, 49, 45].While the present chapter does not treat matrix completion in any detail, it is interestingto mention that graphical models ideas can be useful in this context as well.
Let M ∈ Rm×n be the matrix to be reconstructed, and assume that a subset E ⊆[m]×[n] of its entries is observed. It is natural to try to accomplish this task by minimizingthe 2 distance on observed entries. For X ∈ Rm×r, Y ∈ Rn×r, we introduce thereforethe cost function
C(X,Y ) =1
2‖PE(M −XY T )‖2
F (9.85)
where PE is the projector that sets to zero the entries outside E (i.e. PE(L)ij = Lij if(i, j) ∈ E and PE(L)ij = 0 otherwise). If we denote the rows of X as x1, . . . ,xm ∈ Rr
and the rows in Y as y1, . . . ,yn ∈ Rr, the above cost function can be rewritten as
C(X,Y ) =1
2
∑(i,j)∈E
(Mij −〈xi,yj〉
)2, (9.86)
with 〈 · , ·〉 the standard scalar product on Rr. This cost function factors accordinglythe bipartite graph G with vertex sets V1 = [m] and V2 = [n] and edge set E. The costdecomposes as a sum of pairwise terms associated with the edges of G.
Figure 9.18 reproduces the graph G that is associated to the cost function C(X,Y ).It is remarkable that some properties of the reconstruction problem can be “read” fromthe graph. For instance, in the simple case r = 1, the matrix M can be reconstructed ifand only if G is connected (banning for degenerate cases) [47]. For higher values of therank r, rigidity of the graph is related to uniqueness of the solution of the reconstructionproblem [70]. Finally, message passing algorithms for this problem were studied in[51, 45].

434 Andrea Montanari
x1 xn
y1 ym
Figure 9.18 Factor graph describing the cost function (9.86) for the matrix completion problem. Variablesxi,yj ∈ R
r are to be optimized over. The cost is a sum of pairwise terms (filled squares)corresponding to the observed entries in M .
9.7.4 General regressions
The basic reconstruction method discussed in this review is the regularized least-squaresregression defined in Eq. (9.12), also known as the LASSO. While this is by far the mostinteresting setting for signal processing applications, for a number of statistical learningproblems, the linear model (9.1) is not appropriate. Generalized linear models providea flexible framework to extend the ideas discussed here.
An important example is logistic regression, which is particularly suited for the casein which the measurements y1, . . . ym are 0–1 valued. Within logistic regression, theseare modeled as independent Bernoulli random variables with
p(ya = 1|x) =eAT
a x
1+ eATa x
, (9.87)
with Aa a vector of “features” that characterizes the ath experiment. The objective is tolearn the vector x of coefficients that encodes the relevance of each feature. A possibleapproach consists in minimizing the regularized (negative) log-likelihood, that is
CLogRegA,y (z) ≡−
m∑a=1
ya(ATa z)+
m∑a=1
log(1+ eAT
a z)+λ‖z‖1. (9.88)
The papers [66, 8] develop approximate message passing algorithms for solvingoptimization problems of this type.
Acknowledgements
It is a pleasure to thank Mohsen Bayati, Jose Bento, David Donoho, and Arian Maleki,with whom this research has been developed. This work was partially supported by aTerman fellowship, the NSF CAREER award CCF-0743978, and the NSF grant DMS-0806211.

Graphical models concepts in compressed sensing 435
References
[1] G. Andrew and G. Jianfeng, Scalable training of l1-regularized log-linear models. Proc 24thInte Conf Mach Learning, 2007, pp. 33–40.
[2] R. Affentranger and R. Schneider, Random projections of regular simplices. Discr ComputGeom, 7:219–226, 1992.
[3] D. Aldous and J. M. Steele. The objective method: probabilistic combinatorial optimizationand local weak convergence. Probability on Discrete Structures H. Kesten, ed., SpringerVerlag, pp. 1–72, 2003.
[4] M. Bayati, J. Bento, and A. Montanari. Universality in sparse reconstruction: A comparisonbetween theories and empirical results, in preparation, 2011.
[5] R. G. Baraniuk, V. Cevher, M. F. Duarte, and C. Hegde. Model-based compressive sensing,IEEE Trans Inform Theory 56:1982–2001, 2010.
[6] R. Berinde, A. C. Gilbert, P. Indyk, H. Karloff, and M. J. Strauss. Combining geometryand combinatorics: a unified approach to sparse signal recovery. 46th Ann Allerton Conf(Monticello, IL), September 2008.
[7] P. Billingsley. Probability and Measure, Wiley, 1995.[8] M. Bayati and A. Montanari. Approximate message passing algorithms for generalized linear
models, in preparation, 2010.[9] M. Bayati and A. Montanari. The dynamics of message passing on dense graphs,
with applications to compressed sensing. IEEE Trans Inform Theory, accepted,http://arxiv.org/pdf/1001.3448, 2011.
[10] S. S. Chen and D. L. Donoho. Examples of basis pursuit. Proc Wavelet Appl Sig Image ProcIII, San Diego, CA, 1995.
[11] V. Cevher, Learning with compressible priors. Neur Inform Proc Syst, Vancouver, 2008.[12] V. Cevher, C. Hegde, M. F. Duarte, and R. G. Baraniuk, Sparse signal recovery using Markov
random fields. Neur Inform Proc Syst, Vancouver, 2008.[13] V. Cevher, P. Indyk, L. Carin, and R. G. Baraniuk. Sparse signal recovery and acquisition
with graphical models. IEEE Sig Process Mag 27:92–103, 2010.[14] G. Cormode and S. Muthukrishnan. Improved data streams summaries: The count-min sketch
and its applications. LATIN, Buenos Aires, pp. 29–38, 2004.[15] E. J. Candès andY. Plan. Near-ideal model selection by 1 minimization.Ann Statist, 37:2145–
2177, 2009.[16] E. J. Candès and Y. Plan, Matrix completion with noise. Proc IEEE 98:925–936, 2010.[17] E. J. Candès and Y. Plan. A probabilistic and ripless theory of compressed sensing.
arXiv:1011.3854, November 2010.[18] E. J. Candès and B. Recht. Exact matrix completion via convex optimization. Found Comput
Math 9:717–772, 2009.[19] E. Candès, J. K. Romberg, and T. Tao. Stable signal recovery from incomplete and inaccurate
measurements. Commun Pure Appl Math, 59:1207–1223, 2006.[20] V. Chandar, D. Shah, and G. W. Wornell,Asimple message-passing algorithm for compressed
sensing, Proc IEEE Int Symp Inform Theory (ISIT) (Austin), 2010.[21] E. Candès and T. Tao. The Dantzig selector: statistical estimation when p is much larger than
n. Ann Stat, 35:2313–2351, 2007.[22] D. L. Donoho and I. M. Johnstone. Ideal spatial adaptation via wavelet shrinkage. Biometrika,
81:425–455, 1994.
436 Andrea Montanari
[23] D. L. Donoho and I. M. Johnstone. Minimax risk over lp balls. Prob Th Rel Fields, 99:277–303, 1994.
[24] D. L. Donoho, I. M. Johnstone, J. C. Hoch, and A. S. Stern. Maximum entropy and the nearlyblack object. J Roy Statist Soc, Ser. B (Methodological), 54(1):41–81, 1992.
[25] D. Donoho and A. Montanari. Approximate message passing for reconstruction of block-sparse signals, in preparation, 2010.
[26] D. L. Donoho, A. Maleki, and A. Montanari. Message passing algorithms for compressedsensing. Proc Nat Acad Sci 106:18914–18919, 2009.
[27] D. L. Donoho, A. Maleki, and A. Montanari. Message passing algorithms for compressedsensing: I. Motivation and construction. Proc IEEE Inform Theory Workshop, Cairo, 2010.
[28] D. L. Donoho, A. Maleki, and A. Montanari. The noise sensitivity phase transition incompressed sensing, http://arxiv.org/abs/1004.1218, 2010.
[29] D. Donoho. High-dimensional centrally symmetric polytopes with neighborliness propor-tional to dimension. Discr Comput Geom, 35:617–652, 2006.
[30] D. L. Donoho and J. Tanner. Neighborliness of randomly-projected simplices in highdimensions. Proc Nat Acad Sci, 102(27):9452–9457, 2005.
[31] D. L. Donoho and J. Tanner. Counting faces of randomly projected polytopes when theprojection radically lowers dimension, J Am Math Soc, 22:1–53, 2009.
[32] Y. C. Eldar, P. Kuppinger, and H. Bolcskei. Block-sparse signals: uncertainty relations andefficient recovery. IEEE Trans Sig Proc, 58:3042–3054, 2010.
[33] M.A. T. Figueiredo and R. D. Nowak.An EM algorithm for wavelet-based image restoration.IEEE Trans Image Proc, 12:906–916, 2003.
[34] M. Grant and S. Boyd. CVX: Matlab software for disciplined convex programming, version1.21, http://cvxr.com/cvx, May 2010.
[35] D. Guo, D. Baron, and S. Shamai.Asingle-letter characterization of optimal noisy compressedsensing. 47th Ann Allerton Conf (Monticello, IL), September 2009.
[36] D. Gamarnik and D. Katz. Correlation decay and deterministic FPTAS for counting list-colorings of a graph. 18th Ann ACM-SIAM Symp Discrete Algorithms, New Orleans, 1245–1254, 2007.
[37] D. Gross. Recovering low-rank matrices from few coefficients in any basis.arXiv:0910.1879v2, 2009.
[38] D. Guo and S. Verdu. Randomly spread CDMA: asymptotics via statistical physics. IEEETrans Inform Theory, 51:1982–2010, 2005.
[39] T. Hastie, R. Tibshirani, and J. Friedman. The Elements of Statistical Learning, Springer-Verlag, 2003.
[40] P. Indyk. Explicit constructions for compressed sensing of sparse signals, 19th Ann ACM-SIAM Symp Discrete Algorithm, San Francisco, 2008.
[41] I. Johnstone, Function Estimation and Gaussian Sequence Models. Draft of a book, availableat www-stat.stanford.edu/∼imj/based.pdf, 2002.
[42] M. Jordan (ed.). Learning in Graphical Models, MIT Press, 1998.[43] S. Ji, Y. Xue, and L. Carin. Bayesian compressive sensing. IEEE Trans Sig Proc, 56:2346–
2356, 2008.[44] D. Koller and N. Friedman. Probabilistic Graphical Models, MIT Press, 2009.[45] R. H. Keshavan and A. Montanari. Fast algorithms for matrix completion, in preparation,
2010.[46] S. Korada and A. Montanari. Applications of Lindeberg Principle in communications and
statistical learning. http://arxiv.org/abs/1004.0557, 2010.

Graphical models concepts in compressed sensing 437
[47] R. H. Keshavan, A. Montanari, and S. Oh. Learning low rank matrices from O(n) entries.Proc Allerton Conf Commun, Control Comput, September 2008, arXiv:0812.2599.
[48] R. H. Keshavan, A. Montanari, and S. Oh, Matrix completion from a few entries. IEEE TransInform Theory, 56:2980–2998, 2010.
[49] R. H. Keshavan, A. Montanari, and S. Oh. Matrix completion from noisy entries. J MachLearn Res 11:2057–2078, 2010.
[50] Y. Kabashima, T. Wadayama, and T. Tanaka, A typical reconstruction limit for compressedsensing based on lp-norm minimization. J Stat Mech, L09003, 2009.
[51] B.-H. Kim, A. Yedla, and H. D. Pfister. Imp: A message-passing algorithm for matrixcompletion. Proc Stand 6th Inte Symp Turbo Codes, September 2010, arXiv:1007.0481.
[52] E.L. Lehmann and G. Casella. Theory of Point Estimation, Springer-Verlag, 1998.[53] M. Ledoux, The Concentration of Measure Phenomenon, American Mathematical Society,
2001.[54] Y. Lu, A. Montanari, and B. Prabhakar, Detailed network measurements using sparse graph
counters: The Theory, 45th Ann Allerton Confe Monticello, IL, 2007.[55] Y. Lu, A. Montanari, and B. Prabhakar. Counter braids: asymptotic optimality of the message
passing decoding algorithm. 46th Ann Allerton Confe, Monticello, IL, 2008.[56] Y. Lu, A. Montanari, B. Prabhakar, S. Dharmapurikar, and A. Kabbani. Counter braids: a
novel counter architecture for per-flow measurement. SIGMETRICS 2010, 2008.[57] A. Maleki and D. L. Donoho, Optimally tuned iterative thresholding algorithm for
compressed sensing. IEEE J Sel Topics Sig Process, 4:330–341, 2010.[58] M. Mézard and A. Montanari. Information, Physics and Computation. Oxford University
Press, 2009.[59] A. Montanari. Estimating random variables from random sparse observations. Eur Trans
Telecom, 19:385–403, 2008.[60] M. Mézard, G. Parisi, and M. A. Virasoro. Spin Glass Theory and Beyond. World Scientific,
1987.[61] C. Moallemi and B.Van Roy. Convergence of the min-sum algorithm for convex optimization.
45th Ann Allerton Confe (Monticello, IL), September 2007.[62] A. Montanari and D. Tse.Analysis of belief propagation for non-linear problems: the example
of CDMA (or: how to prove Tanaka’s formula). Proc IEEE Inform Theory Workshop (Puntade l’Este, Uruguay), 2006.
[63] S. Negahban and M. J. Wainwright. Estimation of (near) low-rank matrices with noise andhigh-dimensional scaling. arXiv:0912.5100, 2009.
[64] L. Onsager. Electric moments of molecules in liquids. J Am Chem Soc, 58:1486–1493,1936.
[65] J. Pearl. Probabilistic Reasoning in Intelligent Systems: Networks of Plausible Inference.Morgan Kaufmann, 1988.
[66] S. Rangan. Generalized approximate message passing for estimation with random linearmixing. arXiv:1010.5141, 2010.
[67] S. Rangan, A. K. Fletcher, and V. K. Goyal. Asymptotic Analysis of Map Estimation via theReplica Method and Applications to Compressed Sensing, 2009.
[68] T. J. Richardson and R. Urbanke. Modern Coding Theory, Cambridge University Press, 2008.[69] S. Sarvotham, D. Baron, and R. Baraniuk. Bayesian compressive sensing via belief
propagation. IEEE Trans Sig Proc, 58:269–280, 2010.[70] A. Singer and M. Cucuringu. Uniqueness of low-rank matrix completion by rigidity theory.
arXiv:0902.3846, 2009.

438 Andrea Montanari
[71] P. Schniter. Turbo reconstruction of structured sparse signals. Proc Conf Inform Sci Syst,Princeton, NJ, 2010.
[72] S. Som, L. C. Potter, and P. Schniter. Compressive imaging using approximate messagepassing and a Markov-Tree Prior. Proc Asilomar Conf Sig Syst Comput, 2010.
[73] L. C. Potter, S. Som, and P. Schniter. On approximate message passing for reconstruction ofnon-uniformly sparse signals, Proc Nati Aereospace Electron Confe, Dayton, OH, 2010.
[74] M. Stojnic, F. Pavaresh, and B. Hassibi. On the reconstruction of block-sparse signals withan optimal number of measurements. IEEE Trans Sig Proc, 57:3075–3085, 2009.
[75] T. Tanaka. A statistical-mechanics approach to large-system analysis of CDMA multiuserdetectors. IEEE Trans Inform Theory, 48:2888–2910, 2002.
[76] D. J. Thouless, P. W. Anderson, and R. G. Palmer. Solution of “Solvable model of a spinglass.” Phil Mag 35:593–601, 1977.
[77] R. Tibshirani. Regression shrinkage and selection with the lasso. J Roy Stat Soc, B 58:267–288, 1996.
[78] J. A. Tropp, J. N. Laska, M. F. Duarte, J. K. Romberg, and R. G. Baraniuk. Beyond Nyquist:efficient sampling of sparse bandlimited signals. IEEE Trans Inform. Theory, 56:520–544,2010.
[79] T. Tanaka and J. Raymond. Optimal incorporation of sparsity information by weighted L1
optimization. Proc IEEE Int Symp Inform Theory (ISIT), Austin, 2010.[80] A. W. van der Vaart. Asymptotic Statistics. Cambridge University Press, 2000.[81] D. Weitz. Combinatorial criteria for uniqueness of Gibbs measures. Rand Struct Alg, 27:445–
475, 2005.[82] D. Williams. Probability with Martingales. Cambridge University Press, 1991.[83] M. J. Wainwright and M. I. Jordan. Graphical models, exponential families, and variational
inference. Found Trends Mach Learn, 1, 2008.[84] W. Xu and B. Hassibi. Efficient compressive sensing with deterministic guarantees using
expander graphs. Proc IEEE Inform Theory Workshop, Tahoe City, CA, 2007.[85] P. Zhao and B.Yu. On model selection consistency of Lasso. J Mach Learn Res, 7:2541–2563,
2006.

10 Finding needles in compressedhaystacksRobert Calderbank and Sina Jafarpour
Abstract
In this chapter, we show that compressed learning, learning directly in the compresseddomain, is possible. In particular, we provide tight bounds demonstrating that the linearkernel SVM’s classifier in the measurement domain, with high probability, has trueaccuracy close to the accuracy of the best linear threshold classifier in the data domain. Weshow that this is beneficial both from the compressed sensing and the machine learningpoints of view. Furthermore, we indicate that for a family of well-known compressedsensing matrices, compressed learning is provided on the fly. Finally, we support ourclaims with experimental results in the texture analysis application.
10.1 Introduction
In many applications, the data has a sparse representation in some basis in a much higherdimensional space. Examples are the sparse representation of images in the waveletdomain, the bag of words model of text, and the routing tables in data monitoring systems.
Compressed sensing combines measurement to reduce the dimensionality of theunderlying data with reconstruction to recover sparse data from the projection in themeasurement domain. However, there are many sensing applications where the objec-tive is not full reconstruction but is instead classification with respect to some signature.Examples include radar, detection of trace chemicals, face detection [7, 8], and videostreaming [9] where we might be interested in anomalies corresponding to changesin wavelet coefficients in the data domain. In all these cases our objective is patternrecognition in the measurement domain.
Classification in the measurement domain offers a way to resolve this challenge andwe show that it is possible to design measurements for which there are performanceguarantees. Similar to compressed sensing, linear measurements are used to remove thecosts of pointwise sampling and compression. However, the ultimate goal of compressed
Compressed Sensing: Theory and Applications, ed. Yonina C. Eldar and Gitta Kutyniok. Published byCambridge University Press. © Cambridge University Press 2012.

440 Robert Calderbank and Sina Jafarpour
learning is not reconstruction of the sparse data from their linear measurements. Incontrast, here we are provided with compressively sampled training data, and the goal isto design a classifier directly in the measurement domain with almost the same accuracyas the best classifier in the data domain.
Being able to learn in the compressed domain is beneficial both from the compressedsensing and the machine learning points of view. From the compressed sensing view-point, it eliminates the significant cost of recovering irrelevant data; in other words,classification in the measurement domain is like a sieve and makes it possible to onlyrecover the desired signals, or even remove the recovery phase totally, if we are onlyinterested in the results of classification. This is like finding a needle in a compressivelysampled haystack without recovering all the hay. In addition, compressed learning hasthe potential of working successfully in situations where one cannot observe the datadomain or where measurements are difficult or expensive.
Dimensionality reduction is a fundamental step in applications as diverse as thenearest-neighbor approximation [1, 2], data-streaming [3], machine learning [4, 5], graphapproximation [6], etc. In compressed learning, the sensing procedure can be also con-sidered as a linear dimensionality reduction step. In this chapter we will show thatmost compressed sensing matrices also provide the desired properties of good lineardimensionality reduction matrices.
In terms of geometry, the difference between compressed sensing and compressedlearning is that the former is concerned with separating pairs of points in the measurementdomain to enable unambiguous recovery of sparse data while the latter is concernedwith consistent separation of clouds of points in the data and measurement domains.In this chapter we demonstrate feasibility of pattern recognition in the measurementdomain. We provide PAC-style bounds guaranteeing that if the data is measured directlyin the compressed domain, a soft margin SVM’s classifier that is trained based on thecompressed data performs almost as well as the best possible SVM’s classifier in thedata domain. The results are robust against the noise in the measurement.
The compressed learning framework is applicable to any sparse high-dimensionaldataset. For instance, in texture analysis [10] the goal is to predict the direction of animage by looking only at its wavelet coefficients.Aweighted voting among horizontal andvertical wavelet coefficients of each image can accurately predict whether the image isvertical, horizontal, or neither. However, in compressive imaging, the high-dimensionalwavelet representation of the image is not provided. In contrast, a non-adaptive low-ranksensing matrix is used to project the wavelet vector into some low-dimensional space.Here we show that a weighted voting among the entries of these measurement vectorshas approximately the same accuracy as the original weighted voting among the waveletentries in the texture analysis task.
Section 10.2 clarifies the notation that is used in this chapter. Support Vector Machines(SVM’s) are introduced in Section 10.3. In Sections 10.4 and 10.5 we introduce theDistance-Preserving Property, and prove that if a sensing matrix is Distance-Preservingwith respect to a feature space, then the SVM’s classifier in the measurement domain is

Finding needles in compressed haystacks 441
close to optimal. Section 10.6 shows that the celebrated Johnson-Lindenstrauss propertyis a sufficient condition for distance-preserving. Then in Sections 10.7 and 10.8 weprovide two examples of sensing matrices which are widely used in compressed sensing,and satisfy the Johnson-Lindenstrauss property with respect to sparse feature spaces.Section 10.9 proves the main results about the average-case compressed learning, andSection 10.10 concludes the chapter.
10.2 Background and notation
10.2.1 Notation
Throughout this chapter, in order to distinguish vectors from scalar values, vectors arealways represented by bold symbols. Let n be a positive integer, and let k be a positiveinteger less than n. We sometimes denote 1, · · · ,n by [n]. We assume that all data arerepresented as vectors in Rn. The feature space X (which we also call the data-domain),is a subset of the whole n-dimensional space, and every data point is a vector in the featurespace. Choosing appropriate feature space X highly depends on the prior informationavailable about the data. For instance, if there is no prior knowledge available, then thefeature space is the whole space Rn. However, if it is known a priori that all data pointsare k-sparse, then the feature space can be restricted to the union of all k-dimensionalsubspaces of Rn.
Let X denote an n-dimensional feature space. We associate two parameters with Xwhich we later use in our analysis. The radius R, and the distortion 2→1 of the featurespace X are defined as
R.= max
x∈X‖x‖2 and 2→1(X )
.= max
x∈X
‖x‖1
‖x‖2. (10.1)
It follows from the Cauchy-Schwarz inequality that on one hand, if every element ofX is k-sparse, then 2→1(X ) =
√k. On the other hand, if the feature space covers the
whole space Rn, then 2→1(X ) =√
n.The Hamming weight of a vector x∈Rn, denoted by ‖x‖0, is defined as the number of
nonzero entries of x. The support of the k-sparse vector x, denoted by supp(x), containsthe indices of the nonzero entries of x. Throughout this chapter we let Πk
1 = Π1, · · · ,Πkbe a uniformly random k-subset of [n], and πk
1 = π1, · · · ,πk denote a fixed k-subsetof [n]. We use v1
v2 to denote the inner product between two vectors v1 and v2. Alsowhenever it is clear from context, we remove the subscript from the 2 norm of a vector.
Let A be an m×n matrix. We use the notation Aj for the jth column of the sensingmatrix A; its entries will be denoted by aij , with the row label i varying from 0 to m−1.The matrix A is a tight-frame with redundancy n
m if and only if AA† = nm Im×m. Note
that if A is a tight-frame with redundancy nm , then ‖A‖2 = n
m .

442 Robert Calderbank and Sina Jafarpour
10.2.2 Concentration inequalities
Here we provide the main concentration inequalities which are used in the chapter.
proposition 10.1 (Azuma’s inequality [11]) Let 〈Z0, Z1, · · · , Zk〉 be a set of com-plex random variables such that, for each i, E [Zi] = Zi−1, and |Zi −Zi−1| ≤ ci. Thenfor all ε > 0,
Pr[|Zk −Z0| ≥ ε] ≤ 4exp
−ε2
8∑k
i=1 c2i
.
proposition 10.2 (Extension to Azuma’s inequality when differences are boundedwith high probability [12]) Suppose 〈Z0, Z1, · · · , Zk〉 is a complex martingalesequence, that is for each i, E [Zi] = Zi−1. Moreover, suppose that with probability1− δ for all i: |Zi −Zi−1| ≤ ci, and always |Zi −Zi−1| ≤ bi. Then for all ε > 0,
Pr[|Zk −Z0| ≥ ε] ≤ 4
(exp
−ε2
32∑k
i=1 c2i
+ δ
k∑i=1
bi
ci
).
10.2.3 Group theory
In this chapter, we will analyze deterministic sensing matrices for which the columnsform a group G under pointwise multiplication. The multiplicative identity is the column1 with every entry equal to 1. The following property is fundamental.
lemma 10.1 If every row contains some entry not equal to 1, then the column groupG satisfies
∑g∈G g = 0.
Proof. Given a row i and an element fi = 1, we have
fi
(∑g
gi
)=∑
g
(figi) =∑
g
gi.
10.3 Support Vector Machines
Support vector machines (SVM’s) [13] is a linear threshold classifier in some featurespace, with maximum margin and consistent with the training examples. Any linearthreshold classifier w(x) corresponds to a vector w ∈ Rn such that w(x) = sign
(wx
);
as a result, we identify the linear threshold classifiers with their corresponding vectors.Also for simplicity we only focus on classifiers passing through the origin. The resultscan be simply extended to the general case.
Whenever the training examples are not linearly separable soft margin SVM’s areused. The idea is to simultaneously maximize the margin and minimize the empiricalhinge loss. More precisely let
H(x).= (1+x)+ = max0,1+x,

Finding needles in compressed haystacks 443
and let S.= 〈(x1, l1), . . . ,(xM , lM )〉 be a set of M labeled training data sampled i.i.d.
from some distribution D. For any linear classifier w ∈Rn we define its true hinge loss as
HD(w).= E(x,l)∼D
[(1− lwx
)+
],
and its empirical hinge loss
HS(w).= E(xi,li)∼S
[(1− liw
xi
)+
].
We also define the true regularization loss of a classifier w as
L(w).= HD(w)+
1
2C‖w‖2, (10.2)
where C is the regularization constant. The empirical regularization loss is similarlydefined to be
L(w).= HS(w)+
1
2C‖w‖2. (10.3)
Soft margin SVM’s then minimizes the empirical regularization loss which is a convexoptimization program.
The following theorem is a direct consequence of the convex duality, and we providea proof for completeness.
theorem 10.1 Let 〈(x1, l1), . . . ,(xM , lM )〉 be a set of M labeled training exampleschosen i.i.d. from some distribution D, and let w be the SVM’s classifier obtained byminimizing Equation (10.3). Then the SVM’s classifier can be represented as a linearcombination of the training examples, i.e., w =
∑Mi=1 silixi, with ‖w‖2 ≤C. Moreover,
for all i ∈ [M ] : 0 ≤ si ≤C
M.
Proof. The optimization problem of Equation (10.3) can be written as
minimize1
2‖w‖2+
C
M
M∑i=1
ξi such that: (10.4)
∀ i : ξi ≥ 0
∀ i : ξi ≥ 1− liwxi.
We form the Lagrangian of the above optimization problem by linearly combining theobjective function and the constraints
L(w,ξ,s,η) =1
2‖w‖2 +
C
M
M∑i=1
ξi +
M∑i=1
si(1− liwxi − ξi)−
M∑i=1
ηiξi. (10.5)
By writing the KKT conditions, we obtain the following conditions for the saddle pointof the Lagrangian function:

444 Robert Calderbank and Sina Jafarpour
• The optimal classifier is a linear combination of the training examples:
w−M∑i=1
silixi = 0.
• The optimal dual variables si and ηi are all non-negative.• For every index i we have C
M − si − ηi = 0, which implies that si ≤ CM .
Therefore, the dual program can be written as
maximizeM∑i=1
si −1
2
M∑i,j=1
sisj liljxixj
s.t. ∀ i ∈ [M ] : 0 ≤ si ≤C
M.
Finally we show that the SVM’s classifier has bounded 2 norm. We have
1
2‖w‖2 ≤ 1
2‖w‖2 +
C
M
M∑i=1
ξi =
M∑i=1
si −1
2‖w‖2 ≤ C − 1
2‖w‖2,
where the first inequality follows from the positivity of the hinge loss, the next equalityfollows from the equality of the optimal primal value and the optimal dual value forconvex programs and the fact that the optimal classifier is a linear combination of thetraining examples, and the last inequality follows from the fact that for every index i,si ≤ C
M .
In order to analyze the performance of the SVM’s classifiers, we will use the followingCorollary of Theorem 10.1:
corollary 10.1 Let w be the soft margin SVM’s optimizer of Equation (10.3). Thenw is in the C-convex hull of the feature space, which is defined as:
CHC(X ).=
n∑
i=1
tixi : n ∈ N,xi ∈X ,
n∑i=1
|ti| ≤ C
.
Throughout this chapter, we will use the following oracle model to analyze the per-formance of the SVM’s classifiers. As before, let X denote the feature space, and letD be some distribution over X . We assume that there exists a linear threshold clas-sifier w0 ∈ Rn that has large margin and hence small norm ‖w0‖, and whose trueregularization loss achieves a low generalization error (expected hinge loss). For eachregularization parameter C, we also define w∗ .
= argminLD(w). It follows from thedefinition that LD(w∗) ≤ LD(w0). To compare the true hinge loss of the SVM’s clas-sifiers with the true hinge loss of the oracle classifier w0, we use the following theoremby Sridharan et al. [14].

Finding needles in compressed haystacks 445
theorem 10.2 Let X be the feature space, and suppose D is some distribution overX . Let
S.= 〈(x1, l1), . . . ,(xM , lM )〉
denote M labeled training data sampled i.i.d. from D. Then, for every linear thresholdclassifier w with ‖w‖2 ≤ 2C, with probability at least 1 − δ over training set S thefollowing holds:
LD(w)−LD(w∗) ≤ 2[LS(w)− LS(w∗)
]+
+8R2C log( 1
δ )
M. (10.6)
10.4 Near-isometric projections
Given a distribution D over the n-dimensional feature space X , the goal of the SVM’slearner is to approximate the best large margin linear threshold classifier from i.i.d. train-ing examples. However, as mentioned earlier, in many applications including compressedsensing and data streaming, the data is not directly represented in the feature space X ,and in contrast an m × n projection matrix A is used to transform the data to somem-dimensional space. In this section, we provide sufficient conditions (with respect toX ) that a projection matrix needs to satisfy to guarantee that the m-dimensional SVM’sclassifier has near-optimal generalization accuracy.
Here we allow A to be generated through a random process. However, following thestandard batch-learning paradigms, we shall assume that the process of generating theprojection matrix A is non-adaptive (i.e., independent of the choice of D). In this sectionwe assume no prior sparsity structure for the feature space X . The results provided hereare general and can be applied to any projection matrix that approximately preserves theinner products between instances of X . Later, in Section 10.6, we will show examplesof projection matrices satisfying the required conditions.
We also assume that the projection is noisy. In our analysis, for simplicity we assumethat every projection x → y is contaminated with a noise vector with bounded 2norm. That is y
.= Ax + e, with ‖e‖2 ≤ σR, where σ is a small number. We define
the measurement domain as
AX .= y = Ax+ e : x ∈X , ‖e‖2 ≤ σR.
Intuitively, a projection matrix A is appropriate for compressed learning if it approx-imately preserves the inner products (margins) between the training examples. First weprovide a formal definition of the above intuitive argument, and then we prove that ifa projection matrix satisfied this proposed property, then the SVM’s classifier learneddirectly in the measurement domain has the desired near-optimal performance.
Here we define the Distance-Preserving Property for a projection matrix, which wewill later use to prove that the SVM’s classifier in the measurement domain is close tooptimal.

446 Robert Calderbank and Sina Jafarpour
definition 10.1 ((M,L, ε,δ)-Distance Preserving Property) Let L be a positive num-ber greater than 1, let M be a positive integer, and suppose that ε and δ are small positivenumbers. Let S
.= 〈(x1, l1), . . . ,(xM , lM )〉denote a set of M arbitrary training examples.
Then the projection matrix A is (M,L, ε,δ)-Distance-Preserving ((M,L,ε,δM )−DP ),if with probability at least 1−δ (over the space of the projection matrices A) the followingconditions are all satisfied:
• (C1). For every x ∈X , ‖Ax‖2 ≤ L‖x‖2.• (C2). For every index i in [M ]: (1− ε)‖xi‖2 ≤ ‖yi‖2 ≤ (1+ ε)‖xi‖2.
• (C3). For every distinct indices i and j in [M ]:∣∣xi
xj − yiyj
∣∣≤ εR2.
Next we show that the Distance-Preserving Property is a sufficient condition to guar-antee that the SVM’s classifier trained directly in the measurement domain performsalmost as well as the best linear threshold classifier in the data domain. To this end, weneed to clarify more the notation used in the rest of this chapter.
We denote any classifier in the high-dimensional space by bold letter w, and anyclassifier in the low-dimensional space by bold letter z. Let w∗ be the classifier in thedata domain that minimizes the true regularization loss in the data domain, i.e.,
w∗ .= argw min L(w), (10.7)
and let z∗ be the classifier in the measurement domain that minimizes the trueregularization loss in the measurement domain, i.e.,
z∗ .= argz min L(z). (10.8)
Also let wS be the soft margin classifier trained with a training set S in the data domain,i.e.,
wS.= argw min L〈(x1,l1),...,(xM ,lM )〉(w),
and similarly zAS is the soft margin classifier trained with the compressed training setAS in the measurement domain:
zAS.= argz min L〈(y1,l1),...,(yM ,lM )〉(z).
Finally, let AwS be the classifier in the measurement domain obtained by projectingwS from the data domain to the measurement domain. Note that we will only use AwS
in our analysis to prove the generalization error bound for the zAS classifier.
theorem 10.3 Let L, M , ε, and δ be as defined in Definition 10.1. Suppose that theprojection matrix A is (M + 1,L, ε,δ)-Distance-Preserving with respect to the featurespace X . Let w0 denote the data-domain oracle classifier, and fix
C.=
√√√√√‖w0‖2
(3R2ε
2 +8(1+(L+σ)2) log( 1
δ )M
)2
,
Finding needles in compressed haystacks 447
as the SVM’s regularization parameter. Let S.= 〈(x1, l1), . . . ,(xM , lM )〉 represent M
training examples in the data domain, and let AS.= 〈(y1, l1), . . . ,(yM , lM )〉 denote the
representation of the training examples in the measurement domain. Finally let zAS
denote the measurement domain SVM’s classifier trained on AS. Then with probabilityat least 1− 3δ,
HD(zAS) ≤ HD(w0)+O
R‖w0‖
√√√√(ε+
(L+σ)2log
( 1δ
)M
) . (10.9)
10.5 Proof of Theorem 10.3
In this section we prove that the Distance-Preserving Property provides fidelity for theSVM’s learning in the measurement domain. We use a hybrid argument to show that theSVM’s classifier in the measurement domain has approximately the same accuracy asthe best SVM’s classifier in the data domain. Theorem 10.1 together with the theory ofstructural risk minimization implies that if the data are represented in high-dimensionalspace, the high-dimensional SVM’s classifier wS has almost the same performance asthe best classifier w0. Then we show that if we project the SVM’s classifier wS to themeasurement domain, the true regularization loss of the classifier AwS is almost thesame as the true regularization loss of the SVM’s classifier wS in the high-dimensionaldomain. Again, we emphasize that we only use the projected classifier AwS in theanalysis. The compressed learning algorithm only uses its own learned SVM’s classifierfrom the measurement domain training examples.
To prove that the measurement domain SVM’s classifier is near-optimal, we first showthat if a matrix A is Distance-Preserving with respect to a training set S, then it alsoapproximately preserves the distances between any two points in the convex hull of thetraining examples. This property is then used to show that the distance (margin) betweenthe data-domain SVM’s classifier, and any training example is approximately preservedby the sensing matrix A.
lemma 10.2 Let M be a positive integer, and let D1 and D2 be two positive numbers.Let A be an m× n sensing matrix which is (M + 1,L, ε,δ)-Distance-Preserving withrespect to X . Let 〈(x1, l1), . . . ,(xM , lM )〉 denote M arbitrary elements of X , and let〈(y1, l1), . . . ,(yM , lM )〉 denote the corresponding labeled projected vectors. Then withprobability 1− δ the following argument is valid:
For every non-negative number s1, · · · ,sM , and t1, · · · , tM , with∑M
i=1 si ≤ D1, and∑Mj=1 tj ≤ D2, let
w1.=
M∑i=1
silixi, and w2 =
M∑i=1
tilixi, (10.10)
and similarly define
z1.=
M∑i=1
siliyi and z2.=
M∑i=1
tiliyi. (10.11)

448 Robert Calderbank and Sina Jafarpour
Then
|w1w2 − z1
z2| ≤ D1D2 R2ε.
Proof. It follows from the definition of z1 and z2, and from the triangle inequality that
∣∣z1z2 −w1
w2∣∣=
∣∣∣∣∣∣M∑i=1
M∑j=1
sitj lilj(yi
yj −xixj
)∣∣∣∣∣∣≤
M∑i=1
M∑j=1
sitj∣∣yi
yj −xixj
∣∣≤ εR2
(M∑i=1
si
) M∑j=1
tj
≤ D1D2R2 ε. (10.12)
Next we use Lemma 10.2 and the fact that the SVM’s classifier is in the C-convexhull of the training example to show that the margin and the true hinge loss of the SVM’sclassifier are not significantly distorted by the Distance-Preserving matrix A.
lemma 10.3 Let D be some distribution over the feature space X , and letS = 〈(x1, l1), . . . ,(xM , lM )〉 denote M i.i.d. labeled samples from D. Also let〈(y1, l1), . . . ,(yM , lM )〉 denote the corresponding labeled vectors in the measurementdomain. Let wS
.=∑M
i=1 silixi denote the data domain soft-margin SVM’s clas-sifier trained on S, and let AwS =
∑Mi=1 siliyi denote the corresponding linear
threshold classifier in the measurement domain. Suppose that the sensing matrix is(M + 1,L, ε,δ)-Distance-Preserving with respect to X . Then with probability 1 − δ,
LD(AwS) ≤ LD(wS)+3CR2ε
2.
Proof. Since the definition of the Distance-Preserving Property is independent of thechoice of D, first we assume that 〈(x1, l1), . . . ,(xM , lM )〉 are M fixed vectors in the datadomain. Let (xM+1, lM+1) be a fresh sample from D (which we will use in analyzing thetrue hinge loss of the measurement domain SVM’s classifier. Since A is (M +1,L, ε,δ)-Distance-Preserving, with probability 1− δ, it preserves the distances between any pairof points xi and xj (with i, j ∈ [M + 1]). By Theorem 10.1, the soft margin SVM’sclassifier is a linear combination of the support vectors, where each si is a positivenumber and
∑Mi=1 si ≤ C. As a result, using Theorem 10.2 with D1 = D2 = C yields
1
2C‖AwS‖2 ≤ 1
2C‖wS‖2 +
CR2ε
2. (10.13)
Now we show that dimensionality reduction using A does not distort the true hinge lossof wS significantly.Again, since A is (M +1,L, ε,δ)-Distance-Preserving, Lemma 10.2

Finding needles in compressed haystacks 449
with D1 = C and D2 = 1 guarantees that
1− lM+1(AwS)(yM+1) ≤ 1− lM+1wS xM+1 +CR2ε. (10.14)
Now as1− lM+1w
S xM+1 ≤
[1− lM+1w
S xM+1
]+
,
and since [1− lM+1w
S xM+1
]+
+CR2ε
is always non-negative, we have[1− lM+1(AwS)(yM+1)
]+ ≤
[1− lM+1w
S xM+1
]+
+CR2ε. (10.15)
Equation 10.15 is valid for each sample (xM+1, lM+1) with probability 1− δ over thedistribution of A. Now since the distribution of A is independent from D, we can takethe expectation of Equation (10.15) with respect to D, and we obtain the bound
HD(AwS) ≤ HD(wS)+CR2ε.
So far we have bounded the change in the regularization loss of the SVM’s classifierwS after projection via a Distance-Preserving matrix A. Next we show that the regular-ization loss of zAS , which is the classifier we can directly learn from the measurementdomain training examples, is close to the regularization loss of the linear threshold clas-sifier AwS . We use this to conclude that the regularization loss of zAS is close to theregularization loss of the oracle best classifier w∗ in the data domain. This completesour hybrid argument.
Proof of Theorem 10.3. From the definition of the regularization loss we have:
H(zAS) ≤ H(zAS)+1
2C‖zAS‖2 = L(zAS).
Since A is Distance-Preserving and every noise vector has bounded 2 norm σR, itfollows from the triangle inequality that
maxy
‖f‖2 = maxx,e
‖Ax+ e‖2 ≤ maxx
‖Ax‖2 +maxe
‖e‖2
≤ Lmaxx
‖x‖2 +maxe
‖e‖2 ≤ LR+σR.
Theorem 10.2 states that with probability 1 − δ, the regularization loss of the SVM’sclassifier in the measurement domain zAS , is close to the regularization loss of the bestclassifier in the measurement domain z∗:
LD(zAS) ≤ LD(z∗)+8(L+σ)2 R2C log( 1
δ )
M. (10.16)

450 Robert Calderbank and Sina Jafarpour
By the definition of z∗ in Equation (10.8), z∗ is the best classifier in the measurementdomain, so
LD(z∗) ≤ LD(AwS). (10.17)
Lemma 10.3 connects the regularization loss of the SVM’s classifier in the data domain,wS , to the regularization loss of its projected vector AwS . That is, with probability1− δ,
LD(AwS) ≤ LD(wS)+3CR2ε
2. (10.18)
Theorem 10.2 now applied in the data domain, connects the regularization loss of theSVM’s classifier wS to the regularization loss of the best classifier w∗:
Pr
[LD(wS) ≥ LD(w∗)+
8R2C log( 1δM+1
)
M
]≤ δ. (10.19)
From combining the inequalities of Equations (10.16) to (10.19), it follows that withprobability 1− 3δ
HD(zAS)≤HD(w∗)+1
2C‖w∗‖2+
3CR2ε
2+
8R2C log( 1δ )
M+
8(L+σ)2 R2C log( 1δ )
M.
Observe that for every choice of C, since w∗ is the minimizer of the true regularizationloss (with respect to that choice of C), we have LD(w∗) ≤ LD(w0); therefore, forevery choice of C with probability at least 1− 3δ
HD(zAS)≤HD(w0)+1
2C‖w0‖2+
3CR2ε
2+
8R2C log( 1δ )
M+
8(L+σ)2 R2C log( 1δ )
M.
(10.20)In particular, by choosing
C.=
√√√√√‖w0‖2
(3R2ε
2 +8(1+(L+σ)2) log( 1
δ )M
)2
,
which minimizes the right-hand side of Equation (10.6), we get:
HD(zAS) ≤ HD(w0)+O
R‖w0‖
√√√√(ε+
(L+σ)2 log( 1
δ
)M
) . (10.21)

Finding needles in compressed haystacks 451
10.6 Distance-Preserving via Johnson–Lindenstrauss Property
In this section, we introduce the Johnson–Lindenstrauss Property [15]. We also show howthis property implies the Distance-Preserving Property and also the Restricted IsometryProperty which is a sufficient property for compressed sensing. Throughout this sectionlet ε and ρ be two positive numbers with ε < 0.2, and as before, let k be an integer lessthan n.
definition 10.2 Let x1 and x2 denote two arbitrary vectors in the feature space X .Then A satisfies the (ε,ρ)-Johnson-Lindenstrauss Property ((ε,ρ)-JLP) if with probabil-ity at least 1−ρ, A approximates the distances between x1 and x2 up to a multiplicativedistortion ε:
(1− ε)‖x1 −x2‖2 ≤ ‖A(x1 −x2)‖2 ≤ (1+ ε)‖x1 −x2‖2. (10.22)
The Johnson–Lindenstrauss Property is now widely used in different applicationsincluding nearest-neighbor approximation [1, 2], data-streaming [3], machine learning[4, 5], graph approximation [6], and compressed sensing.
In this section, we show that matrices satisfying the JL Property are appropriate forcompressed learning as well. We start by showing that the JL Property provides sufficientconditions for worst-case compressed sensing:
definition 10.3 An m×n matrix A satisfies the (k,ε)-Restricted Isometry Property((k,ε)-RIP) if it acts as a near-isometry on every k-sparse vector x, i.e.,
(1− ε)‖x‖2 ≤ ‖Ax‖2 ≤ (1+ ε)‖x‖2.
The following theorem is proved by Baraniuk et al. [16], and relates the JL Propertyto the RIP:
theorem 10.4 Let A be an m×n sensing matrix satisfying (ε,ρ)-JLP. Then for every
positive integer k, with probability at least 1−(nk
)( 6√ε
)k
ρ, A is (k,5ε)-RIP.
Proof. First note that if a vector x is k-sparse, then the normalized vector x‖x‖2
is alsok-sparse. Furthermore, since the sensing operator A is linear, we have
A
(x
‖x‖2
)=
1
‖x‖2Ax.
Therefore, the matrix approximately preserves the norm of x if and only if it approxi-mately preserves the norm of x
‖x‖2. Hence, to prove that a matrix satisfies the RIP, it is
sufficient to show that A acts as a near-isometry on every k-sparse vector that has unitEuclidean norm.
Now fix a k-dimensional subspace. Here we denote the set of unit-norm vectors thatlie on that subspace by Xk. We calculate the probability that A approximately preserves

452 Robert Calderbank and Sina Jafarpour
the norm of every vector in Xk. Define
Q .=
q ∈Xk s.t. for all x ∈Xk,min
q∈Q‖x− q‖2 ≤
√ε
2
.
Also let ∆.= maxx∈Xk
‖Ax‖. A combinatorial argument can be used to show that one
can find a set Q of(
6√ε
)k
vectors in Xk, such that the minimum distance of any vector
x in Xk to Q is at most√
ε2 . The JL Property guarantees that with probability at least
1− |Q|ρ, A approximately preserves the norm of every point in Q. That is, for everyq ∈Q
(1− ε)‖q‖2 ≤ ‖Ax‖2 ≤ (1+ ε)‖x‖2,
and therefore,
(1−√
ε)‖q‖2 ≤ ‖Ax‖2 ≤ (1+√
ε)‖x‖2.
Let x be a vector in Xk, and let q∗ .= argminq∈Q ‖x− q‖2. It follows from the triangle
inequality, and from the definition of q∗ that
‖Ax‖2 ≤ ‖A(x− q∗)‖2 + ‖Aq∗‖2 ≤ ∆
√ε
2+(1+
√ε). (10.23)
Equation (10.23) is valid for every x ∈Xk. Therefore, we must have
∆ = maxx∈Xk
‖Ax‖2 ≤ ∆
√ε
2+ (1+
√ε),
and as a result,
∆ ≤ 1+
32
√ε
1−√
ε2
< 1+2√
ε.
Also from using the triangle inequality it follows that for every x ∈Xk
‖Ax‖2 ≥ ‖Aq∗‖2 −‖A(x− q∗)‖2 ≥ (1−√
ε)− (1+2√
ε)
√ε
2> (1− 2
√ε).
Consequently, with probability 1− |Q|ρ, for every vector x in the k-dimensional unitsphere Xk we have
(1− 2√
ε)‖x‖2 ≤ ‖Ax‖2 ≤ (1+2√
ε)‖x‖2,
which implies that
(1− 5ε)‖x‖2 ≤ ‖Ax‖2 ≤ (1+5ε)‖x‖2. (10.24)
Equation (10.24) proves that the probability that the sensing matrix A does not act as
a near-isometry on each fixed subspace is at most(
6√ε
)k
ρ. Since there are(nk
)total

Finding needles in compressed haystacks 453
k-dimensional subspaces, it follows from taking the union bound over all(nk
)subspaces
that with probability at least 1−(nk
)( 6√ε
)k
ρ, A is (k,5ε)-RIP.
The following proposition is a consequence of the RIP property and is proved byNeedell and Tropp [17]. It provides an upper bound for the Lipschitz constant of amatrix satisfying the RIP. We will later use this Proposition to prove that matrices thatsatisfy the JL Property are Distance-Preserving.
proposition 10.3 Let A be a (k,5ε)-RIP sensing matrix. Then for every vectorx ∈ Rn the following bound holds:
‖Ax‖2 ≤√
1+5ε‖x‖2 +
√1+5ε
k‖x‖1.
The RIP property is a sufficient condition for sparse recovery. It has been shownby Candès, Romberg, and Tao [18, 19] that if a matrix satisfies the RIP property withsufficiently small distortion parameter ε, then one can use convex optimization methodsto estimate the best k-term approximation of any vector x ∈ Rn. Now we show that amatrix that satisfies the JL Property is Distance-Preserving. Therefore, it follows fromTheorem 10.3 that if a matrix satisfies the JL Property then the SVM’s classifier in themeasurement domain is almost optimal.
In the rest of this section, we assume that ε1 and ε2 are two positive numbers lessthan 0.2, and ρ1 and ρ2 are two positive numbers less than one. We will assume thatthe sensing matrix satisfies both the (ε1,ρ1)-JL Property (which is used to show that A
approximately preserves the regularization loss of the data domain SVM’s classifier),and the (ε2,ρ2)-JL Property (which is used to show that A satisfies RIP). Potentially, ε1
can be significantly smaller than ε2. The reason is that ε2 only appears in the Lipschitzbound of the sensing matrix A, whereas ε1 controls the distortion of the regularizationloss of the SVM’s classifier.
lemma 10.4 Let M be a positive integer, and let A be the m×n sensing matrix. Thenfor every integer k, A is (M +1,L, ε,δ)-Distance-Preserving matrix with respect to Xwith
L =√
1+5ε2
(1+
2→1(X )√k
),
ε =(3ε1 +4σ +σ2) ,
δ =
(M +2
2
)ρ1 +
(n
k
)(6
√ε1
)k
ρ2.
Proof. We show that the matrix A satisfies all three conditions of Definition 10.1.Proof of Condition (C1): (For every x ∈X , ‖Ax‖2 ≤ L‖x‖2.)
Theorem 10.4 states that for every integer k, with probability at least 1−(nk
)( 6√ε1
)k
ρ2,
A is (k,5ε2)-RIP. Therefore, it follows from Proposition 10.3, and from the definition

454 Robert Calderbank and Sina Jafarpour
of 2→1 (Equation (10.1)), that with the same probability, for every vector x in X
‖Ax‖2 ≤√
1+5ε2
(1+
2→1(X )√k
)‖x‖2.
Therefore A is L-Lipschitz with respect to X with L =√
1+5ε2
(1+
2→1(X )√k
).
Proof of Conditions (C2) and (C3):
• (C2). For every index i in [M +1]: (1− ε)‖xi‖2 ≤ ‖yi‖2 ≤ (1+ ε)‖xi‖2.
• (C3). For every distinct indices i and j in [M +1]:∣∣xi
xj − yiyj
∣∣≤ εR2.
Let 0 denote the n-dimensional all-zero vector. Since A satisfies the (ε1,ρ1)-JL Prop-erty, with probability 1− ρ1 it preserves the distances between two fixed vectors. Herewe apply the union bound to the set of all
(M+2
2
)pairs of vectors selected from the
set 〈0,x1, . . . ,xM+1〉. It follows from the union bound that with probability at least1−
(M+2
2
)ρ1 the following two statements hold simultaneously:
1. For every index i ranging in [M +1] :
(1− ε1)‖xi‖2 ≤ ‖Axi‖2 ≤ (1+ ε1)‖xi‖2.
2. For every pair of indices i and j in [M +1] :
(1− ε1)‖xi −xj‖2 ≤ ‖A(xi −xj)‖2 ≤ (1+ ε1)‖xi −xj‖2.
Now let i and j be any two fixed indices in [M +1]. We have
‖A(xi −xj)‖2 ≤ (1+ ε1)‖xi −xj‖2 (10.25)
= (1+ ε1)(‖xi‖2 + ‖xj‖2 − 2xi
xj
).
Also
(1− ε1)(‖xi‖2 + ‖xj‖2)− 2(Axi)
(Axj) ≤ ‖Axi‖2 + ‖Axj‖2 − 2(Axi)(Axj)
= ‖A(xi −xj)‖2. (10.26)
Combining Equations (10.25) and (10.26), and noting that ‖xi‖ ≤ R and ‖xj‖ ≤ R, weget
(1+ ε1)xixj ≤ (Axi)
(Axj)+2R2ε1, (10.27)
which implies that
xixj − (Axi)
(Axj) ≤ ε1(2R2 +xi
xj
)≤ 3R2ε1.

Finding needles in compressed haystacks 455
Similarly, we can show that
(Axi)(Axj)−xi
xj ≤ 3R2ε1.
Therefore ∣∣xixj − (Axi)
(Axj)∣∣≤ 3R2ε1. (10.28)
Having identified the difference between xixj and (Axi)
(Axj) we now use thetriangle inequality to calculate the distance between xi
xj and yiyj . Recall that yi
.=
Axi + ei and yj.= Axj + ej , with ‖ei‖2 ≤ σR and ‖ej‖2 ≤ σR. From the triangle
inequality we get∣∣xixj − yi
yj
∣∣= ∣∣∣xixj − (Axi + ei)
(Axj + ej)
∣∣∣≤∣∣xi
xj − (Axi)(Axj)
∣∣+ |ei(Axj)|+ |(Axi)
ej |+ |eiej |
≤∣∣xi
xj − (Axi)(Axj)
∣∣+2‖xj‖‖ei‖+2‖xi‖‖ej‖+ ‖ei‖‖ej‖
≤ 3R2ε1 +4R2σ +R2σ2 = R2 (3ε1 +4σ +σ2) .
Next we prove that if a sensing matrix is Distance-Preserving then the performanceof the SVM’s classifier in the measurement domain is close to the performance of thedata domain SVM’s.
theorem 10.5 Let w0 denote the data-domain oracle classifier. Let S.=
〈(x1, l1), . . . ,(xM , lM )〉 represent M training examples in the data domain, and letAS
.= 〈(y1, l1), . . . ,(yM , lM )〉 denote the representation of the training examples in the
measurement domain. Finally let zAS denote the measurement domain SVM’s classifiertrained on AS. Then for every integer k, if
ρ1 ≤ 1
6
(M +2
2
)−1
and ρ2 ≤ 1
6
[(n
k
)(6
√ε1
)k]−1
,
then with probability at least 1− 3
[(nk
)( 6√ε1
)k
ρ2 +(M+2
2
)ρ1
],
HD (zAS) ≤ HD(w0) (10.29)
+O
R‖w0‖
√√√√√ε1 +σ +
(1+ ε2)(1+ 2→1(X )√
k
)2log
((nk
)(6√ε1
)k
ρ2 +(
M+22
)ρ1
)−1
M
.
Proof. The proof of Theorem 10.5 follows from inserting the values of L,ε, and ρ fromLemma 10.4 into Theorem 10.3.

456 Robert Calderbank and Sina Jafarpour
10.7 Worst-case JL Property via random projection matrices
10.7.1 Johnson–Lindenstrauss and random sensing
So far we have shown that if a projection matrix satisfies the Johnson–LindenstraussProperty, then that matrix can be used for compressed learning. Now we provide exam-ples of projection matrices satisfying the Johnson–Lindenstrauss Property. The followingtheorem is proved by Dasgupta and Gupta [20], and by Indyk and Motwani [21], and guar-antees that random Gaussian (or sub-Gaussian) projection matrices satisfy the desiredJL Property.
proposition 10.4 Let A be an m×n projection matrix whose entries are sampledi.i.d. from a N
(0, 1
m
)Gaussian distribution. Let ε be a positive real number, and let x1
and x2 be two fixed vectors in Rn. Then with probability at least 1−2exp−mε2
4
, A
approximately preserves the distance between x1 and x2.
(1− ε)‖x1 −x2‖2 ≤ ‖A(x1 −x2)‖2 ≤ (1+ ε)‖x1 −x2‖2.
By combining Proposition 10.4 and Theorem 10.5 we obtain the following corollariesfor Gaussian projection matrices.
corollary 10.2 Let X represent the sphere of radius R in Rn, and let A be them×n-dimensional Gaussian projection matrix. Let D be some distribution over X , andlet w0 denote the data-domain oracle classifier. Suppose S
.= 〈(x1, l1), . . . ,(xM , lM )〉
represent M training examples in the data domain, and AS.= 〈(y1, l1), . . . ,(yM , lM )〉
denote the representation of the training examples in the measurement domain. LetzAS denote the measurement domain SVM’s classifier trained on AS. Then there existuniversal constants κ1 and κ2, such that for every integer k, if
m ≥ κ1
(logM
ε21
+k log n
k
ε22
),
then with probability at least 1− 6[exp
−κ2mε2
1
+exp−κ2mε2
2]
,
HD(zAS) ≤ HD(w0)+O
(R‖w0‖
√ε1 +σ +
(1+ ε2)nmε21
kM
). (10.30)
Proof. Here the feature space X contains every point inside the sphere with radius R.Therefore, it follows from the Cauchy-Schwarz inequality that 2→1(X ) ≤
√n. More-
over, from applying Proposition 10.4 it follows that the projection matrix satisfies the
both the(ε1,2exp
−mε2
14
)-JL Property, and the
(ε2,2exp
−mε2
24
)-JL Property.
Now observe that since
log
[(n
k
)(6
√ε1
)k]
= O(k log
n
k
)and log
[(M +2
2
)]= O (logM) ,

Finding needles in compressed haystacks 457
there exist sufficiently large universal constants κ1 and κ2, such that if mε21 ≥ κ1 logM ,
and mε22 ≥ κ1
(k log n
k
), then
2
(n
k
)(6
√ε1
)k
exp
−mε2
2
4
+
(M +2
2
)exp
−mε2
1
4
= 2
[exp
−κ2mε2
1
+exp−κ2mε2
2]
.
The result then follows directly from Theorem 10.5.
corollary 10.3 Let X represent the union of all k-sparse vectors x in Rn restrictedto the sphere of radius R. Let D be some distribution over X , and let w0 denotethe data-domain oracle classifier. Suppose S
.= 〈(x1, l1), . . . ,(xM , lM )〉 represent M
training examples in the data domain, and AS.= 〈(y1, l1), . . . ,(yM , lM )〉 denote the rep-
resentation of the training examples in the measurement domain. Finally let zAS denotethe measurement domain SVM’s classifier trained on AS. Then there exist universalconstants κ′
1 and κ′2 (independent of k), such that if
m ≥ κ1
(logM
ε21
+k log n
k
ε22
),
then with probability at least 1− 6[exp
−κ′
2mε22
+exp−κ′
2mε21]
,
HD(zAS) ≤ HD(w0)+O
(R‖w0‖
√ε1 +σ +
(1+ ε2)mε21
M
). (10.31)
Proof. The proof of Corollary 10.3 is aligned with the proof of Corollary 10.2. The onlydifference is that now every vector in the feature spaceX is exactlyk-sparse. The Cauchy-Schwarz inequality implies that for every k-sparse vector x in X , ‖x‖1 ≤
√k‖x‖2.
Therefore, 2→1(X ) ≤√
k.
remark 10.1 Corollary 10.3 states that if it is known a priori that every vector in thefeature space is exactly k-sparse, then the number of training examples needed to obtaina fixed hinge loss can be decreased significantly. In other words, prior knowledge ofsparsity can facilitate the learning task and can be helpful not only from a compressedsensing point of view, but also from a machine learning perspective.
remark 10.2 Note that a larger value for m leads to lower distortion parameter ε1,
and provides lower classification error. In particular, by setting ε1 =
√logM
m we get
HD(zAS) ≤ HD(w0)+ O
((logM
m
) 14
+
(logM
M
) 12
+σ12
).
Finally note that here we only focused on random Gaussian matrices as examples ofmatrices satisfying the JL Property. However, there exist other families of random pro-jection matrices satisfying the desired JL Property. Examples of such matrices are Sparse
458 Robert Calderbank and Sina Jafarpour
Johnson–Lindenstrauss Transform [22, 23], and Fast Johnson–Lindenstrauss Transform[24] and its variations based on dual BCH-codes [25], Lean Walsh Transform [26], andFast Fourier Transform [27]. (See [28] for the explanation of the other matrices with JLProperty.)
remark 10.3 Note that the use of random projection in dimensionality reductionwas discovered even before the start of the compressed sensing field. The results ofthis section were based on a series of past work [29, 30, 31, 32] (see the referencestherein), and tightens and generalizes them based on the new results in learning theoryand stochastic optimization. Interestingly, the JL Property unifies the compressed sensingand compressed sensing tasks. If a matrix satisfies the JL Property, then not only themeasurement domain SVM’s classification is close to optimal, but it is also possible tosuccessfully reconstruct any desired data point efficiently.
10.7.2 Experimental results
Here we provide experimental results supporting the results of the previous section. Herewe fixed n = 1024, and m = 100, and analyzed the impact of changing the sparsity levelk, and the number of training examples M on the average test error of the measurementdomain classifier. At each experiment, we repeated the following process 100 timesindependently. First, we generated an i.i.d. 100×1024 Gaussian matrix. Then we selecteda random k-subset of the columns of the matrix and generated M training examplessupported on the random k-subset and with independent random signs. Finally we usedthe inverse wavelet transform and transformed the training examples to the inversewavelet domain.
We also generated a uniformly random vector w0 ∈ Rn, and used the sign of theinner-product between each training example and w0 as the label of the correspondingtraining example. The training examples were projected to the measurement domainusing the random Gaussian matrix, and then an SVM’s classifier was trained directly inthe measurement domain. We used the 3-fold cross-validation to evaluate the accuracyof the trained classifier.
Figure 10.1(a) shows the dependency between the sparsity level (in the waveletdomain) of the training examples and the average cross-validation error of the SVM’sclassifier in the measurement domain. The average cross-validation of the data domainSVM’s classifier is also provided for comparison. As shown in Figure 10.1(a), the errorrate of the measurement domain SVM’s classifier is very close to the error rate of the data-domain SVM’s. Also note that as k increases the cross-validation error also increases.This is not surprising recalling the curse of dimensionality. Figure 10.1(b) demonstratesthe impact of increasing the number of training examples on the cross-validation error ofthe SVM’s classifiers. Again it turns out that the error of the measurement domain SVMsis close to the error of the data-domain SVM’s. Also as predicted in theory, by increas-ing the number of training examples M , the cross-validation error rate consistentlydecreases.

Finding needles in compressed haystacks 459
5 10 15 20 25 30 35 40 45 500
5
10
15
20
25
Sparsity (k)
Ave
rage
cro
ss−v
alid
atio
n er
ror
(%)
n=1024, m=100, M=100
Data DomainMeasurement Domain
(a) The impact of the sparsity level on the average cross-validation error.
20 40 60 80 100 120 140 160 180 2000
5
10
15
20
25
30
35
Number of training examples (M)
Ave
rage
cro
ss−v
alid
atio
n er
ror
(%)
n=1024, m=100, k=20
Data DomainMeasurement Domain
(b) The impact of the number of training examples onthe average cross-validation error.
Figure 10.1 A comparison between the cross-validation errors of data-domain and measurement-domainSVM’s classifiers. Here a 100× 1024 Gaussian projection matrix is generated and the 3-foldcross-validation is used to measure the cross-validation error.

460 Robert Calderbank and Sina Jafarpour
10.8 Average-case JL Property via explicit projection matrices
10.8.1 Global measures of coherence
Let A be an m×n matrix such that every column of A has unit 2 norm. The followingtwo quantities measure the coherence between the columns of A [33]:
• Worst-case coherence µ.= maxi,j∈[n]
i=j
∣∣∣AiAj
∣∣∣.• Average coherence ν
.= 1
n−1 maxi∈[n]
∣∣∣∣∑j∈[n]j =i
AiAj
∣∣∣∣.Roughly speaking, we can consider the columns of A as n distinct points on the unitsphere in Rn. Worst-case coherence then measures how close two distinct points can be,whereas the average coherence is a measure of the spread of these points.
remark 10.4 The Welch bound [34] states that if all the columns of a matrix A haveunit 2 norm, then unless m = Ω(n), the worst-case coherence of A cannot be too small,
i.e., µ = Ω(
1√m
).
10.8.2 Average-case compressed learning
In Section 10.7, we showed how random sensing matrices can be used in worst-casecompressed learning in which the data lie on arbitrary k-dimensional subspaces. In thissection, we focus on average-case compressed learning. Our goal is to show that thereexist explicit sensing matrices A which are suitable for average-case compressed sensing,i.e., when the signals are supported on a random k-dimensional subspace. Therefore, theresults of this section work for most (in contrast to all) k-sparse vectors.
Here we assume that the feature space is restricted to a random k-dimensional sub-space. Let Πk
1 denote a random k-subset of [n]. The feature space, denoted as XΠk1
is
then the set of all k-sparse vectors x in Rn, with supp(x) = Πk1 , and with ‖x‖2 ≤ R.
We will show that there exist deterministic sensing matrices which act as near-isometryon the feature space XΠk
1.
We start by using the following proposition which is proved by Tropp [34] to showthat a large family of explicit sensing matrices are Lipschitz with respect to the featurespace XΠk
1.
proposition 10.5 There exists a universal constant C such that for every η > 1 andevery positive ε, the following argument holds. Suppose that the m×n sensing matrixA satisfies the conditions
‖A‖2 =n
mand µ ≤ ε
2Cη logn,

Finding needles in compressed haystacks 461
let Πk1 denote a random k-subset of [n] with k ≤ mε2
(2Cη)2 logn , and let AΠk1
denote the
submatrix of A whose columns are restricted to Πk1 . Then
Pr[∥∥∥A†
Πk1AΠk
1− I
∥∥∥2≥ ε
]≤ 1
nη.
We can use Proposition 10.5 to argue that if the sensing matrix is a tight-frame withredundancy n
m , and if the columns of the sensing matrix are sufficiently low coherent,then with overwhelming probability A is Lipschitz with respect to the feature space XΠk
1.
Now we show that if the sensing matrix has sufficiently low µ and ν, then withoverwhelming probability A approximately preserves the distances between any twovectors in XΠk
1which have arbitrary (but fixed) values.
10.8.3 Two fundamental measures of coherence and their role in compressed learning
We first show that a random k-subset of the columns of A is highly uncorrelated withany remaining column:
lemma 10.5 Let ε1 be a positive number, and let k be a positive integer such thatk ≤ min
n−1
2 , ε21 ν−2
. Let Πk1 be a random k-subset of [n]. Let x be a k-sparse vector
with fixed values such that supp(x) = Πk1 . Then
PrΠ
[∃W ∈ [n]−Πk
1 s.t
∣∣∣∣∣k∑
i=1
xiAWAΠi
∣∣∣∣∣≥ 2ε1‖x‖2
]≤ 4nexp
−ε21
128µ2
, (10.32)
and
PrΠ
∃j ∈ [k]s.t
∣∣∣∣∣∣∣∣∑i∈[k]i=j
xiAΠj
AΠi
∣∣∣∣∣∣∣∣≥ 2ε1‖x‖2
≤ 4k exp
−ε21
128µ2
. (10.33)
Proof. See Section 10.9.1.
Throughout the rest of this section, assume that the projection matrix A is a tight-frame with redundancy n
m . Also let M be a positive integer (which we use to denotethe number of training examples), and define,θM
.= 128
√2log(64n4M2). Furthermore,
assume that ε2 and ε3 are two positive numbers with ε2 ≤ µθM
16 .
Here we show that if the sparsity levelk is O(min
n
23 , µ
ν
), then with overwhelming
probability, the Euclidean norm of a vector x in XΠk1
is distorted by at most (1±ε), whereε = O (µ(logn+logM)).
theorem 10.6 Let
k ≤ min
(nθM
96
) 23
, ε22ν−2,
(µθM
96ν
)2
, ε3ν−1
, (10.34)

462 Robert Calderbank and Sina Jafarpour
and let x be a k-sparse vector in XΠk1. Then
PrΠk
1
[∣∣‖Ax‖2 −‖x‖2∣∣≥ 2ε3‖x‖2]≤ 4exp
−ε23
32µ2θ2M
+32k2nexp
−ε22
128µ2
.
Proof. See Section 10.9.2.
The following Corollary is a direct consequence of Theorem 10.6.
corollary 10.4 There exists a constant κ such that if k ≤ min
n23 , µ
ν
, then for
any x ∈XΠk1, the following holds
PrΠk
1
[∣∣‖Ax‖2 −‖x‖2∣∣≥ κµ logn‖x‖2]≤ 1
n.
Proof. The proof follows from Theorem 10.6. Set ε2 = µθM
16 and ε3 =
4√
2log(8n)µθM . Since θM > 128 we have ε2 > µ, and ε3 > µ. Therefore, to sat-
isfy Equation (10.34), it is sufficient to have k ≤min
n23 ,(
µν
)2, µ
ν
. Now observe that
from the definition of µ and ν, µν is always less than or equal to
(µν
)2. Therefore
k ≤ min
n23 ,
µ
ν
is a sufficient condition for Equation 10.34. Theorem 10.6 now guarantees that
PrΠk
1
[∣∣‖Ax‖2 −‖x‖2∣∣≥ 8
√2log(8n)µθM‖x‖2
]≤ 4
8n+
32k2n
64n4 ≤ 1
n.
remark 10.5 Corollary 10.4 can be applied to any matrix and in particular to matriceswith optimal coherence properties including matrices based on binary linear codes (seeSection 10.8.4).
Proposition 10.5 states that if the projection matrix is a low coherent tight-frame, thenwith overwhelming probability A is Lipschitz with respect to a random k-subspace XΠk
1.
Theorem 10.6 guarantees that if the projection matrix also has sufficiently small average-coherence, then it satisfies the Johnson–Lindenstrauss Property with respect to the samefeature space. Therefore, we can use Lemma 10.4 to guarantee that with overwhelmingprobability A is Distance-Preserving with respect to XΠk
1.
lemma 10.6 There exists a universal constant C such that for every η ≥ 1, if theconditions
µ ≤ ε1
2Cη logn,and k ≤ min
mε2
1
(2Cη)2 logn,
(nθM
96
) 23
, ε22ν−2,
(µθM
96ν
)2
, ε3ν−1

Finding needles in compressed haystacks 463
hold simultaneously, then A is (M +1,L, ε,δ)-Distance-Preserving with respect to thefeature space XΠk
1, with
L =√
1+ ε1,
ε =(6ε3 +4σ +σ2) ,
δ = 4
(M +2
2
)[exp
−ε23
32µ2θ2M
+32k2nexp
−ε22
128µ2
]+
1
nη.
Proof. Since XΠk1
is k-dimensional, 2→1(XΠk1) ≤
√k. The proof now follows from
substituting the value of L from Proposition 10.5, and the values of ε and δ fromTheorem 10.6 into Lemma 10.4.
We now use Theorem 10.3 to bound the difference in the true hinge loss of the SVM’sclassifier in the measurement domain and the SVM’s classifier in the data domain.
theorem 10.7 Let w0 denote the data-domain oracle classifier. Also let S.=
〈(x1, l1), . . . ,(xM , lM )〉 represent M training examples in the data domain, and letAS
.= 〈(y1, l1), . . . ,(yM , lM )〉 denote the representation of the training examples in the
measurement domain. Finally let zAS denote the measurement domain SVM’s classifiertrained on AS. Then there exists a universal constant C such that for every η ≥ 1 if theconditions
µ ≤ ε1
2Cη logn,and k ≤ min
mε2
1
(2Cη)2 logn,
(nθM
96
) 23
, ε22ν−2,
(µθM
96ν
)2
, ε3ν−1
hold simultaneously, then with probability 1− 3δ, where
δ.=
(M +2
2
)[4exp
−ε23
32µ2θ2M
+128k2nexp
−ε22
128µ2
]+
1
nη,
the following holds
HD(zAS) ≤ HD(w0)+O
R‖w0‖
√√√√(ε3 +σ +
(1+ ε1) log( 1
δ
)M
) . (10.35)
Proof. The proof follows from substituting the values of L, ε, and δ from Lemma 10.6into Theorem 10.3.
corollary 10.5 Under the conditions of Theorem 10.7, if k ≤ min
mε21
(2Cη)2 logn ,
n23 , µ
ν
, then with probability at least 1− 6
n the following holds
HD(zAS) ≤ HD(w0)+O
(R‖w0‖
√(µ (logM +logn)+σ +
(1+ ε1) logn
M
)).
(10.36)

464 Robert Calderbank and Sina Jafarpour
Proof. Corollary 10.4 proves that k ≤ min
n23 , ν
µ
is a sufficient condition for k ≤
min
(nθM
96
) 23 , ε22ν
−2,(
µθM
96ν
)2, ε3ν
−1
. Now it follows from Theorem 10.7 (with η =
1) that it is sufficient to guarantee that(M +2
2
)[4exp
−ε23
32µ2θ2M
+128k2nexp
−ε22
128µ2
]+
1
n≤ 2
n. (10.37)
In order to satisfy the requirement of Equation (10.37), it is sufficient to ensure that thefollowing two equalities hold simultaneously:
ε2332µ2θ2
M
= log(4n(M +2)(M +1)) , andε22
128µ2 = log(128n2(M +2)(M +1)
).
(10.38)Consequently, since√
θ2M log [4n(M +2)(M +1)] = O (logM +logn) ,
there exists a universal constant κ such that if ε3 ≥ κµ(logM +logn) then δ ≤ 2n .
10.8.4 Average-case Distance-Preserving using Delsarte–Goethals frames
10.8.4.1 Construction of the Delsarte–Goethals framesIn the previous section, we introduced two fundamental measures of coherence betweenthe columns of a tight-frame, and showed how these parameters can be related to theperformance of the SVM’s classifier in the measurement domain. In this section weconstruct an explicit sensing matrix (Delsarte–Goethals frame [35, 36]) with sufficientlysmall average coherence ν, and worst-case coherence µ. We start by picking an oddnumber o. The 2o rows of the Delsarte–Goethals frame A are indexed by the binaryo-tuples t, and the 2(r+2)o columns are indexed by the pairs (P,b), where P is an o× o
binary symmetric matrix in the Delsarte–Goethals set DG(o,r), and b is a binary o-tuple.The entry a(P,b),t is given by
a(P,b),t =1√m
iwt(dP )+2wt(b)itP t+2bt(10.39)
where dp denotes the main diagonal of P , and wt denotes the Hamming weight (thenumber of 1s in the binary vector). Note that all arithmetic in the expressions tP t+2bt
and wt(dP ) + 2wt(b) takes place in the ring of integers modulo 4, since they appearonly as exponents for i. Given P and b, the vector tP t + 2bt is a codeword in theDelsarte–Goethals code. For a fixed matrix P , the 2o columns A(P,b) (b ∈ Fo
2) form anorthonormal basis ΓP that can also be obtained by postmultiplying the Walsh–Hadamard
basis by the unitary transformation diag[itP t
].
The Delsarte–Goethals set DG(o,r) is a binary vector space containing 2(r+1)o binarysymmetric matrices with the property that the difference of any two distinct matrices has

Finding needles in compressed haystacks 465
rank at least o− 2r (see [37]). The Delsarte–Goethals sets are nested
DG(o,0) ⊂ DG(o,1) ⊂ ·· · ⊂ DG
(o,
(o− 1)
2
).
The first set DG(o,0) is the classical Kerdock set, and the last set DG(o, (o−1)2 ) is
the set of all binary symmetric matrices. The rth Delsarte–Goethals sensing matrix isdetermined by DG(o,r) and has m = 2o rows and n = 2(r+2)o columns.
Throughout the rest of this section let 1 denote the all-one vector. Also let Φ denotethe unnormalized DG frame, i.e., A = 1√
mΦ. We use the following lemmas to show
that the Delsarte–Goethals frames are low-coherence tight-frames. First we prove thatthe columns of the rth Delsarte–Goethals sensing matrix form a group under pointwisemultiplication.
lemma 10.7 Let G = G(o,r) be the set of unnormalized columns Φ(P,b) where
φ(P,b),t = iwt(dP )+2wt(b)itP t+2bt, where t ∈ Fo
2
where b∈Fo2 and where the binary symmetric matrixP varies over the Delsarte–Goethals
set DG(o,r). Then G is a group of order 2(r+2)o under pointwise multiplication.
Proof. The proof of Lemma 10.7 is based on the construction of the DG frames, andis provided in [38].
Next we bound the worst-case coherence of the Delsarte–Goethals frames.
theorem 10.8 Let Q be a binary symmetric o× o matrix from the DG(o,r) set, andlet b ∈ Fo
2. If S.=∑
t itQt+2bt
, then either S = 0, or
S2 = 2o+2riv1Qv1 +2bv
1 , where v1Q = dQ.
Proof. We have
S2 =∑t,u
itQt+uQu+2b(t+u)=∑t,u
i(t⊕u)Q(t⊕u)+2tQu+2b(t⊕u).
Changing variables to v = t⊕u and u gives
S2 =∑
v
ivQv+2bv ∑u
(−1)(dQ+vQ)u.
Since the diagonal dQ of a binary symmetric matrix Q is contained in the row space ofQ there exists a solution for the Equation vQ = dQ. Moreover, since Q has rank at leasto−2r, the solutions to the Equation vQ = 0 form a vector space E of dimension at most2r, and for all e,f ∈ E
eQe + fQf = (e+ f)Q(e+ f) (mod 4).

466 Robert Calderbank and Sina Jafarpour
Hence
S2 = 2o∑e∈E
i(v1+e)Q(v1+e)+2(v1+e)b= 2oiv1Qz
1 +2v1b ∑e∈E
ieQe+2eb.
The map e → eQe is a linear map from E to Z2, so the numerator eQe +2eb alsodetermines a linear map from E to Z2 (here we identify Z2 and 2Z4). If this linear mapis the zero map then
S2 = 2o+2riv1Qv1 +2bv
1 ,
and if it is not zero then S = 0.
corollary 10.6 Let A be an m × n DG(o,r) frame whose column entries aredefined by (10.39). Then µ ≤ 2r
√m
.
Proof. Lemma 10.7 states that the columns of the unnormalized DG frame form a groupunder pointwise multiplication. Therefore, the inner product between any two columnsof this matrix is another column sum. Consequently, we have
µ = maxi=j
∣∣∣A†iAj
∣∣∣= 1
m≤ max
i=j
∣∣∣Φ†iΦj
∣∣∣≤ 1
m= max
i=1
∣∣∣Φ†i1
∣∣∣≤ √2o+2r
m=
2r
√m
.
lemma 10.8 Let A be a DG(o,r) frame with m = 2o, and n = 2(r+2)o. Then ν = 1n−1 .
Proof. We have
ν.= max
i
1
n− 1
∣∣∣∣∣∣∑j =i
Ai Aj
∣∣∣∣∣∣= 1
m(n− 1)
∣∣∣∣∣∣∑j =i
Φi Φj
∣∣∣∣∣∣= 1
m(n− 1)
∣∣∣∣∣∣∑i=1
1Φi
∣∣∣∣∣∣ .Now it follows from Lemma 10.1 that since every row of Φ has at least one non-identityelement, every row sum vanishes. Therefore,
∑i∈[n] 1
φi = 0, and since Φ1 = 1 wehave
1
m(n− 1)
∣∣∣∣∣∣∑i=0
1φi
∣∣∣∣∣∣= 1
m(n− 1)
∣∣−11∣∣= 1
n− 1.
lemma 10.9 Let A be a DG(o,r) frame. Then A is a tight-frame with redundancy nm .
Proof. Let t and t′ be two indices in [m]. We calculate the inner-product between therows indexed by t and t′. It follows from Equation (10.39) that the inner-product can be
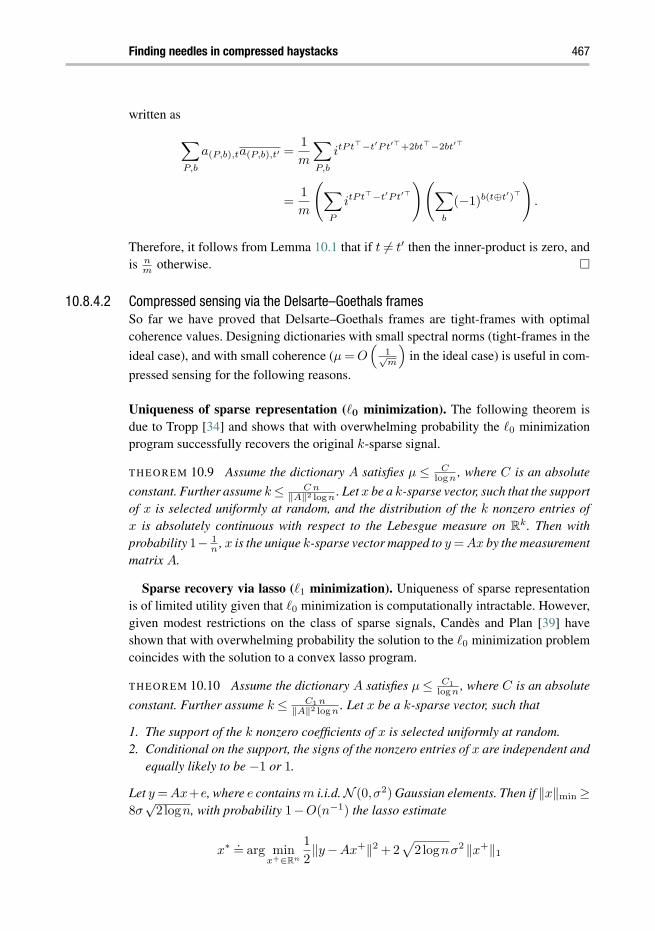
Finding needles in compressed haystacks 467
written as∑P,b
a(P,b),ta(P,b),t′ =1
m
∑P,b
itP t−t′Pt′+2bt−2bt′
=1
m
(∑P
itP t−t′Pt′)(∑
b
(−1)b(t⊕t′))
.
Therefore, it follows from Lemma 10.1 that if t = t′ then the inner-product is zero, andis n
m otherwise.
10.8.4.2 Compressed sensing via the Delsarte–Goethals framesSo far we have proved that Delsarte–Goethals frames are tight-frames with optimalcoherence values. Designing dictionaries with small spectral norms (tight-frames in the
ideal case), and with small coherence (µ = O(
1√m
)in the ideal case) is useful in com-
pressed sensing for the following reasons.
Uniqueness of sparse representation (0 minimization). The following theorem isdue to Tropp [34] and shows that with overwhelming probability the 0 minimizationprogram successfully recovers the original k-sparse signal.
theorem 10.9 Assume the dictionary A satisfies µ ≤ Clogn , where C is an absolute
constant. Further assume k ≤ C n‖A‖2 logn . Let x be a k-sparse vector, such that the support
of x is selected uniformly at random, and the distribution of the k nonzero entries ofx is absolutely continuous with respect to the Lebesgue measure on Rk. Then withprobability 1− 1
n , x is the unique k-sparse vector mapped to y = Ax by the measurementmatrix A.
Sparse recovery via lasso (1 minimization). Uniqueness of sparse representationis of limited utility given that 0 minimization is computationally intractable. However,given modest restrictions on the class of sparse signals, Candès and Plan [39] haveshown that with overwhelming probability the solution to the 0 minimization problemcoincides with the solution to a convex lasso program.
theorem 10.10 Assume the dictionary A satisfies µ ≤ C1logn , where C is an absolute
constant. Further assume k ≤ C1 n‖A‖2 logn . Let x be a k-sparse vector, such that
1. The support of the k nonzero coefficients of x is selected uniformly at random.2. Conditional on the support, the signs of the nonzero entries of x are independent and
equally likely to be −1 or 1.
Let y = Ax+e, where e contains m i.i.d. N (0,σ2) Gaussian elements. Then if ‖x‖min ≥8σ
√2logn, with probability 1−O(n−1) the lasso estimate
x∗ .= arg min
x+∈Rn
1
2‖y−Ax+‖2 +2
√2lognσ2 ‖x+‖1

468 Robert Calderbank and Sina Jafarpour
has the same support and sign as x, and ‖Ax−Ax∗‖2 ≤C2 kσ2, where C2 is a constantindependent of x.
Stochastic noise in the data domain. The tight-frame property of the sensing matrixmakes it possible to map i.i.d. Gaussian noise in the data domain to i.i.d. Gaussian noisein the measurement domain:
lemma 10.10 Let ς be a vector with n i.i.d. N (0,σ2d) entries and e be a vector with m
i.i.d. N (0,σ2m) entries. Let = Aς and v = + e. Then v contains m entries, sampled
i.i.d. from N(0,σ2
), where σ2 = n
mσ2d +σ2
m.
Proof. The tight-frame property implies
E[†]= E[Aςς†A†] = σ2
dAA† =n
mσ2
d I.
Therefore, v = + e contains i.i.d. Gaussian elements with zero mean and variance σ2.
Here we present numerical experiments to evaluate the performance of the lassoprogram with DG frames. The performance of DG frames is compared with that ofrandom Gaussian sensing matrices of the same size. The SpaRSA algorithm [40] with1 regularization parameter λ = 10−9 is used for signal reconstruction in the noiselesscase, and the parameter is adjusted according to Theorem 10.10 in the noisy case.
These experiments relate accuracy of sparse recovery to the sparsity level and theSignal to Noise Ratio (SNR). Accuracy is measured in terms of the statistical 0−1 lossmetric which captures the fraction of signal support that is successfully recovered. Thereconstruction algorithm outputs a k-sparse approximation x to the k-sparse signal x,and the statistical 0−1 loss is the fraction of the support of x that is not recovered in x.Each experiment was repeated 2000 times and Figure 10.2 records the average loss.
Figure 10.2 plots statistical 0− 1 loss and complexity (average reconstruction time)as a function of the sparsity level k. We select k-sparse signals with uniformly randomsupport, with random signs, and with the amplitude of nonzero entries set equal to 1.Three different sensing matrices are compared; a Gaussian matrix, a DG(7,0) frameand a DG(7,1) sieve.1 After compressive sampling the signal, its support is recoveredusing the SpaRSA algorithm with λ = 10−9.
Figure 10.3(a) plots statistical 0− 1 loss as a function of noise in the measurementdomain and Figure 10.3(b) does the same for noise in the data domain. In the measurementnoise study, a N (0,σ2
m) i.i.d. measurement noise vector is added to the sensed vector toobtain the m-dimensional vector y. The original k-sparse signal x is then approximatedby solving the lasso program with λ = 2
√2lognσ2. Following Lemma 10.10, we used a
similar method to study noise in the data domain. Figure 10.3 shows that DG frames andsieves outperform random Gaussian matrices in terms of noisy signal recovery using thelasso.
1 A DG sieve is a submatrix of a DG frame which has no Walsh tones.
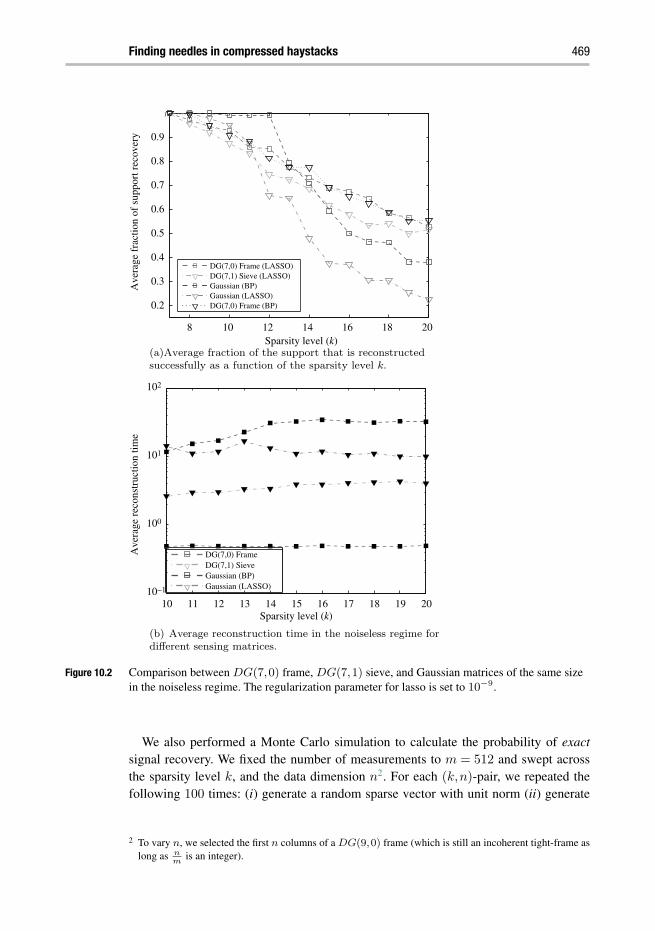
Finding needles in compressed haystacks 469
8 10 12 14 16 18 20
0.2
0.3
0.4
0.5
0.6
0.7
0.8
0.9
1
Ave
rage
fra
ctio
n of
sup
port
rec
over
y
DG(7,0) Frame (LASSO)DG(7,1) Sieve (LASSO)Gaussian (BP)Gaussian (LASSO)DG(7,0) Frame (BP)
(a)Average fraction of the support that is reconstructedsuccessfully as a function of the sparsity level k.
10 11 12 13 14 15 16 17 18 19 2010−1
100
101
102
Sparsity level (k)
Sparsity level (k)
Ave
rage
rec
onst
ruct
ion
time
DG(7,0) FrameDG(7,1) SieveGaussian (BP)Gaussian (LASSO)
(b) Average reconstruction time in the noiseless regime fordifferent sensing matrices.
Figure 10.2 Comparison between DG(7,0) frame, DG(7,1) sieve, and Gaussian matrices of the same sizein the noiseless regime. The regularization parameter for lasso is set to 10−9.
We also performed a Monte Carlo simulation to calculate the probability of exactsignal recovery. We fixed the number of measurements to m = 512 and swept acrossthe sparsity level k, and the data dimension n2. For each (k,n)-pair, we repeated thefollowing 100 times: (i) generate a random sparse vector with unit norm (ii) generate
2 To vary n, we selected the first n columns of a DG(9,0) frame (which is still an incoherent tight-frame aslong as n
mis an integer).

470 Robert Calderbank and Sina Jafarpour
10−9 10−8 10−7 10−6 10−5 10−4 10−3
0.4
0.5
0.6
0.7
0.8
0.9
1
Ave
rage
fra
ctio
n of
sup
port
rec
over
yDG(7,0) FrameDG(7,1) SieveGaussian (BP)Gaussian (LASSO)
(a) The impact of the noise in the measurement domainon the accuracy of the sparse approximation for differentsensing matrices.
10−9 10−8 10−7
Data domain noise standard deviation (σ)
10−6 10−5 10−4 10−30.2
0.3
0.4
0.5
0.6
0.7
0.8
Ave
rage
fra
ctio
n of
sup
port
rec
over
y
DG(7,0) FrameDG(7,1) SieveGaussian (BP)Gaussian (LASSO)
(b) The impact of the noise in the data domain on theracy of the sparse approximation for different sensing
matrices.
Measurement noise standard deviation (σ )
accu
Figure 10.3 Average fraction of the support that is reconstructed successfully as a function of the noise levelin the measurement domain (left), and in the data domain (right). Here the sparsity level is 14.The regularization parameter for lasso is determined as a function of the noise varianceaccording to Theorem 10.10.

Finding needles in compressed haystacks 471
compressive measurements (no noise) using the DG frame, and (iii) recover the signalsusing lasso. Figure 10.4(a) reports the probability of exact recovery over the 100 trials.
We also performed a similar experiment in the noisy regime. Here we independentlychanged the standard deviations of the data-domain noise (σd) and the measurementnoise (σm) from 10−6 to 10−1. We then used the lasso program to obtain a sparseapproximation x to the k-sparse vector x. Figure 10.4(b) plots the average reconstructionerror (−10log10(‖x−x‖2)) as a function of σm and σd.
Finally we used the DG frames to compressively sample an image of size n = 2048×2048. We used the Daubechies-8 discrete wavelet transform to obtain compressiblecoefficients for the image. We compared the quality and computational cost of twodifferent DG sensing matrices, a DG(19,0) frame (providing a compression ratio of25%), and a DG(17,0) frame (providing a compression ratio of 6.25%). The results areshown in Figure 10.5 (see [41] for more detailed comparison with other methods).
10.8.4.3 Compressed learning via the Delsarte–Goethals framesSince Delsarte–Goethals frames have optimal worst-case and average-case coherencevalues, we can use Corollary 10.5 to guarantee that the measurement domain SVM’sclassifier is near-optimal.
corollary 10.7 Letobe an odd integer, and let r≤ o−12 . LetAbe anm×nDG frame
with m = 2o, and n = 2(r+2)o. Let w0 denote the data-domain oracle classifier. Also letS
.= 〈(x1, l1), . . . ,(xM , lM )〉 represent M training examples in the data domain, and let
AS.= 〈(y1, l1), . . . ,(yM , lM )〉 denote the representation of the training examples in the
measurement domain. Finally let zAS denote the measurement domain SVM’s classifiertrained on AS. Then there exists a universal constant C such that if
m ≥(
2r+1C logn
ε1
)2
, and k ≤ min
mε2
1
(2C)2 logn,n
23
then with probability at least 1− 6
n the following holds
HD(zAS) ≤ HD(w0)+O
(R‖w0‖
√(2r (logM +logn)√
m+σ +
(1+ ε1) logn
M
)).
(10.40)
Proof. The proof follows from Corollary 10.5 after substituting the values µ = 2r√
m
and ν = 1n−1 .
remark 10.6 Corollary 10.7 guarantees that larger measurement domain dimensionm leads to lower measurement domain classification loss. In other words
HD(zAS) ≤ HD(w0)+ O
(((logM +logn)2
m
) 14
+
(logn
M
) 12
+σ12
).

472 Robert Calderbank and Sina Jafarpour
Sparsity (k)
Dat
a D
imen
sion
(n)
Probability of exact recovery: DG Frame
51 64 77 90 102
115
128
141
154
166
179
192
205
218
230
243
256
512
1024
1536
2048
2560
0
0.1
0.2
0.3
0.4
0.5
0.6
0.7
0.8
0.9
1
(a) Probability of exact signal recovery as a function of thesparsity level k, and the data domain dimension n using aDG(9, 0) frame.
Measurement noise (log10(σm))
Data
Nois
e(lo
g 10(σ
d))
Average reconstruction error −10 log10( x − x 2): DG Frame
−6 −5 −4 −3 −2 −1−6
−5
−4
−3
−2
−1
−5
0
5
10
15
20
25
30
(b) Average reconstruction error as a function of the datadomain noise (σd ), and the measurement domain noise (σm )using a DG(9, 0) frame.
Figure 10.4 The impact of the sparsity level and noise on the performance of the lasso program using aDG(9,0) frame.
Application: texture classification. Finally we demonstrate an application of com-pressed learning in texture classification. In texture classification, the goal is to classifyimages into one of the “horizontal,” “vertical,” or “other” classes. The information aboutthe direction of an image is stored in the horizontal and vertical wavelet coefficients of

Finding needles in compressed haystacks 473
Table 10.1. Comparison between the classification results of the SVM’s classifier in thedata domain and the SVM’s classifier in the measurement domain.
SVM’s # of “horizontals” # of “verticals” # of “others”
Data Domain 14 18 23Measurement Domain 12 15 28
(a) A DG(19. 0) frame is used to provide a compression ratioof 25%. The reconstruction SNR is 16.58, and the recon-struction time is 8369 seconds.
(b) A DG(17. 0) frame is used to provide a compression ratioof 6.25%. The reconstruction SNR is 12.52, and the recon-struction time is 8606 seconds.
Figure 10.5 Comparison of CS recovery performance of an n = 2048× 2048 image using the Basis pursuitalgorithm from 219 measurements (left), and 217 measurements (right). The reconstruction SNR
is −20log10
(‖x−x‖2
‖x‖2
).
that image. Therefore, an SVM’s classifier in the data (pixel or wavelet) domain wouldprovide high texture classification accuracy. Here we show that an SVM’s classifiertrained directly over the compressively sampled images also has high performance.
We used the Brodatz texture database [42] which contains 111, 128 × 128 images.First we divided the dataset into 56 training images and 55 test images, and trainedan SVM’s classifier from the 128× 128 images. The images were then projected to a211 dimensional space using a DG(11,0) matrix. We then used the same procedure totrain the measurement domain SVM’s classifier and classified the images accordingly.Table 10.1 compares the classification results of the SVM’s classifier in the data domainand the SVM’s classifier in the measurement domain. Figure 10.6 demonstrates examplesof images in each class. The measurement domain classifier misclassifies 3 “horizontal”images, 3 “vertical” images and 1 “others” image. Therefore, the relative classificationerror of the measurement domain SVM’s classifier is |14−11|+|18−15|+|23−22|
55 ≈ 12.7%.
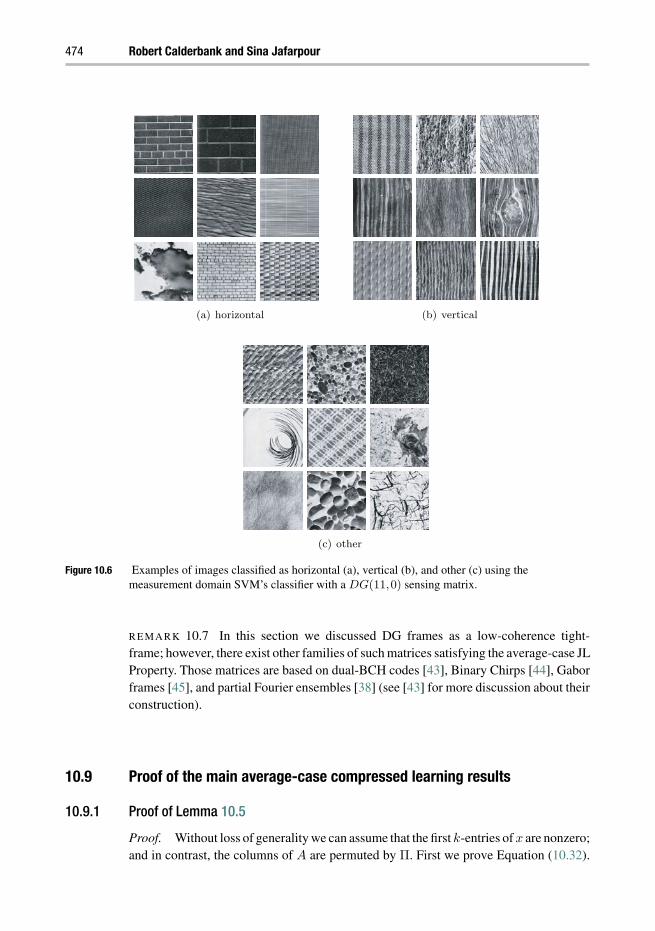
474 Robert Calderbank and Sina Jafarpour
(a) horizontal (b) vertical
(c) other
Figure 10.6 Examples of images classified as horizontal (a), vertical (b), and other (c) using themeasurement domain SVM’s classifier with a DG(11,0) sensing matrix.
remark 10.7 In this section we discussed DG frames as a low-coherence tight-frame; however, there exist other families of such matrices satisfying the average-case JLProperty. Those matrices are based on dual-BCH codes [43], Binary Chirps [44], Gaborframes [45], and partial Fourier ensembles [38] (see [43] for more discussion about theirconstruction).
10.9 Proof of the main average-case compressed learning results
10.9.1 Proof of Lemma 10.5
Proof. Without loss of generality we can assume that the first k-entries of x are nonzero;and in contrast, the columns of A are permuted by Π. First we prove Equation (10.32).

Finding needles in compressed haystacks 475
We apply the union bound over all possible values of W to get
PrΠk
1
[∃W ∈ [n]−Πk
1 s.t
∣∣∣∣∣k∑
i=1
xiAWAΠi
∣∣∣∣∣≥ 2ε1‖x‖2
](10.41)
≤n∑
w=1
PrΠk
1
[∃W ∈ [n]−Πk
1 s.t
∣∣∣∣∣k∑
i=1
xiAWAΠi
∣∣∣∣∣≥ 2ε1‖x‖2 |W = w
].
Now fix the value w, and define w(Πk1)
.=∑k
i=1 xiAwAΠi . Note that conditioned
on w /∈ Πk1 , Πk
1 is a random k-subset of [n] − w. We first prove that the expectedvalue of w(Πk
1) is sufficiently small. Then we use Azuma’s inequality to show that withoverwhelming probability w(Πk
1) is concentrated about its expectation.It follows from the linearity of expectation that
∣∣∣EΠk1
[w(Πk
1)]∣∣∣= ∣∣∣∣∣
k∑i=1
xiEΠi =w
[Aw
AΠi
]∣∣∣∣∣≤ ‖x‖1 ν ≤√
k‖x‖2 ν. (10.42)
To prove the concentration, let πk1 be a fixed k-subset of [n] − w, and define the
martingale sequence
Zt.=EΠk
1
[w(Πk
1) |Πt1 = πt
1]=
t∑i=1
xiAwAπi +
k∑i=t+1
xiEΠi /∈π1,··· ,πt,w
[Aw
AΠi
].
(10.43)Here the goal is to bound the difference |Zt −Zt−1|. Note that
Zt−1 =
t−1∑i=1
xiAwAπi +
k∑i=t
xiEΠi /∈π1,··· ,πt−1,w
[Aw
AΠi
].
Therefore, it follows from the triangle inequality that
|Zt −Zt−1| ≤ |xt|∣∣∣Aw
Aπt−EΠt /∈π1,··· ,πt−1,w
[Aw
AΠt
]∣∣∣ (10.44)
+
k∑i=t+1
|xi|∣∣∣EΠi /∈π1,··· ,πt,w
[Aw
AΠi
]−EΠi /∈π1,··· ,πt−1,w
[Aw
AΠi
]∣∣∣ .From marginalizing the expectation, we have
EΠi /∈π1,··· ,πt−1,w
[Aw
AΠi
]= (10.45)
Pr[Πi = πt]AwAπt
+Pr[Πi = πt]EΠi /∈π1,··· ,πt,w
[Aw
AΠi
].

476 Robert Calderbank and Sina Jafarpour
As a result ∣∣∣EΠi /∈π1,··· ,πt,w
[Aw
AΠi
]−EΠi /∈π1,··· ,πt−1,w
[Aw
AΠi
]∣∣∣ (10.46)
= Pr[Πi = πt]
∣∣∣EΠi /∈π1,··· ,πt,w
[Aw
AΠi
]−Aw
Aπt
∣∣∣≤ 2µ
n− 1− t.
By substituting (10.46) into (10.44) we get the difference bound
ct.= |Zt −Zt−1| ≤ 2|xt|µ+
2µ
n− (t+1)‖x‖1 ≤ 2|xt|µ+
2µ
n− (k +1)‖x‖1. (10.47)
Now in order to use Azuma’s inequality, we need to bound∑k
t=1 c2t :
k∑t=1
c2t = 4µ2
k∑t=1
(|xt|+
‖x‖1
n− (k +1)
)2
(10.48)
≤ 4µ2
(‖x‖2
2 +k2
(n− (k +1))2 ‖x‖
22 +2
k
n− (k +1)‖x‖2
2
).
If k ≤ n−12 , then
∑kt=1 c2
t ≤ 16µ2‖x‖22, and it follows from Azuma’s inequality
(Proposition 10.1) that for every ε1 ≥√
kν,
PrΠk
1
[∣∣w(Πk1)∣∣≥ 2ε1‖x‖2
]≤ Pr
[∣∣∣w(Πk1)−EΠk
1
[w(Πk
1)]∣∣∣≥ ε1‖x‖2
](10.49)
≤ 4exp
−ε21
128µ2
.
Now by taking the union bound over all n choices for w we get
PrΠk
1
[∃W ∈ [n]−Πk
1 s.t
∣∣∣∣∣k∑
i=1
xiAWAΠi
∣∣∣∣∣≥ 2ε1‖x‖2
]≤ 4nexp
−ε21
128µ2
.
The proof of Equation (10.33) is similar: First observe that using the union bound
PrΠk
1
∃j ∈ 1, · · · ,ks.t
∣∣∣∣∣∣∣∣∑
i∈1,···ki=j
xiAΠj
AΠi
∣∣∣∣∣∣∣∣≥ 2ε2‖x‖2
≤ (10.50)
k∑j=1
PrΠk
1
∣∣∣∣∣∣∣∣∑
i∈1,···ki=j
xiAΠj
AΠi
∣∣∣∣∣∣∣∣≥ 2ε2‖x‖2
.

Finding needles in compressed haystacks 477
Furthermore, by marginalizing the left-hand side of (10.50) we get
PrΠk
1
∣∣∣∣∣∣∣∣∑
i∈1,···ki=j
xiAΠj
AΠi
∣∣∣∣∣∣∣∣≥ 2ε2‖x‖2
=
n∑w=1
Pr[Πj = w]PrΠk
1
∣∣∣∣∣∣∣∣∑
i∈1,···ki=j
xiAwAΠi
∣∣∣∣∣∣∣∣≥ 2ε2‖x‖2 |Πj = w
.
An argument similar to the proof of Lemma 10.5 can be used to show that for everyε2 ≥
√kν
PrΠk
1
∣∣∣∣∣∣∣∣∑
i∈1,···ki=j
xiAΠi
AΠj
∣∣∣∣∣∣∣∣≥ 2ε2‖x‖2 |Πj = w
≤ 4exp
−ε22
128µ2
.
Hence
PrΠk
1
∃j s.t
∣∣∣∣∣∣∣∣∑
i∈1,···ki=j
xiAΠj
AΠi
∣∣∣∣∣∣∣∣≥ 2ε2‖x‖2
≤k∑
j=1
n∑w=1
Pr[Πj = w]4exp
−ε22
128µ2
= 4k exp
−ε22
128µ2
.
10.9.2 Proof of Theorem 10.6
The proof of Theorem 10.6 follows from constructing bounded-difference martingalesequences and applying the Extended Azuma Inequality (Proposition 10.2). Let Π be arandom permutation of [n], also let π be a fixed permutation of [n]. For every index t, letΠt
1.= Π1, · · · ,Πt, and πt
1.= π1, · · · ,πt . Let x be k-sparse vector with fixed values,
supported on Πk1 . Without loss of generality we can assume that the first k-entries of x
are nonzero; and in contrast, the columns of A are permuted by Π. For t = 0,1, · · · ,k,we define the following martingale sequence
Zt = EΠk1
k∑i=1
xi
k∑j=1
xjAΠi
AΠj
|Π1 = π1, · · · ,Πt = πt
. (10.51)
First we bound the difference |Zt −Zt−1|. We need the following Lemmas:

478 Robert Calderbank and Sina Jafarpour
lemma 10.11 Let Πk1 be a random k-subset of [n], and let πk
1 be a fixed k-subset of[n]. Then for every t ≤ k the following inequalities simultaneously hold:
• (I1): for every pair of indices i, j with 1 ≤ i < t and t < j:∣∣∣EΠj /∈πt1[Aπi
AΠj
]−EΠj /∈πt−1
1 [Aπi
AΠj
]∣∣∣≤ 2µ
n− t+1.
• (I2) for every pair of distinct indices i, j greater than t∣∣∣EΠi /∈πt1
[EΠj /∈πt
1,Πi
[AΠi
AΠj
]]−EΠi /∈πt−1
1
[EΠj /∈πt−1
1 ,Πi
[AΠi
AΠj
]]∣∣∣≤ 2µ
n− t+1.
Proof. The first inequality is proved by marginalizing the expectation. The proof of thesecond inequality is similar and we omit the details.∣∣∣EΠj /∈πt
1[Aπi
AΠj
]−EΠj /∈πt−1
1 [Aπi
AΠj
]∣∣∣=
∣∣∣EΠj /∈πt1[Aπi
AΠj
]−Pr[Πj = πt]Aπi
Aπt −Pr[Πj = πt]EΠj /∈πt1[Aπi
AΠj
]∣∣∣= Pr[Πj = πt]
∣∣∣EΠj /∈πt1[Aπi
AΠj
]−Aπi
Aπt
∣∣∣≤ 2µ
n− (t− 1).
lemma 10.12 Let Πk1 and πk
1 be defined as in Lemma 10.11. Then for every t ≤ k thefollowing inequalities simultaneously hold:
• (Q1): for every j < t:
∣∣∣EΠt /∈πt−11
[AΠt
Aπj
]∣∣∣≤ k
n−kµ+
n− 1
n−kν.
• (Q2): for every i > t:∣∣∣EΠi /∈πt1[AΠi
Aπt
]−EΠt /∈πt−1
1 [EΠi /∈π1,··· ,πt−1,Πt
[AΠi
AΠt
]]∣∣∣≤ 2k
n−kµ+
2(n− 1)
n−kν.
Proof. The proof of Lemma 10.12 is similar to the proof of Lemma 10.11 and isprovided in [46].
Now we are ready to bound the difference |Zt −Zt−1|.

Finding needles in compressed haystacks 479
lemma 10.13 Let Zt defined by (10.51). Then
|Zt −Zt−1| ≤ 2
∣∣∣∣∣∣t−1∑j=1
xtxjAπt
Aπj
∣∣∣∣∣∣+6
(k
n−kµ+
n− 1
n−kν
)|xt|‖x‖1 +
4µ
n−k‖x‖2
1.
(10.52)
Proof. The proof of Lemma 10.13 is similar to the proof of Lemma 10.12 after somesimplifications, and is provided in [46].
Now, in order to use ExtendedAzuma Inequality (Proposition 10.2), we need to analyzethe average-case and worst-case behaviors of |Zt −Zt−1|.
lemma 10.14 Let Zt defined by (10.51). Then
|Zt −Zt−1| ≤ 2√
k
(µ+3
(k
n−kµ+
n− 1
n−kν
))|xt|‖x‖2 +
4kµ
n−k‖x‖2
2. (10.53)
Moreover, for every positive ε2, if k ≤ min
n−12 , ε22 ν−2
, then with probability 1 −
4k exp
−ε22128µ2
, for every index t between 1 and k
|Zt −Zt−1| ≤ 2
(2ε2 +3
√k
(k
n−kµ+
n− 1
n−kν
))|xt|‖x‖2 +
4kµ
n−k‖x‖2
2. (10.54)
Proof. Equation (10.53) follows from Equation (10.52) after applying the Cauchy-Schwarz inequality. Now if k ≤ min
n−1
2 , ε22 ν−2
then it follows from Lemma 10.5that
PrΠk
1
[∃ t ∈ [k]s.t
∣∣∣∣∣t−1∑i=1
xiAΠi
AΠt
∣∣∣∣∣≥ 2ε2‖x‖2
]≤ 4k exp
−ε23
128µ2
.
We shall find an upper bound for the martingale difference |Zt −Zt−1|.
lemma 10.15 Let ε2 be a positive number less than µθM
16 . Suppose
k ≤ min
(nθM
96
) 23
, ε22ν−2,
(θMµ
96ν
)2
,
and define
ct.= 2
(2ε2 +3
√k
(k
n−kµ+
n− 1
n−kν
))|xt|‖x‖2 +
4kµ
n−k‖x‖2
2.
Thenk∑
t=1
c2t ≤ µ2θ2
M‖x‖42. (10.55)

480 Robert Calderbank and Sina Jafarpour
Proof. The proof of Lemma 10.15 requires some algebraic calculations and is providedin [46].
Having bounded the difference |Zt −Zt−1|, we can use the Extended Azuma Inequal-
ity to show that with overwhelming probability∑k
i=1 xi
(∑kj=1 xjAΠi
AΠj
)is
concentrated around ‖x‖2.Now we are ready to finish the proof of Theorem 10.6.
Proof of Theorem 10.6. First we show that the expected value of ‖Ax‖2 is close to‖x‖2. It follows from the linearity of expectation that
EΠk1
[‖Ax‖2]=
k∑i=1
xi
k∑j=1
xjEΠk1
[AΠi
AΠj
].
Hence
∣∣∣EΠk1
[‖Ax‖2]−‖Ax‖2
∣∣∣=∣∣∣∣∣∣∣∣
k∑i=1
xi
∑j∈[k]j =i
xjEΠ
[AΠi
AΠj
]∣∣∣∣∣∣∣∣≤ ν‖x‖2
1 ≤ kν‖x‖2.
Let Zt defined by Equation (10.51). Then since ε3 ≥ kν, we have
PrΠk
1
[∣∣‖Ax‖2 −‖x‖2∣∣≥ 2ε3‖x‖2]≤ Pr
Π
[|Zk −Z0| ≥ ε3‖x‖2] .
Lemma 10.14 states that always
|Zt −Zt−1| ≤ bt
and with probability at least 1− 4k exp
−ε23128µ2
, for every index t between 1 and k
|Zt −Zt−1| ≤ ct,
where bt and ct are the right-hand sides of Equations (10.53) and (10.54). Lemma 10.15proves that
∑kt=1 c2
t ≤ µ2θ2M‖x‖4
2. Moreover, it is easy to verify that for every t, ct ≥4kµn ‖x‖2, and bt < 8kµ‖x‖2. Therefore
k∑t=1
bt
ct≤
k∑t=1
2n ≤ 2kn.
The result then follows from the Extended Azuma Inequality.

Finding needles in compressed haystacks 481
10.10 Conclusion
In this chapter we introduced compressed learning, a linear dimensionality reductiontechnique for measurement-domain pattern recognition in compressed sensing applica-tions. We formulated the conditions that a sensing matrix should satisfy to guarantee thenear-optimality of the measurement-domain SVM’s classifier. We then showed that alarge family of compressed sensing matrices satisfy the required properties.
We again emphasize that the dimensionality reduction has been studied for a long timein many different communities. In particular, the development of theory and methodsthat cope with the curse of dimensionality has been the focus of the machine learningcommunity for at least 20 years (e.g., SVM’s, complexity-regularization, model selec-tion, boosting, aggregation, etc.). Besides, there has been a huge amount of research ondesigning robust dimensionality reducing techniques, e.g., manifold learning [48, 49],locality sensitive hashing [50], etc. (see also [47]). The compressed learning approachof this section is most beneficial in compressed sensing applications. The reason is thatcompressed sensing already projects the data to some low-dimensional space, and there-fore the dimensionality reduction can be done as fast and efficiently as the state-of-theart sensing methods are.
Moreover, even though the linear dimensionality reduction technique is not as compli-cated as other dimensionality reduction methods, it is sufficient for many applications. Ithas been confirmed empirically that in many applications including information retrieval[30] and face classification [7], the data already has a good enough structure that thislinear technique can perform almost as well as the best classifier in the high-dimensionalspace.
Acknowledgement
It is a pleasure to thank Waheed Bajwa, Ingrid Daubechies, Marco Duarte, StephenHoward, Robert Schapire, and Karthik Sridharan for sharing many valuable insights.The work of R. Calderbank and S. Jafarpour is supported in part by NSF under grantDMS 0701226, by ONR under grant N00173-06-1-G006, and by AFOSR under grantFA9550-05-1-0443.
References
[1] E. Kushilevitz, R. Ostrovsky, andY. Rabani. Efficient search for approximate nearest neighborin high dimensional spaces. SIAM J Comput, 30(2):457–474, 2000.
[2] P. Indyk. On approximation nearest neighbors in non-Euclidean spaces. Proc 39th Ann IEEESymp Found Computer Scie (FOCS): 148–155, 1998.
[3] N. Alon, Y. Matias, and M. Szegedy. The space complexity of approximating the frequencymoments. Proc 28th Ann ACM Symp Theory Comput (STOC): 20–29, 1996.
[4] M. F. Balcan, A. Blum, and S. Vempala. Kernels as features: On kernels, margins, andlow-dimensional mappings. Mach Learning, 65(1), 79–94, 2006.

482 Robert Calderbank and Sina Jafarpour
[5] K. Weinberger, A. Dasgupta, J. Attenberg, J. Langford, and A. Smola. Feature hashing forlarge scale multitask learning. Proc 26th Ann Int Conf Machine Learning (ICML), 1113–1120,2009.
[6] D. A. Spielman and N. Srivastava. Graph sparsification by effective resistances. Proc 40thAnn ACM Symp Theory Comp (STOC), 563–568, 2008.
[7] J. Wright, A. Yang, A. Ganesh, S. Shastry, and Y. Ma. Robust face recognition via sparserepresentation. IEEE Trans Pattern Machine Intell, 32(2), 210–227, 2009.
[8] J. Mairal, F. Bach, J. Ponce, and G. Sapiro. Online learning for matrix factorization and sparsecoding. J Machine Learning Res, 11, 19–60, 2010.
[9] T. Do, Y. Chen, D. Nguyen, N. Nguyen, L. Gan, and T. Tran. Distributed compressed videosensing. Proc 16th IEEE Int Conf Image Proc, 1381–1384, 2009.
[10] J. Han, S. McKenna, and R. Wang. Regular texture analysis as statistical model selection. InECCV (4), vol 5305 of Lecture Notes in Comput Sci, 242–255, 2008.
[11] C. McDiarmid. On the method of bounded differences. Surv Combinatorics, 148–188,Cambridge University Press, Cambridge, 1989.
[12] S. Kutin. Extensions to McDiarmid’s inequality when differences are bounded with highprobability. Tech Rep TR-2002-045, University of Chicago, April, 2002.
[13] C. J.C. Burgess. A tutorial on support vector machines for pattern recognition. Data MiningKnowledge Discovery, 2:121–167, 1998.
[14] K. Sridharan, N. Srebro, and S. Shalev-Shwartz. Fast rates for regularized objectives. InNeural Information Processing Systems, 2008.
[15] W. B. Johnson and J. Lindenstrauss. Extensions of Lipschitz mappings into a Hilbert space.Contemp Math 26:189–206, 1984.
[16] R. Baraniuk, M. Davenport, R. DeVore, and M. Wakin. A simple proof of the restrictedisometry property for random matrices. Construc Approx, 28(3):253–263, 2008.
[17] D. Needell and J. A. Tropp. CoSaMP: Iterative signal recovery from incomplete andinaccurate samples. Appl Comput Harmonic Anal, 26(3):301–321, 2009.
[18] E. Candès, J. Romberg, and T. Tao. Stable signal recovery from incomplete and inaccuratemeasurements. Commun Pure Appl Math, 59(8):1207–1223, 2006.
[19] E. Candès, J. Romberg, and T. Tao. Robust uncertainty principles: Exact signal reconstructionfrom highly incomplete frequency information. IEEE Trans Inform Theory, 52(2):489–509,2006.
[20] S. Dasgupta and A. Gupta. An elementary proof of the Johnson–Lindenstrauss lemma.Technical Report 99-006, UC Berkeley, 1999.
[21] P. Indyk and R. Motwani. Approximate nearest neighbors: Towards removing the curse ofdimensionality. Proc 30th Ann ACM Symp Theory of Comput (STOC): 604–613, 1998.
[22] A. Dasgupta, R. Kumar, and T. Sarlos. A Sparse Johnson–Lindenstrauss Transform. 42ndACM Symp Theory of Comput (STOC), 2010.
[23] D. Achiloptas. Database-friendly random projections: Johnson–Lindenstrauss with binarycoins. J Comput Syst Sci, 66:671–687, 2003.
[24] N.Ailon and B. Chazelle. The fast Johnson–Lindenstrauss transform and approximate nearestneighbors. SIAM J Comput, 39(1):302–322, 2009.
[25] N. Ailon and E. Liberty. Fast dimension reduction using Rademacher series on dual BCHcodes. Discrete Comput Geom, 42(4):615–630, 2009.
[26] E. Liberty, N.Ailon, andA. Singer. Dense fast random projections and lean Walsh transforms.12th Int Workshop Randomization Approx Techniques Comput Sci: 512–522, 2008.

Finding needles in compressed haystacks 483
[27] N. Ailon and E. Liberty. Almost Optimal Unrestricted Fast Johnson–Lindenstrauss Trans-form. Preprint, 2010.
[28] J. Matousek. On variants of Johnson–Lindenstrauss lemma. Private Communication, 2006.[29] D. Achlioptas, F. McSherry, and B. Scholkopf. Sampling techniques for kernel methods. Adv
Neural Inform Proc Syst (NIPS), 2001.[30] D. Fradkin. Experiments with random projections for machine learning. ACM SIGKDD Int
Conf Knowledge Discovery Data Mining: 517–522, 2003.[31] A. Blum. Random projection, margins, kernels, and feature-selection. Lecture Notes Comput
Sci, 3940, 52–68, 2006.[32] A. Rahimi and B. Recht. Random features for large-scale kernel machines. Adv Neural Inform
Proc Syst (NIPS), 2007.[33] W. Bajwa, R. Calderbank, and S. Jafarpour. Model selection: Two fundamental measures of
coherence and their algorithmic significance. Proc IEEE Symp Inform Theory (ISIT), 2010.[34] J. Tropp. The sparsity gap: Uncertainty principles proportional to dimension. To appear,
Proc. 44th Ann. IEEE Conf. Inform Sci Syst (CISS), 2010.[35] R. Calderbank, S. Howard, and S. Jafarpour. Sparse reconstruction via the Reed-Muller
Sieve. Proc IEEE Symp Inform Theory (ISIT), 2010.[36] R. Calderbank and S. Jafarpour. Reed Muller Sensing Matrices and the LASSO. Int Conf
Sequences Applic (SETA): 442–463, 2010.[37] A. R. Hammons, P. V. Kumar, A. R. Calderbank, N. J. A. Sloane, and P. Sole. The Z4-
linearity of Kerdock Codes, Preparata, Goethals, and related codes. IEEE Trans InformTheory, 40(2):301–319, 1994.
[38] R. Calderbank, S. Howard, and S. Jafarpour. Construction of a large class of matrices satisfy-ing a Statistical Isometry Property. IEEE J Sel Topics Sign Proc, Special Issue on CompressiveSensing, 4(2):358–374, 2010.
[39] E. Candès and J. Plan. Near-ideal model selection by 1 minimization. Anna Stat, 37:2145–2177, 2009.
[40] S. Wright, R. Nowak, and M. Figueiredo. Sparse reconstruction by separable approximation.IEEE Trans Sign Proc, 57(7), 2479–2493, 2009.
[41] M. Duarte, S. Jafarpour, and R. Calderbank. Conditioning the Delsarte-Goethals frame forcompressive imaging. Preprint, 2010.
[42] Brodatz Texture Database. Available at http://www.ux.uis.no/∼tranden/brodatz.html.[43] W. U. Bajwa, R. Calderbank, and S. Jafarpour. Revisiting model selection and recovery
of sparse signals using one-step thresholding. To appear in Proc. 48th Ann. Allerton Conf.Commun, Control, Comput, 2010.
[44] L. Applebaum, S. Howard, S. Searle, and R. Calderbank. Chirp sensing codes: Determin-istic compressed sensing measurements for fast recovery. Appl Computa Harmonic Anal,26(2):283–290, 2009.
[45] W. Bajwa, R. Calderbank, and S. Jafarpour. Why Gabor Frames? Two fundamental measuresof coherence and their role in model selection. J Communi Networking, 12(4):289–307,2010.
[46] R. Calderbank, S. Howard, S. Jafarpour, and J. Kent. Sparse approximation and compressedsensing using the Reed-Muller Sieve. Technical Report, TR-888-10, Princeton University,2010.
[47] I. Fodor. A survey of dimension reduction techniques. LLNL Technical Report, UCRL-ID-148494, 2002.

484 Robert Calderbank and Sina Jafarpour
[48] R. G. Baraniuk and M. B. Wakin. Random projections of smooth manifolds. Found ComputaMath, 9(1), 2002.
[49] X. Huo, X. S. Ni, and A. K. Smith. A survey of manifold-based learning methods. RecentAdv Data Mining Enterprise Data, 691–745, 2007.
[50] A. Andoni and P. Indyk. Near-optimal hashing algorithms for approximate nearest neighborin high dimensions. Commun ACM, 51(1):117–122, 2008.

11 Data separation by sparserepresentationsGitta Kutyniok
Modern data are often composed of two or more morphologically distinct constituents,and one typical goal is the extraction of those components. Recently, sparsity methodolo-gies have been successfully utilized to solve this problem, both theoretically as well asempirically. The key idea is to choose a deliberately overcomplete representation madeof several frames each one providing a sparse expansion of one of the components tobe extracted. The morphological difference between the components is then encoded asincoherence conditions of those frames. The decomposition principle is to minimize the1 norm of the frame coefficients. This chapter shall serve as an introduction to and asurvey of this exciting area of research as well as a reference for the state of the art ofthis research field.
11.1 Introduction
Over the last few years, scientists have faced an ever growing deluge of data, whichneeds to be transmitted, analyzed, and stored. A close analysis reveals that most of thesedata might be classified as multimodal data, i.e., being composed of distinct subcompo-nents. Prominent examples are audio data, which might consist of a superposition of thesounds of different instruments, or imaging data from neurobiology, which is typically acomposition of the soma of a neuron, its dendrites, and its spines. In both these exemplarysituations, the data has to be separated into appropriate single components for furtheranalysis. In the first case, separating the audio signal into the signals of the differentinstruments is a first step to enable the audio technician to obtain a musical score froma recording. In the second case, the neurobiologist might aim to analyze the structure ofdendrites and spines separately for the study of Alzheimer-specific characteristics. Thusdata separation is often a crucial step in the analysis of data.
As a scientist, three fundamental problems immediately come to one’s mind:
(P1) What is a mathematically precise meaning of the vague term “distinct compo-nents”?
Compressed Sensing: Theory and Applications, ed. Yonina C. Eldar and Gitta Kutyniok. Published byCambridge University Press. © Cambridge University Press 2012.
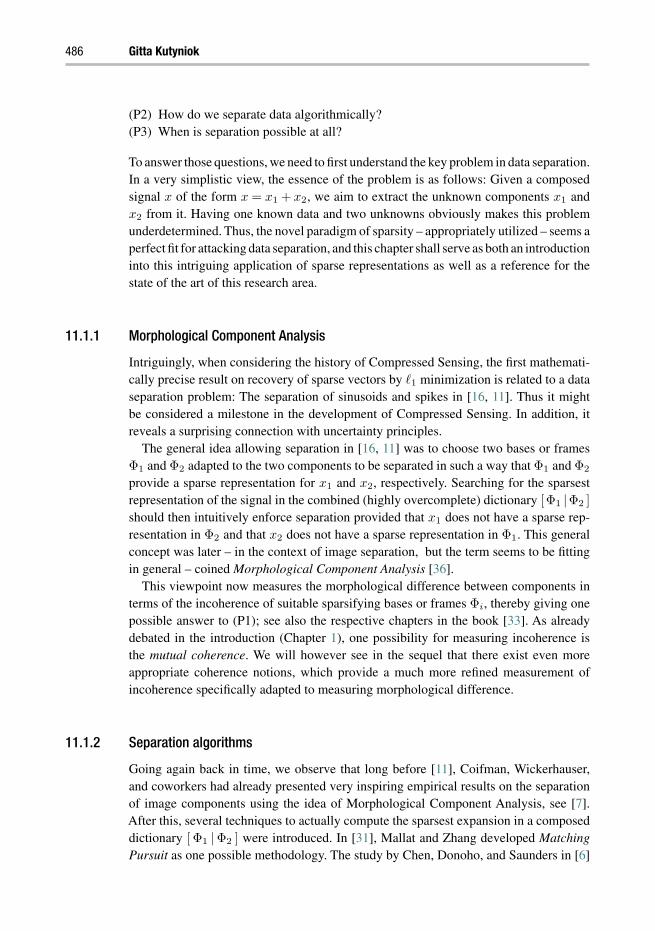
486 Gitta Kutyniok
(P2) How do we separate data algorithmically?(P3) When is separation possible at all?
To answer those questions, we need to first understand the key problem in data separation.In a very simplistic view, the essence of the problem is as follows: Given a composedsignal x of the form x = x1 + x2, we aim to extract the unknown components x1 andx2 from it. Having one known data and two unknowns obviously makes this problemunderdetermined. Thus, the novel paradigm of sparsity – appropriately utilized – seems aperfect fit for attacking data separation, and this chapter shall serve as both an introductioninto this intriguing application of sparse representations as well as a reference for thestate of the art of this research area.
11.1.1 Morphological Component Analysis
Intriguingly, when considering the history of Compressed Sensing, the first mathemati-cally precise result on recovery of sparse vectors by 1 minimization is related to a dataseparation problem: The separation of sinusoids and spikes in [16, 11]. Thus it mightbe considered a milestone in the development of Compressed Sensing. In addition, itreveals a surprising connection with uncertainty principles.
The general idea allowing separation in [16, 11] was to choose two bases or framesΦ1 and Φ2 adapted to the two components to be separated in such a way that Φ1 and Φ2
provide a sparse representation for x1 and x2, respectively. Searching for the sparsestrepresentation of the signal in the combined (highly overcomplete) dictionary [Φ1 |Φ2 ]
should then intuitively enforce separation provided that x1 does not have a sparse rep-resentation in Φ2 and that x2 does not have a sparse representation in Φ1. This generalconcept was later – in the context of image separation, but the term seems to be fittingin general – coined Morphological Component Analysis [36].
This viewpoint now measures the morphological difference between components interms of the incoherence of suitable sparsifying bases or frames Φi, thereby giving onepossible answer to (P1); see also the respective chapters in the book [33]. As alreadydebated in the introduction (Chapter 1), one possibility for measuring incoherence isthe mutual coherence. We will however see in the sequel that there exist even moreappropriate coherence notions, which provide a much more refined measurement ofincoherence specifically adapted to measuring morphological difference.
11.1.2 Separation algorithms
Going again back in time, we observe that long before [11], Coifman, Wickerhauser,and coworkers had already presented very inspiring empirical results on the separationof image components using the idea of Morphological Component Analysis, see [7].After this, several techniques to actually compute the sparsest expansion in a composeddictionary [ Φ1 |Φ2 ] were introduced. In [31], Mallat and Zhang developed MatchingPursuit as one possible methodology. The study by Chen, Donoho, and Saunders in [6]

Data separation by sparse representations 487
then revealed that the 1 norm has a tendency to find sparse solutions when they exist,and coined this method Basis Pursuit.
As explained before, data separation by Morphological Component Analysis – whensuitably applied – can be reduced to a sparse recovery problem. To solve this problem,there nowadays already exists a variety of utilizable algorithmic approaches; therebyproviding a general answer to (P2). Such approaches include, for instance, a canon ofgreedy-type algorithms, and we refer to the introduction and Chapter 8 for further details.Most of the theoretical separation results however consider 1 minimization as the mainseparation technique, which is what we will also mainly focus on in this chapter.
11.1.3 Separation results
As already mentioned, the first mathematically precise result was derived in [11] andsolved the problem of separation of sinusoids and spikes. After this “birth of sparsedata separation,” a deluge of very exciting results started. One direction of research aregeneral results on sparse recovery and Compressed Sensing; here we would like to citethe excellent survey paper [4] and the introduction (Chapter 1).
Another direction continued the idea of sparse data separation initiated in [11]. In thisrealm, the most significant theoretical results might be considered firstly the series ofpapers [19, 10], in which the initial results from [11] are extended to general composeddictionaries, secondly the paper [23], which also extends results from [11] though witha different perspective, and thirdly the papers [3] and [14], which explore the clusteringof the sparse coefficients and the morphological difference of the components encodedin it.
We also wish to mention the abundance of empirical work showing that utilizing theidea of sparse data separation often gives very compelling results in practice; as examples,we refer to the series of papers on applications to astronomical data [2, 36, 34], to generalimaging data [32, 20, 35], and to audio data [22, 25].
Let us remark that also the classical problem of denoising can be regarded as a separa-tion problem, since we aim to separate a signal from noise by utilizing the characteristicsof the signal family and the noise. However, as opposed to the separation problemsdiscussed in this chapter, denoising is not a “symmetric” separation task, since thecharacterization of the signal and the noise are very different.
11.1.4 Design of sparse dictionaries
For satisfactorily answering (P3), one must also raise the question of how to find suitablesparsifying bases or frames for given components. This search for “good” systems inthe sense of sparse dictionaries can be attacked in two ways, either non-adaptively oradaptively.
The first path explores the structure of the component one would like to extract, forinstance, it could be periodic such as sinusoids or anisotropic such as edges in images.This typically allows one to find a suitable system among the already very well exploredrepresentation systems such as the Fourier basis, wavelets, or shearlets, to name a few.

488 Gitta Kutyniok
The advantage of this approach is the already explored structure of the system, whichcan hence be exploited for deriving theoretical results on the accuracy of separation, andthe speed of associated transforms.
The second path uses a training set of data similar to the to-be-extracted component,and “learns” a system which best sparsifies this data set. Using this approach customarilyreferred to as dictionary learning, we obtain a system extremely well adapted to thedata at hand; as the state of the art we would like to mention the K-SVD algorithmintroduced by Aahron, Elad, and Bruckstein in [1]; see also [17] for a “CompressedSensing” perspective to K-SVD. Another appealing dictionary training algorithm, whichshould be cited is the method of optimal directions (MOD) by Engan et al. [21]. Thedownside however is the lack of a mathematically exploitable structure, which makes atheoretical analysis of the accuracy of separation using such a system very hard.
11.1.5 Outline
In Section 11.2, we discuss the formal mathematical setting of the problem, presentthe nowadays already considered classical separation results, and then discuss morerecent results exploiting the clustering of significant coefficients in the expansions ofthe components as a means to measure their morphological difference. We conclude thissection by revealing a close link of data separation to uncertainty principles. Section11.3 is then devoted to both theoretical results as well as applications for separation of1-D signals, elaborating, in particular, on the separation of sinusoids and spikes. Finally,Section 11.4 focuses on diverse questions concerning separation of 2-D signals, i.e.,images, such as the separation of point- and curvelike objects, again presenting bothapplication aspects as well as theoretical results.
11.2 Separation estimates
As already mentioned in the introduction, data separation can be regarded within theframework of underdetermined problems. In this section, we make this link mathemati-cally precise. Then we discuss general estimates on the separability of composed data,firstly without any knowledge of the geometric structure of sparsity patterns, and sec-ondly, by taking known geometric information into account. A revelation of the closerelation with uncertainty principles concludes the section.
In Sections 11.3 and 11.4, we will then see the presented general results and uncertaintyprinciples in action, i.e., applied to real-world separation problems.
11.2.1 Relation with underdetermined problems
Let x be our signal of interest, which we for now consider as belonging to some Hilbertspace H, and assume that
x = x01 +x0
2.

Data separation by sparse representations 489
Certainly, real data are typically composed of multiple components, hence not only thesituation of two components, but three or more is of interest. We will however focuson the two-component situation to clarify the fundamental principles behind the successof separating those by sparsity methodologies. It should be mentioned though that, infact, most of the presented theoretical results can be extended to the multiple componentsituation in a more or less straightforward manner.
To extract the two components from x, we need to assume that – although we are notgiven x0
1 and x02 – certain “ characteristics” of those components are known to us. Such
“characteristics” might be, for instance, the pointlike structure of stars and the curvelikestructure of filaments in astronomical imaging. This knowledge now enables us to choosetwo representation systems, Φ1 and Φ2, say, which allow sparse expansions of x0
1 andx0
2, respectively. Such representation systems might be chosen from the collection ofwell-known systems such as wavelets. A different possibility is to choose adaptivelythe systems via dictionary learning procedures. This approach however requires trainingdata sets for the two components x0
1 and x02 as discussed in Subsection 11.1.4.
Given now two such representation systems Φ1 and Φ2, we can write x as
x = x01 +x0
2 = Φ1c01 +Φ2c
02 = [Φ1 |Φ2 ]
[c01
c02
]with ‖c0
1‖0 and ‖c02‖0 “sufficiently small.” Thus, the data separation problem has been
reduced to solving the underdetermined linear system
x = [Φ1 |Φ2 ]
[c1
c2
](11.1)
for [c1, c2]T . Unique recovery of the original vector [c0
1, c02]
T automatically extracts thecorrect two components x0
1 and x02 from x, since
x01 = Φ1c
01 and x0
2 = Φ2c02.
Ideally, one might want to solve
minc1,c2
‖c1‖0 + ‖c2‖0 s.t. x = [Φ1 |Φ2 ]
[c1
c2
], (11.2)
which however is an NP-hard problem. As already discussed in the introduction(Chapter 1), instead one aims to solve the 1 minimization problem
(Seps) minc1,c2
‖c1‖1 + ‖c2‖1 s.t. x = [Φ1 |Φ2 ]
[c1
c2
]. (11.3)
The lower case “s” in Seps indicates that the 1 norm is placed on the synthesis side.Other choices for separation are, for instance, greedy-type algorithms – and we refer thereader to the introduction (Chapter 1) and Chapter 8. In this chapter we will focus on 1

490 Gitta Kutyniok
minimization as the separation technique, consistent with most known separation resultsfrom the literature.
Before discussing conditions on [c01, c
02]
T and [ Φ1 | Φ2 ], which guarantee uniquesolvability of (11.1), let us for a moment debate whether uniqueness is necessary at all.If Φ1 and Φ2 form bases, it is certainly essential to recover [c0
1, c02]
T uniquely from (11.1).However, some well-known representation systems are in fact redundant and typicallyconstitute Parseval frames such as curvelets or shearlets. Also, systems generated bydictionary learning are normally highly redundant. In this situation, for each possibleseparation
x = x1 +x2, (11.4)
there exist infinitely many coefficient sequences [c1, c2]T satisfying
x1 = Φ1c1 and x2 = Φ2c2. (11.5)
Since we are only interested in the correct separation and not in computing the sparsestexpansion, we can circumvent presumably arising numerical instabilities when solvingthe minimization problem (11.3) by selecting a particular coefficient sequence for eachseparation. Assuming Φ1 and Φ2 are Parseval frames, we can exploit this structure andrewrite (11.5) as
x1 = Φ1(ΦT1 x1) and x2 = Φ2(Φ
T2 x2).
Thus, for each separation (11.4), we choose a specific coefficient sequence when expand-ing the components in the Parseval frames; in fact, we choose the analysis sequence.This leads to the following different 1 minimization problem in which the 1 norm isplaced on the analysis rather than the synthesis side:
(Sepa) minx1,x2
‖ΦT1 x1‖1 + ‖ΦT
2 x2‖1 s.t. x = x1 +x2. (11.6)
This new minimization problem can be also regarded as a mixed 1-2 problem, sincethe analysis coefficient sequence is exactly the coefficient sequence which is minimal inthe 2 norm. For more information, we refer to Chapter 2.
11.2.2 General separation estimates
Let us now discuss the main results of successful data separation, i.e., stating conditionson [c0
1, c02]
T and [Φ1 |Φ2 ] for extracting x01 and x0
2 from x. The strongest known generalresult was derived in 2003 by Donoho and Elad [10] and simultaneously by Gribonvaland Nielsen [23] and used the notion of mutual coherence. Recall that, for a normalizedframe Φ = (ϕi)i∈I , the mutual coherence of Φ is defined by
µ(Φ) = maxi,j∈I,i =j
|〈ϕi,ϕj〉|. (11.7)
We remark that the result by Donoho and Elad was already stated in the introduction,however without a proof, which we will present in this section. For the convenience ofthe reader, we recall the relevant result.

Data separation by sparse representations 491
theorem 11.1 ([10, 23]) Let Φ1 and Φ2 be two frames for a Hilbert space H, and letx ∈H. If x = [Φ1|Φ2]c and
‖c‖0 <1
2
(1+
1
µ([Φ1|Φ2])
),
then c is the unique solution of the 1 minimization problem (Seps) stated in (11.3) aswell as the unique solution of the 0 minimization problem stated in (11.2).
Before presenting the proof, we require some prerequisites. Firstly, we need to intro-duce a slightly stronger version of the null space property than the one discussed in theintroduction.
definition 11.1 Let Φ = (ϕi)i∈I be a frame for a Hilbert space H, and let N (Φ)
denote the null space of Φ. Then Φ is said to have the null space property of order k if
‖1Λd‖1 <1
2‖d‖1
for all d ∈N (Φ) \ 0 and for all sets Λ ⊆ I with |Λ| ≤ k.
This notion provides a very useful characterization of the existence of unique sparsesolutions of the 1 minimization problem (Seps) stated in (11.3).
lemma 11.1 Let Φ = (ϕi)i∈I be a frame for a Hilbert space H, and let k ∈ N. Thenthe following conditions are equivalent.
(i) For each x ∈H, if x = Φc satisfies ‖c‖0 ≤ k, then c is the unique solution of the 1minimization problem (Seps) stated in (11.3), (with Φ instead of [Φ1|Φ2]).
(ii) Φ satisfies the null space property of order k.
Proof. First, assume that (i) holds. Let d ∈ N (Φ) \ 0 and Λ ⊆ I with |Λ| ≤ k bearbitrary. Then, by (i), the sparse vector 1Λd is the unique minimizer of ‖c‖1 subject toΦc = Φ(1Λd). Further, since d ∈N (Φ) \ 0,
Φ(−1Λcd) = Φ(1Λd).
Hence
‖1Λd‖1 < ‖1Λcd‖1,
or, in other words,
‖1Λd‖1 <1
2‖d‖1,
which implies (ii), since d and Λ were chosen arbitrarily.Secondly, assume that (ii) holds, and let c1 be a vector satisfying x = Φc1 with ‖c1‖0
≤ k and support denoted by Λ. Further, let c2 be an arbitrary solution of x = Φc, and set
d = c2 − c1.

492 Gitta Kutyniok
Then
‖c2‖1 −‖c1‖1 = ‖1Λcc2‖1 + ‖1Λc2‖1 −‖1Λc1‖1 ≥ ‖1Λcd‖1 −‖1Λd‖1.
This term is greater than zero for any d = 0 if
‖1Λcd‖1 > ‖1Λd‖1,
or1
2‖d‖1 > ‖1Λd‖1.
This is ensured by (ii). Hence ‖c2‖1 > ‖c1‖1, and thus c1 is the unique solution of (Seps).This implies (i).
Using this result, we next prove that a solution satisfying ‖c‖0 < 12
(1+ 1
µ(Φ)
)is the
unique solution of the 1 minimization problem (Seps).
lemma 11.2 Let Φ = (ϕi)i∈I be a frame for a Hilbert space H, and let x ∈ H. Ifx = Φc and
‖c‖0 <1
2
(1+
1
µ(Φ)
),
then c is the unique solution of the 1 minimization problem (Seps) stated in (11.3) (withΦ instead of [Φ1|Φ2]).
Proof. Let d ∈N (Φ) \ 0, hence, in particular,
Φd = 0;
thus alsoΦT Φd = 0. (11.8)
Without loss of generality, we now assume that the vectors in Φ are normalized. Then,(11.8) implies that, for all i ∈ I ,
di = −∑j =i
〈ϕi,ϕj〉dj .
Using the definition of mutual coherence µ(Φ) (cf. Introduction (Chapter 1) or (11.7)),we obtain
|di| ≤∑j =i
|〈ϕi,ϕj〉| · |dj | ≤ µ(Φ)(‖d‖1 −|di|),
and hence
|di| ≤(
1+1
µ(Φ)
)−1
‖d‖1.
Thus, by the hypothesis on ‖c‖0 and for any Λ ⊆ I with |Λ| = ‖c‖0, we have
‖1Λd‖1 ≤ |Λ| ·(
1+1
µ(Φ)
)−1
‖d‖1 = ‖c‖0 ·(
1+1
µ(Φ)
)−1
‖d‖1 <1
2‖d‖1.

Data separation by sparse representations 493
This shows that Φ satisfies the null space property of order ‖c‖0, which, by Lemma 11.1,implies that c is the unique solution of (Seps).
We further prove that a solution satisfying ‖c‖0 < 12
(1+ 1
µ(Φ)
)is also the unique
solution of the 0 minimization problem.
lemma 11.3 Let Φ = (ϕi)i∈I be a frame for a Hilbert space H, and let x ∈ H. Ifx = Φc and
‖c‖0 <1
2
(1+
1
µ(Φ)
),
then c is the unique solution of the 0 minimization problem stated in (11.2) (with Φ
instead of [Φ1|Φ2]).
Proof. By Lemma 11.2, the hypotheses imply that c is the unique solution of the 1minimization problem (Seps). Now, towards a contradiction, assume that there existssome c satisfying x = Φc with ‖c‖0 ≤ ‖c‖0. Then c must satisfy
‖c‖0 <1
2
(1+
1
µ(Φ)
).
Again, by Lemma 11.2, c is the unique solution of the 1 minimization problem (Seps),a contradiction.
These lemmata now immediately imply Theorem 11.1.
Proof of Theorem 11.1. Theorem 11.1 follows from Lemmata 11.2 and 11.3.
Interestingly, in the situation of Φ1 and Φ2 being two orthonormal bases the boundcan be slightly strengthened. For the proof of this result, we refer the reader to [19].
theorem 11.2 ([19]) Let Φ1 and Φ2 be two orthonormal bases for a Hilbert spaceH, and let x ∈H. If x = [Φ1|Φ2]c and
‖c‖0 <
√2− 0.5
µ([Φ1|Φ2]),
then c is the unique solution of the 1 minimization problem (Seps) stated in (11.3) aswell as the unique solution of the 0 minimization problem stated in (11.2).
This shows that in the special situation of two orthonormal bases, the bound is nearlya factor of 2 stronger than in the general situation of Theorem 11.1.
11.2.3 Clustered sparsity as a novel viewpoint
In a concrete situation, we often have more information on the geometry of the to-be-separated components x0
1 and x02. This information is typically encoded in a particular
clustering of the nonzero coefficients if a suitable basis or frame for the expansion ofx0
1 or x02 is chosen. Think, for instance, of the tree clustering of wavelet coefficients
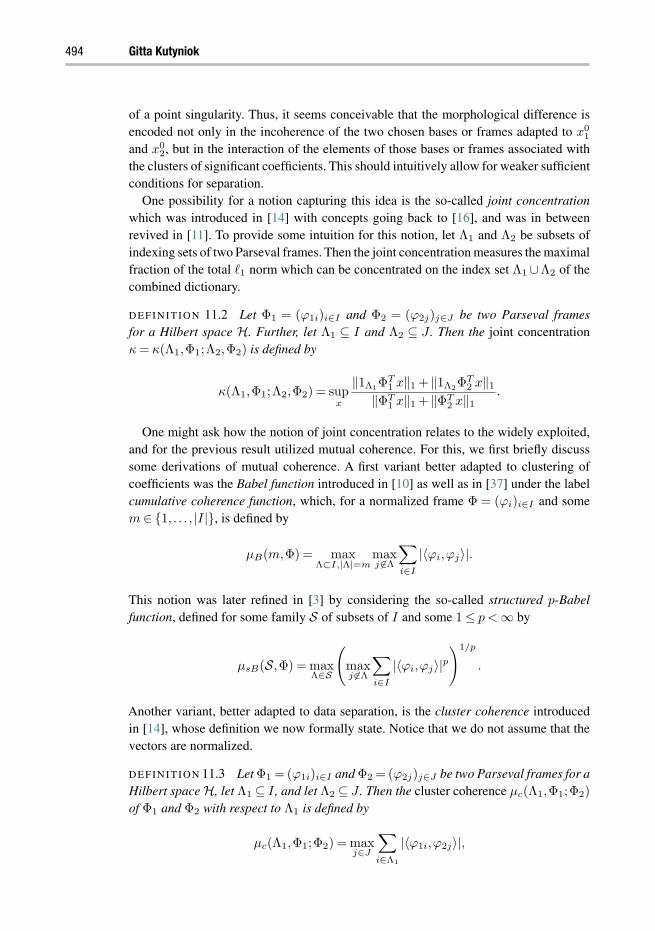
494 Gitta Kutyniok
of a point singularity. Thus, it seems conceivable that the morphological difference isencoded not only in the incoherence of the two chosen bases or frames adapted to x0
1and x0
2, but in the interaction of the elements of those bases or frames associated withthe clusters of significant coefficients. This should intuitively allow for weaker sufficientconditions for separation.
One possibility for a notion capturing this idea is the so-called joint concentrationwhich was introduced in [14] with concepts going back to [16], and was in betweenrevived in [11]. To provide some intuition for this notion, let Λ1 and Λ2 be subsets ofindexing sets of two Parseval frames. Then the joint concentration measures the maximalfraction of the total 1 norm which can be concentrated on the index set Λ1 ∪Λ2 of thecombined dictionary.
definition 11.2 Let Φ1 = (ϕ1i)i∈I and Φ2 = (ϕ2j)j∈J be two Parseval framesfor a Hilbert space H. Further, let Λ1 ⊆ I and Λ2 ⊆ J . Then the joint concentrationκ = κ(Λ1,Φ1;Λ2,Φ2) is defined by
κ(Λ1,Φ1;Λ2,Φ2) = supx
‖1Λ1ΦT1 x‖1 + ‖1Λ2Φ
T2 x‖1
‖ΦT1 x‖1 + ‖ΦT
2 x‖1.
One might ask how the notion of joint concentration relates to the widely exploited,and for the previous result utilized mutual coherence. For this, we first briefly discusssome derivations of mutual coherence. A first variant better adapted to clustering ofcoefficients was the Babel function introduced in [10] as well as in [37] under the labelcumulative coherence function, which, for a normalized frame Φ = (ϕi)i∈I and somem ∈ 1, . . . , |I|, is defined by
µB(m,Φ) = maxΛ⊂I,|Λ|=m
maxj ∈Λ
∑i∈I
|〈ϕi,ϕj〉|.
This notion was later refined in [3] by considering the so-called structured p-Babelfunction, defined for some family S of subsets of I and some 1 ≤ p < ∞ by
µsB(S,Φ) = maxΛ∈S
(maxj ∈Λ
∑i∈I
|〈ϕi,ϕj〉|p)1/p
.
Another variant, better adapted to data separation, is the cluster coherence introducedin [14], whose definition we now formally state. Notice that we do not assume that thevectors are normalized.
definition 11.3 Let Φ1 = (ϕ1i)i∈I and Φ2 = (ϕ2j)j∈J be two Parseval frames for aHilbert space H, let Λ1 ⊆ I , and let Λ2 ⊆ J . Then the cluster coherence µc(Λ1,Φ1;Φ2)
of Φ1 and Φ2 with respect to Λ1 is defined by
µc(Λ1,Φ1;Φ2) = maxj∈J
∑i∈Λ1
|〈ϕ1i,ϕ2j〉|,

Data separation by sparse representations 495
and the cluster coherence µc(Φ1;Λ2,Φ2) of Φ1 and Φ2 with respect to Λ2 is defined by
µc(Φ1;Λ2,Φ2) = maxi∈I
∑j∈Λ2
|〈ϕ1i,ϕ2j〉|.
The relation between joint concentration and cluster coherence is made precise in thefollowing result from [14].
proposition 11.1 ([14]) Let Φ1 = (ϕ1i)i∈I and Φ2 = (ϕ2j)j∈J be two Parsevalframes for a Hilbert space H, and let Λ1 ⊆ I and Λ2 ⊆ J . Then
κ(Λ1,Φ1;Λ2,Φ2) ≤ maxµc(Λ1,Φ1;Φ2),µc(Φ1;Λ2,Φ2).
Proof. Let x ∈H. We now choose coefficient sequences c1 and c2 such that
x = Φ1c1 = Φ2c2
and, for i = 1,2,‖ci‖1 ≤ ‖di‖1 for all di with x = Φidi. (11.9)
This implies that
‖1Λ1ΦT1 x‖1 + ‖1Λ2Φ
T2 x‖1
= ‖1Λ1ΦT1 Φ2c2‖1 + ‖1Λ2Φ
T2 Φ1c1‖1
≤∑i∈Λ1
∑j∈J
|〈ϕ1i,ϕ2j〉||c2j |
+∑j∈Λ2
(∑i∈I
|〈ϕ1i,ϕ2j〉||c1i|)
=∑j∈J
(∑i∈Λ1
|〈ϕ1i,ϕ2j〉|)
|c2j |+∑i∈I
∑j∈Λ2
|〈ϕ1i,ϕ2j〉|
|c1i|
≤ µc(Λ1,Φ1;Φ2)‖c2‖1 +µc(Φ1;Λ2,Φ2)‖c1‖1
≤ maxµc(Λ1,Φ1;Φ2),µc(Φ1;Λ2,Φ2)(‖c1‖1 + ‖c2‖1).
Since Φ1 and Φ2 are Parseval frames, we have
x = Φi(ΦTi Φici) for i = 1,2.
Hence, by exploiting (11.9),
‖1Λ1ΦT1 x‖1 + ‖1Λ2Φ
T2 x‖1
≤ maxµc(Λ1,Φ1;Φ2),µc(Φ1;Λ2,Φ2)(‖ΦT1 Φ1c1‖1 + ‖ΦT
2 Φ2c2‖1)
= maxµc(Λ1,Φ1;Φ2),µc(Φ1;Λ2,Φ2)(‖ΦT1 x‖1 + ‖ΦT
2 x‖1).

496 Gitta Kutyniok
Before stating the data separation estimate which uses joint concentration, we need todiscuss the conditions on sparsity of the components in the two Parseval frames. Sincefor real data “true sparsity” is unrealistic, a weaker condition will be imposed. In theintroduction (Chapter 1), compressibility was already introduced. For the next result, yeta different notion invoking the clustering of the significant coefficients will be required.This notion, first utilized in [9], is defined for our data separation problem as follows.
definition 11.4 Let Φ1 = (ϕ1i)i∈I and Φ2 = (ϕ2j)j∈J be two Parseval frames fora Hilbert space H, and let Λ1 ⊆ I and Λ2 ⊆ J . Further, suppose that x ∈ H can bedecomposed as x = x0
1 + x02. Then the components x0
1 and x02 are called δ-relatively
sparse in Φ1 and Φ2 with respect to Λ1 and Λ2, if
‖1Λc1ΦT
1 x01‖1 + ‖1Λc
2ΦT
2 x02‖1 ≤ δ.
We now have all ingredients to state the data separation result from [14], which –as compared to Theorem 11.1 – now invokes information about the clustering ofcoefficients.
theorem 11.3 ([14]) Let Φ1 = (ϕ1i)i∈I and Φ2 = (ϕ2j)j∈J be two Parseval framesfor a Hilbert space H, and suppose that x ∈ H can be decomposed as x = x0
1 + x02.
Further, let Λ1 ⊆ I and Λ2 ⊆ J be chosen such that x01 and x0
2 are δ-relatively sparse inΦ1 and Φ2 with respect to Λ1 and Λ2. Then the solution (x
1,x2) of the 1 minimization
problem (Sepa) stated in (11.6) satisfies
‖x1 −x0
1‖2 + ‖x2 −x0
2‖2 ≤ 2δ
1− 2κ.
Proof. First, using the fact that Φ1 and Φ2 are Parseval frames,
‖x1 −x0
1‖2 + ‖x2 −x0
2‖2 = ‖ΦT1 (x
1 −x01)‖2 + ‖ΦT
2 (x2 −x0
2)‖2
≤ ‖ΦT1 (x
1 −x01)‖1 + ‖ΦT
2 (x2 −x0
2)‖1.
The decomposition x01 +x0
2 = x = x1 +x
2 implies
x2 −x0
2 = −(x1 −x0
1),
which allows us to conclude that
‖x1 −x0
1‖2 + ‖x2 −x0
2‖2 ≤ ‖ΦT1 (x
1 −x01)‖1 + ‖ΦT
2 (x1 −x0
1)‖1. (11.10)

Data separation by sparse representations 497
By the definition of κ,
‖ΦT1 (x
1 −x01)‖1 + ‖ΦT
2 (x1 −x0
1)‖1
= (‖1Λ1ΦT1 (x
1 −x01)‖1 + ‖1Λ2Φ
T2 (x
1 −x01)‖1)+ ‖1Λc
1ΦT
1 (x1 −x0
1)‖1
+ ‖1Λc2ΦT
2 (x2 −x0
2)‖1
≤ κ ·(‖ΦT
1 (x1 −x0
1)‖1 + ‖ΦT2 (x
1 −x01)‖1
)+ ‖1Λc
1ΦT
1 (x1 −x0
1)‖1
+ ‖1Λc2ΦT
2 (x2 −x0
2)‖1,
which yields
‖ΦT1 (x
1 −x01)‖1 + ‖ΦT
2 (x1 −x0
1)‖1
≤ 1
1−κ(‖1Λc
1ΦT
1 (x1 −x0
1)‖1 + ‖1Λc2ΦT
2 (x2 −x0
2)‖1)
≤ 1
1−κ(‖1Λc
1ΦT
1 x1‖1 + ‖1Λc
1ΦT
1 x01‖1 + ‖1Λc
2ΦT
2 x2‖1 + ‖1Λc
2ΦT
2 x02‖1).
Now using the relative sparsity of x01 and x0
2 in Φ1 and Φ2 with respect to Λ1 and Λ2,we obtain
‖ΦT1 (x
1 −x01)‖1 + ‖ΦT
2 (x1 −x0
1)‖1 ≤ 1
1−κ
(‖1Λc
1ΦT
1 x1‖1 + ‖1Λc
2ΦT
2 x2‖1 + δ
).
(11.11)By the minimality of x
1 and x2 as solutions of (Sepa) implying that
2∑i=1
(‖1Λc
iΦT
i xi ‖1 + ‖1Λi
ΦTi x
i ‖1)= ‖ΦT
1 x1‖1 + ‖ΦT
2 x2‖1
≤ ‖ΦT1 x0
1‖1 + ‖ΦT2 x0
2‖1,
we have
‖1Λc1ΦT
1 x1‖1 + ‖1Λc
2ΦT
2 x2‖1
≤ ‖ΦT1 x0
1‖1 + ‖ΦT2 x0
2‖1 −‖1Λ1ΦT1 x
1‖1 −‖1Λ2ΦT2 x
2‖1
≤ ‖ΦT1 x0
1‖1 + ‖ΦT2 x0
2‖1 + ‖1Λ1ΦT1 (x
1 −x01)‖1 −‖1Λ1Φ
T1 x0
1‖1
+ ‖1Λ2ΦT2 (x
2 −x02)‖1 −‖1Λ2Φ
T2 x0
2‖1.
Again exploiting relative sparsity leads to
‖1Λc1ΦT
1 x1‖1 + ‖1Λc
2ΦT
2 x2‖1 ≤ ‖1Λ1Φ
T1 (x
1 −x01)‖1 + ‖1Λ2Φ
T2 (x
2 −x02)‖1 + δ.
(11.12)
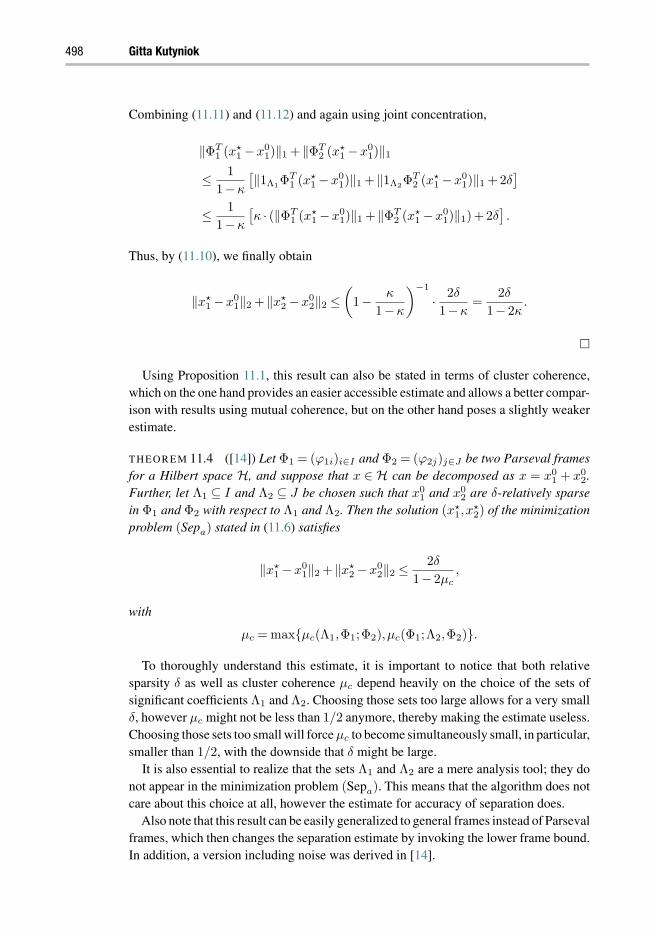
498 Gitta Kutyniok
Combining (11.11) and (11.12) and again using joint concentration,
‖ΦT1 (x
1 −x01)‖1 + ‖ΦT
2 (x1 −x0
1)‖1
≤ 1
1−κ
[‖1Λ1Φ
T1 (x
1 −x01)‖1 + ‖1Λ2Φ
T2 (x
1 −x01)‖1 +2δ
]≤ 1
1−κ
[κ · (‖ΦT
1 (x1 −x0
1)‖1 + ‖ΦT2 (x
1 −x01)‖1)+2δ
].
Thus, by (11.10), we finally obtain
‖x1 −x0
1‖2 + ‖x2 −x0
2‖2 ≤(
1− κ
1−κ
)−1
· 2δ
1−κ=
2δ
1− 2κ.
Using Proposition 11.1, this result can also be stated in terms of cluster coherence,which on the one hand provides an easier accessible estimate and allows a better compar-ison with results using mutual coherence, but on the other hand poses a slightly weakerestimate.
theorem 11.4 ([14]) Let Φ1 = (ϕ1i)i∈I and Φ2 = (ϕ2j)j∈J be two Parseval framesfor a Hilbert space H, and suppose that x ∈ H can be decomposed as x = x0
1 + x02.
Further, let Λ1 ⊆ I and Λ2 ⊆ J be chosen such that x01 and x0
2 are δ-relatively sparsein Φ1 and Φ2 with respect to Λ1 and Λ2. Then the solution (x
1,x2) of the minimization
problem (Sepa) stated in (11.6) satisfies
‖x1 −x0
1‖2 + ‖x2 −x0
2‖2 ≤ 2δ
1− 2µc,
with
µc = maxµc(Λ1,Φ1;Φ2),µc(Φ1;Λ2,Φ2).
To thoroughly understand this estimate, it is important to notice that both relativesparsity δ as well as cluster coherence µc depend heavily on the choice of the sets ofsignificant coefficients Λ1 and Λ2. Choosing those sets too large allows for a very smallδ, however µc might not be less than 1/2 anymore, thereby making the estimate useless.Choosing those sets too small will force µc to become simultaneously small, in particular,smaller than 1/2, with the downside that δ might be large.
It is also essential to realize that the sets Λ1 and Λ2 are a mere analysis tool; they donot appear in the minimization problem (Sepa). This means that the algorithm does notcare about this choice at all, however the estimate for accuracy of separation does.
Also note that this result can be easily generalized to general frames instead of Parsevalframes, which then changes the separation estimate by invoking the lower frame bound.In addition, a version including noise was derived in [14].

Data separation by sparse representations 499
11.2.4 Relation with uncertainty principles
Intriguingly, there exists a very close connection between uncertainty principles and dataseparation problems. Given a signal x ∈H and two bases or frames Φ1 and Φ2, looselyspeaking, an uncertainty principle states that x cannot be sparsely represented by Φ1
and Φ2 simultaneously; one of the expansions is always not sparse unless x = 0. For therelation to the “classical” uncertainty principle, we refer to Subsection 11.3.1.
The first result making this uncertainty viewpoint precise was proven in [19] withideas already lurking in [16] and [11]. Again, it turns out that the mutual coherenceis an appropriate measure for allowed sparsity, here serving as a lower bound for thesimultaneously achievable sparsity of two expansions.
theorem 11.5 ([19]) Let Φ1 and Φ2 be two orthonormal bases for a Hilbert spaceH, and let x ∈H, x = 0. Then
‖ΦT1 x‖0 + ‖ΦT
2 x‖0 ≥ 2
µ([Φ1|Φ2]).
Proof. First, let Φ1 = (ϕ1i)i∈I and Φ2 = (ϕ2j)j∈J . Further, let Λ1 ⊆ I and Λ2 ⊂ J
denote the support of ΦT1 x and ΦT
2 x, respectively. Since x = Φ1ΦT1 x, for each j ∈ J ,
|(ΦT2 x)j | =
∣∣∣∣∣∑i∈Λ1
(ΦT1 x)i〈ϕ1i,ϕ2j〉
∣∣∣∣∣ . (11.13)
Since Φ1 and Φ2 are orthonormal bases, we have
‖x‖2 = ‖ΦT1 x‖2 = ‖ΦT
2 x‖2. (11.14)
Using in addition the Cauchy–Schwarz inequality, we can continue (11.13) by
|(ΦT2 x)j |2 ≤ ‖ΦT
1 x‖22 ·∣∣∣∣∣∑i∈Λ1
|〈ϕ1i,ϕ2j〉|2∣∣∣∣∣≤ ‖x‖2
2 · |Λ1| ·µ([Φ1|Φ2])2.
This implies
‖ΦT2 x‖2 =
∑j∈Λ2
|(ΦT2 x)j |2
1/2
≤ ‖x‖2 ·√
|Λ1| · |Λ2| ·µ([Φ1|Φ2]).
Since |Λi| = ‖ΦTi x‖0, i = 1,2, and again using (11.14), we obtain√
‖ΦT1 x‖0 · ‖ΦT
2 x‖0 ≥ 1
µ([Φ1|Φ2]).
Using the geometric–algebraic relationship,
1
2(‖ΦT
1 x‖0 + ‖ΦT2 x‖0) ≥
√‖ΦT
1 x‖0 · ‖ΦT2 x‖0 ≥ 1
µ([Φ1|Φ2]),
which proves the claim.

500 Gitta Kutyniok
This result can be easily connected to the problem of simultaneously sparse expansions.The following version was first explicitly stated in [4].
theorem 11.6 ([4]) Let Φ1 and Φ2 be two orthonormal bases for a Hilbert spaceH, and let x ∈ H, x = 0. Then, for any two distinct coefficient sequences ci satisfyingx = [Φ1|Φ2]ci, i = 1,2, we have
‖c1‖0 + ‖c2‖0 ≥ 2
µ([Φ1|Φ2]).
Proof. First, set d = c1 − c2 and partition d into [dΦ1 ,dΦ2 ]T such that
0 = [Φ1|Φ2]d = Φ1dΦ1 +Φ2dΦ2 .
Since Φ1 and Φ2 are bases and d = 0, the vector y defined by
y = Φ1dΦ1 = −Φ2dΦ2
is nonzero. Applying Theorem 11.5, we obtain
‖d‖0 = ‖dΦ1‖0 + ‖dΦ2‖0 ≥ 2
µ([Φ1|Φ2]).
Since d = c1 − c2, we have
‖c1‖0 + ‖c2‖0 ≥ ‖d‖0 ≥ 2
µ([Φ1|Φ2]).
We would also like to mention the very recent paper [39] by Tropp, in which he studiesuncertainty principles for random sparse signals over an incoherent dictionary. He, inparticular, shows that the coefficient sequence of each non-optimal expansion of a signalcontains far more nonzero entries than the one of the sparsest expansion.
11.3 Signal separation
In this section, we study the special situation of signal separation, where we refer to 1-Dsignals as opposed to images, etc. For this, we start with the most prominent example ofseparating sinusoids from spikes, and then discuss further problem classes.
11.3.1 Separation of sinusoids and spikes
Sinusoidal and spike components are intuitively the morphologically most distinct fea-tures of a signal, since one is periodic and the other transient. Thus, it seems natural that

Data separation by sparse representations 501
the first results using sparsity and 1 minimization for data separation were proven forthis situation. Certainly, real-world signals are never a pristine combination of sinusoidsand spikes. However, thinking of audio data from a recording of musical instruments,these components are indeed an essential part of such signals.
The separation problem can be generally stated in the following way: Let the vectorx ∈ Rn consist of n samples of a continuum domain signal at times t ∈ 0, . . . ,n− 1.We assume that x can be decomposed into
x = x01 +x0
2.
Here x01 shall consist of n samples – at the same points in time as x – of a continuum
domain signal of the form
1√n
n−1∑ω=0
c01ωe2πiωt/n, t ∈ R.
Thus, by letting Φ1 = (ϕ1ω)0≤ω≤n−1 denote the Fourier basis, i.e.,
ϕ1ω =(
1√ne2πiωt/n
)0≤t≤n−1
,
the discrete signal x01 can be written as
x01 = Φ1c
01 with c0
1 = (c01ω)0≤ω≤n−1.
If x01 is now the superposition of very few sinusoids, then the coefficient vector c0
1 issparse.
Further, consider a continuum domain signal which has a few spikes. Sampling thissignal at n samples at times t ∈ 0, . . . ,n− 1 leads to a discrete signal x0
2 ∈ Rn whichhas very few nonzero entries. In order to expand x0
2 in terms of a suitable representationsystem, we let Φ2 denote the Dirac basis, i.e., Φ2 is simply the identity matrix, and write
x02 = Φ2c
02,
where c02 is then a sparse coefficient vector.
The task now consists in extracting x01 and x0
2 from the known signal x, which isillustrated in Figure 11.1. It will be illuminating to detect the dependence on the numberof sampling points of the bound for the sparsity of c0
1 and c02 which still allows for
separation via 1 minimization.The intuition that – from a morphological standpoint – this situation is extreme, can
be seen by computing the mutual coherence between the Fourier basis Φ1 and the Diracbasis Φ2. For this, we obtain
µ([Φ1|Φ2]) =1√n
, (11.15)
and, in fact, 1/√
n is the minimal possible value. This can be easily seen: If Φ1 and Φ2
are two general orthonormal bases of Rn, then ΦT1 Φ2 is an orthonormal matrix. Hence

502 Gitta Kutyniok
0 50 100 150 200 250–1
–0.50
0.51
0 50 100 150 200 250–1
–0.50
0.51
0 50 100 150 200 250–1
–0.50
0.51
=
+
Figure 11.1 Separation of artificial audio data into sinusoids and spikes.
the sum of squares of its entries equals n, which implies that all entries can not be lessthan 1/
√n.
The following result from [19] makes this dependence precise. We wish to mentionthat the first answer to this question was derived in [11]. In this paper the slightlyweaker bound of (1+
√n)/2 for ‖c0
1‖0 + ‖c02‖0 was proven by using the general result
in Theorem 11.1 instead of the more specialized Theorem 11.2 exploited to derive theresult from [19] stated below.
theorem 11.7 ([19]) Let Φ1 be the Fourier basis for Rn and let Φ2 be the Dirac basisfor Rn. Further, let x ∈ Rn be the signal
x = x01 +x0
2, where x01 = Φ1c
01 and x0
2 = Φ2c02,
with coefficient vectors c0i ∈ Rn, i = 1,2. If
‖c01‖0 + ‖c0
2‖0 < (√
2− 0.5)√
n,
then the 1 minimization problem (Seps) stated in (11.3) recovers c01 and c0
2 uniquely,and hence extracts x0
1 and x02 from x precisely.
Proof. Recall that we have (cf. (11.15))
µ([Φ1|Φ2]) =1√n
.
Hence, by Theorem 11.2, the 1 minimization problem (Seps) recovers c01 and c0
2uniquely, provided that
‖c01‖0 + ‖c0
2‖0 <
√2− 0.5
µ([Φ1|Φ2])= (
√2− 0.5)
√n.
The theorem is proved.
The classical uncertainty principle states that, roughly speaking, a function cannotboth be localized in time as well as in frequency domain. A discrete version of this funda-mental principle was – besides the by now well-known continuum domain Donoho–Stark

Data separation by sparse representations 503
uncertainty principle – derived in [16]. It showed that a discrete signal and its Fouriertransform cannot both be highly localized in the sense of having “very few” nonzeroentries. We will now show that this result – as it was done in [11] – can be interpreted asa corollary from data separation results.
theorem 11.8 ([16]) Let x∈ Rn, x = 0, and denote its Fourier transform by x. Then
‖x‖0 + ‖x‖0 ≥ 2√
n.
Proof. For the proof, we intend to use Theorem 11.5. First, we note that by letting Φ1
denote the Dirac basis, we trivially have
‖ΦT1 x‖0 = ‖x‖0.
Secondly, letting Φ2 denote the Fourier basis, we obtain
x = ΦT2 x.
Now recalling that, by (11.15),
µ([Φ1|Φ2]) =1√n
,
we can conclude from Theorem 11.5 that
‖x‖0 + ‖x‖0 = ‖ΦT1 x‖0 + ‖ΦT
2 x‖0 ≥ 2
µ([Φ1|Φ2])= 2
√n.
This finishes the proof.
As an excellent survey about sparsity of expansions of signals in the Fourier and Diracbases, data separation, and related uncertainty principles as well as on very recent resultsusing random signals, we refer to [38].
11.3.2 Further variations
Let us briefly mention the variety of modifications of the previously discussed setting,most of them empirical analyses, which were developed during the last few years.
The most common variation of the sinusoid and spike setting is the consideration ofa more general periodic component, which is then considered to be sparse in a Gaborsystem, superimposed by a second component, which is considered to be sparse in asystem sensitive to spike-like structures similar to wavelets. This is, for instance, thesituation considered in [22]. An example for a different setting is the substitution of aGabor system by a Wilson basis, analyzed in [3]. In this paper, as mentioned in Subsection11.2.3, the clustering of coefficients already plays an essential role. It should also bementioned that a specifically adapted norm, namely the mixed 1,2 or 2,1 norm, is usedin [25] to take advantage of this clustering, and various numerical experiments showsuccessful separation.

504 Gitta Kutyniok
11.4 Image separation
This section is devoted to discussing results on image separation exploiting Morphologi-cal Component Analysis, first focussing on empirical studies and secondly on theoreticalresults.
11.4.1 Empirical results
In practice, the observed signal x is often contaminated by noise, i.e., x = x01 +x0
2 +n
containing the to-be-extracted components x01 and x0
2 and some noise n. This requires anadaption of the 1 minimization problem.As proposed in numerous publications, one typ-ically considers a modified optimization problem – so-called Basis Pursuit Denoising –which can be obtained by relaxing the constraint in order to deal with noisy observedsignals. The 1 minimization problem (Seps) stated in (11.3), which places the 1 normon the synthesis side then takes the form:
minc1,c2
‖c1‖1 + ‖c2‖1 +λ‖x−Φ1c1 −Φ2c2‖22
with appropriately chosen regularization parameter λ > 0. Similarly, we can considerthe relaxed form of the 1 minimization problem (Sepa) stated in (11.6), which placesthe 1 norm on the analysis side:
minx1,x2
‖ΦT1 x1‖1 + ‖ΦT
2 x2‖1 +λ‖x−x1 −x2‖22.
In these new forms, the additional content in the image – the noise – characterized bythe property that it cannot be represented sparsely by either one of the two systems Φ1
and Φ2, will be allocated to the residual x−Φ1c1 −Φ2c2 or x−x1 −x2 depending onwhich of the two minimization problems stated above is chosen. Hence, performing thisminimization, we not only separate the data, but also succeed in removing an additivenoise component as a by-product.
There exists by now a variety of algorithms which numerically solve such minimiza-tion problems. One large class is, for instance, iterative shrinkage algorithms; and werefer to the beautiful new book [18] by Elad for an overview. It should be mentioned thatit is also possible to perform these separation procedures locally, thus enabling parallelprocessing, and again we refer to [18] for further details.
Let us now delve into more concrete situations. One prominent class of empiricalstudies concerns the separation of point- and curvelike structures. This type of problemarises, for instance, in astronomical imaging, where astronomers would like to separatestars (pointlike structures) from filaments (curvelike structures). Another area in whichthe separation of points from curves is essential is neurobiological imaging. In particular,for Alzheimer research, neurobiologists analyze images of neurons, which – consideredin 2-D – are a composition of the dendrites (curvelike structures) of the neuron andthe attached spines (pointlike structures). For further analysis of the shape of thesecomponents, dendrites and spines need to be separated.
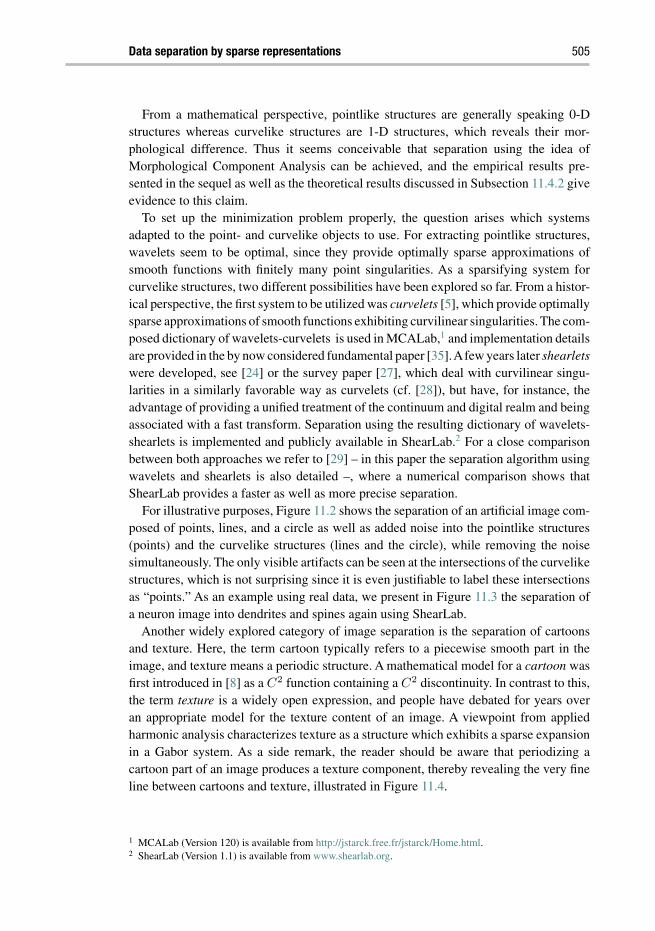
Data separation by sparse representations 505
From a mathematical perspective, pointlike structures are generally speaking 0-Dstructures whereas curvelike structures are 1-D structures, which reveals their mor-phological difference. Thus it seems conceivable that separation using the idea ofMorphological Component Analysis can be achieved, and the empirical results pre-sented in the sequel as well as the theoretical results discussed in Subsection 11.4.2 giveevidence to this claim.
To set up the minimization problem properly, the question arises which systemsadapted to the point- and curvelike objects to use. For extracting pointlike structures,wavelets seem to be optimal, since they provide optimally sparse approximations ofsmooth functions with finitely many point singularities. As a sparsifying system forcurvelike structures, two different possibilities have been explored so far. From a histor-ical perspective, the first system to be utilized was curvelets [5], which provide optimallysparse approximations of smooth functions exhibiting curvilinear singularities. The com-posed dictionary of wavelets-curvelets is used in MCALab,1 and implementation detailsare provided in the by now considered fundamental paper [35].Afew years later shearletswere developed, see [24] or the survey paper [27], which deal with curvilinear singu-larities in a similarly favorable way as curvelets (cf. [28]), but have, for instance, theadvantage of providing a unified treatment of the continuum and digital realm and beingassociated with a fast transform. Separation using the resulting dictionary of wavelets-shearlets is implemented and publicly available in ShearLab.2 For a close comparisonbetween both approaches we refer to [29] – in this paper the separation algorithm usingwavelets and shearlets is also detailed –, where a numerical comparison shows thatShearLab provides a faster as well as more precise separation.
For illustrative purposes, Figure 11.2 shows the separation of an artificial image com-posed of points, lines, and a circle as well as added noise into the pointlike structures(points) and the curvelike structures (lines and the circle), while removing the noisesimultaneously. The only visible artifacts can be seen at the intersections of the curvelikestructures, which is not surprising since it is even justifiable to label these intersectionsas “points.” As an example using real data, we present in Figure 11.3 the separation ofa neuron image into dendrites and spines again using ShearLab.
Another widely explored category of image separation is the separation of cartoonsand texture. Here, the term cartoon typically refers to a piecewise smooth part in theimage, and texture means a periodic structure. A mathematical model for a cartoon wasfirst introduced in [8] as a C2 function containing a C2 discontinuity. In contrast to this,the term texture is a widely open expression, and people have debated for years overan appropriate model for the texture content of an image. A viewpoint from appliedharmonic analysis characterizes texture as a structure which exhibits a sparse expansionin a Gabor system. As a side remark, the reader should be aware that periodizing acartoon part of an image produces a texture component, thereby revealing the very fineline between cartoons and texture, illustrated in Figure 11.4.
1 MCALab (Version 120) is available from http://jstarck.free.fr/jstarck/Home.html.2 ShearLab (Version 1.1) is available from www.shearlab.org.

506 Gitta Kutyniok
(a) Original image (b) Noisy image
(c) Pointlike component (d) Curvelike component
Figure 11.2 Separation of an artificial image composed of points, lines, and a circle into point- and curvelikecomponents using ShearLab.
(a) Original image (b) Pointlike component (c) Curvelike component
Figure 11.3 Separation of a neuron image into point- and curvelike components using ShearLab.
Figure 11.4 Periodic small cartoons versus one large cartoon.

Data separation by sparse representations 507
(a) Barbara image (b) Cartoon component (c) Texture component
Figure 11.5 Separation of the Barbara image into cartoon and texture using MCALab.
As sparsifying systems, again curvelets or shearlets are suitable for the cartoon part,whereas discrete cosines or a Gabor system can be used for the texture part. MCALabuses for this separation task a dictionary composed of curvelets and discrete cosines, see[35]. For illustrative purposes, we display in Figure 11.5 the separation of the Barbaraimage into cartoon and texture components performed by MCALab. As can be seen, allperiodic structure is captured in the texture part, leaving the remainder to the cartooncomponent.
11.4.2 Theoretical results
The first theoretical result explaining the successful empirical performance of Mor-phological Component Analysis was derived in [14] by considering the separation ofpoint- and curvelike features in images coined the Geometric Separation Problem. Theanalysis in this paper has three interesting features. Firstly, it introduces the notion ofcluster coherence (cf. Definition 11.3) as a measure for the geometric arrangementsof the significant coefficients and hence the encoding of the morphological differenceof the components. It also initiates the study of 1 minimization in frame settings, inparticular those where singleton coherence within one frame may be high. Secondly, itprovides the first analysis of a continuum model in contrast to the previously studieddiscrete models which obscure continuum elements of geometry. And thirdly, it exploresmicrolocal analysis to understand heuristically why separation might be possible and toorganize a rigorous analysis. This general approach applies in particular to two variantsof geometric separation algorithms. One is based on tight frames of radial wavelets andcurvelets and the other uses orthonormal wavelets and shearlets.
These results are today the only results providing a theoretical foundation to imageseparation using ideas from sparsity methodologies. The same situation – separatingpoint- and curvelike objects – is also considered in [13] however using thresholding asa separation technique. Finally, we wish to mention that some initial theoretical resultson the separation of cartoon and texture in images are contained in [15].
Let us now dive into the analysis of [14]. As a mathematical model for a compositionof point- and curvelike structures, the following two components are considered: The
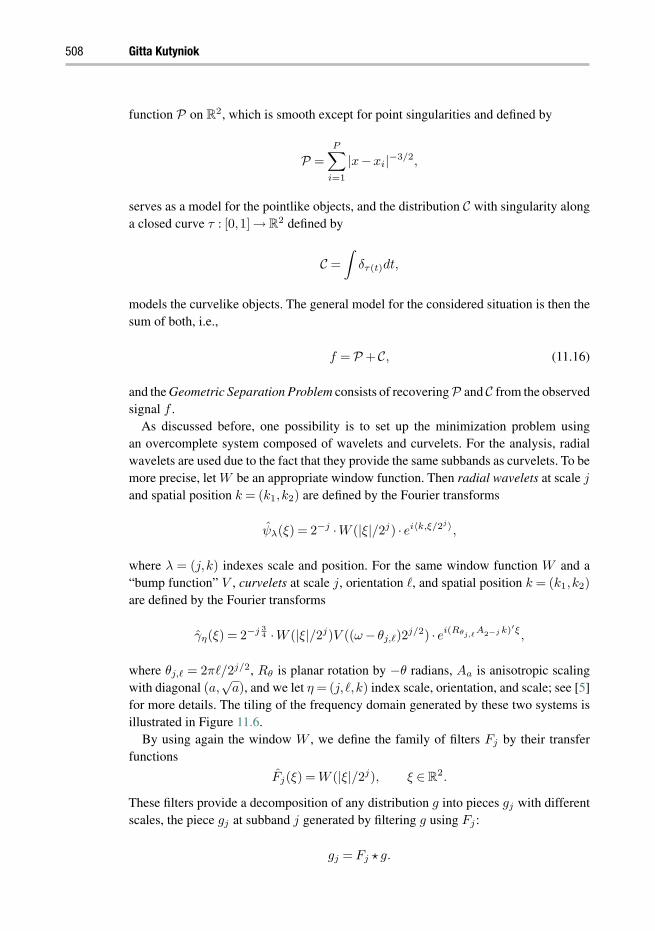
508 Gitta Kutyniok
function P on R2, which is smooth except for point singularities and defined by
P =
P∑i=1
|x−xi|−3/2,
serves as a model for the pointlike objects, and the distribution C with singularity alonga closed curve τ : [0,1] → R2 defined by
C =
∫δτ(t)dt,
models the curvelike objects. The general model for the considered situation is then thesum of both, i.e.,
f = P +C, (11.16)
and the Geometric Separation Problem consists of recoveringP and C from the observedsignal f .
As discussed before, one possibility is to set up the minimization problem usingan overcomplete system composed of wavelets and curvelets. For the analysis, radialwavelets are used due to the fact that they provide the same subbands as curvelets. To bemore precise, let W be an appropriate window function. Then radial wavelets at scale j
and spatial position k = (k1,k2) are defined by the Fourier transforms
ψλ(ξ) = 2−j ·W (|ξ|/2j) · ei〈k,ξ/2j〉,
where λ = (j,k) indexes scale and position. For the same window function W and a“bump function” V , curvelets at scale j, orientation , and spatial position k = (k1,k2)
are defined by the Fourier transforms
γη(ξ) = 2−j 34 ·W (|ξ|/2j)V ((ω− θj,)2
j/2) · ei(Rθj,A2−j k)′ξ,
where θj, = 2π/2j/2, Rθ is planar rotation by −θ radians, Aa is anisotropic scalingwith diagonal (a,
√a), and we let η = (j,,k) index scale, orientation, and scale; see [5]
for more details. The tiling of the frequency domain generated by these two systems isillustrated in Figure 11.6.
By using again the window W , we define the family of filters Fj by their transferfunctions
Fj(ξ) = W (|ξ|/2j), ξ ∈ R2.
These filters provide a decomposition of any distribution g into pieces gj with differentscales, the piece gj at subband j generated by filtering g using Fj :
gj = Fj g.

Data separation by sparse representations 509
(a) Radial wavelets (b) Curvelets
Figure 11.6 Tiling of the frequency domain by radial wavelets and curvelets.
A proper choice of W then enables reconstruction of g from these pieces using theformula
g =∑
j
Fj gj .
Application of this filtering procedure to the model image f from (11.16) yields thedecompositions
fj = Fj f = Fj (P +C) = Pj +Cj ,
where (fj)j is known, and we aim to extract (Pj)j and (Cj)j . We should mention at thispoint that, in fact, the pair (P,C) was chosen in such a way that Pj and Cj have the sameenergy for each j, thereby making the components comparable as we go to finer scalesand the separation challenging at each scale.
Let now Φ1 and Φ2 be the tight frames of radial wavelets and curvelets, respectively.Then, for each scale j, we consider the 1 minimization problem (Sepa) stated in (11.6),which now reads:
minPj ,Cj
‖ΦT1 Pj‖1 + ‖ΦT
2 Cj‖1 s.t. fj = Pj +Cj . (11.17)
Notice that we use the “analysis version” of the minimization problem, since both radialwavelets as well as curvelets are overcomplete systems.
The theoretical result of the precision of separation of fj via (11.17) proved in [14]can now be stated in the following way:
theorem 11.9 ([14]) Let Pj and Cj be the solutions to the optimization problem(11.17) for each scale j. Then we have
‖Pj − Pj‖2 + ‖Cj − Cj‖2
‖Pj‖2 + ‖Cj‖2→ 0, j →∞.
This result shows that the components Pj and Cj are recovered with asymptoticallyarbitrarily high precision at very fine scales. The energy in the pointlike componentis completely captured by the wavelet coefficients, and the curvelike component iscompletely contained in the curvelet coefficients. Thus, the theory evidences that the

510 Gitta Kutyniok
Geometric Separation Problem can be satisfactorily solved by using a combined dictio-nary of wavelets and curvelets and an appropriate 1 minimization problem, as alreadythe empirical results indicate.
We next provide a sketch of proof and refer to [14] for the complete proof.
Sketch of proof of Theorem 11.9. The main goal will be to apply Theorem 11.4 to eachscale and monitor the sequence of bounds 2δ
1−2µcnow dependent on scale. For this, let j
be arbitrarily fixed, and apply Theorem 11.4 in the following way:
• x: Filtered signal fj (= Pj +Cj).• Φ1: Wavelets filtered with Fj .• Φ2: Curvelets filtered with Fj .• Λ1: Significant wavelet coefficients of Pj .• Λ2: Significant curvelet coefficients of Cj .• δj : Degree of approximation by significant coefficients.• (µc)j : Cluster coherence of wavelets-curvelets.
If2δj
1− 2(µc)j= o(‖Pj‖2 + ‖Cj‖2) as j →∞ (11.18)
can be then shown, the theorem is proved.One main problem to overcome is the highly delicate choice of Λ1 and Λ2. It would
be ideal to define those sets in such a way that
δj = o(‖Pj‖2 + ‖Cj‖2) as j →∞ (11.19)
and
(µc)j → 0 as j →∞ (11.20)
are true. This would then imply (11.18), hence finish the proof.A microlocal analysis viewpoint now provides insight into how to suitably choose Λ1
and Λ2 by considering the wavefront sets of P and C in phase space R2 × [0,2π), i.e.,
WF (P) = xiPi=1 × [0,2π)
and
WF (C) = (τ(t),θ(t)) : t ∈ [0,L(τ)],
where τ(t) is a unit-speed parameterization of τ and θ(t) is the normal direction to τ atτ(t). Heuristically, the significant wavelet coefficients should be associated with waveletswhose index set is “close” to WF (P) in phase space and, similarly, the significantcurvelet coefficients should be associated with curvelets whose index set is “close” toWF (C). Thus, using Hart Smith’s phase space metric,
dHS((b,θ); (b′,θ′)) = |〈eθ, b− b′〉|+ |〈eθ′ , b− b′〉|+ |b− b′|2 + |θ− θ′|2,

Data separation by sparse representations 511
where eθ = (cos(θ),sin(θ)), an “approximate” form of sets of significant waveletcoefficients is
Λ1,j = wavelet lattice∩(b,θ) : dHS((b,θ);WF (P)) ≤ ηj2−j,
and an “approximate” form of sets of significant curvelet coefficients is
Λ2,j = curvelet lattice∩(b,θ) : dHS((b,θ);WF (C)) ≤ ηj2−j
with a suitable choice of the distance parameters (ηj)j . In the proof of Theorem 11.9,the definition of (Λ1,j)j and (Λ2,j)j is much more delicate, but follows this intuition.Lengthy and technical estimates then lead to (11.19) and (11.20), which – as mentionedbefore – completes the proof.
Since it was already mentioned in Subsection 11.4.1 that a combined dictionary ofwavelets and shearlets might be preferable, the reader will wonder whether the justdiscussed theoretical results can be transferred to this setting. In fact, this is proven in[26], see also [12]. It should be mentioned that one further advantage of this setting isthe fact that now a basis of wavelets can be utilized in contrast to the tight frame of radialwavelets explored before.
As a wavelet basis, we now choose orthonormal Meyer wavelets, and refer to [30] forthe definition. For the definition of shearlets, for j ≥ 0 and k ∈ Z, let – the notion A2j
was already introduced in the definition of curvelets – A2j and Sk be defined by
A2j =
(2j/2 0
0 2j
)and Sk =
(1 k
0 1
).
For φ,ψ, ψ ∈ L2(R2), the cone-adapted discrete shearlet system is then the union of
φ(·−m) : m ∈ Z2,
2 34 jψ(SkA2j · −m) : j ≥ 0,− 2j/2! ≤ k ≤ 2j/2!,m ∈ Z2,
and2 3
4 jψ(STk A2j · −m) : j ≥ 0,− 2j/2! ≤ k ≤ 2j/2!,m ∈ Z2.
The term “cone-adapted” originates from the fact that these systems tile the frequencydomain in a cone-like fashion; see Figure 11.7(b).
As can be seen from Figure 11.7, the subbands associated with orthonormal Meyerwavelets and shearlets are the same. Hence a similar filtering into scaling subbands canbe performed as for radial wavelets and curvelets.
Adapting the optimization problem (11.17) by using wavelets and shearlets insteadof radial wavelets and curvelets generates purported point- and curvelike objects Wj
and Sj , say, for each scale j. Then the following result, which shows similarly success-ful separation as Theorem 11.9, was derived in [26] with the new concept of sparsityequivalence, here between shearlets and curvelets, introduced in the same paper as mainingredient.

512 Gitta Kutyniok
(a) Wavelets (b) Shearlets
Figure 11.7 Tiling of the frequency domain by orthonormal Meyer wavelets and shearlets.
theorem 11.10 ([26]) We have
‖Pj − Wj‖2 + ‖Cj − Sj‖2
‖Pj‖2 + ‖Cj‖2→ 0, j →∞.
Acknowledgements
The author would like to thank Ronald Coifman, Michael Elad, and Remi Gribonvalfor various discussions on related topics, Wang-Q Lim for producing Figures 11.2, 11.3,and 11.5, and Roland Brandt and Fred Sündermann for Figure 11.3(a). Special thanksgo to David Donoho for a great collaboration on topics in this area and enlighteningdebates, and to Michael Elad for very useful comments on an earlier version of thissurvey. The author is also grateful to the Department of Statistics at Stanford Universityand the Mathematics Department at Yale University for their hospitality and support dur-ing her visits. She acknowledges support by Deutsche Forschungsgemeinschaft (DFG)Heisenberg fellowship KU 1446/8, DFG Grant SPP-1324 KU 1446/13, and DFG GrantKU 1446/14.
References
[1] M. Aharon, M. Elad, and A. M. Bruckstein. The K-SVD: An algorithm for designingof overcomplete dictionaries for sparse representation. IEEE Trans Signal Proc, 54(11):4311–4322, 2006.
[2] J. Bobin, J.-L. Starck, M. J. Fadili,Y. Moudden, and D. L. Donoho. Morphological componentanalysis: An adaptive thresholding strategy. IEEE Trans Image Proc, 16(11):2675–2681,2007.
[3] L. Borup, R. Gribonval, and M. Nielsen. Beyond coherence: Recovering structured time-frequency representations. Appl Comput Harmon Anal, 24(1):120–128, 2008.
[4] A. M. Bruckstein, D. L. Donoho, and M. Elad. From sparse solutions of systems of equationsto sparse modeling of signals and images. SIAM Review, 51(1):34–81, 2009.
[5] E. J. Candès and D. L. Donoho. Continuous curvelet transform: II. Discretization of frames.Appl Comput Harmon Anal, 19(2):198–222, 2005.

Data separation by sparse representations 513
[6] S. S. Chen, D. L. Donoho, and M. A. Saunders. Atomic decomposition by basis pursuit.SIAM J Sci Comput, 20(1):33–61, 1998.
[7] R. R. Coifman and M. V. Wickerhauser. Wavelets and adapted waveform analysis. Atoolkit for signal processing and numerical analysis. Different Perspectives on Wavelets.San Antonio, TX, 1993, 119–153, Proc Symps Appl Math, 47, Am Math Soc, Providence,RI, 1993.
[8] D. L. Donoho. Sparse components of images and optimal atomic decomposition. ConstrApprox, 17(3):353–382, 2001.
[9] D. L. Donoho. Compressed sensing. IEEE Trans Inform Theory, 52(4):1289–1306,2006.
[10] D. L. Donoho and M. Elad. Optimally sparse representation in general (nonorthogonal)dictionaries via l1 minimization. Proc Natl Acad Sci USA, 100(5):2197–2202, 2003.
[11] D. L. Donoho and X. Huo. Uncertainty principles and ideal atomic decomposition. IEEETrans Inform Theory, 47(7):2845–2862, 2001.
[12] D. L. Donoho and G. Kutyniok. Geometric separation using a wavelet-shearlet dictionary.SampTA’09 (Marseilles, France, 2009), Proc., 2009.
[13] D. L. Donoho and G. Kutyniok. Geometric separation by single-pass alternating thresholding,preprint, 2010.
[14] D. L. Donoho and G. Kutyniok. Microlocal analysis of the geometric separation problem.Comm Pure Appl Math, to appear, 2010.
[15] D. L. Donoho and G. Kutyniok. Geometric separation of cartoons and texture via 1minimization, preprint, 2011.
[16] D. L. Donoho and P. B. Stark. Uncertainty principles and signal recovery. SIAMJ Appl Math, 49(3):906–931, 1989.
[17] J. M. Duarte-Carvajalino and G. Sapiro. Learning to sense sparse signals: Simultaneoussensing matrix and sparsifying dictionary optimization. IEEE Trans Image Proc, 18(7):1395–1408, 2009.
[18] M. Elad. Sparse and Redundant Representations, Springer, New York, 2010.[19] M. Elad and A. M. Bruckstein. A generalized uncertainty principle and sparse representation
in pairs of bases. IEEE Trans Inform Theory, 48(9):2558–2567, 2002.[20] M. Elad, J.-L. Starck, P. Querre, and D. L. Donoho. Simultaneous cartoon and texture image
inpainting using morphological component analysis (MCA). Appl Comput Harmon Anal,19(3):340–358, 2005.
[21] K. Engan, S. O.Aase, and J. H. Hakon-Husoy. Method of optimal directions for frame design.IEEE Int Conf Acoust, Speech, Sig Process, 5:2443–2446, 1999.
[22] R. Gribonval and E. Bacry. Harmonic decomposition of audio signals with matching pursuit.IEEE Trans Sig Proc, 51(1):101–111, 2003.
[23] R. Gribonval and M. Nielsen. Sparse representations in unions of bases. IEEE Trans InformTheory, 49(12):3320–3325, 2003.
[24] K. Guo, G. Kutyniok, and D. Labate. Sparse multidimensional representations usinganisotropic dilation and shear operators. Wavelets and Splines, Athens, GA, 2005, NashboroPress, Nashville, TN, 2006:189–201, 2006.
[25] M. Kowalski and B. Torrésani. Sparsity and persistence: Mixed norms provide simple signalmodels with dependent coefficients. Sig, Image Video Proc, to appear, 2010.
[26] G. Kutyniok. Sparsity equivalence of anisotropic decompositions, preprint, 2010.[27] G. Kutyniok, J. Lemvig, and W.-Q. Lim. Compactly supported shearlets, Approximation
Theory XIII (San Antonio, TX, 2010). Proc Math, 13:163–186, 2012.

514 Gitta Kutyniok
[28] G. Kutyniok and W.-Q. Lim. Compactly supported shearlets are optimally sparse.J Approx Theory, 163:1564–1589, 2011.
[29] G. Kutyniok and W.-Q. Lim. Image separation using shearlets, Curves and Surfaces,Avignon,France, 2010, Lecture Notes in Computer Science, 6920, Springer, 2012.
[30] S. G. Mallat. A Wavelet Tour of Signal Processing, Academic Press, Inc., San Diego, CA,1998.
[31] S. G. Mallat and Z. Zhang. Matching pursuits with time-frequency dictionaries. IEEE TransSig Proc, 41(12):3397–3415, 1993.
[32] F. G. Meyer, A. Averbuch, and R. R. Coifman. Multi-layered image representation:Application to image compression. IEEE Trans Image Proc, 11(9):1072–1080, 2002.
[33] J.-L. Starck, F. Murtagh, and J. M. Fadili. Sparse Image and Signal Processing: Wavelets,Curvelets, Morphological Diversity. Cambridge University Press, New York, NY, 2010.
[34] J.-L. Starck, M. Elad, and D. L. Donoho. Redundant multiscale transforms and theirapplication for morphological component analysis. Adv Imag Electr Phys, 132:287–348,2005.
[35] J.-L. Starck, M. Elad, and D. L. Donoho. Image decomposition via the combination of sparserepresentations and a variational approach. IEEE Trans Image Proc, 14(10):1570–1582,2005.
[36] J.-L. Starck, Y. Moudden, J. Bobin, M. Elad, and D. L. Donoho. Morphological componentanalysis. Wavelets XI, San Diego, CA, SPIE Proc. 5914, SPIE, Bellingham, WA, 2005.
[37] J. A. Tropp. Greed is good: Algorithmic results for sparse approximation. IEEE Trans InformTheory, 50(10):2231–2242, 2004.
[38] J. A. Tropp. On the linear independence of spikes and sines. J Fourier Anal Appl, 14(5-6):838–858, 2008.
[39] J. A. Tropp. The sparsity gap: Uncertainty principles proportional to dimension. Proc 44thIEEE Conf Inform Sci Syst (CISS), 1–6, Princeton, NJ, 2010.

12 Face recognition by sparserepresentationArvind Ganesh, Andrew Wagner, Zihan Zhou, Allen Y. Yang,Yi Ma, and John Wright
In this chapter, we present a comprehensive framework for tackling the classical problemof face recognition, based on theory and algorithms from sparse representation. Despiteintense interest in the past several decades, traditional pattern recognition theory stillstops short of providing a satisfactory solution capable of recognizing human facesin the presence of real-world nuisances such as occlusion and variabilities in pose andillumination. Our new approach, called sparse representation-based classification (SRC),is motivated by a very natural notion of sparsity, namely, one should always try to explaina query image using a small number of training images from a single subject category.This sparse representation is sought via 1 minimization. We show how this core idea canbe generalized and extended to account for various physical variabilities encountered inface recognition. The end result of our investigation is a full-fledged practical systemaimed at security and access control applications. The system is capable of accuratelyrecognizing subjects out of a database of several hundred subjects with state-of-the-artaccuracy.
12.1 Introduction
Automatic face recognition is a classical problem in the computer vision community.The community’s sustained interest in this problem is mainly due to two reasons. First,in face recognition, we encounter many of the common variabilities that plague visionsystems in general: illumination, occlusion, pose, and misalignment. Inspired by the goodperformance of humans in recognizing familiar faces [38], we have reason to believethat effective automatic face recognition is possible, and that the quest to achieve thiswill tell us something about visual recognition in general. Second, face recognition hasa wide spectrum of practical applications. Indeed, if we could construct an extremelyreliable automatic face recognition system, it would have broad implications for identityverification, access control, security, and public safety. In addition to these classicalapplications, the recent proliferation of online images and videos has provided a host
Compressed Sensing: Theory and Applications, ed. Yonina C. Eldar and Gitta Kutyniok. Published byCambridge University Press. © Cambridge University Press 2012.

516 A. Ganesh, A. Wagner, Z. Zhou, A. Y. Yang, Y. Ma, and J. Wright
(a) (b) (c) (d)
Figure 12.1 Examples of image nuisances in face recognition. (a) Illumination change. (b) Pixel corruption.(c) Facial disguise. (d) Occlusion and misalignment.
of new applications such as image search and photo tagging (e.g. Google’s Picasa andApple FaceTime).
Despite several decades of work in this area, high-quality automatic face recognitionremains a challenging problem that defies satisfactory solutions. While there has beensteady progress on scalable algorithms for face recognition in low-stake applicationssuch as photo album organization,1 there have been a sequence of well-documentedfailed trials of face recognition technology in mass surveillance/watch-list applications,where the performance requirements are very demanding.2 These failures are mainlydue to the challenging structure of face data: any real-world face recognition systemmust simultaneously deal with variables and nuisances such as illumination variation,corruption and occlusion, and reasonable amount of pose and image misalignment. Someexamples of these image nuisances for face recognition are illustrated in Figure 12.1.
Traditional pattern recognition theory stops short of providing a satisfactory solutioncapable of simultaneously addressing all of these problems. In the past decades, numerousmethods for handling a single mode of variability, such as pose or illumination, havebeen proposed and examined. But much less work has been devoted to simultaneouslyhandling multiple modes of variation, according to a recent survey [52].3 In other words,although a method might successfully deal with one type of variation, it quickly breaksdown when moderate amounts of other variations are introduced to face images.
Recently, the theory of sparse representation and compressed sensing has shed somenew light on this challenging problem. Indeed, there is a very natural notion of sparsityin the face recognition problem: one always tries to find only a single subject out of
1 As documented, e.g., in the ongoing Labeled Faces in the Wild [26] challenge. We invite the interestedreader to consult this work and the references therein.
2 A typical performance metric that is considered acceptable for automatic mass surveillance may requireboth a recognition rate in the high 90s and a false positive rate lower than 0.01% over a database withthousands of subjects.
3 The literature on face recognition is vast, and doing justice to all ideas and proposed algorithms wouldrequire a separate survey of comparable length to this chapter. In the course of this chapter, we will reviewa few works necessary to put ours in context. We refer the reader to [52] for a more comprehensivetreatment of the history of the field.
Face recognition by sparse representation 517
a large database of subjects that best explains a given query image. In this chapter,we will discuss how tools from compressed sensing, especially 1 minimization andrandom projections, have inspired new algorithms for face recognition. In particular, thenew computational framework can simultaneously address the most important types ofvariation in face recognition.
Nevertheless, face recognition diverges quite significantly from the common com-pressed sensing setup. On the mathematical side, the data matrices arising in facerecognition often violate theoretical assumptions such as the restricted isometry propertyor even incoherence. Moreover, the physical structure of the problem (especially mis-alignment) will occasionally force us to solve the sparse representation problem subjectto certain nonlinear constraints.
On the practical side, face recognition poses new nontrivial challenges in algorithmdesign and system implementation. First, face images are very high-dimensional data(e.g., a 1000×1000 gray-scale image has 106 pixels). Largely due to lack of memory andcomputational resource, dimensionality reduction techniques have largely been consid-ered as a necessary step in the conventional face recognition methods. Notable holisticfeature spaces include Eigenfaces [42], Fisherfaces [3], Laplacianfaces [25], and theirvariants [29, 10, 47, 36]. Nevertheless, it remains an open question: what is the optimallow-dimensional facial feature space that is capable of pairing with any well-designedclassifier and leads to superior recognition performance?
Second, past face recognition algorithms often work well under laboratory conditions,but their performance would degrade drastically when tested in less-controlled environ-ments – partially explaining some of the highly publicized failures of these systems.A common reason is that those face recognition systems were only tested on imagestaken under the same laboratory conditions (even with the same cameras) as the trainingimages. Hence, their training sets do not represent well variations in illumination forface images taken under different indoor and outdoor environments, and under differentlighting conditions. In some extreme cases, certain algorithms have attempted to reducethe illumination effect from only a single training image per subject [12, 53]. Despitethese efforts, truly illumination-invariant features are in fact impossible to obtain froma few training images, let alone a single image [21, 4, 1]. Therefore, a natural questionarises: How can we improve the image acquisition procedure to guarantee sufficient illu-minations in the training images that can represent a large variety of real-world lightingconditions?
In this chapter, under the overarching theme of the book, we provide a systematicexposition of our investigation over the past few years into a new mathematical approachto face recognition, which we call sparse representation-based classification (SRC). Wewill start from a very simple, almost simplistic, problem formulation that is directlyinspired by results in compressed sensing. We will see generalization of this approachnaturally accounts for the various physical variabilities in the face recognition problem.In turn, we will see some of the new observations that face recognition can contribute tothe mathematics of compressed sensing. The end result will be a full-fledged practicalsystem aimed at applications in access control. The system is capable of accurately

518 A. Ganesh, A. Wagner, Z. Zhou, A. Y. Yang, Y. Ma, and J. Wright
recognizing subjects out of a database of several hundred with high accuracy, despitelarge variations in illumination, moderate occlusion, and misalignment.
12.1.1 Organization of this chapter
In Section 12.2, starting with the simplest possible problem setting, we show how facerecognition can be posed as a sparse representation problem. Section 12.3 discusses thepossibility of solving this problem more efficiently by projecting the data into a randomlyselected lower-dimensional feature space. In Sections 12.4 and 12.5, we then show howthe SRC framework can be naturally extended to handle physical variabilities suchas occlusion and misalignment, respectively. Sections 12.6 and 12.7 discuss practicalaspects of building a face recognition system using the tools introduced here. Section 12.6shows how to efficiently solve sparse representation problems arising in face recognition,while Section 12.7 discusses a practical system for acquiring training images of subjectsunder different illuminations. In Section 12.8, we combine these developments to givean end-to-end system for face recognition, aimed at access control tasks.
12.2 Problem formulation: sparse representation-based classification
In this section, we first illustrate the core idea of SRC in a slightly artificial scenario inwhich the training and test images are very well-aligned, but do contain significant vari-ations in illumination. We will see how in this setting, face recognition can be naturallycast as a sparse representation problem, and solved via 1 minimization. In subsequentsections, we will see how this core formulation extends naturally to handle other vari-abilities in real-world face images, culminating in a complete system for recognitiondescribed in Section 12.7.
In face recognition, the system is given access to a set of labeled training imagesφi, li from the C subjects of interest. Here, φi ∈ Rm is the vector representation ofa digital image (say, by stacking the W ×H columns of the single-channel image as am = W ×H dimensional vector), and li ∈ 1 . . .C indicates which of the C subjectsis pictured in the ith image. In the testing stage, a new query image y ∈ Rm is provided.The system’s job is to determine which of the C subjects is pictured in this query image,or, if none of them is present, to reject the query sample as invalid.
Influential results due to [1, 21] suggest that if sufficiently many images of the samesubject are available, these images will lie close to a low-dimensional linear subspaceof the high-dimensional image space Rm. The required dimension could be as low asnine for a convex, Lambertian object [1]. Hence, given sufficient diversity in trainingilluminations, the new test image y of subject i can be well represented as a linearcombination of the training images of the same subject:
y ≈∑
j|lj=iφjcj
.= Φici, (12.1)
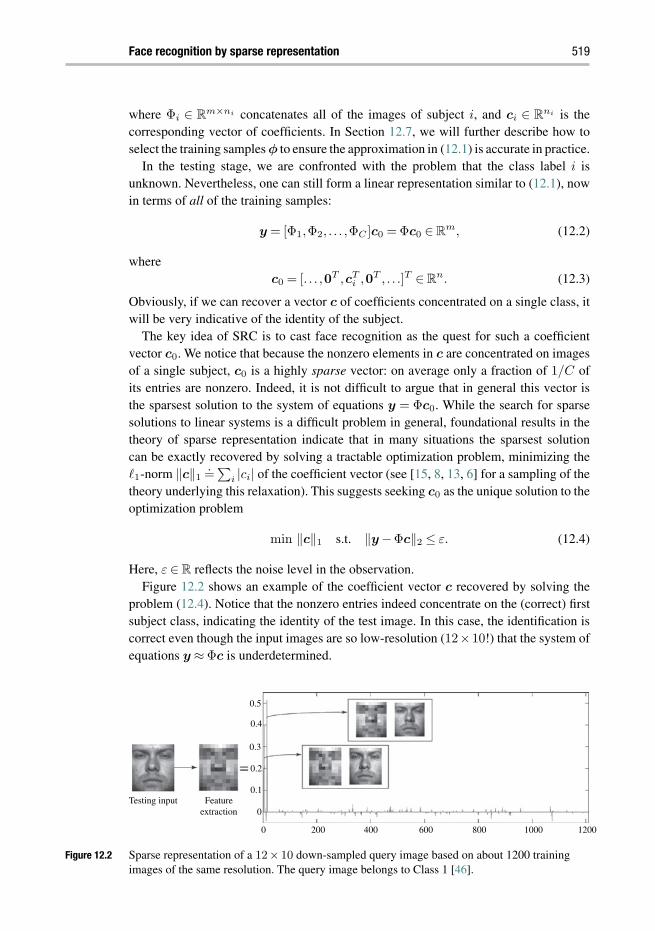
Face recognition by sparse representation 519
where Φi ∈ Rm×ni concatenates all of the images of subject i, and ci ∈ Rni is thecorresponding vector of coefficients. In Section 12.7, we will further describe how toselect the training samples φ to ensure the approximation in (12.1) is accurate in practice.
In the testing stage, we are confronted with the problem that the class label i isunknown. Nevertheless, one can still form a linear representation similar to (12.1), nowin terms of all of the training samples:
y = [Φ1,Φ2, . . . ,ΦC ]c0 = Φc0 ∈ Rm, (12.2)
wherec0 = [. . . ,0T ,cT
i ,0T , . . .]T ∈ Rn. (12.3)
Obviously, if we can recover a vector c of coefficients concentrated on a single class, itwill be very indicative of the identity of the subject.
The key idea of SRC is to cast face recognition as the quest for such a coefficientvector c0. We notice that because the nonzero elements in c are concentrated on imagesof a single subject, c0 is a highly sparse vector: on average only a fraction of 1/C ofits entries are nonzero. Indeed, it is not difficult to argue that in general this vector isthe sparsest solution to the system of equations y = Φc0. While the search for sparsesolutions to linear systems is a difficult problem in general, foundational results in thetheory of sparse representation indicate that in many situations the sparsest solutioncan be exactly recovered by solving a tractable optimization problem, minimizing the1-norm ‖c‖1
.=∑
i |ci| of the coefficient vector (see [15, 8, 13, 6] for a sampling of thetheory underlying this relaxation). This suggests seeking c0 as the unique solution to theoptimization problem
min ‖c‖1 s.t. ‖y−Φc‖2 ≤ ε. (12.4)
Here, ε ∈ R reflects the noise level in the observation.Figure 12.2 shows an example of the coefficient vector c recovered by solving the
problem (12.4). Notice that the nonzero entries indeed concentrate on the (correct) firstsubject class, indicating the identity of the test image. In this case, the identification iscorrect even though the input images are so low-resolution (12×10!) that the system ofequations y ≈ Φc is underdetermined.
Testing input Featureextraction
0.5
0.4
0.3
0.2
0.1
0
0 200 400 600 800 1000 1200
Figure 12.2 Sparse representation of a 12× 10 down-sampled query image based on about 1200 trainingimages of the same resolution. The query image belongs to Class 1 [46].
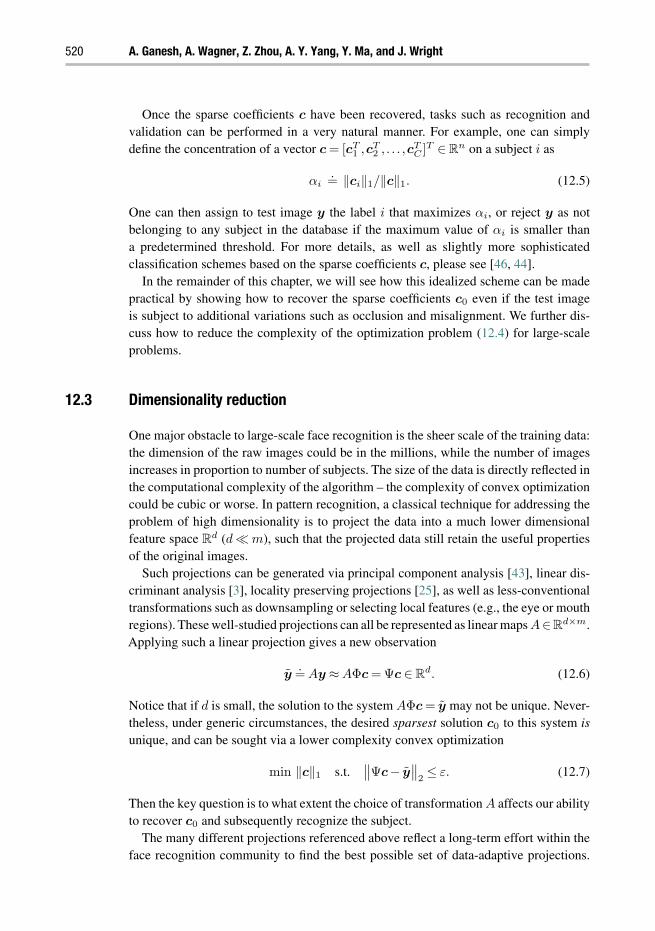
520 A. Ganesh, A. Wagner, Z. Zhou, A. Y. Yang, Y. Ma, and J. Wright
Once the sparse coefficients c have been recovered, tasks such as recognition andvalidation can be performed in a very natural manner. For example, one can simplydefine the concentration of a vector c = [cT
1 ,cT2 , . . . ,cT
C ]T ∈ Rn on a subject i as
αi.= ‖ci‖1/‖c‖1. (12.5)
One can then assign to test image y the label i that maximizes αi, or reject y as notbelonging to any subject in the database if the maximum value of αi is smaller thana predetermined threshold. For more details, as well as slightly more sophisticatedclassification schemes based on the sparse coefficients c, please see [46, 44].
In the remainder of this chapter, we will see how this idealized scheme can be madepractical by showing how to recover the sparse coefficients c0 even if the test imageis subject to additional variations such as occlusion and misalignment. We further dis-cuss how to reduce the complexity of the optimization problem (12.4) for large-scaleproblems.
12.3 Dimensionality reduction
One major obstacle to large-scale face recognition is the sheer scale of the training data:the dimension of the raw images could be in the millions, while the number of imagesincreases in proportion to number of subjects. The size of the data is directly reflected inthe computational complexity of the algorithm – the complexity of convex optimizationcould be cubic or worse. In pattern recognition, a classical technique for addressing theproblem of high dimensionality is to project the data into a much lower dimensionalfeature space Rd (d m), such that the projected data still retain the useful propertiesof the original images.
Such projections can be generated via principal component analysis [43], linear dis-criminant analysis [3], locality preserving projections [25], as well as less-conventionaltransformations such as downsampling or selecting local features (e.g., the eye or mouthregions). These well-studied projections can all be represented as linear maps A∈Rd×m.Applying such a linear projection gives a new observation
y.= Ay ≈ AΦc = Ψc ∈ Rd. (12.6)
Notice that if d is small, the solution to the system AΦc = y may not be unique. Never-theless, under generic circumstances, the desired sparsest solution c0 to this system isunique, and can be sought via a lower complexity convex optimization
min ‖c‖1 s.t.∥∥Ψc− y
∥∥2 ≤ ε. (12.7)
Then the key question is to what extent the choice of transformation A affects our abilityto recover c0 and subsequently recognize the subject.
The many different projections referenced above reflect a long-term effort within theface recognition community to find the best possible set of data-adaptive projections.
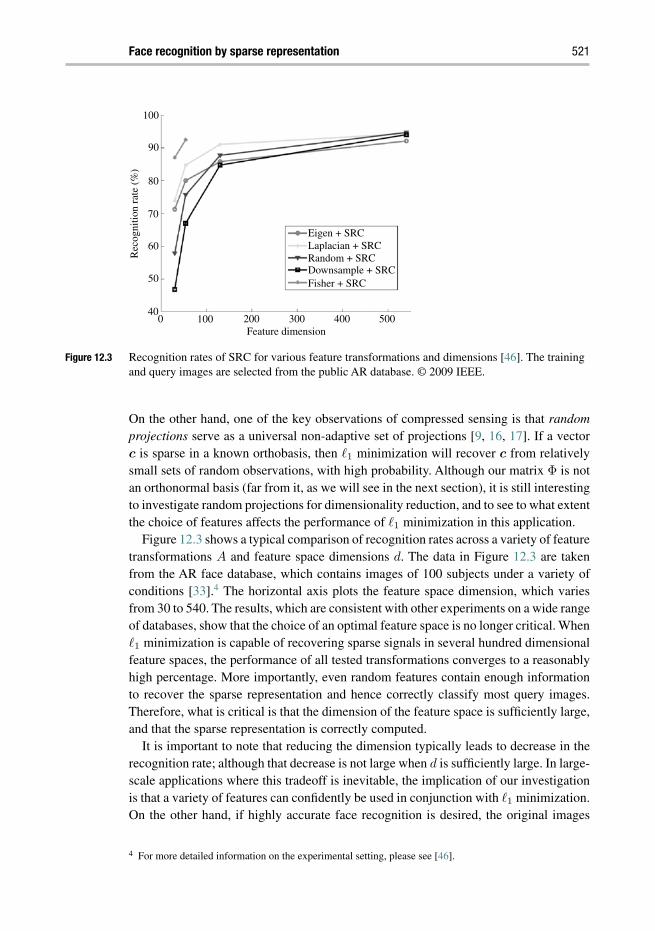
Face recognition by sparse representation 521
100
90
80
70
60
50
400 100 200 300
Feature dimension
Rec
ogni
tion
rate
(%
)
400 500
Eigen + SRCLaplacian + SRCRandom + SRCDownsample + SRCFisher + SRC
Figure 12.3 Recognition rates of SRC for various feature transformations and dimensions [46]. The trainingand query images are selected from the public AR database. © 2009 IEEE.
On the other hand, one of the key observations of compressed sensing is that randomprojections serve as a universal non-adaptive set of projections [9, 16, 17]. If a vectorc is sparse in a known orthobasis, then 1 minimization will recover c from relativelysmall sets of random observations, with high probability. Although our matrix Φ is notan orthonormal basis (far from it, as we will see in the next section), it is still interestingto investigate random projections for dimensionality reduction, and to see to what extentthe choice of features affects the performance of 1 minimization in this application.
Figure 12.3 shows a typical comparison of recognition rates across a variety of featuretransformations A and feature space dimensions d. The data in Figure 12.3 are takenfrom the AR face database, which contains images of 100 subjects under a variety ofconditions [33].4 The horizontal axis plots the feature space dimension, which variesfrom 30 to 540. The results, which are consistent with other experiments on a wide rangeof databases, show that the choice of an optimal feature space is no longer critical. When1 minimization is capable of recovering sparse signals in several hundred dimensionalfeature spaces, the performance of all tested transformations converges to a reasonablyhigh percentage. More importantly, even random features contain enough informationto recover the sparse representation and hence correctly classify most query images.Therefore, what is critical is that the dimension of the feature space is sufficiently large,and that the sparse representation is correctly computed.
It is important to note that reducing the dimension typically leads to decrease in therecognition rate; although that decrease is not large when d is sufficiently large. In large-scale applications where this tradeoff is inevitable, the implication of our investigationis that a variety of features can confidently be used in conjunction with 1 minimization.On the other hand, if highly accurate face recognition is desired, the original images
4 For more detailed information on the experimental setting, please see [46].

522 A. Ganesh, A. Wagner, Z. Zhou, A. Y. Yang, Y. Ma, and J. Wright
themselves can be used as features, in a way that is robust to additional physical nuisancessuch as occlusion and geometric transformations of the image.
12.4 Recognition with corruption and occlusion
In many practical scenarios, the face of interest may be partially occluded, as shown inFigure 12.4. The image may also contain large errors due to self-shadowing, specularities,or corruption.Any of these image nuisances may cause the representation to deviate fromthe linear model y ≈ Φc. In realistic scenarios, we are more likely confronted with anobservation that can be modeled as
y = Φc+ e, (12.8)
where e is an unknown vector whose nonzero entries correspond to the corrupted pixelsin the observation y, as shown in Figure 12.4.
The errors e can be large in magnitude, and hence cannot be ignored or treated withtechniques designed for small noise, such as least squares. However, like the vector c,they often are sparse: occlusion and corruption generally affect only a fraction ρ < 1 ofthe image pixels. Hence, the problem of recognizing occluded faces can be cast as thesearch for a sparse representation c, up to a sparse error e. A natural robust extension tothe SRC framework is to instead solve a combined 1 minimization problem
min ‖c‖1 + ‖e‖1 s.t. y = Φc+ e. (12.9)
Figure 12.4 Robust face recognition via sparse representation. The method represents a test image (left),which is partially occluded (top) or corrupted (bottom), as a sparse linear combination of all thenormal training images (middle) plus sparse errors (right) due to occlusion or corruption. Thelargest coefficients correspond to training images of the correct individual. Our algorithmdetermines the true identity (indicated with a box at second row and third column) from 700training images of 100 individuals in the standard AR face database [46]. © 2009 IEEE.

Face recognition by sparse representation 523
Highly coherent(volume ≤1.5 × 10–229)
A
±I
Figure 12.5 The cross-and-bouquet model for face recognition. The raw images of human faces expressed ascolumns of A are clustered with small variance [45]. © 2010 IEEE.
In [46], it was observed that this optimization performs quite well in correcting occlusionand corruption, for instance, for block occlusions covering up to 20% of the face andrandom corruptions affecting more than 70% of the image pixels.
Nevertheless, on closer inspection, the success of the combined 1 minimization in(12.9) is surprising. One can interpret (12.9) as an 1 minimization problem against asingle combined dictionary B
.= [Φ I] ∈ Rm×(n+m):
min ‖w‖1 s.t. y = Bw, (12.10)
where w = [cT ,eT ]T . Because the columns of Φ are all face images, and hence somewhatsimilar in the high-dimensional image space Rm, the matrixB fairly dramatically violatesthe classical conditions for uniform sparse recovery, such as the incoherence criteria [15]or the restricted isometry property [8]. In contrast to the classical compressed sensingsetup, the matrix B has quite inhomogeneous properties: the columns of Φ are coherentin the high-dimensional space, while the columns of I are as incoherent as possible.Figure 12.5 illustrates the geometry of this rather curious object, which was dubbed a“cross-and-bouquet” (CAB) in [45], due to the fact that the columns of the identity matrixspan a cross polytope, whereas the columns of A are tightly clustered like a bouquet offlowers.
In sparse representation, the CAB model belongs to a special class of sparse represen-tation problems where the dictionary Φ is a concatenation of sub-dictionaries. Examplesinclude the merger of wavelet and heaviside dictionaries in [11] and the combination oftexture and cartoon dictionaries in morphological component analysis [18]. However, incontrast to most existing examples, not only is our new dictionary B inhomogeneous, infact the solution (c,e) to be recovered is also very inhomogeneous: the sparsity of c islimited by the number of images per subject, whereas we would like to handle as densee as possible, to guarantee good error correction performance. Simulations (similar tothe bottom row of Figure 12.4) have suggested that in fact the error e can be quite dense,provided its signs and support are random [46, 45]. In [45], it is shown that
As long as the bouquet is sufficiently tight in the high-dimensional image space Rm, 1 minimization
successfully recovers the sparse coefficients x from very dense (ρ 1) randomly signed errors e.

524 A. Ganesh, A. Wagner, Z. Zhou, A. Y. Yang, Y. Ma, and J. Wright
For a more precise statement and proof of this result, we refer the reader to [45].For our purposes here, it suffices to say that this result suggests that excellent error cor-
rection is possible in circumstances quite similar to the ones encountered in real-worldface recognition. This is surprising for two reasons. First, as mentioned above, the “dic-tionary” in this problem dramatically violates the restricted isometry property. Second,the errors corrected can be quite dense, in contrast to typical results from compressedsensing in which the number of nonzero coefficients recovered (or errors corrected) istypically bounded by a small fraction of the dimension m [8, 17]. Interestingly, whilethe mathematical tools needed to analyze this problem are quite standard in this area,the results obtained are qualitatively different from classical results in compressed sens-ing. Thus, while classical results such as [8, 14] are inspiring for face recognition, thestructure of the matrices encountered in this application gives it a mathematical flavorall its own.
12.5 Face alignment
The problem formulation in the previous sections allows us to simultaneously cope withillumination variation and moderate occlusion. However, a practical face recognitionsystem needs to deal with one more important mode of variability: misalignment of thetest image and training images. This may occur if the face is not perfectly localized inthe image, or if the pose of the face is not perfectly frontal. Figure 12.6 shows how evensmall misalignment can cause appearance-based face recognition algorithms (such asthe one described above) to break down. In this section, we will see how the frameworkof the previous sections naturally extends to cope with this difficulty.
To pose the problem, we assume the observation y is a warped image y = y0 τ−1 ofthe ground-truth signal y0 under some 2-D transformation of domain τ .5 As illustratedin Figure 12.6, when τ perturbs the detected face region away from the optimal position,directly solving a sparse representation of y against properly aligned training imagesoften results in erroneous representation.
Nevertheless, if the true deformation τ can be efficiently found, then we can recovery0 and it becomes possible to recover a relevant sparse representation c for y0 withrespect to the well-aligned training set. Based on the previous error correction model(12.8), the sparse representation model under face alignment is defined as
y τ = Φc+ e. (12.11)
Naturally, one would like to use the sparsity as a strong cue for finding the correctdeformation τ , solving the following optimization problem:
minc,e,τ
‖c‖1 + ‖e‖1 s.t. y τ = Φc+ e. (12.12)
5 In our system, we typically use 2-D similarity transformations, T = SE(2)× R+, for misalignmentincurred by face cropping, or 2-D projective transformations, T = GL(3), for pose variation.
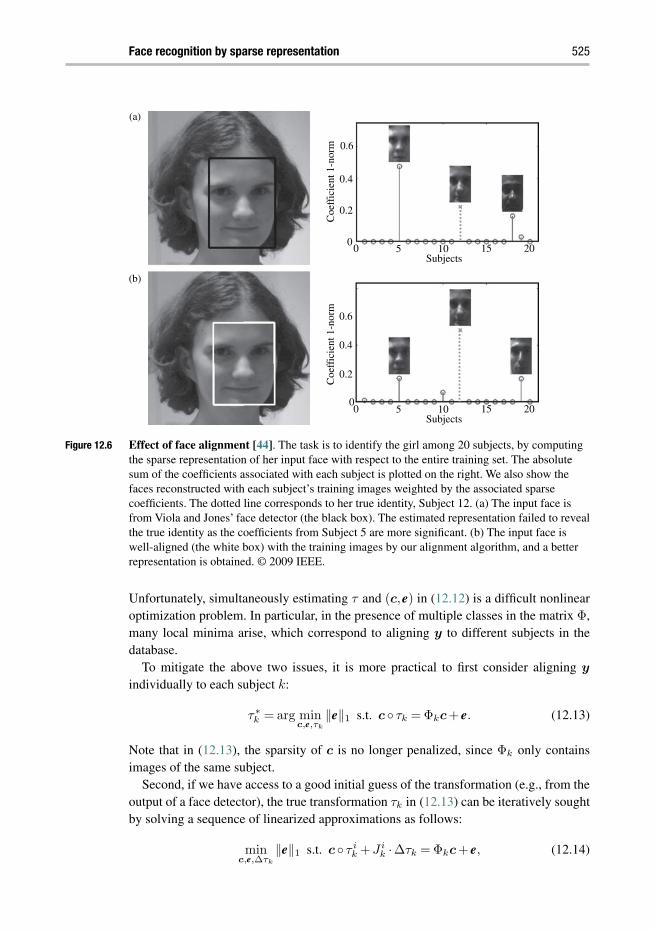
Face recognition by sparse representation 525
(a)
(b)
0.6
0.6
0.4
0.2
0
0.4
0.2
00 5 10
Subjects15 20
0 5 10Subjects
15 20
Coe
ffic
ient
1-n
orm
Coe
ffic
ient
1-n
orm
Figure 12.6 Effect of face alignment [44]. The task is to identify the girl among 20 subjects, by computingthe sparse representation of her input face with respect to the entire training set. The absolutesum of the coefficients associated with each subject is plotted on the right. We also show thefaces reconstructed with each subject’s training images weighted by the associated sparsecoefficients. The dotted line corresponds to her true identity, Subject 12. (a) The input face isfrom Viola and Jones’ face detector (the black box). The estimated representation failed to revealthe true identity as the coefficients from Subject 5 are more significant. (b) The input face iswell-aligned (the white box) with the training images by our alignment algorithm, and a betterrepresentation is obtained. © 2009 IEEE.
Unfortunately, simultaneously estimating τ and (c,e) in (12.12) is a difficult nonlinearoptimization problem. In particular, in the presence of multiple classes in the matrix Φ,many local minima arise, which correspond to aligning y to different subjects in thedatabase.
To mitigate the above two issues, it is more practical to first consider aligning y
individually to each subject k:
τ∗k = arg min
c,e,τk
‖e‖1 s.t. c τk = Φkc+ e. (12.13)
Note that in (12.13), the sparsity of c is no longer penalized, since Φk only containsimages of the same subject.
Second, if we have access to a good initial guess of the transformation (e.g., from theoutput of a face detector), the true transformation τk in (12.13) can be iteratively soughtby solving a sequence of linearized approximations as follows:
minc,e,∆τk
‖e‖1 s.t. c τ ik +J i
k ·∆τk = Φkc+ e, (12.14)

526 A. Ganesh, A. Wagner, Z. Zhou, A. Y. Yang, Y. Ma, and J. Wright
Algorithm 12.1 (Deformable SRC for face recognition [44])
1: Input: Frontal training images Φ1,Φ2, . . . ,ΦC ∈Rm×ni for C subjects, a test imagey ∈ Rm, and a deformation group T considered.
2: for each subject k,3: τ0
k ← I .4: do5: y(τ i
k) ← yτ ik
‖yτ ik‖2
; J ik ← ∂
∂τky(τk)
∣∣τ i
k
;
6: ∆τk = argmin ‖e‖1 s.t. y(τ ik)+J i
k∆τk = Φkc+ e.7: τ i+1
k ← τ ik +∆τk;
8: while ‖τ i+1k − τ i
k‖ ≥ ε.9: end10: Set Φ ←
[Φ1 τ−1
1 | Φ2 τ−12 | · · · | ΦC τ−1
C
].
11: Solve the 1 minimization problem:
c = argminc,e
‖c‖1 + ‖e‖1 s.t. y = Φc+ e.
12: Compute residuals rk(b) = ‖c−Φkδk(c)‖2 for k = 1, . . . ,C.13: Output: identity(y) = argmink rk(c).
where τ ik is the current estimate of the transformation τk, J i
k =∇τk(yτ i
k) is the Jacobianof y τ i
k with respect to τk, and ∆τk is a step update to τk.6
From the optimization point of view, our scheme (12.14) can been seen as a general-ized Gauss–Newton method for minimizing the composition of a non-smooth objectivefunction (the 1-norm) with a differentiable mapping from transformation parametersto transformed images. It has been extensively studied in the literature and is known toconverge quadratically in a neighborhood of any local optimum of the 1-norm [35, 27].For our face alignment problem, we simply note that typically (12.14) takes 10 to 15iterations to converge.
To further improve the performance of the algorithm, we can adopt a slightly modifiedversion of (12.14), in which we replace the warped test image y τk with the normalizedone y(τk) = bτk
‖yτk‖2. This helps to prevent the algorithm from falling into a degenerate
global minimum corresponding to zooming in on a dark region of the test image. Inpractice, our alignment algorithm can run in a multi-resolution fashion in order to reducethe computational cost and gain a larger region of convergence.
6 In computer vision literature, the basic iterative scheme for registration between two identical imagesrelated by an image transformation of a few parameters has been long known as the Lucas–Kanadealgorithm [31]. Extension of the Lucas–Kanade algorithm to address the illumination issue in the samespirit as ours has also been exploited. However, most traditional solutions formulated the objectivefunction using the 2-norm as a least-squares problem. One exception prior to the theory of CS, to the bestof our knowledge, was proposed in a robust face tracking algorithm by Hager and Belhumeur [24], wherethe authors used an iterative reweighted least-squares (IRLS) method to iteratively remove occluded imagepixels while the transform parameters of the face region were sought.

Face recognition by sparse representation 527
0.5
(a) (b)
0.5
0
00
50
100
0
50
100
–0.5
–0.5
0.5
0
–0.5
–50 0Angle of rotationx-translation
50
y-tr
ansl
atio
n
y-tr
ansl
atio
n
Figure 12.7 Region of attraction [44]. Fraction of subjects for which the algorithm successfully aligns amanually perturbed test image. The amount of translation is expressed as a fraction of thedistance between the outer eye corners, and the amount of in-plane rotation in degrees. (a)Simultaneous translation in x and y directions. More than 90% of the subjects were correctlyaligned for any combination of x and y translations, each up to 0.2. (b) Simultaneous translationin y direction and in-plane rotation θ. More than 90% of the subjects were correctly aligned forany combination of y translation up to 0.2 and θ up to 25. © 2009 IEEE.
Once the best transformation τk is obtained for each subject k, we can apply its inverseto the training set Φk so that the entire training set is aligned to y. Then, a global sparserepresentation c of y with respect to the transformed training set can be sought by solvingan optimization problem of the form (12.9). The final classification is done by computingthe 2 distance between y and its approximation y = Φkδk(c) using only the trainingimages from the kth class, and assigning y to the class that minimizes the distance.7 Thecomplete algorithm is summarized in Algorithm 12.1.
Finally, we present some experimental results that characterize the region of attractionof the proposed alignment procedure for both 2-D deformation and 3-D pose variation.We will leave the evaluation of the overall face recognition system to Section 12.8.
For 2-D deformation, we use a subset of images of 120 subjects from the CMU Multi-PIE database [23], since the ground-truth alignment is available. In this experiment, thetraining set consists of images under properly chosen lighting conditions, and the testingset contains one new illumination. We introduce artificial perturbation to each test imagewith a combination of translation and rotation, and use the proposed algorithm to alignit to the training set of the same subject. For more details about the experiment setting,please refer to [44]. Figure 12.7 shows the percentage of successful registrations forall test images for each artificial perturbation. We can see that our algorithm performsvery well with translation up to 20% of the eye distance (or 10 pixels) in both x and y
directions, and up to 30 in-plane rotation. We have also tested our alignment algorithmwith scale variation, and it can handle up to 15% change in scale.
For 3-D pose variation, we collect our own dataset using the acquisition system whichwill be introduced in Section 12.7. The training set includes frontal face images of eachsubject under 38 illuminations and the testing set contains images taken under densely
7 δk(c) returns a vector of the same dimension as c that only retains the nonzero coefficients correspondingto subject k.

528 A. Ganesh, A. Wagner, Z. Zhou, A. Y. Yang, Y. Ma, and J. Wright
(a) (b) (c) (d) (e)
(f) (g) (h) (i) (j)
Figure 12.8 Aligning different poses to frontal training images [44]. (a) to (i): good alignment for posesfrom −45 to +45. (j): a case when the algorithm fails for an extreme pose (> 45). © 2009IEEE.
sampled poses. Viola and Jones’ face detector is then used for face cropping in thisexperiment. Figure 12.8 shows some typical alignment results. The alignment algorithmworks reasonably well with poses up to±45, which easily exceeds the pose requirementfor real-world access-control applications.
12.6 Fast 1 minimization algorithms
In the previous sections, we have seen how the problem of recognizing faces despitephysical variabilities such as illumination, misalignment, and occlusion fall naturallyinto the framework of sparse representation. Indeed, all of these factors can be addressedsimultaneously by solving appropriate 1 minimization problems. However, for theseobservations to be useful in practice, we need scalable and efficient algorithms for 1minimization.
Although 1 minimization can be recast as a linear program and solved to high accuracyusing interior-point algorithms [28], these algorithms do not scale well with the problemsize: each iteration typically requires cubic time. Fortunately, interest in compressedsensing has inspired a recent wave of more scalable, more efficient first-order methods,which can solve very large 1 minimization problems to medium accuracy (see, e.g., [40]for a general survey). As we have seen in Section 12.4, 1 minimization problems arisingin face recognition may have dramatically different structures from problems arising inother applications of compressed sensing, and hence require customized solvers. Inthis section, we describe our algorithm of choice for solving these problems, which isessentially an augmented Lagrange multiplier method [5], but also uses an acceleratedgradient algorithm [2] to solve a key subproblem. We draw extensively on the survey [48],which compares the performance of various solvers in the context of face recognition.

Face recognition by sparse representation 529
The key property of the 1 norm that enables fast first-order solvers is the existenceof an efficient solution to the “proximal minimization”:
Sλ[z] = argminc
λ‖c‖1 +1
2‖c −z‖2
2, (12.15)
where c,z ∈ Rn, and λ > 0. It is easy to show that the above minimization is solved bysoft-thresholding, which is defined for scalars as follows:
Sλ[c] =
c−λ, if c > λ
c+λ, if c < −λ
0, if |c| ≤ λ
(12.16)
and extended to vectors and matrices by applying it element-wise. It is extremely simpleto compute, and forms the backbone of most of the first-order methods proposed for 1minimization. We will examine one such technique, namely, the method of AugmentedLagrange Multipliers (ALM), in this section. To keep the discussion simple, we focusour discussion on the SRC problem, although the ideas are directly applicable to theimage alignment problem as well. The interested reader may refer to the Appendix of[48] for more details.
Lagrange multiplier methods are a popular tool in convex optimization. The basicidea is to eliminate equality constraints by adding an appropriate penalty term to the costfunction that assigns a very high cost to infeasible points. The goal is then to efficientlysolve the unconstrained problem. For our problem, we define the augmented Lagrangianfunction as follows:
Lµ(c,e,ν).= ‖c‖1 + ‖e‖1 + 〈ν,y−Φc− e〉+
µ
2‖y−Φc− e‖2
2, (12.17)
where µ > 0, and ν is a vector of Lagrange multipliers. Note that the augmentedLagrangian function is convex in c and e. Suppose that (c,e) is the optimal solu-tion to the original problem. Then, it can be shown that for sufficiently large µ, thereexists a ν such that
(c,e) = argminc,e
Lµ(c,e,ν). (12.18)
The above property indicates that minimizing the augmented Lagrangian functionamounts to solving the original constrained optimization problem. However, thisapproach does not seem a viable one since ν is not known a priori and the choice ofµ is not evident from the problem. Augmented Lagrange Multiplier methods overcomethese issues by simultaneously solving for ν in an iterative fashion and monotonicallyincreasing the value of µ every iteration so as to avoid converging to an infeasible point.The basic ALM iteration is given by [5]:
(ck+1,ek+1) = argminc,e Lµk(c,e,νk),
νk+1 = νk +µk(y−Φck+1 − ek+1),(12.19)
where µk is a monotonically increasing positive sequence. This iteration by itself doesnot give us an efficient algorithm since the first step of the iteration is an unconstrained

530 A. Ganesh, A. Wagner, Z. Zhou, A. Y. Yang, Y. Ma, and J. Wright
convex program. However, for the 1 minimization problem, we will see that it can besolved very efficiently.
The first step to simplifying the above iteration is to adopt an alternating minimizationstrategy, i.e., to first minimize with respect to e and then minimize with respect to c. Thisapproach, dubbed alternating direction method of multipliers in [22], was first used in[51] in the context of 1 minimization. Thus, the above iteration can be rewritten as:
ek+1 = argmine Lµk(ck,e,νk),
ck+1 = argminc Lµk(c,ek+1,νk),
νk+1 = νk +µk(y−Φck+1 − ek+1).
(12.20)
Using the property described in (12.15), it is not difficult to show that
ek+1 = S 1µk
[1
µkνk +y−Φck
]. (12.21)
Obtaining a similar closed-form expression for ck+1 is not possible, in general. So,we solve for it in an iterative procedure. We note that Lµk
(c,ek+1,νk) can be split intotwo functions: ‖c‖1 + ‖ek+1‖1 + 〈νk,y −Φc− ek+1〉 that is convex and continuousin x; and µk
2 ‖y −Φc− ek+1‖22 that is convex, smooth, and has Lipschitz continuous
gradient. This form of the Lµk(c,ek+1,νk) allows us to use a fast iterative thresholding
algorithm, called FISTA [2], to solve for ck+1 in (12.20) efficiently. The basic idea inFISTA is to iteratively form quadratic approximations to the smooth part of the costfunction and minimize the approximated cost function instead.
Using the above-mentioned techniques, the iteration described in (12.20) is summa-rized as Algorithm 12.2, where γ denotes the largest eigenvalue of ΦT Φ. Althoughthe algorithm is composed of two loops, in practice, we find that the innermost loopconverges in a few iterations.
As mentioned earlier, several first-order methods have been proposed for 1 minimiza-tion recently. Theoretically, there is no clear winner among these algorithms in termsof the convergence rate. However, it has been observed empirically that ALM offersthe best tradeoff in terms of speed and accuracy. An extensive survey of some of theother methods along with experimental comparison is presented in [48]. Compared tothe classical interior-point methods, Algorithm 12.2 generally takes more iterations toconverge to the optimal solution. However, the biggest advantage of ALM is that eachiteration is composed of very elementary matrix-vector operations, as against matrixinversions or Gaussian eliminations used in the interior-point methods.
12.7 Building a complete face recognition system
In the previous sections, we have presented a framework for reformulating face recogni-tion in terms of sparse representation, and have discussed fast 1 minimization algorithms
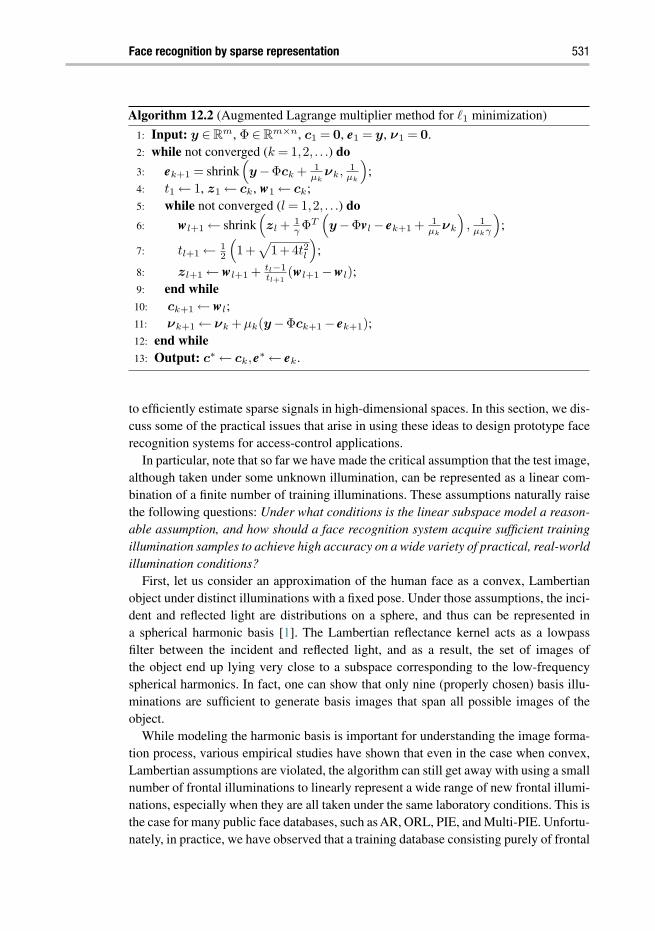
Face recognition by sparse representation 531
Algorithm 12.2 (Augmented Lagrange multiplier method for 1 minimization)
1: Input: y ∈ Rm, Φ ∈ Rm×n, c1 = 0, e1 = y, ν1 = 0.2: while not converged (k = 1,2, . . .) do
3: ek+1 = shrink(y−Φck + 1
µkνk, 1
µk
);
4: t1 ← 1, z1 ← ck, w1 ← ck;5: while not converged (l = 1,2, . . .) do
6: wl+1 ← shrink(zl +
1γ ΦT
(y−Φvl − ek+1 + 1
µkνk
), 1
µkγ
);
7: tl+1 ← 12
(1+
√1+4t2l
);
8: zl+1 ← wl+1 + tl−1tl+1
(wl+1 −wl);9: end while10: ck+1 ← wl;11: νk+1 ← νk +µk(y−Φck+1 − ek+1);12: end while13: Output: c∗ ← ck,e∗ ← ek.
to efficiently estimate sparse signals in high-dimensional spaces. In this section, we dis-cuss some of the practical issues that arise in using these ideas to design prototype facerecognition systems for access-control applications.
In particular, note that so far we have made the critical assumption that the test image,although taken under some unknown illumination, can be represented as a linear com-bination of a finite number of training illuminations. These assumptions naturally raisethe following questions: Under what conditions is the linear subspace model a reason-able assumption, and how should a face recognition system acquire sufficient trainingillumination samples to achieve high accuracy on a wide variety of practical, real-worldillumination conditions?
First, let us consider an approximation of the human face as a convex, Lambertianobject under distinct illuminations with a fixed pose. Under those assumptions, the inci-dent and reflected light are distributions on a sphere, and thus can be represented ina spherical harmonic basis [1]. The Lambertian reflectance kernel acts as a lowpassfilter between the incident and reflected light, and as a result, the set of images ofthe object end up lying very close to a subspace corresponding to the low-frequencyspherical harmonics. In fact, one can show that only nine (properly chosen) basis illu-minations are sufficient to generate basis images that span all possible images of theobject.
While modeling the harmonic basis is important for understanding the image forma-tion process, various empirical studies have shown that even in the case when convex,Lambertian assumptions are violated, the algorithm can still get away with using a smallnumber of frontal illuminations to linearly represent a wide range of new frontal illumi-nations, especially when they are all taken under the same laboratory conditions. This isthe case for many public face databases, such as AR, ORL, PIE, and Multi-PIE. Unfortu-nately, in practice, we have observed that a training database consisting purely of frontal

532 A. Ganesh, A. Wagner, Z. Zhou, A. Y. Yang, Y. Ma, and J. Wright
Subject
Front camera
Rear camera Projectors
Figure 12.9 Illustration of the training acquisition system, which consists of four projectors and two camerascontrolled by a computer. [44] © 2009 IEEE.
Figure 12.10 38 training images of a subject collected by the system. The first 24 images are sampled usingthe foreground lighting patterns, and the other 14 images using the background lighting patterns.[44] © 2009 IEEE.
illuminations is not sufficient to linearly represent images of a face taken under typi-cal indoor and outdoor conditions. To ensure our algorithm works in practice, we needto more carefully acquire a set of training illuminations that are sufficient to linearlyrepresent a wide variety of practical indoor and outdoor illuminations.
To this end, we have designed a system that can acquire frontal images of a subjectwhile simultaneously illuminating the subject from all directions. A sketch of the systemis shown in Figure 12.9. A more detailed explanation of this system is discussed in [44].
Based on the results of our experiments, the illumination patterns projected eitherdirectly on the subject’s frontal face or indirectly on the wall correspond to a total of 38training illumination images, as an example shown in Figure 12.10. We have observedthat further acquiring finer illumination patterns does not significantly improve the imageregistration and recognition accuracy [44]. Therefore, we have used those illuminationmodels for all our large-scale experiments.

Face recognition by sparse representation 533
12.8 Overall system evaluation
In this section, we present representative recognition results of our complete systemon large-scale face databases. All the experiments are carried out using input directlyobtained from the Viola and Jones’ face detector, without any manual interventionthroughout the process.
We use two different face databases to test our system. We first report the perfor-mance of our system on the largest public face database available that is suitable fortesting our algorithm, the CMU Multi-PIE database [23]. This database contains imagesof 337 subjects across simultaneous variation in pose, expression, illumination, andfacial appearance over time, and thus provides the most extensive test among all publicdatabases. However, one shortcoming of the CMU Multi-PIE database for our purpose isthat all the images are taken under controlled laboratory lighting conditions, restrictingour choice of training and testing sets to these conditions, which may not cover all typicalnatural illuminations. Therefore, our goal of this experiment is to simply demonstratethe effectiveness of our fully automatic system with respect to such a large number ofclasses. We next test on a face database collected using our own acquisition system asdescribed in Section 12.7. The goal of that experiment is then to show that with a suf-ficient set of training illuminations, our system is indeed capable of performing robustface recognition with loosely controlled test images taken under practical indoor andoutdoor conditions.
For the CMU Multi-PIE database, we use all the 249 subjects present in Session 1 asthe training set. The remaining 88 subjects are considered as “outliers” and are used totest our system’s ability to reject invalid images. To further challenge our system, weinclude only 7 extreme frontal illumination conditions for each of the 249 subjects in thetraining, and use frontal images of all the 20 illuminations from Session 2–4 as testing,which were recorded at different times over a period of several months. Table 12.1 showsthe result of our algorithm on each of the three testing sessions, as well as the resultsobtained using baseline linear-projection-based algorithms including Nearest Neighbor(NN), Nearest Subspace (NS) [30], and Linear Discriminant Analysis (LDA) [3]. Notethat we initialize these baseline algorithms in two different ways, namely, from the outputof the Viola and Jones’ detector, indicated by a subscript “d,” and with images which arealigned to the training with manually clicked outer eye-corners, indicated by a subscript“m.” One can see in Table 12.1 that, despite careful manual registration, these baselinealgorithms perform significantly worse than our system, which uses input directly fromthe face detector.
We further perform subject validation on the Multi-PIE database, using the measureof concentration of the sparse coefficients as introduced in Section 12.2, and comparethis method to the classifiers based on thresholding the error residuals of NN, NS, andLDA. Figure 12.11 plots the receiver operating characteristic (ROC) curves, which aregenerated by sweeping the threshold through the entire range of possible values for eachalgorithm. We can see that our approach again significantly outperforms the other threealgorithms.
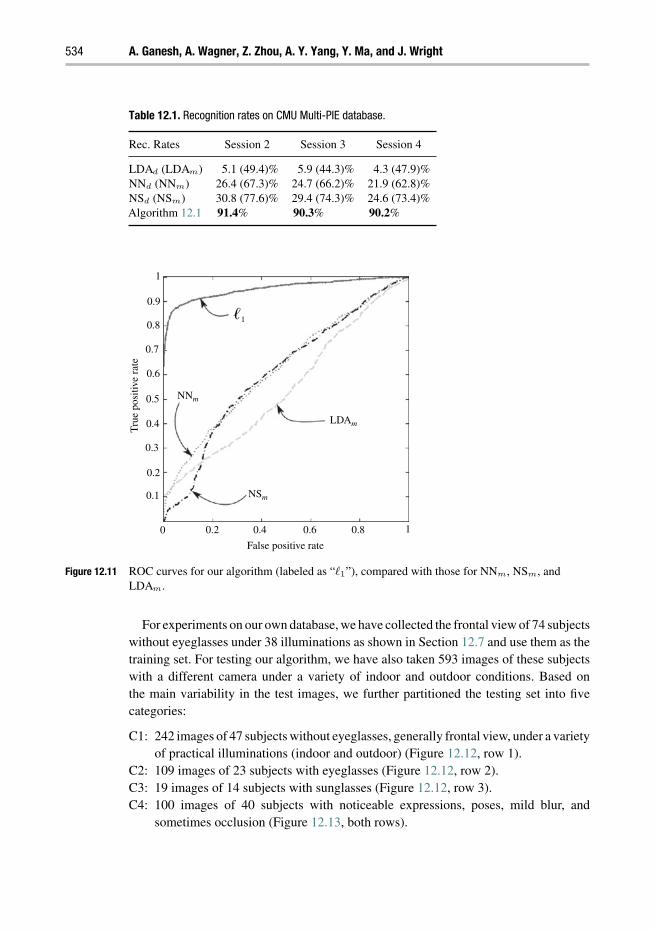
534 A. Ganesh, A. Wagner, Z. Zhou, A. Y. Yang, Y. Ma, and J. Wright
Table 12.1. Recognition rates on CMU Multi-PIE database.
Rec. Rates Session 2 Session 3 Session 4
LDAd (LDAm) 5.1 (49.4)% 5.9 (44.3)% 4.3 (47.9)%NNd (NNm) 26.4 (67.3)% 24.7 (66.2)% 21.9 (62.8)%NSd (NSm) 30.8 (77.6)% 29.4 (74.3)% 24.6 (73.4)%Algorithm 12.1 91.4% 90.3% 90.2%
1
0.9
NNm
NSm
LDAm
0.8L1
0.7
0.6
0.5
0.4
0.3
0.2
0.1
0 0.2 0.4
False positive rate
Tru
e po
sitiv
e ra
te
0.6 0.8 1
Figure 12.11 ROC curves for our algorithm (labeled as “1”), compared with those for NNm, NSm, andLDAm.
For experiments on our own database, we have collected the frontal view of 74 subjectswithout eyeglasses under 38 illuminations as shown in Section 12.7 and use them as thetraining set. For testing our algorithm, we have also taken 593 images of these subjectswith a different camera under a variety of indoor and outdoor conditions. Based onthe main variability in the test images, we further partitioned the testing set into fivecategories:
C1: 242 images of 47 subjects without eyeglasses, generally frontal view, under a varietyof practical illuminations (indoor and outdoor) (Figure 12.12, row 1).
C2: 109 images of 23 subjects with eyeglasses (Figure 12.12, row 2).C3: 19 images of 14 subjects with sunglasses (Figure 12.12, row 3).C4: 100 images of 40 subjects with noticeable expressions, poses, mild blur, and
sometimes occlusion (Figure 12.13, both rows).

Face recognition by sparse representation 535
Table 12.2. Recognition rates on our own database.
Test Categories C1 C2 C3 C4 C5
Rec. Rates (%) 95.9 91.5 63.2 73.7 53.5
Figure 12.12 Representative examples of categories 1-3. One row for each category. [44] © 2009 IEEE.
Figure 12.13 Representative examples of category 4. Top row: successful examples. Bottom row: failures.[44] © 2009 IEEE.
C5: 123 images of 17 subjects with little control (out of focus, motion blur, signifi-cant pose, large occlusion, funny faces, extreme expressions) (Figure 12.14, bothrows).
Table 12.2 reports the recognition rates of our system on each category.As one can see,our system achieves recognition rates above 90% for face images with general frontalviews, under a variety of practical illuminations. Our algorithm is also robust to smallamounts of pose, expression, and occlusion (i.e., eyeglasses).

536 A. Ganesh, A. Wagner, Z. Zhou, A. Y. Yang, Y. Ma, and J. Wright
Figure 12.14 Representative examples of category 5. Top row: successful examples. Bottom row: failures.[44] © 2009 IEEE.
12.9 Conclusion and discussion
Based on the theory of sparse representation, we have proposed a comprehensive frame-work/system to tackle the classical problem of face recognition in computer vision. Theinitial success of our solution relies on careful analysis of the special data structuresin high-dimensional face images. Although our study has revealed new insights aboutface recognition, many new problems remain largely open. For instance, it is still notclear why the sparse representation based classification (SRC) is so discriminative forhighly correlated face images. Indeed, since the matrix Φ = [Φ1,Φ2, . . . ,ΦC ] has classstructure, one simple alternative to SRC is to treat each class one at a time, solving arobust regression problem via the 1 norm, and then select the class with the lowestregression error. Similar to SRC, this alternative respects the physics of illumination andin-plane transformations, and leverages the ability of 1 minimization to correct sparseerrors. However, we find that SRC has a consistent advantage in terms of classificationpercentage (about 5% on Multi-PIE [44]). One more sophisticated way to take advantageof class structure is by enforcing group sparsity on the coefficients c. While this mayimpair the system’s ability to reject invalid subjects (as in Figure 12.11), it also has thepotential to improve recognition performance [39, 32].
Together with other papers that appeared in the similar time frame, this work hasinspired researchers to look into a broader range of recognition problems within theframework of sparse representation. Notable examples include image super-resolution[50], object recognition [34, 41], human activity recognition [49], speech recognition[20], 3-D motion segmentation [37, 19], and compressed learning [7]. While thesepromising works raise many intriguing questions, we believe the full potential of sparserepresentation for recognition problems remains to be better understood mathematicallyand carefully evaluated in practice.
References
[1] R. Basri and D. Jacobs. Lambertian reflectance and linear subspaces. IEEE Trans PatternAnal Machine Intell, 25(2):218–233, 2003.

Face recognition by sparse representation 537
[2] A. Beck and M. Teboulle. A fast iterative shrinkage-thresholding algorithm for linear inverseproblems. SIAM J Imaging Sci, 2(1):183–202, 2009.
[3] P. Belhumeur, J. Hespanda, and D. Kriegman. Eigenfaces vs. Fisherfaces: recognition usingclass specific linear projection. IEEE Trans Pattern Anal Machine Intelli, 19(7):711–720,1997.
[4] P. Belhumeur and D. Kriegman. What is the set of images of an object under all possibleillumination conditions? Int J Comput Vision, 28(3):245–260, 1998.
[5] D. Bertsekas. Nonlinear Programming. Athena Scientific, 2003.[6] A. Bruckstein, D. Donoho, and M. Elad. From sparse solutions of systems of equations to
sparse modeling of signals and images. SIAM Rev, 51(1):34–81, 2009.[7] R. Calderbank, S. Jafarpour, and R. Schapire. Compressed learning: universal sparse
dimensionality reduction and learning in the measurement domain. Preprint, 2009.[8] E. Candès and T. Tao. Decoding by linear programming. IEEE Trans Inform Theory, 51(12),
2005.[9] E. Candès and T. Tao. Near optimal signal recovery from random projections: universal
encoding strategies? IEEE Trans on Inform Theory, 52(12):5406–5425, 2006.[10] H. Chen, H. Chang, and T. Liu. Local discriminant embedding and its variants. Proc IEEE
Int Conf Comput Vision Pattern Recog, 2005.[11] S. Chen, D. Donoho, and M. Saunders. Atomic decomposition by basis pursuit. SIAM Rev,
43(1):129–159, 2001.[12] T. Chen, W. Yin, X. Zhou, D. Comaniciu, and T. Huang. Total variation models for variable
lighting face recognition. IEEE Trans Pattern Anal Machine Intell, 28(9):1519–1524, 2006.[13] D. Donoho. Neighborly polytopes and sparse solution of underdetermined linear equations.
Preprint, 2005.[14] D. Donoho. For most large underdetermined systems of linear equations the minimal
1-norm near solution approximates the sparest solution. Commun Pure Appli Math,59(6):797–829, 2006.
[15] D. Donoho and M. Elad. Optimally sparse representation in general (nonorthogonal)dictionaries via 1 minimization. Proc Nati Acad Sci, 100(5):2197–2202, 2003.
[16] D. Donoho and J.Tanner. Neighborliness of randomly projected simplices in high dimensions.Proc Nati Acad Sci, 102(27):9452–9457, 2005.
[17] D. Donoho and J. Tanner. Counting faces of randomly-projected polytopes when theprojection radically lowers dimension. J Am Math Soc, 22(1):1–53, 2009.
[18] M. Elad, J. Starck, P. Querre, and D. Donoho. Simultaneous cartoon and texture imageinpainting using morphological component analysis (MCA). Appl Comput Harmonic Anal,19:340–358, 2005.
[19] E. Elhamifar and R. Vidal. Sparse subspace clustering. Proc IEEE Int Conf Computer VisionPattern Recog, 2009.
[20] J. Gemmeke, H. Van Hamme, B. Cranen, and L. Boves. Compressive sensing for missingdata imputation in noise robust speech recognition. IEEE J Selected Topics Signal Proc,4(2):272–287, 2010.
[21] A. Georghiades, P. Belhumeur, and D. Kriegman. From few to many: illumination conemodels for face recognition under variable lighting and pose. IEEE Trans Pattern AnalMachine Intell, 23(6):643–660, 2001.
[22] R. Glowinski and A. Marrocco. Sur l’approximation par éléments finis d’ordre un, et larésolution, par pénalisation-dualité d’une classe de problèmes de dirichlet nonlinéaires. RevFranc d’Automat Inform, Recherche Opérationnelle, 9(2):41–76, 1975.

538 A. Ganesh, A. Wagner, Z. Zhou, A. Y. Yang, Y. Ma, and J. Wright
[23] R. Gross, I. Matthews, J. Cohn, T. Kanade, and S. Baker. Multi-PIE. Proc IEEE Conf onAutomatic Face Gesture Recog, 2008.
[24] G. Hager and P. Belhumeur. Efficient region tracking with parametric models of geometryand illumination. IEEE Trans Pattern Anal Machine Intell, 20(10):1025–1039, 1998.
[25] X. He, S. Yan, Y. Hu, P. Niyogi, and H. Zhang. Face recognition using Laplacianfaces. IEEETrans Pattern Anal Machine Intell, 27(3):328–340, 2005.
[26] G. Huang, M. Ramesh, T. Berg, and E. Learned-Miller. Labeled faces in the wild: a databasefor studying face recognition in unconstrained environments. Tech Rep 07-49, University ofMassachusetts, Amherst, 2007.
[27] K. Jittorntrum and M. Osborne. Strong uniqueness and second order convergence in nonlineardiscrete approximation. Numer Math, 34:439–455, 1980.
[28] N. Karmarkar. A new polynomial time algorithm for linear programming. Combinatorica,4:373–395, 1984.
[29] T. Kim and J. Kittler. Locally linear discriminant analysis for multimodally distributed classesfor face recognition with a single model image. IEEE Trans Pattern Anal Machine Intell,27(3):318–327, 2005.
[30] K. Lee, J. Ho, and D. Kriegman. Acquiring linear subspaces for face recognition undervariable lighting. IEEE Trans Pattern Anal Machine Intell, 27(5):684–698, 2005.
[31] B. Lucas and T. Kanade. An iterative image registration technique with an application tostereo vision. Proc Int Joint Conf Artif Intell, 3: 674–679, 1981.
[32] A. Majumdar and R. Ward. Improved group sparse classifier. Pattern Recog Letters, 31:1959–1964, 2010.
[33] A. Martinez and R. Benavente. The AR face database. Technical rep, CVC Technical ReportNo. 24, 1998.
[34] N. Naikal, A. Yang, and S. Sastry. Towards an efficient distributed object recognition systemin wireless smart camera networks. Proc Int Conf Inform Fusion, 2010.
[35] M. Osborne and R. Womersley. Strong uniqueness in sequential linear programming. J AustMath Soc, Ser B, 31:379–384, 1990.
[36] L. Qiao, S. Chen, and X. Tan. Sparsity preserving projections with applications to facerecognition. Pattern Recog, 43(1):331–341, 2010.
[37] S. Rao, R. Tron, and R. Vidal. Motion segmentation in the presence of outlying, incom-plete, or corrupted trajectories. IEEE Trans Pattern Anal Machine Intell, 32(10):1832–1845,2010.
[38] P. Sinha, B. Balas, Y. Ostrovsky, and R. Russell. Face recognition by humans: nineteen resultsall computer vision researchers should know about. Proc IEEE, 94(11):1948–1962, 2006.
[39] P. Sprechmann, I. Ramirez, G. Sapiro, andY. C. Eldar. C-HiLasso: a collaborative hierarchicalsparse modeling framework. (To appear) IEEE Trans Sig Proc, 2011.
[40] J. Tropp and S. Wright. Computational methods for sparse solution of linear inverse problems.Proc IEEE, 98:948–958, 2010.
[41] G. Tsagkatakis and A. Savakis. A framework for object class recognition with no visualexamples. In Western New York Image Processing Workshop, 2010.
[42] M. Turk and A. Pentland. Eigenfaces for recognition. Proc IEEE Int Conf Comp VisionPattern Recog, 1991.
[43] M. Turk and A. Pentland. Eigenfaces for recognition. J Cogn Neurosci, 3(1):71–86, 1991.[44] A. Wagner, J. Wright, A. Ganesh, Z. Zhou, and Y. Ma. Toward a practical automatic face
recognition system: robust pose and illumination via sparse representation. Proc IEEE IntConf Comput Vision Pattern Recog, 2009.
Face recognition by sparse representation 539
[45] J. Wright and Y. Ma. Dense error correction via 1-minimization. IEEE Trans on InformTheory, 56(7):3540–3560, 2010.
[46] J. Wright, A. Yang, A. Ganesh, S. Sastry, and Y. Ma. Robust face recognition via sparserepresentation. IEEE Trans Pattern Anal Machine Intelli, 31(2):210–227, 2009.
[47] S. Yan, D. Xu, B. Zhang, H. Zhang, Q. Yang, and S. Lin. Graph embedding and extension:a general framework for dimensionality reduction. IEEE Trans Pattern Anal Machine Intell,29:40–51, 2007.
[48] A. Yang, A. Ganesh, Z. Zhou, S. Sastry, and Y. Ma. Fast 1-minimization algorithms forrobust face recognition. (Preprint) arXiv:1007.3753, 2011.
[49] A. Yang, R. Jafari, S. Sastry, and R. Bajcsy. Distributed recognition of human actions usingwearable motion sensor networks. J. Ambient Intelli Smart Environm, 1(2):103–115, 2009.
[50] J. Yang, J. Wright, T. Huang, and Y. Ma. Image super-resolution as sparse representation ofraw image patches. Proc IEEE Int Conf Comput Vision Pattern Recog, 2008.
[51] J. Yang and Y. Zhang. Alternating direction algorithms for 1-problems in compressivesensing. arXiv:0912.1185, 2009.
[52] W. Zhao, R. Chellappa, J. Phillips, and A. Rosenfeld. Face recognition: a literature survey.ACM Comput Surv, 35(4):399–458, 2003.
[53] S. Zhou, G. Aggarwal, R. Chellappa, and D. Jacobs. Appearance characterization of lin-ear Lambertian objects, generalized photometric stereo, and illumination-invariant facerecognition. IEEE Trans Pattern Anal Machine Intell, 29(2):230–245, 2007.

Index
p-norm, 50-norm, 5
active learning, 302active vision, 302adaptive vs. non-adaptive information, 270Alltop sequence, 25alternating direction method, 535AMP, see aproximate message passinganalog discretization, 127analog sensing, see Xamplinganalog signals, 13annihilating filter, 160
equation, 160extended annihilating equation, 183
approximate isometries, 19, 214, 230approximate message passing (AMP), 407–412atom, 7audio, 83augmented Lagrange multipliers (ALM), 534
Babel function, 493Back-DSP algorithm, 115Bai–Yin’s law, 229basis, 6basis mismatch, 129Basis Pursuit, 486Bayes’ rule, 276–279Bayesian experimental design, 275, 278belief propagation, 404, 431Bernoulli
random matrices, 228random variables, 220random vectors, 224, 226
Bernstein-type inequality, 222non-commutative, 228, 236
best k-term approximation, 9binary tree, 274block-sparse, 10, 12, 375, 378
Cadzow denoising, 184cartoon, 504, 506, 507cluster coherence, 493, 494, 497, 507, 509
definition, 493clustered sparsity, 492coefficients
clustered, 495cognitive radio, 104coherence, 24collaboration, 66collaborative hierarchical Lasso, 80collaborative hierarchical sparse model, 66collaborative Lasso, 80collaborative sparse model, 76combinatorial group testing, 41compressibility, 11compressive distilled sensing (CDS), 298–301Compressive Sampling Matching Pursuit, 367
algorithm, 368for structured sparse models, 378recovery result, 369
concentration of measure, 230, 262condition number, 211continuous multiband signal, 376, 378continuous to finite, 102coordinate random vectors, 224, 226, 236CoSaMP, see Compressive Sampling Matching
Pursuitcovariance matrix, 224
estimation, 240covering argument, 232covering numbers, 215Cramér–Rao bound (CRB), 33, 177
derivations, 202kernel comparison, 182periodic stream, 181simulations, 187
cross-and-bouquet model, 528cross-polytope, 37, 313cumulative coherence function, 493curse of dimensionality, 271, 292, 293, 300curvelets, 489, 504, 506–511
Dantzig selector, 39data
astronomical, 486audio, 484, 486, 500, 501

Index 541
imaging, 484, 486, 503multimodal, 484neurobiological, 505separation, 484
data streams, 41decoupling, 246, 250democratic measurements, 26denoising, 270–273, 287, 289, 301, 486
Basis Pursuit, 503dictionary, 7, 375
composed, 485, 493, 504sparse, 486
dictionary learning, 487–489dimensionality reduction, 525Dirac basis, 500–502discretization, see analog discretizationDistance-Preserving Property, 440distilled sensing (DS), 286, 287, 289–293, 295,
297–301
effective rank, 241entropy, 276–278, 280expectation maximization, 71exponential reproducing kernels, 166
CRB, 182CRB derivation, 206piecewise sinusoidal, 194simulations, 188
external angle, 314
face recognition, 520alignment, 529occlusion, 527system, 535
false discovery proportion (FDP), 288, 289,291–293, 299, 301
finite rate of innovation (FRI), 13, 14, 149,376
applications, 194definition, 154examples, 155extensions, 194history, 151sampling scheme, 149simulations, 185
Fourier basis, 486, 500–502Fourier measurements, 259frame, 6, 225, 244
dual frame, 7equiangular tight frame, 25Gabor frame, 25
Frobenius norm, 275, 297
Gamma function, 283Gaussian
random matrices, 26, 228, 230random vectors, 32–33, 224, 226
Gaussian mixture model, 66, 70Gelfand width, 22generative model, 278, 282Geometric Separation Problem, 507, 509Gershgorin circle theorem, 25Gordon’s theorem, 229GP, see Gradient PursuitGradient Pursuit, 352–353
algorithm, 353recovery result, 359
Gram matrix, 24, 244, 250graphical model, 394, 399, 428–434Grassmann angle, 313, 320Grassmann Manifold, 313greedy algorithm, 39, 348greedy pursuit, 349
Hadamard matrices, 260hard edge of spectrum, 231heavy-tailed
random matrices with independent columns, 249random matrices with independent rows, 234restricted isometries, 256
hierarchical Lasso, 79hierarchical prior, 282, 284, 285hierarchical sparse model, 66, 76Hoeffding-type inequality, 220hyperparameters, 279, 284, 285hyperspectral images, 83
IHT, see Iterative Hard Thresholdingimage restoration, 67image separation, 485, 503, 504, 507IMV, see infinite measurement vectorincoherence, 252infinite measurement vector, 101information gain, 276–278, 280, 285, 287inner product, 5instance optimality, 18, 36internal angle, 313inverse problem, 271–273isotropic random vectors, 223, 224iterative hard thresholding (IHT), 39, 362–363
algorithm, 363recovery results, 363
iterative soft thresholding (IST), 409, 412, 413, 423
Johnson–Lindenstrauss lemma, 22Johnson–Lindenstauss transform, 440joint concentration, 493–495
Khinchine inequality, 221non-commutative, 227
Kullback–Leibler (KL) divergence, 277

542 Index
Lagrange multiplier, 273Lagrangian, 273Latala’s theorem, 231least absolute shrinkage and selection operator
(LASSO), 28, 298, 299low-rank matrices, 14, 43, 376, 378
manifold, 15Riemannian manifold, 15
Matching Pursuit, 350, 485algorithm, 350
maximum a posteriori (MAP) estimate, 273MCALab, 504, 506mean square error, 398, 400, 402, 412, 423, 425, 427measurement budget, 271, 272, 275, 289–293,
296–300message passing, 404–407min-sum algorithm, 404, 405minimax, 395, 399–404, 423MMV, see multiple measurement vectorsmodel
continuum, 507discrete, 507
model selection, 287, 298model-based restricted isometry property, 379modulated wideband converter, 108, 171
hardware design, 112Morphological Component Analysis, 485, 486, 503,
504, 506MP, see Matching Pursuitmultiband model, 14multiband sampling, 104multiband spectra, 92multichannel, 169
history, 152infinite FRI, 172periodic FRI, 170semi-periodic FRI, 173simulations, 190
multiple measurement vector (MMV), 12, 42, 376,385–389
recovery result, 386mutual coherence, 485, 489, 493, 497, 498, 500
definition, 489lower bound, 500
mutual information, 278MWC, see modulated wideband converter
net, 215noise, 29–35, 176
annihilating filter, see annihilating filterdevelopment, 151history, 152oversampling
Cadzow, 184TLS, 184
performance boundsbounded noise, 30–32continuous-time noise, 177Gaussian noise, 32–35sampling noise, 180
sampling scheme, 177noise sensitivity, 423non-discovery proportion (NDP), 288, 289,
291–293, 299, 301nonharmonic tones, 129nonlinear approximation, 9null space property (NSP), 17, 490Nyquist-equivalent systems, 132Nyquist-folding receiver, 141
OMP, see Orthogonal Matching Pursuitonion peeling, 282oracle estimator, 31Order Recursive Matching Pursuit (ORMP), 357Orthogonal Matching Pursuit (OMP), 39, 351
algorithm, 351recovery result, 359
oversampling, see noise
parametric model, 15pattern classification, 84PCA, see principal component analysisperiodic mixing, 109periodic nonuniform sampling, 106phase transition, 38PLA, see Projected Landweber AlgorithmPNS, see periodic nonuniform samplingpolynomial reproducing kernels, 168
CRB, 182CRB derivation, 205
prefix code, 274principal component analysis, 66, 72probability distribution
Gamma, 283Laplace, 282Student’s t, 284
Projected Landweber Algorithm, 377algorithm, 377recovery result, 379–380
projection operator, 377pursuit, see greedy pursuit
quantization, 21
radar sensing, 136random demodulator, 128random projections, 526random subset, 246rank aware order recursive matching, 388refinement, 272, 287, 290, 291, 293, 294, 296–299

Index 543
Regularized Orthogonal Matching Pursuit,356–357
relative sparsity, 495replica method, 421, 428restricted isometry property (RIP), 19–24, 252, 348,
380ROMP, see Regularized Orthogonal Matching
Pursuitrotation invariance, 220Rudelson’s inequality, 227, 238, 257
sample covariance matrix, 240sampling, 149
equation, 149noise, 176noise-free, 159
sampling from matrices and frames, 242Schatten norm, 227second moment matrix, 223selectors, 246sensing energy, 276, 278, 281, 286sensing matrix, 16
random sensing matrix, 26separation
accuracy, 492algorithms, 485, 488analysis side, 489, 503image, 485, 503signal, 484, 499synthesis side, 488, 503
sequences of innovation, 122sequential experiments, 276sequential sampling/sensing, 270–272, 275, 278,
282, 285, 302ShearLab, 504, 505shearlets, 486, 489, 504, 506, 507, 510, 511shift-invariant sampling, 98signal recovery, 27
1-norm minimization, 27greedy algorithms, 39
signal separation, 499sinc kernel, 159
CRB, 182CRB derivation, 202simulations, 185
single measurement vector (SMV), 43singular value decomposition, see SVDsingular values, 214sinusoids, 485, 486, 499–502sketching, 41Slepian’s inequality, 229soft thresholding, 401–403, 407soft-thresholding, 534SoS kernel, 162
CRB, 182CRB derivation, 204
simulations, 185source identification, 76source separation, 76SP, see Subspace Pursuitspark, 16, 43sparse recovery, 269, 270, 275, 296, 486
analysis side, 489, 503synthesis side, 488, 503
sparse representation-based classification (SRC),523
sparse shift-invariant, 99sparsity, 8
approximate sparsity, 11clustered, 492relative, 495sparse approximation error, 11structured sparsity, 12, 13
spectral norm, 215computing on a net, 216
spectrum slices, 105spectrum-blind reconstruction, 106spherical random vector, 225, 226spikes, 485, 486, 499–502stability, 20Stagewise Orthogonal Matching Pursuit,
355–356state evolution, 414–417statistical physics, 421, 428StOMP, see Stagewise Orthogonal Matching Pursuitstructured and collaborative sparse models, 66structured models, 373structured sparse models, 66, 70structured sparsity, 274–275, 374, 375, 381sub-exponential
norm, 222random variables, 221
sub-gaussiannorm, 219, 225random matrices with independent columns,
245random matrices with independent rows, 232random variables, 217, 219random vectors, 225restricted isometries, 26, 254
sub-matrices, 243, 260Subspace Pursuit, 367
algorithm, 369recovery result, 369
sum of sincs, 119sum of sincs kernel, see SoS kernelsupport recovery, see model selectionSupport Vector Machines, 440SVD, 184
Cadzow, see Cadzow denoisingTLS, see TLS
symmetrization, 237, 258

544 Index
texture, 504, 506, 507thresholding, 11time-delay, 93TLS, 184total least-squares denoising, see TLStree-sparse, 375, 378
uncertainty principle, 485, 487, 498, 499, 502classical, 498, 501Donoho–Stark, 502
union of subspaces, 12, 94, 374–385sparse union of subspaces, 12, 13
universality, 26, 141UoS, see union of subspaces
vector spacenormed vector space, 4
wavelets, 12, 486, 488, 502, 504, 507, 509, 510Meyer, 510, 511radial, 507–511
Welch bound, 24
Xampling, 13, 88, 94architecture, 96framework, 94X-ADC, 96X-DSP, 96


![[ Moshe Mishali and Yonina C. Eldar ]](https://img.dokumen.tips/doc/110x75/61c4cb8c10e9a8212d491b39/-moshe-mishali-and-yonina-c-eldar-.jpg)