Embed Size (px)
Citation preview

Data Analysis Through Modeling:Thinking and Writing in Context
Kris Green and Allen Emerson
Fall 2011 Edition1
1 c©2011 Kris H. Green and W. Allen Emerson

ii
About this text
Data Analysis Through Modeling is a one-semester data analysis and calculus text that canbe used as part of a one-, two- or three semester sequence of mathematics courses usually re-quired of business and management undergraduate majors. We believe the following featuresdistinguish this text from other texts in the curriculum:
⇒ Data-driven, open-ended problems⇒ Extensive use of spreadsheets throughout the text as more than just a calculator⇒ Key problems framed as realistic business memos⇒ Follows recommendations of MAA’s Curriculum Foundations Project CRAFTY report
for business and management
The increasingly information-driven demands of business in the 21st century require a dif-ferent emphasis in the quantitative skills and ways of thinking than traditional mathematicscourses have provided in the education of managers. This emphasis has to do with becomingcomfortable in the world of data and mathematical models, being able to use technology asa tool through which to think, and expressing one’s thinking effectively in writing.
The key, we believe, is data analysis through modeling. Data analysis for us means ”Whatcan we find out about this data set relevant to our problem?” Models for us are such thingsas: averages, boxplots, histograms, single- and multivariable regression equations, both linearand nonlinear. These models are proxies for data that are too complex to understand anyother way. We think of calculus as a way of analyzing certain kinds of models, which in turn,reveals something about underlying data structures. Our treatment of calculus emphasizesbasic concepts, such as rates of change, constrained optimization, and interpretations of areaunder a graph, and their applications to business problems. We use spreadsheets to developnumerical methods for both differentiation and integration while deemphasizing symbolicmanipulation. We use Excel’s Solver routine instead of the simplex method to solve linearprogramming problems. Using Solver has the advantage that we can also solve nonlinearprograms.
As we developed this text, we found the introduction of spreadsheet technology for anal-ysis of data not only changed our teaching approach and the content of the course, butit caused us to modify our assignments as well. We found that we simply could not getthe quality and depth of understanding we desired from our students by using conventionalexercises. We found that students have to explain their thinking and make explicit theirassumptions and inferences. In short, we had to supplement our more conventional exerciseswith memoranda problems with accompanying data files that students respond to in an ap-propriate business format that are, in turn, read by their supervisor. Further, we find thatstudents learn more by having a chance to revise their work based on instructor/supervisorfeedback. All of which should give an indication as to why the book is subtitled ”Thinkingand Writing in Context.”
Although the text has a unit of descriptive statistics and develops regression all the waythrough multivariable regression with interaction terms, Data Analysis Through Modeling isnot a statistics text. Most one-semester introductory statistics courses do not treat regressionat the level presented in this text. Moreover, most introductory statistics texts do not give

iii
the same emphasis to descriptive statistics that this text does, which is to use these relativelysimple concepts for rather deep analysis. Data Analysis Through Modeling fits well with anintroductory statistics course that primarily deals with probability and hypothesis testing.
How this text fits into the curriculum
We recommend the following tracks for a three-credit-hour, semester-long course using DataAnalysis Through Modeling :
• For students not having a prior statistics course: Chapters 1-9, 11-12 [11 chapters].This course would not contain calculus and would be the first in either a two- or threesemester sequence: 1) data analysis and statistics or 2) data analysis, statistics, andcalculus. In our experience, students then do quite well in the follow-up statisticscourse after their experience with our approach to data analysis.
• With a statistics prerequisite: Chapters 1-3, 7-9, 11-17 [12 chapters]. This coursewould contain calculus and constitute the second course in a two-semester sequencecontaining probability and hypothesis testing, data analysis, and calculus.
The basic concepts of calculus are emphasized and applied to business problems involvingmarginal analysis, optimization and area under a curve. As recommended by CRAFTY,formal techniques of symbolic manipulation are kept to a minimum, whereas spreadsheetsare used extensively not only for finding numerical solutions but, equally important, for thedevelopment of the basic concepts of calculus themselves.
The Technology Used in this Text
In addition to problem solving in the dynamic environment of spreadsheets, students willhave the opportunity to learn about and use the following Excel tools: pivot tables, sort-ing, stacking and unstacking data, basic statistical functions, frequency tables, sumproduct,building boxplots and histograms, correlation tables, simple regression, multivariable regres-sion (quantitative and qualitative), scatterplots, trendlines, Goal Seek, SOLVER table andgraphing in three dimensions. In addition, students will develop many basic computer liter-acy abilities, such as copying and pasting and integrating numerical, textual and graphicalanalyses into a single Word document. But what is most important about the way studentslearn these tools is that they are all taught in the context of solving business-type problems;this context, we believe, is critical for students learning how to transform these tools from aset of instructions to follow into a method of thinking and analyzing data.
The Structure of the Book
This text is organized into five units, not all of which can be covered in one semester, asmentioned above. The chapters in each unit are all connected through a common ”thinking

iv
Unit Thinking StrategyQuantifying the World Students learn the importance of data and how to locate
data in real world situations.Analyzing Data ThroughSpatial Models
Students learn how to use basic charts and graphs todeeply understand a problem situation.
Analyzing Data ThroughLinear Models
Students learn how to apply proportional reasoning tounderstand data with one or more independent vari-ables.
Analyzing Data ThroughNonlinear Models
Students learn to build models by linearizing non-proportional data and learn how to interpret these inrealistic situations.
Analyzing Data ThroughCalculus Models
Now that students understand how to build models fromdata, they learn how to use concepts from calculus tounderstand the problem from which the data and themodel were derived.
Table 1: Units and thinking strategies covered in the text.
strategy”. The thinking strategies are described in the table 1. The breakdown of topics ineach chapter within the units is described later.
Each chapter is designed to be covered in one week of a typical semester course. Sincethe homework problems (see below) come at the end of a chapter, the homework scheduleshould, ideally, consist of one assignment per week. Each chapter’s introduction provides abrief overview. It also includes a list of goals and objectives that the student should haveafter completing the chapter. After the introduction and overview, the main content of eachchapter is separated into two major sections, each of which consists of the following:
Discussion. This presents a short overview of the chapter or discusses a short motivationalexample illustrating the use of the chapter material. The material in this section isconceptual in nature.
Definitions and Formulas. This lists the factual information of the chapter in the form ofdefinitions, formulas, graphs, and methods of computing. It is intended as a referenceguide.
Worked Examples. These offer worked examples of using the formulas and techniques ofthe chapter. This material is more often procedural in nature, but uses concepts tounpack and apply the material to realistic situations from the business world.
Explorations. These involve small scenarios, often supplemented with data in Excel. Theyare open-ended and require discussion and scaffolding. These are basically guided-discovery type activities and are ready-made in-class activities, but can also cbe com-pleted by students outside of class in order to enhance their understanding of thechapter material.
How to Guides. These offer the details for getting Word, Excel and StatPro (an Exceladd-in) to handle the computations and graphing needed to complete the exercises.

v
Homework Problems
Each chapter within a unit is designed to provide the material for a weekly homeworkassignment at the end of the second section of the chapter. The problems at a chapter’send come in three types: Mechanics and Technique Problems, Application and ReasoningProblems, and Memo Problems (which include Communication and Professionalism skills).Although we consider the memos to be the heart of any course using this book, the numberof memos instructors choose to assign on a weekly basis will vary and the two other typesof problems work very well to provide a balanced weekly assignment load.
Mechanics and Technique Problems. These problems involve straightforward calcula-tions by hand or, more often, with the computer, and use the basic definitions, formulas,and computer techniques from the chapter.
Application and Reasoning Problems. These problems require students to analyze dataor apply the concepts of the chapter to small decision-making scenarios. Many of theserequire students to explain their thinking in a few short sentences so that the inferencesthey have drawn from the data and other information are made explicit.
Memo Problems. Each chapter concludes with a memo problem from a supervisor atOracular Consulting. The memos are written in the style of a management memo,often having a rather open-ended feel, and will most often direct the analysis staff (thestudents) to analyze some data for a client, using the tools of that chapter (and possiblyprevious chapters). Students are expected to reply to these memos with their own pro-fessionally written memos or reports. Most memo problems usually permit more thanone ”correct” response. We have developed detailed ”rubrics” for assessing each memowhich are invaluable should the instructor choose to have students revise and resubmittheir memos. These can be found in the Instructor’s Guide. These rubrics do not con-tain ”answers” per se, but rather statements to be checked off by the instructor thatnote lapses in analysis, missing pieces, incorrect or misapplied mathematical/computerprocedures, or point out structural writing difficulties. These statements are dividedinto three discrete areas: Mechanics and Technique, Applications and Reasoning, andCommunication and Professionalism, and each of these three is divided into two levelsof competence, Expected and Impressive (see the appendices for an example). In theInstructor’s Guide we describe in detail how we arrive at grades.
Entering Student Profile
As a student entering a course using this book, or as someone using this book on their own togain new skills, techniques, and concepts about quantitative analysis in the business world,you shold have some skills in the areas of mathematics, the use of technology, and writing.
Mathematics background: Basic algebra skills are essential, but the text does not requirewell-honed algebraic skills as a pre-requisite. What is most essential is the abstractionthat algebra supports in moving from concrete objects to expressions and functions

vi
with parameters and variables. Students should have had a mathematics backgroundup to, but not necessarily including, precalculus.
Technology background: The text does not assume that the students have any knowledgeof spreadsheets, though in our experience most have some familiarity with computersand spreadsheets, Excel in particular.
Writing Background: In our experience, students gain the most from this text when it istaught in a writing-intensive format, using a selection of the chapter memo problems(including revisions). Most first-year college writing course requirements will haveprepared students sufficiently to write at the level the memos demand.
Exiting Student Profile
By the end of a course based on this text, we expect students to have developed capabili-ties in three areas. The first area (mentioned above) is ”Mechanics and Techniques,” whichincludes knowledge of basic mathematical notation and symbol manipulation as well as ba-sic technological (especially spreadsheet) skills for structuring problems for solutions. Thesecond area is ”Application and Reasoning,” which covers the ability to contextualize themathematical ideas, to extract quantitative information from a context, and to make logicalinferences from quantitative analyses. The final area is ”Communication and Professional-ism,” which covers the ability to write coherently about a problem and its proposed solutionand to communicate this analysis in a professionally appropriate manner.
Specifically, a student earning an average grade in a course based on this text would havethe capabilities in each of the three areas shown in the outline below.
Mechanics and Techniques
◦ Has had experience formulating and interpreting algebraic, graphical and numericalmathematical models◦ Has used spreadsheets to apply various mathematical, statistical, and graphical tools
to business situations◦ Understands enough about data analytic techniques to effectively communicate with
statisticians and other types of expert analysts◦ Is competent and comfortable with spreadsheets◦ Has learned to use technology as a tool with which to think
Application and Reasoning
◦ Understands how to define a problem situation in terms of data◦ Understands the basic design of data collection forms and how to employ them◦ Has experience in working in open-ended, ambiguous problem situations◦ Understands the interpretive power of graphical displays of data◦ Understands the power and limitations of mathematical models◦ Has experience in interpreting the parameters and coefficients of mathematical models

vii
◦ Is capable of drawing contextual inferences from statistical and graphical analysis
Communication and Professionalism
◦ Knows the importance of writing in the workplace◦ Can write competent memos and reports as part and parcel of one’s job◦ Knows how to integrate and arrange statistical and graphical elements in a word pro-
cessing document to produce a convincing argument◦ Has learned to consider the reader’s response to a memo◦ Has learned to plan ahead to meet the demands of the course◦ Persists when the path is not clear◦ Has learned self discipline in accomplishing long and complex tasks
Some Words About Level of Difficulty
Viewed apart from a context of a memo, the mathematics, technology, and writing demandsof certain chapters may not seem very difficult when taken separately. But when studentsanalyze a data set using Excel, interpret and draw inferences from mathematical formulationswithin specific problem contexts and then organize the various charts, computer output, andtext into a coherent and readily understood memo, they find the work to be anything buteasy. Indeed, instructors of this text invariably comment on how they themselves have beenchallenged by the problems. The open-ended nature of the problems (e.g. see the Chapter 1memo) contributes to this challenge, as well as the sheer amount of time it takes to completethe whole process. This is one of the reasons that instructors may not wish to assign a memoproblem every week, especially when requiring revisions, which students mightily appreciateand benefit from.
Some Words About Plagiarism and Working Together
We require all memos to be submitted electronically through a course website (Blackboard) inWord. This enables us to issue the following policy that eliminates concerns about plagiarism:
”We encourage you to work together and to seek help when you need it. Our onlyrequirement is that you write your own memo in your own words.”
Invariably, two or three students will copy each other’s work sometime in the beginning ofthe semester. Because each writer’s voice comes through so strongly even in the memo genre,duplication is easy to detect. Furthermore, technology is an aid in identifying copying. Forexample, Microsoft Word has a feature called compare and merge documents (under tools)that superimposes one document upon another showing all differences in red (every space,every comma, whole chunks of text, etc.) or, more importantly, no differences. Tips on usingthis tool are available in the Instructor’s Guide. Once identified, instructors can respondwith the following notification: ”Computer analysis shows that significant portions of yourmemo and Mike’s memo are identical. While we encourage you to work together, we dorequire that you do your own write up. Friendly warning.” There are no copying problemsfrom this point on. Maybe word gets around the class about the ”computer analysis.”

viii
Copyright Notice
This edition of Data Analysis Through Modeling: Thinking and Writing in Context, includ-ing all written material, examples, problems, and associated data files, is the property of Dr.Kris H. Green, copyright 2008.

ix
Chapter Details
Unit 1. Quantifying the World. Students learn the importance of data and how to locatedata in real world situations.
Chapter Content Memo Regarding
1. Problem Solv-ing
Framing a problem in terms ofdata
Performing the up-front analysis in re-sponse to a RFP from Carnivorous CruiseLines concerning lack of attendance at itsentertainment venues (No data file)
2. Understandingthe Role of Data
Collecting and organizingdata to support problemsolving
Creating data collection forms and dis-playing sample test data in spreadsheetsfor the Carnivorous Cruise Lines RFP(Create your own data file)
3. Using Modelsto Interpret Data
Building simple models to an-alyze data using the mean,standard deviation and pivottables
Analyzing sample data from CarnivorousCruise Lines to make changes in the en-tertainment schedule (Data file)
Unit 2. Analyzing Data Through Spatial Models. Students learn how to use basic chartsand graphs to deeply understand a problem situation.
Chapter Content Memo Regarding
4. Box-and-Whisker Plots
Using boxplots and associatedmeasures to build and analyzespatial models of data
Using boxplots to explore the salary struc-tures of four different companies for twoquite different managers in need of a job(Data file)
5. Histograms Using z-scores and histogramsfor understanding differentdistributions of data
Analyzing customer wait times at a fastfood restaurant in response to customercomplaints of poor service (Data file)
6. InterpretingSpatial Models
Estimating statistics fromsummary data and connectthe different spatial models(boxplots and histograms)to build a more completeunderstanding of a set of data
Analyzing ten different stocks in order tobuild financial portfolios for two quite dif-ferent clients. (Data file)

x
Unit 3. Analyzing Data Through Linear Models. Students learn how to apply proportionalreasoning to understand data with one or more independent variables.
Chapter Content Memo Regarding
7. Correlation Picturing and quantifying therelationship between two vari-ables using correlation andtrendlines
Using and interpreting trendlines to deter-mine how in-city and out-of-city drivingconditions effect maintenance costs for atrucking fleet (Data file)
8. Simple Regres-sion
Using simple linear regressionto measure the effect of onevariable upon another and tointerpret how well our modelsfit the data
Building and interpreting simple regres-sion models regarding the how variousvariables affect ridership on a commuterrail system (Data file)
9. Multipleand CategoricalRegression
Extending regression model-ing into many dimensions andusing qualitative variables
Building successive multivariable modelsusing quantitative and qualitative vari-ables to analyze how gender might be im-plicated in the salary structure at a com-pany (Data file)
10. Is the ModelAny Good?
Exploring the reliability oflinear models and introduc-ing interaction terms into themodels
Developing more realistic models of thetruck fleet maintenance costs using inter-action terms and stepwise regression anal-ysis (Data file)
Unit 4. Analyzing Data with Nonlinear Models. Students learn to build models by lin-earizing non-proportional data and learn how to interpret these in realistic situations.
Chapter Content Memo Regarding
11. GraphicalApproaches toNonlinear Data
Examining a variety of non-linear graphical models withone independent variable (log-arithmic, exponential, square,square root and reciprocal)and their transformations
Analyzing various data sets from a cus-tomer who wants better models for eachset than those created by Excel’s trend-lines; this is accomplished by shifting andscaling the basic models and computingthe goodness of fit for each (Data file)
12. Modelingwith NonlinearData
Building and interpretingnonlinear regression models,including general power mod-els and multiplicative modelsin several variables
Creating and comparing multivariablemodels (one linear and one multiplicative)to help analyze operating costs at an in-surance company (Data file)
13. NonlinearMultivariableModels
Extending the variety of non-linear multivariable modelsto include quadratic mod-els developed from interactionterms
Developing more accurate models of thecommuter rail system data by usingquadratic interaction terms (Data file)

xi
Unit 5. Analyzing Data Using Calculus Models. Now that students understand how tobuild models from data, they learn how to use concepts from calculus to understand theproblem from which the data and the model were derived.
Chapter Content Memo Regarding
14. Optimizationand Analysis ofModels
Using calculus (derivatives) tointerpret and optimize poly-nomial and power models
Developing and optimizing a mathemati-cal model to challenge an interpretation ofa data set (Create your own data file)
15. Deeper Ex-ploration of Logsand Exponentials
Applying calculus to the anal-ysis and optimization of loga-rithmic and exponential mod-els
Applying calculus skills to exponentialfunctions in order to help a wine collec-tor plan her wine storage for the future(Create your own data file)
16. Optimizationin Several Vari-ables
Defining constraints and per-forming constrained optimiza-tion using Excel’s SOLVERroutine
Determining optimal mix of advertisingbudget under uncertain conditions, usingSolver (Data file)
17. Area Underthe Curve
Evaluating definite integralsusing both the FundamentalTheorem of Calculus and nu-merical methods to find thearea under a curve.
Finding the area between curves to resolvea pricing dispute for a doll at Cool Toys forTots (consumers’ and producers’ surplus).(Data file)

Contents
I Quantifying the World 1
1 Problem Solving By Asking Questions 7
1.1 Why Data? . . . . . . . . . . . . . . . . . . . . . . . . . . . . . . . . . . . . 8
1.1.1 Definitions and Formulas . . . . . . . . . . . . . . . . . . . . . . . . . 10
1.1.2 Worked Examples . . . . . . . . . . . . . . . . . . . . . . . . . . . . . 10
1.1.3 Exploration 1A: Assumptions get in the way . . . . . . . . . . . . . . 13
1.1.4 How To Guide . . . . . . . . . . . . . . . . . . . . . . . . . . . . . . . 14
1.2 Defining the Problem . . . . . . . . . . . . . . . . . . . . . . . . . . . . . . . 18
1.2.1 Definitions and Formulas . . . . . . . . . . . . . . . . . . . . . . . . . 20
1.2.2 Worked Examples . . . . . . . . . . . . . . . . . . . . . . . . . . . . . 21
1.2.3 Exploration 1B: Beef N’ Buns Service . . . . . . . . . . . . . . . . . . 24
1.2.4 How To Guide . . . . . . . . . . . . . . . . . . . . . . . . . . . . . . . 26
1.3 Homework . . . . . . . . . . . . . . . . . . . . . . . . . . . . . . . . . . . . . 28
1.3.1 Mechanics and Techniques Problems . . . . . . . . . . . . . . . . . . 28
1.3.2 Application and Reasoning Problems . . . . . . . . . . . . . . . . . . 28
1.3.3 Memo Problem . . . . . . . . . . . . . . . . . . . . . . . . . . . . . . 31
2 The Role of Data 33
2.1 Extracting Data from the Problem Situation . . . . . . . . . . . . . . . . . . 34
2.1.1 Definitions and Formulas . . . . . . . . . . . . . . . . . . . . . . . . . 37
2.1.2 Worked Examples . . . . . . . . . . . . . . . . . . . . . . . . . . . . . 38
2.1.3 Exploration 2A: Extracting Data at Beef n’ Buns . . . . . . . . . . . 43
2.1.4 How To Guide . . . . . . . . . . . . . . . . . . . . . . . . . . . . . . . 44
2.2 Organizing data in spreadsheets . . . . . . . . . . . . . . . . . . . . . . . . . 47
2.2.1 Definitions and Formulas . . . . . . . . . . . . . . . . . . . . . . . . . 48
2.2.2 Worked Examples . . . . . . . . . . . . . . . . . . . . . . . . . . . . . 49
2.2.3 Exploration 2B: Entering Beef n’ Buns Data into Excel . . . . . . . . 53
2.2.4 How To Guide . . . . . . . . . . . . . . . . . . . . . . . . . . . . . . . 54
2.3 Homework . . . . . . . . . . . . . . . . . . . . . . . . . . . . . . . . . . . . . 57
2.3.1 Mechanics and Techniques Problems . . . . . . . . . . . . . . . . . . 57
2.3.2 Application and Reasoning Problems . . . . . . . . . . . . . . . . . . 58
2.3.3 Memo Problem . . . . . . . . . . . . . . . . . . . . . . . . . . . . . . 59
xiii
xiv CONTENTS
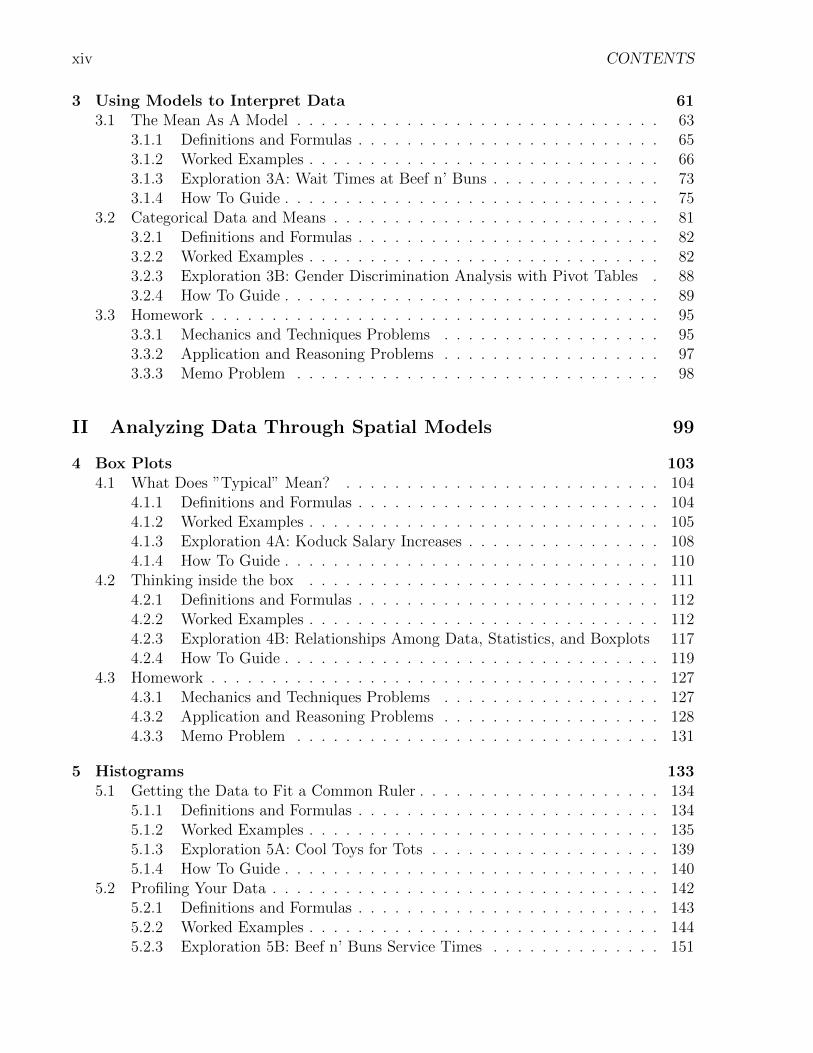
3 Using Models to Interpret Data 613.1 The Mean As A Model . . . . . . . . . . . . . . . . . . . . . . . . . . . . . . 63
3.1.1 Definitions and Formulas . . . . . . . . . . . . . . . . . . . . . . . . . 653.1.2 Worked Examples . . . . . . . . . . . . . . . . . . . . . . . . . . . . . 663.1.3 Exploration 3A: Wait Times at Beef n’ Buns . . . . . . . . . . . . . . 733.1.4 How To Guide . . . . . . . . . . . . . . . . . . . . . . . . . . . . . . . 75
3.2 Categorical Data and Means . . . . . . . . . . . . . . . . . . . . . . . . . . . 813.2.1 Definitions and Formulas . . . . . . . . . . . . . . . . . . . . . . . . . 823.2.2 Worked Examples . . . . . . . . . . . . . . . . . . . . . . . . . . . . . 823.2.3 Exploration 3B: Gender Discrimination Analysis with Pivot Tables . 883.2.4 How To Guide . . . . . . . . . . . . . . . . . . . . . . . . . . . . . . . 89
3.3 Homework . . . . . . . . . . . . . . . . . . . . . . . . . . . . . . . . . . . . . 953.3.1 Mechanics and Techniques Problems . . . . . . . . . . . . . . . . . . 953.3.2 Application and Reasoning Problems . . . . . . . . . . . . . . . . . . 973.3.3 Memo Problem . . . . . . . . . . . . . . . . . . . . . . . . . . . . . . 98
II Analyzing Data Through Spatial Models 99
4 Box Plots 1034.1 What Does ”Typical” Mean? . . . . . . . . . . . . . . . . . . . . . . . . . . 104
4.1.1 Definitions and Formulas . . . . . . . . . . . . . . . . . . . . . . . . . 1044.1.2 Worked Examples . . . . . . . . . . . . . . . . . . . . . . . . . . . . . 1054.1.3 Exploration 4A: Koduck Salary Increases . . . . . . . . . . . . . . . . 1084.1.4 How To Guide . . . . . . . . . . . . . . . . . . . . . . . . . . . . . . . 110
4.2 Thinking inside the box . . . . . . . . . . . . . . . . . . . . . . . . . . . . . 1114.2.1 Definitions and Formulas . . . . . . . . . . . . . . . . . . . . . . . . . 1124.2.2 Worked Examples . . . . . . . . . . . . . . . . . . . . . . . . . . . . . 1124.2.3 Exploration 4B: Relationships Among Data, Statistics, and Boxplots 1174.2.4 How To Guide . . . . . . . . . . . . . . . . . . . . . . . . . . . . . . . 119
4.3 Homework . . . . . . . . . . . . . . . . . . . . . . . . . . . . . . . . . . . . . 1274.3.1 Mechanics and Techniques Problems . . . . . . . . . . . . . . . . . . 1274.3.2 Application and Reasoning Problems . . . . . . . . . . . . . . . . . . 1284.3.3 Memo Problem . . . . . . . . . . . . . . . . . . . . . . . . . . . . . . 131
5 Histograms 1335.1 Getting the Data to Fit a Common Ruler . . . . . . . . . . . . . . . . . . . . 134
5.1.1 Definitions and Formulas . . . . . . . . . . . . . . . . . . . . . . . . . 1345.1.2 Worked Examples . . . . . . . . . . . . . . . . . . . . . . . . . . . . . 1355.1.3 Exploration 5A: Cool Toys for Tots . . . . . . . . . . . . . . . . . . . 1395.1.4 How To Guide . . . . . . . . . . . . . . . . . . . . . . . . . . . . . . . 140
5.2 Profiling Your Data . . . . . . . . . . . . . . . . . . . . . . . . . . . . . . . . 1425.2.1 Definitions and Formulas . . . . . . . . . . . . . . . . . . . . . . . . . 1435.2.2 Worked Examples . . . . . . . . . . . . . . . . . . . . . . . . . . . . . 1445.2.3 Exploration 5B: Beef n’ Buns Service Times . . . . . . . . . . . . . . 151

CONTENTS xv
5.2.4 How To Guide . . . . . . . . . . . . . . . . . . . . . . . . . . . . . . . 1525.3 Homework . . . . . . . . . . . . . . . . . . . . . . . . . . . . . . . . . . . . . 156
5.3.1 Mechanics and Techniques Problems . . . . . . . . . . . . . . . . . . 1565.3.2 Application and Reasoning Problems . . . . . . . . . . . . . . . . . . 1585.3.3 Memo Problem . . . . . . . . . . . . . . . . . . . . . . . . . . . . . . 162
6 Interpreting Spatial Models 1636.1 Estimating Stats from Frequency Data . . . . . . . . . . . . . . . . . . . . . 164
6.1.1 Definitions and Formulas . . . . . . . . . . . . . . . . . . . . . . . . . 1656.1.2 Worked Examples . . . . . . . . . . . . . . . . . . . . . . . . . . . . . 1666.1.3 Exploration 6A: Data Summaries and Sensitivity . . . . . . . . . . . 1726.1.4 How To Guide . . . . . . . . . . . . . . . . . . . . . . . . . . . . . . . 174
6.2 Two Perspectives are Better than One . . . . . . . . . . . . . . . . . . . . . 1766.2.1 Definitions and Formulas . . . . . . . . . . . . . . . . . . . . . . . . . 1776.2.2 Worked Examples . . . . . . . . . . . . . . . . . . . . . . . . . . . . . 1786.2.3 Exploration 6B: Stock Investment Decisions . . . . . . . . . . . . . . 1826.2.4 How To Guide . . . . . . . . . . . . . . . . . . . . . . . . . . . . . . . 183
6.3 Homework . . . . . . . . . . . . . . . . . . . . . . . . . . . . . . . . . . . . . 1876.3.1 Mechanics and Techniques Problems . . . . . . . . . . . . . . . . . . 1876.3.2 Application and Reasoning Problems . . . . . . . . . . . . . . . . . . 1906.3.3 Memo Problem . . . . . . . . . . . . . . . . . . . . . . . . . . . . . . 192
III Analyzing Data Through Linear Models 193
7 Coorelation 1997.1 Picturing Two Variable Relationships . . . . . . . . . . . . . . . . . . . . . . 200
7.1.1 Definitions and Formulas . . . . . . . . . . . . . . . . . . . . . . . . . 2007.1.2 Worked Examples . . . . . . . . . . . . . . . . . . . . . . . . . . . . . 2047.1.3 Exploration 7A: Predicting the Price of a Home . . . . . . . . . . . . 2107.1.4 How To Guide . . . . . . . . . . . . . . . . . . . . . . . . . . . . . . . 212
7.2 Fitting a Line to Data . . . . . . . . . . . . . . . . . . . . . . . . . . . . . . 2167.2.1 Definitions and Formulas . . . . . . . . . . . . . . . . . . . . . . . . . 2177.2.2 Worked Examples . . . . . . . . . . . . . . . . . . . . . . . . . . . . . 2187.2.3 Exploration 7B: Adding Trendlines . . . . . . . . . . . . . . . . . . . 2217.2.4 How To Guide . . . . . . . . . . . . . . . . . . . . . . . . . . . . . . . 222
7.3 Homework . . . . . . . . . . . . . . . . . . . . . . . . . . . . . . . . . . . . . 2277.3.1 Mechanics and Techniques Problems . . . . . . . . . . . . . . . . . . 2277.3.2 Application and Reasoning Problems . . . . . . . . . . . . . . . . . . 2287.3.3 Memo Problem . . . . . . . . . . . . . . . . . . . . . . . . . . . . . . 229
8 Simple Regression 2318.1 Modeling with Proportional Reasoning in Two Dimensions . . . . . . . . . . 233
8.1.1 Definitions and Formulas . . . . . . . . . . . . . . . . . . . . . . . . . 2348.1.2 Worked Examples . . . . . . . . . . . . . . . . . . . . . . . . . . . . 234

xvi CONTENTS
8.1.3 Exploration 8A: Regression Modeling Practice . . . . . . . . . . . . . 238
8.1.4 How To Guide . . . . . . . . . . . . . . . . . . . . . . . . . . . . . . . 239
8.2 Using and Comparing the Usefulness of a Proportional Model . . . . . . . . 241
8.2.1 Definitions and Formulas . . . . . . . . . . . . . . . . . . . . . . . . . 241
8.2.2 Worked Examples . . . . . . . . . . . . . . . . . . . . . . . . . . . . . 245
8.2.3 Exploration 8B: How Outliers Influence Regression . . . . . . . . . . 249
8.2.4 How To Guide . . . . . . . . . . . . . . . . . . . . . . . . . . . . . . . 251
8.3 Homework . . . . . . . . . . . . . . . . . . . . . . . . . . . . . . . . . . . . . 253
8.3.1 Mechanics and Techniques Problems . . . . . . . . . . . . . . . . . . 253
8.3.2 Application and Reasoning Problems . . . . . . . . . . . . . . . . . . 255
8.3.3 Memo Problem . . . . . . . . . . . . . . . . . . . . . . . . . . . . . . 256
9 Multiple Regression Models 257
9.1 Modeling with Proportional Reasoning in Many Dimensions . . . . . . . . . 259
9.1.1 Definitions and Formulas . . . . . . . . . . . . . . . . . . . . . . . . . 260
9.1.2 Worked Examples . . . . . . . . . . . . . . . . . . . . . . . . . . . . . 263
9.1.3 Exploration 9A: Production Line Data . . . . . . . . . . . . . . . . . 269
9.1.4 How To Guide . . . . . . . . . . . . . . . . . . . . . . . . . . . . . . . 270
9.2 Modeling with Qualitative Variables . . . . . . . . . . . . . . . . . . . . . . . 273
9.2.1 Definitions and Formulas . . . . . . . . . . . . . . . . . . . . . . . . . 274
9.2.2 Worked Examples . . . . . . . . . . . . . . . . . . . . . . . . . . . . . 274
9.2.3 Exploration 9B: Maintenance Cost for Trucks . . . . . . . . . . . . . 277
9.2.4 How To Guide . . . . . . . . . . . . . . . . . . . . . . . . . . . . . . . 278
9.3 Homework . . . . . . . . . . . . . . . . . . . . . . . . . . . . . . . . . . . . . 280
9.3.1 Mechanics and Techniques Problems . . . . . . . . . . . . . . . . . . 280
9.3.2 Application and Reasoning Problems . . . . . . . . . . . . . . . . . . 281
9.3.3 Memo Problem . . . . . . . . . . . . . . . . . . . . . . . . . . . . . . 283
10 Is the Model Any Good 285
10.1 Which coefficients are trustworthy? . . . . . . . . . . . . . . . . . . . . . . . 287
10.1.1 Definitions and Formulas . . . . . . . . . . . . . . . . . . . . . . . . . 288
10.1.2 Worked Examples . . . . . . . . . . . . . . . . . . . . . . . . . . . . . 288
10.1.3 Exploration 10A: Building a Trustworthy Model at EnPact . . . . . . 292
10.1.4 How To Guide . . . . . . . . . . . . . . . . . . . . . . . . . . . . . . . 293
10.2 More Complexity with Interaction Terms . . . . . . . . . . . . . . . . . . . . 295
10.2.1 Definitions and Formulas . . . . . . . . . . . . . . . . . . . . . . . . . 295
10.2.2 Worked Examples . . . . . . . . . . . . . . . . . . . . . . . . . . . . . 296
10.2.3 Exploration 10B: Complex Gender Interactions at EnPact . . . . . . 300
10.2.4 How To Guide . . . . . . . . . . . . . . . . . . . . . . . . . . . . . . . 301
10.3 Homework . . . . . . . . . . . . . . . . . . . . . . . . . . . . . . . . . . . . . 302
10.3.1 Mechanics and Techniques Problems . . . . . . . . . . . . . . . . . . 302
10.3.2 Application and Reasoning Problems . . . . . . . . . . . . . . . . . . 302
10.3.3 Memo Problem . . . . . . . . . . . . . . . . . . . . . . . . . . . . . . 304

CONTENTS xvii
IV Analyzing Data with Nonlinear Models 307
11 Nonlinear Models Through Graphs 31111.1 What if the Data is Not Proportional . . . . . . . . . . . . . . . . . . . . . . 312
11.1.1 Definitions and Formulas . . . . . . . . . . . . . . . . . . . . . . . . . 31211.1.2 Worked Examples . . . . . . . . . . . . . . . . . . . . . . . . . . . . . 31811.1.3 Exploration 11A: Non-proportional data . . . . . . . . . . . . . . . . 32211.1.4 How To Guide . . . . . . . . . . . . . . . . . . . . . . . . . . . . . . . 324
11.2 Transformations of Graphs . . . . . . . . . . . . . . . . . . . . . . . . . . . . 32511.2.1 Definitions and Formulas . . . . . . . . . . . . . . . . . . . . . . . . . 32611.2.2 Worked Examples . . . . . . . . . . . . . . . . . . . . . . . . . . . . . 32811.2.3 Exploration 11B: Shifting and Scaling the Basic Models . . . . . . . . 33311.2.4 How To Guide . . . . . . . . . . . . . . . . . . . . . . . . . . . . . . . 336
11.3 Homework . . . . . . . . . . . . . . . . . . . . . . . . . . . . . . . . . . . . . 34011.3.1 Mechanics and Techniques Problems . . . . . . . . . . . . . . . . . . 34011.3.2 Application and Reasoning Problems . . . . . . . . . . . . . . . . . . 34311.3.3 Memo Problem . . . . . . . . . . . . . . . . . . . . . . . . . . . . . . 344
12 Modeling with Nonlinear Data 34712.1 Non-proportional Regression Models . . . . . . . . . . . . . . . . . . . . . . 348
12.1.1 Definitions and Formulas . . . . . . . . . . . . . . . . . . . . . . . . . 34912.1.2 Worked Examples . . . . . . . . . . . . . . . . . . . . . . . . . . . . . 35012.1.3 Exploration 12A: Learning and Production at Presario . . . . . . . . 35612.1.4 How To Guide . . . . . . . . . . . . . . . . . . . . . . . . . . . . . . . 357
12.2 Interpreting a Non-proportional Model . . . . . . . . . . . . . . . . . . . . . 36312.2.1 Definitions and Formulas . . . . . . . . . . . . . . . . . . . . . . . . . 36412.2.2 Worked Examples . . . . . . . . . . . . . . . . . . . . . . . . . . . . . 36612.2.3 Exploration 12B: What it means to be linear . . . . . . . . . . . . . . 37012.2.4 How To Guide . . . . . . . . . . . . . . . . . . . . . . . . . . . . . . . 371
12.3 Homework . . . . . . . . . . . . . . . . . . . . . . . . . . . . . . . . . . . . . 37312.3.1 Mechanics and Techniques Problems . . . . . . . . . . . . . . . . . . 37312.3.2 Application and Reasoning Problems . . . . . . . . . . . . . . . . . . 37512.3.3 Memo Problem . . . . . . . . . . . . . . . . . . . . . . . . . . . . . . 376
13 Multivariate Nonlinear Models 37913.1 Models with Numerical Interaction Terms . . . . . . . . . . . . . . . . . . . 380
13.1.1 Definitions and Formulas . . . . . . . . . . . . . . . . . . . . . . . . . 38113.1.2 Worked Examples . . . . . . . . . . . . . . . . . . . . . . . . . . . . . 38113.1.3 Exploration 13A: Revenue and Demand Functions . . . . . . . . . . . 38713.1.4 How To Guide . . . . . . . . . . . . . . . . . . . . . . . . . . . . . . . 389
13.2 Interpreting Quadratic Models in Several Variables . . . . . . . . . . . . . . 39113.2.1 Definitions and Formulas . . . . . . . . . . . . . . . . . . . . . . . . . 39213.2.2 Worked Examples . . . . . . . . . . . . . . . . . . . . . . . . . . . . . 39413.2.3 Exploration 13B: Exploring Quadratic Models . . . . . . . . . . . . . 40013.2.4 How To Guide . . . . . . . . . . . . . . . . . . . . . . . . . . . . . . . 402

xviii CONTENTS
13.3 Homework . . . . . . . . . . . . . . . . . . . . . . . . . . . . . . . . . . . . . 40513.3.1 Mechanics and Techniques Problems . . . . . . . . . . . . . . . . . . 40513.3.2 Application and Reasoning Problems . . . . . . . . . . . . . . . . . . 40713.3.3 Memo Problem . . . . . . . . . . . . . . . . . . . . . . . . . . . . . . 410
V Analyzing Data Using Calculus Models 411
14 Optimization 41514.1 Calculus with Powers and Polynomials . . . . . . . . . . . . . . . . . . . . . 416
14.1.1 Definitions and Formulas . . . . . . . . . . . . . . . . . . . . . . . . . 41814.1.2 Worked Examples . . . . . . . . . . . . . . . . . . . . . . . . . . . . . 42114.1.3 Exploration 14A: Finding the Derivative of a General Power Function 42514.1.4 How To Guide . . . . . . . . . . . . . . . . . . . . . . . . . . . . . . . 427
14.2 Extreme Calculus! . . . . . . . . . . . . . . . . . . . . . . . . . . . . . . . . 42914.2.1 Definitions and Formulas . . . . . . . . . . . . . . . . . . . . . . . . . 42914.2.2 Worked Examples . . . . . . . . . . . . . . . . . . . . . . . . . . . . . 43014.2.3 Exploration 14B: Simple Regression Formulas . . . . . . . . . . . . . 43514.2.4 How To Guide . . . . . . . . . . . . . . . . . . . . . . . . . . . . . . . 437
14.3 Homework . . . . . . . . . . . . . . . . . . . . . . . . . . . . . . . . . . . . . 43814.3.1 Mechanics and Techniques Problems . . . . . . . . . . . . . . . . . . 43814.3.2 Application and Reasoning Problems . . . . . . . . . . . . . . . . . . 43814.3.3 Memo Problem . . . . . . . . . . . . . . . . . . . . . . . . . . . . . . 441
15 Logarithmic and Exponential Models 44315.1 Logarithms and their derivatives . . . . . . . . . . . . . . . . . . . . . . . . . 444
15.1.1 Definitions and Formulas . . . . . . . . . . . . . . . . . . . . . . . . . 44515.1.2 Worked Examples . . . . . . . . . . . . . . . . . . . . . . . . . . . . . 44615.1.3 Exploration 15A: Logs and distributions of data . . . . . . . . . . . . 45015.1.4 How To Guide . . . . . . . . . . . . . . . . . . . . . . . . . . . . . . . 451
15.2 Compound interest and derivatives of exponentials . . . . . . . . . . . . . . . 45415.2.1 Definitions and Formulas . . . . . . . . . . . . . . . . . . . . . . . . . 45415.2.2 Worked Examples . . . . . . . . . . . . . . . . . . . . . . . . . . . . . 45515.2.3 Exploration 15B: Loan Amortization . . . . . . . . . . . . . . . . . . 45915.2.4 How To Guide . . . . . . . . . . . . . . . . . . . . . . . . . . . . . . . 461
15.3 Homework . . . . . . . . . . . . . . . . . . . . . . . . . . . . . . . . . . . . . 46215.3.1 Mechanics and Techniques Problems . . . . . . . . . . . . . . . . . . 46215.3.2 Application and Reasoning Problems . . . . . . . . . . . . . . . . . . 46315.3.3 Memo Problem . . . . . . . . . . . . . . . . . . . . . . . . . . . . . . 464
16 Optimization in Several Variables 46516.1 Constraints on Optimization . . . . . . . . . . . . . . . . . . . . . . . . . . . 466
16.1.1 Definitions and Formulas . . . . . . . . . . . . . . . . . . . . . . . . . 46616.1.2 Worked Examples . . . . . . . . . . . . . . . . . . . . . . . . . . . . . 46716.1.3 Exploration 16A: Setting up Optimization Problems . . . . . . . . . . 473

CONTENTS xix
16.1.4 How To Guide . . . . . . . . . . . . . . . . . . . . . . . . . . . . . . . 47516.2 Using Solver Table . . . . . . . . . . . . . . . . . . . . . . . . . . . . . . . . 477
16.2.1 Definitions and Formulas . . . . . . . . . . . . . . . . . . . . . . . . . 47716.2.2 Worked Examples . . . . . . . . . . . . . . . . . . . . . . . . . . . . . 47816.2.3 Exploration 16B: Sensitivity Analysis . . . . . . . . . . . . . . . . . . 48516.2.4 How To Guide . . . . . . . . . . . . . . . . . . . . . . . . . . . . . . . 487
16.3 Homework . . . . . . . . . . . . . . . . . . . . . . . . . . . . . . . . . . . . . 49216.3.1 Mechanics and Techniques Problems . . . . . . . . . . . . . . . . . . 49216.3.2 Application and Reasoning Problems . . . . . . . . . . . . . . . . . . 49316.3.3 Memo Problem . . . . . . . . . . . . . . . . . . . . . . . . . . . . . . 496
17 Area Under a Curve 49717.1 Calculating the Area under a Curve . . . . . . . . . . . . . . . . . . . . . . . 499
17.1.1 Definitions and Formulas . . . . . . . . . . . . . . . . . . . . . . . . . 50117.1.2 Worked Examples . . . . . . . . . . . . . . . . . . . . . . . . . . . . . 50217.1.3 Exploration 17A: Numerical Integration . . . . . . . . . . . . . . . . 50517.1.4 How To Guide . . . . . . . . . . . . . . . . . . . . . . . . . . . . . . . 506
17.2 Applications of the Definite Integral . . . . . . . . . . . . . . . . . . . . . . . 50817.2.1 Definitions and Formulas . . . . . . . . . . . . . . . . . . . . . . . . . 50817.2.2 Worked Examples . . . . . . . . . . . . . . . . . . . . . . . . . . . . . 50917.2.3 Exploration 17B: Consumers’ and Producers’ Surplus at Market Equi-
librium . . . . . . . . . . . . . . . . . . . . . . . . . . . . . . . . . . . 51517.2.4 How To Guide . . . . . . . . . . . . . . . . . . . . . . . . . . . . . . . 516
17.3 Homework . . . . . . . . . . . . . . . . . . . . . . . . . . . . . . . . . . . . . 52117.3.1 Mechanics and Techniques Problems . . . . . . . . . . . . . . . . . . 52117.3.2 Application and Reasoning Problems . . . . . . . . . . . . . . . . . . 52217.3.3 Memo Problem . . . . . . . . . . . . . . . . . . . . . . . . . . . . . . 524
A Excel Cursor Shapes 525
B Excel Errors 527
C Other Features of Excel 529
D Sample Rubric for Evaluating Memo 7 531

xx CONTENTS

Part I
Quantifying the World
1


3
Thinking of the world as data
In today’s world, everyone is collecting data. It’s everywhere. Some even say we are in-nundated with data, so much so that we cannot keep up with the amount of data we cangenerate and collect. With this in mind, consider the following definition of data:
Data: Information extracted from real-world contexts that has been organized for analysisin forms that can be used for making decisions.
Given this definition, who among the following are more likely to think of the world as datain their professional work?
• Mathematicians?
• Scientists?
• Reporters?
• Detectives?
• Business managers?
We can be fairly safe in saying that mathematicians do not see the world as data in theirday-to-day work. Only a relatively few mathematicians deal with the real world at all intheir professional work. While they may construct mathematical models that others (suchas scientists or business managers) may find very useful in making sense of real-world data,mathematicians themselves are often quite unconcerned about the real-world usefulness oftheir work.
Scientists, on the other hand, use data extensively in their everyday work, but theyuse it under carefully controlled circumstances. They are interested in data in terms of itsexperimental reproducibility. They tend to think of the world in terms of patterns of datathat occur and reoccur under certain specified conditions. They tend to think of real-worlddata in terms of how it conforms to predictable scientific laws.
Reporters think of the world as stories. Not rambling stories, but stories told in a certainway so as to communicate a lot of information in a short space. They efficiently extractinformation from the cacophony of life’s events by using the five W’s (though not necessarilyin this order:
• Who,
• What,
• Where,
• When, and
• Why).

4
Depending on the nature of the story, experienced reporters usually try to work the answersto the 5-W’s into the first paragraph or so of the story. This enables them to accuratelyconvey the context and gist of the story as soon as possible, so that anything else furtherdown the column is merely an elaboration of what is already known. The point is thatwithout the 5-W’s approach news reporting becomes less focused, more meandering, andresults in less accurate information transmitted for the amount of print expended. But doreporters see the world as data in the sense we have defined it above? They certainly seethe world as story based on information, but as data?–probably not. Even if a reporter werewriting a financial story, for example, and even if that story contained numerical informationthat was organized in a form that could be analyzed in some way (for example, graphs orcharts), that data would not be specific enough or numerous enough to be of much use to abank or stock brokerage firm for decision making. Indeed, such businesses would probablyhave their own data analysis staff anyway or would contract out such services. Nevertheless,the 5-W tool for extracting and organizing information from the world is a useful one fromwhich managers can profit. You will get the opportunity to try it out for yourself in thisfirst unit.
Do detectives see the world as data? ”Nothing but the facts, ma’am,” says Joe Friday,the laconic police investigator of that ancient TV show Dragnet. Clearly, detectives think ofthe world as data. Not management-type data, but certainly as information that is organizedfor analysis in forms that can be used for making that one bottom-line decision - whodunnit?Of course, there are a host of decisions that precede this big one. The detective makes thesedecisions by drawing inferences from evidence, which is another way of saying ”by analyzingthe data.” So while the data that detectives work with is quite different from the data thatmanagers compile, there is a similarity in what the two do with the data, the way theymarshal compelling evidence and draw inferences from that evidence as they argue theircase. Everyone knows that detectives cannot make judgments or decisions that will hold upin court without the proper supporting evidence. So it is with business managers. Theylikewise must present their arguments based on proper supporting evidence. We will beconcerned with what constitutes proper evidence and how to present it in almost all of thehomework problems.
Because business managers have to constantly make decisions in less-than-certain cir-cumstances, it is to their advantage to think of the world as data, almost to the extent thatit becomes second nature to them, a way of seeing. While it is true that certain aspects ofbusiness occur with regularity, such as manufacturing processes or financial dealings, it isalso true that many important aspects of business, such as sales trends or employee equityissues, are not reducible to known scientific laws. Then too, all aspects of business eventuallycome down to that one irreducible basic fact, the bottom line. For example, here is a list ofbottom-line questions that a manager has to answer on a day-to-day basis that should makeclear the case for thinking of the world as data:
• How are we performing?
• Do we have a problem? If so, what is it?
• What can we expect will happen in the future if we continue doing what we’re doingnow?
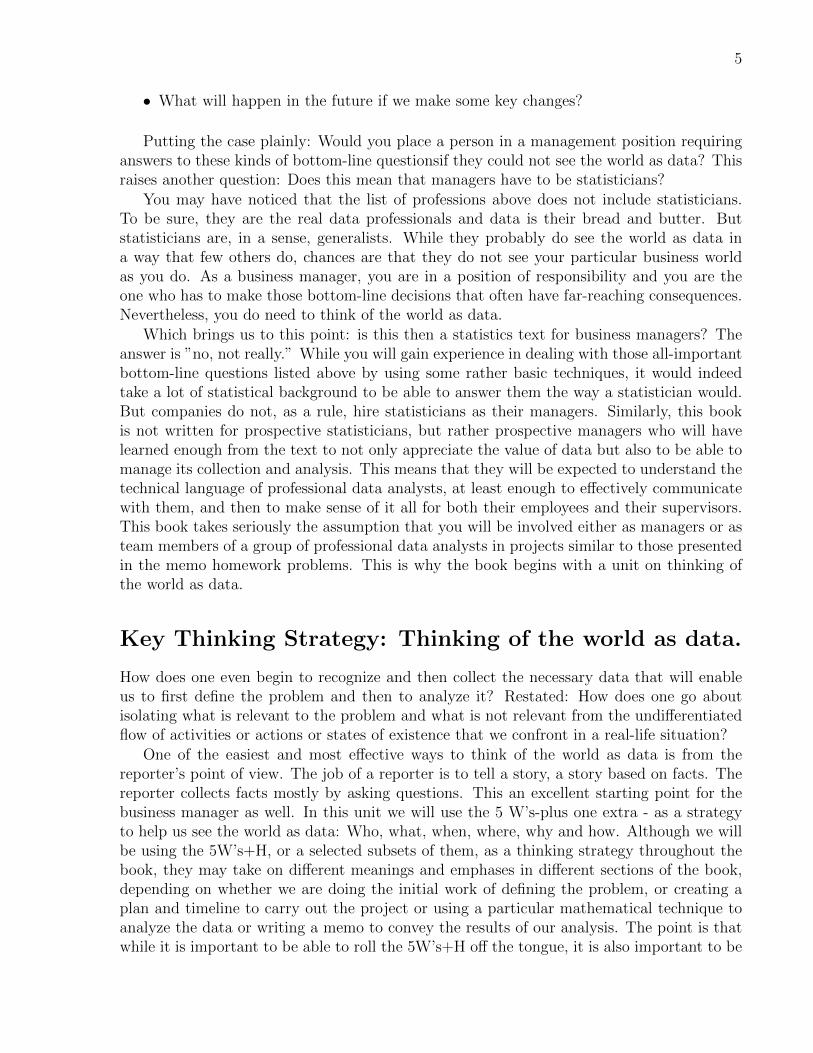
5
• What will happen in the future if we make some key changes?
Putting the case plainly: Would you place a person in a management position requiringanswers to these kinds of bottom-line questionsif they could not see the world as data? Thisraises another question: Does this mean that managers have to be statisticians?
You may have noticed that the list of professions above does not include statisticians.To be sure, they are the real data professionals and data is their bread and butter. Butstatisticians are, in a sense, generalists. While they probably do see the world as data ina way that few others do, chances are that they do not see your particular business worldas you do. As a business manager, you are in a position of responsibility and you are theone who has to make those bottom-line decisions that often have far-reaching consequences.Nevertheless, you do need to think of the world as data.
Which brings us to this point: is this then a statistics text for business managers? Theanswer is ”no, not really.” While you will gain experience in dealing with those all-importantbottom-line questions listed above by using some rather basic techniques, it would indeedtake a lot of statistical background to be able to answer them the way a statistician would.But companies do not, as a rule, hire statisticians as their managers. Similarly, this bookis not written for prospective statisticians, but rather prospective managers who will havelearned enough from the text to not only appreciate the value of data but also to be able tomanage its collection and analysis. This means that they will be expected to understand thetechnical language of professional data analysts, at least enough to effectively communicatewith them, and then to make sense of it all for both their employees and their supervisors.This book takes seriously the assumption that you will be involved either as managers or asteam members of a group of professional data analysts in projects similar to those presentedin the memo homework problems. This is why the book begins with a unit on thinking ofthe world as data.
Key Thinking Strategy: Thinking of the world as data.
How does one even begin to recognize and then collect the necessary data that will enableus to first define the problem and then to analyze it? Restated: How does one go aboutisolating what is relevant to the problem and what is not relevant from the undifferentiatedflow of activities or actions or states of existence that we confront in a real-life situation?
One of the easiest and most effective ways to think of the world as data is from thereporter’s point of view. The job of a reporter is to tell a story, a story based on facts. Thereporter collects facts mostly by asking questions. This an excellent starting point for thebusiness manager as well. In this unit we will use the 5 W’s-plus one extra - as a strategyto help us see the world as data: Who, what, when, where, why and how. Although we willbe using the 5W’s+H, or a selected subsets of them, as a thinking strategy throughout thebook, they may take on different meanings and emphases in different sections of the book,depending on whether we are doing the initial work of defining the problem, or creating aplan and timeline to carry out the project or using a particular mathematical technique toanalyze the data or writing a memo to convey the results of our analysis. The point is thatwhile it is important to be able to roll the 5W’s+H off the tongue, it is also important to be

6
aware that not only will we not always talk about all of them all the time but that even whenwe do we may not be thinking of them in quite the same way from situation to situation.Then too, the W’s are not necessarily mutually exclusive, meaning that, for example, theremay be situations in which it does not make sense to ask What? without asking Where? inthe same breath or How? without asking When?

Chapter 1
Problem Solving By AskingQuestions1
Sometimes the data that is needed to solve a problem has already been gathered and issitting in a data bank just waiting to be analyzed. Sometimes it is not. If this is the case,one of the first steps in solving the problem is to gather the necessary data. But exactlywhat data does one need? Clearly, that depends on the problem and that, in turn, assumeswe know what the problem really is. This chapter is about letting go of our preconceivednotions of what the problem is and then developing ways of getting at the data that will notonly define the problem situation but also point to a solution.
• As a result of this chapter, students will learn√
The importance of not making assumptions about a problem√To understand a problem within its context√The importance of data√What is involved in gathering data
• As a result of this chapter, students will be able to√
Better understand how to read complex interrelated texts√Develop a plan for gathering data√Develop a rough timeline for a project√Write a memo in response to a problem
1 c©2011 Kris H. Green and W. Allen Emerson
7

8 CHAPTER 1. PROBLEM SOLVING BY ASKING QUESTIONS
1.1 Why Data?
One of the first things that an aspiring manager or consultant has to learn about solving aproblem is that he or she is not being paid to provide unsubstantiated beliefs about whatmight or might not be a good solution. Rather, the successful manager or consultant ispaid to propose solutions based upon pertinent data and a well-reasoned analysis of thatdata. The manager’s feelings or guesswork or intuitions can be helpful in exploring a problemsituation but they cannot by themselves be the basis for making sound and reliable decisions.Again, it is having a clear idea of how to define the problem and having a plan for collectingthe relevant data that constitute the professional approach.
The first step to solving a problem is to define the problem. This is not as obvious oras simple as it sounds; there are numerous case studies showing how businesses have wastedlarge quantities of money trying to solve the wrong problem. Listed below are the othersteps in the general problem solving process. Keep in mind that the process is usually notsequential. You will usually find yourself jumping steps and repeating steps in an attemptto refine your solution.
1. Problem formulation stage
(a) Define the problem
(b) Identify possible causes and their effects
(c) Determine data to be collected
2. Data collection stage
(a) Determine what the variables are and how they will be coded
(b) Construct data collection forms
(c) Construct the database for analysis
3. Solution development stage
(a) Interrogate the data
(b) Determine a root cause for the problem
(c) Develop possible solutions
(d) Use the data to select the best solution
4. Refinement stage
(a) Test the solution with sample data
(b) Modify the solution based on the tests
5. Implementation stage
(a) Present your findings and your plan
(b) Put your solution into practice

1.1. WHY DATA? 9
(c) Collect data as to the effectiveness of the solution
(d) Modify the solution as needed, based on data
One of the reasons that it is vitally important to define the problem you are studying isbecause real-world problems are often multifaceted. Their causes may be well hidden, andwhat you observe - the perceived problem - may mask the real problem’s causes. Part ofyour job in studying a problem is to think of possible causes for the perceived problem, thendetermine ways to investigate the situation by collecting data that can sort through thesecauses. Making this even more difficult is the fact that a single cause can have multipleeffects, each of which may generate more effects of its own, some of which may overlap.Identifying this chain of cause and effect is really what understanding the problem is allabout.

10 CHAPTER 1. PROBLEM SOLVING BY ASKING QUESTIONS
1.1.1 Definitions and Formulas
Data Information extracted from real-world contexts that has been organized for analysisin forms that can be used to inform decision-making.
Consultant/Business Manager A person who is paid to propose solutions that are basedupon the collection and analysis of pertinent data.
Perceived problem What the supervisor or employee or customer or client thinks is hap-pening, which may or may not be the actual problem.
Problem situation The circumstances in which a problem takes place and that give riseto the problem
Cause The cause of a problem is often very unclear. The cause is what is really keepingyour situation from being ideal. Very often, you will need to brainstorm possible causesand then collect data in order to rule out one or more of them.
Effect or symptom This is the real problem, the result of the cause of the problem. Itmay be something obvious like lost revenue, and there may be several effects from asingle cause.
Chain of cause and effect Very often, a single root cause will ”ripple” through the sit-uation, leading to an intermediate effect, which itself becomes the cause of anotherproblem, which has an effect, which causes another problem, and so on. Identificationof the real problem and its cause then becomes more difficult because you are forcedto backtrack from the obvious problem all the way to the root cause in order to mosteffectively solve the problem. For example, you may be experiencing the symptom ofabdominal pain. In order for the doctor to help you, she must determine why you havethe pain (the cause): it could be something you ate, an ulcer, a broken rib, a bruise,or something even more serious. Each possible cause has a very different solution.However, if the cause of the pain is, say, an ulcer, what is causing the ulcer? Stress?Spicy food? Poison?
1.1.2 Worked Examples
Example 1.1. A Problem at Gamma Technologies
Consider the memo below, from the CEO of Gamma Technologies, a firm that makeselectronic sensors and filters for medical imaging equipment. The company is fairly large,has been around for many years, and has a varied and diverse workforce.

1.1. WHY DATA? 11
To: All department managersFrom: CEO, Gamma TechnologiesDate: May 1, 2008Re: Working environment at Gamma
I have received a number of complaints that the working environment atGamma is unfriendly to older workers. As a result, it is believed that older work-ers are leaving the company in such numbers that they are drastically underrep-resented in the company. What should we do about this?
Excerpts from the responses of three managers, X, Y, and Z, are given below. Theseexcerpts are followed by critiques in which some of these managers’ unsubstantiated beliefsand assumptions are pointed out.
How Manager X Responded (an excerpt): ”...Age discrimination is clearly a problemin today’s workforce and it will become even more so in the immediate future as baby-boomers begin retiring later in life than previous generations of workers, either by choice orbecause of the increasing difficulty of accumulating a sufficient nest egg. Attitudes towardand perceptions of aging workers must be addressed head on. I recommend that a required-attendance series of sensitivity training classes be inaugurated immediately...”
How Manager Y Responded (an excerpt): ”...Underrepresentation, whether regards togender, race, or age, is a serious matter and puts Gamma at risk of a major class-actiondiscrimination law suit. I recommend that management immediately establish 1) a securehotline to handle complaints and 2) a review board that will investigate such complaintsand 3) a set of procedures that establish clearly what actions will be taken upon the reviewboard’s conclusions...”
How Manager Z Responded (an excerpt): ”..It is difficult to say with certainty how muchof the underrepresentation of older workers is due to an unfriendly environment and howmuch to other factors, such as wanting a career change or having accumulated sufficientfinancial resources for early retirement..”
Example 1.2. Critique of the Beliefs and Assumptions of the Managers
• Manager X
1. Belief: Age discrimination is clearly a problem in today’s workforce. Critique:While this may be true, X has not presented any evidence (data) to support thisbelief.
2. Assumption: Younger workers at Gamma have an attitude problem (unfriendli-ness) toward older workers. Critique: How do we know this is true? X does notpresent any evidence (data) to support this assumption.
3. Assumption: Gamma’s unfriendliness to older workers is due to age discrimina-tion. Critique: If there is unfriendliness to older workers (which has yet to beestablished), there is no evidence (data) that this unfriendliness is due to the age

12 CHAPTER 1. PROBLEM SOLVING BY ASKING QUESTIONS
of the worker and not to some other characteristic. Moreover, if there is indeed anunfriendly environment at Gamma, perhaps it is due to the unfriendly attitudeof older workers to younger workers, not the other way around.
4. Belief: Sensitivity training effectively curbs discrimination. Critique: There is noevidence presented that such is the case. Even if X had presented data support-ing the effectiveness of sensitivity training based on studies conducted at othercompanies, X would have to demonstrate that Gamma fits the profiles of theseother companies.
• Manager Y:
1. Assumption: There is an under representation of older workers at Gamma. Cri-tique: There is no evidence (data) as to what the representation of older workersactually is at Gamma or how it compares to that of similar companies.
2. Assumption: Gamma is at imminent risk of a class-action law suit. Critique: Ifthere is under representation of older workers at Gamma, how do we know it isof sufficient proportion to precipitate a class-action law suit?
• Manager Z:
1. Assumption: The under representation of older workers at Gamma may be at-tributed to reasons other than just an unfriendly environment. Critique: Whilenot providing any supporting evidence that Gamma’s older workers are indeedunderrepresented, Z does properly question whether any such under represen-tation can be attributed to age alone. This demonstrates a degree of analyticsophistication not found in the other manager’ responses.
Example 1.3. The Common Assumption: There is a problem at Gamma.Critique: All of the managers took as a given that what the CEO says is a problem isindeed a problem. A good manager or consultant understands that there is a perceivedproblem (what the boss or employee or customer or client perceives to be the problem) butalso understands that the person being consulted should not propose solutions to bogusproblems. The client’s view of the problem will almost certainly be stated in terms of oneor more assumptions and beliefs. This is to be expected, since if the client/customer knewwhat the situation really was, he or she would not need a consultant. It is the consultant’sjob to use the client’s perceptions as a first approximation, a way of framing the problem,but to not buy into these perceptions unless analysis of the data supports them.
A Serious Misstep: Managers X and Y are recommending solutions to a perceived prob-lem. That is, they are proposing solutions before knowing what the problem is and withoutgathering data to understand its dimensions.
While it is true that the manager/consultant is not paid for his or her unsubstantiatedbeliefs about what might or might not be a good solution (even to a genuine problem), one’sbeliefs or intuitions can be useful tools for figuring out what data should be gathered. Itmay turn out that some of the assumptions managers X, Y, and Z made are, in fact, trueand can be supported by the gathering and analysis of appropriate data.

1.1. WHY DATA? 13
1.1.3 Exploration 1A: Assumptions get in the way
The beliefs and assumptions underlying the managers’ responses to the CEO’s directive atGamma are all plausible, but they are not grounded in an analysis of data. We can useassumptions like these, however, to help us determine what kinds of data we need to gatherin order to explore as many dimensions of a situation as we can without assuming we knowthe answers. The managers’ ”solutions” were likewise plausible but were proposed at thefinal stage of the problem-solving process instead of at the problem formulation stage wherethey could be most useful. In similar situations, we can use our imagined solutions as a wayof testing whether we have thought of all the data we need to gather in order to adequatelysupport them.
Briefly describe how you would gather the data needed to test the assumptions/beliefsof X, Y, and Z.
NOTE: If a particular belief or assumption does not seem to be particularly helpful forcollecting the kind of data you need, explain briefly why not and move on to the next one.
Manager Belief or Assumption Data Needed or ExplanationX Age discrimination is a
problemYoung workers are un-friendly toward olderworkersUnfriendliness is due to agediscriminationSensitivity training curbsage discrimination
Y Older workers are under-represented at GammaGamma is at risk of a law-suit
Z Under-representation maybe due to more than just un-friendliness
Explain below why you think that the data you listed above will help you gather enoughdata to assure that you have gotten beneath the perceived problem to the real problem (theymay be one and the same, of course).

14 CHAPTER 1. PROBLEM SOLVING BY ASKING QUESTIONS
1.1.4 How To Guide
Writing business memos and reports
All solutions to memo problems should be written so as to ”stand alone.” That is, any readershould be able to pick up your solution and read it without knowing anything else about theproblem (but might need to know something about the content). In other words, you mustthink objectively about your response to the memo. Ask yourself, ”What if I got this on mydesk and knew nothing about the project? Would I understand the memo?” If the answeris no, then your response needs more information.
Writing is one of the most (if not THE MOST) important aspects of a career - any career,but especially one in business. Writing is a way of seeing, understanding, explaining, andenvisioning the world around you. Managers with good communication skills will never beoutsourced.
In this course, you will be preparing two types of responses to memos. The first type ofresponse you will produce is an informal, routine type of memo (see the sample in Example1 (page 10) - problem at Gamma) . In a routine memo, you should:
• Use an informative subject line that summarizes the purpose of the memo.
• State the purpose of your memo in a direct manner in your introduction.
• Organize the body of your memo for readability, using visual cues, bulleted lists, andtables.
• Summarize your analysis, findings, or recommendations, as appropriate in your closingparagraph.
• DO NOT include a closing (like ”Sincerely, John”)
The second type of response you will be preparing is really what would be called aBusiness Report. In this type of response, you should include the following sections:
1. The Executive Summary (1 - 2 paragraphs)
(a) Introduction. Tell the reader what the problem is about. Briefly tell the readerwhat data has been collected. Explain what you want to determine or find out.
(b) Preview. Then tell the reader what you are planning to do and give him/her anidea about how the analysis of the data will flow. Explain what the structure ofthe memo is.
(c) Conclusions of the Analysis. Briefly describe the conclusions, if possible.
2. Analysis (the bulk of the report)
(a) Steps to Reach the Conclusion. Explain what you did; explain all the steps andthe reasoning that led to each step.

1.1. WHY DATA? 15
(b) Supporting Evidence. Provide all the supporting evidence - graphs, tables, charts,etc. Labe leach item appropriately and refer to it by name in the text of theresponse. Organize the evidence and the explanation so the reader can follow theargument.
3. Conclusion (1 - 2 paragraphs)
(a) Summary of results. Provide a summary of the results of the analysis, collectedinto a convenient form (like a table).
(b) Context. Put your solution into context and explain what the results actuallymean for the situation you are analyzing. Interpret the results so the reader doesnot have to guess.
(c) Sensitivity. How accurate are your results? How much are they likely to changeas a result of changes in the underlying data? Give the reader a sense of whatthe limits are to your analysis, so that he/she knows how much to rely on theseresults.
(d) Advice. If the original assignment/memo called for a decision, be sure you providea clearly stated response to that requirement, and clearly connect your evidenceand process to the decision you are advocating.
Another helpful hint is to use headings in the memo to improve both the visual andlogical organization. These may take many different visual formats (bold type, underlining,larger font, etc.) but should match with the structure provided in the introduction of thememo, so that an interested reader can easily locate the information he or she needs. Thishelps with your overall goal in writing a good memo: Make your thought process transparentfor both your reader and yourself. After all, you may need to come back to this project insix months or a year; a good memo now will save you a lot of time later.
Elements Of An Effective Memo√
Writing is competent (grammar, spelling and sentence structure are correct and clear)√Directed at the right person (your audience)√Fully addresses the problem√Margins are clean√Organized and focused so it can quickly be read and understood√Sufficient analytic detail to justify all conclusions√No charts or tables split across page breaks√Charts and tables are labeled and referred to by these labels in the text√Evidence (charts and tables) is embedded in the report, somewhat near the discussionabout it (integration of text and graphics)√Charts and tables are all legible√Document sections are in order and not fragmented√Introduction provides an overview of the memo and its structure√Introduction reminds the reader (briefly) of what the problem context is and what youhave been asked to do

16 CHAPTER 1. PROBLEM SOLVING BY ASKING QUESTIONS
Elements of an Exceptional Memo√
Additional tables used to organize all conclusions and make comparisons easier√Features like bold text, shading, and headings used to highlight important information√Conclusion summarizes the analysis√Report includes an analysis of accuracy and possible errors
The 5W+H Strategy√
Who writes? To whom?√What do they write about?√When should you write?√Where should you write?√Why should you write?
Email protocols for professional communication
You are probably used to sending and reading emails. You probably even have multipleemail accounts to manage. Since all systems are slightly different, we want to talk aboutsomething more important to the general concept of sending emails, whether you are sendingthem to your course instructors, your family, your boss, or your friends.
Personal Information. It is critical that several things appear in any email message.
• Your name. It may seem redundant; after all, the recipient has your email address.But consider this. Many usernames are not clearly connected to to your name. Whensomeone receives an email from abC1434, they don’t usually have time to think abouteveryone they know that might have that as a username. They really don’t know whosent the message. If you aren’t willing to sign your actual name to the message, youshould really think about whether it is a message you should be sending.
• Your job title and address
• Maybe even a phone number.
If your e-mail system allows signature files, it probably will let you create several differentones. You could have a signature file for professional communications and a separate one forpersonal communications, with different information in each.
Subject Line. Be sure that you put something meaningful in the subject line of yourmessages. With the thousands of junk email messages that most people receive each week,the subject line will often be the deciding factor in whether your email gets read or not.If your email is to a course instructor, for instance, your instructor will appreciate it if thesubject line contains the course number (like MSTI 130) as the first part of the subject line.In the business world, many people will automatically delete messages with inappropriatesubject lines or without a subject altogether, not to mention that many spam filters willautomatically remove messages without subject lines before the intended recipient everygets an opportunity to examine them.

1.1. WHY DATA? 17
Be Professional. Make sure that you do a little proofreading in your emails. Theymay be short, but don’t be sloppy. Grammar, punctuation, and spelling are all importantin emails. Very often, this may be your only chance to make a first impression, so make itgood.

18 CHAPTER 1. PROBLEM SOLVING BY ASKING QUESTIONS
1.2 Defining the Problem
More often than not, the most important step in solving a real-life problem is finding outexactly what the problem is. Obvious - and sometimes not so obvious. There are times whenyou will be called on to work with supervisors or clients who come to you for a solution butwho don’t really have a clear idea of what the problem is, and it will be your job to get tothe bottom of the situation by gathering the data that define the problem and that provideall that will be needed to solve the problem once it is identified. Defining the problem andcoming up with a plan for gathering the appropriate data to think about the problem gohand in hand.
But how, for any given problem situation, do we recognize what data will enable us tofirst define the problem accurately and then later to analyze it? We need to learn how toisolate what is relevant to the problem from what is not relevant to it. We will see in theExamples and Exploration how to use the 5W+H thinking strategy to recognize and isolaterelevant information from a problem situation. In most cases, the strategy must be appliedtwice: once to the problem context, in order to understand what is going on and howone might resolve it, and once to the communicative context, in order to understand thepurpose for solving the problem and how the results are to be shared.
In the problem context, we ask questions to help understand the perception of the prob-lem, the causes of the problem, and the consequences of the problem. In other words, theyhelp us develop an accurate picture of chain of cause and effect involved in the problem. Ifthe perceived problem is ”poor customer service” at your fast food restaurant, one needs toknow a great deal more before trying to solve the problem. Who is complaining about thecustomer service? Is it a particular type of customer, customers placing a particular order,or something else? When are the complaints occurring? Are they around the clock, onlyat certain times of day/night, or are they connected to a particular staffing arrangement?Where are the complaints centered? Are they at the counter, drive-through, or both? Whatdo the customer complaints even mean? Are they in regards to waiting too long for food,lack of friendliness, lack of cleanliness, or some other aspect of customer service? Why havethese complaints just been brought up? Has something changed about the customer service?By first asking these questions, and then systematically collecting data to answer them, onecan develop a better picture of the problem context. One can then attempt to resolve theproblem as it actually exists. Without relevant data in the restaurant example, a managermight be tempted to push her employees to work faster, trying to minimize service times,when the real issue is that no one is keeping the dining area clean. Solving the wrong problemis often costly in time and money, and it still leaves the original problem unsolved.
Capturing the needed information in analyzable forms, however, is not always easy. Hereare four ways to collect data that you might consider when defining the problem:
• Observations
• Survey Questionnaires
• Interviews
• Archives

1.2. DEFINING THE PROBLEM 19
We will use observations and survey questionnaires in later sections. You might consider,however, using any or all of these methods of data collection when doing the memo problemat the end of this chapter.

20 CHAPTER 1. PROBLEM SOLVING BY ASKING QUESTIONS
1.2.1 Definitions and Formulas
5W+H Strategy A method for making sure that you have considered as many differentaspects of the problem situation as possible by asking six essential questions: Who?What? When? Where? Why? and How?
Problem Context This is the situation giving rise to the problem. It includes everythingabout the situation. For example, if there are complaints about a restautant’s ser-vice times, then the food preparation process, the layout of the store, the menu, thecustomers, and everything else involved in placing and picking up an order can beconsidered part of the problem context.
Communicative Context This is an additional aspect of solving a problem that is oftenignored. The problem context describes the situation; the communicative context helpsone to understand the purpose and goals for solving the problem. Typically, this isbecause your boss has contacted you and given you deadlines and goals for the project.
Observation Either a person or some sort of mechanical process (or combination) recordsthe occurrence of some pertinent event, usually recorded in a format specially preparedfor this purpose, e.g. keeping tallies on a lined paper form or noting times in one-hourblocks or an electric eye keeping tallies and times of the traffic flow through a gate.
Survey Questionnaire A form (paper or electronic) filled out by customers, usually re-quires some sort of short answer or circle (check mark) of possible responses, e.g.Check: Male/Female; On a Likert scale of 1 (most liked) to 5 (least liked), circle oneof the following, etc.
Interview Either structured (the interviewer asks all interviewees exactly the same ques-tions) or semi-structured (the interviewer asks each interviewee the same basic ques-tions but ”goes with the flow,” according to how the interviewee responds). Structuredinterviews lend themselves most readily to quantitative analysis and often are some-what like a questionnaire, except they are usually longer and have certain advantages,such as the interviewer making sure that all the questions are answered and understood.
Archival Data Data that is compiled from already-existing sources, e.g. company databanks, government reports, or trade/industry tables that are available in print form,on CDs or that can be downloaded from the web.
Timeline A schedule of the events or tasks needed to complete a project along with thelength of time each task will require and, usually, the personnel needed for each task.
RFP A request for a proposal. A business solicits proposals from other companies to un-dertake a project. The business will evaluate all submitted proposals on a competitivebasis with regard to how well the proposals address the task or problem at hand andat what cost. The business will then award a contract to the company submitting thebest proposal.

1.2. DEFINING THE PROBLEM 21
1.2.2 Worked Examples
These examples start with a memo from a regional manager of a fast-food chain to you,the manager of a local restaurant in the chain. This is followed by some notes on how youmight respond to the memo. and a sample response memo to critique. The subsequentexploration begins with the response from the regional manager to your memo and gives youthe opportunity to explore how you might address the regional manager’s concerns.
Example 1.4. A Problem at Beef n’ Buns
To: Local Manager, Beef n’ BunsFrom: Chad R. Chez, Regional Manager, Beef n’ BunsDate: May 8, 2008Re: Customer Service
I seem to be getting a lot of complaints from across the region that our Beefn’ Buns service is lousy. I want each of you to send me a detailed plan and a roughtimeline for addressing this problem. I will review them and get back to you.
My Notes Toward a Reply There seems to be a lot going on with this memo, so I’mgoing to deal with it on two levels:
1. How should I deal with my boss in the context of the memo?
2. How can I come up with what he wants?
The Memo Context. This will help ensure that I do everything the boss wants in theway that he has asked for it to be done. While it doesn’t resolve the problem itself, it willprobably help me understand the boss better, and it will certainly help me keep my job.
WHO? My boss, the Regional Manager
WHAT? Wants me to devise a plan and a timeline for addressing the perceived problem. I’llsend my response as a well-thought out memo
WHEN? ASAP (if I know what’s good for me!), then I’ll wait for his comments to see when Iwill actually have to do put the plan into action
WHERE? Sent to him
WHY? Perceived Problem: Lousy-service complaints. Whether I feel these complaints arejustified or not, I am responsible for addressing his concern
HOW? Send him a memo with two things: A plan and a timeline. I think I’ll also send alongsome idea of what the project will cost, just to let him know that such things don’tcome free.

22 CHAPTER 1. PROBLEM SOLVING BY ASKING QUESTIONS
The Problem Situation. This is where I find out about the causes of the problem andhopefully find some ways to fix it.
WHO? My customers
WHAT? Perceived problem: lousy service.
WHERE? At the drive-up window? At the walk-in service counter? In the kitchen? In the diningarea?
WHEN? Does the time of day matter? Is it tied to a particular set of staff members?
WHY? To see if my restaurant has a problem with service times. Are lousy-service complaintsjustified at my business? Is it related to something other than service times (likecleanliness, friendliness or something else?)
HOW? How can I and my staff go about gathering data to find out about service times?
PLAN: I don’t know what the problem really is. I need to find out if it’s a matter ofunacceptably long service times at the drive-up and/or the walk-in counter. I’ll need tocollect data on both. I (or my staff) will have to observe, time, and record the service-timedata and do some analysis of the data.
OBSERVATIONS: Where should I position my observers? When should they be there?How will they actually do it? Over what period of time should we collect data?
TIMELINE: I don’t need a definite starting date for my project at this point, but I doneed some kind of estimate of how long each of the tasks in my plan will take. Trying toset up a timeline really points out the missing pieces of my plan, and that is helpful. Forexample, who will carry out all these tasks? Seeing the overall project laid out like thisalso gives me an idea of the extra personnel cost and personnel scheduling problems I willencounter in carrying out the study–I will want to at least mention these things in my memo.Part of the timeline should include the time required to analyze the data. All in all, it isimportant to show the Regional Manager that I have thought about some of the ins andouts and that I have a realistic picture of the whole.

1.2. DEFINING THE PROBLEM 23
Example 1.5. A Proposed Plan and Timeline for Beef n’ Buns
To: Chad R. Chez, Regional Manager, Beef n’ BunsFrom: Local Manager, Beef n’ BunsDate: May 8, 2008Re: Customer Service
This is in response to your request for a plan and timeline for determining ifcustomers are receiving poor service at my location.
Plan My staff and I will collect service wait times at the two venues, the drive-upwindow and the walk-in counter. One of us will record the time each order hastaken from the moment it is placed to when the completed order is delivered tothe customer. We will gather the wait times during a continuous one-hour intervalfor the periods we are busiest, that is, breakfast, lunch, and at dinner. Here is mytimeline for the project:
Task Time Personnel1. Create detailed plan for data collection 1 week 1 me2. Actual data collection 2 weeks 2 people for 3 hrs/day3. Analysis of data 2 weeks 1 me + consultant4. Writing of report 1 week 1 me
Although there may be some additional expenses, most of the cost of theproject will come from filling the slots vacated by the observers during the period ofdata collection and the hours the consultant puts in. I have identified a reputablestatistical consultant at our local university who charges $50/hr and would beinterested in the project.
Cost Estimate:
2 people x 3 hrs/day x 14 days @ $10.00/hr= $8401 Statistical consultant x 4 hrs x $50/hr = $200Miscellaneous expense (forms, etc) = $100Total =$1140
I await your reply as to when to begin and how I should take care of theaccounting.

24 CHAPTER 1. PROBLEM SOLVING BY ASKING QUESTIONS
1.2.3 Exploration 1B: Beef N’ Buns Service
Consider the following response from your boss:
To: Local Manager, Beef n’ BunsFrom: Chad R. Chez, Regional Manager, Beef n’ BunsDate: May 11, 2008Re: Customer Service
You are definitely headed in the right direction. Here are some things I wouldlike you to think about for your revision.
I’m thinking that the type of order might have something to do with the waittime. We might find that some items or combination of items take longer thanothers. What might make one order take a significantly longer time than another?Just the size? Is there some way of comparing all these different combinations?If so, we could pinpoint the problem items and figure out ways to cut down theirprep or processing times. Also, should the drive-up data be kept separate fromthe walk-in data or is it sufficient just to identify which is which in the same database?
Collecting data during certain times of the day seems reasonable. Have youthought about the day of the week as a variable as well?
Have you considered that the complaints might mean something other thantoo-long wait times? What about customer relations? You know–friendliness,courtesy? Is there a way of getting at this possibility?
I think your timeline ought to include something about the time it is going totake to design the data collection forms and also maybe a training period for yourobservers. Shouldn’t there be some trial runs to catch any bugs and then some timeto make any necessary modifications to the collection forms? Also, what aboutthe time it will take to enter the data into spreadsheets? Considering the amountof data you will be collecting, entry time might be significant enough to figure inthe timeline. Much of the data can be captured and stored by the computer asthe orders are placed and so your observers need not write down everything at themoment.
I am pleased that you thought to include the services of a statistical consultantin this project because so many of my local managers did not. I suspect that eitherthey didn’t even think of a consultant or were afraid that they didn’t know enoughto deal with one. As a matter of fact, I think that you might consider bringing inthe consultant at other times in the process, instead of just for the data analysis.
Anyway, give me a revision of your plan and timeline ASAP. I will let youknow how we will deal with the cost and the accounting of the project later on.

1.2. DEFINING THE PROBLEM 25
Make some notes as to how you would modify your plan based on the regional manager’smemo and then create an expanded timeline to include his suggestions.
Notes on how to deal with the differences in orders:
Notes on collecting data on customer relations:
Revised timeline:

26 CHAPTER 1. PROBLEM SOLVING BY ASKING QUESTIONS
1.2.4 How To Guide
Format of computer information in this text
This textbook contains three kinds of computer information to help you. Each will beformatted a little differently, so we have included a brief overview of each to help you.
Excel Information
Excel information will be presented with a brief set up of how the spreadsheet should beorganized and what the new tool will do. Step-by-step instructions will follow. Any formulasin the format below show the syntax of formulas to be typed into Excel.
=FormulaName(argument 1, argument 2, etc.)
Any formulas shown in this format, with specific cells or cell ranges in the formula,should be typed exactly as shown, assuming that your spreadsheet is set up as described inthe information or as shown in the accompanying screenshots and images.
=FormulaName(A1:A10, 3)
Advice on computers and doing work electronically
There is nothing so tragic as bad things happening to good students.Unknown Instructor
If you want to avoid being one of those good students to whom bad things happen, takeheed of the following advice. It should become a mantra, repeated to yourself over and overuntil it is a part of your psyche:
SAVE EARLY, SAVE OFTEN.
Anytime you make a substantial change to your work like pasting a graphic in, typinga whole sentence or paragraph, adding a table, or reformatting, you should save your file.Save as soon as possible after starting a file. There is also a keyboard shortcut for savingfiles: CTRL+S. Use this frequently to avoid losing a substantial part of your work.
Using the help system in Microsoft Office
The help system for Microsoft Office is fairly extensive. In Word or Excel (or Power Point),there is a button in the upper right corner of the screen that is labeled with a question mark.Clicking this button will activate the help system, shown in figure 1.1
The basic help dialog box has a search feature and some organized links about Excel.For starters, try searching for help on ”help”. Simply type the word ”help” into the searchbox. If you are offline (not connected to the internet) you will have access to the basic helpfeatures; if you are online the help center can search a huge database of information to helpyou with your questions.

1.2. DEFINING THE PROBLEM 27
You should get used to using the help features. Very often, your first try will not turnup anything, but always check the ”see also” line that appears with most help information.This will link you to other information that is related to the topic you originally searchedfor.
Within the information portion of the help window, most of the phrases and sentencesare hyperlinked to allow you to navigate through the information to locate what you need.
Figure 1.1: Microsoft Excel 2007 help interface

28 CHAPTER 1. PROBLEM SOLVING BY ASKING QUESTIONS
1.3 Homework
1.3.1 Mechanics and Techniques Problems
1.1. Two sets of train tracks run parallel to each other, except for a short distance wherethey meet and become one set of tracks over a narrow bridge. One morning, a train speedsonto the bridge. Another train coming from the opposite direction also speeds onto thebridge. Neither train can stop on the short bridge, yet there is no collision. How is thispossible?
1.2. Identify the 5W+H for the second memo from the boss in exploration 1.2.3 (page 24).
Memo Context Problem ContextWhoWhatWhereHowWhyWhen
1.3. Identify the 5W+H for the news article in figure 1.2 (page 29):
Memo Context Problem ContextWhoWhatWhereHowWhyWhen
1.3.2 Application and Reasoning Problems
1.4. Let’s say you are a sports writer for a major national newspaper. You are asked towrite an article to go with the one of the following headlines. Choose one and describe yourhypothesis and how you would collect data to support that hypothesis.
• Big City? Less Safe!
• Are Major League Baseball Salaries too high?
• Chicago Cubs play better at night

1.3. HOMEWORK 29
Figure 1.2: News article for Mechanics and Techniques problem 3 (page 28).
• Pentagon skimps on Health Care for Vets
1.5. Look again at the Gamma Technologies scenario, example 1 (page 10). The CEOcontends that there is a problem with age-discrimination at the company. Choose one ofthe three managers who responded and describe what they believe is the chain of cause andeffect.
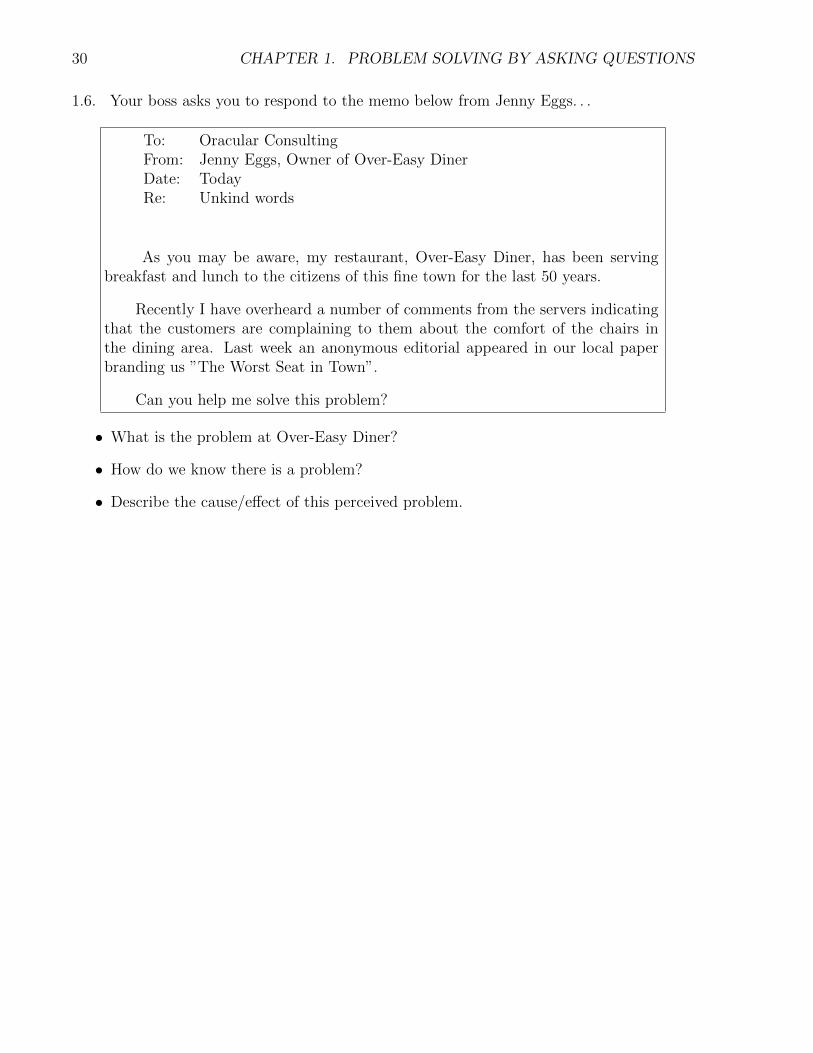
30 CHAPTER 1. PROBLEM SOLVING BY ASKING QUESTIONS
1.6. Your boss asks you to respond to the memo below from Jenny Eggs. . .
To: Oracular ConsultingFrom: Jenny Eggs, Owner of Over-Easy DinerDate: TodayRe: Unkind words
As you may be aware, my restaurant, Over-Easy Diner, has been servingbreakfast and lunch to the citizens of this fine town for the last 50 years.
Recently I have overheard a number of comments from the servers indicatingthat the customers are complaining to them about the comfort of the chairs inthe dining area. Last week an anonymous editorial appeared in our local paperbranding us ”The Worst Seat in Town”.
Can you help me solve this problem?
• What is the problem at Over-Easy Diner?
• How do we know there is a problem?
• Describe the cause/effect of this perceived problem.

1.3. HOMEWORK 31
1.3.3 Memo Problem
To: Analysis StaffFrom: Director of MarketingDate: May 11, 2008Re: Salena Way RFP
I have received an RFP (Request For Proposal) from Salena Way, Directorof Carnivorous Cruise Lines. Her RFP is enclosed in hard copy and also attachedelectronically (see page 32).
After you read and think about Ms. Way’s problem, I want each of you tosend me a preliminary proposal for how to deal with it. I will give you somefeedback and you can resubmit your revision to me (I will post the deadlines onour intranet web site). I will then pass on your revised proposal to our marketingteam, who will cost it out. I will write a cover letter and submit the final proposalto Ms. Way myself.
Our marketing team will need your proposal to include the following, so makesure you address each of them:
1. What is the perceived problem(s) and its consequences?
2. Possible reasons for the problem (The RFP suggests three possibilities. Makesure you address these and maybe consider one or two other possibilities).
3. A plan for gathering data to help identify the problem. You need to includea rough timeline for the whole data collection and analysis process.
4. Use your possible reasons and possible solutions (1 and 2 above) as a wayof ensuring that your data collection gets you what you might need; that is,use these as a reality check to refine your thinking.
5. Identify any possible difficulties, problems or expenses (there will indeedbe some) that might be encountered in collecting and analyzing such data.Don’t include any dollar figures because our marketing team will do this.

32 CHAPTER 1. PROBLEM SOLVING BY ASKING QUESTIONS
To: Salena Way, Director of Carnivorous Cruise LinesFrom: Director of Marketing, Oracular ConsultantsDate: May 1, 2008Re: RFP Regarding Entertainment Attendance
As you may be aware, cruise ship traveling has become big business. Our cruise line is nowcompeting for customers of all age groups and socioeconomic status levels. We offer all typesof cruises, from relatively inexpensive 3-4-day cruises in the Caribbean, to 12-15-day cruises inthe Mediterranean, to several-month, around-the-world cruises. These have several features thatattract customers, many of whom book 6 months or more in advance: (1) they offer a relaxing,everything-done-for-you way to travel, (2) they serve food that is plentiful, usually excellent,and included in the price of the cruise, (3) they stop at a number of interesting ports and offertravelers a way to see the world, and (4) they provide a wide variety of entertainment, particularlyin the evening.
This last feature, the entertainment, presents a difficult problem for our ship’s staff. Atypical cruise might have well over a thousand customers, including elderly singles and couples,middle-aged people with or without children, and young people, often honeymooners. Thesedifferent types of passengers have varied tastes in terms of their after-dinner preferences inentertainment. Some want traditional dance music, some want comedians, some want rockmusic, some want movies, some want to go back to their cabins and read, and so on. Obviously,our cruise entertainment director wants to provide the variety of entertainment our customersdesire within a reasonable budget because satisfied customers tend to be repeat customers. Thequestion is how to provide the right mix of entertainment.
As a part of an internal quality control study my department has been conducting, Irecently took one of our 12-day cruises. The entertainment seemed to be of high quality andthere was plenty of variety. A seven-piece show band played dance music nightly in the largestlounge, two other small musical combos played nightly at two smaller lounges, a pianist playednightly as a piano bar in an intimate lounge, a group of professional singers and dancers playedBroadway-type shows about twice weekly, and various professional singers and comedians playedoccasional single-night performances. (There is also a moderately large onboard casino, but ittended to attract the same people every night and it was always closed when the ship was inport.) Although this entertainment was free to all passengers, much of it had embarrassingly lowattendance. The nightly show band and musical combos, who were contracted to play nightlyuntil midnight, often had fewer than a half dozen people in the audience, sometimes literallynone. The professional singers, dancers, and comedians attracted larger audiences, but therewere still plenty of empty seats. In spite of this, the cruise staff posted a weekly schedule, andthey stuck to it regardless of attendance. In a short-term financial sense, it doesn’t make muchdifference. The performers get paid the same whether anyone is in the audience or not, thepassengers have already paid (indirectly) for the entertainment part of the cruise, and the onlypossible impact on our cruise line (in the short run) is the considerable loss of liquor sales fromthe lack of passengers in the entertainment lounges. The morale of the entertainers was not great;entertainers love packed houses (and so do we at Carnivorous!). Of course, as they usually arguesomewhat philosophically, their hours are relatively short and they are still, after all, gettingpaid to see the world.
We need to get to the bottom of this. Off the top of my head, could it be that we havea problem with deadbeat passengers, or low-quality entertainment, or a mismatch between theentertainment offered and the entertainment desired? How do I go about finding out? Should wekeep a strict schedule, or should we play it more by ear? We need a proposal that identifies theproblem(s) and then offers a solution(s) within a reasonable time frame for a reasonable price.
(Adapted from Data Analysis and Decision Making with Microsoft Excel by Albright, Winston, and Zappe,Duxbury Press, New York, 1999)

Index
5W+H, 20
Archival Data, 20
ComputerCommand Format, 26Excel Info, 26General Advice, 26Microsoft Help, 26
Consultant, 10
Data, 10
Email Protocol, 16
Interview, 20
Observation, 20
ProblemCause, 10Chain of cause and effect, 10Communicative Context, 20Effect, 10Perceived, 10Problem Context, 20Situation, 10
RFP, 20
Survey, 20
Timeline, 20
Writing, 14
533