Embed Size (px)
Citation preview

Policy, Research, and External Affair.
WORKING PAPERS
L Studies and Training Design
Economic Development InstituteThe World BankDecember 1990
WPS 554
Korea's Labor MarketsUnder
Structural Adjustment
Dipak Mazumdar
Korea's ability to keep the economy from going off the rails hasbeen as remarkable as its achievement of high long-run growthrates. The key to the success of Korea's labor policy - stateguidelines limited the wage increases under structural adjust-ment - was the high rate of total factor productivity growth.
The Policy. Research, and Extemal Affairs Complex distributes PRE Working Papers to disseninate the findings of work tn progress andto encourage the exchange of ideas among Bank staff and all others interested in development issues. These papers carry the names ofthe authors, reflect only their views, and should be used and cited accordingly. The findings, interpretations. and ctmclusions are theauthors' own. They should not be auributed to the World Bank, its Board of Directors, its management, or any of its member countries.
Pub
lic D
iscl
osur
e A
utho
rized
Pub
lic D
iscl
osur
e A
utho
rized
Pub
lic D
iscl
osur
e A
utho
rized
Pub
lic D
iscl
osur
e A
utho
rized
Pub
lic D
iscl
osur
e A
utho
rized
Pub
lic D
iscl
osur
e A
utho
rized
Pub
lic D
iscl
osur
e A
utho
rized
Pub
lic D
iscl
osur
e A
utho
rized

Policy, Research, and External Affairs
Studies and Training Design
WPS 554
This paper- a product of the Studies and Training Design Division, Economic Development Institute-is part of a larger effort in PRE to understand the behavior of labor markets in the process of structuraladjustment of the economy. The paper is one of the country studies prepared for the project on "LaborMarkets in An Era of Structural Adjustmcnt. Copies are available free from the World Bank, 1818 H StreetNW, Washington, DC 20433. Please contact Marshall Schreier, room M4-023, extension 36432 (55 pages,including figures and tables).
Korea is an interesting case study in long-term The wage-setting mechanism seems to haveand short-term adjustment. Korea's rate of been strongly influenceu by state guidelines,economic growth after 1965 was high at a time which encouraged wage increases as incentiveof rapid, fundamental economic restructuring. payments but kept them within the limits ofKorea's open, export-oriented economy - productivity increases - subject to the necessitydependent on imports of oil and intermediate of dealing with short-run shocks.inputs - was exposed to oil price shocks andinterest rate hikes. The key to the success of Korea's labor
policies was the high rate of total factor produc-To keep up the rate of investment, Korea tivity growth. This also allowed for continued
borrowed heavily in the world market - and nominal devaluation of the won without trigger-appeared to be highly vulnerable. And it had a ing secondary pressures on domestic costs orhistory of walking a tightrope between inflation- damaging extemal competitiveness.ary pressures and balance of payments deficits.
The above points pertain to the behavior cfKorea's ability to keep the economy from the large-scale "formal" sector of the economy.
derailing has been as remarkable as its achieve- But wage employment in small firms and thement of high long-term growth rates. self-employed constitute a sizeable part of the
labor market. How did labor eamings in theseMazumdar concludes that wage behavior in sectors perform relative to the wage gains in the
the formal sector played a significant role in formal sector? For lack of data Mazumdaradjustment, but not because there was an elastic focused on farm workers, wage eamers in smallsupply of labor at a stagnant wage during firms, and also a section of the workforce whoseexpansion. On the contrary, real wages rose relative eamings have been low throughout -impressively throughout the period of growth. that is, female workers.But real wage increases lagged behind thegrowth rate of labor productivity (except during Women and workers in the farm sector andthe "big push" of the late 1970s). And during small firms shared to some extent in wagethe years after the oil shock real wages stagnated increases, but the long-term record for theseor even declined somewhat despite a spurt in groups is not entirely satisfactory.productivity.
The PRE Working Paper Series disseminates the findings of work under way in the Bank's Policy, Research, and ExternalAffairs Complex. An objective of the series is to get these findings out quickly, even if presentations are less than fully polished.The findings, interpretations, and conclusions in these papers do not necessarily represent official Bank policy.
Produced by the PRE Dissemination Center

Table of Contents
I. Cycles in the Korean Economy 1
Phase I: The Period of Export-led Growth (1965-1973) 1Phase 2: Period of Directed Heavy Industrialization and the
Shadow of Crisis (1973-79) 4Phase 3: The Crisis and Ad;ustment (1979-82) 5Phase 4: Recovery and Growth (1982-to date) 6
II. The Characteristics of Korean Stabilization and Adjustment Policies 8
Ill. Determinants of Unit Labor Cost and Wage Behavior in KoreanManufacturing 1 1
Determinants of Unit Labor Cost 1 2Wage-Productivity Trends 1 5Wage Determination in Korean Manufacturing 1 8
IV. The Structure of Korean Labor Markets and Wage Differentials 23
Farm/Non-farm Differential 24Wage Difference by Size of Firms 2 7Male-Female Differences 31
Conclusion 40
References 44
Annex 47

1. Cycles In the Korean Economy
Recent economic history of Korea can be broken down into the following four
phases: The period (1965-73) was a period of sustained growth rate in the GDP, which
although varying from year to year was at a generally high level (Figure 1).1
Difficulties emerged after the first oil shock. It led to a period in which government
economic policy leaned towards one of fostering development in heavy industry so as to
make the economy less dependent on the vagaries of the world economy. This policy led to
a faster build up of foreign debt, so that when the second oil price hike and interest rate
hike struck, the economy went into a depression in the early 80s-the first time when
the average rate of growth of real GDP actually fell below zero. The depression however,
was extremely short-lived. As in other Southeast Asian countries (other than the
Philippines) the economy was able to adjust very quickly to the external shocks (which
were indeed aggravated by internal shocks), and the recovery since 1982 has been rapid
and sustained.
Phase l: The period of export-led growth (1965-1973)
This was the period of export led growth in Korea. As can be seen from Figure 2,
the barter terms of trade either increased or were constant (except for one year,
1969), while the income terms of trade increased at a very high rate from year to year.
In fact, throughout the period the lowest annual rate of growth of the income terms of
trade was 30 percent, and in most years it was well above this. This was the period
when the outward looking strategy of Korea was getting established in a spectacular way.
The current account was, however, in deficit throughout this period (Figure 1),
and until 1971 the annual percentage rate of growth of the deficit accelerated. It also
went up sharply as a percentage of GNP from -3.7 percent in 1966-67 to -8.9 percent
in 1971.
1 The basic time-series in which the graphs are based is given in Annex Table Al.The income terms of trade shows the real value of exports in terms of importablecapacity. It is the index of the value of exports divided by the index of import prices.

2
Figure 1REAL GDP GROWTH AND CURRENT ACCOUNT/GNP (Korea, 1963-88)
2 -
20
Is.
1163 19i3 1973 173 1933 133
'. OL COP CROwf * CURM ACMt W
Figure 2Growth of the Terms of Trade (Korea 1963-1988)
a0 -so
-20
-'0
1954 1969 1174 1979 9'4
a MAT

3
The reason for this deficit was the high rate of Investment sustained at a level
higher than the domestic rate of savings. Foreign borrowing was used to bridge the gap,
as well as to take care of the diminishing role of foreign aid. "Firms (specially
exporters) were given strong incentives to borrow abroad. A system of loan guarantees
substantially reduced the risks and the real cost of borrowing was negative." (Collins, p.
6). External debt as a percentage of GNP reached a level over 30 percent by ihe ond of
the period. But because of the increase in the export-GNP ratio, the ratio of debt to
exports-which ultimately determined Korea's ability to finance the debt-fell
significantly towards the end of the period (Figure 3).
Figure 3
KOREAN DEBT RATIOS (1970-1988)
160 -
1 40
130
l20
100 ,
90
sgo 97 9617 18 951|
60 o
40
so
20
1970 1973 1976 1979 1962 1935 1916
a OEBT/GNP 4.OET/EXPORTS
4
The role of the public sector in maintaining the high rate of investment was
limited. This, together with the fact that tax revenue as a percentage of GNP nearly
doubled over this period (Dornbusch and Park, Figure 2, p. 408), held the budget deficit
at a relatively modest level. Except for 1972 whei the deficit was 4.6 percent of GNP,
the ratio was generally 2 percent or less.
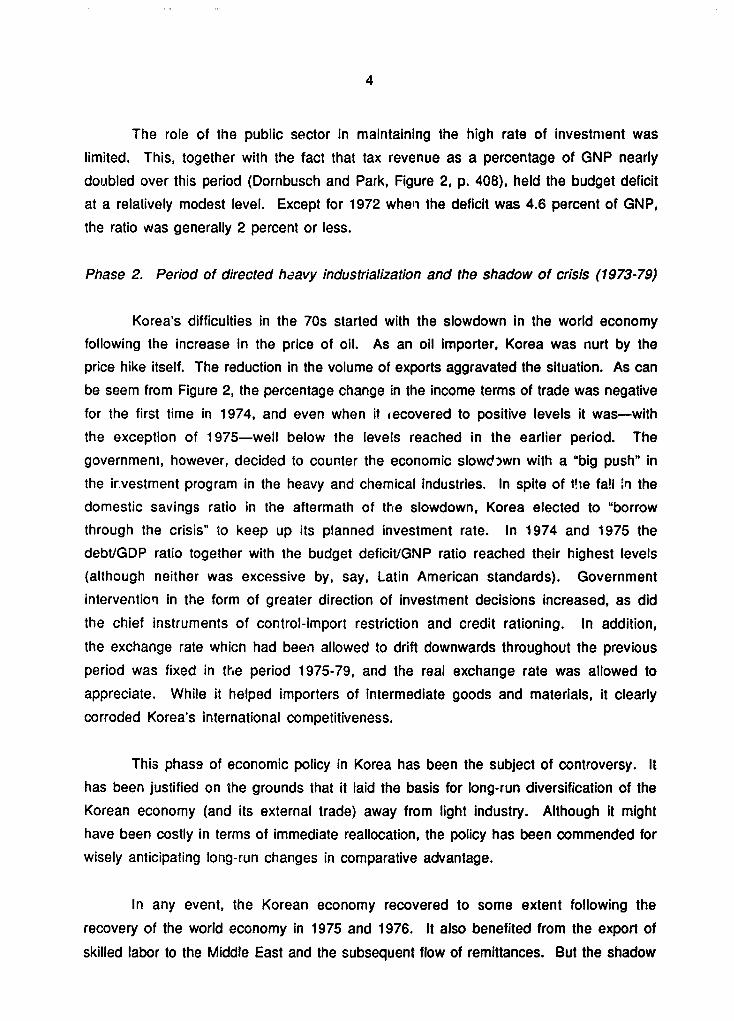
Phase 2. Period of directed heavy industrialization and the shadow of crisis (1973-79)
Korea's difficulties in the 70s started with the slowdown in the world economy
following the increase in the price of oil. As an oil importer, Korea was nurt by the
price hike itself. The reduction in the volume of exports aggravated the situation. As can
be seem from Figure 2, the percentage change in the income terms of trade was negative
for the first time in 1974, and even when it tecovered to positive levels it was-with
the exception of 1975-well below the levels reached in the earlier period. The
government, however, decided to counter the economic slowdcwn with a "big push" in
the irvestment program in the heavy and chemical industries. In spite of tie fa!l in the
domestic savings ratio in the aftermath of the slowdown, Korea elected to "borrow
through the crisis" to keep up its planned investment rate. In 1974 and 1975 the
debVGDP ratio together with the budget deficit/GNP ratio reached their highest levels
(although neither was excessive by, say, Latin American standards). Government
intervention in the form of greater direction of investment decisions increased, as did
the chief instruments of control-import restriction and credit rationing. In addition,
the exchange rate whicn had been allowed to drift downwards throughout the previous
period was fixed in the period 1975-79, and the real exchange rate was allowed to
appreciate. While it helped importers of intermediate goods and materials, it clearly
corroded Korea's international competitiveness.
This phass of economic policy in Korea has been the subject of controversy. It
has been justified on the grounds that it laid the basis for long-run diversification of the
Korean economy (and its external trade) away from light industry. Although it might
have been costly in terms of immediate reallocation, the policy has been commended for
wisely anticipating long-run changes in comparative advantage.
In any event, the Korean economy recovered to some extent following the
recovery of the world economy in 1975 and 1976. It also benefited from the export of
skilled labor to the Middle East and the subsequent flow of remittances. But the shadow

5
of a crisis which the events of this period generated lingered, leading to the majordepression at the end of the decade.
Phase 3. The Crisis and Adjustment (1979-82)
As in 1974, the second oil price hike triggered the depression with the barterterms of trade registering negative percentage changes in 1979, 1980 and 1981. Theannual rate of change of the income terms of trade was also negative in 1979 and 1980(figure 2). GDP growth rate fell and for the first time was negative in 1980. Asdomestic savings plunged, current account deficits mushroomed. External borrowingwas resorted to on a large scale. This was the period of the most rapid accumulation offoreign debt in Korean history. The debt/GNP ratio climbed from 32 to 53 percentduring these years-equalling the level of some Latin American borrowers, e.g. Brazil.Internal balance was also disrupted severely, inflation rates reaching levels well abovethose seen in the 60s and 70s (with the exception of the years of the previous crisis,1974-75) (Figure 4).
Figure 4
RATE OF URBAN AND RURAL INFLATION (Korea, 1966-88)35 -
30
25-
20
zw
5
0*
-5
12BS 1971 1975 1igas98
C3 URSAftINFt4LATION * RURAL INFLAMMO

6
As we shall see In more detail in the next section, even while Korea stepped up Its
external borrowing levels to record levels in response to the crisis following the secondoil shock, it had already started to take steps to increase Korea's competitiveness,particularly through wage and exchange rate policies. At the same time, further steps Inadjustment were taken In fiscal, monetary and industrial policies. The package of
policir3 had immediate effect in restoring internal and external balance. By the end of
1982, the rate of inflation and the current account deficit had been reduced drastically.
Phase 4. Recovery and Growth (1982-to date)
The rate of growth of GDP was negative only in 1980, but it was still low by
Korean standards in 1981 and 1982. The economic measures taken in these years,
however, prepared Korea for a strong positive response when world trade rebounded in1983-84. As can be seen from Figure 1, the growth rate of the economy increasedsubstantially. This also produced ai. increase in domestic savings, which helped to
reduce the deficit in the current account of the balance of payments. When a slowdown in
the world economy threatened to produce another dip in the growth rate in 1985, Koreacountered by substantial real depreciations of the exchange rate. But an important point
to note is that devaluation did not add fuel to the inflationary spiral as it seems to havedone in 1979-80. On the contrary, the achievement of internal balance sustained thelow rate of inflation attained at the end of 1982.
Since 1986, Korea has been experiencing a remarkable economic boom, with agrowth rate of 12 percent in each of these years 1986-88. As in earlier periods, the
boom has been fueled by a remarkable rate of growth of exports-which could, in its
turn, be traced to a variety of external factors, including the low and stable j,rice of oil,
the appreciation of the yen, and continued strong growth in the OECD economies. The
concern of the foreign debt which had loomed large in the early 80s has disappeared as
the current account surpluses generated by the export boom have been used to prepay
part of the liabilities.
Inflation had been kept under control until 1988, when it showed signs of
accelerating. The threat of incipient inflation is the product of new developments
particularly in the foreign exchange and labor n arkets. The liquidity influx from trade
surplus-together with capital inflows-threaten appreciation of the won beyond levels
which are considered "safe" from the point-of-view of external competitiveness. At the

7
same time, new developments in the labor market threatened to create wage inflation of akind which had not been seen so far in Korean history. Mu-, of this new set of problemsand concerns are outside the scope of this paper since we are mainly concerned withKorea's success in adjustment policies after the shocks of 1978-74 and 1979-80. Wewill, however, refer to the labor market developments of the late 80s insofar as it helpsa better understanding of Korean wage movements during the earlier periods of
adjustment.

8
11. The Characteristics of Korean Stabilization andAdjustment Policies
It is now well known that the myth that the Korean development process wasfueled by unregulated free markets is a false one. The goverrnment both during theregime of Park (who was assassinated in 1979) and subsequently played a determinedregulatory role. The package of policies involved both bringing about structuraladjustments in the economy and pushing thre !-h stabilization measures when theeconomy threatened to go off the rails due to exts4rnal and/or internal shocks. It is usefulto review the salient features of this package before we turn to a more det;.ileddiscussion of labor markets.
The major strategy in the industrialization of Korea has been the promotion ofexports. Exports as a percentage of GNP rose from less than 3 percent in the 1950s to15 percent in 1969 and to 35 percent in the early 80s. This, however, did not meanthat the domestic market was ignored-even for those industries, like textiles, which hadheavy involvement in exports. Korea's tariff system was dualistic. Importedintermediate inputs could be duty-free, but industries targeted for development weregranted tariff protection. When the export growth of textiles threatened to slow down,Korea embarked on the policy of "big-push" after the first oil crisis with a shift fromlight to heavy industry.
The major instruments of targeted industrial development were licensing andcredit policy. The Economic Planning Board (EPB) which was responsible for targetinghad control over licensing as well as credit. If a proposal originated from the privatesector, the EPB had to approve it, and if it complement .* she EPB's overall strategy,credit would be arranged by the Ministry of Finance. If, on the other hand, thegovernment took the initiative, the EPB would typically find a private firm to undertakethe project rather than set up a public enterprise.
Amsden points out: "Government control of credit differentiated Korean andJapanese development. The Japanese zaibatsu owned their own banks whereas theKorean chaebol did not... Direction of the economy was more centralized because powerover the purse was more centralized."2
2 Amsden, p. 5.

9
The central role of the state In credit for Industry was possible because offinancial repression. Although Korea has a less centrally controlled non-bank financial
sector as well as a curb market, the official banking sector has been dominant at leastuntil the 1980s. Generally, deposit rates were kept low-and were even sometimesnegative in real terms. The Implicit tax on depositors helped to channel resources intoinvestment in targeted areas, and to finance budget deficits in a non-inflationary way.3
Nowhere was control over financial flows more Important than in the oxternalcapital account. The government maintained tight control over foreign borrowing. Bothshort and iong-term borrowing required government approval. "But the repayments ofinterest and principal on loans (were) guaranteed by the banks owned or strictlycontrolled by the government or by the government its 5f."4 The governinent used
foreign borrowing for three purposes. First, it was used to bridge the gap between
domestic savings and investment, and thus maintain a rate of investment higher than
what would nave been possible from strictly domestic savings. Secondly, it was used
alonr' with the control over domestic credit to support the priorities of restructuring the
economy. Thirdly, and not the least important, use of borrowing was to tide over balance
of payments difficulties originating from internal or external shocks.
Along with many other economies, specialty, in Latin America, Korea had a rising
debt/GNP ratio throughout the period 1965-82, and also it increased strikingly in the
years of crisis, 1974-75 and 1979-80. But Korea managed to avoic the development of
the crises into prolonged difficulties which dampened long-run growth. In fact, in each
of the two cases of external shocks which Korea experienced as an oil importer, it took
no more than two or three years for the stabilization measures to be successful, the
debt/GNP ratio to fall and sustained growth to be resumed.
The effective control over the external flow of funds clearly helped. Unlike manycountries of Latin America, the crisis was not deepened by capital flight. The major
3 For more details, see Dornbosch and Park, pp. 417-19, and the references citedtherein.
4 Yung Chul Park in Wong and Krause, p. 226. Park makes the point that forpractical purposes, "there is no point in distinguishing private borrowing fromgovernrnrnt indebtedness."

1 0
difference with Latin America, however, was the substantially lower level of debt-
export ratio in Korea. In 1981 this was 76.6 while the major countries facing difficult
problems in the 80s-Argentina, Brazil, Chile or Mexico-had debt-export ratios that
were three to five times higher than Korea's. Thus in Korea, in the period 1980-83
debt servicing was below the level of exports, but In the Latin American countries It
exceaded exports by anywhere between 30 and 100 percent5
The maintenance of export growth has thus been as important for Korea's long-
term economic development as it has for successful response to the shocks. The factors
affecting external competitiveness are thus of central importance in the analysis of
Korean policies of adjustment and stabilization. The behavior of average wages,
particularly in the export oriented manufacturing sector, together with other factors
affecting unit labor costs, are the relevant issues to discuss in this connection. This is
the subject of the next section.
5 See Sachs, p. 533, Table 4 and pp. 532-35 for further discussion on the Asia-Latin America difference.

I 1
111. Determinants of Unit Labor Cost and WageBehavior In Korean Manufacturing
The central statistic to look at for external competitiveness of an economy is theunit labor cost of the exporting country in the international market. Thus It has tobe the unit labor cost expressed in, say, dollars.
We define
Uc = W/V 1/e ... (1)where Uc = unit labor cost in dollars
W = wages per workerV = value added per worker
e = the exchange rate (wons per dollar)
The three elements in determining unit labor cost in world prices are (i) wagebehavior, (ii) the changes in labor productivity, and (iii) the course of the exchangerate. To some extent these three factors are interconnected, but clearly all three need tobe analyzed for our purposes.
Korea has always followed an active exchange rate policy, together with thecontrol over external capital flows described above. As can be seen from Table 111.1, theexchange rate depreciated continuously between 1968 and 1975. There wereparticularly large depreciations during the crisis periods of 1971-72 and 1975. Thewon was fixed to the dollar between 1976 and 1979. But the active devaluation of thecurrency was resumed following the second oil crisis. There was a maxi-devaluation in1980 as after the first oil shock. We will be looking in greater detail below at theseepisodes of short-run adjustment.
The more or less continuous devaluation of the currency was necessary becauseinflation rates in Korea, as has been mentioned in Section I, has been persistently doubledigit (see Figure 4, p. 6) until the post-1982 period. There has been a correspondinglycontinuous pressure for the real exchange rate to increase which had to be countered bydevaluation to maintain competitiveness.

1 2
Devaluation has, however, not been always a successful measure to prevent the
real exchange rate from increasing in open economies like Korea which had to import alot of its materials and intermediate goods, including oil. The higher unit cost of imports
adds to the inflationary spiral. In the Korean case there is one additional route through
which devaluation could enhance the rate of inflation. Korean food policy has the dual
objective of supporting a high price for the farmer, and enabling consumers to buy at alower price (although still higher than world prices). The difference between the
buying and selling prices creates a deficit for the Grain Management Fund (GMF) whichis used to administer the policy. Apart trom domestic procurement, the government has
had to import a substantial amount of rice and barley to hold down selling prices. Thus
with devaluation, the deficit of the GMF increases. Although food prices are not directly
affected, the inflationary impact of the devaluation through an increase in the fiscaldeficit could be significant.
But as is apparent from the Figure 4, Korea, although walking on the inflationary
tightrope had never been faced with the problems of spiraling inflation. Inflation rates
jumped to rather high rates of 25-30 percent in both the periods of maxi-devaluation
(associated with the oil price shocks), but was brought down to moderate levels very
quickly-and rather spectacularly so in the 80s. The success story on this pointinvolves two main policy and economic responses. First, the budget deficit (and the
growth of money supply) was controlled. "The unified budget deficit, although swinging
widely, never reached 5 percent of GNP and never stayed very high for more than two
years in a row."6 Secondly, a crucial issue is that of the behavior of wages relative tolabor productivity.
Determinants of Unit Labor Cost
We can use equation (1) to derive the following relationship:
U'c = W - V - e-
= (w' + Pc) - (v' + P'p) - e
= (w' - v) + (Pc - Pp) - e- ... (2)
The dots represent proportionate rates of change.
The additional variables 3re defined as follows:
6 Dornbusch and Park, p. 414. See pp. 414-17 of this paper for furtherdiscussion of this point.

1 3
w = real wage (in terms of consumer goods)v = index of physical productivity of labor
PC = index of cost of livingPp = index of prices of manufactured goods
Equation (2) decomposes the percentage change in the unit labor cost into threeelements: the wage-productivity gap, the shift in the ratio of consumer to producerprices; and the change in the nominal exchange rate. The contribution of each factor tothe change in unit labor cost is given in Table 111.1. (The basic data are given forreference in the Annex Table A.2 ).7
The following points in the table are worthy of emphasis:
(i) The continuous depreciation of the exchange rate to which reference hasalready been made did not lead to an increase in the price of tradeablesrelative to the price of non-tradeables (as approximated by theproducers' price index relative to the cost of living index).8 Thus thedomestic real exchange rate generally moved against manufacturing andincreased the unit labor cost in most years. This is because devaluationdid not fully compensate for inflation. Nevertheless it moderated theimpact of inflation, and as we can see from the Table 111.1, the magnitudeof the upward pressure or; unit labor cost from this source was small.
(i i) In the years of crisis and stabilization policies, large devaluations as well
as a substantial negative wage-productivity gap helped in the reduction ofunit labor costs. This happened in all the three episodes of stabilization:first, in 1971 when the government acted to counteract a temporary
7 It should be noted that the wage series is really one of average earnings perworker-the annual wage bill dividing by the number employed. Basic wages as well assupplementary payments to labor are included in the wage bill.
8 Cereals, an important part of the CPI, although imported to some extent-arereally non-tradeables in Korea because of the administered price system operated by theGrain Management Fund. Thus a great deal of the consumer budget will be affectivelynon-tradeables.

1 4
Table 111.1 Annual Percentage Change In Unit Labor Costs and ItsComponents
Wage- Consumer-Producer Nominal Average Unit LaborProductivity Gap Price Differential Exchange Rate Costs (in US$)
Year (1) (2) (3) (4) = (1) + (2) - (3)
1968 -6.14 3.88 2.27 -4.521969 -7.25 3.69 4.16 -7.721970 -3.19 3.70 7.77 -7.271971 -16.80 8.65 11.78 -19.931972 3.63 -2.44 13.18 -11.981973 5.17 -8.78 1.38 -4.99
1974 9.47 -1.57 1.54 6.351975 -10.45 4.78 19.66 -25.341976 10.37 -0.95 0.00 9.421977 7.43 -0.65 0.00 6.781978 3.59 1.27 0.00 4.861979 17.01 -1.00 0.00 16.00
1980 -9.34 1.99 25.50 -32.861981 -16.14 7.58 12.12 -20.68
1982 0.30 2.25 7.35 -4.801983 -5.65 0.58 6.11 -11.181984 -1.59 1.56 3.90 -3.931985 2.97 0.05 7.95 -4.921986 -2.47 -1.39 1.31 -5.17
Averages1967-73 -4.40 1.43 6.66 -9.631973-79 6.58 0.29 3.30 3.571979-81 -12.60 4.90 18.62 -26.321981-86 -1.21 0.60 5.28 -5.89
Source: "Principal Economic Indicators," Statistics Department, Bank of Korea(CPI and exchange rate)IFS Yearbook, IMF (deflator)
Industrial Statistics Yearbook, UN (wage bill and value added)

1 5
slowdown in exports; second, in 1975 following the first oil price shock;and thirdly, during the "comprehensive" stabilization plan of 1980-81.
(iii) The average figures given for the three periods 1967-73, 1973-79, and1980 to date show clearly the different trends in unit labor costsassociated with varying performances of the economy. They also help usto quantify the relative importance of the wage-productivity gap and theexchange rate movements in accounting for movements in unit labor cuts(in dollars).
During the first period of export expansion unit labor costs declined at asubstantial annual rate of 9.6 percent per annum. It can be seen that the depreciation ofthe nominal exchange rate contributed as much as the excess of productivity growth overwage growth, to the decline of ULC, in spite of an adverse movement of domestic realexchange rate. The problem years after the first oil shock and the "big push" reversedthe trend in unit labor costs. It is seen that its sharp increase in the period 1973-79was largely due to the adverse wage-productivity gap. Although the exchange rate wasdevalued sharply in 1975, it will be recalled that Korea went to a fixed rate for the restof the 70s. This policy was abandoned following the second oil shock. The experience ofthe two years of adjustment-1980 and 1981-shows the large contribution ofdevaluation-rather 50 percent more than the negative wage-productivity gap-to thereduction of ULC. But the negative wage productivity gap was substantial, so that theULC decline was massive-offset only slightly by the increase in domestic real exchangerate. The continued decline of ULC until 1986-which was instrumental in therecovery-was again due more to nominal devaluation than to the negative wage-productivity gap, although the latter contributed significantly to it.
Wage-productivity Trends
We conclude that the behavior of wages relative to productivity has been ofcrucial importance both in the periods of Korean growth and the short periods ofstabilization. In developing countries with a large farming sector, it is tempting toassume a la Lewis that the negative wage-productivity gap which has been observed isdue to an elastic supply of labor at a constant real wage, while productivity growth in themodern sector is significant due to exogenous technological progress-thus leading to afall in unit labor costs over time. But the Korean story is different. As can be seen from

1 6
Figure 5, and Table A.1, real wage growth was more than 5 percent per annumthroughout the 20-year period we have been considering, except in a few selected years.As it happens, these exceptional years were precisely the years of Korean stabilizationpolicies-1971-72, 1975 and 1980-81. Of these, only in the last was real wagegrowth neyative, but it fell by less than 5 percent. For most of the period, of course, thepositive reai wage growth was well above 5 percent.
The sustained and substantial rate of increase in labor productivity thus emergesas a critical variable in the success of achieving a continuous reduction in unit laborcosts despite the continuous devaluation of the currency. The productivity growth wassufficient to counter the rising import costs produced by the devaluation as well aspermit a significant growth of real wages. In the crisis years all or more of the increasein productivity went into the reduction of unit labor costs while real wage growth wastemporarily halted.
The importance of productivity growth for the stability of the economy is alsorelevant for another reason-that of preventing the emergency of inflationary
expectations. We have seen that until after the stabilization of 1980-81 Koreaninflation rate has been double-digit and very high in short bursts. Yet the economynever degenerated into a dangerous spiral of rising wages and prices. Stabilizationefforts in most countries generally need a period of stagnation or even decline in realwages. Often this wage effect is produced by an abnormal increase in the rate ofinflation. The success of the effect depends on the subsequent behavior of wages as theyare affected by inflationary expectations of workers. In many developing countries,
particularly in Latin America, inflationary expectations have been explosive. Periods ofreal wage stability or decline have been followed by spiraling increases in wages andprices, leading to erosion of international competitiveness, as workers seek to defend
their real wage unsuccessfully through accelerating money wage increases. In an
economy like that of Korea, productivity growth has sustained a significant rate of realwage growth over many years. Thus the workers' confidence in the viability of the
economy in improving their standard of living is continuously reinforced. It is easier
for them to accept temporary real wage restraint (or even decline) without demandingmoney wage increases which feed an explosive inflationary spiral.
While the investment rate in Korea was high, the sustained growth in labor
productivity was, to a large extent, due to the growth of total factor productivity.

1 7
FMGURE 5. REAL VALUE ADDED AND WAGES(onhuot figures per worker. 198S0-0o)
1710
'60
ISO
140
130
120)
110
go90
soL - 73assa3l
80
50
40
50
6. 68 69 70 71 72 73 74 75 76 77 78 79 80 81 32 s3 84 as 86
Q Value Added | Wages
Source: UN Y"rbook of tndustrial Statistics"Principal Economic tadicators", Ban of rorma
,1

1 8
Nishlmuzu and Robinson showed that, over the period in the 60s and 70s, Korea's TFPgrowth at 3.7 percent per annum was by far the highest of the countries covered.9 Theincreasing efficiency in the use of both capital and labor allowed Korea a safe margin fo.
increase in real wages without eating into profitability.
Wage Determination in Korean Manufacturing
The increase in productivity made it possible for wages to increase. But why didit actually do so at the sustained rate that it did? What was the mechanism ofdetermining wages in industry?
For the period covered in this study, before the late 80s, the influence of unionson wage levels was minimal. The right to strike was banned by presidential decree in1971. Unions did exist in large firms, particularly in the textiles, metalworking and
chemical sectors. But they needed prior permission from the government for collective
bargaining. Earnings function studies have found no significant effect of unions onrelative wages.10
Wage guidelines for both white and blue collar workers are specified from timeto time by the Federation of Korean Industries (FKI) as well as by the Federation of
Korean Trade Unions (FKTU). The former is dominated t. the chaebol, while theinfluence of government on the latter has been recognized for some time. The
government's own influence was used to support wage restraint, as during thestabilization period of 1980-81, as well as to ensure that the workers received a share
of productivity gains in the years of sustained growth.1 1
9 It was 1.3 percent per annum in Turkey, 0.5 percent in Yugoslavia and 2 percentin Japan.
I 0 Cf. for example, Su-ll Park, Part 3.
11 Very recently, in 1988-89, the Korean government has shown a newcommitment to a less interventionist policy vis-a-vis labor markets. The impact onindependent wage bargaining was immediate. After two successive years of double-digitnominal wage increase, the FKTU was asking for a 27 percent wage increase in thespring negotiations of 1989. This was countered by the FKI's offer of a wage increase inthe range of 8.9-12.9 percent depending on the sector. The government suggested thatnominal wage increases should be no higher than real productivity gains. But as shownby continuing labor unrest, including large-scale strikes, this informal Incomes policyis experiencing real difficulty in implementation.

1 9
In fact, with or without government encouragement, Korean industry showedstrong predilections towards a profit-sharing system of remuneration. The basic wageconstituted no more than 75 percent of total monthly earnings in the early 70s andseems to have fallen to 70 percent in the 80s.12 Overtime pay and annual bonuses-bothof which are related to business conditions and profitability-constitute the rest.Secondly, the industrial firms, particularly the larger ones seem to have formed theinternal labor market structure. The level of starting wages in Korea is predominantlydetermined by the worker's formal schooling and sex, regardless of job content.13 Thisbasic wage rises on an almost regular basis by certain fixed amounts-the so-called"annual base-up." This "base-up" is directly related to the length of service in thecompany, and is not necessarily associated with any promotion in job status. Promotiontakes the form of skipping several "base-ups." One econometric study found that "inthe case of male workers, one year of "inside" experience (with the same employer)tended to raise wages on average by about 10 percent, whereas one year of outsideexperience (with a different employer) raised them by an average of only about 3.8percent."1 4
With a strong mechanism of rewarding firm-specific skills in place, clearly amajor incentive for efficiency would be the sharing of the gains of productivity increasewith the workers. The question might be asked: what is the exact nature of firm-specific skills which were being rewarded?
Amsden makes the point that Korea depended heavily on imported technology-andhad little experience in these technologies with the possible exception of textiles."Korean managers could never hope to manage in a tight, "Taylorist" top-down fashion,at least not initially, because no one at the top knew enough about the process (of
The domestic change in the labor market scene after the government movedtowards a "hands-off' policy underlines the importance of its impact on wage behaviorthrough the previous periods of Korean development.
1 2 Funkoo Park, Table 17, p. 38 based on the Ministry of Labor's Occupational WageSurvey.
1 3 This account follows Su-ll Park, Chapter V.
14 Amsden (1990), p. 88 quoting Lee (1983).

20
production) to do so. Under these conditions, it was imperative to rely upon motivated
workers, even If they possessed little more than formal schooling, to exercise the most
fundamental skill of all-intelligence."15 This was particularly so because the demands
of an export-oriented strategy were quite severe on the maintenance of product quality.
A profit-sharing model of wage determination could explain the observed
increase in real wage-at a rate a little below productivity growth in the period before
1974 and again after the adjustment of 1980-81. The successful wage repression of
1971, 1975 and 1980-81, which contributed strongly to the stabilization effort, has
the hallmark of state paternalism in wage setting.
The question still might be asked: why did wages increase significantly faster
than productivity in the period of "big push" in the second half of the 70s? The answer
is probably that the high optimism of the state driven investments towards
diversification was one of the factors. The other was the tightness of the labor market
caused not only by the "big push," but also the rather sudden and substantial emigration
of Korean workers to the Middle East, to help in the latter's post-oil construction boom.
As can be seen from Table A.1 the unemployment rate fell to an historic low in
1978. It might be mentioned that the unemployment rate touched this low again in
1986, and fell even lower in 1987 and 1988. As already pointed out, the events of the
last few years have created a new situation in the Korean labor market. The wage
explosion, which is still underway, is as much due to the tightness of the labor market,
as to the less paternalistic role of the government in wage determination, and the
emergence of union activism as a powerful force.
An attempt was made to test these points with an econometric model of wage
determination. Our model was the usual augmented Phillips curve together with an
element to capture the profit-sharing aspect. It is hypothesized that workers have a
target real wage in any period which is governed by the productivity growth of a
previous period. If the percentage increase in real wage falls short of the percentage
increase in productivity of the earlier period, then there is additional upward pressure
on money wages. It should be noted that the mechanism of the target wage could percolate
15 Amsden (1990), p. 89.

21
through the decision of workers or of employers or of both. The model would thus looklike the following:
W t = a + b P e + c Ut - x + d(v t . y - w t - y) *---(3)
where W t G percentage change in money wage in the current period;
Pe = expected rate of inflation;Ut - x = unemployment rate x periods before;
v t - y = percentage increase in productivity y periods before
w t - y = percentage increase in real wages y periods before.
The values of x and y are found by the best fit of the model to the data.
The model was estimated with quarterly data for the period 1970.3-1988.3.The results are given in Table 111.2. The expected inflation rate is approximated by the
rate of increase in the CPI in the previous period. (It could also be interpreted as
representing workers' effort to recapture lost real wages as a result of fast inflation).In the first equation reported in Table 111.2, we get a reasonably good fit with all thevariables having the right sign and strong significance.
The second equation increases thu R2 substantially without reducing the
significance of the explanatory variables significantly. The extra term DNOMAW(-4) isthe percentage change in money wages since four quarters before the present. Theinclusion of the variable increases the R2 by so much because there is a strong seasonal
pattern in the money wage series.16 17
The footnotes to the table define the variables. The fitted equations support ourhypothesis strongly. Both the rate of unemployment and the target real wage based on
actual productivity increase enter the process of wage determination.
1 6 In particular, average earnings in the fourth quarter of each year are bumped upas workers are paid their annual bonus.
1 7 Note that the variable TARGET (-2) in Table 111.2 can be broken down into ratesof growth of money wages, prices, and productivity, all lagged two periods. When wetried productivity only without the lagged wage and price indices, the estimated equationperformed less well, with a smaller R2 and greatly reduced significance of the TARGETvariable.

22
Table 111.2 Determinants of Percentage Changes In Nominal Wages1970-1988, Quarterly Data
Regression Analysis (OLS Estimates)
DurbinAdjusted Watson
Constant DCPI(-1) LER Target(-2) DNOMAW(-4) R-squared Statistic F-Statistic
0.135 0.869 -0.028 0.214 -.- 0.519 2.24 25.8
(5.87) (4.05) (-5.23) (4.51)0.070 0.478 -0.016 0.097 0.59 0.695 2.24 40.3(3.30) (2.62) (-3.39) (2.30) (6.25)
DNOMAW: Percentage change in nominal monthly earnings per regular employeein manufacturing, averaged for each quarter
DCPI(-1): Inflation rate lagged one quarter.
UER: Unemployment rate.
TARGET(-2): Difference between growth in productivity and growth in real wages.The variable is lagged two quarters.
DNOMAW(-4): The dependent variable lagged four quarters.
Periods covered by both regressions go from the second quarter of 1971 to the thirdquarter of 1988 (70 observations). Figures in parentheses are t-statistics.

23
IV. The Structure of Korean Labor Markets andWage Dlfferentials
The discussion on wages and productivity in Section III referred to the formalmanufacturing sector. The coverage of the datd was limited to wage employees in firmsemploying more than 10 workers. A great deal of employment in Korea has always beenin the informal sector.
The size of the informal sector employment could be estimated by comparing twosources of employment data: the Economically Active Population Survey (EAPS),Economic Planning Board, which estimates total employment on the basis of a householdsurvey and the Actual Labor Conditions at Establishment (ALCE), Ministry of Labor,which estimates employment on the basis of a survey of establishments above a certainemployment size.18
Unfortunately, the ALCE excludes public sector employment from its estimates.Thus, the comparison has to be limited to the "production sector' of the economy-agriculture, mining, manufacturing and construction. A comparison for 1979 showsthat practically the whole of the 5 million employed in the agriculture sector and a thirdof the 3 million in manufacturing were in the informal sector. Furthermore, a specialcensus of the "commerce" sector (wholesale and retail trade, hotels and restaurants)for 1979 also revealed that 90 percent of the 1.3 million people were in establishmentsemploying less than ten workers.19 The agricultural sector has been declining overtime, but the trends in employment in the informal component of the secondary andtertiary sector are not very clear. Likewise, data deficiency does not allow one toanalyze trends in earnings in all parts of the informal economy. But it is possible toexamine some specific aspects of the earnings difference between the formal and theinformal sectors which appear to be important. These include (i) the farm/non-farmdifferential; (ii) differentiation in earnings by size of firm within the manufacturingsector; and (iii) the male/female differential. In what follows we shall be concernedwith behavior of the earnings differences over the long period of the structural
18 Five or more workers until 1979 and ten or more workers after 1980.
"9 Lindauer, Table 18, p. 72 and p. 73, last paragraph.

24
transformation of the Korean economy, as well as the short-run behavior during theperiods of stabilization and adjustment following the oil price shocks.
Farm/Non-farm Differential
Korean data sources allow us to compare average annual farm incomes withannual earnings in manufacturing or with the average income of urban salary and/orwage earners. (The sample of salary earners includes white collar workers).Alternatively, we can compare real daily farm wages with real daily earnings inmanufacturing. Because of the small number of wage eamners in agriculture relative tofarm-operators, the analysis of relative farm earnings is more significant. The seriesare graphed in Figure 6. The actual data and discussion of sources are given in AnnexTable A.5 It it seen that in the period of expansion, 1966 to the first oil crisis of 1973,farm incomes per earner increased at only a slightly slower rate than average earningsin manufacturing. The differential in favor of manufacturing increased somewhat toabout 50 percent at the end of the period. The urban wage earner's household income perearner was significantly higher.20 But over the pe"iod the rate of growth of householdincome was substantially lower than that of farm income, so that the differential wassqueezed.
After the stabilization efforts following the oil crisis, urban earnings stagnatedfor a couple of years. Manufacturing earnings had a very low growth only in 1975, buturban wage earners' income seems to have fallen before this, both in 1973 and 1674.The slowdown of the economy, however, had no impact on the growth of income in thefarm sector. The rural/urban earnings difference definitely fell in this period ofadjustment.
Earnings in the non-farm sector took a sharp upward turn during the period ofthe "big push' in the second half of the 70s. We have seen above in Section II that realwages in manufacturing increased at a rapid rate-above the rate of growth of laborproductivity. It is apparent from Figure 6 that the income per earnings in urbanhouseholds went up even faster. The average income of urban salaried householdsincreased much faster than that of wage earners indicating the increased lightness in the
20 This may be due to (a) the exclusion from the sample of single member urbanhouseholds who would presumably have low earnings, and (b) the inclusion ofsupplementary incomes from other sources in the family income.

figure 6
REAL ANNUAL INCOME PER EARNEROY EARNER TYPE. 1966-85
4-
3.5
3
2.5
2 -
1.5
1
0.5
196B 1970 1974 1978 1982
LEGENDtI FARM 1 4ANUF 0 UjA ARY A URa WAGE
(WUSEROLD) (NOUSEHOLD)

26
market for white collar labor. Farm incomes per worker increased by about the same
absolute amount per year as in the previous period, so that the rate of growth slowed
down. The period of the "big push" then widened the rural/urban wage differential by a
substantial amount. In 1979 manufacturing wages were 80 percent higher than farmingearnings and urban wage earners' income 100 percent higher.
As in the first episode of stabilization, urban earnings in the period following the
second oil shock fell, while farm earnings continued to grow at much the same rate. Therural/urban differential fell, but not by enough to restore it to the levels of the early
70s. Since 1982 rural and urban earnings have increased at a rather similar rate. The
widening of the differential in favor of urban wage earners which took place in the late
70s seems to have been a permanent one.
It has been maintained that the comparison of average incomes, particularly after
the stabilization program of the eighties, may be giving too favorable a picture for the
farm sector. The deficit in the Grain Management Fund-which, as we have seen,
supported the prices paid to farmers above the prices of cereals sold to consumers-wasdrastically (educed as part of the stabilization package in the years following 1981. The
slowing down in the rate of inflation clearly helped the process of deficit reduction, butit has been suggested that the terms of trade for the farming population did deteriorate.
Amsden believes that such a deterioration was mainly responsible for the mass exodus
between 1982 and 1985 out of agriculture-"even larger than the migration associated
with the 1980 harvest failure.21 Moreover, "the last wave of migrants was believed to
consist of relatively older people, unequipped to enter the labor force and unaccounted
for in the unemployment statistics which, therefore, were lower than otherwise."22
The outmigration from agriculture might, indeed, have prevented the rural-urban
differential from increasing further in favor of the urban sector in the post 1981
period. Also the earnings distribution within the farm sector might have deteriorated (a
point on which there is no statistical information). In any case, taken in conjunctionwith the point established that the earnings differential in favor of urban workers was at
a higher level in the 80s than it was in the early 70s, the discussion does imply that the
21 Amsden, p. 36.
22 Amsden, p. 36.

27
farming sector did suffer a relative deprivation after the boom of the late 70s and the
subsequent adjustment of the economy.
Wage Difference by Size of Firms
The difference in labor earnings between the informal and the formal sectors in
the non-farm economy is of major interest in the history of Korean development.Unfortunately, the absence of comparable household surveys over a period of time does
not allow us to look at trends in differentials for too many subsectors. Information does
exist, however, on wage difference by size groups of firms in manufacturing. The wagelevels in small firms could be expected to approximate levels of earnings in the informal
sector. Thus a study of wage difference by size of firms is of interest.
It has been well-known to students of the Korean economy for some time that the
government policies which led to export oriented industrialization also produced a
dualism in the manufacturing sector. "While government policy towards domesticmarket-oriented small-scale industry has been characterized by benign neglect oractive discrimination, export/large scale sector has enjoyed considerable advantagesfrom the government through direct and indirect subsidies."23
A central role in this process of differentiations was played by credit policy. Thepreferential interest rate on export credit was reduced to 6 percent in June 1967 while
the ordinary bank rate was set in 1965 at 26 percent. In addition, the exporting firms
enjoyed a string of preferences in import licenses, tax concessions and favorable tariff
rates for imported inputs. "These subsidies were disproportionately favorable to large-
scale industries. In 1974, only 6 percent of small- or medium-scale industries (less
than 200 en,ployees) were designated by government as "export lndustries.t
Government export subsidies were also scaled according to export volume andperformance."24
23 Su II Park, p. 57. See Chapter II of this work for an extended discussion of theissues summarized here.
24 Ibid., p. 61.

28
Korean industry was also encouraged to adopt state-of-the-art technologydeveloped in the high Income countries, to enable It to cater to the needs of the worldmarkets. This led to the adoption of capital intensive technology-a trend abetted by thelow cost of loanable funds. Further, the recently designed technology of mass productionfavors large scale operations to reap the benefits of machine specialization. Thus,successive plants, in the exports industries in Korea, have been designed for
increasingly large-scale production.
The difference in technology and labor productivity between large and smallfirms are associated with large differences in wages. To some extent the observeddifference in average earnings per worker reflect differences in skil! composition. But,as we shall see, even for a relatively homogeneous group like production workers whoare dominated by the semi-skilled, very large wage differentials exist. An element ofprofit-sharing clearly enters into the high wages paid by large firms who have such
high labor productivity. As already mentioned in Section III, the importance of labor
unions, in the determination of wages was relatively small. On the other hand, there isconsiderable evidence of employer paternalism, mixed in with incentives for efficiencyand low turnover, in the setting of wages at high levels in the large firms. It will be
recalled, in particular, that basic wages account for only a part of total earnings inKorea. Various allowances and annt zI special earnings bonuses are a substantial
component of earnings, and this proportion seems to increase sharply with firm size(see below).
Table IV.1 gives the evolution of employment, output and labor productivity by
firm size between 1960 and 1982. Note that the definitions of small, medium and large
firms are different in 1960 and 1963 from the definitions for later years. The datashow the enormous importance of firms with less than 100 employees (small and
medium categories in the table) in the early sixties. The "small" (employing less than
30 workers) employed 45 percent of the workers and produced a third of gross output.Value added per worker in the small firms was half of that in the large firms, and in the
medium firms it was two-thirds of the large.
A major change seems to have taken place between 1969 and 1975. The largefirms expanded fast at the expense of the small, the share of the latter dipping from 32
to 17 percent in terms of employment, and from 17 to 8 percent in terms of gross

29
output. At the same time, the difference In value added per worker narrowed markedly(from 14 percent of the level in large firms in 1969 to 40 percent In 1975).
The shocks of the mid-70s and the early 80s seem to have arrested the fastrelative expansion of large firms. This, in spite of the "big push" of the 1975-79period. The proportion of employment in large firms fell from 62 to 55 percent. The
Table IV.1 Technology, Size and Productivity Differentials In ManufacturingEstablishments
No. of Employees Gross Output Value Added Fixed AssetsYear (% of Total) (% of Total) per Worker Index per Worker Index
1960:Small 45.2 36.9 59.4 n/aMedium 22.4 20.4 67.8 n/aLarge 32.3 42.6 100.0 n/a
1963Small 42.0 31.5 46.3 n/aMedium 23.0 22.9 66.8 n/aLarge 34.9 45.5 100.0 n/a
1969Small 31.6 16.6 14.2 16.6Medium 20.1 15.0 19.8 43.2Large 48.2 68.3 100.0 100.0
1975Small 17.4 8.3 40.5 18.6Medium 20.2 15.7 69.6 35.4Large 62.3 75.8 100.0 100.0
1980Small 18.3 8.1 42.5 19.8Medium 22.7 15.6 61.1 42.4Large 58.9 76.1 100.0 100.0
1982Small 21.4 9.1 37.2 22.7Medium 23.3 17.1 57.1 39.5Large 55.1 73.6 100.0 100.0
Note: For the years 1960 and 1963, Small - 5-29, Medium = 30-99, and Large , 100+For the years 1969, 1975, 1980 and 1982, Small = 5-49, Medium = 50-199, andLarge = 200+
Source- Report on Mining and Manufacturing Survey

30
difference in value added per worker, however, might have widened somewhat, reflectingperhaps rationalization and weeding out of less efficient firms in the large scale sector.
Thus, while the Korean experience supports tne a priori model of a shrinkage ofthe large firm sector during the periods of adjustment with the "slack" taken up bysmall firms, the changes are not nearly as dramatic in the difficult period of 1975-82compared to the expansionary phase of 1969-75.
Turning to the differential in earnings by size of firm in manufacturing, TableIV.2 gives the differentials in average earnings. These data show a substantial increase
in the differential, particularly with respect to small firms during the decade of the60s. The trend was reversed in the seventies, both in the years leading up to the firstoil crisis, and subsequently during the period of the "big push." By the end of the 70sthe small-large differential was about the same level as in 1960. But the second oil
crisis and the adjustment of the 80's saw again a widening of the differential--but to asmaller extent than in the 60s.
Table IV.2 Differentials In Average Remuneration by Firm SizeIn South Korean Manufacturing
1 960-1 986
Large/Small Medium/Small Large/MediumYear (Small = 100) (Small = 100) (Medium = 100)
1960 136.5 99.9 136.61967 155.7 126.9 122.71970 180.9 147.6 122.61974 152.4 129.3 117.81979 130.1 115.9 112.31983 147.6 120.3 122.71986 149.0 119.4 124.8
Note: Small firms are defined as having 5-49 workers; medium, 50-199, and large, 200 ormore workers.
Source: Korea--Statistical Yearbooks (1962, 1976, 1981, 1985 and Reports on Mining andManufacturing Surveys for 1967 and 1970.

31
Table. IV.3 Earnings Differentials by Size of Firm, Sex, Occupation andEducational Level of Workers In Korean Industries
1967 and 1980
(Base - 100, Firms with 10-29 Workers in each Category)
University Middle or ElementaryFirm Size Graduate School Graduate(No. of workers) Male Female Male Female
1967 1980 1967 1980 1967 1980 1967 1980
10-29 100.0 100.0 100.0 100.0 100.0 100.0 100.0 100.030-99 117.6 103.4 88.5 88.7 113.0 105.1 107.3 98.2100-299 131.7 111.3 126.5 109.3 124.3 125.2 124.0 103.6300-499 149.2 112.1 99.9 101.5 157.4 131.7 132.5 104.7500+ 171.0 113.6 96.4 119.0 1 201.9 133.4 163.3 107.9
Note: For 1967, firm size ranges from 100 to 199 (instead of 1980 range that goes from 100 to299); and from 200 to 499 (in 1980, it ranges from 300 to 499). Therefore, comparisonsbetween these two groups should take into account this fact. The category for male andfemale with middle school and under for 1967 refers to production workers.
Source: Report on Wage Survey, 1967, the Bank of Korea, Table 2, pp. 50-65.
Report on Occupational Wage Survey, Administration of Labour Affairs, 1980, Vol. I,Tables 111.4 and 111.5, pp. 336-461.
The data of Table IV.2 do not control for skill, education and skill differences.
When we do control for such differences, as is done in Table IV.3, it is seen that there is
a significant decline in the differentials in 1980 compared to the levels of 1967 except
perhaps for female university graduates. Taken together with the evidence of Table IV.2,
we could conclude that there has, indeed, been an accentuation of dualism within the
manufacturing sector of Korea before 1971. But this process was reversed in the next
decade. It was threatening re-establishing itself again in the early 80s. It would be
very interesting to see, when more recent data are available, if the wage explosion of the
late 80s has contributed substantially to the accentuation of dualism.
Male-Female Differences
Table IV.4 gives the participation rates of males and females, separately for farm
and non-farm households. It is seen that the participation rate for females in farm
households does not show much of a trend. But the rate in non-farm households, although

32
well below the rate in farm households, has been slowly increasing over the period(with small cyclical dips in 1981 and 1985). But the increase in non-farmparticipation has by no means been spectacular. The process of development generally isaccompanied by substantial increases In female participation arising both from thesupply and demand sides. On the supply side important factors helping the process are
Table IV.4: Labor Force Participation Rates, by Sex (percentage)
Farm Households Non-Farm Households
Male Female All Male Female All
1970 75.2 48.2 60.9 75.1 29.8 51.51975 73.8 51.8 62.7 75.1 31.2 52.51976 74.5 55.3 64.8 74.7 33.7 53.31977 74.3 52.5 63.3 76.9 33.5 54.01 978 74.5 54.0 63.9 75.3 35.6 54.61 979 73.5 54.2 63.6 74.4 35.9 54.41980 72.4 53.0 62.5 74.2 36.1 54.41 981 72.1 53.4 62.6 73.7 35.4 53.81982 70.4 53.6 61.9 73.4 37.5 54.71 983 68.7 51.3 59.8 71.8 37.9 54.21 984 68.8 50.1 59.3 69.6 36.1 52.21985 68.9 50.7 59.7 69.8 37.7 53.1
Source: Economically Active Population Survey, reproduced from Grootaert, Table 2,p. 5
rising levels of education, reduced fertility and a general change in attitudes to marketwork on the part of women. The educational expansion in Korea seems to have benefitedwomen as much as men. The average years of schooling of women has risen from 2.92
years in 1960 to 6.63 years in 1980 (as against the overall average of 3.86 and7.61).25 At the same time fertility levels have declined drastically (by more than halfin the last twenty years) reducing the number of small children at home. This wouldtend to increase market activity for married females. On the demand side,industrialization and the growth of urban services-social and private-create
opportunities for female employment. What makes the Korean case unusual is that inspite of the presence of these factors at levels above those for other developing countries
25 Ibid., p. 6.

33
the non-farm participation rate for females is, after two decades of development, well
below those of other countries.26
Institutional changes facilitating greater participation of women in the non-farm
workforce have been slow In coming. Grootaert points out that part-time work Is not
very common for women in Korea-only about 7-8 percent working 35 hours or less
per week. In fact, the distribution of workers by hours worked showed little difference
between men and women, except that men do more overtime work (more than 54 hours a
week).27 Evidently Korean employers have not taken the initiative in developing the
market for jobs in clerical, sales and assembly line production work which can be easily
split into two part-time jobs. Grootaert also points out that there has been limited
government effort in establishing public day-care centers, and there have been various
restrictions on private sector initiatives.
Turning to the composition of female employment in the non-farm sector, the
time series for the proportion of female employment by industry and by occupation are
given in Tables IV.5 and IV.6, respectively. As far as mining and manufacturing are
concerned, the percentage of women workers increased at a modest but steady rate until
1980 and has declined somewhat since. Thare was, however, a decline in the crisis
years following the first oil shock in 1974 and 1975. Thus, there is evidence that the
proportion of women in manufacturing employment responds significantly to cyclical
demand factors.
The increase of less than 10 percentage points in the share of female employment
in industry must, however, be considered rather marginal compared to the large shifts
in the industrial structure of the economy in the twenty-year period. Much more
pronounced growth of female employment is seen in the occupations categories in Table
IV.7. This is particularly so in the clerical and service categories where the proportion
of women in total employment has been doubled.
26 Even the neighborirg countries of Asia had significantly higher rates. 49.7 forHong Kong, 48.9 for Japan, 45.8 for Singapore and a high of 78.4 for Thailand. USA andCanada has rates of around 52 percent (Grootaert, p. 6, quoting the ILO Yearbook for1 984).
27 Grootaert, Table 10, p. 15.

34
It has, however, been noticed that the increase in female employment in these
white collar categories has been confined to narrow low-income groups. 'Clearly
clerical work has undergone a major and rapid image shift from a male to a female
occupation... More than 80 percent of the clerical workforce below 25 (in 1984) are
women; the clerical workforce above age 35 is 95 percent male."2 8 In the service
categories there is evidence of severe "crowding" of women into two sub groups-viz.
teachers and "medical, dental and veterinary personnel." In the "administrative and
managerial" category only 2.9 percent are women-far below the proportion in other
East Asian countries.2 9
Table IV.5 Evolution of Female Employment by Industry(Women Workers as a Percent of Total)
Year Agriculture Mining & Manufacturing Construction Services
1963 37.98 27.89 8.81 32.261964 37.97 29.57 3.83 32.081965 38.32 28.03 4.62 34.301966 38.84 29.46 3.35 31.791967 39.28 30.76 3.86 32.351968 40.22 31.75 6.01 34.221969 39.01 32.76 8.01 33.591970 41.62 31.18 1.76 34.671 971 41.82 33.40 2.59 34.271972 42.95 33.09 2.30 32.901973 42.13 37.78 2.96 34.671974 41.51 35.31 5.11 35.591975 41.53 33.55 4.89 35.911 976 42.64 37.59 4.91 37.331977 41.59 37.99 7.84 35.121978 44.10 38.39 7.67 36.561979 44.57 38.52 7.66 37.541980 43.77 38.05 8.56 38.231981 43.66 37.72 7.89 38.431982 43.74 37.30 6.98 41.011983 43.16 37.10 6.99 42.131984 42.72 36.49 7.42 41.43
Source: Economic Planning Board: Year Book of Labor Statistics
28 Grootaert, p. 20.
29 The percentages are 13.1 in Hong Kong, 6.1 in Japan, 17.4 in S;ngapore and19.8 in Thailand. (Grootaert, Table 14, p. 22, citing ILO sources).

35
Table IV.6 Evolution of Female Employment by Occupation(Women Workers as a Percent of Total)
Products & EquipmentYear Professional Clerical Sales Service Agriculture Operations
1963 21.46 11.28 44.81 19.83 38.08 19.831964 19.18 10.20 45.52 20.64 38.00 20.641965 18.03 10.03 46.21 20.06 38.38 20.061966 16.73 9.85 43.97 22.21 38.67 22.211967 16.14 11.63 42.77 23.61 39.37 23.611968 16.25 17.00 44.25 24.38 40.35 24.381969 15.57 13.81 42.95 25.09 39.30 25.091970 18.40 13.54 42.70 57.70 42.36 23.351971 19.43 16.55 41.25 23.72 41.92 23.721972 16.45 16.79 42.10 22.81 42.93 22.811973 19.11 17.83 42.08 27.88 41.99 27.881974 19.90 19.39 41.67 26.92 41.43 26.921975 20.86 20.88 40.72 57.38 41.41 25.841976 20.56 23.08 43.03 58.44 42.57 29.961977 22.53 24.47 41.60 54.38 41.61 29.921978 25.08 27.67 42.21 56.14 44.17 29.161979 26.34 30.60 43.41 56.27 44.62 29.021980 25.34 32.75 43.72 58.12 43.83 27.731981 23.54 33.62 44.21 57.72 43.82 26.681982 26.64 34.12 45.96 58.18 44.00 27.101983 26.67 34.21 47.35 59.99 43.38 27.891984 27.16 33.58 46.82 60.72 42.99 26.99
Source: Economic Planning Board, Year Book of Labour Statistics.This survey covers all individuals 14+ except armed forces, foreigners and prisoners.
Another aspect of the differential conditions of empioyment by sex Is revealed bylooking at the changes in employment by work steaus. The employed labor force isclassified into self-employed workers, family workers and employees. The distinctionbetween the first two is important for work status. A self-employed person could be asmall entrepreneur, and often has earnings above wages eamed by employees. A familyworker, on the other hand, is a working unpaid member of the household. One of the
most striking developments in Korea is that in 1984 nearly 80 percent of familyworkers in the mining and manufacturing sector were females. Between 1976 and 1984the proportion of females among employees remained unchanged. But the proportion offemales among family workers went up from 65 to 80 percent, while the female's share

36
in the self-employed category was drastically reduced by half to 26 percent.3 0
Evidently, during the period of the "big push" and the subsequent adjustment there wasa sharp drop in the role of women as entrepreneurs.
Another feature of Korean labor markets is that within employees there are threecategories, regular, temporary and daily workers. We have referred earlier to theImportance of internal labor markets in Korean manufacturing. Because of the securityof tenure and access to bonuses and other benefits which internal labor markets imply,Korean employers use a large proportion of the workforce on temporary or dailycontracts. This gives flexibility to the size of the workforce and lowers the cost of labor,particularly when there is a decline in business conditions. Table IV.8 gives the seriesfor the three categories of workers, separately for men and women for ti.e period 1963-85. It is seen that the proportion of regulars among male workers has increasedsubstantially, with only a dip between 1972 and 1975. But for female the proportion in1985 was about the same as in 1968. The percentage of regulars among females seemsto have fallen significantly both after the first oil shock in 1973-75 and following thesecond period of stabil;wation in the early 80s. It is only known that regulars are betterpaid than temporaries, partly because they have claims to bonuses and some fringebenefits which the latter do not, and also the conditions of employment (eg. security oftenure) are better for the regulars. Evidently, women workers have been used in amore "marginal" way in the last two decades.
30 Grootaert, p. 27. and Table 18.

37
Table IV.7: Percent Distribution of Total Employment by Sex and Status(Non-farm Households)
Males FemalesRegular Temporary Daily Regular Temporary Daily
Year Employees Employees Workers Employee Employees Workers
1963 49.6 17.6 32.6 34.6 2e.6 38.6
1964 48.6 20.4 30.8 32.0 34.0 33.8
1965 51.4 20.7 27.7 35.2 36.4 28.3
1966 55.3 17.4 27.2 39.3 30.0 30.6
1967 57.5 17.4 25.0 45.7 23.2 30.9
1968 62.9 14.5 22.4 49.0 22.5 28.4
1969 65.7 11.3 22.8 55.3 20.1 24.5
1970 68.8 11.8 19.2 57.9 22.1 19.8
1971 69.2 11.3 19.4 55.2 23.9 20.8
1972 62.4 12.6 24.8 52.0 26.7 21.1
1973 56.5 19.7 23.7 44.7 34.5 20.7
1974 62.3 17.0 20.5 46.7 33.3 19.8
1975 60.9 19.5 19.4 48.3 33.9 17.6
1977 64.9 15.6 19.3 54.9 26.1 18.8
1973 68.3 13.8 17.8 57.7 24.9 17.2
1980 71.5 12.1 16.2 58.5 24.6 16.7
1982 73.7 10.8 15.3 62.3 21.5 16.0
1984 71.9 14.7 13.2 50.6 30.5 18.7
1985 72.3 14.9 12.8 48.8 30.4 20.8
Source: Economic Planning Board; Yearbook of Labour Statistics (The survey is basedon the population aged 14 and over and not in the army, imprisoned, or foreigners.
Turning to earnings, the trend in the female/male differential for differenteducational groups is plotted in Figure 7. It seems that while university and collegeeducated females have improved their relative earnings since 1970 (although stillearning a little more than 70 percent of the male average), the bulk of the femaleworkers with high or middle level schooling have more or less the same relativeearnings as in the early 70s. There might have been a trend towards the reduction of the

38
gender differential for this group (particularly the high school graduates) In the "big
push" period of the late 70s, but this gain has been lost in the 80s.

39
Figure 7
SOUTH KOREA: FEMALE/MALE EARNINGS RATIOby level of education 1970-84
0.74-
0.72 -
0.7-
0.68 -
0.66 -
0.64 -
0.62-
0.6
0.58-
0.56
0.54
0.52
0.5
0.48
70 74 75 77 80 81 82 83 84
a University , Junior O High , MidCollege School School
Source: Occupational Wage Survey
Note: The survey is based on a random sample of establishmentsemploying 10 or more regular employees, excluding agri-culture, forestry, fishing, government administration,public education, army and police.

40
Conclusion
This paper has investigated the successful adjustment to external shocks of anopen economy with heavy dependence on key imports. In the Korean case, themacroeconomic problem, as we have seen, was accentuated by a high investment ratemaintained throughout the growth process of the last two decades. The rate of Investmentcontinuously outrunning the rate of domestic savings kept the economy walking on atightrope of external deficits on the current account as well as internal inflationarypressures for much of this period. Maintenance of external competitiveness was ofcentral importance to an export-oriented economy.
The evidence shows that an active exchange rate policy (continuous devaluation ofthe won except for a few years in the late 70s, and maxi devaluations in the periods of"shock") has been central to the mechanism which kept unit labor costs in dollarsfalling throughout the period. But the success of devaluation in producing the desiredresult depended on policies affecting both the capital and labor markets. In the capitalmarkets, the maintenance of cheap credit for the large scale sector cushioned theexporting firms from the rising costs of interest pavments and imported inputs whichdevaluation induced. Equally important was the tight government control of externalcapital flows which prevented destabilizing speculative movements of capital.
On the labor market front, the evidence shows the importance of statepaternalism in wage negotiations in the formal sector in keeping real wage increases inline with productivity growth, but somewhat below it in most periods (again with theexception of the period of the 'big push"). It was also eminently successful indrastically slowing down or even halting real wage growth during the short-run periodsof crisis. But the wage-productivity relationship behaved in the healthy way it didbecause real wages increased significantly in most years. This experience must havebeen instrumental both in securing worker acquiescence to the temporary stagnation ofwages and in preventing destabilizing inflationary expectations from developing.
The critical factor here was the strongly positive time trend in total factorproductivity growth. It is this which kept the rate of real wage growth high, at the sametime that the unit labor cost in industry was falling.

4 1
Real wages in the large-scale manufacturing sector in Korea have "risen faster,possibly than in any previous or contemporary Industrial revolution."31 It wassuggested in our analysis that the major factor behind this real wage growth was most
likely profit-sharing as an incentive scheme in the process of wage determination. The
internal labor market structure of the large firms in Korean manufacturing encouraged
this process, as did state paternalism. We would expect that in large segments of the
labor market, outside the large firms the mechanisms of the internal labor markets
would be weak, and wages would be lower in these segments and would rise less fast.
This is, indeed, what has been suggested by earlier writers. For example, Amsdenwrites: "By world standards, Korea has the highest inter-manufacturing industry wage
dispersion and the widest gap in gross wages between the sexes (Krueger and Summers,
1986; Jong Woo Lee, 1983). Underlying the rapid rise in real wages beginning in
1965 was the preening of a labor aristocracy: male, employed by the chaebol, in thenew heavy Industries. At the opposite end of the spectrum is the economically activepopulation in the informal sector."32
The absence of comprehensive household surveys in Korea precluded theinvestigation of formal-informal earnings differentials in large parts of the labormarket. But we are able to look at a limited range of wage differentials. Earnings in thefarm sector did not perform all that badly vis-a-vis average earnings in the non-farm
or urban sectors. Up to the first oil shock of 1973 annual farm incomes per workerincreased at only a slightly lower rate than the average earnings in manufacturing. But
during the "big push" of the late 70s the differential in favor of manufacturing wages
increased from 50 to 80 percent, and although it fell somewhat after the adjustment
following the second oil shock, it was in the mid-eighties well above the earlier levels.
Analysis of gross wage differentials by firm size within the formal sector (i.e.,excluding very small firms employing less than 10 workers) shows very largedifferences in average earnings. The differential in favor of large firms increased to a
high point of 81 percent in 1970, but then declined to 30 percent in 1979. It increased
again in the early 80s, and might have gone up much more sharply with the wage
explosion in the large scale sector. Comparing wage differences between more
31 Amsden, 1990, p. 79.
32 Amsden, 1987, p. 4.

42
homogeneous categories of labor, it Is seen that the differential which, was about 100
percent in 1967 (for male middle or elementary school graduates), fell to 33 percent in
1980. At the same time, the large scale sector seems to have taken the main brunt of
short-run adjustment following the oil shocks. Wages stagnated In this sector for short
periods after the adjustment, and the relative expansion of the large firms at the expense
of the small, which was going on rapidly until 1973, seems to have been halted in the
next decade.
Amsden suggested that "not only Korea set world records with its growth rate in
wages, it also has outcompeted other countries in its discrimination against women
workers."3 3 In section IV, we found evidence of surprisingly small increases in
participation rates of females in the non-farm sectors; severe occupational crowding; a
larger proportion of females in lower status jobs like "temporaries" or 'family
workers," and more or less constant wage differential in favor of male workers,
maintained over the years.. Average earnings of female workers with high or middle
school education were 52 percent of the earnings of males with similar education. As is
to be expected, females seem to have been disproportionately affected during the post-
shock periods of sharp adjustment.
While Korea's record in solving some of these structural problems in the labor
market has not been very good, her astonishing success in managing the short-run
macro-economic balance in the economy may also be threatened in the future. A full
analysis of contemporary developments in the labor market is beyond the scope of this
paper. But we should, in concluding, draw attention to the explosive increases in wages
in manufacturing since 1987. This type of wage push, emanating from a breakdown of
the traditional relationship between the Korean Federation of Trade Unions and that of
Employers, threatens to upset the wage-productivity balance which, we have seen, has
been a key to the success of Korea's macro-economic stability. If wages go soaring above
productivity growth, Korea's share of the export market relative to her close
competitors will undoubtedly be threatened, and in addition, there will be the threat of
inflationary spiral, and perhaps the need for much more painful adjustments when
external shocks develop in the future. "A recent study of manufacturing unit labor costs
found that between 1980 and 1986 Taiwan's ULC rose 56% relative to Korea's. In
33 Amsden, 1990, p. 85.

43
1987 and 1988 the two economies' ULCs increased at the same rate. It was only in thefirst quarter of 1989 that Korea's ULC began to increase relative to Taiwan."34 Theconcem of the coming years is how much and in what way is Korea able to contain thesenew developments in the labor market. The other significant question Is Korea's abilityto sustain--if not to increase--the record rate of total factor productivity growth which
she has achieved In the last two decades or more.
34 Quoted in World Bank (1989), p. 7.

44
References
Amsden, Alice, Republic of Korea, Country Study No. 14 in the "Project on Stabilizationand Adjustment Policies and Programs," World Institute for DevelopmentEconomic Research, Helsinki, 1987.
Amsden, Alice, uSouth Korea's Record Wage Rates: Labor in Late Industrialization,"Industrial Relations, Vol. 29., No. 1, 1990.
Collins, Susan and Won Am Park, "External Debt and Macroeconomic Performance inSouth Korea," National Bureau of Economic Research, October 1987.
Grootaert, C. "The Labor Force Participation of Women in the Republic of Korea:Evaluation of Policy Issues," Internal Discussion Paper, Asia RegionalSeries, World Bank, May 1987.
Hong, Wontack and Krause, Lawrence B., (ed.) Trade and Growth of the AdvancedDeveloping Countries In the Pacific Basin, Korean DevelopmentInstitute, Seoul. 1981.
Krueger, A. and L.H. Summers, "Reflections on the Inter-Industry Wage Structure,"Harvard Institute of Economic Research, Discussion Paper No. 1252,July 1986.
Lee, Jong Woo, "Economic Development and Wage Inequality in Korea," Unpublished
Ph.D. dissertation, Harvard University, 1983.
Lindauer, David "Labor Market Behavior in the Republic of Korea," World BankStaff Working Paper, No. 641, July 1984.
Nishimuzu, M. and Robinson, S., "Trade Policies and Productivity Change in Semi-Industrialized Countries," Journal of Development Economics,1984, Vol. 16, 1-2, 177-206.

45
Park, Funker and Castaneda, Torsacio, "Structural Adjustment and the Role of the LaborMarket," Korean Development Institute, Working Paper No. 8705, May1987.
Park, Se-li, Wages in Korea: "Determination of the Wage Levels and the Wage Structurein a Dualistic Labor Market," Unpublished Ph.D. dissertation, CornellUniversity, 1980.
Sachs, Jeffrey, "External Debt and Macroeconomic Performance In Latin America andEast Asia," Brookings Papers on Economic Activity, 2, 523-573, 1985.
World Bank, "Korea: Country Economic Memorandum," Paper No. 7920-KO,Washington, D.C., October 1989.

47
ANNEX

48
Table A.1 South Korea: Major Economle Indicators
GNP Current Exports Budget Unemploy-Growth Account Growth Deficit ment rate
Year (%) (% GNP) (%) (% GNP) (%)
1967 6.60 -4.12 28.00 -. 6.21968 11.30 -7.49 42.20 -.- 5.11969 13.80 -7.76 36.9gu -.- 4.81970 7.60 -7.35 34.00 1.60 4.51971 8.60 -9.38 27.90 2.30 4.51972 5.10 -3.56 52.10 4.60 4.51973 13.20 -2.28 98.60 1.60 4.01974 8.10 -13.05 38.30 4.00 4.11975 6.40 -9.05 13.90 4.60 4.11976 13.10 -1.09 51.80 2.90 3.91977 9.80 0.03 30.20 2.60 3.81978 9.80 -2.17 26.50 2.50 3.21979 7.20 -6.43 18.40 1.40 3.81980 -3.70 -9.56 16.30 3.20 5.21981 5.90 -7.21 21.40 4.70 4.51982 7.20 -3.91 2.80 4.40 4.31983 12.60 -2.07 11.90 1.60 4.11984 9.30 -1.62 19.60 1.40 3.81985 7.00 -1.01 3.50 1.00 4.01986 12.90 4.39 14.60 1.80 3.81987 12.80 7.39 36.20 -. - 3.11988 12.20 7.84 28.40 . 2.5
Source: Statistics Department, The Bank of Korea, 'Principal Economic Indicatorse (GNP andexports growth, 1988 GNP growth rate is preliminary).
Bank of Korea, Economic Statistics Yearbook.

49
Table A.2 South Korea: Net Barter and Income Terms of Trade
Net Barter Income Terms Per Cent ChangeYear Terms of Trade Barter Income
1980=1001963 111.48 1.211964 112.83 1.88 1.21 55.601965 114.87 3.36 1.81 78.391966 128.15 4.91 11.57 46.411967 132.85 6.23 3.66 26.801968 138.06 8.93 3.92 43.311969 133.27 12.40 -3.47 38.891970 134.19 16.06 0.69 29.451971 133.08 20.57 -0.82 28.091972 132.35 30.76 -0.55 49.561973 125.62 45.82 -5.08 48.971974 101.31 40.73 -19.35 -11.121 975 92.10 45.10 -9.09 10.741976 105.10 69.90 14.12 54.991 977 112.40 89.00 6.95 27.321978 117.80 106.70 4.80 19.891979 115.30 103.40 -2.12 -3.091980 100.00 100.00 -13.27 -3.291981 97.90 115.C0 -2.10 15.001982 102.20 127.90 4.39 11.221983 103.10 150.00 0.88 17.281984 105.30 177.10 2.13 18.071985 105.90 191.70 0.57 8.241986 114.70 234.70 8.31 22.431987 118.08 296.94 2.95 26.521988 121.36 344.87 2.78 16.14
Note: Net barter terms of trade are defined as the ratio of export to import unit value index.Income terms of trade are defined as the product of the net barter terms of trade and theexport quantum index.

50
Table A.3 South Korea: Debt Ratios
DebVGNP Debt/Exports
1970 23.48 144.351971 28.42 158.691972 30.76 143.841973 29.00 95.211974 33.00 95.571975 31.12 110.281976 28.30 85.821977 38.39 109.911978 34.59 100.891979 35.45 117.181980 52.97 130.571981 51.21 120.981982 55.11 131.651983 52.09 133.031984 49.70 125.101985 53.76 142.451986 44.46 111.351987 30.35 71.921988 14.94 38.06
Source: On-Line Woiid Development Debt Service.
Note: Total external debt equals public, publicly guaranteed, private non-guaranteed,IMF credit, short term debt, outstanding and disbursed.

51
Table A.4 South Korea: Data Used for Unit Labor Costs In Manufacturing
Annual Annual Manuf. AverageValue Wages Deflator CPI ExchangeAdded (billion 1980= 1 980= Rate
Year (billion wons) wons) 100 100 (won/$)
1967 206.6 53.3 17.1 15.3 270.51968 300.1 76.6 18.3 17.0 276.71969 424.2 105.7 19.9 19.1 288.21970 547.9 137.1 22.3 22.2 310.61971 688.6 160.4 23.4 25.2 347.21972 899.3 211.5 26.7 28.1 392.91973 1379.6 310.3 29.9 29.0 398.31974 1867.2 451.3 37.7 36.1 404.51975 2828.1 651.6 45.4 45.2 484.01976 4075.1 1009.1 52.8 52.1 484.01977 5596.9 1460.4 58.5 57.4 484.01978 8193.0 2221.8 66.2 65.7 484.01979 9205.0 2922.1 78.9 77.7 484.01980 11857.0 3471.7 100.0 100.0 607.41981 15412.0 4133.5 113.7 121.3 681.01982 17306.0 4754.1 119.4 130.1 731.11983 20912.0 5499.6 122.8 134.5 775.81984 24656.0 6495.1 123.7 137.6 806.01985 26737.0 7244.5 126.7 141.0 870.01986 32882.0 8607.3 131.3 144.2 881.5
Source: UN Yearbook of Industrial Statistics.IMF International Financial Statistics.Bank of Korea.

52
Table A.5 (a): Annual Earnings per Worker In the Farming andManufacturing Sectors
Real Annual per Worker Real Annual ManufacturingFarm Income Eai nings
1980 Won (% Change 1980 Won (% ChangeYear (thousands) per Annum) (thousands) per Annum)
1966 400 4671967 426 6.4 520 11.11968 474 11.2 593 14.019969 518 9.2 707 19.21970 537 3.7 787 11.31971 660 22.9 826 5.01972 688 4.2 858 3.81973 735 6.8 924 7.8
1966-73Average 555 11.9 710 13.9
1974 785 6.7 1004 8.61975 822 4.7 1018 1.41976 876 6.5 1190 16.81977 964 10.1 1446 21.41978 1004 4.1 1696 17.3
1974-78Average 890 6.9 1271 17.2
1979 1072 6.7 1845 8.71980 1081 0.8 1760 -4.61981 1152 6.5 1742 -0.91982 1232 6.9 1864 6.91983 1292 4.8 2023 8.51984 1490 15.3 2138 5.71985 1579 5.9 2294 7.2
1979-85Average 1271 7.8 1952 4.0

53
Table A.5 (b): Annual Household Income per Earner for Urban Households
Annual Real Household Income per Earner
Salary Earner Households Wage Eamer Households1980 Won (% Change 1980 Won (% Change
Year (thousands) per Annum) (thousands) per Annum)1966 1316 6811967 1569 19.2 981 44.11968 1615 2.9 1006 2.41969 1609 -0.4 1038 3.21970 1562 -2.8 975 -6.01971 1652 5.7 1041 6.71972 1685 1.9 1073 3.01973 1690 0.2 1046 -2.5
1966-73Average 1587 4.0 980 7.6
1974 1806 6.8 990 -5.31975 1873 3.7 1052 6.21976 2428 29.6 1146 8.91977 2932 20.7 1427 24.51978 3284 12.0 1851 29.6
1974-78Average 2465 20.4 1293 21.7
1979 3507 6.7 2058 11.11980 3684 5.0 1985 -3.51981 3646 -1.0 2006 1.01982 3568 -2.1 1787 -10.91983 3760 5.3 1938 8.41984 3962 5.3 2074 7.0
1979-84Average 3388 -16.6 1975 -16.6

54
Note cn the data
Data on daily farm wages and incomes were collected from the Korean NationalAgricultural Cooperative's monthly report. These same figures are reported in theStatistical Yearbook published by the Economic Planning Board. Census years were 1975and 1970, all other years are based on sample surveys. The survey is carried out by theMin'stry of Agriculture and Fisheries and is based on a sample of farm households engagedprimarily in farming and cultivating a plot of land more than 0.1 hectare. The survey isconducted monthly and revised after censuses. Income includes agricultural receipts,side-business receipts, non-business receipts (wages, rent, etc.) and property (assets)receipts less farm and side business expenses. Daily farm wages are also reported inthese documents. Here, men's daily wages (cash and in kind) are shown for all workers.
The price index used to deflate farm incomes was the prices paid by farmersindex, reported in "he same documents. These prices are collected at 85 rural marketscovering 201 items.
Farm income was normalized to per worker farm income by dividing total farmincome (including income from non-farm sources) by the number of farm workers.
Data on manufacturing earnings were extracted from the Statistics Yearbookpublished by the Economic Planning Board. These statistics are collected by the Ministryof Labour in a Monthly Wage Survey. The survey covers all manufacturingestablishments with 10 or more employees. The earnings reported are the averagemonthly earnings of all (men and women) regular employees. Regular workers are thosewhose term of employment contract are one month or more, and who worked for morethan 45 days during the three months prior to the reporting day. Monthly earningsinclude overtime pay, bonus pay and base pay.
The deflator used to estimate real earnings for manufacturing and urban householdincomes was the all cities consumer price index. This is reported in the EconomicPlanning Board's Statistics Yearbook. Average price data are collected three times amonth at 9 principal cities including Seoul on 394 commodities and services. Up until1965, the city consumer price index survey was carried out in Seoul alone.

55
Urban incomes data was also taken from the Statistics Yearbook. This data is based
on the Family Income and Expenditure Survey conducted by the Economic Planning Board
each month. The survey covers all households residing in one of Korea's 50 cities,
excluding farmer' households, fishing households, single person households, foreign
households and households whose income and expenditure are not easily Identified. Income
includes earnings, Income from subsidiary jobs and other income.

PRE Working Paper Series
ContactAuthor QLa
WPS528 Monetary Policy Instruments for Gerard Caprio, Jr. October 1990 W. Pitayatona-Developing Countries Patrick Honohan karn
37666
WPS529 The Sectoral Structure of Poverty Monika Huppi October 1990 C. SpoonerDuring An Adjustment Period: Martin Ravallion 30464Evidence for Indonesia in theMid-1980s
WPS530 The Menu Approach to Developing Asli Demirguc-Kunt November 1990 S. King-WatsonCountry External Debt: An Analysis Ishac Diwan 31047of Commercial Banks' Choice Behavior
WPS531 The World Bank's Role in Shaping Fred T. Sai November 1990 L. Bruce-DiggsThird World Population Policy Lauren A. Chester 31091
WPS532 Privatization in Turkey Sven B. Kjellstrom November 1990 T. Nana-Sinkan36026
WPS533 Government Revenue from Alberto Giovannini November 1990 A. BhallaFinancial Repression Martha de Melo 37699
WPS534 Risk Facing U.S. Commercial Banks Menahem Prywes November 1990 J. Israel31285
WPS535 Shared Investment in General Eliakim Katz November 1990 V. CharlesTraining: The Role of Information Adrian Ziderman 33651
WPS536 The Link Between Poverty and Maurice Schfff November 1990 S. FallonMalnutrition: A Household Theoretic Alberto Valo6s 37947Approach
WPS537 Commodity Exports and Real Income Arvind Panagariya November 1990 S. Fallonin Africa Maurice Schiff 37947
WPS538 Agricultural Reform in Developing Avishay Braverman November 1990 C. SpoonerCountries: Reflections for Eastern J. Luis Guasch 30464Europe
WPS539 Maternal Health in Jamaica: Health Chris Naschak Feifer November 1990 L. Bruce-DiggsNeeds, Services, and Utilization 31091
WPS540 Venture Capital Operations and Silvia SagariTheir Potential Role in LDC Markets Gabriela Guidotti
WPS541 Pricing Average Price Options for the Stijn Claessens November 1990 S. King-Watson1990 Mexican and Venezuelan Sweder van Wijnbergen 31047Recapture Clauses
PRE Working Paper Series
ContactALhboor paoer
WPS542 The Metals Price Boom of 1987-89: Boum.Jong Choe November 1990 S. LipscombThe Role of Supply Disruptions and 33718Stock Changes
WPS543 Development Assistance Gone Donald B. Keesing November 1990 S. FallonWrong: Why Support Services Have Andrew Singer 37947Failed to Expand Exports
WPS544 How Support Services Can Expand Donald B. Keesing November 1990 S. FallonManufactured Exports: New Andrew Singer 37947Methods of Assistance
WPS545 Health and Development: What Nancy Birdsall November 1990 L. MitchellCan Research Contribute? 38589
WPS546 The Transition to Export-Led Growth Stephan Haggard November 1990 E. Khinein South Korea, 1954-66 Byung-Kook Kim 39361
Chung-in Moon
WPS547 Does High Technology Matter? An Andrea Boltho November 1990 M. HilemanApplication to United States Regional Robert King 31284Growth
WPS548 Deposit Insurance in Developing Samuel H. Talley November 1990 M. PomeroyCountries Ignacio Mas 37666
WPS549 Intertemporal Substitution in a Patricio Arrau December 1990 S. King-WatsonMonetary Framework: Evidence 31047from Chile and Mexico
WPS550 Firms' Responses to Relative Price John L Newman December 1990 A. MurphyChanges in C6te d'lvoire: The Victor Lavy 33750Implications for Export Subsidies Raoul Salomonand Devaluations Philippe de Vreyer
WPS551 Australia's Antidumping Experience Gary Banks December 1990 N. Artis37947
WPS552 Selected World Bank Poverty Nancy Gillespie December 1990 M. AbieraStudies: A Summary of Approaches, 31262Coverage, and Findings
WPS553 Money, Inflation, and Deficit in Egypt Marcelo Giugale December 1990 V. IsraelHinh T. Dinh 36097
WPS554 Korea's Labor Markets Under Dipak Mazumdar December 1990 M. SchreierStructural Adjustment 36432