Embed Size (px)
Citation preview
oineymedal
Knob-Twiddling to Answer Questionsabout Textile Wet Processing Chemicalsand ProcessesBy Keith R. Beck. Olney Medalist, North Carolina State University
I N T R O D U C T I O N
Behind the colors and functions of textile matenals that we usein everyday life lies a tremendous amount of chemistry To de-velop dyeing and finishing chemicals and to improve the pro-cesses by which they are applied, it is necessary to analyze thosematerials- Such analyses involve many different instrumentaltechniques. In this paper, the focus wiil be pnmanly on spec-troscopy (i.e., nuclear magnetic resonance (NMR), mass spec-trometry (MS), near infrared (NIR), and ultraviolet-visible (UV-Vis) spectroscopy) and chromatography (i.e., gaschromatography (GC) and high-performance liquid chromatog-raphy (HPLC)). Before computers were developed and adaptedto control these instruments, many of the adjustments weremade by turning knobs. Over the past 35 years, the power ofthese instruments to answer textile wet-processing questions(e.g., "What is it?" and "How much of it is there^") has in-creased tremendously With data answenng these fundamen-tal questions, it is possible to improve textile wet processes andchemicals. Examples of some of these knob-twiddling investi-gations are given in this paper with a focus on durable-pressfinishing and dyebath monitoring.
N I R S P E C T H O S C O P Y
NIR spectroscopy is an excellent tool for answenng both quali-tative and quantitative questions, especially for fiber identifi-
A B S T R A C T
For three decades, we have used analytical instruments to investigate im-portant chemicals and their effects in textile wet processing. High-per-formance liquid chromatography (HPLC), gas chromatography/mass spec-trometry (GC/MS), and C -NMR (carbon-13 nuclear magnetic resonance)spectroscopy provided valuable information about durable press reagentcomposition and effects in the bath and on the fabric. We used liquid COas a dry cleaning solvent and supercritical CO, for extrartion of waxes fromcotton and for dyeing polyester. To monitor dye exhaustion, we devel-oped direct dyebath monitoring, flow injection analysis (FIA), and sequen-tial injection analysis (SIA) systems. Coupling FIA and HPLC allowed us tosimultaneously monitor exhaustion and hydrolysis of reactive dyes in realtime. This paper will address three questions: "What is it?" "How muchis there?" and "What is happening to it in the process?"
Key Terms
AnalysisDyeingInstrumentationProcessing
DECEMBER 2OD6
cation and blend analysis, it is a non-destructive secondaryanalytical technique (i.e., the instrument must be trained usingdata from a primary technique, which requires little or nosample preparation.) Howell and Davis' developed a simple NIRlibrary that could be used to identify cotton, rayon, nylon, poly-ester, acrylic, polypropylene, and wool fibers. Those sevenclasses of fibers were expanded to include acetate, modacrylic,poly{vinyl alcohol), poly(vinyl chlonde), silk, triacetate, para-ara-mid (Kevlar), and mefa-aramid (Nomex).^ Cotton was not dif-ferentiated from linen and nylon fibers could not be classifiedaccording to dyeability in this study It was, however, possibleto differentiate among the 29, 49, and 129 grades of Kevlarby NIR.
Very early work by Tincher and Luk showed that NIR was anexcellent tool for anaiysis of polyester/cotton blends in yarns,^In recent AATCC committee work, we have revisited this ques-tion: calibration models were developed from a training set of265 polyester/cotton fabrics and those models were validatedby predicting the percent polyester in 35 fabrics of known com-position.'' The NIR-lab polyester content results agreed to within±5.0% for over 90% of the validation samples. The use of sec-ond derivative spectra and standard normal variate (SNV) nor-malization minimized the impact of baseline effects and of fab-ric color and patterns.
C A R B O N D I O X I D E : S O L V E N T A N D
P R O C E S S I N G F L U I D
Another "How much?" question was answered usingsupercritical carbon dioxide (CO2). For many years, the amountof organic-soluble matter in greige fabncs was determined bySoxhlet extraction into 1,1,1-trichloroethane (TCE)- Usingsupercritical CO^ at various pressures and temperatures, the waxcontent of greige cotton fabncs was determined.^ The goal ofthis particular work was to develop an extraction method thatdid not use a halogenated solvent. We found that a smallamount of ethanol acted either as a co-solvent for the wax ordisrupted the hydrogen bonds in the cotton cellulose; all of thewax could be removed by supercritical CO2 extraction with anefficiency comparable to TCE Soxhlet extraction.
As is often the case in science, experience with thesupercritical fluid extractor led to its reconfiguration to help usanswer questions for another project. Exhaust dyeing of poly-ester in water is typically effected at 130C with disperse dyes.As part of a large project to determine if polyester could betechnically and economically dyed in supercritical CO^, it wasnecessary to determine two important characteristics of dispersedyes: their solubility as a function of temperature and pressure,
www.AATCC.ORG
35
oineymedal
HO'
HO OH
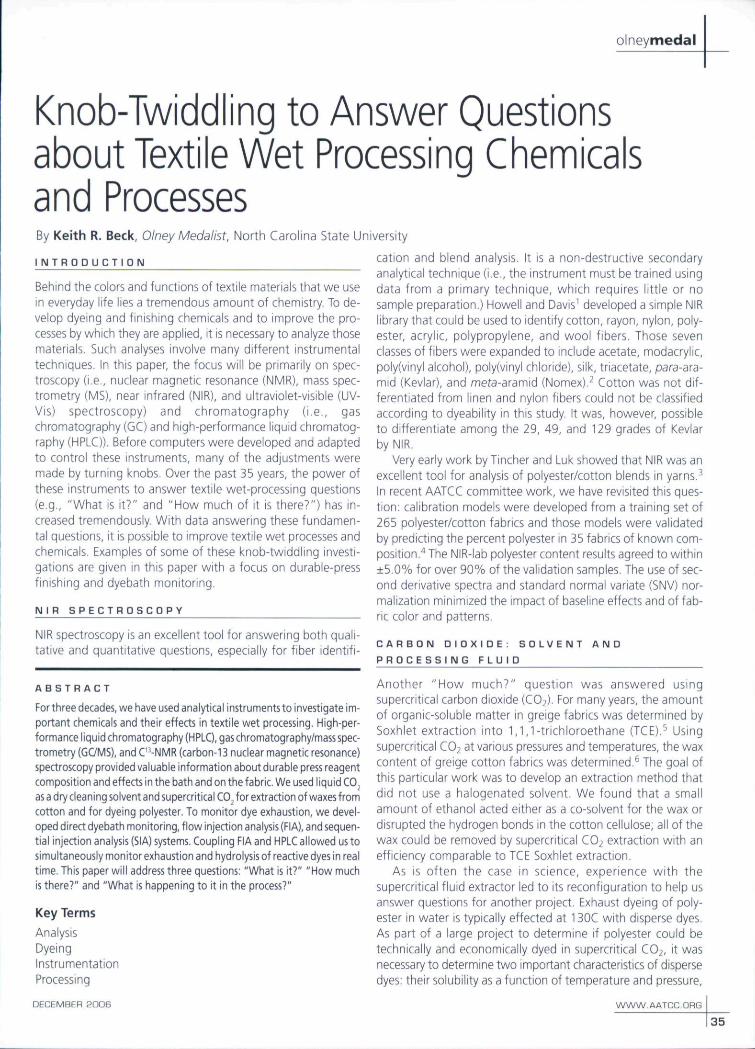
Fig. 1. Structure of DMDHEU.
36
and their affinity for poiyester insupercritical CO2. Using a modi-fied supercriticai fiuid extractor,we measured the soiubiiity be-havior of severai disperse dyes.''This information was criticai indesigning a dyeing process thatprevented surface deposition ofthe dye during depressunzation.
In the late 1990s, there was tremendous interest in devel-oping alternatives to perchloroethyiene as a drydeaning soivent.Cleaning processes invoiving iiquid CO2 were being developed.Littie was known about the fastness properties of dyes in CO2.Sampies of commonly drycieaned fabrics (triacetate, acetate,siik, rayon, poiyester, and wool), each dyed with 10 differentdyes, were prepared and subjected to liquid CO2 in a labora-tory machine, a pilot-scaie CO2 cleaning machine in Germany,and in a commercial CO2 drydeaning machine. Resuits indicatedthat aii of the dyed fabrics except triacetate exhibited goodfastness (DE < 1) in the commercial machine.^
D U R A B L E P R E S S F I N I S H I N G
In the mid-1960s, durable press (DP) finishing was significantlyimproved by the introduction of dimethyioidihydroxy-ethyieneurea (DMDHEU, Fig. 1). DMDHEU was stili the domi-nant DP finish in the iate 1970s and eariy 1980s. intensive re-search and development efforts were made to reduce theamount of formaidehyde reieased by finished fabrics. The nextsection of this paper reiates some of our efforts to better un-derstand the structures and the properties of DMDHEU finishesand some related methyloi compounds. Much of this researchwas supported by and conducted in collaboration with a groupof researchers at the U.S. Department of Agriculture (SouthernRegionai Research Center).
Early HPLC Analysis of DP AgentsBecause DiVIDHEU (Fig. 1) is very poiar and contains hydroxyigroups, our early attempts to analyze it by HPLC were basedon methods used to analyze carbohydrates.^ The columns werewater-jacketed 8 mm x 410 mm tubes seif-packed with the Li*form of a cation exchange resin (6% suifonated divinylbenzene crossiinked polystyrene). These coiumns weretypicaliy thermostated at 60C-70C and run at 0.5 mUmin with water as the mobiie phase. As indicated bytheir plate counts of 4,000-6,000 piates/m, the coi-umns were not very efficient, but they were usefui formonitoring the synthesis of DP agents and measunngthem in extracts of finished fabrics and in commerciaifinishing products.
To study the acid-cataiyzed crosslinking reactionbetween DIVIDHEU and celiuiose, fabric was paddedwith in-house prepared DMDHEU and MgCi2, dned tominimize migration, and cured at different tempera-tures. The partiaily-cured fabrics were extracted withwater and the resulting extract quantitated by HPLC.'°From the initiai concentration (Co) and the concentra-
AATCC REVIEW
tion ( 0 at various times it) at each temperature, the rate con-stant for crossiinking was caicuiated using iniCgiO = kf. A plotof iniCo/Q vs. t gave a straight iine indicating a pseudo first-order reaction. When in k was piotted against MT. where 7" isthe absoiute temperature, the energy of activation (5,, f) wasfound to be 29.2 kcai/moi. This compared very favorabiy withthe iiterature vaiue of 29.4 kcai/moi."
in a subsequent study, HPLC was used to determine theeffect of pad-bath pH and storage on the hydroiysis ofDMDHEU.'^ It was found that DMDHEU padded on fabric anddned but not cured was stable for up to 55 days as iong as thepH did not exceed 6. Above pH 6, hydrolysis occurred withinone day of appiication. At pH 10, the maximum amount ofmonomethyloidihydroxyethyieneurea (MMDHEU) was gener-ated after one day and hydroiysis to dihydroxyethyieneurea(DHEU) was compiete between 15 and 55 days, it was obvi-ous that the pH of the pad-bath is more important than thestorage penod in the production of post-cured fabrics,
A simiiar study with dimethytoiethyieneurea (DMEU) wasperformed with a 70/30 water-methanoi solvent-conditionedC18 reverse phase HPLC column using water as the mobiiephase.'^ it was found that DMEU, as expected, was much lessstable on fabric than DMDHEU. After 15 days, only 18% of theoriginal DMEU, compared to 86% for DMDHEU, remained onthe fabric padded with a pH 6 bath. DMEU also formed oligo-nners by reaction with itself.
Removal of DMDHEU Crosslinksit is weli known that cotton ceiiuiose is significantiy weaker aftercrossiinking due to DP treatment than before DP treatment.One possibie expianation is a decrease in the degree of poly-merization (dp) during the acid-cataiyzed DP-finishing process.To determine the dp of the finished ceiiuiose, the crosslinksmust be removed so the ceiiuiose can be dissolved. Reaiizingthat ceiiuiose is stable to mercerizing-strength NaOH, we foundthat boiiing DMDHEU-crossiinked cotton fabnc in 23% NaOHunder nitrogen for 10 min removed aii crossiinks. ' Tabie ishows some of the chemical and physical properties of thecontroi fabric (unfinished but treated with NaOH), fabrics fin-ished with DMDHEU/MgCi^ (Sampie A), and fabrics finished
TABLE 1.
Properties of Control, Finished, and
Contro!DMDHEU +MgCl2 (A)A StrippedDMDHEU +MgClj +CA''(B)B Stripped
WRA (W+F)'Citric acid.
BreakingLoad(N)272135
249156
274
Stripped Fabrics
WRA (W+F) %Nitrogen
n194286
194272
185
-0.01.1
-0.01.06
-0.0
%CH20
-0.02.95
-0.02.83
-0.0
Stands for Wrinkle Recovery Angle (Warp and Fill).
dPv
3,720—
2,820—
3,050
DECEMBER 2OOB
oineymedal
TABLE II.
'3C-NMR Chemical Shifts^
Carbon Atom
CHOH (trans)CHOH (cis)CHjOHCHpCHg
ChemicalShift (ppm)-86-80-66-75
CarbonAtomCHOCH3 (trans)CHOCH3 (els)CH2OQH3CHOCH3
ChemicalShift (ppm)-91-88-57-56
•^he carbon atom for which the chemical shift was determinedis underiined.
ROH
with DMDHEU/MgCb + citric acid (Sample B). ^The data showed that some, but not all, of the decrease in
strength caused by DP finishing is caused by a decrease in dp(as determined by viscosity). The major portion of the strengthloss is probably due to the localization of tensile forces in thecrosslinked cellulose.
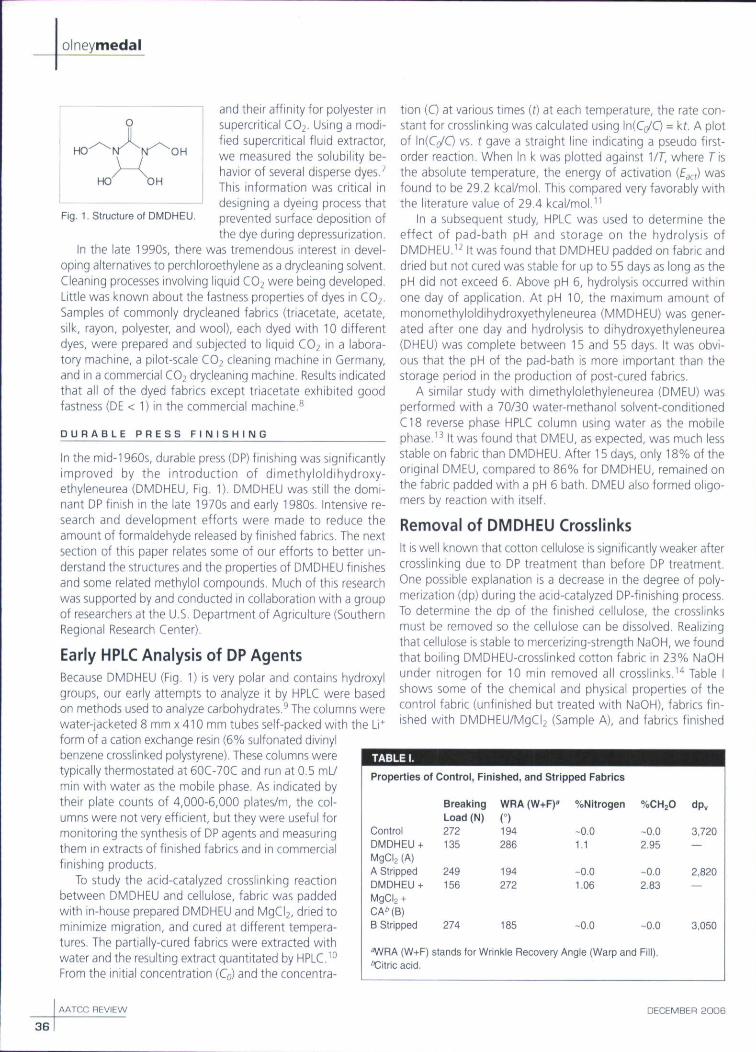
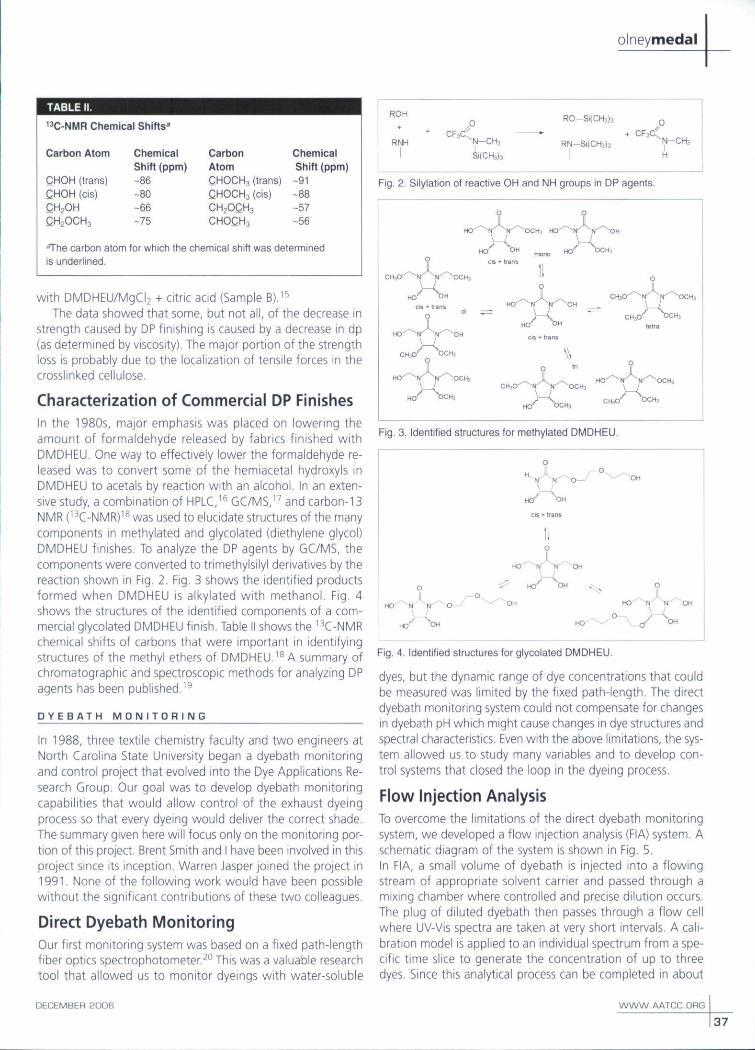
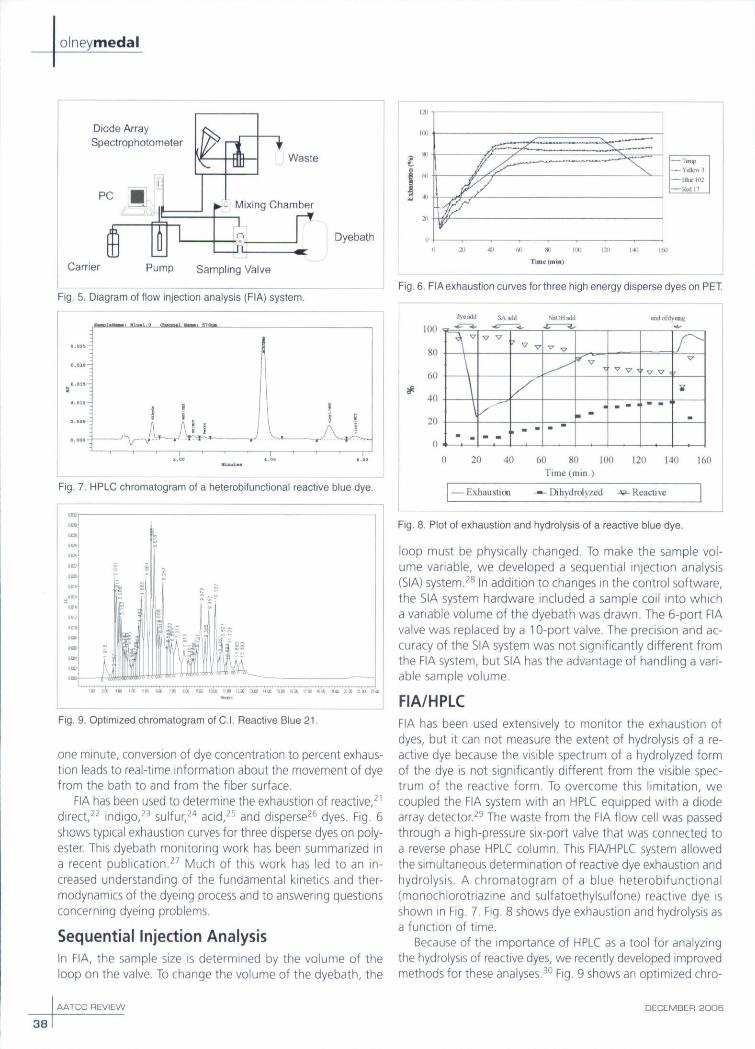
Characterization of Commercial DP FinishesIn the 1980s, major emphasis was placed on lowering theamount of formaldehyde released by fabrics finished withDMDHEU. One way to effectively lower the formaldehyde re-leased was to convert some of the hemiacetal hydroxyls inDMDHEU to acetals by reaction with an alcohol. In an exten-sive study, a combination of HPLC, ^ GC/MS,^^ and carbon-13NMR('^C-NMR)'^ was used to elucidate structures of the manycomponents in methylated and glycolated (diethylene glycoi)DMDHEU finishes. To analyze the DP agents by GC/MS, thecomponents were converted to trimethylsilyl derivatives by thereaction shown in Fig. 2. Fig. 3 shows the identified productsformed when DMDHEU is alkylated with methanol. Fig. 4shows the structures of the identified components of a com-mercial glycolated DMDHEU finish. Tabie II shows the ^^C-NMRchemical shifts of carbons that were important in identifyingstructures of the methyl ethers of DMDHEU.^^ A summary ofchromatographic and spectroscopic methods for analyzing DPagents has been published.'^
D Y E B A T H M O N I T O R I N G
In 1988, three textile chemistry faculty and two engineers atNorth Carolina State University began a dyebath monitoringand control project that evolved into the Dye Applications Re-search Group. Our goal was to develop dyebath monitoringcapabilities that would allow control of the exhaust dyeingprocess so that every dyeing would deliver the correct shade.The summary given here will focus only on the monitoring por-tion of this project. Brent Smith and I have been involved in thisproject since its inception. Warren Jasper joined the project in1991. None of the following work would have been possiblewithout the significant contributions of these two colleagues.
Direct Dyebath MonitoringOur first monitoring system was based on a fixed path-lengthfiber optics spectrophotometer.^^ This was a valuable researchtool that allowed us to monitor dyeings with water-soluble
DECEMBER 2DDB
-N-CH, RN-Si{CH3)3 N-CH3H
Fig. 2. Silyiation of reactive OH and NH groups in DP agents.
o
HO' ' OHes * trans
0
\ _ /
o
_ Xm-' OH
di _ j ^
HH
OCHJ H O '
11IiO
O"^ \>H
O
HC-
•"OH
\ \BI
"-or
H.
o
hT^OH
OCH;
CH
H3 \ _
CHjO
o
.O'H.CH.tetra
1
O C H J
Fig. 3. Identified structures for methylated DMDHEU.
O
. .. I ..
O
CIS -t rrans
i l
11o
•-O—^
'"OH
HO'"".0—..
0
'~~N'Tr'""OH
Fig. 4. identified structures for glycoiated DMDHEU.
dyes, but the dynamic range of dye concentrations that couidbe measured was limited by the fixed path-length. The directdyebath monitoring system could not compensate for changesin dyebath pH which might cause changes in dye structures andspectral characteristics. Even with the above limitations, the sys-tem allowed us to study many variables and to develop con-trol systems that closed the loop in the dyeing process.
Flow Injection AnalysisTo overcome the limitations of the direct dyebath monitoringsystem, we developed a flow injection analysis (FIA) system. Aschematic diagram of the system is shown in Fig. 5.In FIA, a small volume of dyebath is injected into a flowingstream of appropriate solvent carrier and passed through amixing chamber where controlled and precise dilution occurs.The plug of diluted dyebath then passes through a flow cellwhere UV-Vis spectra are taken at very short intervals. A cali-bration model is applied to an individual spectrum from a spe-cific time slice to generate the concentration of up to threedyes. Since this analytical process can be completed in about
AATCC.DRG
37
oineymedal
Waste
Diode ArraySpectrophotometer
PC
Dyebath
Carrier Pump Sampiing Vaive
Fig. 5. Diagram of fiow injection analysis (FIA) system.
Fig. 7. HPLC chromatogram of a heterobifunctional reactive blue dye.
3 8
Fig. 9. Optimized chromatogram of C.I, Reactive Biue 21.
one minute, conversion of dye concentration to percent exhaus-tion leads to real-time information about the movement of dyefrom the bath to and from the fiber surface.
FIA has been used to determine the exhaustion of reactive/'direct,^^ indigo,^^ sulfur,^'' acid,^^ and disperse^^ dyes. Fig. 6shovys typical exhaustion curves for three disperse dyes on poly-ester. This dyebath monitoring work has been summarized ina recent publication.^' Much of this work has led to an in-creased understanding of the fundamental kinetics and ther-modynamics of the dyeing process and to answering questionsconcerning dyeing problems.
Sequential Injection AnalysisIn FIA, the sample size is determined by the volume of theloop on the valve. To change the volume of the dyebath, the
AATCC REVIEW
Fig. 6. FIA exhaustion curves for three high energy disperse dyes on PET
Old ofdyoig
10(1
8(1
6(1
40
20
0 i
\
\
\
- -
^ ^
/
i - •
- • '1
0 20 40 60 80 1(10 12(.) 140 160Time (min )
[•Ahauslini -•-Dihydrolj^ed -w-Reactive
Fig. 8. Plot of exhaustion and hydrolysis of a reactive biue dye,
loop must be physically changed. To make the sample vol-ume variable, we developed a sequential injection analysis(SIA) system.^^ In addition to changes in the control software,the SIA system hardware included a sample coil into whicha variable volume of the dyebath was drawn. The 6-port FIAvalve was replaced by a 10-port valve. The precision and ac-curacy of the SIA system was not significantly different fromthe FIA system, but SIA has the advantage of handling a vari-able sample volume.
FIA/HPLCFIA has been used extensively to monitor the exhaustion ofdyes, but it can not measure the extent of hydrolysis of a re-active dye because the visible spectrum of a hydrolyzed formof the dye is not significantly different from the visible spec-trum of the reactive form. To overcome this limitation, wecoupled the FIA system with an HPLC equipped with a diodearray detector.^^ The waste from the FIA flow cell was passedthrough a high-pressure six-port valve that was connected toa reverse phase HPLC column. This FIA/HPLC system allowedthe simultaneous determination of reactive dye exhaustion andhydrolysis. A chromatogram of a blue heterobifunctional(monochlorotriazine and suifatoethylsulfone) reactive dye isshown in Fig. 7. Fig, 8 shows dye exhaustion and hydrolysis asa function of time.
Because of the importance of HPLC as a tool for analyzingthe hydrolysis of reactive dyes, we recently developed improvedmethods for these analyses.^° Fig. 9 shows an optimized chro-
DECEMBER 2OO6
olneymedal
matogram of C.I. Reactive Blue 21, a complex sulfonated ph-thalocyanine dye containing at least 43 blue components.
C O N C L U S I O N S
Over the past three decades, our ability to analyze chemicalsin textile processes has dramatically increased. We are able toanalyze materials faster and more completely than ever beforeto provide a body of new knowledge to improve and createtextile wet processes. Information provided here on durablepress agents and dyebath analysis is a trickle from the river ofdata flowing from research laboratories.
Acknowledgements
Support for this work was received from the U.S. Departmentof Agriculture (Southern Regional Research Center), the Na-tional Textile Center, the Consortium for Research in Fibers,Textiles and Manufacturing, the Environmental ProtectionAgency Purdue University, and North Caroiina State UniversityIn addition to many faculty, industrial, and government col-leagues who contributed significantly to the research men-tioned here, the following students and research associates whoso ably performed the work are gratefully acknowledged: DilipPasad, Karen Springer, Prashant Abhyankar, Martin Wusik,Beverly Leibowitz, SuChul Chung, Rosemary Kunz, HerbertKuiube, Tod Madderra, Jennifer Williams, Michele Wallace, SaraDraper, Rachel Slivensky, Jay Merritt, Tatjana van Delden, BillSnyder, Gordon Berkstresser, Gerardo Monterro, TraceyMariowe, Jana Lykins Wharton, Lynn Grady Moore, AndyMonfalcone, and Cindy Salley Recognition for this work shouldbe shared with each of them. Figs. 5, 7, 8, and 9 are repro-duced with the permission of AATCC,
References1. Howell, Houston E. and James R. Davis, Textile Chemist and Color-
ist, Vol, 23, No. 9, September 1991, pp69-73.2. Beck, Keith R., Janine Wagner, and James. W. Rucker, Eastern
Analytical Society Meeting, Somerset, N.J., U.S.A., November 1995.
3. Tichner, Wayne C. and Andrea Luk, Textile Chemist and Colorist,Vol. 17, No. 10, October 1985, pp69-73.
4. Rodgers, James E. and Keith R. Beck, Proceedings, 2005 BeltwideCotton Conference, January 2005,
5. AATCC Technical Manual. Vol. 81, 2006, pp141-142,
6. Beck, Keith R, and Lynn G. Moore, Textile Chemist and Colorist,Vol, 29, No, 8, August 1997, pp66-70.
7. Draper, SaraL.,etal.,Dyesandftgmenrs, Vol.45, No. 3, June2000,ppl77-183.
8. Wentz, Manfred, eidl., AATCC Review, Vo\. 1, No, 5, May 2001,pp25-30,
9. Beck, Keith R., BeverlyJ. Leibowitz, and Michael R. Ladisch, Journa/
of Chromatography, Vol, 190, No. 1, March 1980, pp226-232.
10. Beck, Keith R. and Dilip M, Pasati, Journal of Applied Polymer Sci-ence, Vol. 27, No. 4, Apnl 1982, ppi 131 -1138
11. Gonzalez, Elwood J.,etaL, Textile Research Journalyo\. 36, No. 6,June 1966, p571.
12. Beck, Keith R, and Dilip M, Pasad, Textile Research Journal, Vol. 52,No. 4, April 1982, pp269-274.
13. Beck, Keith R, and Dilip M. Pasad, rexf;7e/?esearc/iJouma/, Vol. 53,No. 9, September 1983, pp525-529,
14. Abhyankar, Prashant N., et al.. Textile Research Journal, Vol. 55,No, 7, July 1985, pp444-448
15. Abhyankar, Prashant N., et al.. Textile Research Journal, Vol. 56,No. 9, September 1986, pp551-555,
16. Beck, Keith R., etal.. Textile Chemist and Colorist, Vol, 16, No, 5,May 1984, pp15-18.
17. Beck, Keith R., et aL, 7exf;7e Chemist and Colorist, Vol 20, No. 3,March 1988, pp35-39,
18. Beck, Keith R. and Karen S, Springer, Textile Chemist and Colorist.Vol, 20, No. 12, December 1988, pp29-33.
19. Beck, Keith R., Modern Textile Characterization Methods, editedby Mastura Raheel, Chapter 6, Marcel Dekker, New York, 1996,PP237-263.
20. Beck, Keith R., Tod A. Madderra, and C. Brent Smith, Textile Chemistand Colorist. Vol. 23, No. 6, June 1991, pp23-27.
21 Lefeber, Michele, et al.. Textile Chemist and Colorist. Vol. 26, No.5, May 1994, pp30-34,
22. Snyder, William, Master's Thesis, North Carolina State University,1996.
23. Merritt, Judson T., et al,, AATCC Review, Vol. 1, No. 4, Apnl 2001,pp53-57.
24. Slivenski, Rachel, Master's Thesis, North Carolina State University,2002.
25. Draper, S L., et aL, AATCC Review, Vol. 3, No. 8, August 2003,pp51-54.
26. van Delden, Tatjana E., Keith R. Beck, and C, Brent Smith, TextileChemist and Colorist, Vol, 30, No, 5, May 1998, pp14-18.
27. Beck, Keith R., AATCC Review, Vol. 3, No. 8, August 2003,pp9-14
28. Draper, Sara L., Keith R, Beck, and C, Brent Smith,/\/\7CC/?ewew,VoL 1, No. 1, January 2001, pp24-28.
29. Wallace, M.R.,K.R. Beck, and C, Brent Smith, rexf/7eC/iem/standColorist, Vol. 32, No. 2, Eebruary 2000, pp39-42,
30. Beck, Keith R, and Cindy T, Salley, Book of Papers, AATCC Interna-tional Conference & Exhibition, Boston, Mass,, U,S,A,, 2005,ppi 93-200.
Author's Address
Keith R. Beck, College of Textiles, North Carolina State Univer-sity 2401 Research Dr., Raleigh, NC, USA, 27695-8301;telephone+1 919 515 6558; fax-KI 919 515 6532;e-maii keith [email protected].
DECEMBER 3DDB AATCC DRG
39


![[2008] Textile Dyes](https://img.dokumen.tips/doc/110x75/55cf9cff550346d033abd4fe/2008-textile-dyes.jpg)