Embed Size (px)
Citation preview
Kinematic, microphysical, and electrical aspects of an asymmetric
bow-echo mesoscale convective system observed during STEPS 2000
Timothy J. Lang1 and Steven A. Rutledge1
Received 28 June 2006; revised 25 October 2007; accepted 28 December 2007; published 30 April 2008.
[1] Five hours of detailed observations of the asymmetric bow-echo mesoscaleconvective system on 11–12 June 2000 during the STEPS project are presented. Datasources included polarimetric and Doppler radars, a VHF lightning mapper, and theNational Lightning Detection Network. Nearly every (99%) VHF lightning sourceoccurred within 10 km of the convective line. Charge identification within the much ofthe convective line revealed evolution during the first 3 h from a normal polaritydipole (upper positive charge near 9 km MSL/�30�C, over mid-level negative chargenear 7 km/�16�C) to a normal polarity tripole with the addition of lower positivecharge near 4 km (1�C). During the final 2 h, the charge structure resembled aninverted dipole, with negative charge overlaying positive. When the bow echo occurredduring hour 2, part of the cells associated with severe winds developed an invertedtripolar charge structure and produced predominantly positive cloud-to-groundlightning. Stratiform lightning was infrequent, normally initiating in the convective lineand propagating rearward along two pathways: a downward-sloping upper pathwaynear 9 km, and a more common constant-altitude lower pathway near 6 km (�10�C).Some flashes initiated within the stratiform region during this time, but only afterstratiform reflectivities increased significantly in the mixed-phase region. These flashesinitiated near the bright band (4 km), and tapped negative charge above and positivecharge below. Possible mechanisms to explain the observations are discussed.
Citation: Lang, T. J., and S. A. Rutledge (2008), Kinematic, microphysical, and electrical aspects of an asymmetric bow-echo
mesoscale convective system observed during STEPS 2000, J. Geophys. Res., 113, D08213, doi:10.1029/2006JD007709.
1. Introduction
[2] Despite considerable research concerning electrifica-tion and lightning production in mesoscale convectivesystems (MCSs), many unanswered questions remain. Thisstudy addresses three questions described in the followingsubsections, using an observational case study of theevolution of an asymmetric bow-echo MCS.
1.1. What is the Distribution of Total Lightning andCharge in Asymmetric and Bow-Echo MCSS, andHow Well Does This Agree With Conceptual Models?
[3] The vast majority of past MCS electrification studieshave focused on either cloud-to-ground (CG) lightning[e.g., Rutledge and MacGorman, 1988] or electrical chargestructure as revealed by balloon-borne electric field metersoundings [e.g., Stolzenburg et al., 1998]. Stolzenburg et al.[1998] presented a conceptual model of charge structure in aarchetypal MCS. Their findings suggested that, within theupdrafts of the convective line of MCSs, there are fourlayers of alternating charge, with two additional layersoutside updrafts. Within the transition zone behind the
convective line there are usually five charge layers, whilein the stratiform precipitation region there are usually up tosix. Stolzenburg et al. [1998] suggested that upper chargelayers in the convective line are connected to their counter-parts in the stratiform region, and may slope downwardtoward the rear of the MCS, a hypothesis supported byobservations from Stolzenburg et al. [2001] and Carey et al.[2005].[4] Marshall and Rust [1993] concluded that, despite this
conceptual model, there can be significant variability instratiform charge structure. They identified two archetypalcharge structures, Type A and Type B. Type A has fivecharge layers, with negative charge near 0�C, and isrepresentative of the stratiform regions of squall lines andpredominantly stratiform MCSs (see Houze et al. [1990] fora review of MCS organizational archetypes). They found asimpler charge structure, Type B, in bow-echo MCSs.Type B has four alternating charge layers with positivecharge near 0�C. Schuur and Rutledge [2000a], in theirobservations, found charge layers in symmetric MCSs tomost closely follow the Type A paradigm. However, asym-metric MCSs had simpler structures more akin to Type B.[5] Recently, Carey et al. [2005] studied total lightning in
a symmetric leading-line, trailing- stratiform MCS using athree-dimensional (3D) VHF lightning mapper. Within theconvective line, which contained most of the observedlightning, the lightning distribution suggested a normal-
JOURNAL OF GEOPHYSICAL RESEARCH, VOL. 113, D08213, doi:10.1029/2006JD007709, 2008ClickHere
for
FullArticle
1Department of Atmospheric Science, Colorado State University, FortCollins, Colorado, USA.
Copyright 2008 by the American Geophysical Union.0148-0227/08/2006JD007709$09.00
D08213 1 of 21
polarity tripolar electrical structure, with positive chargenear 3�C and �35�C, and negative charge near �17�C.Another notable result was a downward-sloping lightningpathway from the upper positive charge region, whichterminated 40–50 km into the stratiform region near thealtitude of the radar bright band. A possible origin of thissloping pathway, as discussed by Carey et al. [2005], waspositive charge residing on snow particles ejected rearwardfrom the convective line, which gradually descend towardthe melting level.[6] Carey et al. [2005] found evidence for stratiform
lightning of all types to occur within three positive chargelayers in the stratiform region, at 2�C, �11�C, and �31�C.Lyons et al. [2003], in a study of MCS sprite-producingstratiform positive CG (+CG) flashes, found correspondingVHF source densities in these flashes to concentrate nearthe melting level, implying positive charge near 0�C. Langet al. [2004a], in a study of MCS +CGs terminating in thestratiform region, found corresponding VHF source densi-ties to concentrate near �10�C. Thus these latter two studiescombined found individual stratiform positive charge layersthat correspond to two of the three layers found by Carey etal. [2005].[7] Still missing from the literature is a comprehensive
study of the total lightning distribution in asymmetricMCSs. A reasonable hypothesis with such systems is thattheir lightning distribution and charge structure also couldbe asymmetric, with significant variability along the con-vective line not seen in symmetric storms as by Carey et al.[2005]. In addition, their stratiform lightning distributioncould be more representative of the simpler Type B arche-type, with positive charge near 0�C and perhaps again near�20�C [Marshall and Rust, 1993; Schuur and Rutledge,2000a].
1.2. What Physical Mechanisms Account for theObserved Bipolarity in MCS CG LightningDistribution, as Well as the Initiation of LightningWithin the Stratiform Region of MCSs?
[8] The typical CG lightning pattern in mature MCSs isbipolar, with negative CG (�CG) lightning striking pre-dominantly within the convective line, while +CG lightningdominates in the stratiform region [e.g., Hill, 1988; Orvilleet al., 1988; Rutledge and MacGorman, 1988; Stolzenburg,1990; Rutledge et al., 1990]. Recent studies of MCSlightning using VHF mappers have noted that the vastmajority of flashes propagating within the stratiform regioninitiated within the convective line, and traversed throughthe stratiform region along well-defined pathways thatlikely corresponded to the locations of significant chargelayers [e.g., Lang et al., 2004a, Carey et al., 2005].However, Lang et al. [2004a] also noted a minority ofstratiform +CG flashes that actually initiated within thestratiform region itself.[9] There remains considerable uncertainty as to what
mechanism could explain sufficient electric fields to initiatelightning within the stratiform region. The two candidatesare charge advection and in situ charging [Rutledge andMacGorman, 1988]. There have been numerous studies ofthese processes. Rutledge et al. [1993] and Rutledge andPetersen [1994] suggested in situ charging as the dominantmechanism, with the latter study finding that stratiform
lightning (in particular, +CGs) only occurs when verticalreflectivity profiles are intense (>15 dBZ above the meltinglevel). This suggests that a non-inductive charging mecha-nism may be important for charge separation in the strati-form region. Other explanations for charging mechanismsinclude inductive mechanisms or charging during melting[Shepherd et al., 1996].[10] However, Carey et al. [2005] presented evidence for
lightning occurring along rearward advected ice particlepathways, implying that advection of charge from theconvective line could be important in the upper levels ofthe stratiform region. In the modeling study of Schuur andRutledge [2000b], in situ charge separation explained up to70% of the total charge in the stratiform region, with chargeadvection accounting for 30%. Rutledge et al. [1990]suggested that both stratiform region charging mechanismsmight account for different subsets of stratiform +CGs.Thus it is possible that both mechanisms may be importantin stratiform charging, and together could account for boththe initiation and the propagation of stratiform lightning.However, in order to test this idea, further observations ofMCS lightning are required, including 3D mapping ofchannels. As part of this, it is important to understandwhere lightning initiates within the stratiform region.
1.3. Are There Lightning Patterns Characteristic ofBow-Echo MCSs, Which May be Useful in theContext of Understanding and Predicting SevereWeather, and if so What Causes Them?
[11] One of the most robust relationships between light-ning and severe weather is the common occurrence of arapid increase in total (intracloud or IC, and CG) lightningflash rate several minutes prior to the onset of severeweather, such as large hail (diameter D > 2 cm) or tornadoes[Williams et al., 1999]. Williams et al. [1999] interpretedthis as a consequence of rapid intensification of the con-vective updraft, leading to increases in both total lightningflash rate and the probability of severe weather. Thus it maybe possible to associate total flash rate in the convective lineof MCSs with bow echoes and severe winds, as well aslarge hail production.[12] There also may be a relationship between severe
weather and CG lightning in MCSs. Price and Murphy[2002] noted an enhancement of +CG fraction duringdamaging wind events associated with a bow-echo MCS[e.g., Weisman, 2001]. During the derecho phase, +CGfraction exceeded 70% for over 3 h. Price and Murphy[2002] did not discuss the location of these +CGs relative tothe convective line or stratiform region. However, Nielsen etal. [1994] and Knupp et al. [1998] both noted that +CGscould be enhanced in the convective line of a MCS duringits development phase, when rapid intensification of theconvection was occurring.[13] Given the commonly observed correspondence
between storms that produce predominantly +CG light-ning and severe weather such as hail, strong winds, andtornadoes [e.g., Rust et al., 1981a, 1981b; Stolzenburg,1994; Carey and Rutledge, 1998], it is reasonable tohypothesize that portions of the convective line involvedwith the strongest winds (as well as large hail) also mayfeature enhanced +CG lightning. This could be particu-larly true in the U.S. Central Plains [Carey et al., 2003].
D08213 LANG AND RUTLEDGE: ASPECTS OF AN ASYMMETRIC BOW-ECHO MCS
2 of 21
D08213
The underlying mechanism may be the creation of aninverted charge structure akin to the +CG-dominated stormstudied by Wiens et al. [2005], with significant positivecharge at mid-levels (�10 to �20�C). This may occur viathe acquisition of positive charge on riming particles (graupelor hail) during rebounding collisions with ice crystals.Saunders and Peck [1998] found that high riming accretionrates lead to positive charging of the riming particle, even atcold temperatures. The riming accretion rate could beboosted by enhanced liquid water contents that may existwithin strong, broad updrafts [e.g.,Williams et al., 2005]. Themodeling study of Kuhlman et al. [2006] supported thistheory by showing that charging parameterizations basedon Saunders and Peck [1998] could lead to the developmentof inverted charge structures.
2. Brief Overview of Case Study
[14] During the afternoon of 11 June 2000 (local time), anasymmetric bow-echo MCS developed and propagatedthrough the domain of the Severe Thunderstorm Electrifi-cation and Precipitation Study (STEPS) [Lang et al.,2004b]. This is the same storm whose stratiform +CGlightning was studied by Lang et al. [2004a].[15] The synoptic setting for this MCS featured mostly
zonal flow at upper levels over Colorado and Kansas, withthe axis of the jet stream much further to the north.Southeasterly flow existed at the surface, with dewpointsin the 7–9�C range. A sounding launched at 1813 UTC(hereafter all times in UTC) approximately 100 km west ofGoodland, KS, showed 936 J kg�1 of convective availablepotential energy. The mean shear from the surface to 6 kmAGL and bulk Richardson number calculated via themethod of Weisman and Klemp [1986] were 9.0 m s�1
and 23.1, respectively. Though consistent with the devel-opment of intense multicellular convection and squall lines[e.g., Weisman and Klemp, 1986], the environmental ther-modynamics and shear did not suggest the likelihood ofbow echoes [Weisman, 1993].[16] The MCS started out by 1900 as a collection of
cells that appeared over the Colorado counties of Elbertand El Paso, southeast of Denver. By 2030 the storm had awell-defined southwest-northeast-oriented linear structure,with trailing stratiform echo forming by 2130. Individualcell lifetimes normally were 0.5–1 h, and no supercellswere observed in the MCS. The MCS was well-covered bythe STEPS radar and lightning observing network fornearly 5 h (2100 on 11 June through 0150 on 12 June),during which time it produced numerous reports of severeweather, including large hail and strong winds. This MCSalso underwent dramatic kinematic, microphysical, andelectrical evolution, which was examined in detail.
3. Data and Methodology
3.1. Radars
3.1.1. Overview[17] Lang et al. [2004b] provided a detailed overview of
the STEPS experimental design, so only the portions mostpertinent to this study will be covered here. Polarimetricand Doppler radar data were available from both the NCARS-Pol and CSU-CHILL radars. Since the CHILL scan
strategy was not optimal, only data from S-Pol (but notfrom CHILL) were used in the analyses to be presented. Athird Doppler radar, the WSR-88D NEXRAD at Goodland,KS (KGLD), was available for this study. The KGLD radarwas ideal for full time series analysis of the storm, since itscanned the entire MCS every 5–6 min throughout theobservation period.3.1.2. Polarimetric Analysis[18] Due to the size of the MCS and scanning restraints
with polarimetric radars, it was impossible to construct well-resolved time series of the entire MCS with polarimetricdata. Hence analyses of select portions of the MCS weredone. Otherwise, data quality control and analysis method-ology were virtually identical to Tessendorf et al. [2005]. Inparticular, polarimetric data were interpolated to 0.5� 0.5�0.5 km3 resolution Cartesian grids (spanning 75 km in eitherhorizontal direction, and 1.5–20 km MSL in the vertical)covering regions of interest, and the Tessendorf et al. [2005]fuzzy-logic hydrometeor identification (HID) methodologywas used to construct time series and cross-sections ofvariables such as graupel echo volume. One difference withthe Tessendorf et al. [2005] methodology was that theREORDER software was used for creating grids.3.1.3. Dual-Doppler Analysis[19] High-resolution grids similar to the polarimetric ones
were created for select portions of the storm, using reflec-tivity and radial velocity data from S-Pol and KGLD. Thesegrids were used in dual-Doppler syntheses to obtain 3Dkinematic information. The synthesis procedure was verysimilar to the methodology of Tessendorf et al. [2005],except radial velocity was manually unfolded instead ofusing an automated algorithm. In all dual-Doppler figures inthis paper the winds shown are relative to ground.3.1.4. Convective/Stratiform Partitioning[20] In addition to the high-resolution grids, every
KGLD volume within the analysis period was interpolatedto a 2 � 2 � 0.5 km3 resolution grid (spanning 376 km ineither horizontal direction, and 1.5–20 km MSL in thevertical) centered 28 km north and 62 km west of the KGLDradar. Using these coarser grids, the convective and stratiformportions of this storm were separated objectively, in order toexamine the evolution of radar reflectivity and lightning inthese different areas. However, it was found that conven-tional partitioning algorithms [Steiner et al., 1995; Yuterand Houze, 1998] failed on the intense stratiform region ofthis MCS, in which major areas were misclassified asconvective even after extensive tuning of the algorithms.Therefore a new partitioning algorithm was developedutilizing information in the vertical. When 30+ dBZ wasobserved at 6+ km MSL (�10�C; hereafter all altitudes inMSL), the associated grid column was classified as con-vective. If this was not the case but the grid column waswithin 10 km distance of a convective grid column, thecolumn was classified as transition. If neither conditionwas satisfied, the grid column was stratiform. Grid col-umns containing missing data at 6+ km, such as thosewithin the KGLD cone of silence, were unclassified.[21] The subjectively chosen height and reflectivity
thresholds were lightning-based, and corresponded looselyto the rule of thumb developed by Petersen et al. [1996] thatmost storms do not become electrified until they show30+ dBZ echo at �10�C. Since this was a lightning study,
D08213 LANG AND RUTLEDGE: ASPECTS OF AN ASYMMETRIC BOW-ECHO MCS
3 of 21
D08213
it was felt that such an algorithm was justified. No majormicrophysical or dynamical inferences were made on thebasis of this algorithm. For example, convective gridcolumns included only the most intense convection, whichin turn was likely to produce lightning. The transitioncolumns should not be confused with the transition zoneof MCSs [Houze et al., 1990], although they certainly couldinclude such portions of the storm. The transition columnslikely contained weak and decaying convection in thevicinity of the convective line, while stratiform columnscontained both stratiform echo and perhaps weak/decayingconvection far (>10 km) from major convection.
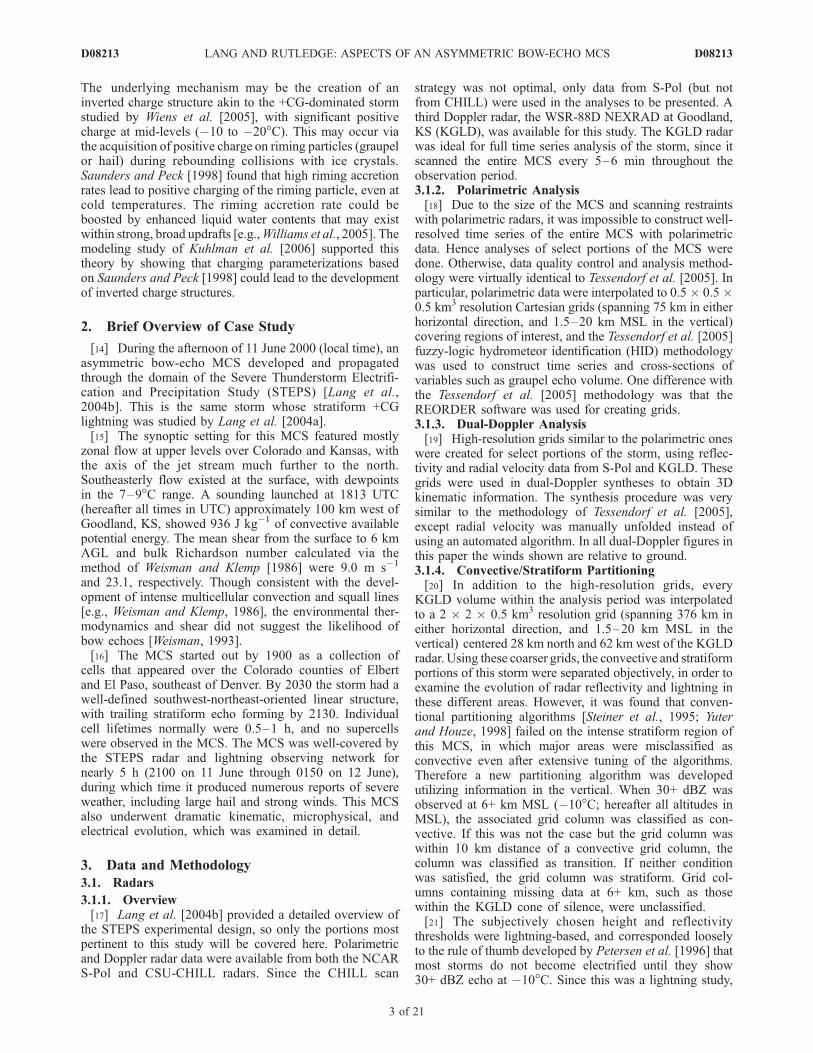
[22] Figure 1 shows an example of the performance ofthis algorithm for one particular KGLD volume. It effec-tively picked out the convective line from the surroundingecho, and avoided the misclassification of the intensestratiform echo as convective. In addition, though no majordynamical inferences should be based on this algorithm, anintercomparison was performed between 12 partitionedKGLD volumes matched in time with 12 dual-Dopplersynthesis volumes degraded to 2-km horizontal resolution.Maximum vertical velocity was determined in each gridcolumn, separated by partition category. The median resultswere 4.0 m s�1 in convective columns, 1.3 m s�1 in tran-
Figure 1. Horizontal cross-section of KGLD reflectivity at 6 km MSL, at 2200 UTC on 11 June (a), andthe results of the convective/stratiform partitioning algorithm (b); C, Convective; S, Stratiform; T,Transition; ND, No Data).
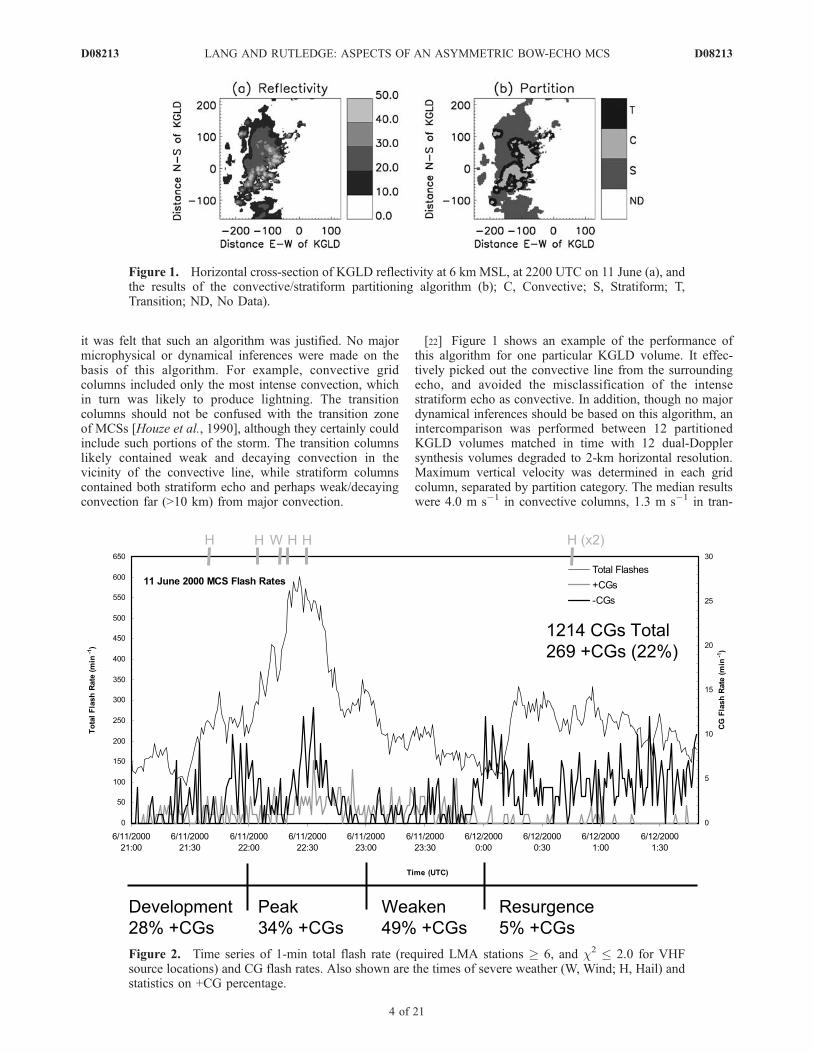
Figure 2. Time series of 1-min total flash rate (required LMA stations � 6, and c2 � 2.0 for VHFsource locations) and CG flash rates. Also shown are the times of severe weather (W, Wind; H, Hail) andstatistics on +CG percentage.
D08213 LANG AND RUTLEDGE: ASPECTS OF AN ASYMMETRIC BOW-ECHO MCS
4 of 21
D08213

sition columns, and 0.9 m s�1 in stratiform columns, in linewith expectations for vertical velocity trends in thesedifferent categories. Therefore the algorithm should beadequate for developing gross statistics on lightning andreflectivity evolution within the convective and stratiformregions of this MCS.
3.2. Three-Dimensional VHF Lightning MappingArray
3.2.1. Overview[23] The New Mexico Tech Lightning Mapping Array
(LMA) provided 3D mapping of lightning channels at highspatial and temporal resolution [Rison et al., 1999]. Withinthe 70-km diameter core of the 13-station STEPS LMAnetwork, centered within the triangle formed by the threeradars [Lang et al., 2004b], Thomas et al. [2004] claimed anuncertainty in source locations of 6–12 m in the horizontaland 20–30 m in the vertical. Outside the network core,range and altitude errors increased as ranged squared, whileazimuthal errors increased linearly with range [Thomas etal., 2004]. Vertical resolution was <1 km out to 125 kmfrom the network center, which encompassed all of the radar
dual-Doppler lobes [Lang et al., 2004b]. Normally, onlyVHF sources detected by at least 7 stations were examined,and goodness-of-fit values (c2) were required to be � 1.0 inthe source location solutions. Exceptions will be noted infigure captions.[24] Since this MCS spanned up to �200 km along its
convective line, and was observed for almost 5 h, there weretimes when the LMA resolved lightning better than others,particularly in the vertical. Lightning was most poorlyresolved during the 2100 hour and the 0100 hour. Obser-vations in the convective line were best during the2200 hour, while stratiform region observations were bestduring the 2300 hour. In the discussion of results, thedistance of the relevant portions of the storm from theLMA network center will be noted.3.2.2. Flash Rates and Flash Classification[25] Flashes were identified and categorized, and flash
rate calculations were made, using the lightning viewingsoftware called XLMA, following the methodology ofThomas et al. [2003]. No changes were made to thesoftware defaults for flash sorting. This algorithm is auto-mated, and is subject to errors such as grouping the wrong
Figure 3. Time-height plots of VHF source density in the convective (a) and stratiform (c) regions ofthis MCS. Also shown are time-height plots of 30 dBZ echo volume in the convective region (b), alongwith 20 dBZ echo volume in the stratiform region (d).
D08213 LANG AND RUTLEDGE: ASPECTS OF AN ASYMMETRIC BOW-ECHO MCS
5 of 21
D08213
sources with the wrong flashes. However, as Wiens et al.[2005] noted, sensitivity studies suggest that basic flashtrends are preserved.[26] VHF sources were classified as convective, transi-
tion, or stratiform if they occurred in the respective gridcolumn of the temporally closest KGLD volume. A flashwas determined to be convective if 80% or more of thesources occurred in convection. Similarly, stratiform flasheswere those with � 80% sources in stratiform. Other flasheswere classified as mixed. Median location of the first 10sources or first 10% of total sources in a flash (whicheverwas less) was determined and named the origin location ofthat flash, which was similarly classified as convective,transition, or stratiform.3.2.3. Charge Identification[27] Manual charge identification using the LMA data
was performed following the technique and theory of Risonet al. [1999], Thomas et al. [2001], Rust et al. [2005], andWiens et al. [2005]. This technique assumes the bi-directional electric field breakdown model for lightningdischarges proposed by Kasemir [1960] and further advo-cated by Mazur and Ruhnke [1993]. It also is based on thefact that negative breakdown through positive charge layersis inherently more noisy at VHF than positive breakdownthough negative charge, leading to more VHF sources beingdetected in positive charge layers than in negative [Rison etal., 1999]. The technique usually assigns charge for a flashwithin a charge dipole based on the initial vertical directionof the negative leader discharge. If upward, then the dipoleis assumed to be positive charge over negative charge; ifdownward, the opposite. Relative distribution of VHF
sources with altitude also can be used to help identifycharge locations. This technique is inherently subjective,and is prone to error if its key assumptions are not valid, butits results show good agreement with charge distributionsinferred from balloon-borne electric field soundings[Coleman et al., 2003; Rust et al., 2005], and it has beensuccessfully applied by other researchers [e.g., Wiens et al.,2005] to infer physically reasonable gross charge distribu-tions in thunderstorms. Because of the large number offlashes in this MCS, charge was sorted only for selectedshort time periods (1–10 min each) and locations.
3.3. Other Data
[28] The National Lightning Detection Network (NLDN)data were analyzed following Wiens et al. [2005]. Similar tothe LMA flash classification, strike locations were classifiedas convective, transition, or stratiform based on compar-isons with KGLD grids. The NLDN is known to occasion-ally misclassify IC flashes as CGs of either polarity [e.g.,Cummins et al., 1998]. No corrections were made for this,but it was noted whenever LMA data suggested that NLDNmisclassification had occurred. Misclassifications were un-common enough that they did not seriously impact anyresults. Temperatures at various altitudes were provided bya balloon sounding launched through the transition zone ofthe MCS near 2309. Severe weather reports came from theNational Climate Data Center and the Storm PredictionCenter, and included latitude and longitude locations, soreports could be matched to the MCS. Severe weatherreports are susceptible to substantial inaccuracies in timingand location [e.g., Williams et al., 1999; Witt et al., 1998a,
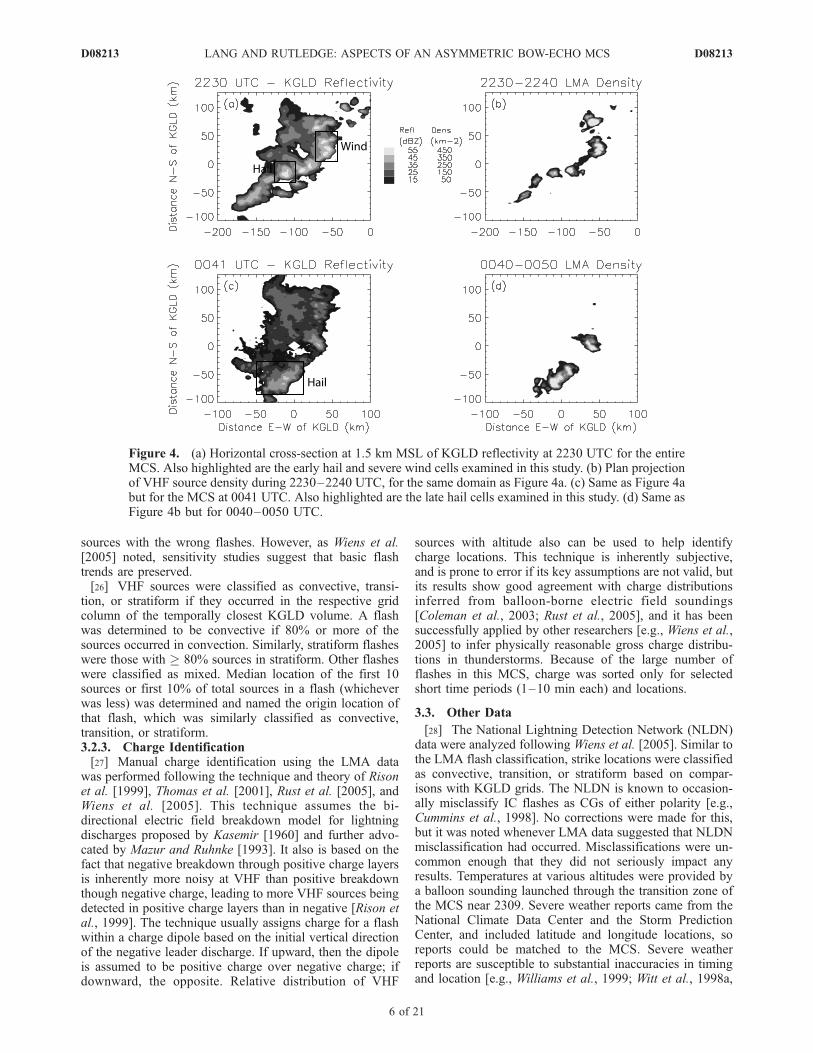
Figure 4. (a) Horizontal cross-section at 1.5 km MSL of KGLD reflectivity at 2230 UTC for the entireMCS. Also highlighted are the early hail and severe wind cells examined in this study. (b) Plan projectionof VHF source density during 2230–2240 UTC, for the same domain as Figure 4a. (c) Same as Figure 4abut for the MCS at 0041 UTC. Also highlighted are the late hail cells examined in this study. (d) Same asFigure 4b but for 0040–0050 UTC.
D08213 LANG AND RUTLEDGE: ASPECTS OF AN ASYMMETRIC BOW-ECHO MCS
6 of 21
D08213
1998b], so they were interpreted only in the context ofcorroborating radar data.
4. Observations
4.1. Evolution of the Entire MCS
[29] Figure 2 shows lightning flash rates for the entireMCS during the analysis period (2100–0150). There weretwo convective peaks in this MCS, both associated withsevere weather. One occurred around 2230. During this timeperiod total flash rate peaked near 600 min�1, with �CGflash rates between 10 and 15 min�1, and +CG flash ratesbetween 5 and 10 min�1. Over the 2200 hour roughly one-third of all CGs were positive. Severe weather included upto 3.8-cm diameter hail and wind gusts up to 29 m s�1. Thiswind report coincided with the bow echo in this storm. Thesecond convective peak occurred after 0000, when CG rates
again peaked between 10 and 15 min�1. Total flash rateswere still high (�300 min�1), but lower than the previouspeak. Interestingly, during the 0000–0150 time period only5% of all CGs were positive. During this period there weretwo reports at 0045 of hail greater than or equal to 2 cm indiameter.[30] Convection dominated the electrical behavior of this
MCS, with total convective VHF sources �105 min�1
throughout the observation period, while transition regionsproduced �104 sources min�1 and stratiform produced�103 sources min�1. Thus approximately 99% of allVHF sources occurred in or within 10 km of intenseconvection. Figure 3 shows time-height distributions ofVHF sources and KGLD reflectivity statistics for theportions of the MCS identified as convective and stratiform.Prior to 2200, VHF activity was mainly confined to theupper regions of the convection, around 9 km (�30�C;
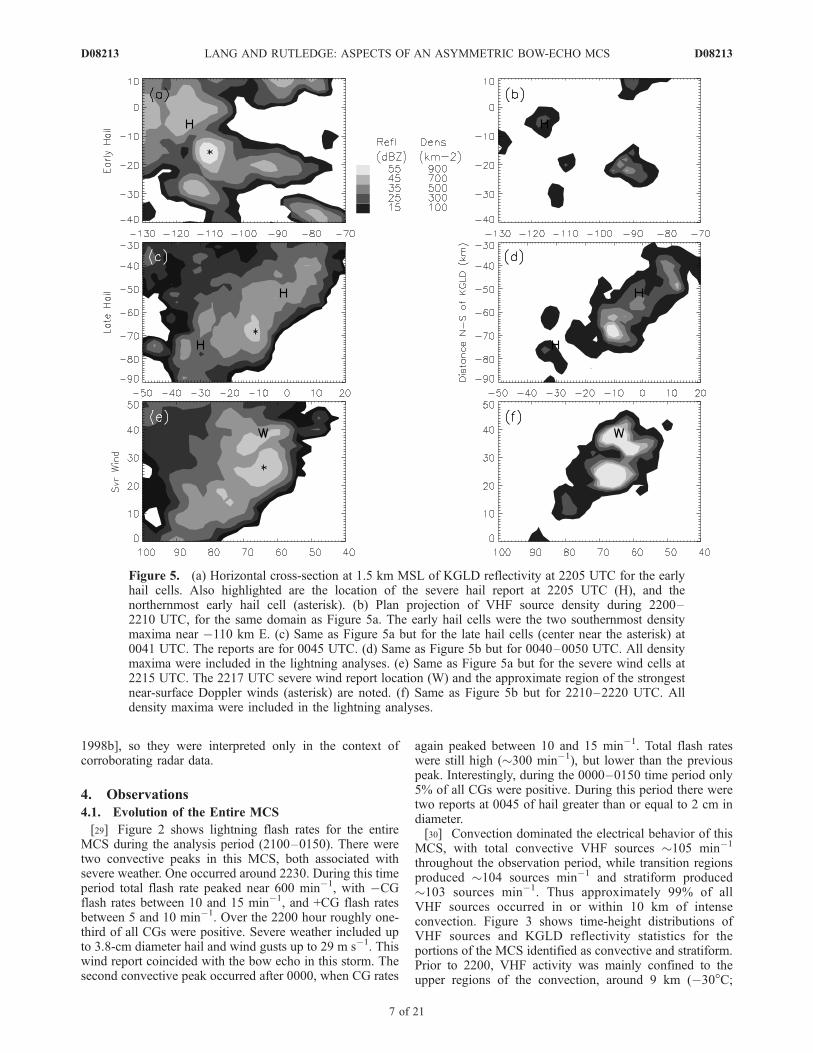
Figure 5. (a) Horizontal cross-section at 1.5 km MSL of KGLD reflectivity at 2205 UTC for the earlyhail cells. Also highlighted are the location of the severe hail report at 2205 UTC (H), and thenorthernmost early hail cell (asterisk). (b) Plan projection of VHF source density during 2200–2210 UTC, for the same domain as Figure 5a. The early hail cells were the two southernmost densitymaxima near �110 km E. (c) Same as Figure 5a but for the late hail cells (center near the asterisk) at0041 UTC. The reports are for 0045 UTC. (d) Same as Figure 5b but for 0040–0050 UTC. All densitymaxima were included in the lightning analyses. (e) Same as Figure 5a but for the severe wind cells at2215 UTC. The 2217 UTC severe wind report location (W) and the approximate region of the strongestnear-surface Doppler winds (asterisk) are noted. (f) Same as Figure 5b but for 2210–2220 UTC. Alldensity maxima were included in the lightning analyses.
D08213 LANG AND RUTLEDGE: ASPECTS OF AN ASYMMETRIC BOW-ECHO MCS
7 of 21
D08213
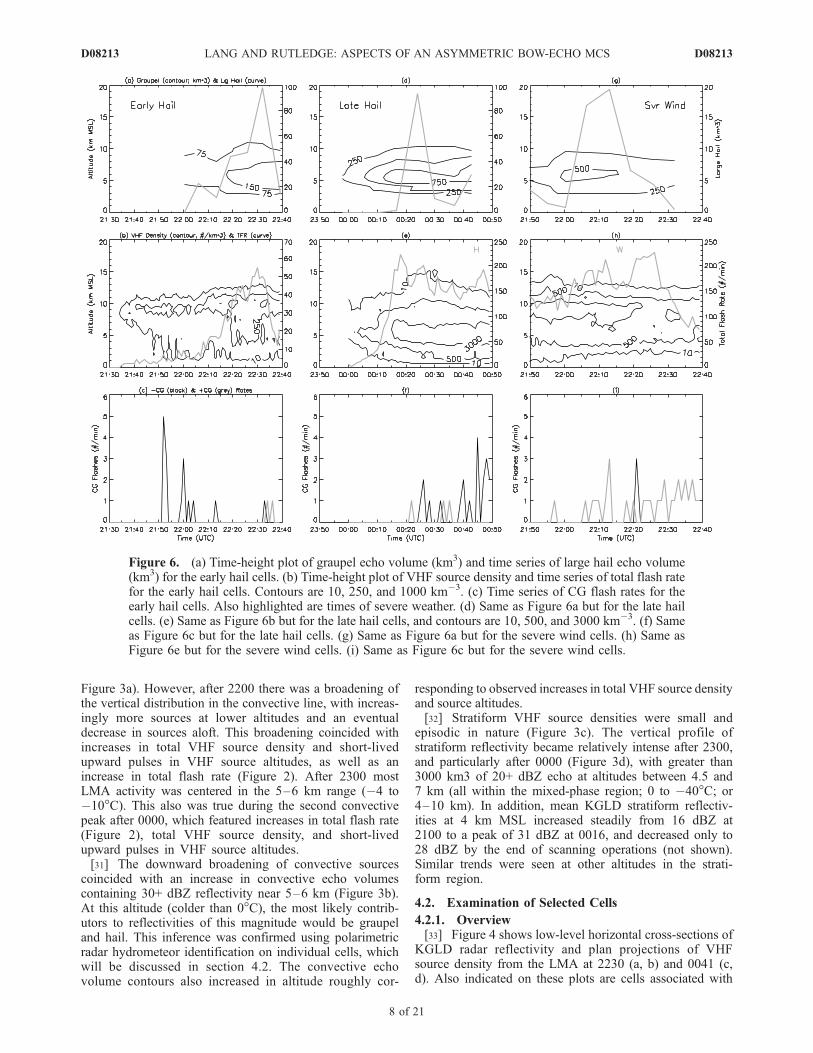
Figure 3a). However, after 2200 there was a broadening ofthe vertical distribution in the convective line, with increas-ingly more sources at lower altitudes and an eventualdecrease in sources aloft. This broadening coincided withincreases in total VHF source density and short-livedupward pulses in VHF source altitudes, as well as anincrease in total flash rate (Figure 2). After 2300 mostLMA activity was centered in the 5–6 km range (�4 to�10�C). This also was true during the second convectivepeak after 0000, which featured increases in total flash rate(Figure 2), total VHF source density, and short-livedupward pulses in VHF source altitudes.[31] The downward broadening of convective sources
coincided with an increase in convective echo volumescontaining 30+ dBZ reflectivity near 5–6 km (Figure 3b).At this altitude (colder than 0�C), the most likely contrib-utors to reflectivities of this magnitude would be graupeland hail. This inference was confirmed using polarimetricradar hydrometeor identification on individual cells, whichwill be discussed in section 4.2. The convective echovolume contours also increased in altitude roughly cor-
responding to observed increases in total VHF source densityand source altitudes.[32] Stratiform VHF source densities were small and
episodic in nature (Figure 3c). The vertical profile ofstratiform reflectivity became relatively intense after 2300,and particularly after 0000 (Figure 3d), with greater than3000 km3 of 20+ dBZ echo at altitudes between 4.5 and7 km (all within the mixed-phase region; 0 to �40�C; or4–10 km). In addition, mean KGLD stratiform reflectiv-ities at 4 km MSL increased steadily from 16 dBZ at2100 to a peak of 31 dBZ at 0016, and decreased only to28 dBZ by the end of scanning operations (not shown).Similar trends were seen at other altitudes in the strati-form region.
4.2. Examination of Selected Cells
4.2.1. Overview[33] Figure 4 shows low-level horizontal cross-sections of
KGLD radar reflectivity and plan projections of VHFsource density from the LMA at 2230 (a, b) and 0041 (c,d). Also indicated on these plots are cells associated with
Figure 6. (a) Time-height plot of graupel echo volume (km3) and time series of large hail echo volume(km3) for the early hail cells. (b) Time-height plot of VHF source density and time series of total flash ratefor the early hail cells. Contours are 10, 250, and 1000 km�3. (c) Time series of CG flash rates for theearly hail cells. Also highlighted are times of severe weather. (d) Same as Figure 6a but for the late hailcells. (e) Same as Figure 6b but for the late hail cells, and contours are 10, 500, and 3000 km�3. (f) Sameas Figure 6c but for the late hail cells. (g) Same as Figure 6a but for the severe wind cells. (h) Same asFigure 6e but for the severe wind cells. (i) Same as Figure 6c but for the severe wind cells.
D08213 LANG AND RUTLEDGE: ASPECTS OF AN ASYMMETRIC BOW-ECHO MCS
8 of 21
D08213
significant hail and severe wind, which will be discussed inthis section. At the earlier time, convection was active allalong the leading line of the MCS, and a nascent stratiformregion was developing rearward of this line, particularly inthe north. There is significant bowing of the convective line,and the cell producing severe winds is contained within thisbow echo. (When we refer to ‘‘bow echo’’, we merely meanthe portion of the convective line that is bowing, not theentire storm.) By the later time period, the strongest con-vection was in the southern portion of the MCS, while themature stratiform region was north of this convection.Overall, the structure of this MCS identifies it as asymmet-ric [Houze et al., 1990].[34] The evolution of individual cells associated with
significant hail and severe wind was examined. One diffi-culty with this analysis was that the close proximity of cellsmade it hard to distinguish them from one another. Inaddition, there was ambiguity in the assignment of severeweather reports to particular cells. For example, the threesevere hail reports between 2200 and 2230 (Figure 2) alloccurred within a complex of several closely located cells(within 10–30 km of one another). Considering that up to75% of severe weather reports are not accurate to within5 min [Williams et al., 1999], that up to 30% of all severe
hail reports cannot be associated with specific radar-observed cells [Witt et al., 1998a, 1998b], and that thisstorm was located in a rural area where severe weatherreporting is limited, we did not always attempt to match hailreports to specific cells. Details of how we treated individ-ual hail reports are given in the following sub-sections.[35] For the case of severe wind, dual-Doppler syntheses
were used to identify the cell with the most intense near-surface winds, which were closest in space and time to thesevere wind report. In all cases, VHF source spatial densitywas plotted against radar data to subjectively isolate (usingXLMA) the desired cells from the lightning perspective.Small enough density minima were found between cells inorder to effectively isolate them from one another, enough torecover basic trends such as flash rates and vertical evolutionof VHF source activity. Figure 5 shows three different sets ofcells, examined later in this section, that were responsible forsignificant hail and severe winds in this MCS.4.2.2. Early Cells With Significant Hail[36] The ‘‘early hail’’ cells (Figures 5a and 5b) were a set
of two cells that produced significant quantities of radar-inferred large hail (D > 2 cm; i.e., severe-sized). They werea subset of a large complex of cells that was responsible forup to three severe hail reports between 2205 and 2230.
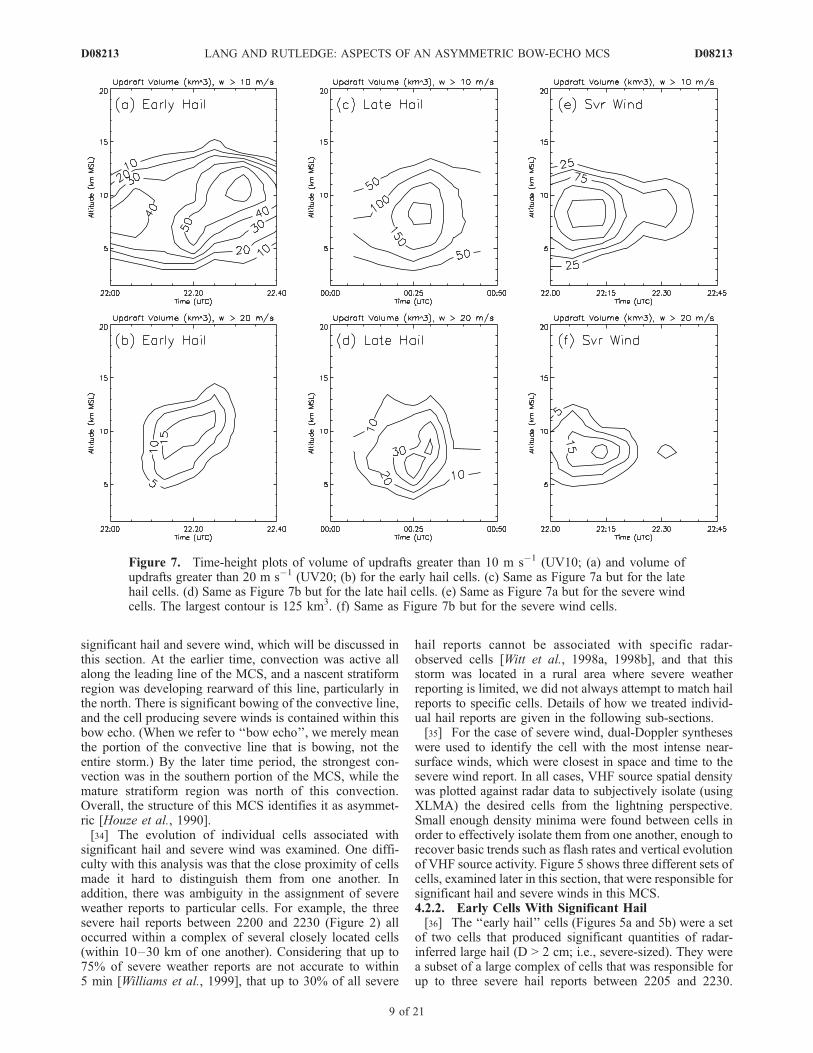
Figure 7. Time-height plots of volume of updrafts greater than 10 m s�1 (UV10; (a) and volume ofupdrafts greater than 20 m s�1 (UV20; (b) for the early hail cells. (c) Same as Figure 7a but for the latehail cells. (d) Same as Figure 7b but for the late hail cells. (e) Same as Figure 7a but for the severe windcells. The largest contour is 125 km3. (f) Same as Figure 7b but for the severe wind cells.
D08213 LANG AND RUTLEDGE: ASPECTS OF AN ASYMMETRIC BOW-ECHO MCS
9 of 21
D08213

Because of the uncertainties in the reports, we did not matchindividual cells to severe hail reports. Instead, we chose toexamine the two cells we did because they featured inter-esting microphysical, kinematic, and electrical evolutionthat was representative of the evolution of much of theconvective line around this time. Figures 6a–6c show timeseries of HID graupel and hail (Figure 6a); VHF sourcedensity and total flash rate (b); and CG flash rates (c) forthese cells. These cells averaged about 83 km from theLMA network center, within the 1-km vertical resolutionthreshold for quality 3D analysis.[37] In general, increasing amounts of polarimetrically
identified large hail occurred during a rapid increase in totalflash rate, as well as an overall increase in VHF sourcedensity and altitudes. There were small spikes in �CG flashrates (Figure 6c) prior to and coincident with the onset ofhail, with little +CG activity, but flash rates averaged lessthan 1 min�1. Thus similar to some of the storms studied byLang et al. [2000] and Lang and Rutledge [2002], thesecells were associated with few CGs overall.[38] One of the most interesting results was that downward
broadening of VHF source density (from the maximum at9 km) began when significant graupel was identified at loweraltitudes (5–6 km) after 2215 (Figures 6a and 6b). Thisintensification occurred as the second cell, which originallyformed ahead of the convective line, was incorporated fullyinto the MCS, and could be related to the formation anddescent of charge-carrying ice particles from middle to lowerlevels in the storm [MacGorman et al., 1989].[39] Figure 7 shows the kinematic evolution of this cell
complex, with dual-Doppler updraft volumes greater than
10 m s�1 (UV10; Figure 7a) and 20 m s�1 (UV20;Figure 7b) plotted as time- height evolution. Both UV10and UV20 filled most of the mixed-phase region. UV10reached over 50 km3 within the mixed-phase region by2220, as the hail and total lightning time series were rapidlyincreasing, and the downward broadening in VHF sourcedensity was occurring (Figures 6a and 6b). UV20 hit itsmixed-phase maximum about 10 min prior to the UV10maximum.[40] Figure 8 shows the spatial and temporal evolution of
lightning-inferred charge structure in these cells. Early on, thecells contained upper positive charge near 9 km (�30�C),withmid- level negative charge near 7 km (�16�C). Later, thecells developed lower positive charge near 4 km (1�C). Inother words, as they intensified the cells evolved from anormal-polarity dipole to a normal tripole [Williams, 1989].Similar evolution was observed in most of the convective linearound this time.[41] Figure 9 shows the microphysical and kinematic
structure of these cells at 2213, along with two flashes thatrevealed the electrical structure. The flashes, an IC betweenthe upper dipole and a �CG involving the mid-levelnegative and lower positive charge layers, occurred inregions of graupel and hail, near the main updraft of thiscell. Note that the lateral displacement of the upper-leveldipole to the east late in the complex’s lifetime (Figure 8)appeared to be associated with southwesterly flow aloft, asshown in the plotted IC flash (Figure 9).4.2.3. Late Cells With Severe Hail[42] Figures 6d–6f show the microphysical and electrical
evolution of the cell complex that produced two separate
Figure 8. Vertical projections of VHF source density associated with positive (filled gray) and negative(black) charge for three different time periods in the early hail cells, in the E-W (left) and N-S (right)planes. Contour levels are ±60 km�2.
D08213 LANG AND RUTLEDGE: ASPECTS OF AN ASYMMETRIC BOW-ECHO MCS
10 of 21
D08213
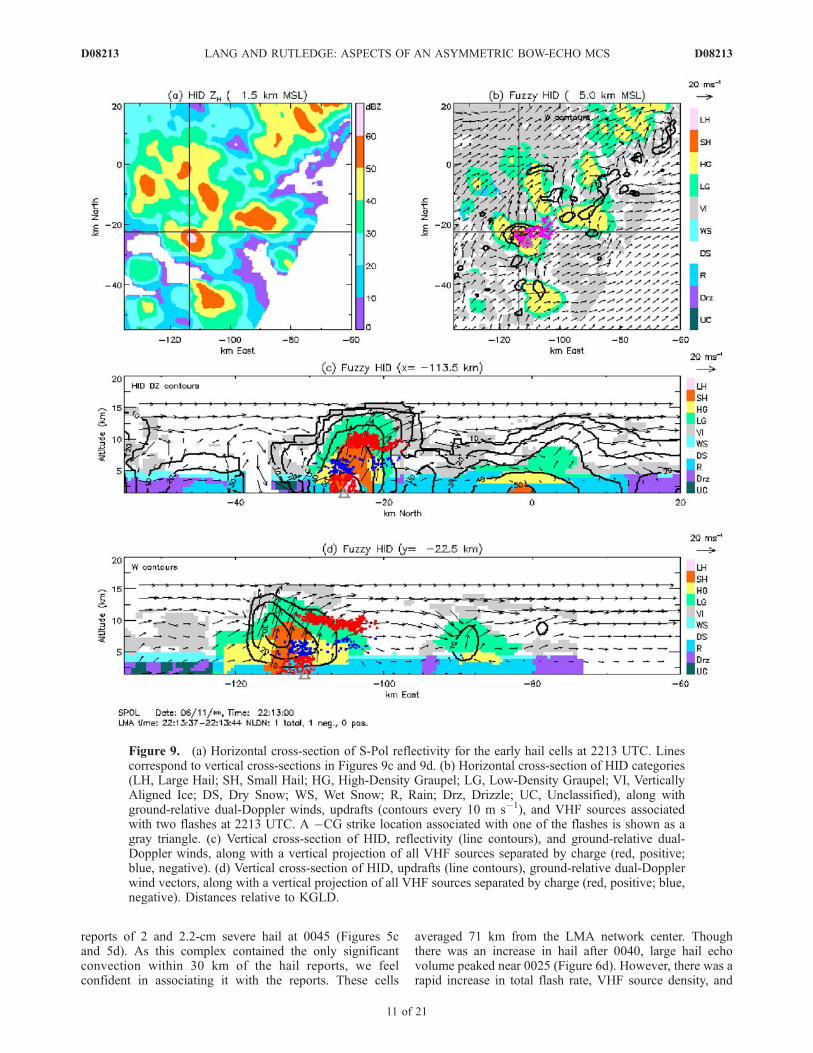
reports of 2 and 2.2-cm severe hail at 0045 (Figures 5cand 5d). As this complex contained the only significantconvection within 30 km of the hail reports, we feelconfident in associating it with the reports. These cells
averaged 71 km from the LMA network center. Thoughthere was an increase in hail after 0040, large hail echovolume peaked near 0025 (Figure 6d). However, there was arapid increase in total flash rate, VHF source density, and
Figure 9. (a) Horizontal cross-section of S-Pol reflectivity for the early hail cells at 2213 UTC. Linescorrespond to vertical cross-sections in Figures 9c and 9d. (b) Horizontal cross-section of HID categories(LH, Large Hail; SH, Small Hail; HG, High-Density Graupel; LG, Low-Density Graupel; VI, VerticallyAligned Ice; DS, Dry Snow; WS, Wet Snow; R, Rain; Drz, Drizzle; UC, Unclassified), along withground-relative dual-Doppler winds, updrafts (contours every 10 m s�1), and VHF sources associatedwith two flashes at 2213 UTC. A �CG strike location associated with one of the flashes is shown as agray triangle. (c) Vertical cross-section of HID, reflectivity (line contours), and ground-relative dual-Doppler winds, along with a vertical projection of all VHF sources separated by charge (red, positive;blue, negative). (d) Vertical cross-section of HID, updrafts (line contours), ground-relative dual-Dopplerwind vectors, along with a vertical projection of all VHF sources separated by charge (red, positive; blue,negative). Distances relative to KGLD.
D08213 LANG AND RUTLEDGE: ASPECTS OF AN ASYMMETRIC BOW-ECHO MCS
11 of 21
D08213
maximum height of VHF sources (�15 km MSL) prior to0020, providing warning that these cells were intensifyingand had severe weather potential (Figure 6e).[43] Similar to the early hail cells, CG lightning activity
was very low (<1 min�1); however, there was an increase in�CG flash rate after 0040 (Figure 6f). Unlike the earlierperiod (Figure 6b), there was no maximum in VHF sourcedensity located near 9 km MSL (Figure 6e). Recall that thiscell complex occurred during the second convective peak(Figure 2), when the upper-level VHF density maximumwas missing from the convective line in general (Figure 3a).However, there was additional evidence for a possible linkbetween graupel at 5–6 km and the development ofsignificant VHF activity in this region, as the maxima ingraupel and VHF density were nearly collocated in time andspace.[44] UV10 and UV20 (Figures 7c and 7d) peaked within
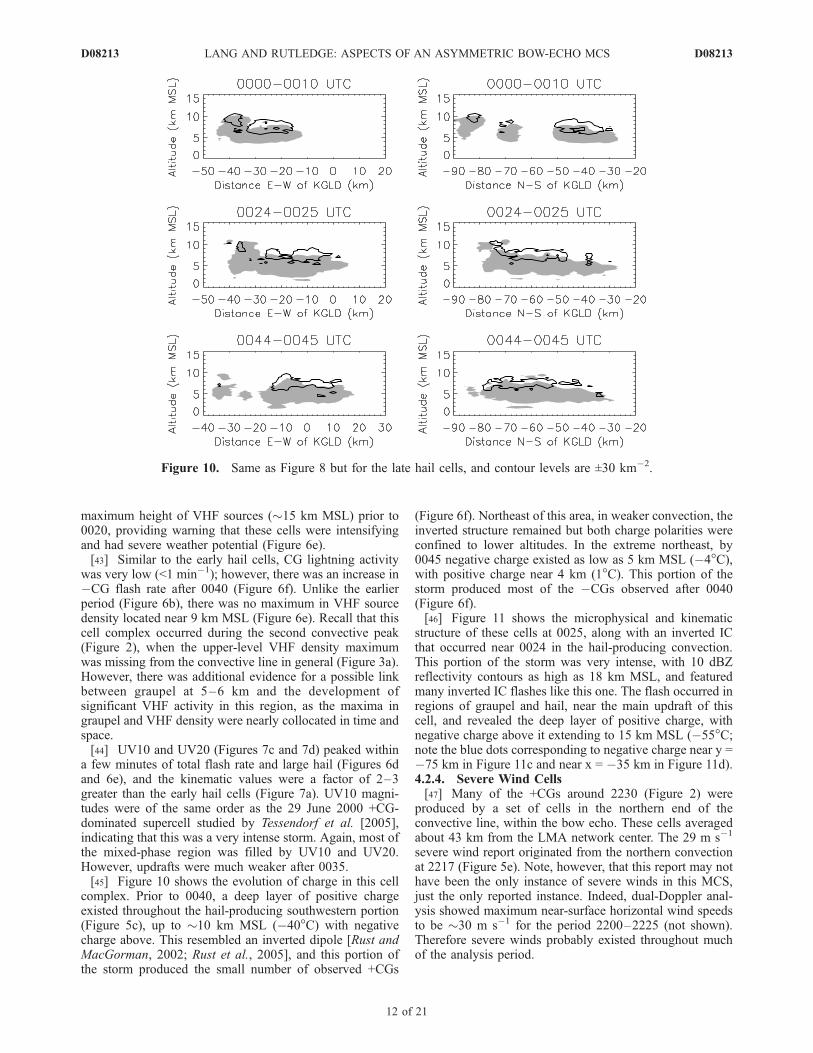
a few minutes of total flash rate and large hail (Figures 6dand 6e), and the kinematic values were a factor of 2–3greater than the early hail cells (Figure 7a). UV10 magni-tudes were of the same order as the 29 June 2000 +CG-dominated supercell studied by Tessendorf et al. [2005],indicating that this was a very intense storm. Again, most ofthe mixed-phase region was filled by UV10 and UV20.However, updrafts were much weaker after 0035.[45] Figure 10 shows the evolution of charge in this cell
complex. Prior to 0040, a deep layer of positive chargeexisted throughout the hail-producing southwestern portion(Figure 5c), up to �10 km MSL (�40�C) with negativecharge above. This resembled an inverted dipole [Rust andMacGorman, 2002; Rust et al., 2005], and this portion ofthe storm produced the small number of observed +CGs
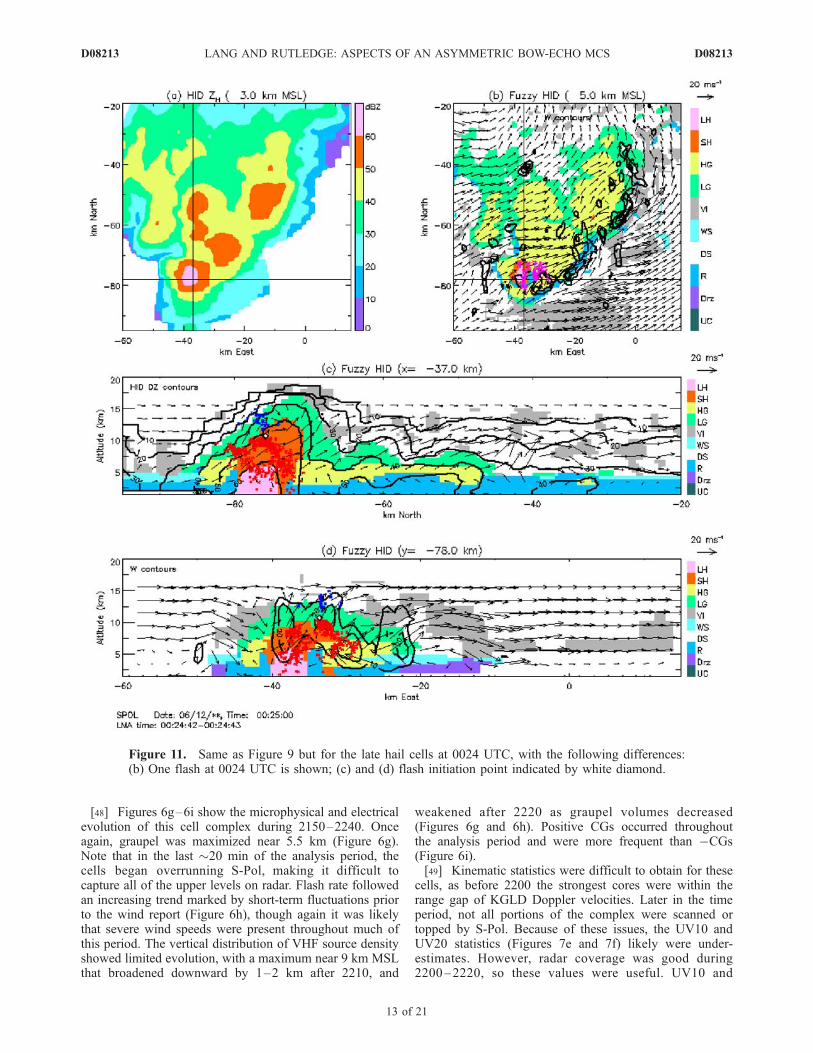
(Figure 6f). Northeast of this area, in weaker convection, theinverted structure remained but both charge polarities wereconfined to lower altitudes. In the extreme northeast, by0045 negative charge existed as low as 5 km MSL (�4�C),with positive charge near 4 km (1�C). This portion of thestorm produced most of the �CGs observed after 0040(Figure 6f).[46] Figure 11 shows the microphysical and kinematic
structure of these cells at 0025, along with an inverted ICthat occurred near 0024 in the hail-producing convection.This portion of the storm was very intense, with 10 dBZreflectivity contours as high as 18 km MSL, and featuredmany inverted IC flashes like this one. The flash occurred inregions of graupel and hail, near the main updraft of thiscell, and revealed the deep layer of positive charge, withnegative charge above it extending to 15 km MSL (�55�C;note the blue dots corresponding to negative charge near y =�75 km in Figure 11c and near x = �35 km in Figure 11d).4.2.4. Severe Wind Cells[47] Many of the +CGs around 2230 (Figure 2) were
produced by a set of cells in the northern end of theconvective line, within the bow echo. These cells averagedabout 43 km from the LMA network center. The 29 m s�1
severe wind report originated from the northern convectionat 2217 (Figure 5e). Note, however, that this report may nothave been the only instance of severe winds in this MCS,just the only reported instance. Indeed, dual-Doppler anal-ysis showed maximum near-surface horizontal wind speedsto be �30 m s�1 for the period 2200–2225 (not shown).Therefore severe winds probably existed throughout muchof the analysis period.
Figure 10. Same as Figure 8 but for the late hail cells, and contour levels are ±30 km�2.
D08213 LANG AND RUTLEDGE: ASPECTS OF AN ASYMMETRIC BOW-ECHO MCS
12 of 21
D08213
[48] Figures 6g–6i show the microphysical and electricalevolution of this cell complex during 2150–2240. Onceagain, graupel was maximized near 5.5 km (Figure 6g).Note that in the last �20 min of the analysis period, thecells began overrunning S-Pol, making it difficult tocapture all of the upper levels on radar. Flash rate followedan increasing trend marked by short-term fluctuations priorto the wind report (Figure 6h), though again it was likelythat severe wind speeds were present throughout much ofthis period. The vertical distribution of VHF source densityshowed limited evolution, with a maximum near 9 km MSLthat broadened downward by 1–2 km after 2210, and
weakened after 2220 as graupel volumes decreased(Figures 6g and 6h). Positive CGs occurred throughoutthe analysis period and were more frequent than �CGs(Figure 6i).[49] Kinematic statistics were difficult to obtain for these
cells, as before 2200 the strongest cores were within therange gap of KGLD Doppler velocities. Later in the timeperiod, not all portions of the complex were scanned ortopped by S-Pol. Because of these issues, the UV10 andUV20 statistics (Figures 7e and 7f) likely were under-estimates. However, radar coverage was good during2200–2220, so these values were useful. UV10 and
Figure 11. Same as Figure 9 but for the late hail cells at 0024 UTC, with the following differences:(b) One flash at 0024 UTC is shown; (c) and (d) flash initiation point indicated by white diamond.
D08213 LANG AND RUTLEDGE: ASPECTS OF AN ASYMMETRIC BOW-ECHO MCS
13 of 21
D08213
UV20 were intermediate relative to corresponding values inthe other hail cells, and again filled the mixed-phase region.UV10 values were similar to the 29 June 2000 supercell[Tessendorf et al., 2005].[50] Figure 12 shows the charge evolution, which was
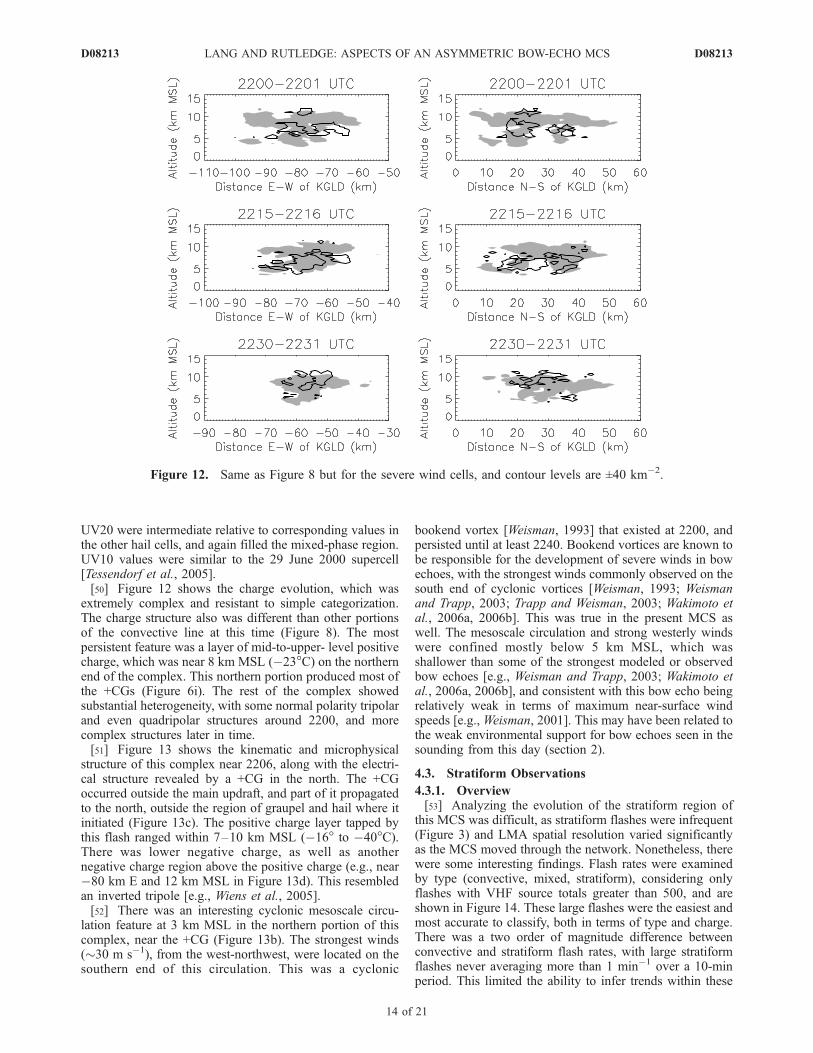
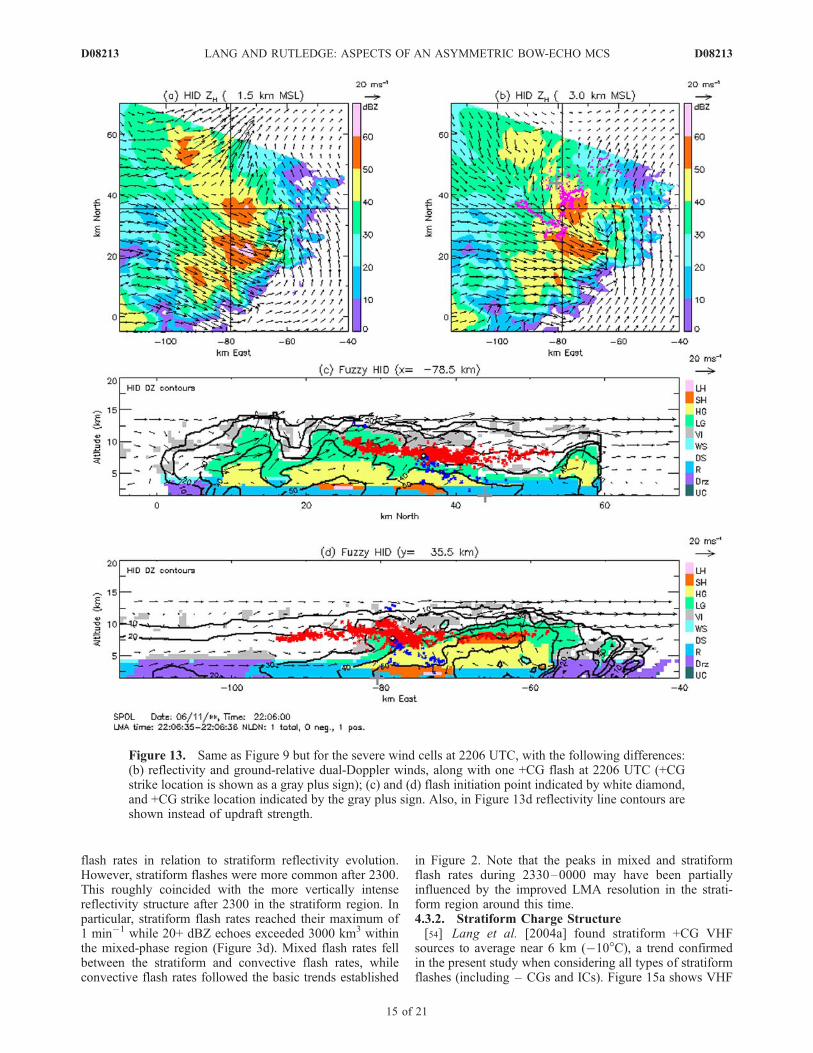
extremely complex and resistant to simple categorization.The charge structure also was different than other portionsof the convective line at this time (Figure 8). The mostpersistent feature was a layer of mid-to-upper- level positivecharge, which was near 8 km MSL (�23�C) on the northernend of the complex. This northern portion produced most ofthe +CGs (Figure 6i). The rest of the complex showedsubstantial heterogeneity, with some normal polarity tripolarand even quadripolar structures around 2200, and morecomplex structures later in time.[51] Figure 13 shows the kinematic and microphysical
structure of this complex near 2206, along with the electri-cal structure revealed by a +CG in the north. The +CGoccurred outside the main updraft, and part of it propagatedto the north, outside the region of graupel and hail where itinitiated (Figure 13c). The positive charge layer tapped bythis flash ranged within 7–10 km MSL (�16� to �40�C).There was lower negative charge, as well as anothernegative charge region above the positive charge (e.g., near�80 km E and 12 km MSL in Figure 13d). This resembledan inverted tripole [e.g., Wiens et al., 2005].[52] There was an interesting cyclonic mesoscale circu-
lation feature at 3 km MSL in the northern portion of thiscomplex, near the +CG (Figure 13b). The strongest winds(�30 m s�1), from the west-northwest, were located on thesouthern end of this circulation. This was a cyclonic
bookend vortex [Weisman, 1993] that existed at 2200, andpersisted until at least 2240. Bookend vortices are known tobe responsible for the development of severe winds in bowechoes, with the strongest winds commonly observed on thesouth end of cyclonic vortices [Weisman, 1993; Weismanand Trapp, 2003; Trapp and Weisman, 2003; Wakimoto etal., 2006a, 2006b]. This was true in the present MCS aswell. The mesoscale circulation and strong westerly windswere confined mostly below 5 km MSL, which wasshallower than some of the strongest modeled or observedbow echoes [e.g., Weisman and Trapp, 2003; Wakimoto etal., 2006a, 2006b], and consistent with this bow echo beingrelatively weak in terms of maximum near-surface windspeeds [e.g., Weisman, 2001]. This may have been related tothe weak environmental support for bow echoes seen in thesounding from this day (section 2).
4.3. Stratiform Observations
4.3.1. Overview[53] Analyzing the evolution of the stratiform region of
this MCS was difficult, as stratiform flashes were infrequent(Figure 3) and LMA spatial resolution varied significantlyas the MCS moved through the network. Nonetheless, therewere some interesting findings. Flash rates were examinedby type (convective, mixed, stratiform), considering onlyflashes with VHF source totals greater than 500, and areshown in Figure 14. These large flashes were the easiest andmost accurate to classify, both in terms of type and charge.There was a two order of magnitude difference betweenconvective and stratiform flash rates, with large stratiformflashes never averaging more than 1 min�1 over a 10-minperiod. This limited the ability to infer trends within these
Figure 12. Same as Figure 8 but for the severe wind cells, and contour levels are ±40 km�2.
D08213 LANG AND RUTLEDGE: ASPECTS OF AN ASYMMETRIC BOW-ECHO MCS
14 of 21
D08213
flash rates in relation to stratiform reflectivity evolution.However, stratiform flashes were more common after 2300.This roughly coincided with the more vertically intensereflectivity structure after 2300 in the stratiform region. Inparticular, stratiform flash rates reached their maximum of1 min�1 while 20+ dBZ echoes exceeded 3000 km3 withinthe mixed-phase region (Figure 3d). Mixed flash rates fellbetween the stratiform and convective flash rates, whileconvective flash rates followed the basic trends established
in Figure 2. Note that the peaks in mixed and stratiformflash rates during 2330–0000 may have been partiallyinfluenced by the improved LMA resolution in the strati-form region around this time.4.3.2. Stratiform Charge Structure[54] Lang et al. [2004a] found stratiform +CG VHF
sources to average near 6 km (�10�C), a trend confirmedin the present study when considering all types of stratiformflashes (including – CGs and ICs). Figure 15a shows VHF
Figure 13. Same as Figure 9 but for the severe wind cells at 2206 UTC, with the following differences:(b) reflectivity and ground-relative dual-Doppler winds, along with one +CG flash at 2206 UTC (+CGstrike location is shown as a gray plus sign); (c) and (d) flash initiation point indicated by white diamond,and +CG strike location indicated by the gray plus sign. Also, in Figure 13d reflectivity line contours areshown instead of updraft strength.
D08213 LANG AND RUTLEDGE: ASPECTS OF AN ASYMMETRIC BOW-ECHO MCS
15 of 21
D08213
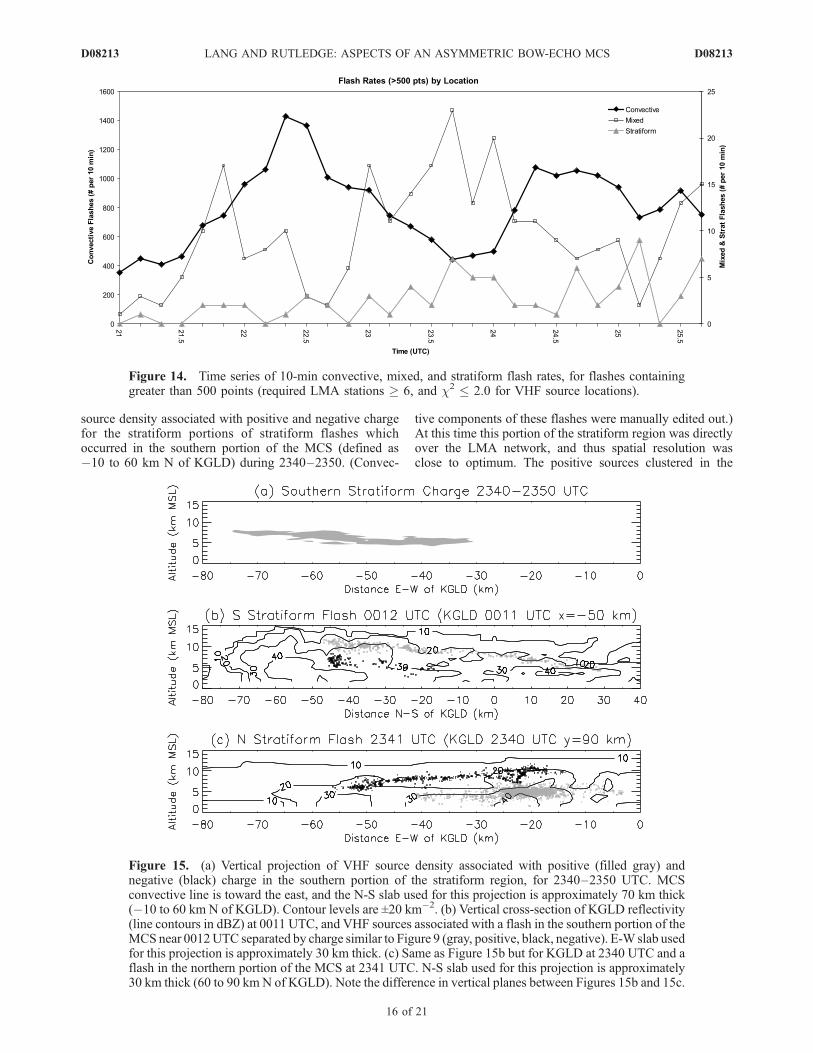
source density associated with positive and negative chargefor the stratiform portions of stratiform flashes whichoccurred in the southern portion of the MCS (defined as�10 to 60 km N of KGLD) during 2340–2350. (Convec-
tive components of these flashes were manually edited out.)At this time this portion of the stratiform region was directlyover the LMA network, and thus spatial resolution wasclose to optimum. The positive sources clustered in the
Figure 14. Time series of 10-min convective, mixed, and stratiform flash rates, for flashes containinggreater than 500 points (required LMA stations � 6, and c2 � 2.0 for VHF source locations).
Figure 15. (a) Vertical projection of VHF source density associated with positive (filled gray) andnegative (black) charge in the southern portion of the stratiform region, for 2340–2350 UTC. MCSconvective line is toward the east, and the N-S slab used for this projection is approximately 70 km thick(�10 to 60 km N of KGLD). Contour levels are ±20 km�2. (b) Vertical cross-section of KGLD reflectivity(line contours in dBZ) at 0011 UTC, and VHF sources associated with a flash in the southern portion of theMCS near 0012UTC separated by charge similar to Figure 9 (gray, positive, black, negative). E-W slab usedfor this projection is approximately 30 km thick. (c) Same as Figure 15b but for KGLD at 2340 UTC and aflash in the northern portion of the MCS at 2341 UTC. N-S slab used for this projection is approximately30 km thick (60 to 90 km N of KGLD). Note the difference in vertical planes between Figures 15b and 15c.
D08213 LANG AND RUTLEDGE: ASPECTS OF AN ASYMMETRIC BOW-ECHO MCS
16 of 21
D08213
range 5.5–7 km (�7�C to �16�C), with an upward tilttoward the western edge of the stratiform region. This wasconsistent with the inference of positive charge near 6 km.This charge layer remained active in producing lightning,and its altitude remained approximately constant, with somehorizontal heterogeneity, throughout the 5-h observationperiod.[55] The lower lightning pathway in the stratiform region
was the most common, especially late in this MCS’slifetime. However, there were occasional flashes along a
downward-sloping upper pathway, which due to their rarityare difficult to show in the averaged manner of Carey et al.[2005]. Some examples of these flashes are shown inFigures 15b and 15c. The first (Figure 15b) was a convec-tive IC with a significant stratiform component, whichoccurred near 0012 in a decaying cell that had upperpositive charge. (Most convection around this time lackedupper positive charge.) This IC was misclassified as a +CGby the NLDN, as the ‘‘ground strike’’ supposedly occurredduring rapid upward development of the discharge. The
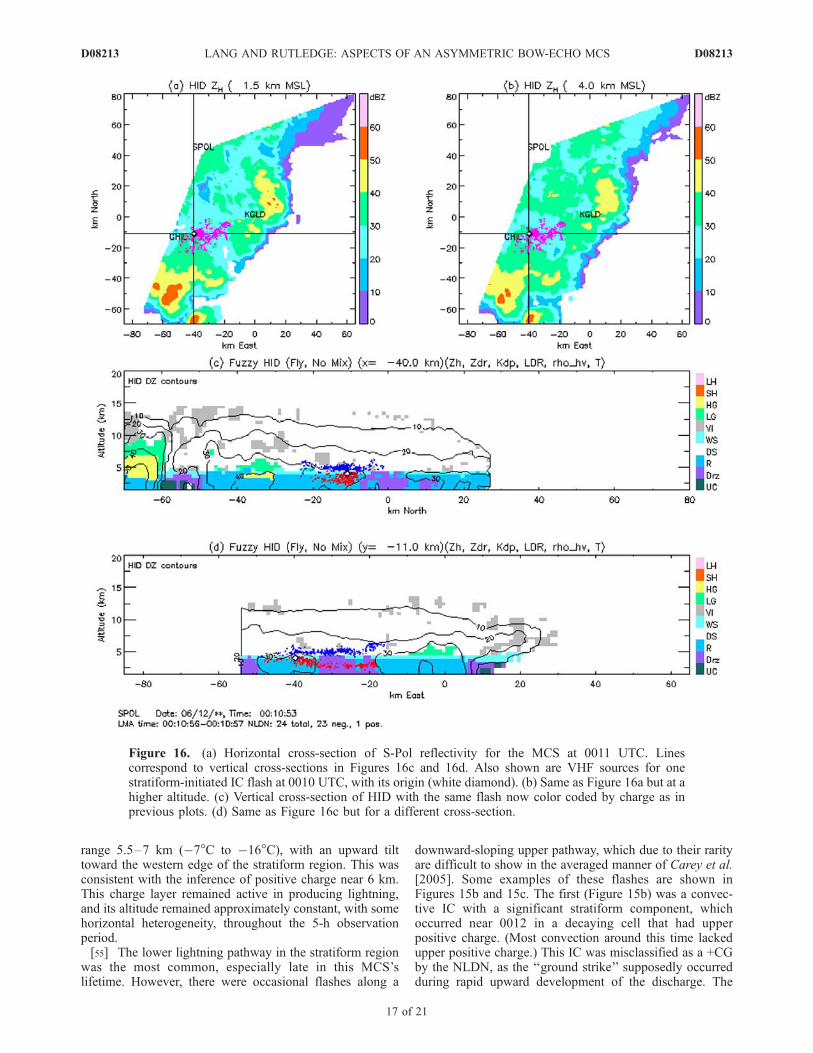
Figure 16. (a) Horizontal cross-section of S-Pol reflectivity for the MCS at 0011 UTC. Linescorrespond to vertical cross-sections in Figures 16c and 16d. Also shown are VHF sources for onestratiform-initiated IC flash at 0010 UTC, with its origin (white diamond). (b) Same as Figure 16a but at ahigher altitude. (c) Vertical cross-section of HID with the same flash now color coded by charge as inprevious plots. (d) Same as Figure 16c but for a different cross-section.
D08213 LANG AND RUTLEDGE: ASPECTS OF AN ASYMMETRIC BOW-ECHO MCS
17 of 21
D08213
positive charge component of the flash followed the resultsof Carey et al. [2005], with termination near the bright bandin the stratiform region. The flash also followed the down-ward sloping of the 20-dBZ contour. In addition, thenegative portion of the flash sloped downward outside ofconvection. Though still rare (0–2 per 10-min period),stratiform flashes along a downward-sloping pathway weremore common in the early lifetime of the MCS (2100–0000), when upper positive charge appeared in most cells.[56] The second example was an inverted IC flash that
occurred at 2341 in the northern portion of the MCS(defined as 60 to 90 km N of KGLD; Figure 15c). Thisportion of the storm developed an inverted polarity structureearlier than the southern portion containing the late hailcells, and the upper negative charge sloped downwardsimilar to the upper positive charge in Figure 15b. Recallthat around this time the southern portion of the MCSfeatured stratiform positive charge near 6 km MSL(Figure 15a); this was not as apparent in the northern partof the MCS, where this flash occurred.4.3.3. Stratiform-Initiated Flashes[57] Over the entire observation period, 137 flashes
(convective, mixed, or stratiform) with 500+ sources wereidentified as initiating within the stratiform region itself(compared to 22,776 large flashes initiating within theconvective line, and 996 within transition areas). A manualanalysis of the stratiform-initiated flashes found that atmost 25 initiated independently, without any other light-ning nearby in time and space. Of the remainder, 10 weremisclassified by this study’s algorithm due to noise or poorspatial resolution, 16 were due to sparking caused bycollisional charging of aircraft in ice clouds [Thomas etal., 2004], and 2 occurred in the forward anvil of theconvective line, which also could be classified as strati-form by the algorithm. All other remaining flashes werecomponents of very large complexes of multiple flashesinitiating in or near the convective line. The typical patternwas a large convective-initiated flash propagating into thestratiform region, a small gap in time (�50–100 ms), andthen the occurrence of a stratiform-initiated flash, begin-ning near the termination point of the original flash.Because of present uncertainties in the physics of strati-form flashes, it was difficult to say whether this was onelarge misclassified convective-initiated flash, or multipleflashes. This phenomenon may have been similar to the‘‘associated’’ lightning flashes studied by Mazur [1982]and Vonnegut et al. [1985]. These flashes were notconsidered in the analysis of stratiform-initiated flashes,because they appeared to be related to an initial dischargefrom the convective line.[58] Of the 25 independent stratiform-initiated flashes,
two occurred during 2320–2330 and the rest all occurredafter 0000. One of these flashes is shown in Figure 16. Itinitiated within the radar bright band (4 km), in wet snow.The stratiform flash subsequently tapped two layers ofcharge, including negative charge above the melting leveland positive charge below (Figures 16c–16d). To the extentthat spatial resolution allowed useful analysis, nearly allother stratiform- initiated flashes also occurred near thebright band, initiating between these two charge layers(always negative over positive). These charge layers gener-ally were situated below the main lower positive charge
layer that existed around 5.5–7 km MSL (Figure 15a),although multiple flashes tapping these charge layers rarelyoccurred in the same location (recall that stratiform light-ning was infrequent in this storm), and there was somehorizontal heterogeneity in flash altitudes in different por-tions of the stratiform region (e.g., Figure 15a).
5. Discussion and Conclusions
5.1. Convective Evolution
[59] Approximately 99% of VHF lightning sources in the11–12 June 2000 MCS occurred within 10 km of theconvective line. Time-height evolution of VHF sources, aswell as an examination of individual convective elements,indicated evolution during the first 3 h within much of theconvective line from a normal dipolar charge structure, withupper positive charge near 9 km (�30�C) over mid-levelnegative charge near 7 km (�16�C), to a normal-polaritytripole with lower positive charge near 4 km (1�C). Thistripolar structure, a result of the intensification of theconvective line, was broadly consistent with that of thesymmetric MCS observed by Carey et al. [2005], and wasassociated with the production of �CG flashes that tappedthe lower two charge layers [Mansell et al., 2002].[60] During the final 2 h, the charge structure resembled
an inverted dipole, with negative charge overlaying positivecharge. The relative altitudes of these charge layersdepended on the intensity of the convection in question.In the most intense cells, such as the southern portion of thelate hail cells, the positive charge layer extended up to10 km (�40�C), with negative charge up to 15 km (�55�C).Cells with these deep positive charge layers sometimesproduced +CG lightning. In weaker or decaying cells, suchas the northern portion of the late hail cells, the positivecharge was as low as 0�C, with negative charge near 5 km(�4�C). These cells sometimes produced �CGs.[61] A +CG-dominated cell complex was associated with
a cyclonic bookend vortex on the northern end of the bowecho. While other portions of the convective line at thesame time featured a normal tripole, the bow echo cellcomplex had an inverted tripolar structure in its northernportion, with mid-level positive charge near 8 km (�23�C).In the southern portion the charge structure was extremelycomplex and defied simple categorization. The fact thatthese charge structures were associated solely with the bowecho suggests that future work should examine if cellsassociated with bow echoes commonly feature atypicalcharge structures and lightning. In addition, because of thedifferences between the bow echo cells and the rest of theconvective line at this time (e.g., the early hail cells), thisstudy establishes that asymmetries in charge structure canoccur within the convective line of asymmetric MCSs, ashypothesized.[62] The various inverted electrical structures observed in
this MCS were very similar to those in other STEPS stormsanalyzed by Rust and MacGorman [2002], Lang et al.[2004b], Rust et al. [2005] and Wiens et al. [2005], withpositive charge layers of varying depths located at mid-levels within the storm (e.g., �10 to �20�C). Additionally,these inverted structures produced predominantly +CGlightning (except during decay), similar to previous studies.These results suggest that convective +CGs in other MCSs
D08213 LANG AND RUTLEDGE: ASPECTS OF AN ASYMMETRIC BOW-ECHO MCS
18 of 21
D08213
[e.g., Knupp et al., 1998] also may be produced by invertedcharge structures.[63] The results of this study were consistent with those
ofWiens et al. [2005], as the inverted charge structures wereassociated with large volumes of strong updrafts. As Langand Rutledge [2002] and Wiens et al. [2005] argued,stronger and broader updrafts should produce higher liquidwater contents, which would boost riming accretion ratesand enhance the probability of the riming particle gainingpositive charge at colder temperatures [e.g., Saunders andPeck, 1998]. Environmental data were not examined forpossible clues as to why this storm-wide change occurred,though the inverted structures occurred first in the northernportions of the MCS (Figure 15c).[64] In the severe portions of the MCS, large hail and
strong winds usually were associated with enhanced totallightning flash rate, increased VHF source density, andupward pulses in VHF source altitudes. Additionally, theselightning phenomena often occurred several minutes priorto the occurrence of large hail. This expected result supportsthe conclusions of Williams et al. [1999] and Hamlin et al.[2001], and suggests that relationships between lightningand severe weather in the convective line of MCSs aresimilar to those seen in isolated convection. The observedchanges in the gross vertical distribution of VHF sources(e.g., Figures 3 and 6), coupled with the development ofgraupel at low levels, may be important. Consistent withnon-inductive charging theory, both observations [e.g.,Wiens et al., 2005] and model simulations [e.g., Kuhlmanet al., 2006] support the inference that total lightning flashrate should reveal the development of graupel, as observed.The present study adds to previous work by suggesting thatthe vertical distribution of VHF lightning could be used as aproxy for locating graupel. Note that this study andTessendorf et al. [2005] showed that the development ofsignificant amounts of graupel often was associated with theoccurrence of large hail. This raises the possibility thatchanges in the vertical distribution of VHF sources couldconsistently precede the occurrence of large hail, as observedin this study. This may add another potential severe weather‘‘nowcasting’’ role for VHF lightning mapping data.
5.2. Stratiform Evolution
[65] In contrast with previous studies of asymmetricand bow-echo MCSs, the stratiform charge structure inthis MCS was similar to symmetric MCSs [Schuur andRutledge, 2000a; Carey et al., 2005], and most similar tothe Type A charge structure archetype of Marshall andRust [1993]. Positive charge existed near �10�C, and wasthe primary conduit for stratiform lightning initiated inconvection. There was evidence that this positive chargelayer was elevated in height far from the convective line,a finding not represented in current conceptual models ofstratiform electrification and charge structure [Stolzenburget al., 1998]. The elevation of this layer may have beencaused by the horizontal transport and weak lifting ofpositively charged cloud particles within the base of theascending front-to-rear flow that exists in many MCSs[Houze et al., 1990].[66] A secondary conduit containing positive charge
existed along a downward-sloping upper pathway thatstarted near �30�C and terminated near the bright band.
Negative charge existed near 0�C, with another positivecharge layer below this at temperatures above freezing.Because of a relative lack of stratiform flashes, and vari-ability in LMA spatial resolution because of storm motion,there was little evidence that this basic charge structureevolved in time. It appeared to not evolve, except that thesloping upper positive charge was replaced by negativecharge once inverted-polarity charge structures occurred inthe convective line.[67] This study’s results support the basic inferences of
Carey et al. [2005] that the sloping upper charge layer(positive or negative) in MCSs is caused by advection ofcharged ice particles, especially snow, from the convectiveline. However, as Carey et al. [2005] noted, this does notrule out an in situ charging mechanism also being active inthis layer as it descends.[68] The increase in vertical reflectivity intensity after
2300 in the STEPS MCS, along with the approximatelystationary positive charge layer at �10�C, was suggestiveof an in situ mechanism being active in this layer,following the arguments of Carey et al. [2005] and otherstudies. In addition, the polarity switch in charge layersabove and below the melting level was suggestive of an insitu charging mechanism based on melting in this region[Shepherd et al., 1996]. Whatever the nature of thisspeculated melting electrification mechanism (e.g., [seeShepherd et al., 1996] for different possibilities), it wasevidently the one most capable of generating strongenough electric fields to initiate lightning within thestratiform region itself, as opposed to merely providing aconduit for lightning initiated in the convective line.Moreover, the observation that nearly all stratiform-initiatedflashes started near the bright band was consistent with thewell-known enhanced lightning hazard to aircraft flying nearthis altitude in MCSs [e.g., Davis et al., 2004].
[69] Acknowledgments. We thank Kyle Wiens, Sarah Tessendorf,and Larry Carey for their valuable discussions and assistance with thisresearch. LMA data were provided by Paul Krehbiel, who also providedsubstantial assistance with their interpretation and analysis, as well asprovided insightful comments and suggestions on the manuscript. DaveRust and Don MacGorman of NOAA/NSSL provided the balloon soundingdata. NLDN data were provided by Vaisala. S-Pol and KGLD data wereprovided by NCAR. This research was funded by National ScienceFoundation grant ATM-0309303 from the Physical Meteorology program.The S-Pol radar is supported by the National Science Foundation.
ReferencesCarey, L., and S. Rutledge (1998), Electrical and multiparameter radarobservations of a severe hailstorm, J. Geophys. Res., 103(D12),13,979–14,000.
Carey, L. D., S. A. Rutledge, and W. A. Petersen (2003), The relation-ship between severe storm reports and cloud-to-ground lightning in thecontiguous United States from 1989 to 1998, Mon. Weather Rev., 131,1211–1228.
Carey, L. D., M. J. Murphy, T. L. McCormick, and N. W. S. Demetriades(2005), Lightning location relative to storm structure in a leading-line,trailing-stratiform mesoscale convective system, J. Geophys. Res., 110,D03105, doi:10.1029/2003JD004371.
Coleman, L. M., T. C. Marshall, M. Stolzenburg, T. Hamlin, P. R. Krehbiel,W. Rison, and R. J. Thomas (2003), Effects of charge and electrostaticpotential on lightning propagation, J. Geophys. Res., 108(D9), 4298,doi:10.1029/2002JD002718.
Cummins, K. L., M. J. Murphy, E. A. Bardo, W. L. Hiscox, R. B. Pyle, andA. E. Pifer (1998), A combined TOA/MDF technology upgrade of theU.S National Lightning Detection Network, J. Geophys. Res., 103(D8),9035–9044.
Davis, C., et al. (2004), The bow echo and MCV experiment: Observationsand opportunities, Bull Am. Meteorol. Soc., 85, 1075–1093.
D08213 LANG AND RUTLEDGE: ASPECTS OF AN ASYMMETRIC BOW-ECHO MCS
19 of 21
D08213
Hamlin, T., J. D. Harlin, P. R. Krehbiel, W. Rison, and R. J. Thomas (2001),Lightning as a detector of convective surges in thunderstorms, Eos Trans.Am. Geophys. Union, 82(Suppl.), Abstract AE12A-86.
Hill, R. D. (1988), Interpretation of bipole patterns in a mesoscale storm,Geophys. Res. Lett., 15(7), 643–644.
Houze, R. A., Jr., B. F. Smull, and P. Dodge (1990), Mesoscale organizationof springtime rainstorms in Oklahoma,Mon. Weather Rev., 118, 613–654.
Kasemir, H. W. (1960), A contribution to the electrostatic theory of light-ning discharge, J. Geophys. Res., 65(7), 1873–1878.
Knupp, K. R., B. Geerts, and S. J. Goodman (1998), Analysis of a small,vigorous, mesoscale convective system in a low-shear environment. PartI: Formation, radar echo structure, and lightning behavior, Mon. WeatherRev., 126, 1812–1836.
Kuhlman, K. M., C. L. Ziegler, E. R. Mansell, D. R. MacGorman, andJ. M. Straka (2006), Numerically simulated electrification and light-ning of the 29 June 2000 STEPS supercell storm, Mon. Weather Rev.,134, 2734–2757.
Lang, T. J., and S. A. Rutledge (2002), Relationships between convectivestorm kinematics, precipitation, and lightning, Mon. Weather Rev., 130,2492–2506.
Lang, T. J., S. A. Rutledge, J. E. Dye, M. Venticinque, P. Laroche, andE. Defer (2000), Anomalously low negative cloud-to-ground lightningflash rates in intense convective storms observed during STERAO-A,Mon. Weather Rev., 128, 160–173.
Lang, T. J., S. A. Rutledge, and K. C. Wiens (2004a), Origins of positivecloud-to-ground lightning flashes in the stratiform region of a mesoscaleconvective system, Geophys. Res. Lett., 31, L10105, doi:10.1029/2004GL019823.
Lang, T. J., et al. (2004b), The Severe Thunderstorm Electrification andPrecipitation Study (STEPS), Bull. Am. Meteorol. Soc., 85, 1107–1125.
Lyons,W. A., T. E. Nelson, E. R.Williams, S. A. Cummer, andM. A. Stanley(2003), Characteristics of sprite-producing positive cloud-to-groundlightning during the 19 July 2000 STEPS mesoscale convective systems,Mon. Weather Rev., 131, 2417–2427.
MacGorman, D. R., D. W. Burgess, V. Mazur, W. D. Rust, W. L. Taylor,and B. C. Johnson (1989), Lightning rates relative to tornadic stormevolution on 22 May 1981, J. Atmos. Sci., 46, 221–251.
Mansell, E. R., D. R. MacGorman, C. L. Ziegler, and J. M. Straka (2002),Simulated three-dimensional branched lightning in a numerical thunder-storm model, J. Geophys. Res., 107(D9), 4075, doi:10.1029/2000JD000244.
Marshall, T. C., and W. D. Rust (1993), Two types of vertical electricalstructures in stratiform precipitation regions of mesoscale convectivesystems, Bull. Am. Meteorol. Soc., 74, 2159–2170.
Mazur, V. (1982), Associated lightning discharges, Geophys. Res. Lett.,9(11), 1227–1230.
Mazur, V., and L.H. Ruhnke (1993),Commonphysical processes in natural andartificially triggered lightning, J. Geophys. Res., 98(D7), 12,913–12,930.
Nielsen, K. E., R. A. Maddox, and S. V. Vasiloff (1994), The evolution ofcloud-to-ground lightning within a portion of the 10–11 June 1985 squallline, Mon. Weather Rev., 122, 1809–1817.
Orville, R. E., R. W. Henderson, and L. F. Bosart (1988), Bipole patternsrevealed by lightning locations in mesoscale storm systems, Geophys.Res. Lett., 15(2), 129–132.
Petersen, W. A., S. A. Rutledge, and R. E. Orville (1996), Cloud-to-groundlightning observations from TOGA COARE: Selected results and light-ning location algorithms, Mon. Weather Rev., 124, 602–620.
Price, C. G., and B. P. Murphy (2002), Lightning activity during the 1999Superior derecho, Geophys. Res. Lett., 29(23), 2142, doi:10.1029/2002GL015488.
Rison, W., R. J. Thomas, P. R. Krehbiel, T. Hamlin, and J. Harlin (1999), AGPS-based three-dimensional lightning mapping system: Initial observa-tions in central New Mexico, Geophys. Res. Lett., 26(23), 3573–3576.
Rust, W. D., and D. R. MacGorman (2002), Possibly inverted-polarityelectrical structures in thunderstorms during STEPS, Geophys. Res. Lett.,29(12), 1571, doi:10.1029/2001GL014303.
Rust, W. D., D. R. MacGorman, and R. T. Arnold (1981a), Positivecloud-to-ground lightning flashes in severe storms, Geophys. Res. Lett.,8(7), 791–794.
Rust, W. D., D. R. MacGorman, and R. T. Arnold (1981b), Research on theelectrical properties of severe thunderstorms in the Great Plains, Bull. Am.Meteorol., 62, 1286–1293.
Rust, W. D., D. R. MacGorman, E. C. Buning, S. A. Weiss, P. R. Krehbiel,R. J. Thomas, W. Rison, and J. Harlin (2005), Inverted-polarity electricalstructures in thunderstorms in the Severe Thunderstorm ElectrificationStudy (STEPS), Atmos. Res., doi:10.1016/j.atmosres.2004.11.029.
Rutledge, S. A., and D. R. MacGorman (1988), Cloud-to-ground lightningactivity in the 10–11 June 1985 mesoscale convective system observedduring the Oklahoma-Kansas PRE-STORM project, Mon. Weather Rev.,116, 1393–1408.
Rutledge, S. A., and W. A. Petersen (1994), Vertical radar reflectivitystructure and cloud-to-ground lightning in the stratiform region of MCSs:Further evidence for in situ charging in the stratiform region, Mon.Weather Rev., 122, 1760–1776.
Rutledge, S. A., C. Lu, and D. R. MacGorman (1990), Positive cloud-to-ground lightning in mesoscale convective systems, J. Atmos. Sci., 47,2085–2100.
Rutledge, S. A., E. R. Williams, and W. A. Petersen (1993), Lightning andelectrical structure of mesoscale convective systems, Atmos. Res., 29,27–53.
Saunders, C. P. R., and S. L. Peck (1998), Laboratory studies of the influ-ence of the rime accretion rate on charge transfer during graupel/crystalcollisions, J. Geophys. Res., 103(D12), 13,949–13,956.
Schuur, T. J., and S. A. Rutledge (2000a), Electrification of stratiform regionsin mesoscale convective systems. Part I: An observational comparison ofsymmetric and asymmetric MCSs, J. Atmos. Sci., 57, 1961–1982.
Schuur, T. J., and S. A. Rutledge (2000b), Electrification of stratiformregions in mesoscale convective systems. Part II: Two-dimensional nu-merical model simulations of a symmetric MCS, J. Atmos. Sci., 57,1983–2006.
Shepherd, T. R., W. D. Rust, and T. C. Marshall (1996), Electric fieldsand charges near 0�C in stratiform clouds, Mon. Weather Rev., 124,919–938.
Steiner, M., R. A. Houze Jr., and S. E. Yuter (1995), Climatological char-acterization of three-dimensional storm structure from operational radarand rain gauge data, J. Appl. Meteorol., 34, 1978–2007.
Stolzenburg, M. (1990), Characteristic of the bipolar pattern of lightninglocations observed in 1988 thunderstorms, Bull. Am. Meteorol. Soc., 71,1331–1338.
Stolzenburg, M. (1994), Observations of high ground flash densities ofpositive lightning in summertime thunderstorms, Mon. Weather Rev.,122, 1740–1750.
Stolzenburg, M., W. D. Rust, B. F. Smull, and T. C. Marshall (1998),Electrical structure in thunderstorm convective regions. 1. Mesoscaleconvective systems, J. Geophys. Res., 103(D12), 14,059–14,078.
Stolzenburg, M., T. C. Marshall, and W. D. Rust (2001), Serial soundings ofelectric field through the mesoscale convective system, J. Geophys. Res.,106(D12), 12,371–12,380.
Tessendorf, S. A., L. J. Miller, K. C. Wiens, and S. A. Rutledge (2005), The29 June 2000 supercell observed during STEPS. Part I: Kinematics andmicrophysics, J. Atmos. Sci., 62, 4127–4150.
Thomas, R. J., T. Hamlin, J. Harlin, P. Krehbiel, W. Rison, and M. Stanley(2001), Thunderstorm charge structure and the spatial distribution ofradiation sources located by the LMA. Abstract AE12A-0081, FallAnn. Mtg. Am. Geophys. Union EOS Trans. AGU, 82(47).
Thomas, R., P. Krehbiel, W. Rison, J. Harlin, T. Hamlin, and N. Campbell(2003), The LMA flash algorithm, in 11th Int. Conf. on Atmos. Electr.,Int. Commission on Atmospheric, Versailles, France, pp. 655–656.
Thomas, R. J., P. R. Krehbiel, W. Rison, S. J. Hunyady, W. P. Winn,T. Hamlin, and J. Harlin (2004), Accuracy of the lightning mappingarray, J. Geophys. Res., 109, D14207, doi:10.1029/2004JD004549.
Trapp, R. J., and M. L. Weisman (2003), Low-level mesovortices withinsquall lines and bow echoes. Part II: Their genesis and implications,Mon.Weather Rev., 131, 2804–2823.
Vonnegut, B., O. H. Vaughan Jr., M. Brook, and P. Krehbiel (1985), Me-soscale observations of lightning from space shuttle, Bull. Am. Meteorol.Soc., 66, 20–29.
Wakimoto, R. M., H. V. Murphey, A. Nester, D. P. Jorgensen, and N. T.Atkins (2006a), High winds generated by bow echoes. Part I: Overviewof the Omaha bow echo 5 July 2003 storm during BAMEX, Mon.Weather Rev., 134, 2793–2812.
Wakimoto, R. M., H. V. Murphey, C. A. Davis, and N. T. Atkins (2006b),High winds generated by bow echoes. Part II: The relationship betweenthe mesovortices and damaging straight-line winds, Mon. Weather Rev.,134, 2813–2829.
Weisman, M. L. (1993), The genesis of severe, long-lived bow echoes,J. Atmos. Sci., 50, 645–670.
Weisman, M. L. (2001), Bow echoes: A tribute to T. T. Fujita, Bull. Am.Meteorol. Soc., 82, 97–116.
Weisman, M. L., and J. B. Klemp (1986), Characteristics of Isolated Con-vective Storms. Mesoscale Meteorology and Forecasting, edited by PeterS. Ray, Amer. Meteor. Soc., pp. 331–358.
Weisman, M. L., and R. J. Trapp (2003), Low-level mesovortices withinsquall lines and bow echoes. Part I: Overview and dependence on en-vironmental shear, Mon. Weather Rev., 131, 2779–2803.
Wiens, K. C., S. A. Rutledge, and S. A. Tessendorf (2005), The 29 June2000 supercell observed during STEPS. Part II: Lightning and chargestructure, J. Atmos. Sci., 62, 4151–4177.
Williams, E. R. (1989), The tripole structure of thunderstorms, J. Geophys.Res., 94(D11), 13,151–13,167.
D08213 LANG AND RUTLEDGE: ASPECTS OF AN ASYMMETRIC BOW-ECHO MCS
20 of 21
D08213

Williams, E., B. Boldi, A. Matlin, M. Weber, S. Hodanish, D. Sharp,S. Goodman, R. Raghavan, and D. Buechler (1999), The behavior oftotal lightning activity in severe Florida thunderstorms, Atmos. Res., 51,245–265.
Williams, E. R., V. Mushtak, D. Rosenfeld, S. Goodman, and D. Boccippio(2005), Thermodynamic conditions favorable to superlative thunderstormupdraft, mixed phase microphysics and lightning flash rate, Atmos. Res.,76, 288–306.
Witt, A., M. D. Eilts, G. J. Stumpf, J. T. Johnson, E. D. Mitchell, and K. W.Thomas (1998a), An enhanced hail detection algorithm for the WSR-88D, Weather Forecasting, 13, 286–303.
Witt, A., M. D. Eilts, G. J. Stumpf, E. D. Mitchell, J. T. Johnson, and K. W.Thomas (1998b), Evaluating the performance of WSR-88D severe stormdetection algorithms, Weather Forecasting, 13, 513–518.
Yuter, S. E., and R. A. Houze Jr. (1998), The natural variability of pre-cipitating clouds over the western Pacific warm pool, Q. J. R. Meteorol.Soc., 124, 53–99.
�����������������������T. J. Lang and S. A. Rutledge, Department of Atmospheric Science,
Colorado State University, 200 West Lake Street, Fort Collins, CO 80523,USA. ([email protected])
D08213 LANG AND RUTLEDGE: ASPECTS OF AN ASYMMETRIC BOW-ECHO MCS
21 of 21
D08213