Embed Size (px)
Citation preview
Keysight TechnologiesMIMO Performance and Condition Number in LTE Test
Application Note
Introduction
As companies rush to get Long Term Evolution (LTE)
products to market, engineers face tough challenges in
testing these often complex devices. The mandate to
include Multiple-Input Multiple-Output (MIMO) means
many engineers are working to optimize their multi-
antenna architectures. To achieve time-to-market goals,
the MIMO solutions under development need to work
correctly in real-world situations. Defining situations when
MIMO transmissions will improve system performance
can be complicated, but it is a critical aspect of
successful implementation.
Of particular interest is how to quickly determine whether a
MIMO channel is capable of supporting spatial multiplexing
under a given signal-to-noise ratio (SNR). Fortunately
with the proper test equipment, a figure of merit called
“condition number” can provide a short-term indication of
the SNR required to properly recover a MIMO transmission
over the selected wireless channel.
This application note will review the basic concepts of
MIMO with specific application to spatial multiplexing
in 3rd Generation Partnership Project (3GPP) LTE. It will
show measurements of channel coefficients and associated
condition numbers as they relate to the SNR at the LTE
receiver. How antenna and channel correlation affects
system performance will also be discussed, along with
recommendations for the best measurement tools to use
when developing LTE products and systems.
Multi-antenna wireless systems have been shown to
improve data capacity through spatial multiplexing and
improve system reliability through antenna diversity and
spatial coding such as Space-Time Block Coding (STBC)
and Space-Frequency Block Coding (SFBC). The suitability
of a MIMO wireless system for spatial multiplexing is
largely dependent on the characteristics of the wireless
channel, the antenna configuration and the ability of the
receiver to accurately recover the channel coupling matrix
coefficients. The complexity of the wireless channel
including channel correlation, interference and noise rate
may create difficulties when measuring the operation
and troubleshooting a MIMO system. Fortunately, the
operation of a LTE MIMO system with application to spatial
multiplexing can be quickly verified with a calculation of
the channel matrix “condition number” using a vector
signal analyzer (VSA) such as the Keysight Technologies,
Inc. 89601A. The condition number is a deterministic
calculation for evaluating the performance of the wireless
channel and estimating the associated increase in SNR
required for successful signal demodulation in the LTE
MIMO system. For example, a condition number close
to the ideal value of 0 dB would imply perfect channel
conditions for the application of spatial multiplexing, while
values greater than 10 dB would point to the need for a dB
per dB improvement in the relative SNR in order to properly
demodulate the MIMO transmission. It can also be shown
using the Keysight 89601A VSA that the channel matrix
and associated condition number is a function of subcarrier
frequency and time which may be a useful tool when
studying the effects of banding subcarriers at the evolved
Node B (eNB) for the highest performance.
3
Spatial multiplexing through MIMO offers an increase in
the transmission rate while using the same bandwidth
and total transmit power when compared to a traditional
Single-Input Single-Output (SISO) system. The theoretical
increase in capacity is linearly related to the number
of transmit/receive antenna pairs added to the MIMO
system, although in practice, spatial multiplexing requires
better channel conditions and higher SNR than an
equivalent SISO system. Antenna configurations found
in the LTE specifications [1] include the two transmit and
two receive antenna configuration, generally referred as
a “2x2”, and the four transmit and four receive antenna
configuration, or “4x4”. A MIMO system can also be
configured with an unequal number of antennas between
the transmitter and the receiver, such as the “4x2”
configuration, useful for combining spatial multiplexing
with antenna diversity. When using an unequal number
of antennas between the transmitter and receiver, the
MIMO capacity improvement is constrained by the smaller
number of antenna ports.
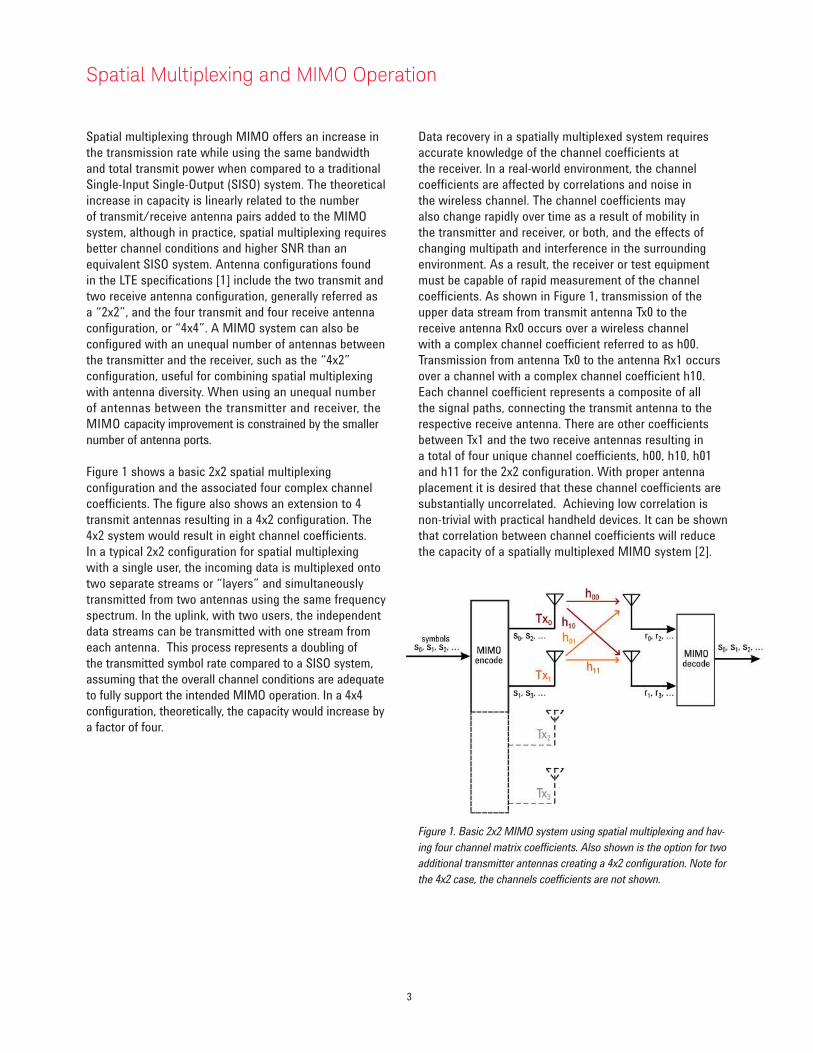
Figure 1 shows a basic 2x2 spatial multiplexing
configuration and the associated four complex channel
coefficients. The figure also shows an extension to 4
transmit antennas resulting in a 4x2 configuration. The
4x2 system would result in eight channel coefficients.
In a typical 2x2 configuration for spatial multiplexing
with a single user, the incoming data is multiplexed onto
two separate streams or “layers” and simultaneously
transmitted from two antennas using the same frequency
spectrum. In the uplink, with two users, the independent
data streams can be transmitted with one stream from
each antenna. This process represents a doubling of
the transmitted symbol rate compared to a SISO system,
assuming that the overall channel conditions are adequate
to fully support the intended MIMO operation. In a 4x4
configuration, theoretically, the capacity would increase by
a factor of four.
Data recovery in a spatially multiplexed system requires
accurate knowledge of the channel coefficients at
the receiver. In a real-world environment, the channel
coefficients are affected by correlations and noise in
the wireless channel. The channel coefficients may
also change rapidly over time as a result of mobility in
the transmitter and receiver, or both, and the effects of
changing multipath and interference in the surrounding
environment. As a result, the receiver or test equipment
must be capable of rapid measurement of the channel
coefficients. As shown in Figure 1, transmission of the
upper data stream from transmit antenna Tx0 to the
receive antenna Rx0 occurs over a wireless channel
with a complex channel coefficient referred to as h00.
Transmission from antenna Tx0 to the antenna Rx1 occurs
over a channel with a complex channel coefficient h10.
Each channel coefficient represents a composite of all
the signal paths, connecting the transmit antenna to the
respective receive antenna. There are other coefficients
between Tx1 and the two receive antennas resulting in
a total of four unique channel coefficients, h00, h10, h01
and h11 for the 2x2 configuration. With proper antenna
placement it is desired that these channel coefficients are
substantially uncorrelated. Achieving low correlation is
non-trivial with practical handheld devices. It can be shown
that correlation between channel coefficients will reduce
the capacity of a spatially multiplexed MIMO system [2].
Spatial Multiplexing and MIMO Operation
Figure 1. Basic 2x2 MIMO system using spatial multiplexing and hav-
ing four channel matrix coefficients. Also shown is the option for two
additional transmitter antennas creating a 4x2 configuration. Note for
the 4x2 case, the channels coefficients are not shown.
4
In LTE, the channel coefficients are measured using a “non-
blind” technique where predefined orthogonal frequency
division multiplexing (OFDM) reference signals (RS) are
simultaneously transmitted from each antenna. These
reference signals use different subcarriers and will be used
to directly measure the amplitude and phase response
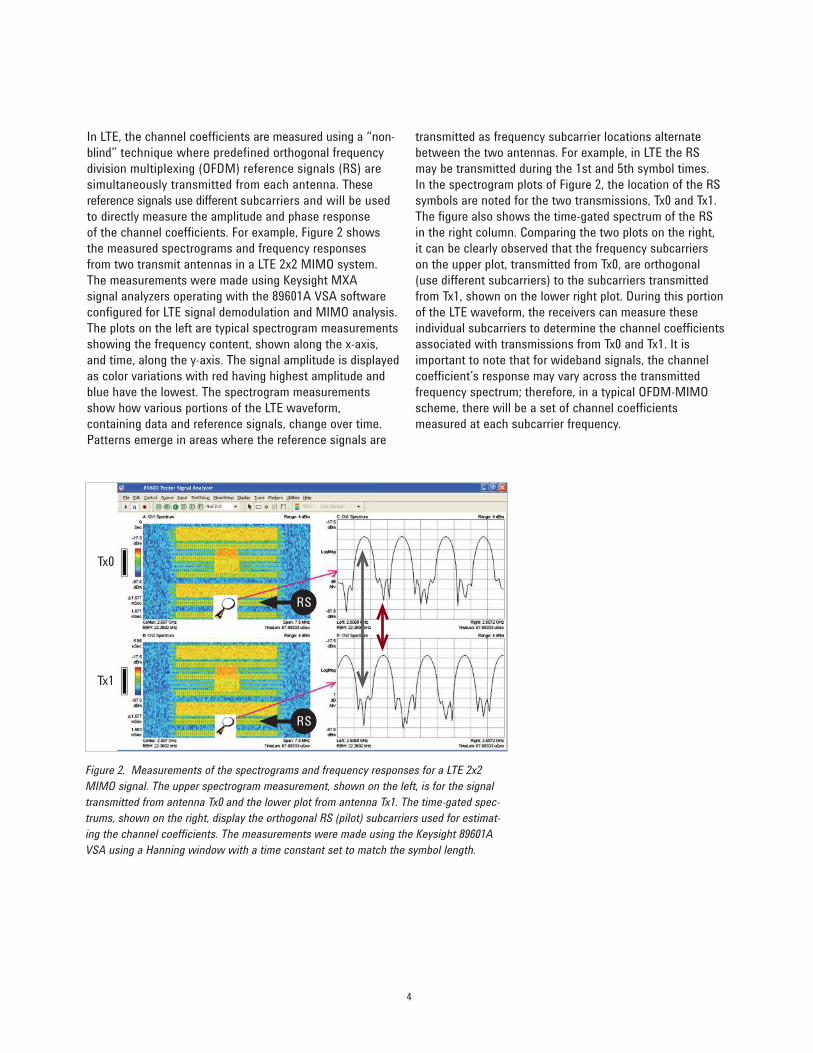
of the channel coefficients. For example, Figure 2 shows
the measured spectrograms and frequency responses
from two transmit antennas in a LTE 2x2 MIMO system.
The measurements were made using Keysight MXA
signal analyzers operating with the 89601A VSA software
configured for LTE signal demodulation and MIMO analysis.
The plots on the left are typical spectrogram measurements
showing the frequency content, shown along the x-axis,
and time, along the y-axis. The signal amplitude is displayed
as color variations with red having highest amplitude and
blue have the lowest. The spectrogram measurements
show how various portions of the LTE waveform,
containing data and reference signals, change over time.
Patterns emerge in areas where the reference signals are
transmitted as frequency subcarrier locations alternate
between the two antennas. For example, in LTE the RS
may be transmitted during the 1st and 5th symbol times.
In the spectrogram plots of Figure 2, the location of the RS
symbols are noted for the two transmissions, Tx0 and Tx1.
The figure also shows the time-gated spectrum of the RS
in the right column. Comparing the two plots on the right,
it can be clearly observed that the frequency subcarriers
on the upper plot, transmitted from Tx0, are orthogonal
(use different subcarriers) to the subcarriers transmitted
from Tx1, shown on the lower right plot. During this portion
of the LTE waveform, the receivers can measure these
individual subcarriers to determine the channel coefficients
associated with transmissions from Tx0 and Tx1. It is
important to note that for wideband signals, the channel
coefficient’s response may vary across the transmitted
frequency spectrum; therefore, in a typical OFDM-MIMO
scheme, there will be a set of channel coefficients
measured at each subcarrier frequency.
Figure 2. Measurements of the spectrograms and frequency responses for a LTE 2x2
MIMO signal. The upper spectrogram measurement, shown on the left, is for the signal
transmitted from antenna Tx0 and the lower plot from antenna Tx1. The time-gated spec-
trums, shown on the right, display the orthogonal RS (pilot) subcarriers used for estimat-
ing the channel coefficients. The measurements were made using the Keysight 89601A
VSA using a Hanning window with a time constant set to match the symbol length.
Tx0
Tx1
RS
RS
5
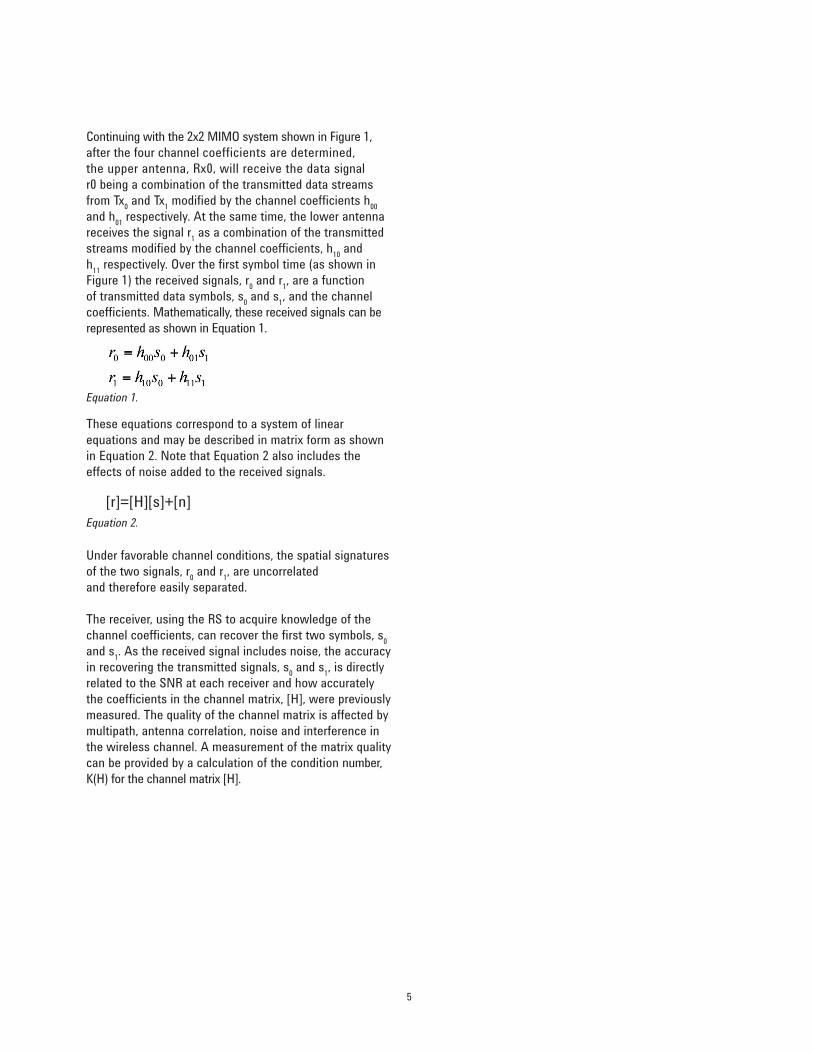
Continuing with the 2x2 MIMO system shown in Figure 1,
after the four channel coefficients are determined,
the upper antenna, Rx0, will receive the data signal
r0 being a combination of the transmitted data streams
from Tx0 and Tx
1 modified by the channel coefficients h
00
and h01
respectively. At the same time, the lower antenna
receives the signal r1 as a combination of the transmitted
streams modified by the channel coefficients, h10
and
h11
respectively. Over the first symbol time (as shown in
Figure 1) the received signals, r0 and r
1, are a function
of transmitted data symbols, s0 and s
1, and the channel
coefficients. Mathematically, these received signals can be
represented as shown in Equation 1.
These equations correspond to a system of linear
equations and may be described in matrix form as shown
in Equation 2. Note that Equation 2 also includes the
effects of noise added to the received signals.
Under favorable channel conditions, the spatial signatures
of the two signals, r0 and r
1, are uncorrelated
and therefore easily separated.
The receiver, using the RS to acquire knowledge of the
channel coefficients, can recover the first two symbols, s0
and s1. As the received signal includes noise, the accuracy
in recovering the transmitted signals, s0 and s
1, is directly
related to the SNR at each receiver and how accurately
the coefficients in the channel matrix, [H], were previously
measured. The quality of the channel matrix is affected by
multipath, antenna correlation, noise and interference in
the wireless channel. A measurement of the matrix quality
can be provided by a calculation of the condition number,
K(H) for the channel matrix [H].
Equation 1.
Equation 2.
[r]=[H][s]+[n]
6
Condition Number
A system of linear equations is “well-conditioned” if small
errors in the matrix coefficients result in small errors in the
solution. A system of linear equations is “ill-conditioned”
when small errors in the coefficients may have a large
detrimental effect on the solution. Often with round-off
errors, finding a solution using an ill-conditioned matrix
may require the use of double or triple precision in order
to reach a specific accuracy in the final solution. The
accuracy in the solution may also decrease when the
measurements of the matrix coefficients are corrupted
by high levels of noise and interference, such as the
case when measuring the RS pilot subcarriers in a LTE
MIMO transmission with low SNR. There are several
techniques to quantify the matrix properties including a
key parameter referred as the matrix “condition number”.
The condition number is a traditional and deterministic
calculation formed by taking the ratio of the maximum
to minimum singular values of the matrix. For MIMO,
the channel condition number, K(H), is calculated from
the instantaneous channel matrix [H] without the need
for stochastic averaging. Small values for the condition
number imply a well-conditioned channel matrix while
large values indicate an ill-conditioned channel matrix.
The condition number can provide an indication as to
whether the MIMO channel is capable of supporting
spatial multiplexing and is a short-term indication of the
SNR required to properly recover a MIMO transmission.
In MIMO analysis, the condition number for the channel
matrix, K(H), is often expressed as a numerical value in dB.
A well-conditioned matrix will have approximately equal
singular values and the condition number will be low and
typically less than 10 dB. The ideal condition number, K(H),
is equal to one, or 0 dB. When K(H) is greater than 10 dB,
data recovery at the receiver becomes progressively more
sensitive to errors in the measured channel coefficients
resulting from additive white Gaussian noise (AWGN),
quantization noise and other interference present in the system.
It can be shown that the sensitivity of the recovered data, ,
is related to the sensitivity of the received signal, , and the
value of condition number, K(H), by the relationship shown in
Equation 3 [3]. Here represents the vector norm of the
associated column vector for the transmitted and received data.
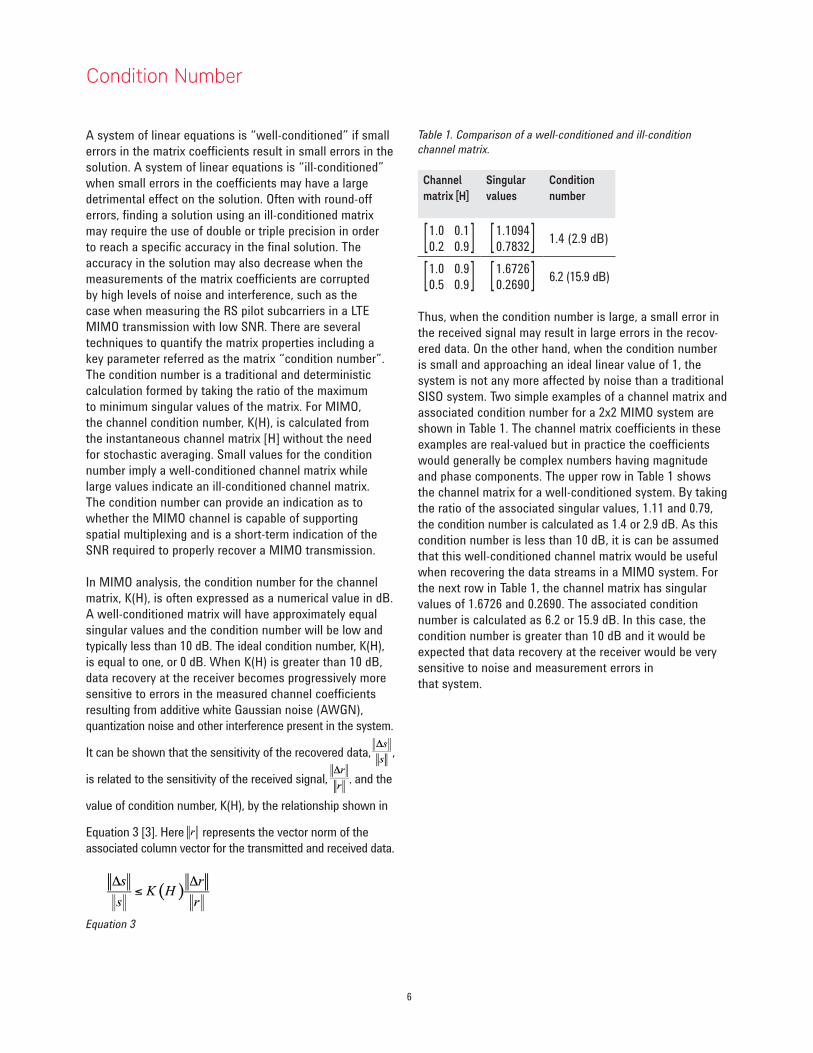
Table 1. Comparison of a well-conditioned and ill-condition
channel matrix.
Channel
matrix [H]
Singular
values
Condition
number
[1.0 0.1] 0.2 0.9 [1.1094] 0.78321.4 (2.9 dB)
[1.0 0.9] 0.5 0.9 [1.6726] 0.26906.2 (15.9 dB)
Thus, when the condition number is large, a small error in
the received signal may result in large errors in the recov-
ered data. On the other hand, when the condition number
is small and approaching an ideal linear value of 1, the
system is not any more affected by noise than a traditional
SISO system. Two simple examples of a channel matrix and
associated condition number for a 2x2 MIMO system are
shown in Table 1. The channel matrix coefficients in these
examples are real-valued but in practice the coefficients
would generally be complex numbers having magnitude
and phase components. The upper row in Table 1 shows
the channel matrix for a well-conditioned system. By taking
the ratio of the associated singular values, 1.11 and 0.79,
the condition number is calculated as 1.4 or 2.9 dB. As this
condition number is less than 10 dB, it is can be assumed
that this well-conditioned channel matrix would be useful
when recovering the data streams in a MIMO system. For
the next row in Table 1, the channel matrix has singular
values of 1.6726 and 0.2690. The associated condition
number is calculated as 6.2 or 15.9 dB. In this case, the
condition number is greater than 10 dB and it would be
expected that data recovery at the receiver would be very
sensitive to noise and measurement errors in
that system.
Equation 3
7
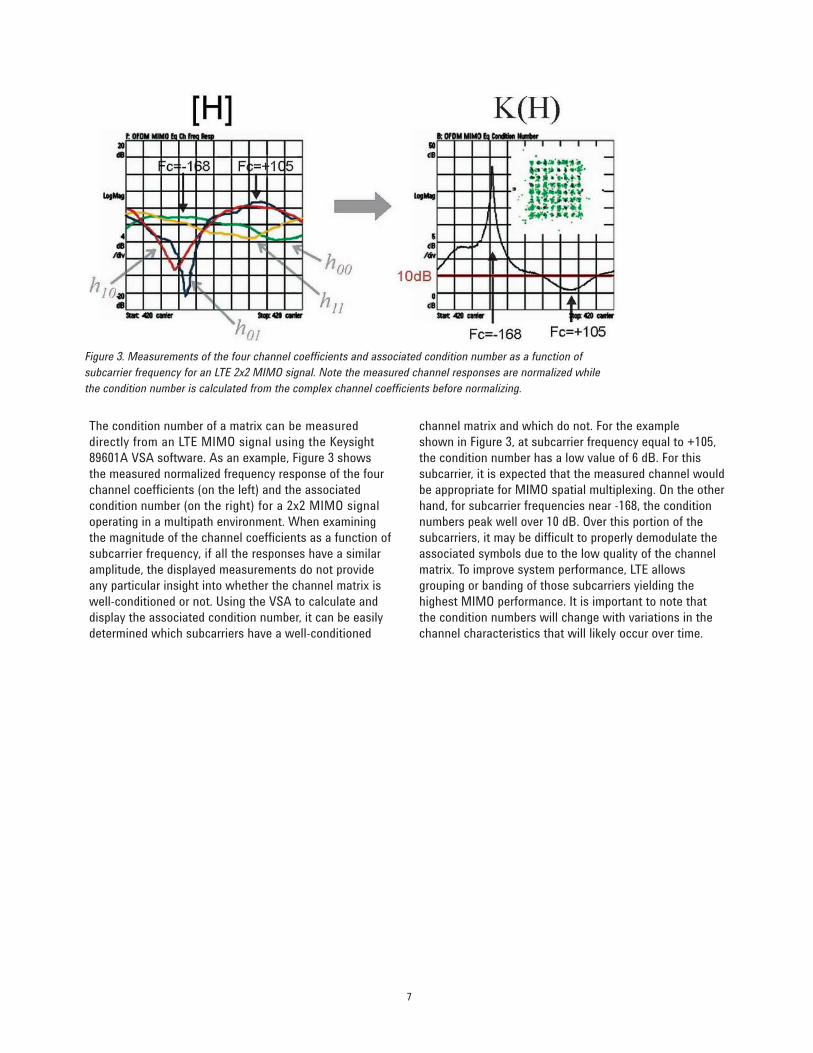
The condition number of a matrix can be measured
directly from an LTE MIMO signal using the Keysight
89601A VSA software. As an example, Figure 3 shows
the measured normalized frequency response of the four
channel coefficients (on the left) and the associated
condition number (on the right) for a 2x2 MIMO signal
operating in a multipath environment. When examining
the magnitude of the channel coefficients as a function of
subcarrier frequency, if all the responses have a similar
amplitude, the displayed measurements do not provide
any particular insight into whether the channel matrix is
well-conditioned or not. Using the VSA to calculate and
display the associated condition number, it can be easily
determined which subcarriers have a well-conditioned
channel matrix and which do not. For the example
shown in Figure 3, at subcarrier frequency equal to +105,
the condition number has a low value of 6 dB. For this
subcarrier, it is expected that the measured channel would
be appropriate for MIMO spatial multiplexing. On the other
hand, for subcarrier frequencies near -168, the condition
numbers peak well over 10 dB. Over this portion of the
subcarriers, it may be difficult to properly demodulate the
associated symbols due to the low quality of the channel
matrix. To improve system performance, LTE allows
grouping or banding of those subcarriers yielding the
highest MIMO performance. It is important to note that
the condition numbers will change with variations in the
channel characteristics that will likely occur over time.
Figure 3. Measurements of the four channel coefficients and associated condition number as a function of
subcarrier frequency for an LTE 2x2 MIMO signal. Note the measured channel responses are normalized while
the condition number is calculated from the complex channel coefficients before normalizing.
8
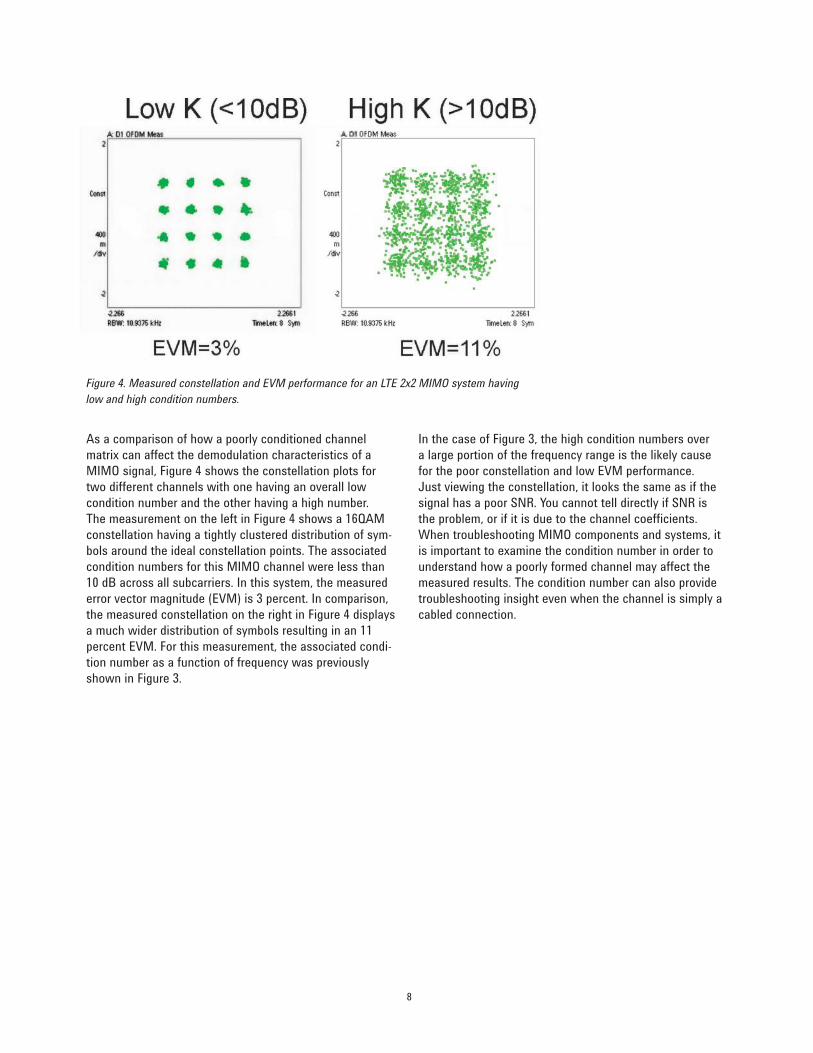
As a comparison of how a poorly conditioned channel
matrix can affect the demodulation characteristics of a
MIMO signal, Figure 4 shows the constellation plots for
two different channels with one having an overall low
condition number and the other having a high number.
The measurement on the left in Figure 4 shows a 16QAM
constellation having a tightly clustered distribution of sym-
bols around the ideal constellation points. The associated
condition numbers for this MIMO channel were less than
10 dB across all subcarriers. In this system, the measured
error vector magnitude (EVM) is 3 percent. In comparison,
the measured constellation on the right in Figure 4 displays
a much wider distribution of symbols resulting in an 11
percent EVM. For this measurement, the associated condi-
tion number as a function of frequency was previously
shown in Figure 3.
In the case of Figure 3, the high condition numbers over
a large portion of the frequency range is the likely cause
for the poor constellation and low EVM performance.
Just viewing the constellation, it looks the same as if the
signal has a poor SNR. You cannot tell directly if SNR is
the problem, or if it is due to the channel coefficients.
When troubleshooting MIMO components and systems, it
is important to examine the condition number in order to
understand how a poorly formed channel may affect the
measured results. The condition number can also provide
troubleshooting insight even when the channel is simply a
cabled connection.
Figure 4. Measured constellation and EVM performance for an LTE 2x2 MIMO system having
low and high condition numbers.
9
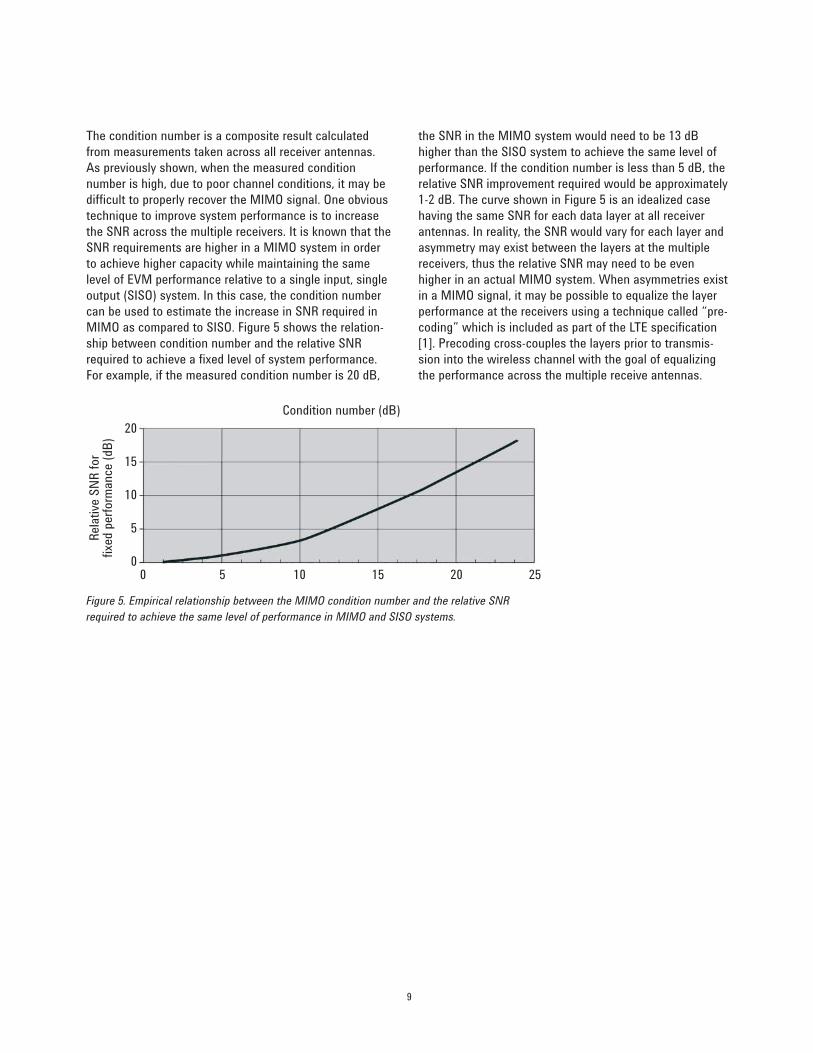
The condition number is a composite result calculated
from measurements taken across all receiver antennas.
As previously shown, when the measured condition
number is high, due to poor channel conditions, it may be
difficult to properly recover the MIMO signal. One obvious
technique to improve system performance is to increase
the SNR across the multiple receivers. It is known that the
SNR requirements are higher in a MIMO system in order
to achieve higher capacity while maintaining the same
level of EVM performance relative to a single input, single
output (SISO) system. In this case, the condition number
can be used to estimate the increase in SNR required in
MIMO as compared to SISO. Figure 5 shows the relation-
ship between condition number and the relative SNR
required to achieve a fixed level of system performance.
For example, if the measured condition number is 20 dB,
the SNR in the MIMO system would need to be 13 dB
higher than the SISO system to achieve the same level of
performance. If the condition number is less than 5 dB, the
relative SNR improvement required would be approximately
1-2 dB. The curve shown in Figure 5 is an idealized case
having the same SNR for each data layer at all receiver
antennas. In reality, the SNR would vary for each layer and
asymmetry may exist between the layers at the multiple
receivers, thus the relative SNR may need to be even
higher in an actual MIMO system. When asymmetries exist
in a MIMO signal, it may be possible to equalize the layer
performance at the receivers using a technique called “pre-
coding” which is included as part of the LTE specification
[1]. Precoding cross-couples the layers prior to transmis-
sion into the wireless channel with the goal of equalizing
the performance across the multiple receive antennas.
Figure 5. Empirical relationship between the MIMO condition number and the relative SNR
required to achieve the same level of performance in MIMO and SISO systems.
Condition number (dB)
0 5 10 15 20 25
Rela
tive
SN
R f
or
fixe
d p
erf
orm
ance
(dB
)
20
15
10
5
0
10
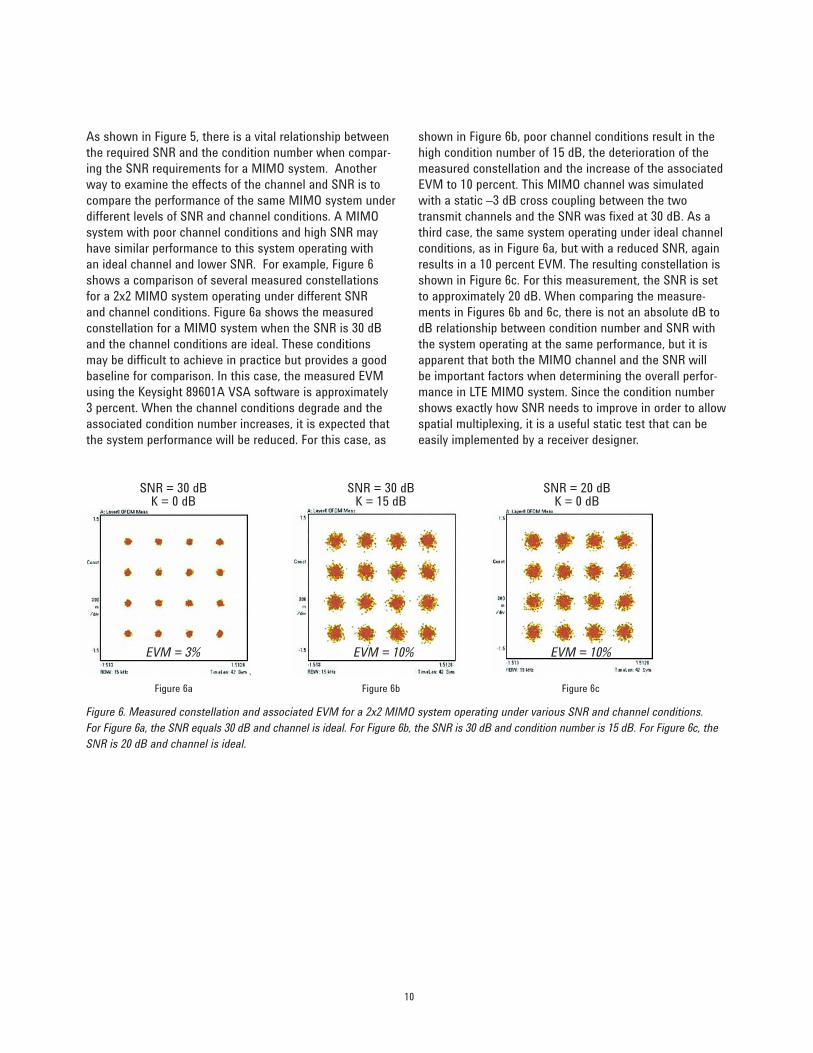
As shown in Figure 5, there is a vital relationship between
the required SNR and the condition number when compar-
ing the SNR requirements for a MIMO system. Another
way to examine the effects of the channel and SNR is to
compare the performance of the same MIMO system under
different levels of SNR and channel conditions. A MIMO
system with poor channel conditions and high SNR may
have similar performance to this system operating with
an ideal channel and lower SNR. For example, Figure 6
shows a comparison of several measured constellations
for a 2x2 MIMO system operating under different SNR
and channel conditions. Figure 6a shows the measured
constellation for a MIMO system when the SNR is 30 dB
and the channel conditions are ideal. These conditions
may be difficult to achieve in practice but provides a good
baseline for comparison. In this case, the measured EVM
using the Keysight 89601A VSA software is approximately
3 percent. When the channel conditions degrade and the
associated condition number increases, it is expected that
the system performance will be reduced. For this case, as
shown in Figure 6b, poor channel conditions result in the
high condition number of 15 dB, the deterioration of the
measured constellation and the increase of the associated
EVM to 10 percent. This MIMO channel was simulated
with a static –3 dB cross coupling between the two
transmit channels and the SNR was fixed at 30 dB. As a
third case, the same system operating under ideal channel
conditions, as in Figure 6a, but with a reduced SNR, again
results in a 10 percent EVM. The resulting constellation is
shown in Figure 6c. For this measurement, the SNR is set
to approximately 20 dB. When comparing the measure-
ments in Figures 6b and 6c, there is not an absolute dB to
dB relationship between condition number and SNR with
the system operating at the same performance, but it is
apparent that both the MIMO channel and the SNR will
be important factors when determining the overall perfor-
mance in LTE MIMO system. Since the condition number
shows exactly how SNR needs to improve in order to allow
spatial multiplexing, it is a useful static test that can be
easily implemented by a receiver designer.
Figure 6. Measured constellation and associated EVM for a 2x2 MIMO system operating under various SNR and channel conditions.
For Figure 6a, the SNR equals 30 dB and channel is ideal. For Figure 6b, the SNR is 30 dB and condition number is 15 dB. For Figure 6c, the
SNR is 20 dB and channel is ideal.
SNR = 30 dBK = 0 dB
SNR = 30 dBK = 15 dB
SNR = 20 dBK = 0 dB
Figure 6a Figure 6b Figure 6c
EVM = 3% EVM = 10% EVM = 10%
11
It was previously discussed that an ill-conditioned MIMO
channel matrix will result in a system prone to error and
highly sensitive to noise and interference. Correlation
in the channel matrix coefficients may also result in
an ill-conditioned matrix and the associated condition
number will also be large. Correlation between the
matrix coefficients are the result of one or more of the
following: inadequate antenna spacing, common antenna
polarization and narrow angular spread created by the
surrounding environment [2]. A MIMO system is more
likely to have a lower condition number when the channel
coefficients have low correlation. Correlation is measured
statistically for many modeled channels, so there is not a
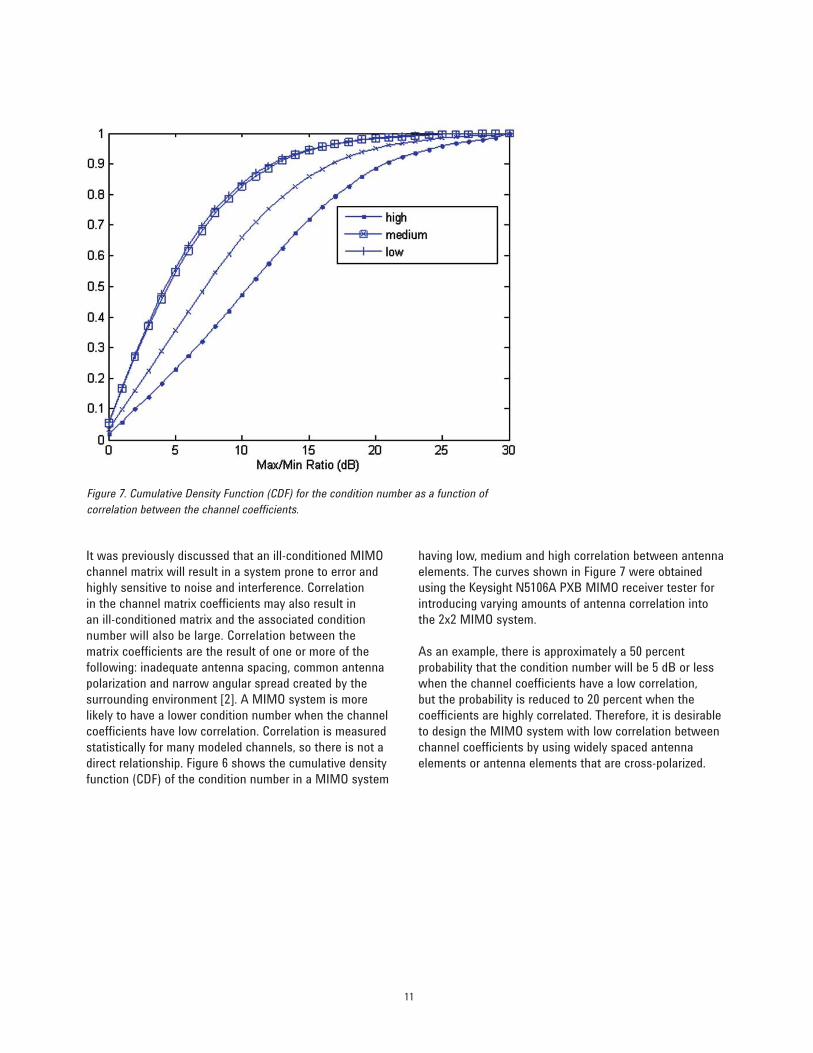
direct relationship. Figure 6 shows the cumulative density
function (CDF) of the condition number in a MIMO system
having low, medium and high correlation between antenna
elements. The curves shown in Figure 7 were obtained
using the Keysight N5106A PXB MIMO receiver tester for
introducing varying amounts of antenna correlation into
the 2x2 MIMO system.
As an example, there is approximately a 50 percent
probability that the condition number will be 5 dB or less
when the channel coefficients have a low correlation,
but the probability is reduced to 20 percent when the
coefficients are highly correlated. Therefore, it is desirable
to design the MIMO system with low correlation between
channel coefficients by using widely spaced antenna
elements or antenna elements that are cross-polarized.
Figure 7. Cumulative Density Function (CDF) for the condition number as a function of
correlation between the channel coefficients.
12
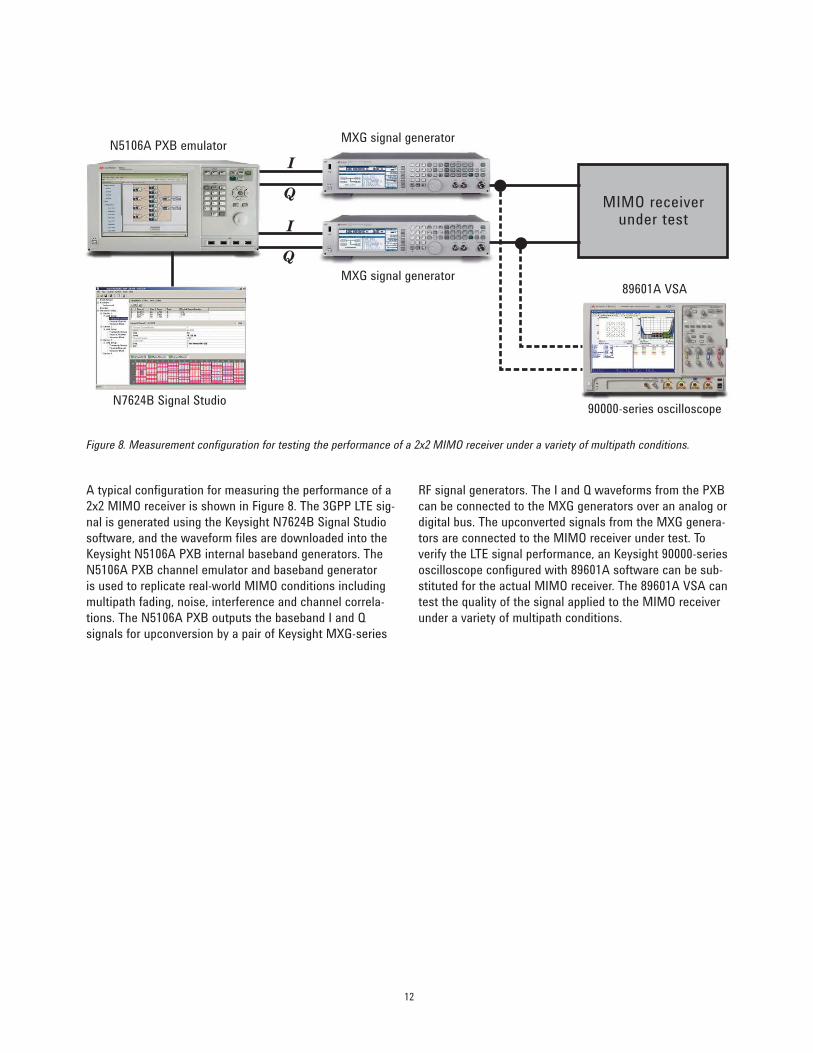
A typical configuration for measuring the performance of a
2x2 MIMO receiver is shown in Figure 8. The 3GPP LTE sig-
nal is generated using the Keysight N7624B Signal Studio
software, and the waveform files are downloaded into the
Keysight N5106A PXB internal baseband generators. The
N5106A PXB channel emulator and baseband generator
is used to replicate real-world MIMO conditions including
multipath fading, noise, interference and channel correla-
tions. The N5106A PXB outputs the baseband I and Q
signals for upconversion by a pair of Keysight MXG-series
RF signal generators. The I and Q waveforms from the PXB
can be connected to the MXG generators over an analog or
digital bus. The upconverted signals from the MXG genera-
tors are connected to the MIMO receiver under test. To
verify the LTE signal performance, an Keysight 90000-series
oscilloscope configured with 89601A software can be sub-
stituted for the actual MIMO receiver. The 89601A VSA can
test the quality of the signal applied to the MIMO receiver
under a variety of multipath conditions.
Figure 8. Measurement configuration for testing the performance of a 2x2 MIMO receiver under a variety of multipath conditions.
N5106A PXB emulatorMXG signal generator
MXG signal generator89601A VSA
MIMO receiver under test
90000-series oscilloscopeN7624B Signal Studio
I
I
Q
Q
13
Conclusion
It has been shown that the matrix condition number is a
very useful quantitative tool for determining the overall
quality of the LTE MIMO channel. The condition number
can also be used to estimate the required increase in
SNR in a spatially-multiplexed MIMO system when
compared to a traditional SISO system. This knowledge
can help receiver designers understand how well a MIMO
receiver should be able to recover a signal under particular
channel conditions, and design tests for their receivers.
As shown in Figure 6, knowledge of the condition number
can help provide insight to the quality of the channel that
would not otherwise be obvious.
References
[1] 3rd Generation Partnership Project; Technical
Specification Group Radio Access Network; Evolved
Universal Terrestrial Radio Access (E-UTRA);
Physical Channels and Modulation (Release 8),
3GPP TS 36.211 V8.4.0 (2008-09), 2008.
[2] Keysight Application Note, MIMO Channel
Modeling and Emulation Test Challenges,
Literature Number 5989-8973EN, October 2008.
[3] Advanced Engineering Mathematics, Erwin Kreyszig,
6th Edition, pg 1025-26, 1988.
For more information on Keysight
Technologies’ products, applications or
services, please contact your local Keysight
office. The complete list is available at:
www.keysight.com/find/contactus
Americas
Canada (877) 894 4414Brazil 55 11 3351 7010Mexico 001 800 254 2440United States (800) 829 4444
Asia PaciicAustralia 1 800 629 485China 800 810 0189Hong Kong 800 938 693India 1 800 112 929Japan 0120 (421) 345Korea 080 769 0800Malaysia 1 800 888 848Singapore 1 800 375 8100Taiwan 0800 047 866Other AP Countries (65) 6375 8100
Europe & Middle East
Austria 0800 001122Belgium 0800 58580Finland 0800 523252France 0805 980333Germany 0800 6270999Ireland 1800 832700Israel 1 809 343051Italy 800 599100Luxembourg +32 800 58580Netherlands 0800 0233200Russia 8800 5009286Spain 0800 000154Sweden 0200 882255Switzerland 0800 805353
Opt. 1 (DE)Opt. 2 (FR)Opt. 3 (IT)
United Kingdom 0800 0260637
For other unlisted countries:
www.keysight.com/find/contactus
(BP-07-01-14)
This information is subject to change without notice.© Keysight Technologies, 2009-2014Published in USA, July 31, 20145990-4759ENwww.keysight.com
14 | Keysight | MIMO Performance and Condition Number in LTE Test - Application Note
www.lxistandard.org
LAN eXtensions for Instruments puts the power of Ethernet and the
Web inside your test systems. Keysight is a founding member of the
LXI consortium.
Three-Year Warranty
www.keysight.com/find/ThreeYearWarranty
Keysight’s commitment to superior product quality and lower total cost
of ownership. The only test and measurement company with three-year
warranty standard on all instruments, worldwide.
www.keysight.com/find/AssurancePlans
Up to five years of protection and no budgetary surprises to ensure your
instruments are operating to specification so you can rely on accurate
measurements.
Keysight Channel Partners
www.keysight.com/find/channelpartners
Get the best of both worlds: Keysight’s measurement expertise and product
breadth, combined with channel partner convenience.
www.keysight.com/find/MIMO
www.keysight.com/find/LTE