Embed Size (px)
Citation preview
Key Statistics for PontypriddMay 2010
This paper provides key statistics under a number of topic headings for the National Assembly for Wales constituency of Pontypridd.
This is one of a series of Members’ Research Service profiles for the National Assembly for Wales’ constituencies and electoral regions in Wales. These profiles replace those published in 2007.
The National Assembly for Wales is the democratically elected body that represents the interests of Wales and its people, makes laws for Wales and holds the Welsh Government to account.
The Members’ Research Service is part of the National Assembly for Wales. We provide confidential and impartial research support to the Assembly’s scrutiny and legislation committees, and to all 60 individual Assembly Members and their staff.
Members’ Research Service briefings are compiled for the benefit of Assembly Members and their support staff. Authors are available to discuss the contents of these papers with Members and their staff but cannot advise members of the general public. We welcome comments on our briefings; please post or email to the addresses below.
An electronic version of this paper can be found on the National Assembly’s website at:www.assemblywales.org/bus-assembly-publications-research.htm
Further hard copies of this paper can be obtained from:Members’ Research ServiceNational Assembly for WalesCardiff BayCF99 1NA
Email: [email protected]
© National Assembly for Wales Commission Copyright 2010The text of this document may be reproduced free of charge in any format or medium providing that it is reproduced accurately and not used in a misleading or derogatory context. The material must be acknowledged as copyright of the National Assembly for Wales Commission and the title of the document specified.
Enquiry no: 09 / 4096

Key Statistics for PontypriddMay 2010
Rachel Dolman
Paper Number: 10 / 042


Summary
This profile provides a statistical overview of Pontypridd. Detailed statistics are presented in sections one to six of the paper.
Summary of results
mid 2007 population estimates show that around 79,900 people live in Pontypridd. With 760 people per square kilometre the area is more densely populated than Wales as a whole;
a lower share of the population in the area (18 per cent) than in Wales (21 per cent) is of retirement age;
the 2008 Annual Population Survey estimated 20 per cent of people aged 3 or more can speak Welsh, compared with 27 per cent across Wales;
turn-out for the constituency ballot in the 2007 National Assembly for Wales elections was 40.5 per cent. This was below that for Wales (43.5 per cent). The winning party was Labour;
in February 2010, around 3.8 per cent of the working age population in Pontypridd were claiming Jobseeker's Allowance. The equivalent figure for Wales was 4.6 per cent. In 2008, around 74 per cent of working age adults were in employment compared with 71 per cent in Wales;
2006-08 data show the average gross weekly earnings for those working in Pontypridd was around £479. The equivalent figure for Wales was £470;
in 2007, an estimated 12 per cent of working age adults in Pontypridd had no qualifications, this compares with 15 per cent in Wales;
Welsh Health Survey results for 2003-07 showed that, around 28 per cent of adults in Pontypridd reported that they currently smoke and 38 per cent reported drinking more than the daily guidelines on at least one day in the past week. The equivalent figures for Wales were 26 per cent and 36 per cent respectively; and
the Welsh Index of Multiple Deprivation 2008 ranks specific small areas in Wales in terms of deprivation. In Pontypridd, 6 per cent of areas fall in the 10% most deprived areas in Wales and overall the majority of its areas are less deprived than the Wales average.


Contents
Introduction ..............................................................................................................................................1
About the data ..................................................................................................1
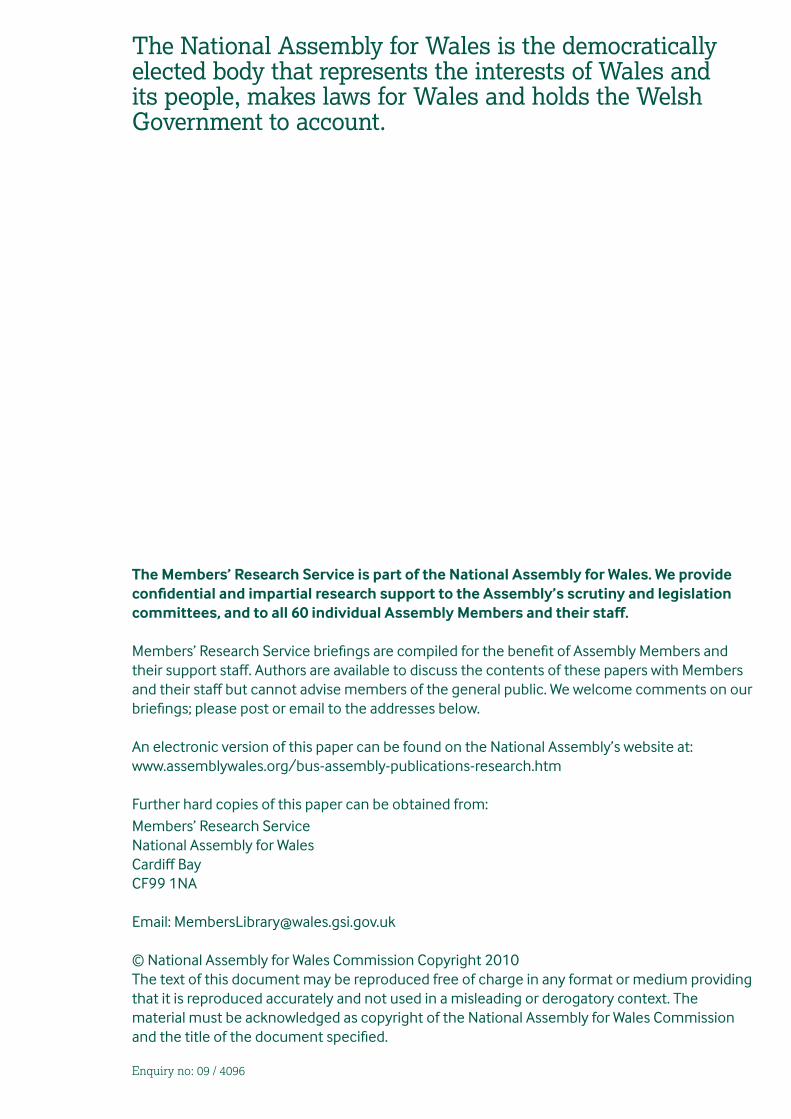
Map of Pontypridd .................................................................................................................................2
1. Population statistics ...................................................................................................................3
2. Economic and labour market statistics.............................................................................4
3. Education statistics .....................................................................................................................5
4. Health, housing and transport statistics ..........................................................................6
5. Deprivation statistics .................................................................................................................7
Child Index .......................................................................................................7
6. Comparisons with earlier years ............................................................................................9
Qualifications of 15 year olds and Jobseeker’s Allowance..................................9
7. Sources and notes.....................................................................................................................10
Sources for further information .......................................................................10 Links to further information ............................................................................10 Notes and definitions ......................................................................................11


Key Statistics for Pontypridd
Introduction
This paper presents statistics for the National Assembly for Wales constituency area
of Pontypridd. It is part of a series of profiles for the Assembly constituencies and
electoral regions in Wales. These profiles are based on the constituencies and
electoral regions introduced for the Assembly elections in 2007, and replace the
profiles published by the Member’s Research Service in March 2007. A separate
profile has been produced for each constituency. Statistics for the five electoral
regions have been brought together in a single paper.
About the data
The tables in this paper show statistics for Pontypridd along with comparable figures
for the electoral region it is part of (South Wales Central1) and for Wales as a whole.
The information is drawn from a number of different sources. Therefore, not all
information presented in the profile relates to the same time period. The time
periods are shown in the tables, and details on the data sources and definitions used
are provided in section 7 (Sources and notes).
Results presented in this profile should not be compared with those in the 2007 profile because, although the indicators may appear to be the same, a number of the
data sources and definitions used have changed.
Since electoral geographies do not form a standard statistical geography, and the
areas covered are small, the availability of robust data is limited. Therefore, it is
not possible to include statistics on all topics of interest, for example, child
poverty, those not in employment, education or training (NEETs), and social services.
For the same reason, these profiles do not contain detailed commentary and charts
showing trends.
Many of the results are taken from surveys. Therefore, the results shown are
estimates of the true value and will be subject to sampling error. Because of the small
numbers of survey respondents in each constituency, many of the estimates are not
robust enough to say whether the results for the constituency are statistically
different from that of Wales as a whole. Due to robustness, some figures in the tables
are rounded to whole numbers rather than to 1 decimal place.
An electronic version of this paper is available on the Members’ Research Service
pages of the National Assembly for Wales’ website.
1 The electoral region of South Wales Central contains the following constituencies: Cardiff Central, Cardiff North, Cardiff South & Penarth, Cardiff West, Cynon Valley, Pontypridd, Rhondda and Vale of Glamorgan.
1

Map of Pontypridd
2

1. Population statistics
Letter refers to sources and notes PontypriddSouth Wales
Central Wales Units
Population, mid-2007:
a Total population 79.9 663.9 2,980.0 Number (thousands)
a Change in population, 2001-2007 4.0 3.2 2.6 Per cent
b Area 105 859 20,742 Square kilometres
b Population density 760 773 144 Number per sq km
a Age and sex profile, mid-2007:
Male 48.9 48.7 48.8 Per cent
Female 51.1 51.3 51.2 Per cent
Aged 0-15 18.5 18.9 18.7 Per cent
c Working age 63.3 63.0 60.3 Per cent
c Retirement age 18.3 18.1 21.0 Per cent
d Population groups, 2001:
Single (never married) 30.0 32.2 28.0 Per cent of those aged 16+
e Living in a communal establishment 2.1 1.9 1.5 Per cent
f Non-White Ethnic Group 1.6 4.8 2.1 Per cent
g Migrant 11.8 12.7 11.2 Per cent
d Place of birth, 2001:
Wales 85.7 80.2 75.4 Per cent
Other UK 11.4 14.9 21.4 Per cent
h Elsewhere in EU 1.3 1.6 1.3 Per cent
h Non-EU 1.6 3.4 1.9 Per cent
i Can speak Welsh, 2008 20.3 18.4 26.5 Per cent of those aged 3+
j 2007 Assembly Election results
Winning party Labour . .
Share of the vote by winning party 41.9 . . Per cent of valid votes cast
Turnout 40.5 42.3 43.5 Valid votes as per cent of the electorate
k Assembly Electorate, 2008 58.5 499.8 2,279.8 Number (thousands)
l Parliamentary Electorate, 2008 58.3 493.9 2,261.8 Number (thousands)
Source: For details of the data sources refer to Sources and notes, in section 7.
3

2. Economic and labour market statistics
Letter refers to sources and notes PontypriddSouth Wales
Central Wales Units
a
Managerial and professional 23.5 25.3 22.0 Per cent of ages 16-74Intermediate 14.5 14.1 15.1 Per cent of ages 16-74Routine and Manual 28.7 26.4 30.0 Per cent of ages 16-74Never worked and long-term unemployed
3.1 4.1 3.8 Per cent of ages 16-74
Not classifiable 30.2 30.0 29.1 Per cent of ages 16-74
b Economic activity, 2008:
In employment 74.4 70.5 70.7 Per cent of working ageEconomically inactive, excluding students
14.9 18.6 20.5 Per cent of working age
c Average weekly earnings, 2006-08
479 499 470 £
d Jobseeker's Allowance claimants, February 2010:
Persons 3.8 4.8 4.6 Per cent of working ageMales 5.6 7.1 6.7 Per cent of working ageFemales 1.8 2.4 2.4 Per cent of working age
Aged 24 and under 38 36 35 Per cent of claimantsAged 25-49 50 52 51 Per cent of claimantsAged 50+ 12 12 14 Per cent of claimants
Up to 6 months duration 69 66 65 Per cent of claimants6 to 12 months duration 17 21 19 Per cent of claimants
Over 12 months duration 14 13 15 Per cent of claimants
e Claimants of other benefits, 2008:
f
Persons 9.9 10.3 10.5 Per cent of working ageMales 10.8 11.6 11.6 Per cent of working ageFemales 9.0 8.9 9.4 Per cent of working age
g Disability living allowance claimants
8.6 8.7 9.7 Per cent of the under 65s
h Income support claimants 9.2 11.8 10.1 Per cent of households
i Pensions credit beneficiaries:
Guarantee credit only 7.8 9.5 8.3 Per cent of aged 60+Guarantee & savings credit 13.9 14.2 13.6 Per cent of aged 60+
Incapacity benefit and/or severe disablement allowance cla imants:
National Statistics Socio-economic Classification, 2001:
Source: For details of the data sources refer to Sources and notes, in section 7.
4

3. Education statistics
Data are for 2008/09 unless another year is given
Letter refers to sources and notes PontypriddSouth Wales
Central Wales Units
a Highest qualification attained, 2007:
Level 4 and above 31 32 27 Per cent of the working age
Level 3 17 20 20 Per cent of the working age
Level 2 21 19 21 Per cent of the working age
Below level 2 19 16 17 Per cent of the working age
No qualifications 12 13 15 Per cent of the working age
b
c Level 2 at Key Stage 1 84.4 81.5 81.1 Per cent
Level 4 at Key Stage 2 78.2 77.5 77.0 Per cent
Level 5 at Key Stage 3 58.7 61.5 61.3 Per cent
d GCSE Examination / equivalent achievements:
5+ GCSE Grades A*-C 56.3 60.6 60.6 Per cent of 15 year olds
A*-C in each of the core subjects 44.1 44.1 46.0 Per cent of 15 year olds
Average wider points score 370.0 386.8 378.8 Score
e Leaving full time education without a recognised qualification, 2008
0.6 1.7 1.5 Per cent of 15 year old pupils
f A Level Examination / equivalent achievements:
2+ A Level Grades A-E 96.1 96.1 96.0 Per cent of entrants
Average wider points score 654.3 722.5 687.7 Score
g Absence from maintained secondary schools:
Unauthorised absence 2.2 2.3 1.7 Per cent of half-day sessions
All absence 10.1 9.5 9.0 Per cent of half-day sessions
h Pupil teacher ratios:
Primary schools 23.4 20.2 20.0 Ratio
Secondary schools 17.2 16.3 16.4 Ratio
h Average class sizes:
Key Stage 1 27.0 25.7 24.5 Number of pupils
Key Stage 2 27.7 26.1 25.0 Number of pupils
Mixed Key Stages 1 & 2 27.1 26.0 23.0 Number of pupils
Key Stage 3 23.8 23.9 23.6 Number of pupils
Secondary: Years 7-11 22.9 22.8 22.1 Number of pupils
Secondary: Years 12-13 10.6 11.0 10.9 Number of pupils
i Pupils entitled to free school meals
17.2 20.4 17.8 Per cent of compulsory school age pupils
Achievements in teacher assessments in each of the core subjects:
Source: For details of the data sources refer to Sources and notes, in section 7.
5

4. Health, housing and transport statistics
Letter refers to sources and notes PontypriddSouth Wales
Central Wales Units
a Welsh Health Survey, 2003/04 - 2007:
Limiting long-term illness 27 25 27 Per cent of adults
General health 'fair' or 'poor' 21 21 22 Per cent of adultsProviding unpaid care for 50+ hours a week
4 4 4 Per cent of adults
b Any heart condition (excluding high blood pressure)
9 9 9 Per cent of adults
b High blood pressure 19 17 19 Per cent of adults
Smoker 28 27 26 Per cent of adults
c Consumption of alcohol: above guidelines
38 40 36 Per cent of adults
c Consumption of alcohol: binge 22 23 19 Per cent of adults
d Overweight or obese 59 54 55 Per cent of adults
d Obese 21 18 19 Per cent of adults
e Visited a dentist, 2009 63 58 56 Per cent of population
f Households, 2001:
g Total 30,532 261,535 1,209,048 Number
Average size 2.5 2.4 2.4 Number of members
One person 25.3 28.6 29.1 Per cent
h Lone parent with dependent children
6.3 8.2 7.3 Per cent
Pensioner 22.1 23.4 25.6 Per cent
One or more person with limiting long-term illness
42.8 40.9 42.4 Per cent
No central heating 3.9 6.0 7.5 Per cent
i Overcrowded 4.7 5.4 4.4 Per cent
f Household spaces 2001:
g Total household spaces 31,491 272,230 1,275,819 Number
Vacant 2.9 3.7 4.0 Per cent
Second home/holiday accommodation
0.1 0.2 1.2 Per cent
f Tenure 2001:
Owner Occupied 77.4 73.2 71.3 Per cent
Local Authority 9.1 9.9 13.7 Per cent
Housing Association/ Registered Socia l Landlord
4.3 5.4 4.2 Per cent
Private Landlord 6.0 8.2 7.4 Per cent
Other 3.2 3.2 3.3 Per cent
Use of transport:
j Own or have access to a motor vehicle (2006)
83 81 84 Per cent of population
k Travel to work by car (2008) 82 73 81 Per cent of those in employment
Source: For details of the data sources refer to Sources and notes, in section 7.
6

5. Deprivation statistics
The Welsh Index of Multiple Deprivation 2008 (WIMD)2 is a measure of deprivation for small areas in Wales. It ranks statistical geographies known as Lower Super Output Areas (LSOAs) in terms of deprivation across various categories (known as domains) such as health and employment, as well as providing an overall deprivation rank.
Although WIMD does not provide deprivation ranks for constituencies as a whole it is possible to look at the rank of LSOAs within a constituency.3
Figure 2, overleaf, shows the LSOAs within Pontypridd shaded according to their overall level of deprivation. Of the 51 LSOAs in Pontypridd, the map shows that 3 were in the most deprived 10% in Wales.
In Pontypridd: 6 per cent of its LSOAs fall within the 10% most deprived LSOAs in Wales. 43 per cent of its LSOAs fall within the 50% most deprived LSOAs in Wales.
In relation to Wales as a whole, this means that a relatively low proportion of areas in Pontypridd are among the 10% most deprived and overall, the majority of areas fall in the less deprived half of Wales.
Figure 1: The percentage of LSOAs in Pontypridd that are in the 10% most deprived LSOAs in Wales, by domain, 2008
0
5
10
15
20
25
30
Envi
ron
men
t
Co
mm
un
ity
safe
ty
Edu
cati
on
Hea
lth
Emp
loym
ent
Inco
me
Ove
rall
dep
riva
tio
n
Acc
ess
tose
rvic
es
Ho
usi
ng
Per
cent
Source: Welsh Index of Multiple Deprivation 2008, StatsWales [006028]3
Child Index3
In the 2008 WIMD child index, 8 per cent of LSOAs in Pontypridd fall within the 10% most deprived LSOAs in Wales and 43 per cent fall within the more deprived half of Wales.
2 Welsh Government WIMD 2008 web pages [accessed 19 April 2010] 3 See Sources and notes, notes 5a and 5b.
7

Figure 2
8

6. Comparisons with earlier years
For the majority of indicators presented in this paper it is not possible to show trends for the following reasons. Constituencies do not form a standard statistical geography, so the availability of data at this level is limited. Also, the current constituencies were only introduced in 2007.
Qualifications of 15 year olds and Jobseeker’s Allowance
Trend data are publicly available for school statistics and Jobseeker’s Allowance claimants. The charts below show trends for qualifications of 15 year olds and Jobseeker’s Allowance claimants.
Figure 3: Percentage of 15 year old pupils achieving 5 or more GCSEs grade A*-C or equivalent in Pontypridd and Wales
0
10
20
30
40
50
60
70
2005/06 2006/07 2007/08 2008/09
Per
cent
Pontypridd Wales
Source: Welsh Government Publication “School Statistics by Assembly Constituency and Region”: 2009, 2008, 2007 and 2006.
Figure 4: Jobseeker's Allowance claimants, Pontypridd and Wales (a)
0
1
2
3
4
5
2005 2006 2007 2008 2009
Per
cent
of
work
ing
ag
e
pop
ula
tion
Pontypridd Wales
Source: StatsWales table 014265 (a) These figures are based on annual averages for each year and will therefore differ to monthly figures shown in table 2 and other publications by Members' Research Service.
9

7. Sources and notes
Sources for further information
Since electoral geographies do not form a standard statistical geography, and the areas covered are small, the availability of robust data at constituency level is limited. A variety of sources have been used in compiling the statistics presented in this paper.
Many of the statistics have been supplied on request by the Statistical Directorate of the Welsh Government, the Office for National Statistics (ONS) and the Department for Work and Pensions (DWP). This is because, until recently, DWP and ONS constituency data available in the public domain were presented on the basis of the Westminster Parliamentary constituencies used in the 2005 UK General Election. The Assembly constituencies, which took effect in 2007, differ from the 2005 Westminster constituencies. However, the constituencies used in the 2010 General Election are the same as the Assembly constituencies.
Links to further information
The links below provide information about the data sources used in this paper and further statistics relating to Wales.
Statistical Directorate of the Welsh Government
Office for National Statistics (ONS)
Department for Work and Pensions (DWP)
NOMIS – the website for official labour market statistics
Neighbourhood Statistics
Local Government Data Unit ~ Wales
10

Notes and definitions
1: Population statistics
1a These statistics have been calculated from mid-year population estimates (for 2001 and 2007) provided by the Office for National Statistics (ONS). Information about the ONS small area population estimates project can be found on the small area population estimates pages of the Office for National Statistics website.
1b The population density has been calculated from mid-2007 population estimates (see note 1a), and area measurements compiled from Census 2001 statistics (see note 1d). Area measurements are based on the 2001 version of the Ordnance Survey Boundary-Line data-set, amended where district boundaries have changed since 2001, and do not include inland water.
1c Working age is 16-64 for males, 16-59 for females, and retirement age is 65+ for males, 60+ for females.
1d These statistics have been aggregated from Census 2001 Key Statistics for electoral divisions, using SASPAC (software specifically written for the analysis and interrogation of datasets derived from the Census of Population).
In general, there may be occasional small discrepancies between counts or percentages shown in Census tables from different sources. This is usually because cells in Census tables are randomly adjusted to avoid the release of confidential data.
General information about the Census can be found on the Census area of the ONS website. Census 2001 Definitions, published by the ONS, includes a glossary of terms.
1e A 'communal establishment' is defined as an establishment providing managed residential accommodation, where 'managed' means full-time or part-time supervision of the accommodation.
1f ‘Non-white ethnic group’ includes people from a mixed white-other ethnic group.
1g A 'migrant' is a person with a different address one year before the Census to that on census day.
1h The EU is as defined on Census day (29 April 2001).
11

1i These statistics were provided by the Statistical Directorate of the Welsh Government and have been calculated from the ONS’ Annual Population Survey (APS) for 2008. The survey asks those aged 3 and over: “Can you speak Welsh? Yes/No”.
Further information on the APS can be found on the ONS website.
Results should not be compared with those from the 2001 Census. The Annual Population Survey estimates of the proportion of people with Welsh language skills are higher than the respective Census estimates. For further information, please see the ONS report Differences in estimates of Welsh Language Skills.
1j Results shown are for the constituency ballot at the 2007 National Assembly for Wales election. Therefore, results for the winning party and share of the vote for Wales and the region are not shown.
1k Published by the Welsh Government.
The number of people who were registered on the electoral roll and were therefore entitled to vote, as at 1 December 2008. It is based on the qualifying date of 15 October 2008. If there had been an election on 1 December 2008 then those who registered after 15 October would not be eligible to vote. Note that entitlement to vote is different for Assembly and Parliamentary elections. EU citizens resident in Wales are entitled to vote at National Assembly for Wales (and local government elections) but not at Parliamentary elections.
1l ONS, UK Electoral Statistics 2008 (Table 2b).
The figures are derived from data supplied to the ONS by Electoral Registration Officers and show the number of people who on 1 December 2008 were registered to vote in parliamentary elections in the UK. It is based on the qualifying date of 15 October 2008. If there had been an election on 1 December 2008 then those who registered after 15 October 2008 would not be eligible to vote. The total number of parliamentary electors is residential qualifiers which includes overseas electors. Overseas electors are not resident in the United Kingdom, but must previously have been resident here and included in the electoral register (unless they were too young to register). They are registered in the same parliamentary constituency as before they went abroad. The residence qualification requires a person to be normally living at the address on the qualifying date even if temporarily absent. People having more than one place of residence, such as students, may therefore be included on more than one register, but they are only entitled to vote in one constituency in a general election.
12

2: Economic and labour market statistics
2a See note 1d.
2b These statistics were provided by the Statistical Directorate of the Welsh Government and have been calculated from the ONS’s Annual Population Survey (APS) for 2008. They show rates of working age people 'in employment' and 'economically inactive (excluding students)'. Rates of unemployment are not shown due to the small sample sizes involved (at constituency level), and since alternative statistics on Jobseeker’s Allowance claimants are provided.
Further information on the APS can be found on the ONS website.
2c These statistics were provided by the Statistical Directorate of the Welsh Government and have been calculated from the ONS’s Annual Survey of Hours and Earnings (ASHE). The statistics are based on the location of workplace and show the mean gross weekly earnings for full-time employees on adult rates whose pay for the survey pay-period was not affected by absence. A three year average (2006 to 2008) has been used due to the volatility of the estimates at constituency level.
Further information on the ASHE can be found on the ONS website.
2d These statistics are derived from monthly data, as at February 2010, on NOMIS (the website for official labour market statistics). Rates have been calculated using the 2007 mid-year population estimates.
The claimant count is not the official measure of unemployment but it is the only indicative statistic available for areas smaller than local authorities.
The claimant count differs from the International Labour Organisation (ILO) unemployment measure. The ILO is a more encompassing measure of unemployment because the claimant count excludes those who are unemployed who are not eligible to claim and those who do not wish to claim.
Claimant count rates are presented as the percentage of the working age population and will therefore differ to figures based on the percentage of the economically active population aged 16 and over.
2e These statistics were provided by the Department for Work and Pensions (DWP) and have been calculated from the Work and Pensions Longitudinal Study. Counts of claimants or beneficiaries for August 2008 were provided (rounded to the nearest ten), and rates have been derived using the 2007 mid-year population estimates, unless otherwise stated. See the DWP website for further information on statistics produced by the DWP.
13

2f Includes those receiving Incapacity Benefit or Severe Disablement Allowance. Incapacity Benefit is paid to people who are assessed as being incapable of work and who meet certain contribution conditions. Until April 2001, people who were incapable of work and did not satisfy the contribution conditions for Incapacity Benefit could get Severe Disablement Allowance.
2g Disability Living Allowance is a tax-free benefit for children and adults (under 65) who need help with personal care or have walking difficulties because they are physically or mentally disabled.
2h Income Support is a benefit to provide assistance to households whose income is not enough to cover their basic needs. The rates shown here are calculated using Census 2001 estimates of numbers of households (see note 1d).
2i Pension Credit is designed to help pensioners at the lower end of the income scale by ensuring a guaranteed minimum weekly income (guaranteed credit) and, in addition, to reward those people who have made modest provision for their retirement (savings credit). Both parts are based on people’s income and other circumstances. Pension Credit is claimed on a household basis and therefore the number of people that Pension Credit helps ('beneficiaries') is the number of claimants in addition to the number of partners for whom they are also claiming.
3: Education statistics
3a These statistics were provided by the Statistical Directorate of the Welsh Government and have been calculated from the ONS’ Annual Population Survey (APS) for 2007. The statistics show the percentage of working age adults qualified at each National Qualification Framework (NQF) level. See DirectGov for more information on NQF levels.
Further information on the APS can be found on the ONS website.
3b These statistics were published by the Welsh Government in their statistical publication "School Statistics by Assembly Constituency and Region, 2009" (SB6/2010). Data for constituencies and regions relates to pupils at LEA maintained schools only. The data have been produced from the National Curriculum Assessments Database. The core subject indicator represents the percentage of pupils achieving the expected level or above in English or Welsh First Language, mathematics and science in combination.
See the Statistical Directorate’s webpages for further information on school statistics and the data sources used here.
14

3c Twenty-three maintained primary schools currently piloting the Foundation Phase were not required to provide Key Stage 1 results.
3d These statistics were published by the Welsh Government in their statistical publication "School Statistics by Assembly Constituency and Region, 2009" (SB6/2010). Data for constituencies and regions relates to pupils at Local Education Authority maintained schools only. Data are derived from the Welsh Government's School Examination Performance Information. Core subjects are English or Welsh, Maths and Science. For an explanation of the calculation of points scores, please refer to the Glossary in "Schools in Wales: Examination Performance, 2008".
3e These statistics were provided by the Statistical Directorate of the Welsh Government. The percentage of 15-year-old pupils leaving full-time education with no recognised qualification is defined by the Welsh Government's performance indicator EDU/002. Please refer to "Pupils Leaving Education with No Qualifications, 2008/09" for definitions and key quality Information.
3f These statistics were published by the Welsh Government in their statistical publication “School Statistics by Assembly Constituency and Region, 2009" (SB6/2010). Data for constituencies and regions relates to full-time pupils at LEA maintained schools only. Data are derived from the Welsh government's School Examination Performance Information. The percentage relates to pupils entering a volume equivalent to 2 A levels. For an explanation of the calculation of points scores, please refer to the Glossary in "Schools in Wales: Examination Performance, 2008".
3g These statistics were published by the Welsh Government in their statistical publication "School Statistics by Assembly Constituency and Region, 2009" (SB6/2010). Please refer to "Absenteeism from Secondary Schools, 2008/09" for definitions and key quality information.
3h These statistics were published by the Welsh Government in their statistical publication "School Statistics by Assembly Constituency and Region, 2009" (SB6/2010)". The 'within school' definition of pupil teacher ratio has been given and full time equivalent numbers for pupils and teachers have been used. Please refer to "Appendix III - Glossary and Notes" of "Schools in Wales: General Statistics, 2009" for further information and definitions.
3i These statistics were published by the Welsh Government in their statistical publication "School Statistics by Assembly Constituency and Region, 2009" (SB6/2010)" and derived from the Pupil Level Annual School Census (PLASC).
15

4: Health, housing and transport statistics
4a These statistics were provided by the Statistical Directorate of the Welsh Government and have been produced from the Welsh Health Survey (WHS). Four years of survey data (2003/04 to 2007) have been combined to increase the sample size used and improve the precision of the estimates. The percentages shown are based on adults aged 16+ and are observed percentages, that is, they are not adjusted for the different age profiles of different areas. See WHS reports & webpages for full details & definitions.
4b Currently being treated for illness.
4c Based on heaviest drinking day in past week and based on all adults (drinkers and non-drinkers). Drinking above guidelines is men drinking more than 4 units and women more than 3 units; binge drinking are double the daily limits (i.e. men drinking more than 8 units, women more than 6 units).
4d Overweight and obesity is defined using the Body Mass Index (BMI). Overweight is a BMI of 25+. Obesity is BMI of 30+.
4e These statistics were provided by Dental Services, NHS Business Services Authority. The figures are based on the number of patients living in Wales who have visited an NHS dentist in Wales in the 24 months ending 31 March 2009. Patients can appear in more than one constituency if they have moved locations within the time period. The rates have been calculated using 2007 mid-year estimates (see note 1a). Please refer to the statistical publication "NHS Dental Statistics 2008-09" (SDR 122/2009) for further information and definitions.
4f These statistics have been aggregated from Census 2001 Key Statistics. See note 1d.
4g A household comprises one person living alone, or a group of people living at the same address with common housekeeping (sharing a living room/sitting room or at least one meal a day). 'Total households' refers to households with residents; 'total household spaces' to households with or without residents.
4h A dependent child is a person aged 0-15 in a household (whether or not in a family) or a person aged 16-18 who is a full-time student in a family with parent(s).
4i A household is counted as 'overcrowded' if its occupancy rating is -1 or less (implying there is one room too few). The occupancy rating assumes that every household, including one person households, requires a minimum of two common rooms (excluding bathrooms).
16

4j These statistics were provided by the Statistical Directorate of the Welsh Government and have been calculated from the ONS’ Annual Population Survey (APS) for 2006. The question on access to a vehicle is not asked every year.
Further information on the APS can be found on the ONS website.
4k These statistics were provided by the Statistical Directorate of the Welsh Government and have been calculated from the ONS’ Annual Population Survey (APS) for 2008. The figures relate to the percentage of people in employment who usually travel to work as a driver or passenger in a car, van, minibus or work van. The question on travelling to work is not asked every year.
Further information on the APS can be found on the ONS website.
5. Deprivation statistics
5a The Welsh Index of Multiple Deprivation (WIMD) is published by the Welsh Government, and is the official measure of deprivation in small areas in Wales. It is a relative measure of concentrations of deprivation at the small area level. The statistics used in these calculations were complied from WIMD data in StatsWales table 006028.
The index can be used for:
giving a deprivation score for each of the 1,896 small areas in Wales; ranking the scores for all 1,896 areas, so that the areas can be put in
order from the most deprived to the least; and comparing the scores of two different areas to see if one is more
deprived (but you can’t tell by how much).
Ways the index cannot be used:
You can’t say how much more deprived one area is than another. If area A has a score of 40 and area B one of 20, it does not follow that A is twice as deprived as B.
It is an index of deprivation not affluence. If one area is much lower down the ranked list than another then you can say that it is less deprived but you can’t say it is more affluent.
The child index data were compiled from data in StatsWales table 006505. For more details on the Index please see the WIMD web pages.
5b There is a single LSOA (W01000086: Llanllyfni & Clynnog) which extends into two assembly constituencies and regions: Arfon (in North Wales) and Dwyfor Meirionnydd (in Mid and West Wales). In the analysis, this LSOA has been counted in the statistics for both of the constituencies or regions.
17


![多摩市立複合文化施設[パルテノン多摩]parthenon.or.jp/koho/pdf/1311-12.pdfARAJIN Magic Office 042-771-9362 042-374-6142 042-371 -2824 042-371-1558 042-355-21 1 6 042-356-0308](https://img.dokumen.tips/doc/110x75/5fb10d74c5dcf6120d16df17/ceoeefffff-arajin-magic-office-042-771-9362.jpg)